Embed Size (px)
Citation preview

Asia Illicit Tobacco Indicator 2016: IndonesiaPrepared by Oxford EconomicsOctober 2017
22
DisclaimerThe Asia Illicit Tobacco Indicator 2016 Report (the “Report”) on the illicit tobacco trade in selected Asian markets (including Australia and New Zealand) has been prepared by Oxford Economics (OE). OE enjoyed academic freedom and full editorial control of the Report. We are grateful for the inputs and data received from public sector and industry stakeholders.
OE prepared the Report in accordance with specific terms of reference agreed between Philip Morris International Management SA, an affiliate of Philip Morris International (PM), and OE. Financial support for the Report was provided by PM. OE assume all responsibility for the Report analysis, findings, and conclusion. The terms of reference under which OE were engaged by Philip Morris International Management SA are detailed in the Asia Illicit Tobacco Indicator 2016 Methodological Overview Report, available to download via the following link illicittobacco.oxfordeconomics.com
33
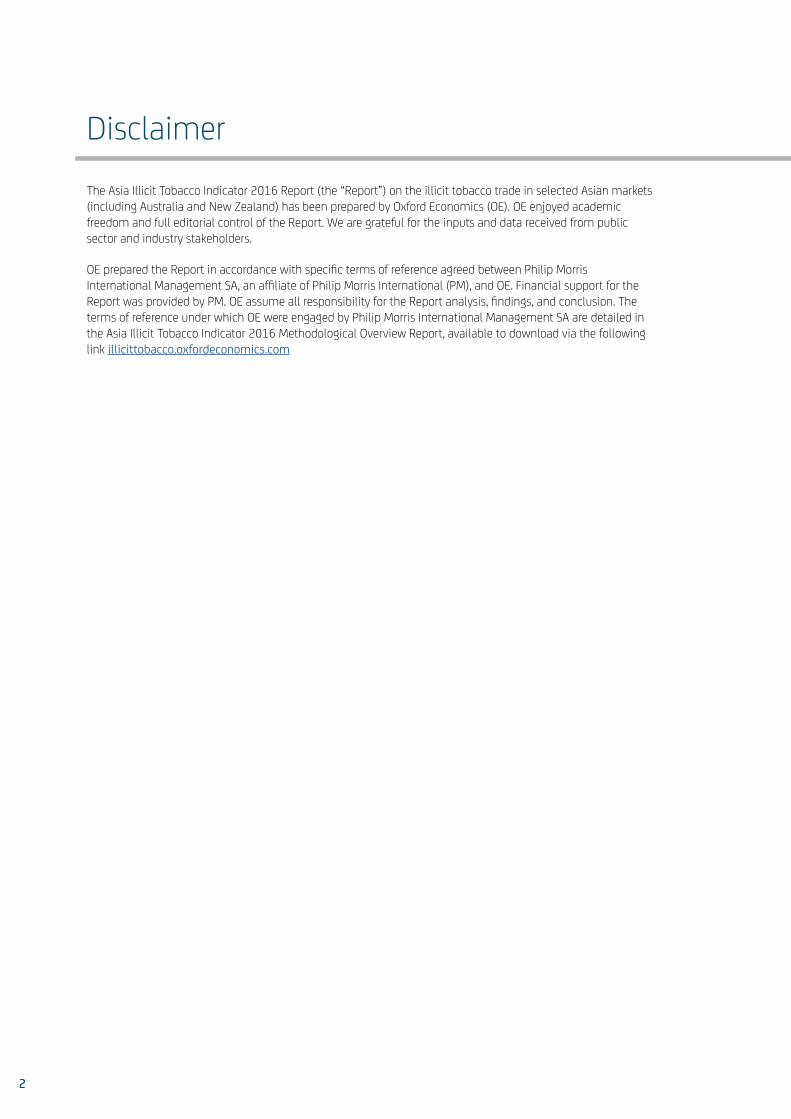
1 Legal Domestic Sales is based on IMS data, adjusted to reflect the proportion of Domestic Illicit Consumption that includes under-declaration, used, and Counterfeit Excise Tax stamps. As such, our estimate of Legal Domestic Sales is lower than IMS estimates. Our estimate of Legal Domestic Sales are also lower than the government estimate of 342 billion cigarettes in 2016 (based on production).
2 Price per pack of the Most Sold Brand in October 2016, based on PM data. In Indonesia, the Most Sold Brand is a machine-made kretek, which comes in the format of 16 cigarettes per pack. The pack price of 20 is therefore derived from a pack of 16 cigarettes.
3 The Relative Income Price is defined as the proportion, expressed as a percentage, of nominal GDP per capita required to purchase 100 packs of the Most Sold Brand of cigarettes (converted to a pack of 20 where applicable) in a particular market.
Legal Domestic Sales:
287.1 bn cigarettes
Indonesia
Price:
IDR 21,250 USD 1.78
| Indonesia Market Summary
Legal Domestic Sales in Indonesia are estimated to have been 287.1 billion in 2016, a 1.5% decline in comparison with 2015.
Sales have however remained broadly stable over the five-year period since the beginning of the Asia Illicit Tobacco Indicator Report.1
Three manufacturers (PT. Gudang Garam, PT. HM Sampoerna/PMI and PT. Djarum) accounted for more than three-quarters of legal sales in 2016.
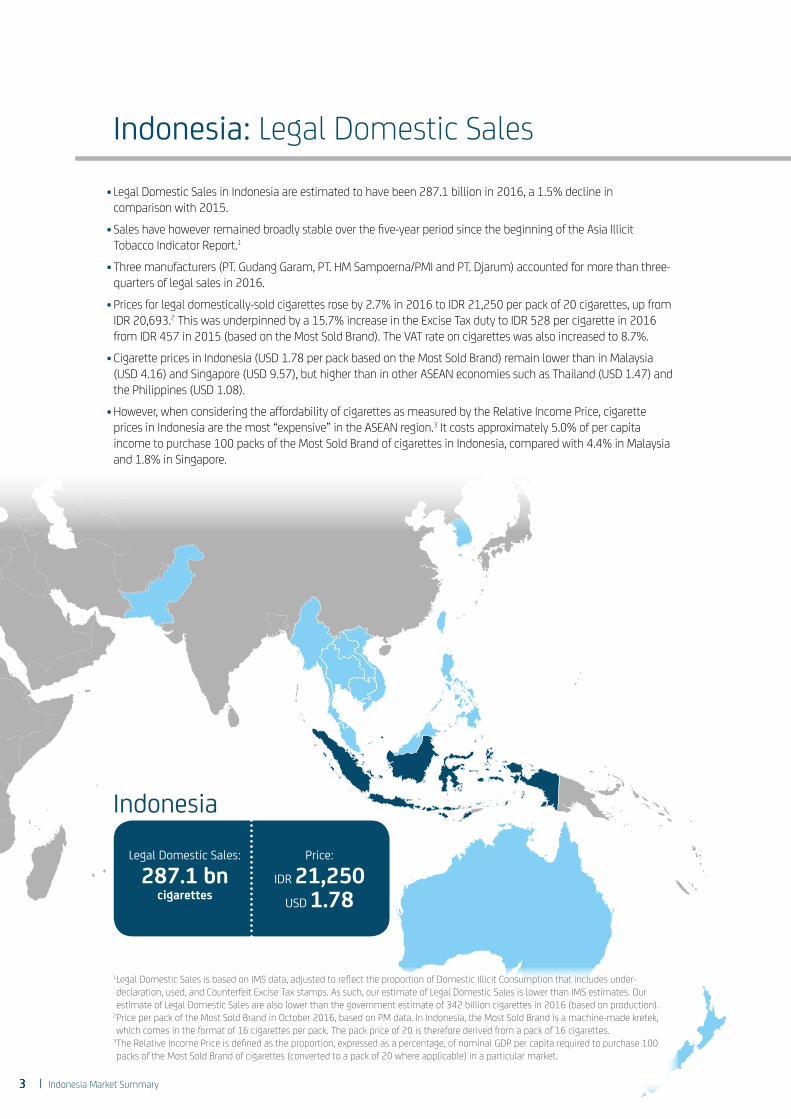
Prices for legal domestically-sold cigarettes rose by 2.7% in 2016 to IDR 21,250 per pack of 20 cigarettes, up from IDR 20,693.2 This was underpinned by a 15.7% increase in the Excise Tax duty to IDR 528 per cigarette in 2016 from IDR 457 in 2015 (based on the Most Sold Brand). The VAT rate on cigarettes was also increased to 8.7%.
Cigarette prices in Indonesia (USD 1.78 per pack based on the Most Sold Brand) remain lower than in Malaysia (USD 4.16) and Singapore (USD 9.57), but higher than in other ASEAN economies such as Thailand (USD 1.47) and the Philippines (USD 1.08).
However, when considering the affordability of cigarettes as measured by the Relative Income Price, cigarette prices in Indonesia are the most “expensive” in the ASEAN region.3 It costs approximately 5.0% of per capita income to purchase 100 packs of the Most Sold Brand of cigarettes in Indonesia, compared with 4.4% in Malaysia and 1.8% in Singapore.
Indonesia: Legal Domestic Sales
3
44
Indonesia: Tobacco tax applied to cigarettes4
Indonesia: Legal Domestic Sales and prices5
0
100
200
300
400
500
600
201620152014201320122011201020092008
277 280 300325
355 375413
528
457
IDR
per c
igar
ette
% o
f Tot
al C
onsu
mpt
ion
0
20
40
60
80
100
20162015201420132012
91.3
8.5 10.1 11.7 11.9 12.1
89.3 87.8 87.888.0Non-Domestic Legal (NDL)
Non-Domestic Illicit (NDI)
Legal Domestic Consumption
Ciga
rette
s bn
0
50
100
150
200
250
300
350
20162015201420132012
282.9
26.2 32.2 38.1 39.5 39.7
284.7 286.8291.6286.2
310.0 318.9
Non-Domestic Legal (NDL)
Non-Domestic Illicit (NDI)
Legal Domestic Consumption
331.5 326.8325.3
IDR
tn
Actual ExciseTax revenues
Estimated Excise Tax Loss
40
0
40
80
120
160
20162015201420132012
90.5
3.1
103.6153.4
112.5
5.1 7.0 8.0
151.6
8.5
0.6NDL
0.3NDI
0.2 NDL
0.1NDI
0.2 NDL
0.5NDI
0.1 NDL
0.01NDI
0.2 NDL
0.1NDI
0.2 NDL
0.1NDI
0.7NDL
0.3NDI
0.5NDL
0.2NDI
0.3NDL
0.04NDI
0.6NDL
1.5NDI
15.7%
10.7%10%
Domestic Illicit
Domestic Illicit
0
40
80
120
160
200
240
280
320
201620152014201320122011201020092008
Ciga
rette
s bn
IDR per pack of 20 cigarettes
0
24,000
18,000
21,000
15,000
12,000
9,000
6,000
3,000
Cigarette sales bnIDR per pack of 20 cigarettes
0
100
200
300
400
500
600
201620152014201320122011201020092008
277 280 300325
355 375413
528
457
IDR
per c
igar
ette
% o
f Tot
al C
onsu
mpt
ion
0
20
40
60
80
100
20162015201420132012
91.3
8.5 10.1 11.7 11.9 12.1
89.3 87.8 87.888.0Non-Domestic Legal (NDL)
Non-Domestic Illicit (NDI)
Legal Domestic Consumption
Ciga
rette
s bn
0
50
100
150
200
250
300
350
20162015201420132012
282.9
26.2 32.2 38.1 39.5 39.7
284.7 286.8291.6286.2
310.0 318.9
Non-Domestic Legal (NDL)
Non-Domestic Illicit (NDI)
Legal Domestic Consumption
331.5 326.8325.3
IDR
tn
Actual ExciseTax revenues
Estimated Excise Tax Loss
40
0
40
80
120
160
20162015201420132012
90.5
3.1
103.6153.4
112.5
5.1 7.0 8.0
151.6
8.5
0.6NDL
0.3NDI
0.2 NDL
0.1NDI
0.2 NDL
0.5NDI
0.1 NDL
0.01NDI
0.2 NDL
0.1NDI
0.2 NDL
0.1NDI
0.7NDL
0.3NDI
0.5NDL
0.2NDI
0.3NDL
0.04NDI
0.6NDL
1.5NDI
15.7%
10.7%10%
Domestic Illicit
Domestic Illicit
0
40
80
120
160
200
240
280
320
201620152014201320122011201020092008
Ciga
rette
s bn
IDR per pack of 20 cigarettes
0
24,000
18,000
21,000
15,000
12,000
9,000
6,000
3,000
Cigarette sales bnIDR per pack of 20 cigarettes
Source: Indonesian Directorate General of Customs & Excise 4 Rate applied in October of each year to Most Sold Brand (machine-made kretek with volume > 2bn), including Earmarked Tax introduced in 2014.
Source: Oxford Economics based on PM data 5 Price of the Most Sold Brand in October of each year. In Indonesia, the Most Sold Brand is a machine-made kretek, which comes in the format of 16 cigarettes per pack. Pack price of 20 is therefore derived from a pack of 16 cigarettes. For the purposes of this chart, Legal Domestic Sales data have not been adjusted for the presence of under-declaration, used, and Counterfeit Excise Tax stamps. The estimates of Legal Domestic Sales are therefore higher than presented elsewhere in this Report.
Indonesia Market Summary |
55
Indonesia: Cigarette Consumption
Source: UGM and Oxford Economics1 The Empty Pack Survey was undertaken in 2016 Q4. 2012 results based on 2011 Q2 Empty Pack Survey (see Report methodology for more details).
2 Given that a proportion of Domestic Illicit Consumption includes cigarettes with incorrect, used, or Counterfeit Excise Tax stamps affixed, it was necessary to adjust the estimate of Legal Domestic Sales for the purposes of this Report as these volumes are likely to be included within the IMS data.
3 Satriawan, Elan, Artidiatun Adji, Bambang Riyanto, Wisnu Setiadi Nugroho, Andika Ridha Ayu Perdana, Riswanti Budi Sekaringsih, Dreda Bumi Pamungkas, Mohtar Rasyid, Azka Azifa, “A Survey on Illegal Cigarettes in Indonesia: 2016”, Economics and Business Research and Development Agency (EBReDA), Faculty of Economics and Business, Universitas Gadjah Mada, Yogyakarta, Indonesia. Unpublished Report, 2016.
4 Estimated using passenger data, Smoking Prevalence in tourists’ country/market of origin, and the passenger duty-free personal import allowance limit.
5Satriawan, Adji, and Riyanto (2016).6See http://bisnis.liputan6.com/read/2825392/bea-cukai-tindak-1597-kasus-peredaran-rokok-ilegal-di-2016 7 Domestic Illicit estimates for 2013 based on interpolating between 2012 and 2014 data. 2015 estimates based on interpolating between 2014 and 2016 data.
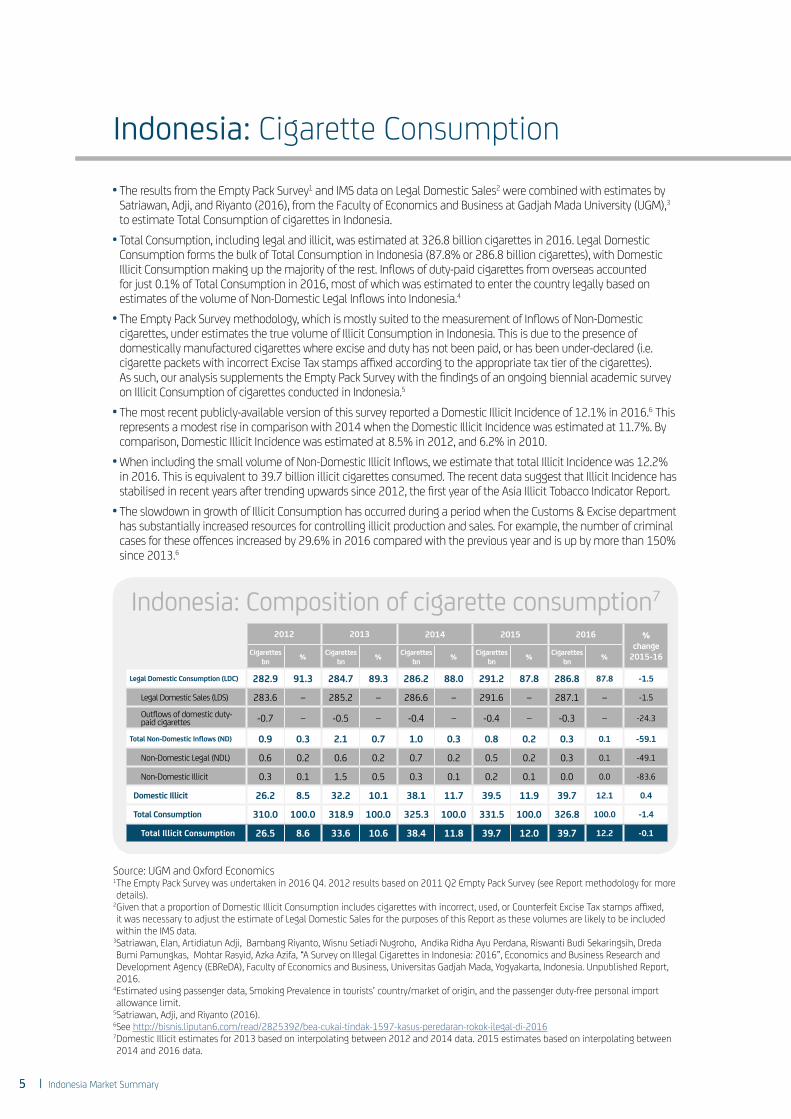
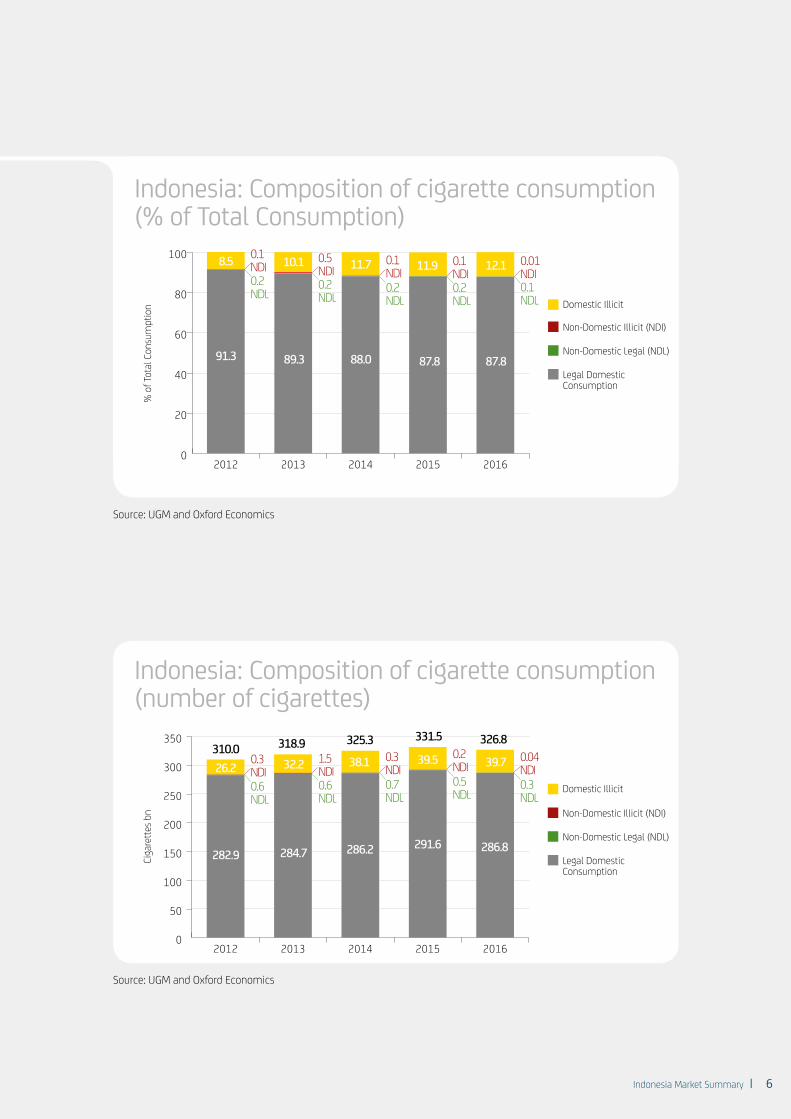
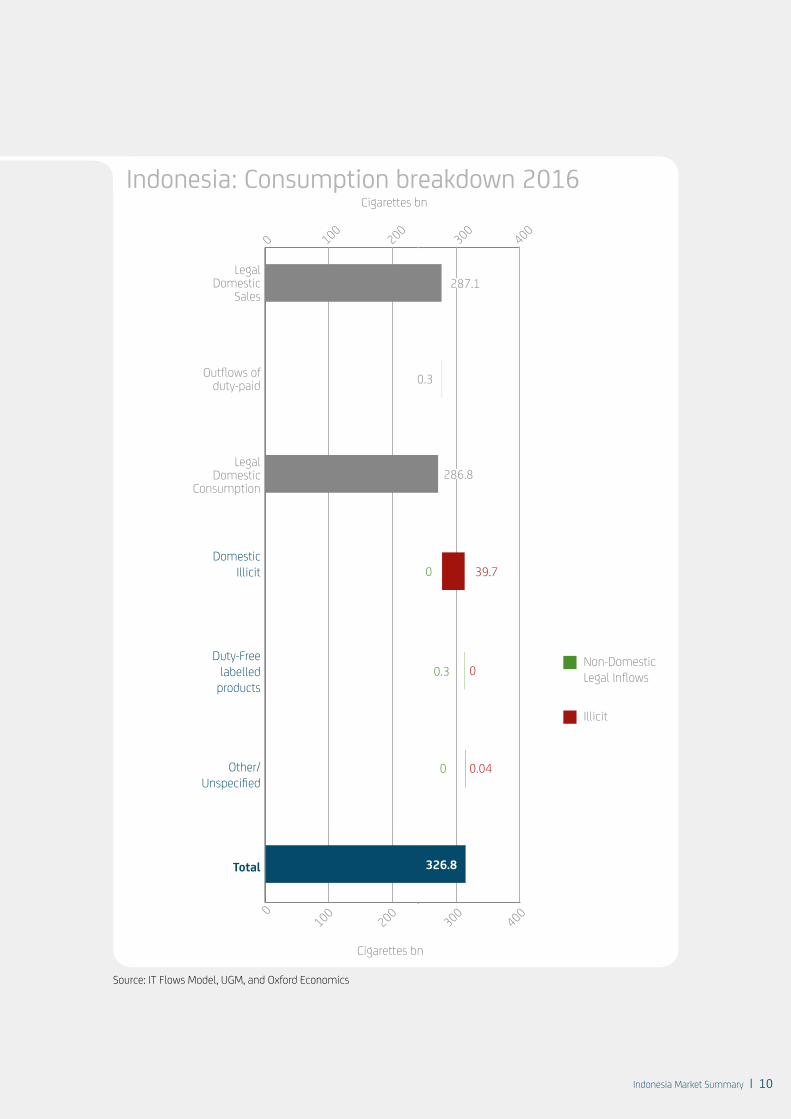
The results from the Empty Pack Survey1 and IMS data on Legal Domestic Sales2 were combined with estimates by Satriawan, Adji, and Riyanto (2016), from the Faculty of Economics and Business at Gadjah Mada University (UGM),3 to estimate Total Consumption of cigarettes in Indonesia. Total Consumption, including legal and illicit, was estimated at 326.8 billion cigarettes in 2016. Legal Domestic Consumption forms the bulk of Total Consumption in Indonesia (87.8% or 286.8 billion cigarettes), with Domestic Illicit Consumption making up the majority of the rest. Inflows of duty-paid cigarettes from overseas accounted for just 0.1% of Total Consumption in 2016, most of which was estimated to enter the country legally based on estimates of the volume of Non-Domestic Legal Inflows into Indonesia.4
The Empty Pack Survey methodology, which is mostly suited to the measurement of Inflows of Non-Domestic cigarettes, under estimates the true volume of Illicit Consumption in Indonesia. This is due to the presence of domestically manufactured cigarettes where excise and duty has not been paid, or has been under-declared (i.e. cigarette packets with incorrect Excise Tax stamps affixed according to the appropriate tax tier of the cigarettes). As such, our analysis supplements the Empty Pack Survey with the findings of an ongoing biennial academic survey on Illicit Consumption of cigarettes conducted in Indonesia.5
The most recent publicly-available version of this survey reported a Domestic Illicit Incidence of 12.1% in 2016.6 This represents a modest rise in comparison with 2014 when the Domestic Illicit Incidence was estimated at 11.7%. By comparison, Domestic Illicit Incidence was estimated at 8.5% in 2012, and 6.2% in 2010.
When including the small volume of Non-Domestic Illicit Inflows, we estimate that total Illicit Incidence was 12.2% in 2016. This is equivalent to 39.7 billion illicit cigarettes consumed. The recent data suggest that Illicit Incidence has stabilised in recent years after trending upwards since 2012, the first year of the Asia Illicit Tobacco Indicator Report.
The slowdown in growth of Illicit Consumption has occurred during a period when the Customs & Excise department has substantially increased resources for controlling illicit production and sales. For example, the number of criminal cases for these offences increased by 29.6% in 2016 compared with the previous year and is up by more than 150% since 2013.6
Indonesia: Composition of cigarette consumption7
2012 2013 2014 2015 2016 % change
2015-16 Cigarettes bn % Cigarettes
bn % Cigarettes bn % Cigarettes
bn % Cigarettes bn %
Legal Domestic Consumption (LDC) 282.9 91.3 284.7 89.3 286.2 88.0 291.2 87.8 286.8 87.8 -1.5
Legal Domestic Sales (LDS) 283.6 – 285.2 – 286.6 – 291.6 – 287.1 – -1.5
Outflows of domestic duty-paid cigarettes -0.7 – -0.5 – -0.4 – -0.4 – -0.3 – -24.3
Total Non-Domestic Inflows (ND) 0.9 0.3 2.1 0.7 1.0 0.3 0.8 0.2 0.3 0.1 -59.1
Non-Domestic Legal (NDL) 0.6 0.2 0.6 0.2 0.7 0.2 0.5 0.2 0.3 0.1 -49.1
Non-Domestic Illicit 0.3 0.1 1.5 0.5 0.3 0.1 0.2 0.1 0.0 0.0 -83.6
Domestic Illicit 26.2 8.5 32.2 10.1 38.1 11.7 39.5 11.9 39.7 12.1 0.4
Total Consumption 310.0 100.0 318.9 100.0 325.3 100.0 331.5 100.0 326.8 100.0 -1.4
Total Illicit Consumption 26.5 8.6 33.6 10.6 38.4 11.8 39.7 12.0 39.7 12.2 -0.1
| Indonesia Market Summary
66
Source: UGM and Oxford Economics
Source: UGM and Oxford Economics
Indonesia: Composition of cigarette consumption(% of Total Consumption)
Indonesia: Composition of cigarette consumption(number of cigarettes)
0
100
200
300
400
500
600
201620152014201320122011201020092008
277 280 300325
355 375413
528
457
IDR
per c
igar
ette
% o
f Tot
al C
onsu
mpt
ion
0
20
40
60
80
100
20162015201420132012
91.3
8.5 10.1 11.7 11.9 12.1
89.3 87.8 87.888.0Non-Domestic Legal (NDL)
Non-Domestic Illicit (NDI)
Legal Domestic Consumption
Ciga
rette
s bn
0
50
100
150
200
250
300
350
20162015201420132012
282.9
26.2 32.2 38.1 39.5 39.7
284.7 286.8291.6286.2
310.0 318.9
Non-Domestic Legal (NDL)
Non-Domestic Illicit (NDI)
Legal Domestic Consumption
331.5 326.8325.3
IDR
tn
Actual ExciseTax revenues
Estimated Excise Tax Loss
40
0
40
80
120
160
20162015201420132012
90.5
3.1
103.6153.4
112.5
5.1 7.0 8.0
151.6
8.5
0.6NDL
0.3NDI
0.2 NDL
0.1NDI
0.2 NDL
0.5NDI
0.1 NDL
0.01NDI
0.2 NDL
0.1NDI
0.2 NDL
0.1NDI
0.7NDL
0.3NDI
0.5NDL
0.2NDI
0.3NDL
0.04NDI
0.6NDL
1.5NDI
15.7%
10.7%10%
Domestic Illicit
Domestic Illicit
0
40
80
120
160
200
240
280
320
201620152014201320122011201020092008Ci
gare
ttes b
nIDR per pack of 20 cigarettes
0
24,000
18,000
21,000
15,000
12,000
9,000
6,000
3,000
Cigarette sales bnIDR per pack of 20 cigarettes
0
100
200
300
400
500
600
201620152014201320122011201020092008
277 280 300325
355 375413
528
457
IDR
per c
igar
ette
% o
f Tot
al C
onsu
mpt
ion
0
20
40
60
80
100
20162015201420132012
91.3
8.5 10.1 11.7 11.9 12.1
89.3 87.8 87.888.0Non-Domestic Legal (NDL)
Non-Domestic Illicit (NDI)
Legal Domestic Consumption
Ciga
rette
s bn
0
50
100
150
200
250
300
350
20162015201420132012
282.9
26.2 32.2 38.1 39.5 39.7
284.7 286.8291.6286.2
310.0 318.9
Non-Domestic Legal (NDL)
Non-Domestic Illicit (NDI)
Legal Domestic Consumption
331.5 326.8325.3
IDR
tn
Actual ExciseTax revenues
Estimated Excise Tax Loss
40
0
40
80
120
160
20162015201420132012
90.5
3.1
103.6153.4
112.5
5.1 7.0 8.0
151.6
8.5
0.6NDL
0.3NDI
0.2 NDL
0.1NDI
0.2 NDL
0.5NDI
0.1 NDL
0.01NDI
0.2 NDL
0.1NDI
0.2 NDL
0.1NDI
0.7NDL
0.3NDI
0.5NDL
0.2NDI
0.3NDL
0.04NDI
0.6NDL
1.5NDI
15.7%
10.7%10%
Domestic Illicit
Domestic Illicit
0
40
80
120
160
200
240
280
320
201620152014201320122011201020092008
Ciga
rette
s bn
IDR per pack of 20 cigarettes
0
24,000
18,000
21,000
15,000
12,000
9,000
6,000
3,000
Cigarette sales bnIDR per pack of 20 cigarettes
Indonesia Market Summary |
77
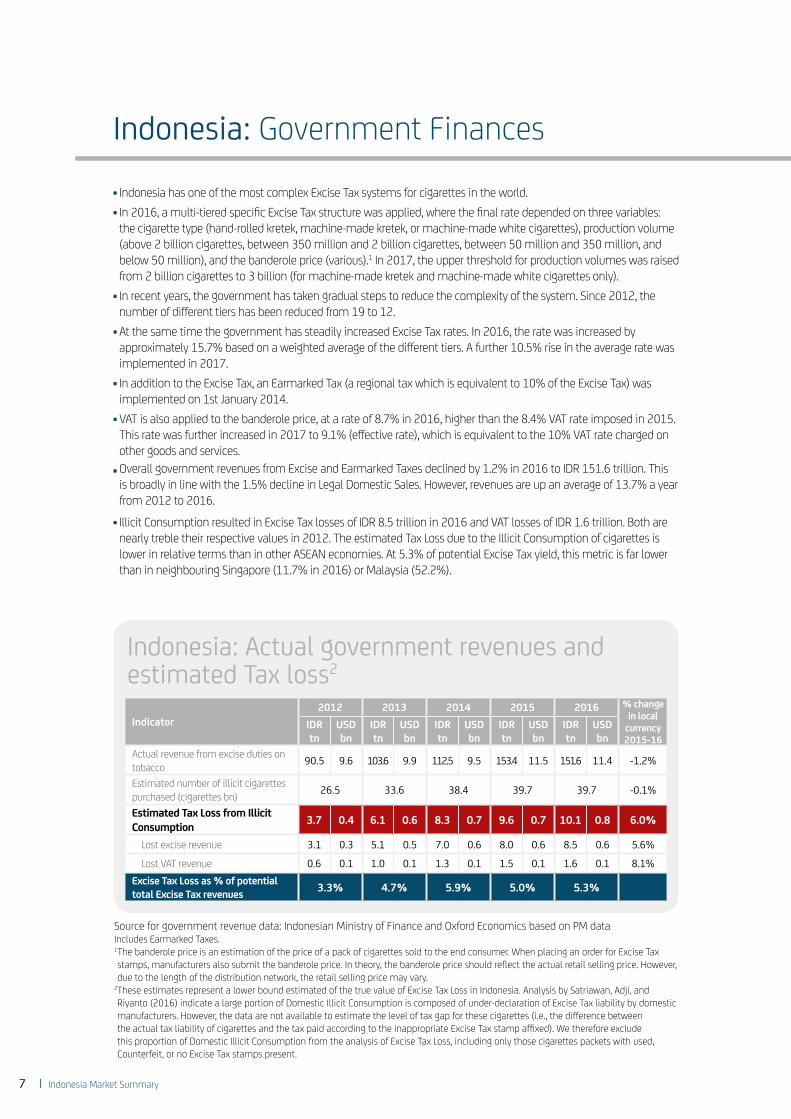
Indonesia: Government Finances Indonesia has one of the most complex Excise Tax systems for cigarettes in the world. In 2016, a multi-tiered specific Excise Tax structure was applied, where the final rate depended on three variables: the cigarette type (hand-rolled kretek, machine-made kretek, or machine-made white cigarettes), production volume (above 2 billion cigarettes, between 350 million and 2 billion cigarettes, between 50 million and 350 million, and below 50 million), and the banderole price (various).1 In 2017, the upper threshold for production volumes was raised from 2 billion cigarettes to 3 billion (for machine-made kretek and machine-made white cigarettes only). In recent years, the government has taken gradual steps to reduce the complexity of the system. Since 2012, the number of different tiers has been reduced from 19 to 12. At the same time the government has steadily increased Excise Tax rates. In 2016, the rate was increased by approximately 15.7% based on a weighted average of the different tiers. A further 10.5% rise in the average rate was implemented in 2017. In addition to the Excise Tax, an Earmarked Tax (a regional tax which is equivalent to 10% of the Excise Tax) was implemented on 1st January 2014. VAT is also applied to the banderole price, at a rate of 8.7% in 2016, higher than the 8.4% VAT rate imposed in 2015. This rate was further increased in 2017 to 9.1% (effective rate), which is equivalent to the 10% VAT rate charged on other goods and services. Overall government revenues from Excise and Earmarked Taxes declined by 1.2% in 2016 to IDR 151.6 trillion. This is broadly in line with the 1.5% decline in Legal Domestic Sales. However, revenues are up an average of 13.7% a year from 2012 to 2016. Illicit Consumption resulted in Excise Tax losses of IDR 8.5 trillion in 2016 and VAT losses of IDR 1.6 trillion. Both are nearly treble their respective values in 2012. The estimated Tax Loss due to the Illicit Consumption of cigarettes is lower in relative terms than in other ASEAN economies. At 5.3% of potential Excise Tax yield, this metric is far lower than in neighbouring Singapore (11.7% in 2016) or Malaysia (52.2%).
| Indonesia Market Summary
Source for government revenue data: Indonesian Ministry of Finance and Oxford Economics based on PM dataIncludes Earmarked Taxes.1 The banderole price is an estimation of the price of a pack of cigarettes sold to the end consumer. When placing an order for Excise Tax stamps, manufacturers also submit the banderole price. In theory, the banderole price should reflect the actual retail selling price. However, due to the length of the distribution network, the retail selling price may vary.
2 These estimates represent a lower bound estimated of the true value of Excise Tax Loss in Indonesia. Analysis by Satriawan, Adji, and Riyanto (2016) indicate a large portion of Domestic Illicit Consumption is composed of under-declaration of Excise Tax liability by domestic manufacturers. However, the data are not available to estimate the level of tax gap for these cigarettes (i.e., the difference between the actual tax liability of cigarettes and the tax paid according to the inappropriate Excise Tax stamp affixed). We therefore exclude this proportion of Domestic Illicit Consumption from the analysis of Excise Tax Loss, including only those cigarettes packets with used, Counterfeit, or no Excise Tax stamps present.
Indicator2012 2013 2014 2015 2016 % change
in local currency2015-16
IDR tn
USD bn
IDR tn
USD bn
IDR tn
USD bn
IDR tn
USD bn
IDR tn
USD bn
Actual revenue from excise duties on tobacco 90.5 9.6 103.6 9.9 112.5 9.5 153.4 11.5 151.6 11.4 -1.2%
Estimated number of illicit cigarettes purchased (cigarettes bn) 26.5 33.6 38.4 39.7 39.7 -0.1%
Estimated Tax Loss from Illicit Consumption 3.7 0.4 6.1 0.6 8.3 0.7 9.6 0.7 10.1 0.8 6.0%
Lost excise revenue 3.1 0.3 5.1 0.5 7.0 0.6 8.0 0.6 8.5 0.6 5.6%
Lost VAT revenue 0.6 0.1 1.0 0.1 1.3 0.1 1.5 0.1 1.6 0.1 8.1%Excise Tax Loss as % of potential total Excise Tax revenues 3.3% 4.7% 5.9% 5.0% 5.3%
Indonesia: Actual government revenues and estimated Tax loss2

88
Source: Indonesian Ministry of Finance and Oxford Economics based on PM data
0
100
200
300
400
500
600
201620152014201320122011201020092008
277 280 300325
355 375413
528
457
IDR
per c
igar
ette
% o
f Tot
al C
onsu
mpt
ion
0
20
40
60
80
100
20162015201420132012
91.3
8.5 10.1 11.7 11.9 12.1
89.3 87.8 87.888.0Non-Domestic Legal (NDL)
Non-Domestic Illicit (NDI)
Legal Domestic Consumption
Ciga
rette
s bn
0
50
100
150
200
250
300
350
20162015201420132012
282.9
26.2 32.2 38.1 39.5 39.7
284.7 286.8291.6286.2
310.0 318.9
Non-Domestic Legal (NDL)
Non-Domestic Illicit (NDI)
Legal Domestic Consumption
331.5 326.8325.3
IDR
tn
Actual ExciseTax revenues
Estimated Excise Tax Loss
40
0
40
80
120
160
20162015201420132012
90.5
3.1
103.6153.4
112.5
5.1 7.0 8.0
151.6
8.5
0.6NDL
0.3NDI
0.2 NDL
0.1NDI
0.2 NDL
0.5NDI
0.1 NDL
0.01NDI
0.2 NDL
0.1NDI
0.2 NDL
0.1NDI
0.7NDL
0.3NDI
0.5NDL
0.2NDI
0.3NDL
0.04NDI
0.6NDL
1.5NDI
15.7%
10.7%10%
Domestic Illicit
Domestic Illicit
0
40
80
120
160
200
240
280
320
201620152014201320122011201020092008
Ciga
rette
s bn
IDR per pack of 20 cigarettes
0
24,000
18,000
21,000
15,000
12,000
9,000
6,000
3,000
Cigarette sales bnIDR per pack of 20 cigarettes
Indonesia: Actual government revenues and estimated Excise Tax Loss
Indonesia Market Summary |
99
Duty-Free labelled products
0 mn(0.0%)
Total36 mn(-83.6%)
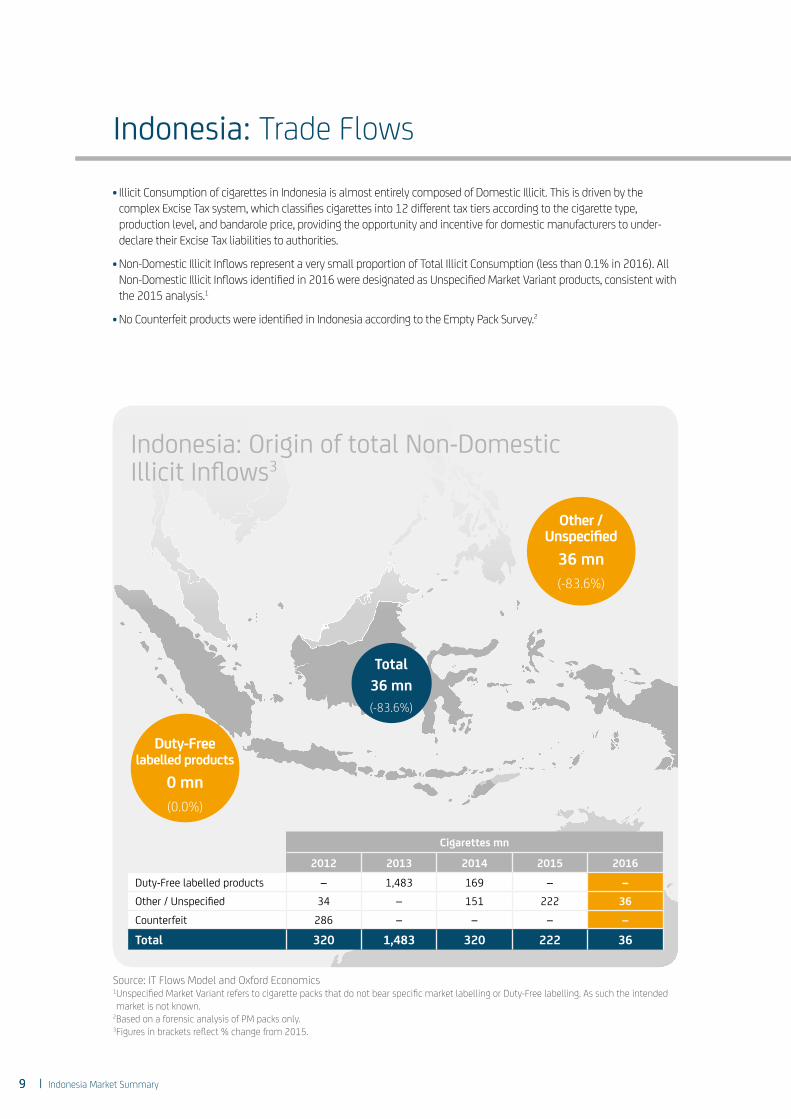
Illicit Consumption of cigarettes in Indonesia is almost entirely composed of Domestic Illicit. This is driven by the complex Excise Tax system, which classifies cigarettes into 12 different tax tiers according to the cigarette type, production level, and bandarole price, providing the opportunity and incentive for domestic manufacturers to under-declare their Excise Tax liabilities to authorities.
Non-Domestic Illicit Inflows represent a very small proportion of Total Illicit Consumption (less than 0.1% in 2016). All Non-Domestic Illicit Inflows identified in 2016 were designated as Unspecified Market Variant products, consistent with the 2015 analysis.1
No Counterfeit products were identified in Indonesia according to the Empty Pack Survey.2
Indonesia: Trade Flows
Source: IT Flows Model and Oxford Economics1 Unspecified Market Variant refers to cigarette packs that do not bear specific market labelling or Duty-Free labelling. As such the intended market is not known.
2Based on a forensic analysis of PM packs only.3Figures in brackets reflect % change from 2015.
Cigarettes mn
2012 2013 2014 2015 2016
Duty-Free labelled products – 1,483 169 – –Other / Unspecified 34 – 151 222 36Counterfeit 286 – – – –
Total 320 1,483 320 222 36
Indonesia: Origin of total Non-Domestic Illicit Inflows3
Other / Unspecified
36 mn(-83.6%)
| Indonesia Market Summary
1010
Indonesia: Consumption breakdown 2016
Source: IT Flows Model, UGM, and Oxford Economics
0
0
100
100
200
200
Cigarettes bn
Cigarettes bn
400
400
300
300
Total 326.8
Legal Domestic
Sales287.1
Outflows of duty-paid 0.3
Legal Domestic
Consumption286.8
Illicit
Non-Domestic Legal Inflows
Other/ Unspecified
0
0Duty-Free
labelled products
0.3
Domestic Illicit 39.70
0.04
Indonesia Market Summary |
1111
Indonesia: Other Estimates
Source Comment
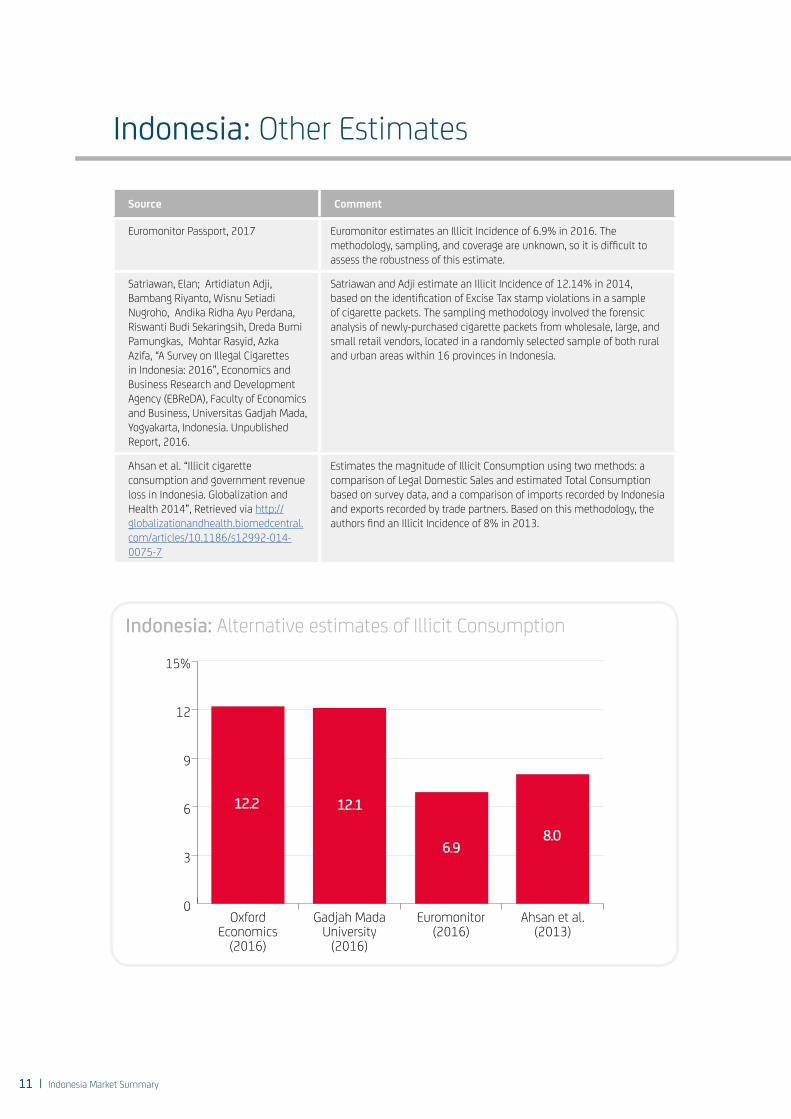
Euromonitor Passport, 2017 Euromonitor estimates an Illicit Incidence of 6.9% in 2016. The methodology, sampling, and coverage are unknown, so it is difficult to assess the robustness of this estimate.
Satriawan, Elan; Artidiatun Adji, Bambang Riyanto, Wisnu Setiadi Nugroho, Andika Ridha Ayu Perdana, Riswanti Budi Sekaringsih, Dreda Bumi Pamungkas, Mohtar Rasyid, Azka Azifa, “A Survey on Illegal Cigarettes in Indonesia: 2016”, Economics and Business Research and Development Agency (EBReDA), Faculty of Economics and Business, Universitas Gadjah Mada, Yogyakarta, Indonesia. Unpublished Report, 2016.
Satriawan and Adji estimate an Illicit Incidence of 12.14% in 2014, based on the identification of Excise Tax stamp violations in a sample of cigarette packets. The sampling methodology involved the forensic analysis of newly-purchased cigarette packets from wholesale, large, and small retail vendors, located in a randomly selected sample of both rural and urban areas within 16 provinces in Indonesia.
Ahsan et al. “Illicit cigarette consumption and government revenue loss in Indonesia. Globalization and Health 2014”, Retrieved via http://globalizationandhealth.biomedcentral.com/articles/10.1186/s12992-014-0075-7
Estimates the magnitude of Illicit Consumption using two methods: a comparison of Legal Domestic Sales and estimated Total Consumption based on survey data, and a comparison of imports recorded by Indonesia and exports recorded by trade partners. Based on this methodology, the authors find an Illicit Incidence of 8% in 2013.
Indonesia: Alternative estimates of Illicit Consumption
0
5
10
15
20
25
30
35
40%
“Bottom up” consumption(2009)
Oxford Economics(2015)
0.6
35.7
0
5
10
15
20
25%
Vietnam Tobacco
Association(2014)
“Bottom up” consumption
(2014)
Nielsen Retail Audit (2015)
Euromonitor (2016)
OxfordEconomics
(2016)
22.220.9
17.1 18.6 18.2
0
3
6
9
12
15%
“Bottom up”consumption
(2014)
Euromonitor(2016)
OxfordEconomics
(2016)
12.0
5.63.7
0
1
2
3
4
5%
'Bottom up'consumption (2014)
Euromonitor(2016)
Oxford Economics(2016)
2.5
3.9
4.7
0
3
6
9
12
15%
“Bottom up”consumption (2014)
Euromonitor (2016)
Oxford Economics (2016)
13.111.0
5.1
0
10
20
30
40
50%
“Bottom up” consumption (2013)
Nielsen(2014)
Euromonitor(2016)
Oxford Economics(2016)
43.736.7 38.8
23.7
0.0
0.5
1.0
1.5
2.0
2.5%
Euromonitor (2016)Oxford Economics (2016)
2.3
0.9
0
3
6
9
12
15%
Ahsan et al.(2013)
Euromonitor(2016)
Gadjah MadaUniversity
(2016)
OxfordEconomics
(2016)
12.2 12.1
8.06.9
| Indonesia Market Summary
1212
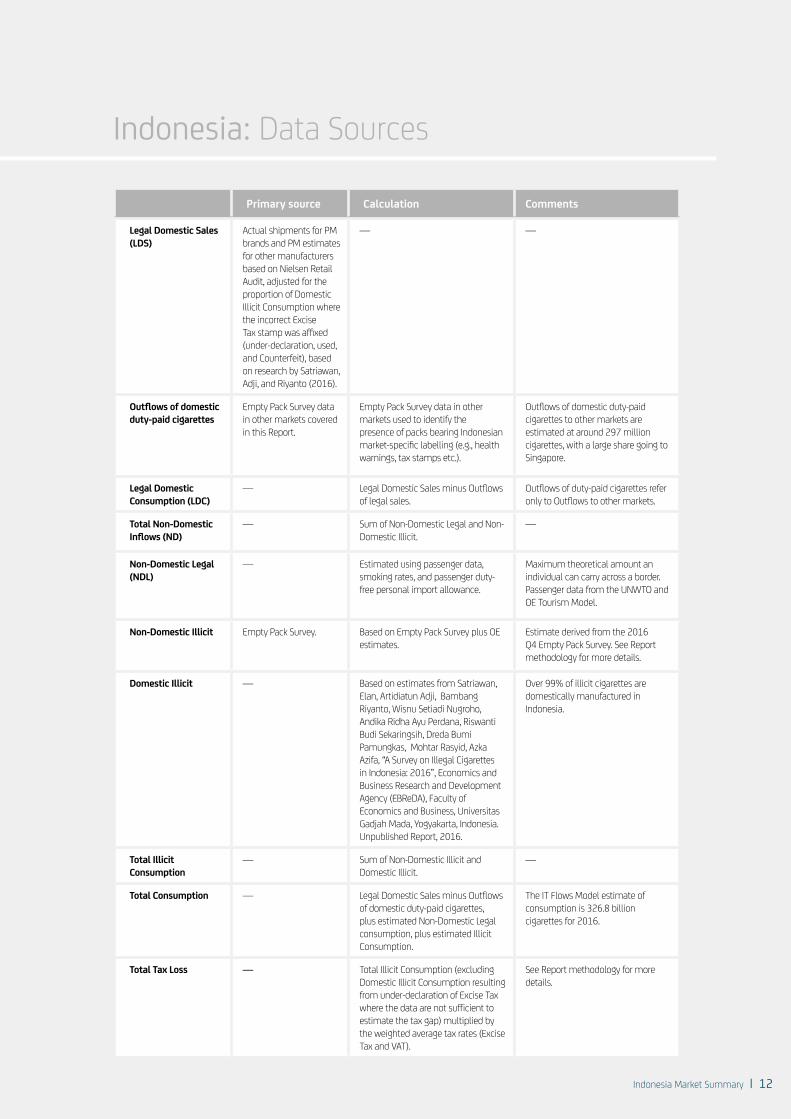
Indonesia: Data Sources
Primary source Calculation Comments
Legal Domestic Sales (LDS)
Actual shipments for PM brands and PM estimates for other manufacturers based on Nielsen Retail Audit, adjusted for the proportion of Domestic Illicit Consumption where the incorrect Excise Tax stamp was affixed (under-declaration, used, and Counterfeit), based on research by Satriawan, Adji, and Riyanto (2016).
— —
Outflows of domestic duty-paid cigarettes
Empty Pack Survey data in other markets covered in this Report.
Empty Pack Survey data in other markets used to identify the presence of packs bearing Indonesian market-specific labelling (e.g., health warnings, tax stamps etc.).
Outflows of domestic duty-paid cigarettes to other markets are estimated at around 297 million cigarettes, with a large share going to Singapore.
Legal Domestic Consumption (LDC)
— Legal Domestic Sales minus Outflows of legal sales.
Outflows of duty-paid cigarettes refer only to Outflows to other markets.
Total Non-Domestic Inflows (ND)
— Sum of Non-Domestic Legal and Non-Domestic Illicit.
—
Non-Domestic Legal (NDL)
— Estimated using passenger data, smoking rates, and passenger duty-free personal import allowance.
Maximum theoretical amount an individual can carry across a border. Passenger data from the UNWTO and OE Tourism Model.
Non-Domestic Illicit Empty Pack Survey. Based on Empty Pack Survey plus OE estimates.
Estimate derived from the 2016 Q4 Empty Pack Survey. See Report methodology for more details.
Domestic Illicit — Based on estimates from Satriawan, Elan, Artidiatun Adji, Bambang Riyanto, Wisnu Setiadi Nugroho, Andika Ridha Ayu Perdana, Riswanti Budi Sekaringsih, Dreda Bumi Pamungkas, Mohtar Rasyid, Azka Azifa, “A Survey on Illegal Cigarettes in Indonesia: 2016”, Economics and Business Research and Development Agency (EBReDA), Faculty of Economics and Business, Universitas Gadjah Mada, Yogyakarta, Indonesia. Unpublished Report, 2016.
Over 99% of illicit cigarettes are domestically manufactured in Indonesia.
Total Illicit Consumption
— Sum of Non-Domestic Illicit and Domestic Illicit.
—
Total Consumption — Legal Domestic Sales minus Outflows of domestic duty-paid cigarettes, plus estimated Non-Domestic Legal consumption, plus estimated Illicit Consumption.
The IT Flows Model estimate of consumption is 326.8 billion cigarettes for 2016.
Total Tax Loss — Total Illicit Consumption (excluding Domestic Illicit Consumption resulting from under-declaration of Excise Tax where the data are not sufficient to estimate the tax gap) multiplied by the weighted average tax rates (Excise Tax and VAT).
See Report methodology for more details.
Indonesia Market Summary |
OXFORD ECONOMICS(HEADQUARTERS)Abbey House, 121 St Aldates Oxford, OX1 1HB, UK Email: [email protected]: +44 1865 268900
LONDON Broadwall House, 21 Broadwall London, SE1 9PL, UK
NEW YORK 5 Hanover Square, 19th FloorNew York, NY 10004, USA
SINGAPORE6 Battery Road#38-05Singapore 049909
illicittobacco.oxfordeconomics.com
www.oxfordeconomics.com