Embed Size (px)
Citation preview

DISCLOSURE APPENDIX AT THE BACK OF THIS REPORT CONTAINS IMPORTANT DISCLOSURES, ANALYST CERTIFICATIONS, AND THE STATUS OF NON-US ANALYSTS. US Disclosure: Credit Suisse does and seeks to do business with companies covered in its research reports. As a result, investors should be aware that the Firm may have a conflict of interest that could affect the objectivity of this report. Investors should consider this report as only a single factor in making their investment decision.
CREDIT SUISSE SECURITIES RESEARCH & ANALYTICS BEYOND INFORMATION®
Client-Driven Solutions, Insights, and Access
03 September 2015
Asia Pacific/Taiwan
Equity Research
IT Hardware (Technology - PC TW (Asia)/Technology - Hardware HK (Asia))
Asia Hardware Sector SECTOR FORECAST
iPhone 6S, positioning for the big show
Figure 1: Larger screen form factor will make up 95+% of volume next year
0.0
10.0
20.0
30.0
40.0
50.0
60.0
70.0
80.0
90.0
F4Q14A F1Q15A F2Q15A F3Q15A F4Q15E F1Q16E F2Q16E F3Q16E F4Q16E
units, mn
iPhone 4S iPhone 5 iPhone 5C iPhone 5S iPhone 6 iPhone 6 Plus iPhone 6S iPhone 6S Plus
Fiscal quarter end, i.e. F4Q15 is Sep-15 Q-E. Source: Company data, IDC, Credit Suisse estimates
■ iPhone 6S spec upgrades. We expect Apple (covered by our IT Hardware analyst K. Garcha, for details see the team’s report click here) to debut a 4.7" iPhone 6S and 5.5" 6S Plus next week (10 Sep). The key spec upgrades we expect include a 2 GB memory, a 12 MP camera, force-touch and haptics, and strengthened aluminium uni-body casing (i.e., 7,000 series). CS iPhone forecasts are 47.3/78.05 mn in Sep 2015 and Dec 2015 and 230/239 mn in FY15/16E. Our report looks into large-size iPhone penetration rates, iPhone launch and pre-sale track records, speed of country expansion, and Apple's Taiwan supply chain share price performances pre and post launch.
■ Near-term bottle-necks but large-size iPhone TAM significant. Our recent updates on Apple's Asian supply chain suggest haptics and FPC component are constrained currently due to low yields. We believe this could impact iPhone 6S final assembly volumes at the initial ramp and our September shipments, if yields do not improve. We remain optimistic on the volume opportunity for the current install-base to upgrade to large-size iPhones next year. Credit Suisse analysis looks into large-size iPhone penetration and sees its rising from sub-30% today to over 70% by end of CY16.
■ Taiwan top buys. Pauline Chen continues to prefer market share gain names at Apple. Her top picks are Catcher (casing) and Largan (lens). Jerry Su’s top picks are Chipbond (driver-IC back-end) and TPK (force-touch lamination). In assembly, Thompson Wu prefers Hon Hai and their dominant iPhone market share position and diversification into other Apple projects, its earnings growth profile, and overall risk/reward to Pegatron. Randy Abrams sees Apple as a mixed catalyst this year for TSMC, Amkor and ASE.
■ 16th
Asia Technology Conference Sept 9-11 in Taipei. We have 71 tech companies at the Taipei event and over 20 other companies during pre-tour. We have 21 companies from Taiwan’s non-tech sectors as well (click here).
Research Analysts
Thompson Wu
886 2 2715 6386
Randy Abrams, CFA
886 2 2715 6366
Pauline Chen
886 2 2715 6323
Kulbinder Garcha
212 325 4795
Manish Nigam
852 2101 7067
Jerry Su
886 2 2715 6361

03 September 2015
Asia Hardware Sector 2
Focus table and charts Figure 2: CS Apple iPhone shipment forecast by model (covered by Kulbinder Garcha) iPhone model Sep-14 Dec-14 Mar-15 Jun-15 Sep-15 Dec-15 Mar-16 Jun-16 Sep-16 FY15 FY16
F4Q14A F1Q15A F2Q15A F3Q15A F4Q15E F1Q16E F2Q16E F3Q16E F4Q16E
iPhone 4S 5.6 3.8 2.3 1.1 0.0 0.0 0.0 0.0 0.0 7.1 0.0
iPhone 5 0.2 0.1 0.1 0.0 0.0 0.0 0.0 0.0 0.0 0.3 0.0
iPhone 5C 5.1 5.0 1.9 1.2 0.5 0.0 0.0 0.0 0.0 8.6 0.0
iPhone 5S 15.1 12.4 6.7 4.8 1.4 0.8 0.6 0.5 0.5 25.3 2.4
iPhone 6 10.5 35.3 34.0 28.0 31.7 5.7 4.6 3.6 3.6 129.1 17.4
iPhone 6 Plus 2.7 17.7 16.1 12.4 13.7 5.7 4.6 3.6 3.6 59.9 17.4
iPhone 6S 50.7 40.6 32.5 31.6 0.0 155.4
iPhone 6S Plus 15.2 12.2 9.7 9.5 0.0 46.6
Total shipments 39.3 74.4 61.1 47.5 47.3 78.0 62.5 49.9 48.7 230.4 239.1 Source: Company data, IDC, Credit Suisse estimates
Figure 3: Apple CS iPhone installed base implies units will still grow in 2016/2017 (mn) iOS global installed base analysis (in mn) 2012 2013 2014 2015E 2016E 2017E
iPhone subs 250.7 312.3 400.0 486.6 545.6 604.6
Gross add 73.2 87.9 110.0 116.6 103.5 110.0
Churn 17.6 26.3 22.3 30.0 44.5 51.0
as % of subs 9.0% 10.5% 7.1% 7.5% 9.1% 9.3%
Sub net adds 55.7 61.6 87.7 86.6 59.0 59.0
Replacement units demanded 76.1 100.3 129.7 165.5 197.9 224.2
Adjusted replacement rate 39.0% 40.0% 41.5% 41.4% 40.7% 41.1%
Adjusted replacement cycle (in months) 30.8 30.0 28.9 29.0 29.5 29.2
Total iPhone units demanded 149.3 188.2 239.7 282.1 301.4 334.2
Second hand phones recycled into the base (f) 13.9 34.5 47.0 48.0 60.0 70.0
% previous installed base (trailing 12 months) 7% 14% 17% 13% 14% 14%
% of 2 years prior installed base 18% 19% 15% 15% 14%
iPhone units demanded 135.4 153.6 192.7 234.1 241.4 264.2
yoy % 45.4% 13.5% 25.4% 21.5% 3.1% 9.4%
Implied iPhone units 135.4 153.6 192.7 234.1 241.4 264.2 Source: Company data, Credit Suisse estimates
Figure 4: Genius' share price is consistently the worst
performing name one month ahead of iPhone launch –
and is the case into iPhone 6S, but … Share price performance from Aug 2, 2015 through Sept 2, 2015
Figure 5: … Genius has also consistently been the best
performing name one week post. Shares were up 18.9%
one week post iPhone 6 launch (+12% for iPhone 5) Share price performance one week post launch
Genius
Unimicron
TSMC
TSE
ASE
Chipbond
Catcher
Pegatron
Hon Hai
Largan
Delta
Foxconn Tech
TXC
-30.0%-25.0%-20.0%-15.0%-10.0% -5.0% 0.0% 5.0% 10.0% 15.0%
iPhone 6S (Aug 2 to Sept 2)
-10.0% -5.0% 0.0% 5.0% 10.0% 15.0% 20.0% 25.0%
Delta
Largan
Catcher
Pegatron
TXC
TSEC
Foxconn Tech
Unimicron
TSMC
Hon Hai
ASE
Chipbond
Genius
iPhone 6
Source: Company data, TEJ, Credit Suisse Source: Company data, TEJ, Credit Suisse

03 September 2015
Asia Hardware Sector 3
Taiwan tops Apple supply chain buys names
Final assembly: Hon Hai, OUTPERFORM, NT$127 (Thompson Wu)
Apple is using Hon Hai and Pegatron as the two assemblers to launch iPhone 6S. In the
past two iPhone cycles, Apple appears to have pulled first from Pegatron’s hubs and then
Hon Hai based on monthly sales trends. Last year, Pegatron’s MoM sales peaked in
September, whereas we saw continued strength in Hon Hai’s monthly sales in Oct and
Dec-months. We expect Hon Hai retains 100% of iPhone 6S Plus orders, which was over
30% of iPhone 6 sales in 2Q15, from 20% in 3Q14. In addition, Hon Hai is involved with
other Apple projects including the 12"-plus iPad Pro and eventually Apple Watch, in our
view, whereas Pegatron is phasing out iPad mini to Compal.
Importantly, Hon Hai has established several growth opportunities outside of Apple
including data-centers and back-end packing with SPIL. We have still yet to identify a
meaningful growth driver for Pegatron. Pegatron paid 65.7% cash pay-out in 2014, higher
to Hon Hai's payout of 43%. Hon Hai has greater capacity to increase its pay-out, in our
view and estimate 60% in 2017. Hon Hai trades 8.5x P/E on 2016 EPS, or a 10% discount
to Pegatron at 9.5x, despite Hon Hai having more attractive earnings growth in 2016 of
14% growth versus 4% for Pegatron.
Figure 6: Pegatron Sept MoM sales growth exceeds Hon
Hai in iPhone ramp owing to a longer lead time to ramp
Figure 7: Apple ODM/EMS partner by product line and
corresponding to expected launch date
-60.0%
-40.0%
-20.0%
0.0%
20.0%
40.0%
60.0%
80.0%
100.0%
Aug-13 Oct-13 Dec-13 Feb-14 Apr-14 Jun-14 Aug-14 Oct-14 Dec-14
Hon Hai Precision Pegatron
1Q14 2Q14 3Q14 4Q14 1Q15 2Q15 3Q15 4Q15
Hon Hai
- iPhone 6S / 6S Plus
- iPhone 6 / 6 Plus
- iPhone 5S
- iPhone 5C
- iPad Air
- iPad Pro
- iPad mini
Pegatron
- iPhone 6S
- iPhone 6
- iPhone 5C
- iPad Air
- iPad mini
Compal
- iPad mini
Wistron
- gen-1 year iPhone 6
- iPhone 5C
- iPhone 5S
Quanta
- Apple Watch
- MacBook Air
- iMac
2.98
Source: Company data, Credit Suisse estimates Source:, Credit Suisse estimates
Uni-body Casing: Catcher, OUTPERFORM, TP NT$431 (Pauline Chen)
Catcher remains our top pick in the downstream component space. We expect continued
market share consolidation, evidenced by fewer casing suppliers in iPhone 6s (three only,
versus four in iPhone 6). This should help Catcher to further expand its market share in
4.7” iPhone to estimated 15% in 2015E. We also expect longer machine hours for iPhone
6s (versus iPhone 6), given casing material improvement (from Al 6,000 series to 7,000
series). We believe the increasing entry barrier (financially and technologically) should
lead to faster profit share consolidation in the casing sector. Lastly, the recent noise on
China’s smartphone demand has raised some concerns. However, we note that 38% of
China’s iPhone users are using 5.5" iPhones, versus global average of 31%, according to
IDC. As a result, Catcher should be less impacted if there is any weak demand in China.
Thompson Wu
PC/Hardware
Tel: +886 2 2715 6386
Pauline Chen
Handsets/components
Tel: +886 2 2715 6323

03 September 2015
Asia Hardware Sector 4
Figure 8: Casing—revenue share by vendor (1H15) Figure 9: Casing—operating profit share by vendor (1H15)
Catcher, 23%
FTC, 35%
Casetek, 14%
Eson, 4%
AVY, 2%
Bin Chuan, 1%
Ways, 1% Coxon, 4%
Catcher, 62%
FTC, 29%
Casetek, 8%
Eson, 1%
AVY, 0%Bin Chuan,
1%Ways, 1% Coxon, 3%
Source: Company data, Credit Suisse Source: Company data, Credit Suisse
Lens: Largan Precision, OUTPERFORM, TP NT$4,000 (Pauline Chen)
We expect continued lens spec upgrade in iPhones, from iPhone 4 (5 MP), to iPhone 4s
(to 8 MP with wider aperture), to iPhone 5 (same 8 MP but 18% thinner), to iPhone 5s
(same 8 MP, bigger pixel size and wider aperture), to iPhone 6 (same 8 MP, ~9% thinner
& adding OIS), and potentially to iPhone 6s (to 12 MP). The increasing demand for better
human-machine interaction by giving machine vision should also expand Largan's TAM
beyond smartphones. Although we are positive on the continued lens upgrade cycle in the
medium term, we note the softer China smartphone demand could hurt Largan's
profitability (albeit partially offset by NTD depreciation) in the near term. First on direct
impact, Chinese brand customers are estimated to account for 25-30% of Largan's
revenue. Second on indirect impact, Largan’s earnings are more sensitive to 5.5” iPhones
(due to higher share and higher ASP from OIS pass-through revenue). Nevertheless, we
are willing to look beyond the near-term volatility, given continued lens upgrade cycle, a
bigger TAM beyond smartphone, and Largan's dominant position in plastic lens.
Figure 10: Largan controlled 76% of lens' revenue share… Figure 11: …and 113% of lens' operating profit share
0%
10%
20%
30%
40%
50%
60%
70%
80%
90%
100%
Mar-08 Mar-09 Mar-10 Mar-11 Mar-12 Mar-13 Mar-14 Mar-15
Largan Genius Newmax Kinko Ability Glory Science
-60%
-40%
-20%
0%
20%
40%
60%
80%
100%
Mar-08 Mar-09 Mar-10 Mar-11 Mar-12 Mar-13 Mar-14 Mar-15
Largan Genius Newmax Kinko Ability Glory Science
Source: Company data, Credit Suisse Source: Company data, Credit Suisse
Force touch lamination: TPK, OUTPERFORM, TP NT$215 (Jerry Su)
TPK is re-entering into the iPhone supply chain in 2H15 by providing lamination of the
force touch sensor with the backlight metal chassis. The volume production had begun
from early 3Q15, as TPK is now at the upstream of the supply chain given the lamination
of the force touch sensor is involved with the backlight manufacturing process (before the
LCM assembly), versus historically (iPhone3/4 touch) or current iPad's after LCM process.
This should lead to higher volume than before given the consideration of yield loss at
backlight assembly and LCM processes as 5% yield loss for each could lead to 10% more
volume for force touch sensor. In the near term, TPK guides for 3Q15 revenues growth of
50% QOQ, driven by the ramp of the iPhone projects and the new tablet product cycle.
Management expects the momentum to sustain into 4Q15 and guides for 1H15/2H15
revenues split to be 40%/60%, implying another 20% QoQ growth on the top line for 4Q15.
Jerry Su
Panels
Tel: +886 2 2715 6361

03 September 2015
Asia Hardware Sector 5
Figure 12: TPK sales mix by sizes: Smartphone and
wearable was 51% of sales in 2Q15
Figure 13: TPK now shifts to the upstream supply chain
position
80%
61%72%
66%57%
51%64%
73%75%
58%46%
26%
41%47%46%41%44%
51%47%45%
60%51%
0%
10%
20%
30%
40%
50%
60%
70%
80%
90%
100%
1Q10 3Q10 1Q11 3Q11 1Q12 3Q12 1Q13 3Q13 1Q14 3Q14 1Q15
<7" 7"~11" 11"~16" >16" and others
Force Touch
lamination
(TPK/GIS)
Backlight module
(Minebea/Radiant)
TFT open cell
(LGD)
LGM assembly
(in house or
outsourced)
Product assembly
(Hon Hai)
Source: Company data, Credit Suisse estimates Source: Company data, Credit Suisse
Driver IC backend: Chipbond, OUTPERFORM, TP NT$70 (Jerry Su)
Chipbond is the sole supplier for iPhone DDI backend with 12-15% sales contribution for
the past few years. We believe its iPhone exposure will continue to increase in 2H15-2016
on multiple new project wins, including the bumping and testing of force touch sensor IC,
power amplifier IC and power management IC. We estimate its sales exposure for Apple
to increase to ~20% in 2016, while OP contribution should be higher, given better margin
profile. In the near term, Chipbond expects its 3Q revenue to stay flattish QoQ on iPhone
ramp and 4K proliferation, although panel makers guided shipments to decline mid-single-
digit QoQ. Chipbond also said it sees strong pull-in for new smartphone models in 3Q and
is shipping new devices (besides DDI backend) with its proprietary bumping process.
Figure 14: Chipbond revenue and margin trend Figure 15: 12” bumping and COG sales trend
0%
5%
10%
15%
20%
25%
30%
35%
0
500
1,000
1,500
2,000
2,500
3,000
3,500
4,000
4,500
5,000
1Q12 4Q12 3Q13 2Q14 1Q15 4Q15E
NT$ mn Core sales Tape sales Reported GM (RHS)
-30%
-20%
-10%
0%
10%
20%
30%
0
200
400
600
800
1,000
1,200
1,400
1Q12 4Q12 3Q13 2Q14 1Q15 4Q15E
NT$ mn 12" bumping + COG sales QoQ
Source: Company data, Credit Suisse estimates Source: Company data, Credit Suisse estimates
Semiconductor manufacturing – Apple a mixed
catalyst this year for TSMC, Amkor and ASE
TSMC, ASE and Amkor are the main semiconductor manufacturing partners for Apple’s
processor packaging and its related peripheral chips. TSMC’s market share was 100% in
the iPhone 6 generation but will move back down to about 55% share factoring in dual
sourcing on the new models for the phone and potentially iPad with Samsung. We do still
believe that base case for the a10 chipset next year will be TSMC also using its InFO
process, a view shared by industry participants in the opening day of Semicon Taiwan.
We model TSMC’s share price recovering next year with Apple, although partially offset by
Android camp weakness and also Qualcomm’s shift to Samsung for its high-end
Snapdragon 820, which would help Qualcomm recover market share in Samsung’s high-
end smartphones.
Randy Abrams
Semiconductors
Tel: +886 2 2715 6366

03 September 2015
Asia Hardware Sector 6
Figure 16: CS projects TSMC’s market share for the Apple processor will dip in 2H15 before recovering in 2H16 Apple volumes (mn units) 3Q14 4Q14 1Q15 2Q15 3Q15 4Q15 1Q16 2Q16 3Q16 4Q16 2013 2014 2015 2016
iPad 12.3 21.4 12.6 10.9 10.9 16.4 13.1 11.1 10.0 16.6 74.2 63.4 50.9 50.9
iPhone 39.3 74.5 61.2 47.5 47.3 78.1 62.4 50.0 48.7 80.3 153.5 192.7 234.1 241.4
iPods 1.2 0.0 0.0 0.0 0.0 0.0 0.0 0.0 0.0 0.0 9.4 3.8 0.0 0.0
iWatch 2.5 4.0 8.0 6.0 7.0 6.5 10.5 14.5 30.0
Apple TV set-top units 0.3 0.5 0.3 0.3 1.3 2.2 1.2 1.2 1.2 1.3 2.2 1.8 4.0 4.9
Total units (mn) 53.1 96.4 74.1 61.2 63.5 104.7 82.7 69.3 66.5 108.7 239.3 261.6 303.5 327.1
QoQ / YoY 6% 82% -23% -17% 4% 65% -21% -16% -4% 64% 9% 16% 8%
Apple mfg potential (mn units) 3Q14 4Q14 1Q15 2Q15 3Q15 4Q15 1Q16 2Q16 3Q16 4Q16 2013 2014 2015 2016
Blended die size 97 96 95 93 92 98 99 97 97 98 110 102 95 98
Die per wafer 466 467 476 482 490 458 456 463 463 462 411 442 477 461Wafer per quarter (thousands) 114 206 156 127 130 229 181 150 143 235 584 587 641 710
Wafer per month demand 38.0 68.8 51.9 42.3 43.2 76.2 60.5 49.9 47.8 78.4 194.6 195.8 213.6 236.7
Capex required ($bn) $0.5 $0.9
TSMC potential 3Q14 4Q14 1Q15 2Q15 3Q15 4Q15 1Q16 2Q16 3Q16 4Q16 2013 2014 2015 2016
Wafer demand (thousands) 114 206 156 127 130 229 181 150 143 235 584 587 641 710
Revenue per 12" wafer, US$ 7,985 7,786 7,591 7,401 8,141 7,938 7,739 7,546 9,300 9,021 5,662 8,061 7,788 8,439
Apple Processor Sales (US$ mn) $910 $1,606 $1,182 $939 $1,056 $1,815 $1,404 $1,130 $1,334 $2,123 $3,306 $4,734 $4,991 $5,992
TSMC share: 70% 80% 80% 80% 55% 55% 55% 70% 80% 85% 0% 45% 66% 74%
TSMC Apple assumption: $637 $1,285 $945 $751 $581 $998 $772 $791 $1,067 $1,804 $0 $2,118 $3,275 $4,435
Apple % of TSMC 9.1% 17.8% 13.4% 11.3% 8.7% 15.3% 12.2% 11.4% 14.2% 24.1% 0.0% 8.4% 12.2% 15.7%
Rest of TSMC $6,331 $5,943 $6,096 $5,910 $6,114 $5,509 $5,540 $6,152 $6,431 $5,694 $20,111 $23,054 $23,629 $23,818
QoQ / YoY 7.7% -6.1% 2.6% -3.0% 3.5% -9.9% 0.6% 11.1% 4.5% -11.5% 14.6% 2.5% 0.8%
TSMC sales (US$ mn) $6,968 $7,228 $7,041 $6,661 $6,695 $6,507 $6,312 $6,943 $7,499 $7,499 $20,111 $25,173 $26,905 $28,253
QoQ / YoY 14.7% 3.7% -2.6% -5.4% 0.5% -2.8% -3.0% 10.0% 8.0% 0.0% 25.2% 6.9% 5.0% Source: Company data, Credit Suisse estimates
ASE has the highest revenue content with 25% of consolidated sales now from its SiP
module projects largely for Apple (fingerprint IC, force touch, Wifi module, watch board,
and R&D for a camera module). The company also gets about 10-15% of sales from
packaging other Apple related components. Unfortunately, the company has seen
profitability weighed down by lower builds than initially projected for the watch, high pass-
through content on materials and high concentration of revenue with one customer for that
business, requiring it to do a substantial amount of work for a thin margin.
Figure 17: ASE EMS GMs and OpM on a declining trend (NT$ mn)
0.0%
2.0%
4.0%
6.0%
8.0%
10.0%
12.0%
14.0%
2Q0
9
3Q0
9
4Q0
9
1Q1
0
2Q1
0
3Q1
0
4Q1
0
1Q1
1
2Q1
1
3Q1
1
4Q1
1
1Q1
2
2Q1
2
3Q1
2
4Q1
2
1Q1
3
2Q1
3
3Q1
3
4Q1
3
1Q1
4
2Q1
4
3Q1
4
4Q1
4
1Q1
5
2Q1
5
3Q1
5
GM (%)
EMS GM EMS OpM
Source: Company data, Credit Suisse estimates
Amkor also has good content in Apple also through peripheral analog, connectivity and
sensors though for both ASE and Amkor packaging the processor, the portion that is
manufactured at Samsung should be vertically integrated, pulling a couple percent of sales
from the flip chip business back to Samsung.

03 September 2015
Asia Hardware Sector 7
Figure 18: ASE has multiple content in the iPhone Figure 19: ASE has multiple module projects for Apple
ComponentChipset
ASP
ASE's
ASP
ASE
share
ASE ASP
(US$)
SiP Module (Fingerprint) $8.0 $8.0 80% $6.4
Wifi Module (EMS) $3.0 $3.0 100% $3.0
Force Touch (EMS) $4.0 $4.0 50% $2.0
Application processor $20.0 $1.2 30% $0.4
LTE Baseband $30.0 $2.1 50% $1.1
Connectivity $5.0 $1.0 40% $0.4
Memory (DRAM/NAND/Controller) $40.0 $4.0 10% $0.4
PA/Switch $10.0 $1.0 10% $0.1
Sensors (Accel, Compass, Gyro, Temp, Touch) $12.0 $2.4 40% $1.0
Analog $7.5 $1.9 20% $0.4
NFC $2.0 $0.6 50% $0.3
Sensor hub $2.5 $0.6 50% $0.3
Audio Codec $3.0 $0.6 20% $0.1
CMOS sensor $3.0 $1.2 0% $0.0
Major silicon content (US$): $147.0 $30.4 $15.8
2012 2013 2014 2015 2016
Wifi Module Sales (US$) $389 $424 $485 $499 $503
WiFi Module % of USI Sales 18.2% 16.0% 13.9% 10.5% 9.0%
Fingerprint Module Sales (US$ mn) $0 $318 $944 $1,070 $989
Watch Module Sales (US$mn) $0 $0 $0 $678 $1,060
Force Touch Sales (US$mn) $0 $0 $0 $236 $425
Total SiP Sales (US$mn) $0 $318 $944 $1,984 $2,655
NT$ $29.4 $29.6 $30.3 $31.3 $31.4
SiP Sales (NT$mn) $0 $9,409 $28,684 $62,037 $83,373
Consolidated Sales (NT$) $193,972 $219,862 $256,622 $292,996 $330,611
SiP % of Consolidated sales 0.0% 4.3% 11.2% 21.2% 25.2%
SiP % of USI Sales 0.0% 12.0% 27.1% 41.8% 47.3%
SiP % of ATM Sales 0.0% 1.9% 6.1% 7.5% 6.6%
Source: Company data, Credit Suisse estimates Source: Company data, Credit Suisse estimates
Large screen penetration to accelerate in 2016
Apple has recently started commenting on its penetration of large screen iPhones (see
reports from CS IT Hardware analyst Kulbinder Garcha). While we acknowledge there is
some estimation in this process, we conclude that current iPhone estimates of 234 mn and
241 mn as shown below are consistent with the large screen penetration, expanding from
around 25% to over 70% of the installed base and providing a healthy tailwind to growth.
Here we make several assumptions:
■ Apple’s global active iPhone installed base at the end of last year was some 400 mn
units, rising to about 490 mn this year. Within this, Apple has said the iPhone 6 and 6
Plus penetration of the active iPhone install-base increased from a "low-teens" level to
approximately 25% as of the June 2015 quarter.
■ The percentage of the installed base that has a larger screen will accelerate in 2016.
As the iPhone 6S/6S Plus are launched, the older, smaller screen phones will begin to
appear even more antiquated. Additionally, with the iPhone 6/6 Plus likely to be sold at
a discount once the 6S/6S Plus is launched, this will make the larger form factor more
affordable and more attractive.
We estimate in 2016, over 70% of the active iPhone install base will have upgraded to a
4.7"and above iPhone, which is based on CS Apple analyst Kulbinder Garcha's CY15/16
iPhone shipment forecasts of 234 mn and 241 mn. This also implies over 85%/95% of
CY15/16 iPhone shipments will be 4.7" and above and the rest comprised of 4.0".
Figure 20: The larger screen form factor will make up more than 95% of volume next year
0.0
10.0
20.0
30.0
40.0
50.0
60.0
70.0
80.0
90.0
F4Q14 F1Q15 F2Q15 F3Q15E F4Q15E F1Q16E F2Q16E F3Q16E F4Q16E F1Q17E
iPhone 4S iPhone 5 iPhone 5C iPhone 5S iPhone 6 iPhone 6 Plus iPhone 6S iPhone 6S Plus
Source: Company data, IDC, Credit Suisse estimates
Below is our CS annual installed base analysis. Again, our CY16 241 mn estimate implies
about a 70% penetration with the install-base growing by 12%. We show that even with
the replacement rate slowing to almost 30 months, units can still grow the next two years.

03 September 2015
Asia Hardware Sector 8
Figure 21: Apple CS iPhone installed base implies units will still grow in 2016/2017 (mn) iOS global installed base analysis (in mn) 2012 2013 2014 2015E 2016E 2017E
iPhone subs 250.7 312.3 400.0 486.6 545.6 604.6
Gross add 73.2 87.9 110.0 116.6 103.5 110.0
Churn 17.6 26.3 22.3 30.0 44.5 51.0
as % of subs 9.0% 10.5% 7.1% 7.5% 9.1% 9.3%
Sub net adds 55.7 61.6 87.7 86.6 59.0 59.0
Replacement units demanded 76.1 100.3 129.7 165.5 197.9 224.2
Adjusted replacement rate 39.0% 40.0% 41.5% 41.4% 40.7% 41.1%
Adjusted replacement cycle (in months) 30.8 30.0 28.9 29.0 29.5 29.2
Total iPhone units demanded 149.3 188.2 239.7 282.1 301.4 334.2
Second hand phones recycled into the base (f) 13.9 34.5 47.0 48.0 60.0 70.0
% previous installed base (trailing 12 months) 7% 14% 17% 13% 14% 14%
% of 2 years prior installed base 18% 19% 15% 15% 14%
iPhone units demanded 135.4 153.6 192.7 234.1 241.4 264.2
yoy % 45.4% 13.5% 25.4% 21.5% 3.1% 9.4%
Implied iPhone units 135.4 153.6 192.7 234.1 241.4 264.2
CS estimated iPhone units 135.8 153.5 192.7 234.1 241.4 Source: Company data, Credit Suisse estimates
iPhone 6S spec upgrade – suppliers/beneficiaries
We expect Apple to launch refreshed 4.7" iPhone 6S and 5.5" iPhone 6S-Plus next week,
10 Sep. In addition, we expect Apple to continue providing the current generation iPhone 6
at a discounted price (US$99 with contract). The following are the key spec upgrades we
expect in upcoming iPhone 6S and key suppliers:
■ 2GB memory upgrade from 1GB. Key suppliers include Hynix and Samsung;
■ Camera lens upgrade to 12MP from 8 MP. Key suppliers include Largan and
Kantatsu;
■ Force-touch and haptics addition. Key suppliers include TPK/GIS (force-touch
lamination); AAC/Nidec (haptics); Nippon Mektron (i.e., NOK)/Zheng Ding (i.e. ZDT)
(for FPC); and NOK/Cheng Uei (for FPC-SMT);
■ Upgraded aluminium uni-body casing to 7,000 series. Key suppliers include
Catcher, Foxconn Technology, and Jabil;
■ Driver IC back-end. Key suppliers include Chipbond;
■ Processor upgrade to 16/14nm FinFet. The new processor we expect will move to
FinFet for better power/performance and be dual sourced at TSMC and
Samsung/GlobalFoundries, with about 30-40% of the phone volume at TSMC and the
remainder at Samsung, with GlobalFoundries a second source alternative.

03 September 2015
Asia Hardware Sector 9
Figure 22: iPhone specs and key features from iPhone 4S to iPhone 6S Manufacturer Apple Apple Apple Apple Apple Apple Apple Apple
Image
Model iPhone 4S iPhone 5 iPhone 5C iPhone 5S iPhone 6 iPhone 6 Plus iPhone 6S iPhone 6S Plus
Technology WCDMA/GSM WCDMA/GSM/LTE WCDMA/GSM/LTE WCDMA/GSM/LTE GSM/CDMA/LTE GSM/CDMA/LTE GSM/CDMA/LTE GSM/CDMA/LTE
Announced 10/4/2011 9/12/2012 9/10/2013 9/10/2013 9/9/2014 9/9/2014 Expected: 9/9/2015 Expected: 9/9/2015
Availability 10/14/2011 9/21/2012 9/20/2013 9/20/2013 9/19/2014 9/19/2014 End of Sept-2015 End of Sept-2015
Operating system iOS 5 iOS 6 iOS 7 iOS 7 iOS 8 iOS 8
CPU A5, 1 GHz A6, 1.2 GHz A6, 1.3GHz A7 1.3GHz A8 1.4GHz A8 1.4GHz
Memory (RAM) 512MB 1GB 1GB 1GB 1GB 1GB 2GB 2GB
Storage 16/32/64GB 16/32/64GB 16/32GB 16/32/64GB 16/64/128GB 16/64/128GB
Display pixels 960x640 1136x640 1136x640 1136x640 1334x750 1920x1080
Dimensions (wxhxd) (mm) 115.2x58.6x9.3 123.8x58.6x7.6 124.4x59.2x9 123.8x58.6x7.6 138.1x67x6.9 158.1x77.8x7.1
Weight (g) 140 112 132 112 129 172
Screen (inches) 3.5 4.0 4.0 4.0 4.7 5.5
Camera Megapixel 8MP/ VGA 8MP/1.2MP 8MP/1.2MP 8MP/1.2MP 8MP/1.2MP 8MP/1.2MP 12MP/1.2MP 12MP/1.2MP
OIS no no no no no yes
Sensor size 1/3.2'' 1/3.2'' 1/3.2'' 1/3'' 1/3'' 1/3''
Aperture ƒ/2.4 ƒ/2.4 ƒ/2.4 ƒ/2.2 ƒ/2.2 ƒ/2.2
Touchscreen G/G capacitive In-Cell capacitive In-Cell capacitive In-Cell capacitive In-Cell capacitive In-Cell capacitive In-Cell capacitive
with force-touch
In-Cell capacitive
with force-touch
Battery 1432 mAh 1440 mAh 1510 mAh 1560 mAh 1810 mAh 2915 mAh
Talk time (hrs) up to 8h up to 8h up to 10h up to 10h up to 14h up to 24h
Standby time (hrs) up to 200h up to 225h up to 250h up to 250h up to 250h up to 384h
Price (US$) US$199/299/399 US$199/299/399 US$99/199 US$199/299/399 US$199/299/399 US$299/399/499
Casing Glass+steel frame Al Unibody Plastic Unibody Al Unibody Al 6,000 Unibody Al 6,000 Unibody Al 7,000 Unibody Al 7,000 Unibody Source: Company data, Credit Suisse
iPhone 6S needs to top 10 mn in first weekend sales
to beat iPhone 6; and 9 mn to beat iPhone 5S
iPhone 6S sold 10 mn in the first weekend of launch compared 9 mn for iPhone 5S, and 5
mn for iPhone 6. iPhone 6 country expansion was the fastest in Apple's iPhone history. In
roughly one and half months, Apple was shipping iPhone 6 in 47 countries. The initial
country at launch has included US, Australia, Canada, France, Germany, Hong Kong,
Japan, Singapore, and the UK the past two cycles. iPhone 6 add Puerto Rico. iPhone 6
was introduced and shipping in China roughly one month after launch compared to three
months from launch of iPhone 5S. See launch dates and country expansion details below:
Figure 23: Historical iPhone launch dates, pre-order vs. ship dates and country expansion Announcement Announce date Pre-order date Ship date Countries
iPhone 6 and 6 Plus product cycle
Add 36 more countries in October month 10/13/2014 N/A 10/17-10/31/14 Friday, October 17: China, India and Monaco / Thursday, October 23: Israel / Friday, October 24: Czech Republic,
French West Indies, Greenland, Malta, Poland, Reunion Island and South Africa / Thursday, October 30: Bhrain
and Kuwait / Friday, October 31: Albania, Bosnia, Croatia, Estonia, Greece, Guam, Hungary, Iceland, Kosovo,
Latvia, Lithuania, Macau, Macedonia, Mexico, Moldova, Montenegro, Serbia, South Korea, Romania, Slovakia,
Slovenia, Ukraine and Thailan
China avaliability 9/30/2014 N/A 10/10/2014 China release on 10/10 with China Mobile, China Telecom and China Unicom
Sold 10 mn in first weekend of launch 9/22/2014 US, Australia, Canada, France, Germany, Hong Kong, Japan, Puerto Rico, Singapore and the UK
Sold 4 mn in 24 hours of launch date 9/15/2014 US, Australia, Canada, France, Germany, Hong Kong, Japan, Puerto Rico, Singapore and the UK
iPhone 6 at US$199 (16GB), 6Plus at US$299 (16GB) 9/9/2014 9/12/2014 9/19/2014 US, Australia, Canada, France, Germany, Hong Kong, Japan, Puerto Rico, Singapore and the UK
iPhone 5S and 5C product cycle
China avaliability 12/22/2013 N/A 1/17/2014
Sold 9 mn in first weekend of launch 9/23/2013
iPhone 5S at US$199 (16GB) 9/10/2013 9/12/2013 9/20/2014 US, Australia, Canada, China, France, Germany, Hong Kong, Japan, Puerto Rico, Singapore and the UK
iPhone 5C at US$99 (16GB) 9/10/2013 9/12/2013 9/20/2014 US, Australia, Canada, China, France, Germany, Hong Kong, Japan, Puerto Rico, Singapore and the UK
iPhone 4S 8GB model 9/10/2013 N/A N/A
Japan avaliability announced with NTT DOCOMO 9/10/2013 9/13/2013 9/20/2013
iPhone 5 product cycle
China, 2 mn in first weekend of launch (iPhone 5) 12/17/2012
China avaliability 11/30/2012 N/A 12/14/2015
Adds 22 more countries on Sept 28 9/12/2012 N/A 9/28/2012 Austria, Belgium, Czech Republic, Denmark, Estonia, Finland, Hungary, Ireland, Italy, Liechtenstein, Lithuania,
Luxembourg, Netherlands, New Zealand, Norway, Poland, Portugal, Slovakia, Slovenia, Spain, Sweden and
Switzerland.
iPhone 5, 5 mn in first weekend 9/24/2012
iPhone 5 pre-orders top 2 mn in first 24 hours 9/17/2012
iPhone 5 US$199 (16GB) 9/12/2012 9/14/2012 9/21/2012 US, Australia, Canada, France, Germany, Hong Kong, Japan, Singapore and the UK
iPhone 4S for US$99, iPhone 4 free with contract 9/12/2012
iPhone 4S product cycle
Adds 22 more countries by Oct 28; and 70 countries by YE
iPhone 4S, 4 mn in first weekend 10/17/2011
iPhone 4S pre-orders top 1 mn in first 24 hours 10/10/2011
iPhone 4S for US$199 (16GB) 10/4/2011 10/7/2011 10/14/2011 US, Australia, Canada, France, Germany, Japan and the UK
iPhone 4 product cycle
Avaliable on Verizon 1/11/2011 2/10/2011
China avaliability and on China Unicom 9/19/2010 9/25/2010
Adds 17 countries 7/26/2010 7/30/2010
iPhone 4 US$199 (16GB) 6/10/2010 6/15/2010 6/24/2010 US, UK, France, Germany and Japan
iPhone 3GS US$99 (16GB) Source: Company data, Credit Suisse
03 September 2015
Asia Hardware Sector 10
Genius has had the greatest share price volatility pre
and post iPhone launch event
Genius is consistently the best performing stock (based on share price) one week after
iPhone launch over the two of three iPhone launches (i.e., iPhone 6 and 5). It is also
consistently one of the worst performing names one month into the launch. Genius share
price is the worst performing name one-month into the iPhone 6S launch next week.
Chipbond’s share price also performed consistently well one week post launch; it provides
the backend service for the iPhone driver IC.
Figure 24: Genius' share price is consistently the worst performing name one month
ahead of iPhone launch – and is the case into iPhone 6S – but is the consistently one of
the best performing names one week after iPhone launch. Share price performance from Aug 2, 2015 through Sept 2, 2015
Genius
Unimicron
TSMC
TSE
ASE
Chipbond
Catcher
Pegatron
Hon Hai
Largan
Delta
Foxconn Tech
TXC
-30.0% -25.0% -20.0% -15.0% -10.0% -5.0% 0.0% 5.0% 10.0% 15.0%
iPhone 6S (Aug 2 to Sept 2)
Source: Company data, Credit Suisse estimates
Figure 25: Supply chain price chg 1 mnth pre-iPhone 6 Share price performance one month pre- launch
Figure 26: Supply chain price chg 1 wk post iPhone 6 Share price performance one week post launch
Genius
TXC
Delta
Unimicron
Largan
TSEC
TSMC
ASE
Pegatron
Chipbond
Foxconn Tech
Hon Hai
Catcher
-10.0% -5.0% 0.0% 5.0% 10.0% 15.0%
iPhone 6 launch
-10.0% -5.0% 0.0% 5.0% 10.0% 15.0% 20.0% 25.0%
Delta
Largan
Catcher
Pegatron
TXC
TSEC
Foxconn Tech
Unimicron
TSMC
Hon Hai
ASE
Chipbond
Genius
iPhone 6
Source: Company data, TEJ, Credit Suisse Source: Company data, TEJ, Credit Suisse

03 September 2015
Asia Hardware Sector 11
Figure 27: Supply chain price chg 1 mnth pre-iPhone 5S Share price performance one month pre- launch
Figure 28: Supply chain price chg 1 wk post iPhone 5S Share price performance one week post launch
Largan
Delta
Pegatron
Genius
TXC
Unimicron
TSEC
Foxconn Tech
Catcher
TSMC
Chipbond
Hon Hai
ASE
-5.0% 0.0% 5.0% 10.0% 15.0% 20.0%
iPhone 5S launch
-10.0% -8.0% -6.0% -4.0% -2.0% 0.0% 2.0% 4.0%
Pegatron
Genius
TXC
ASE
Largan
Hon Hai
Delta
Chipbond
Foxconn Tech
Unimicron
TSEC
TSMC
Catcher
iPhone 5S
Source: Company data, TEJ, Credit Suisse Source: Company data, TEJ, Credit Suisse
Figure 29: Supply chain price chg 1 mnth pre-iPhone 5 Share price performance one month pre- launch
Figure 30: Supply chain price chg 1 wk post iPhone 5 Share price performance one week post launch
Genius
Pegatron
Unimicron
Catcher
TSEC
TSMC
TXC
Largan
ASE
Delta
Foxconn Tech
Hon Hai
Chipbond
-10.0% -5.0% 0.0% 5.0% 10.0% 15.0% 20.0%
iPhone 5 launch
-10.0% -5.0% 0.0% 5.0% 10.0% 15.0%
Chipbond
Largan
ASE
TSMC
Delta
Foxconn Tech
TSEC
TXC
Catcher
Hon Hai
Pegatron
Unimicron
Genius
iPhone 5
Source: Company data, TEJ, Credit Suisse Source: Company data, TEJ, Credit Suisse

03 September 2015
Asia Hardware Sector 12
Apple’s Asia-Pac including Japan Product Supply Chain Figure 31: Apple’s Asia-Pac including Japan Product Supply Chain Component Company % of sales Ticker iPhone 6S Plus iPhone 6S iPhone 6 Plus iPhone 6 iPad Air 2 iPad mini 3 iPad Pro Apple Watch 12" MacBook
Assembly Hon Hai 50% 2317.TW
Quanta 35% 2382.TW
Pegatron 50% 4938.TW
Compal 5% 2324.TW
Wistron 5% 3231.TW
Semi Fab Samsung (20-40% of LSI) 005930.KS
ASE 25% 2311.TW
TSMC 15% 2330.TW
Memory Samsung 10% 005930.KS
Hynix 15% 000660.KS
Casing Catcher >50% 2474.TW
FTC >50% 2354.TW
Casetek >50% 5264.TW
PCB Tripod 5% 3044.TW
Kinsus 10% 3189.TW
NYPCB 5-10% 8046.TW
Unimicron 5-10% 3037.TW
Compeq 10% 2313.TW
Camera Largan >50% 3008.TW
Genius NA 3406.TW
Camera module LGI 20-25% 011070.KS
Cowell 1415.HK
Primax 4915.TW
Display Samsung 005930.KS
Radiant 40% 6176.TW
LGD 20-25% 034220.KS
Sharp 6753.JP
JDI 6740.JP
Touch TPK 45% 3673.TW
G-Tech 80% 3149.TW
Driver IC Package Chipbond 15% 6147.TWO
Timing controller Parade 60-65% 4966.TWO
Quartz Crystal TXC 15% 3042.TW
Power/Passive Delta 5-10% 2308.TW
Acoustic Merry 20% 2439.TW
AAC Tech 40% (total) 2018.HK
Haptics AAC Tech 15% (Haptics) 2018.HK
Nidec 6594.T
TDK
LGC
Sony
Battery Simplo 40-50% 6121.TWO
Keyboard Darfon 15% 8163.TW
Sunrex 15% 2387.TW
Trackpad Primax ~10% 4915.TW
Hinge SZS 15% 3376.TW
JarllyTec 20-30% 3548.TW Source: Company data, Credit Suisse estimates
Figure 32: Japan-focused iPhone 6S component suppliers 1st supplier 2nd supplier 3rd supplier
MLCC Murata Taiyo Yuden SEMCO
Thermistor Murata TDK
Chip beads TDK Murata Taiyo Yuden
Crystal Devices
Power Inductor Cyntec Taiyo Yuden Toko/Murata
Common Mode Filter TDK Murata
RF inductor Murata
B to B Connector
Antenna Connector Murata
Headset Foster Goetek
Main HDI
FC-CSP for AP Ibiden SEMCO
VCM for AF Alps Mitsumi Nidec
OIS Alps Mitsumi
CMOS Image Sensor Sony
Ceramic Packages
Haptic Nidec AAC
Battery TDK LGC Sony
Backlight units Minebea Radiant
Duplexer
BPF
Main RF Front End module
Diversity Module Murata Skyworks
WIFI MODULE Murata USI TDK
Switches Mitsumi Alps Panasonic
Avago/Skyworks/QORVO/Murata
EPSON/NDK/TXC/Kyocera/Murata
JAE/Kyocera/Panasonic/Molex/Hirose
Ibiden/UMTC/AT&S/Compeq/TTM
Kyocera (Camera module/Crystal/SAW devices)/NGKS
Avago/Skyworks/TDK/Taiyo Yuden
Murata/TDK/QORVO/AVAGO/SWKS
Source: Company data, Credit Suisse estimates
03 September 2015
Asia Hardware Sector 13
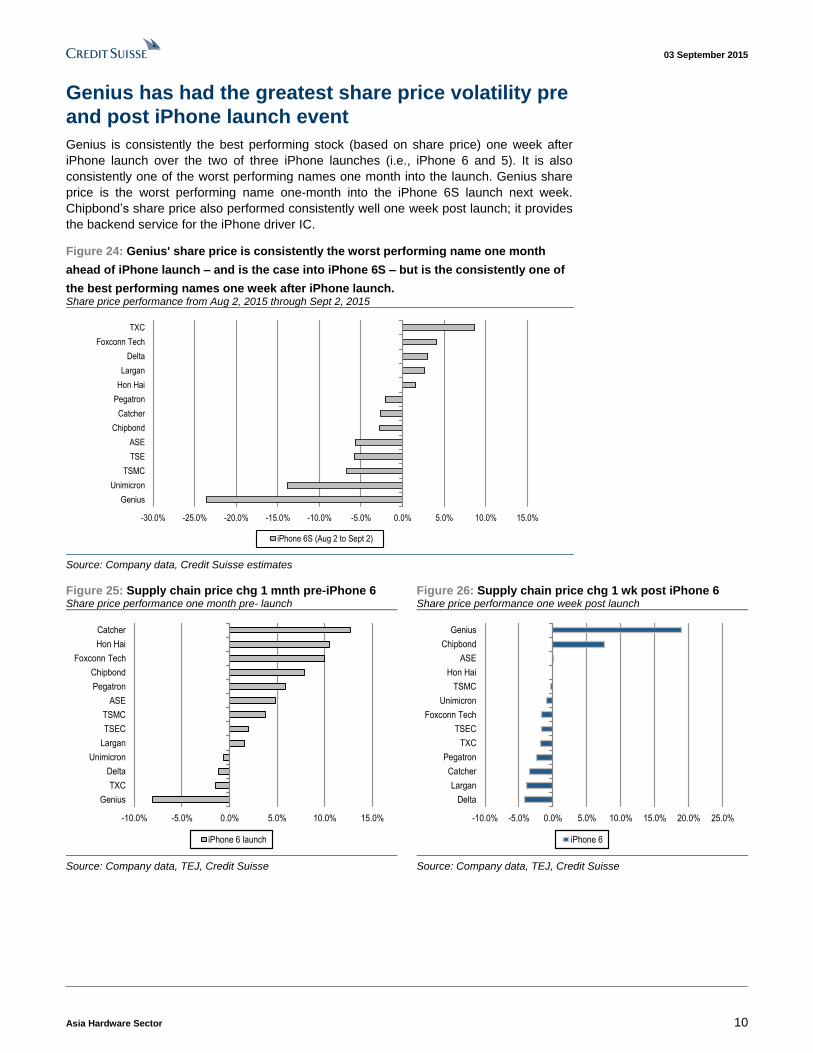
Companies Mentioned (Price as of 02-Sep-2015)
AAC Technologies Holdings Inc (2018.HK, HK$44.1) Advanced Semicon. Engr. (2311.TW, NT$31.75) Amkor Technology Inc. (AMKR.OQ, $5.17) Apple Inc (AAPL.OQ, $112.34) Casetek Holdings Limited (5264.TW, NT$122.5) Catcher Technology (2474.TW, NT$321.5, OUTPERFORM, TP NT$431.0) Chipbond (6147.TWO, NT$47.85, OUTPERFORM, TP NT$70.0) Compal Electronics (2324.TW, NT$18.1) Compeq Mftg (2313.TW, NT$21.75) Coxon (3607.TW, NT$51.2) Darfon (8163.TW, NT$14.7) Delta Electronics (2308.TW, NT$156.5) EPSON TOYO (6708.DE^E09, €3.2) Eson Precision (5243.TW, NT$25.8) Foster Electric (6794.T, ¥2,249) Foxconn Technology Corp (2354.TW, NT$93.2) G-Tech (3149.TW, NT$11.7) GSEO (3406.TW, NT$46.45) Hirose Electric (6806.T, ¥13,170) Hon Hai Precision (2317.TW, NT$90.6, OUTPERFORM, TP NT$127.0) Japan Display (6740.T, ¥365) Jarlly (3548.TWO, NT$19.1) Kinsus Interconnect Tech (3189.TW, NT$60.4) Kyocera (6971.T, ¥5,812) LG Display Co Ltd. (034220.KS, W22,850) LG Innotek (011070.KS, W89,900) Largan Precision (3008.TW, NT$2950.0, OUTPERFORM, TP NT$4000.0) Minebea (MNBEY.PK, $30.19) Mitsumi Electric (6767.T, ¥639) Molex (MOLXA.OQ^L13, $38.66) Murata Manufacturing (6981.T, ¥16,370) Nan Ya Printed Circuit Board (8046.TW, NT$30.0) Nidec (6594.T, ¥9,226) Panasonic (6752.T, ¥1,258) Parade Technologies (4966.TWO, NT$245.5) Pegatron (4938.TW, NT$83.1) Primax (4915.TW, NT$40.2) Radiant Opto-Electronics (6176.TW, NT$97.0) SK Hynix (HYNIX.LU, $29.07) SK Hynix Inc. (000660.KS, W34,350) SZS (3376.TW, NT$81.0) Samsung Electronics (005930.KS, W1,090,000) Sharp (6753.T, ¥169) Simplo (6121.TWO, NT$109.0) Skyworks Solutns (SWKS.OQ, $85.74) Sunrex (2387.TW, NT$12.2) TDK (6762.T, ¥6,940) TPK Holdings (3673.TW, NT$81.8, OUTPERFORM[V], TP NT$215.0) TXC Corp. (3042.TW, NT$33.1) Taiyo Yuden (6976.T, ¥1,407) Tripod Technology (3044.TW, NT$45.1) Unimicron Technology Corp (3037.TW, NT$12.75) Wistron (3231.TW, NT$16.4)
Disclosure Appendix
Important Global Disclosures
Thompson Wu, Randy Abrams, CFA, Pauline Chen and Jerry Su each certify, with respect to the companies or securities that the individual analyzes, that (1) the views expressed in this report accurately reflect his or her personal views about all of the subject companies and securities and (2) no part of his or her compensation was, is or will be directly or indirectly related to the specific recommendations or views expressed in this report.

03 September 2015
Asia Hardware Sector 14
3-Year Price and Rating History for Catcher Technology (2474.TW)
2474.TW Closing Price Target Price
Date (NT$) (NT$) Rating
12-Sep-12 146.00 155.00 N
29-Oct-12 119.00 135.00
07-Jan-13 145.00 155.00
01-Apr-13 140.00 163.00 O
06-May-13 160.00 184.00
01-Nov-13 172.00 200.00
06-Feb-14 208.00 240.00
29-Apr-14 273.50 315.00
05-Jun-14 282.00 330.00
07-Jul-14 283.50 335.00
05-Mar-15 289.00 370.00
19-Mar-15 303.00 375.00
07-Apr-15 360.50 394.00
29-Apr-15 350.00 431.00
* Asterisk signifies initiation or assumption of coverage.
N EU T RA L
O U T PERFO RM
3-Year Price and Rating History for Chipbond (6147.TWO)
6147.TWO Closing Price Target Price
Date (NT$) (NT$) Rating
28-Sep-12 46.50 50.00 O
15-Oct-12 48.15 52.50
24-Oct-12 49.80 55.00
18-Nov-12 51.60 57.00
30-Nov-12 56.30 57.00 N
30-Jan-13 60.50 60.00
02-May-13 79.00 68.00
11-Jun-13 78.70 70.00
12-Aug-13 60.50 75.00 O
14-Oct-13 55.50 72.00
11-Dec-13 56.30 55.00 N
15-Jan-14 46.05 49.00
10-Apr-14 55.00 51.00
16-Sep-14 55.70 66.00 O
04-Nov-14 57.00 69.00
12-Jan-15 62.90 72.00
25-May-15 71.50 86.00
13-Jul-15 56.90 80.00
04-Aug-15 45.80 70.00
* Asterisk signifies initiation or assumption of coverage.
O U T PERFO RM
N EU T RA L

03 September 2015
Asia Hardware Sector 15
3-Year Price and Rating History for Hon Hai Precision (2317.TW)
2317.TW Closing Price Target Price
Date (NT$) (NT$) Rating
18-Oct-12 71.02 77.11 N
14-Nov-12 72.89 81.17
21-Feb-13 67.53 76.30
15-Apr-13 62.58 69.81
24-Apr-13 63.39 67.37
16-May-13 63.88 60.07
24-Jul-13 64.12 61.69
14-Aug-13 64.20 74.11
21-Nov-13 66.96 90.18 O
13-Jan-14 73.04 96.43
15-May-14 79.11 98.21
17-Jul-14 95.09 126.00
14-Nov-14 96.80 125.00
31-Mar-15 91.60 123.00
18-May-15 96.80 127.00
* Asterisk signifies initiation or assumption of coverage.
N EU T RA L
O U T PERFO RM
3-Year Price and Rating History for Largan Precision (3008.TW)
3008.TW Closing Price Target Price
Date (NT$) (NT$) Rating
18-Sep-12 659.00 670.00 N
25-Oct-12 595.00 700.00 O
05-Nov-12 615.00 710.00
07-Jan-13 746.00 830.00 N
31-Jan-13 773.00 850.00
25-Apr-13 688.00 825.00 O
23-Jul-13 875.00 999.00
25-Jul-13 935.00 1060.00
07-Oct-13 1000.00 1130.00
23-Jan-14 1185.00 1360.00
24-Apr-14 1755.00 2100.00
04-Jun-14 1980.00 2310.00
07-Jul-14 2425.00 2800.00
07-Apr-15 2755.00 2940.00
16-Apr-15 2785.00 3280.00
10-Jun-15 3270.00 3750.00
08-Jul-15 3280.00 3760.00
16-Jul-15 3520.00 4000.00
* Asterisk signifies initiation or assumption of coverage.
N EU T RA L
O U T PERFO RM

03 September 2015
Asia Hardware Sector 16
3-Year Price and Rating History for TPK Holdings (3673.TW)
3673.TW Closing Price Target Price
Date (NT$) (NT$) Rating
28-Sep-12 384.50 475.00 O
07-Nov-12 406.50 495.00
05-Dec-12 496.50 680.00
26-Feb-13 552.00 710.00
04-Jul-13 408.50 535.00
06-Aug-13 325.00 485.00
21-Oct-13 232.00 380.00
01-Nov-13 192.50 207.00 N
19-Feb-14 180.50 175.00
22-Apr-14 223.00 210.00
07-Jul-14 275.00 300.00
24-Jul-14 238.50 270.00
23-Oct-14 147.00 155.00
10-Feb-15 202.00 210.00
30-Apr-15 191.00 200.00
08-Jun-15 191.00 240.00 O
29-Jul-15 131.50 215.00
* Asterisk signifies initiation or assumption of coverage.
O U T PERFO RM
N EU T RA L
The analyst(s) responsible for preparing this research report received Compensation that is based upon various factors including Credit Suisse's total revenues, a portion of which are generated by Credit Suisse's investment banking activities
As of December 10, 2012 Analysts’ stock rating are defined as follows:
Outperform (O) : The stock’s total return is expected to outperform the relevant benchmark*over the next 12 months.
Neutral (N) : The stock’s total return is expected to be in line with the relevant benchmark* over the next 12 months.
Underperform (U) : The stock’s total return is expected to underperform the relevant benchmark* over the next 12 months.
*Relevant benchmark by region: As of 10th December 2012, Japanese ratings are based on a stock’s total return relative to the analyst's coverage universe which consists of all companies covered by the analyst within the relevant sector, with Outperforms representing the most attractiv e, Neutrals the less attractive, and Underperforms the least attractive investment opportunities. As of 2nd October 2012, U.S. and Canadian as well as European ratings are based on a s tock’s total return relative to the analyst's coverage universe which consists of all companies covered by the analyst within the r elevant sector, with Outperforms representing the most attractive, Neutrals the less attractive, and Underperforms the least attractive investment opportunities. For Latin Ame rican and non-Japan Asia stocks, ratings are based on a stock’s total return relative to the average total return of the relevant country or regional benchmark; prior to 2nd October 2012 U.S. and Canadian ratings were based on (1) a stock’s absolute total return potential to its current share price and (2) the relative attractiv eness of a stock’s total return potential within an analyst’s coverage universe. For Australian and New Zealand stocks, the expected total return (ETR) calculation includes 1 2-month rolling dividend yield. An Outperform rating is assigned where an ETR is greater than or equal to 7.5%; Underperform where an ETR less than or equal to 5%. A Neutral may be assigned where the ETR is between -5% and 15%. The overlapping rating range allows analysts to assign a rating that puts ETR in the context of associated risks. Prior to 18 May 2015, ETR ranges for Outperform and Underperform ratings did not overlap with Neutral thresholds between 15% and 7.5%, wh ich was in operation from 7 July 2011.
Restricted (R) : In certain circumstances, Credit Suisse policy and/or applicable law and regulations preclude certain types of communications, including an investment recommendation, during the course of Credit Suisse's engagement in an investment banking transaction and in certain other circumstances.
Volatility Indicator [V] : A stock is defined as volatile if the stock price has moved up or down by 20% or more in a month in at least 8 of the past 24 months or the analyst expects significant volatility going forward.
Analysts’ sector weightings are distinct from analysts’ stock ratings and are based on the analyst’s expectations for the fundamentals and/or valuation of the sector* relative to the group’s historic fundamentals and/or valuation:
Overweight : The analyst’s expectation for the sector’s fundamentals and/or valuation is favorable over the next 12 months.
Market Weight : The analyst’s expectation for the sector’s fundamentals and/or valuation is neutral over the next 12 months.
Underweight : The analyst’s expectation for the sector’s fundamentals and/or valuation is cautious over the next 12 months.
*An analyst’s coverage sector consists of all companies covered by the analyst within the relevant sector. An analyst may cov er multiple sectors.

03 September 2015
Asia Hardware Sector 17
Credit Suisse's distribution of stock ratings (and banking clients) is:
Global Ratings Distribution
Rating Versus universe (%) Of which banking clients (%)
Outperform/Buy* 54% (31% banking clients)
Neutral/Hold* 31% (42% banking clients)
Underperform/Sell* 12% (33% banking clients)
Restricted 3%
*For purposes of the NYSE and NASD ratings distribution disclosure requirements, our stock ratings of Outperform, Neutral, and Underperform most closely correspond to Buy, Hold, and Sell, respectively; however, the meanings are not the same, as our stock ratings are determined on a relative basis. (Please refer to definitions above.) An investor's decision to buy or sell a security should be based on investment objectives, current holdin gs, and other individual factors.
Credit Suisse’s policy is to update research reports as it deems appropriate, based on developments with the subject company, the sector or the market that may have a material impact on the research views or opinions stated herein.
Credit Suisse's policy is only to publish investment research that is impartial, independent, clear, fair and not misleading. For more detail please refer to Credit Suisse's Policies for Managing Conflicts of Interest in connection with Investment Research: http://www.csfb.com/research-and-analytics/disclaimer/managing_conflicts_disclaimer.html
Credit Suisse does not provide any tax advice. Any statement herein regarding any US federal tax is not intended or written to be used, and cannot be used, by any taxpayer for the purposes of avoiding any penalties.
Price Target: (12 months) for Catcher Technology (2474.TW)
Method: Our target price of NT$431 for Catcher is based on 15x NTM EPS (earnings per share). We use 15x, compared to its historical trading range of 5-25x.
Risk: Risks to our NT$431 target price for Catcher may include: (1) increasing customer concentration risk, which could lead to higher volatility in earnings; (2) yield rates for new product cycle; (3) high capex being a risk to margins; (4) Asian currency appreciation; and (5) end-market demand.
Price Target: (12 months) for Chipbond (6147.TWO)
Method: Our 12-month forward target price of NT$70 for Chipbond is based on 13x 2016 P/E (price-to-earnings), mid cycle multiple vs its 10-15x historical range.
Risk: Key risks to our target price of NT$70 for Chipbond include: (1) weaker-than-expected demand for smartphones, tablet PCs, NBs, monitors and TVs , (2) market share loss, and (3) NTD appreciation.
Price Target: (12 months) for Hon Hai Precision (2317.TW)
Method: Our NT$127 target price for Hon Hai Precision is based on 11x our NTM earnings per share (EPS) vs its last three-year P/E range of 8-12x. We believe a 11x multiple is appropriate as we expect data-centre growth can accelerate earnings growth in 2015 and improve margins and ROEs.
Risk: Risks to our NT$127 target price for Hon Hai Precision include: (1) the impact from rising China labour costs coming in larger than expected; (2) the potential of key clients cutting orders due to labour events, or the potential and orders are stronger than expected due to PC product cycles and devices, including tablets and smartphones; and (3) change in Hon Hai's relationship with Apple, its largest customer in revenue contribution terms.
Price Target: (12 months) for Largan Precision (3008.TW)
Method: Our target price of NT$4,000 for Largan Precision is based on 19x 2016E EPS (+1 STD), given its good earnings quality.
Risk: Risks that could impede achievement of our NT$4,000 target price for Largan Precision include: (1) Apple apparently giving the supply chain pretty aggressive forecasts for 2H; (2) Largan has a much lower share of the low-priced iPhone; and (3) Sunny Optical ramping up faster than expected.
Price Target: (12 months) for TPK Holdings (3673.TW)
Method: Our 12-month target price of NT$215 for TPK Holdings is based on 14x 2016 P/E (fully diluted), average of historical range of 6-23x in 2010-11 when TPK was the main touch panel supplier for iPhone .
Risk: Our target price of NT$215 for TPK Holdings has the following risks: (1) high customer concentration (Apple), (2) competition heating up, (3) weaker demand on economic slowdown, and (4) shifts in technology trends.

03 September 2015
Asia Hardware Sector 18
Please refer to the firm's disclosure website at https://rave.credit-suisse.com/disclosures for the definitions of abbreviations typically used in the target price method and risk sections.
See the Companies Mentioned section for full company names
The subject company (2317.TW, 3673.TW, 4938.TW, 2354.TW, 5264.TW, 3037.TW, AAPL.OQ, 005930.KS, AMKR.OQ, 2324.TW, 3231.TW, 000660.KS, 034220.KS, 6753.T, 6752.T) currently is, or was during the 12-month period preceding the date of distribution of this report, a client of Credit Suisse.
Credit Suisse provided investment banking services to the subject company (AAPL.OQ, 6752.T) within the past 12 months.
Credit Suisse has managed or co-managed a public offering of securities for the subject company (AAPL.OQ) within the past 12 months.
Credit Suisse has received investment banking related compensation from the subject company (AAPL.OQ, 6752.T) within the past 12 months
Credit Suisse expects to receive or intends to seek investment banking related compensation from the subject company (2317.TW, 3673.TW, 3008.TW, 2474.TW, 4938.TW, 5264.TW, 3037.TW, 2308.TW, AAPL.OQ, 005930.KS, 6594.T, AMKR.OQ, 2324.TW, 3231.TW, 000660.KS, 3044.TW, 8046.TW, 034220.KS, 6753.T, 6740.T, 6976.T, 6981.T, 6971.T, 6762.T, 6806.T, 6752.T) within the next 3 months.
As of the date of this report, Credit Suisse makes a market in the following subject companies (AAPL.OQ, 6753.T, 6971.T, 6752.T).
As of the end of the preceding month, Credit Suisse beneficially own 1% or more of a class of common equity securities of (3673.TW, 2474.TW, 4938.TW, 2311.TW, 2354.TW, 6176.TW, 3189.TW, 2324.TW, 3231.TW, 3044.TW).
Credit Suisse has a material conflict of interest with the subject company (005930.KS) . Credit Suisse is acting as exclusive financial advisor to Samsung Electronics and Samsung Fine Chemicals in relation to the proposed sale of their ownership stakes in the semiconductor wafer joint ventures with SunEdison, SMP Ltd and MEMC Korea Company Ltd, to SunEdison.
Credit Suisse has a material conflict of interest with the subject company (6753.T) . Credit Suisse is acting as a sole financial advisor to Canadian Solar regarding an acquisition of Recurrent Energy, LLC from its parent company, Sharp Corporation.
As of the date of this report, an analyst involved in the preparation of this report has the following material conflict of interest with the subject company (AAPL.OQ). A Credit Suisse analyst involved in the preparation of this report has a long position in the common stock of AAPL.
For other important disclosures concerning companies featured in this report, including price charts, please visit the website at https://rave.credit-suisse.com/disclosures or call +1 (877) 291-2683.
Important Regional Disclosures
Singapore recipients should contact Credit Suisse AG, Singapore Branch for any matters arising from this research report.
The analyst(s) involved in the preparation of this report have not visited the material operations of the subject company (2317.TW, 3673.TW, 6147.TWO, 3008.TW, 2474.TW, 4938.TW, 2311.TW, 2354.TW, 5264.TW, 3037.TW, 2308.TW, 3042.TW, 6176.TW, AAPL.OQ, AAPL.OQ, 3189.TW, 005930.KS, 2018.HK, 6594.T, AMKR.OQ, 2324.TW, 3231.TW, 000660.KS, 3044.TW, 8046.TW, 034220.KS, 6753.T, 6740.T, 4966.TWO, 6976.T, 6981.T, 6971.T, 6762.T, 6806.T, 6752.T, 6767.T) within the past 12 months
Restrictions on certain Canadian securities are indicated by the following abbreviations: NVS--Non-Voting shares; RVS--Restricted Voting Shares; SVS--Subordinate Voting Shares.
Individuals receiving this report from a Canadian investment dealer that is not affiliated with Credit Suisse should be advised that this report may not contain regulatory disclosures the non-affiliated Canadian investment dealer would be required to make if this were its own report.
For Credit Suisse Securities (Canada), Inc.'s policies and procedures regarding the dissemination of equity research, please visit https://www.credit-suisse.com/sites/disclaimers-ib/en/canada-research-policy.html.
The following disclosed European company/ies have estimates that comply with IFRS: (6806.T).
Credit Suisse has acted as lead manager or syndicate member in a public offering of securities for the subject company (2311.TW, AAPL.OQ, AMKR.OQ, 000660.KS) within the past 3 years.
As of the date of this report, Credit Suisse acts as a market maker or liquidity provider in the equities securities that are the subject of this report.
Principal is not guaranteed in the case of equities because equity prices are variable.
Commission is the commission rate or the amount agreed with a customer when setting up an account or at any time after that.
Taiwanese Disclosures: This research report is for reference only. Investors should carefully consider their own investment risk. Investment results are the responsibility of the individual investor. Reports may not be reprinted without permission of CS. Reports written by Taiwan based analysts on non-Taiwan listed companies are not considered recommendations to buy or sell securities under Taiwan Stock Exchange Operational Regulations Governing Securities Firms Recommending Trades in Securities to Customers.
To the extent this is a report authored in whole or in part by a non-U.S. analyst and is made available in the U.S., the following are important disclosures regarding any non-U.S. analyst contributors: The non-U.S. research analysts listed below (if any) are not registered/qualified as research analysts with FINRA. The non-U.S. research analysts listed below may not be associated persons of CSSU and therefore may not be subject to the NASD Rule 2711 and NYSE Rule 472 restrictions on communications with a subject company, public appearances and trading securities held by a research analyst account.
03 September 2015
Asia Hardware Sector 19
Credit Suisse (Hong Kong) Limited .................................................................................................................................................... Manish Nigam
Credit Suisse AG, Taipei Securities Branch ........................................................ Thompson Wu ; Randy Abrams, CFA ; Pauline Chen ; Jerry Su
For Credit Suisse disclosure information on other companies mentioned in this report, please visit the website at https://rave.credit-suisse.com/disclosures or call +1 (877) 291-2683.
03 September 2015
Asia Hardware Sector 20
References in this report to Credit Suisse include all of the subsidiaries and affiliates of Credit Suisse operating under its investment banking division. For more information on our structure, please use the following link: https://www.credit-suisse.com/who-we-are This report may contain material that is not directed to, or intended for distribution to or use by, any person or entity who is a citizen or resident of or located in any locality, state, country or other jurisdiction where such distribution, publication, availability or use would be contrary to law or regulation or which would subject Credit Suisse AG or its affiliates ("CS") to any registration or licensing requirement within such jurisdiction. All material presented in this report, unless specifically indicated otherwise, is under copyright to CS. None of the material, nor its content, nor any copy of it, may be altered in any way, transmitted to, copied or distributed to any other party, without the prior express written permission of CS. All trademarks, service marks and logos used in this report are trademarks or service marks or registered trademarks or service marks of CS or its affiliates. The information, tools and material presented in this report are provided to you for information purposes only and are not to be used or considered as an offer or the solicitation of an offer to sell or to buy or subscribe for securities or other financial instruments. CS may not have taken any steps to ensure that the securities referred to in this report are suitable for any particular investor. CS will not treat recipients of this report as its customers by virtue of their receiving this report. The investments and services contained or referred to in this report may not be suitable for you and it is recommended that you consult an independent investment advisor if you are in doubt about such investments or investment services. Nothing in this report constitutes investment, legal, accounting or tax advice, or a representation that any investment or strategy is suitable or appropriate to your individual circumstances, or otherwise constitutes a personal recommendation to you. CS does not advise on the tax consequences of investments and you are advised to contact an independent tax adviser. Please note in particular that the bases and levels of taxation may change. Information and opinions presented in this report have been obtained or derived from sources believed by CS to be reliable, but CS makes no representation as to their accuracy or completeness. CS accepts no liability for loss arising from the use of the material presented in this report, except that this exclusion of liability does not apply to the extent that such liability arises under specific statutes or regulations applicable to CS. This report is not to be relied upon in substitution for the exercise of independent judgment. CS may have issued, and may in the future issue, other communications that are inconsistent with, and reach different conclusions from, the information presented in this report. Those communications reflect the different assumptions, views and analytical methods of the analysts who prepared them and CS is under no obligation to ensure that such other communications are brought to the attention of any recipient of this report. Some investments referred to in this report will be offered solely by a single entity and in the case of some investments solely by CS, or an associate of CS or CS may be the only market maker in such investments. Past performance should not be taken as an indication or guarantee of future performance, and no representation or warranty, express or implied, is made regarding future performance. Information, opinions and estimates contained in this report reflect a judgment at its original date of publication by CS and are subject to change without notice. The price, value of and income from any of the securities or financial instruments mentioned in this report can fall as well as rise. The value of securities and financial instruments is subject to exchange rate fluctuation that may have a positive or adverse effect on the price or income of such securities or financial instruments. Investors in securities such as ADR's, the values of which are influenced by currency volatility, effectively assume this risk. Structured securities are complex instruments, typically involve a high degree of risk and are intended for sale only to sophisticated investors who are capable of understanding and assuming the risks involved. The market value of any structured security may be affected by changes in economic, financial and political factors (including, but not limited to, spot and forward interest and exchange rates), time to maturity, market conditions and volatility, and the credit quality of any issuer or reference issuer. Any investor interested in purchasing a structured product should conduct their own investigation and analysis of the product and consult with their own professional advisers as to the risks involved in making such a purchase. Some investments discussed in this report may have a high level of volatility. High volatility investments may experience sudden and large falls in their value causing losses when that investment is realised. Those losses may equal your original investment. Indeed, in the case of some investments the potential losses may exceed the amount of initial investment and, in such circumstances, you may be required to pay more money to support those losses. Income yields from investments may fluctuate and, in consequence, initial capital paid to make the investment may be used as part of that income yield. Some investments may not be readily realisable and it may be difficult to sell or realise those investments, similarly it may prove difficult for you to obtain reliable information about the value, or risks, to which such an investment is exposed. This report may provide the addresses of, or contain hyperlinks to, websites. Except to the extent to which the report refers to website material of CS, CS has not reviewed any such site and takes no responsibility for the content contained therein. Such address or hyperlink (including addresses or hyperlinks to CS's own website material) is provided solely for your convenience and information and the content of any such website does not in any way form part of this document. Accessing such website or following such link through this report or CS's website shall be at your own risk. This report is issued and distributed in Europe (except Switzerland) by Credit Suisse Securities (Europe) Limited, One Cabot Square, London E14 4QJ, England, which is authorised by the Prudential Regulation Authority and regulated by the Financial Conduct Authority and the Prudential Regulation Authority. This report is being distributed in Germany by Credit Suisse Securities (Europe) Limited Niederlassung Frankfurt am Main regulated by the Bundesanstalt fuer Finanzdienstleistungsaufsicht ("BaFin"). This report is being distributed in the United States and Canada by Credit Suisse Securities (USA) LLC; in Switzerland by Credit Suisse AG; in Brazil by Banco de Investimentos Credit Suisse (Brasil) S.A or its affiliates; in Mexico by Banco Credit Suisse (México), S.A. (transactions related to the securities mentioned in this report will only be effected in compliance with applicable regulation); in Japan by Credit Suisse Securities (Japan) Limited, Financial Instruments Firm, Director-General of Kanto Local Finance Bureau (Kinsho) No. 66, a member of Japan Securities Dealers Association, The Financial Futures Association of Japan, Japan Investment Advisers Association, Type II Financial Instruments Firms Association; elsewhere in Asia/ Pacific by whichever of the following is the appropriately authorised entity in the relevant jurisdiction: Credit Suisse (Hong Kong) Limited, Credit Suisse Equities (Australia) Limited, Credit Suisse Securities (Thailand) Limited, regulated by the Office of the Securities and Exchange Commission, Thailand, having registered address at 990 Abdulrahim Place, 27th Floor, Unit 2701, Rama IV Road, Silom, Bangrak, Bangkok 10500, Thailand, Tel. +66 2614 6000, Credit Suisse Securities (Malaysia) Sdn Bhd, Credit Suisse AG, Singapore Branch, Credit Suisse Securities (India) Private Limited (CIN no. U67120MH1996PTC104392) regulated by the Securities and Exchange Board of India as Research Analyst (registration no. INH 000001030) and as Stock Broker (registration no. INB230970637; INF230970637; INB010970631; INF010970631), having registered address at 9th Floor, Ceejay House, Dr.A.B. Road, Worli, Mumbai - 18, India, T- +91-22 6777 3777, Credit Suisse Securities (Europe) Limited, Seoul Branch, Credit Suisse AG, Taipei Securities Branch, PT Credit Suisse Securities Indonesia, Credit Suisse Securities (Philippines ) Inc., and elsewhere in the world by the relevant authorised affiliate of the above. Research on Taiwanese securities produced by Credit Suisse AG, Taipei Securities Branch has been prepared by a registered Senior Business Person. Research provided to residents of Malaysia is authorised by the Head of Research for Credit Suisse Securities (Malaysia) Sdn Bhd, to whom they should direct any queries on +603 2723 2020. This report has been prepared and issued for distribution in Singapore to institutional investors, accredited investors and expert investors (each as defined under the Financial Advisers Regulations) only, and is also distributed by Credit Suisse AG, Singapore branch to overseas investors (as defined under the Financial Advisers Regulations). By virtue of your status as an institutional investor, accredited investor, expert investor or overseas investor, Credit Suisse AG, Singapore branch is exempted from complying with certain compliance requirements under the Financial Advisers Act, Chapter 110 of Singapore (the "FAA"), the Financial Advisers Regulations and the relevant Notices and Guidelines issued thereunder, in respect of any financial advisory service which Credit Suisse AG, Singapore branch may provide to you. This information is being distributed by Credit Suisse AG, Dubai Branch, duly licensed and regulated by the Dubai Financial Services Authority (DFSA), and is directed at Professional Clients or Market Counterparties only, as defined by the DFSA. The financial products or financial services to which the information relates will only be made available to a client who meets the regulatory criteria to be a Professional Client or Market Counterparty only, as defined by the DFSA, and is not intended for any other person. This research may not conform to Canadian disclosure requirements. In jurisdictions where CS is not already registered or licensed to trade in securities, transactions will only be effected in accordance with applicable securities legislation, which will vary from jurisdiction to jurisdiction and may require that the trade be made in accordance with applicable exemptions from registration or licensing requirements. Non-U.S. customers wishing to effect a transaction should contact a CS entity in their local jurisdiction unless governing law permits otherwise. U.S. customers wishing to effect a transaction should do so only by contacting a representative at Credit Suisse Securities (USA) LLC in the U.S. Please note that this research was originally prepared and issued by CS for distribution to their market professional and institutional investor customers. Recipients who are not market professional or institutional investor customers of CS should seek the advice of their independent financial advisor prior to taking any investment decision based on this report or for any necessary explanation of its contents. This research may relate to investments or services of a person outside of the UK or to other matters which are not authorised by the Prudential Regulation Authority and regulated by the Financial Conduct Authority and the Prudential Regulation Authority or in respect of which the protections of the Prudential Regulation Authority and Financial Conduct Authority for private customers and/or the UK compensation scheme may not be available, and further details as to where this may be the case are available upon request in respect of this report. CS may provide various services to US municipal entities or obligated persons ("municipalities"), including suggesting individual transactions or trades and entering into such transactions. Any services CS provides to municipalities are not viewed as "advice" within the meaning of Section 975 of the Dodd-Frank Wall Street Reform and Consumer Protection Act. CS is providing any such services and related information solely on an arm's length basis and not as an advisor or fiduciary to the municipality. In connection with the provision of the any such services, there is no agreement, direct or indirect, between any municipality (including the officials, management, employees or agents thereof) and CS for CS to provide advice to the municipality. Municipalities should consult with their financial, accounting and legal advisors regarding any such services provided by CS. In addition, CS is not acting for direct or indirect compensation to solicit the municipality on behalf of an unaffiliated broker, dealer, municipal securities dealer, municipal advisor, or investment adviser for the purpose of obtaining or retaining an engagement by the municipality for or in connection with Municipal Financial Products, the issuance of municipal securities, or of an investment adviser to provide investment advisory services to or on behalf of the municipality. If this report is being distributed by a financial institution other than Credit Suisse AG, or its affiliates, that financial institution is solely responsible for distribution. Clients of that institution should contact that institution to effect a transaction in the securities mentioned in this report or require further information. This report does not constitute investment advice by Credit Suisse to the clients of the distributing financial institution, and neither Credit Suisse AG, its affiliates, and their respective officers, directors and employees accept any liability whatsoever for any direct or consequential loss arising from their use of this report or its content. Principal is not guaranteed. Commission is the commission rate or the amount agreed with a customer when setting up an account or at any time after that.
Copyright © 2015 CREDIT SUISSE AG and/or its affiliates. All rights reserved.
Investment principal on bonds can be eroded depending on sale price or market price. In addition, there are bonds on which investment principal can be eroded due to changes in redemption amounts. Care is required when investing in such instruments. When you purchase non-listed Japanese fixed income securities (Japanese government bonds, Japanese municipal bonds, Japanese government guaranteed bonds, Japanese corporate bonds) from CS as a seller, you will be requested to pay the purchase price only.
TC2186