Embed Size (px)
Citation preview
Asia and Pacific Regional Economic Outlook
Sustaining the Momentum: Vigilance and Reforms
1
Romain DuvalAsia and Pacific Department, IMF
Tokyo, May 8, 2014
2
Key Messages
•Asia will remain the most dynamic region
•Risks from outside Asia have receded
•Actions taken to address vulnerabilities bearing fruit
•But need for vigilance and reforms
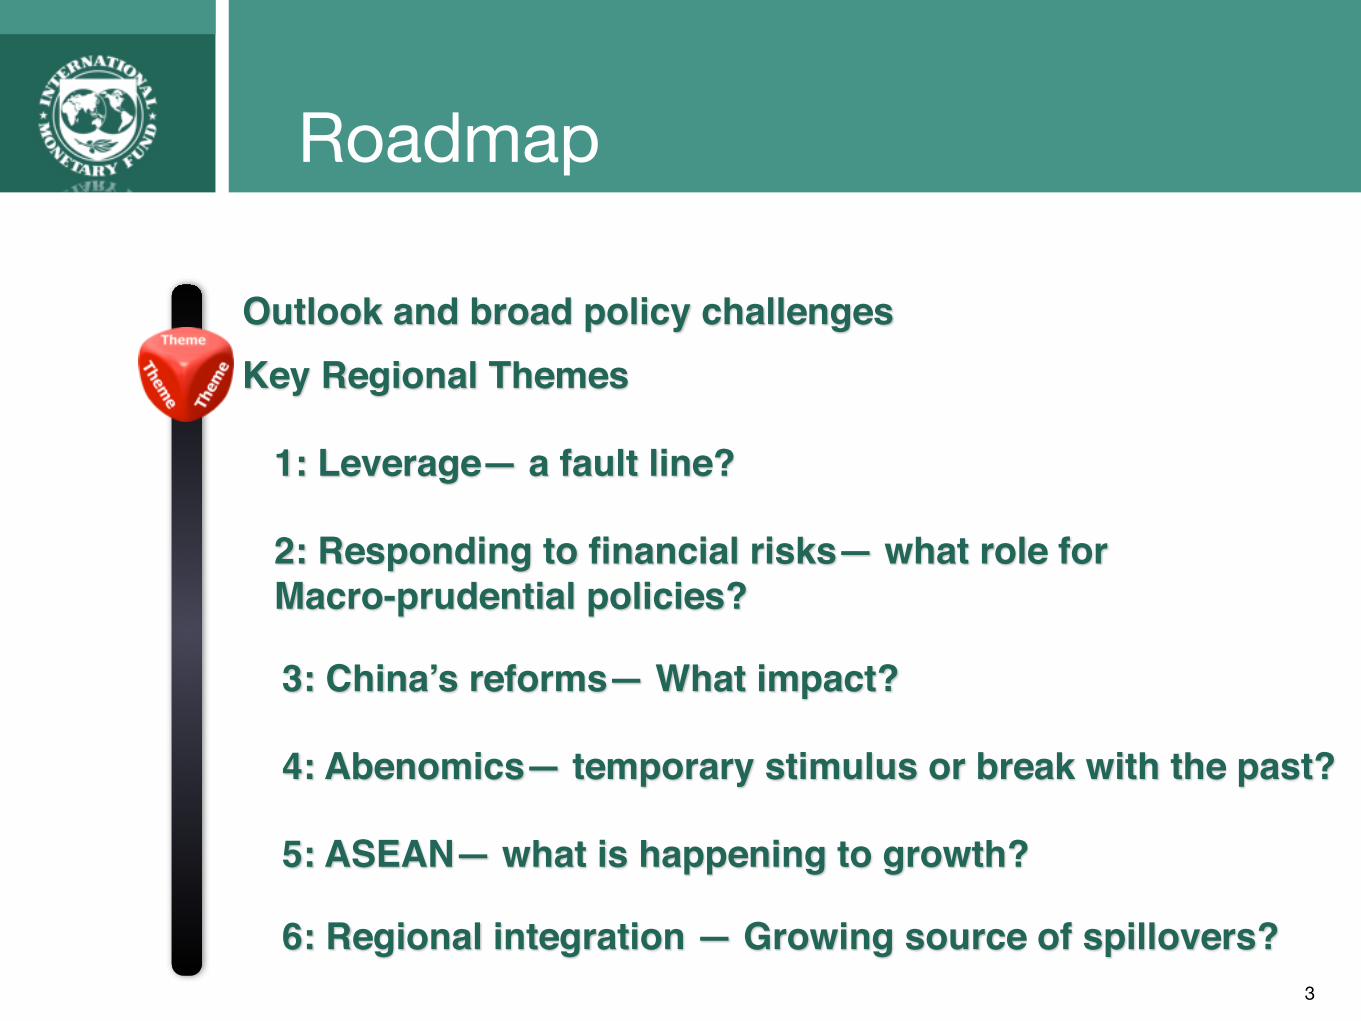
Roadmap
Outlook and broad policy challenges
1: Leverage— a fault line?
2: Responding to financial risks— what role for Macro-prudential policies?
3: China’s reforms— What impact?
4: Abenomics— temporary stimulus or break with the past?
5: ASEAN— what is happening to growth?
Key Regional Themes
3
6: Regional integration — Growing source of spillovers?
4
5
6
7
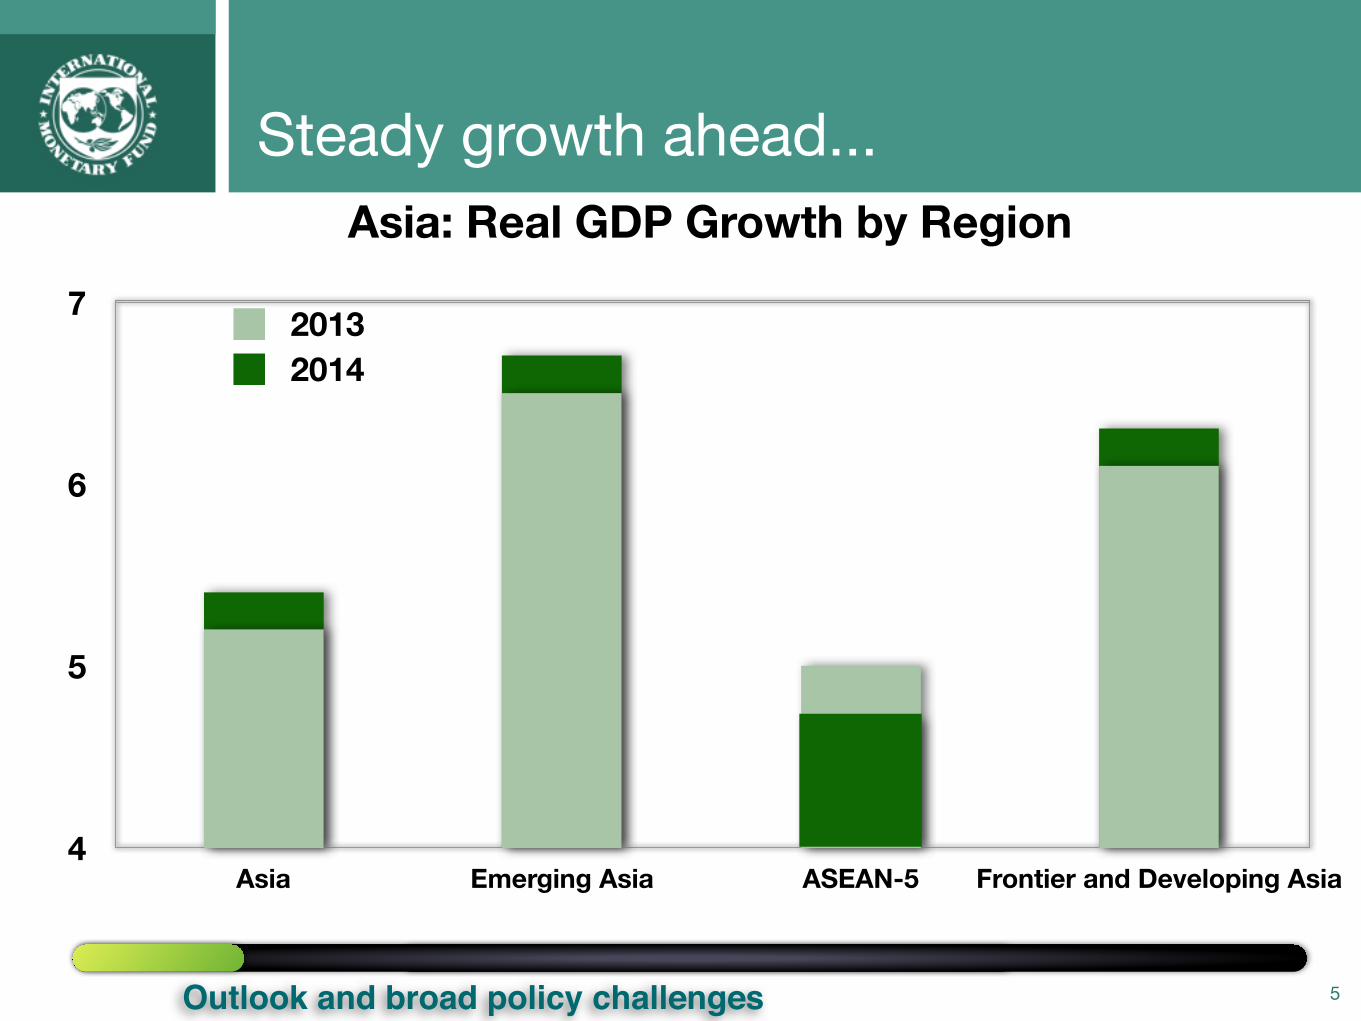
Asia Emerging Asia ASEAN-5 Frontier and Developing Asia
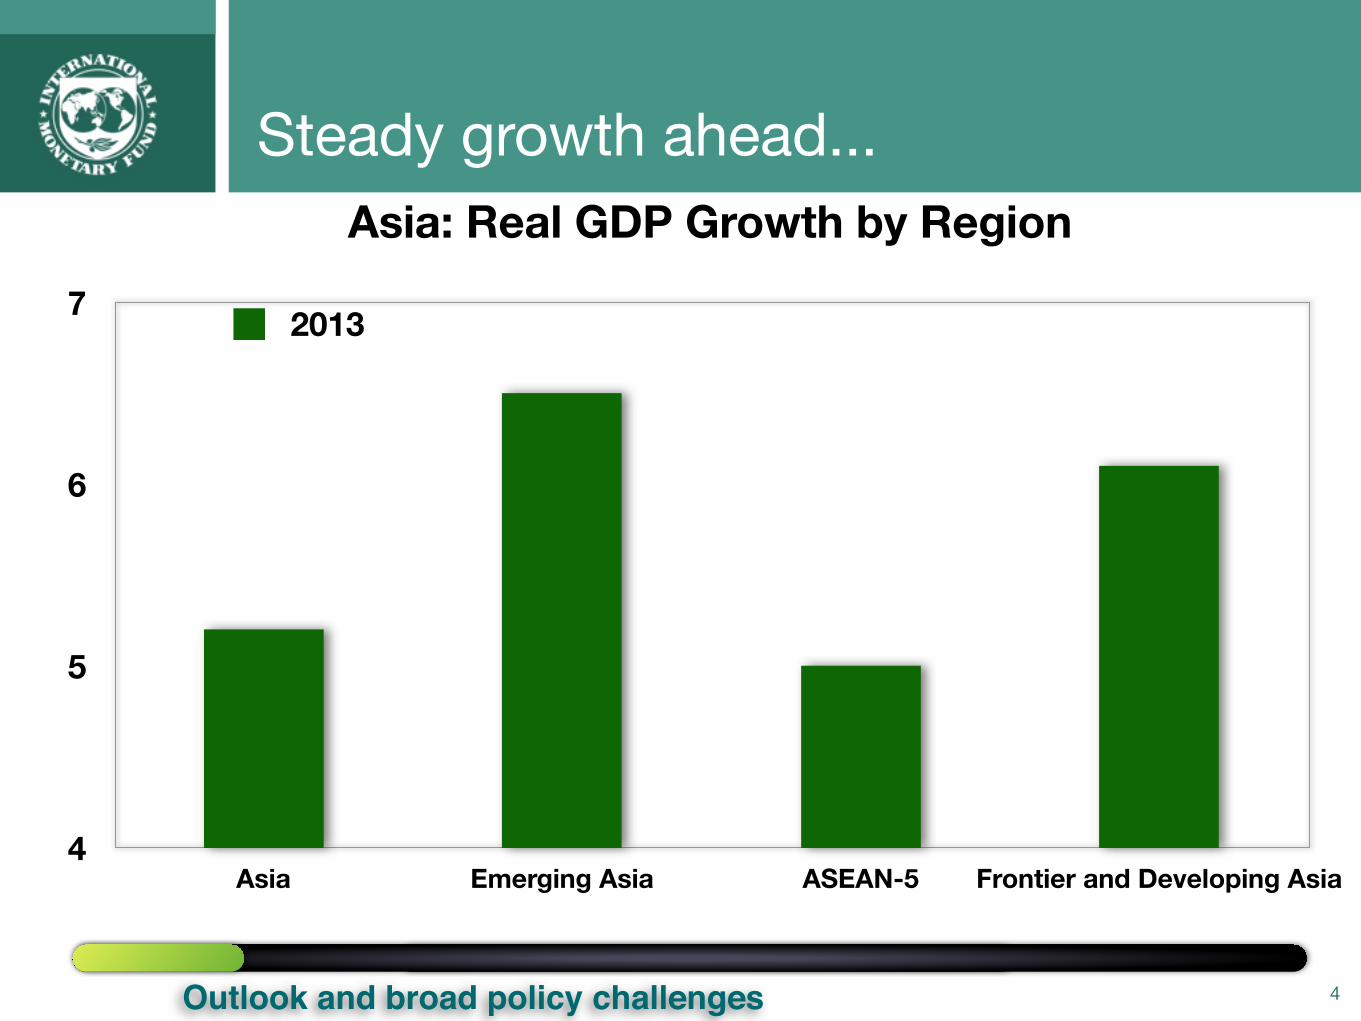
Steady growth ahead...
4
Asia: Real GDP Growth by Region
2013
Outlook and broad policy challenges
4
5
6
7
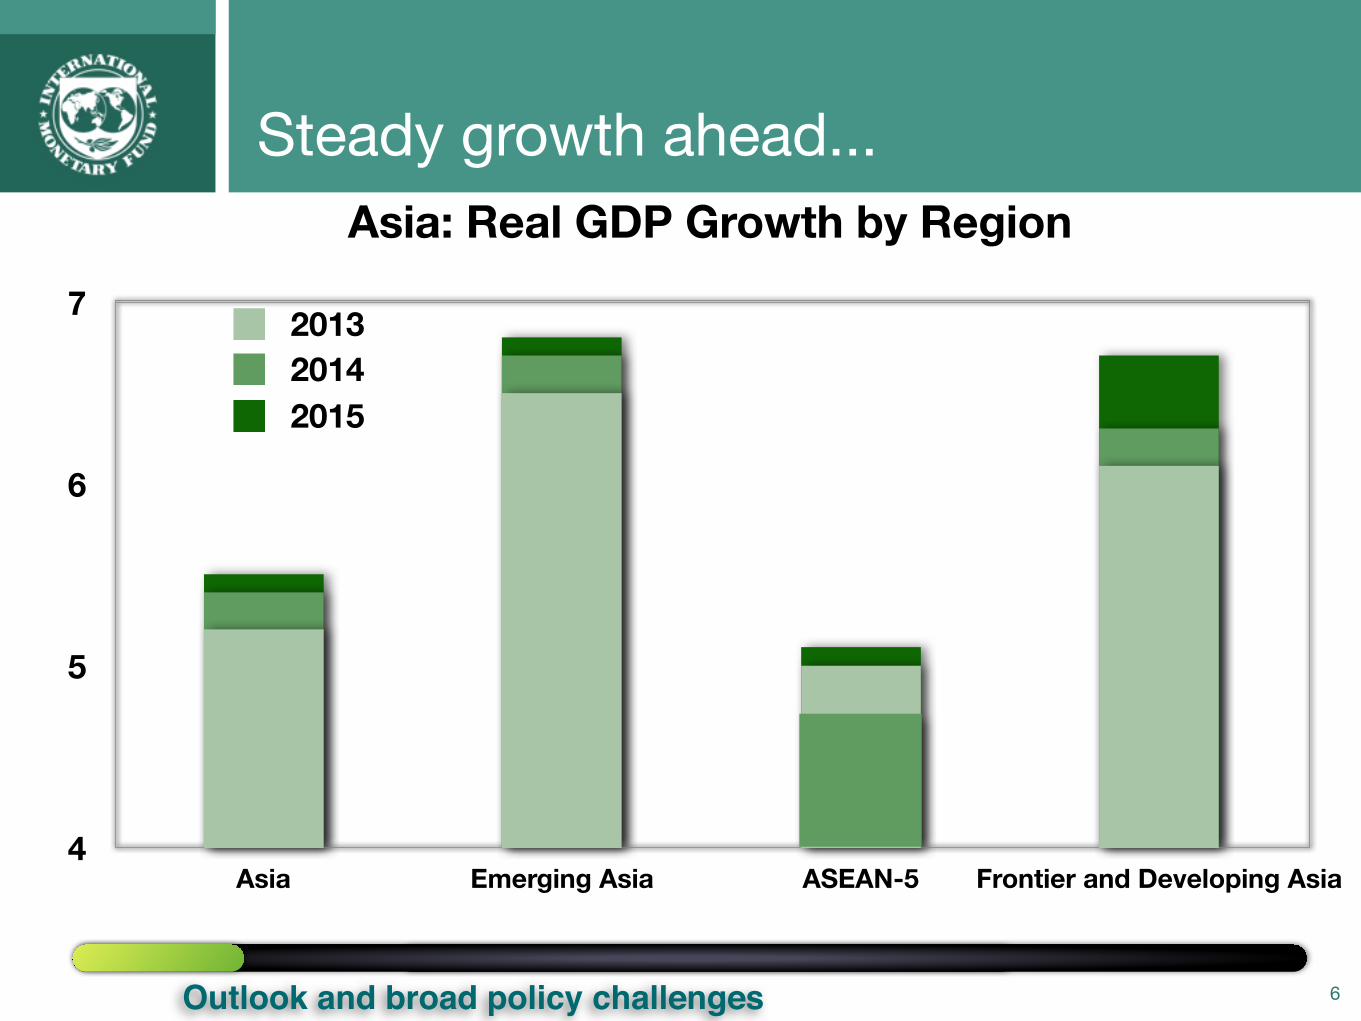
Asia Emerging Asia ASEAN-5 Frontier and Developing Asia
Steady growth ahead...
5
Asia: Real GDP Growth by Region
20132014
Outlook and broad policy challenges
Steady growth ahead...
6
Asia: Real GDP Growth by Region
20132014
4
5
6
7
Asia Emerging Asia ASEAN-5 Frontier and Developing Asia
2015
Outlook and broad policy challenges
-0.5
0
0.5
1.0
1.5
2.0
2.5
2013 2014 2015
7
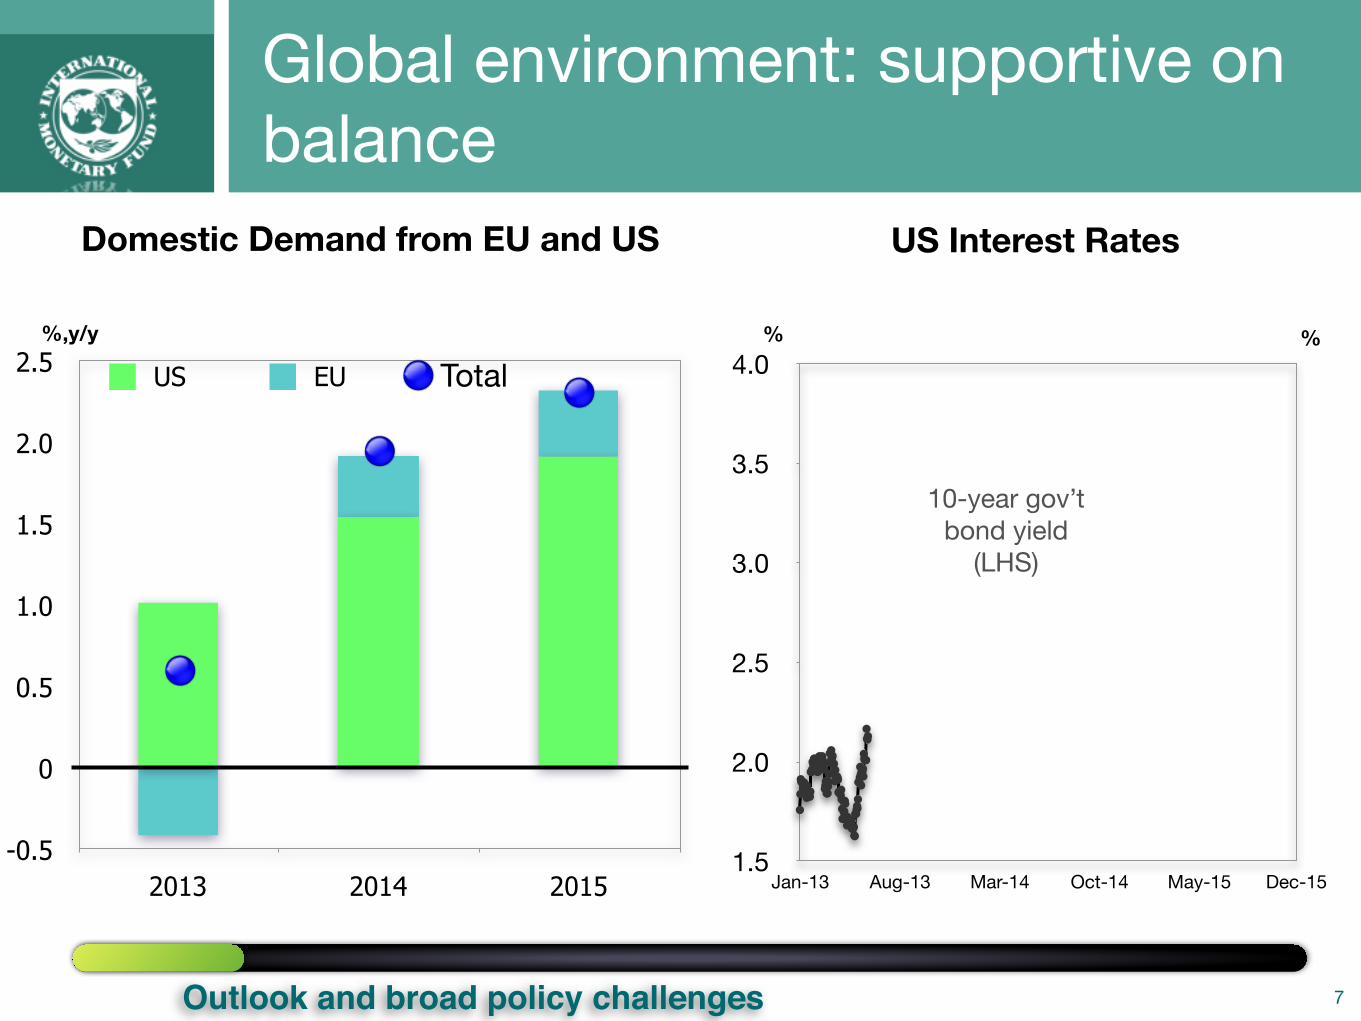
Domestic Demand from EU and US
US EU Total
US Interest Rates
%,y/y
1.5
2.0
2.5
3.0
3.5
4.0
Jan-13 Aug-13 Mar-14 Oct-14 May-15 Dec-15
% %
10-year gov’t bond yield
(LHS)
Global environment: supportive on balance
Outlook and broad policy challenges
-0.5
0
0.5
1.0
1.5
2.0
2.5
2013 2014 2015
8
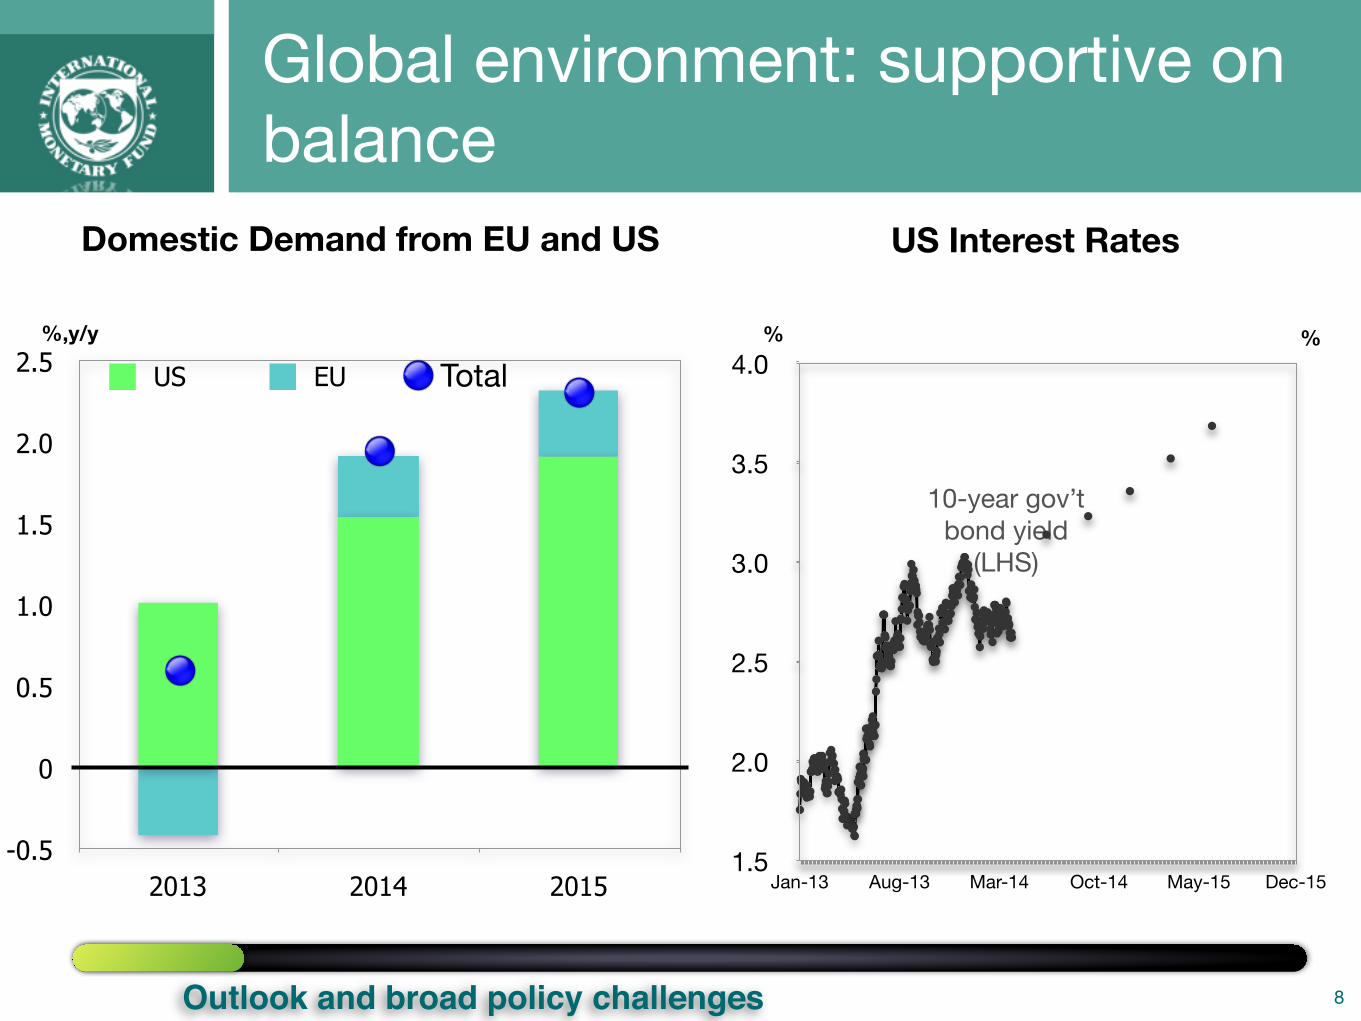
Domestic Demand from EU and US
US EU Total
US Interest Rates
%%,y/y %
10-year gov’t bond yield
(LHS)
Global environment: supportive on balance
1.5
2.0
2.5
3.0
3.5
4.0
Jan-13 Aug-13 Mar-14 Oct-14 May-15 Dec-15
Outlook and broad policy challenges
9
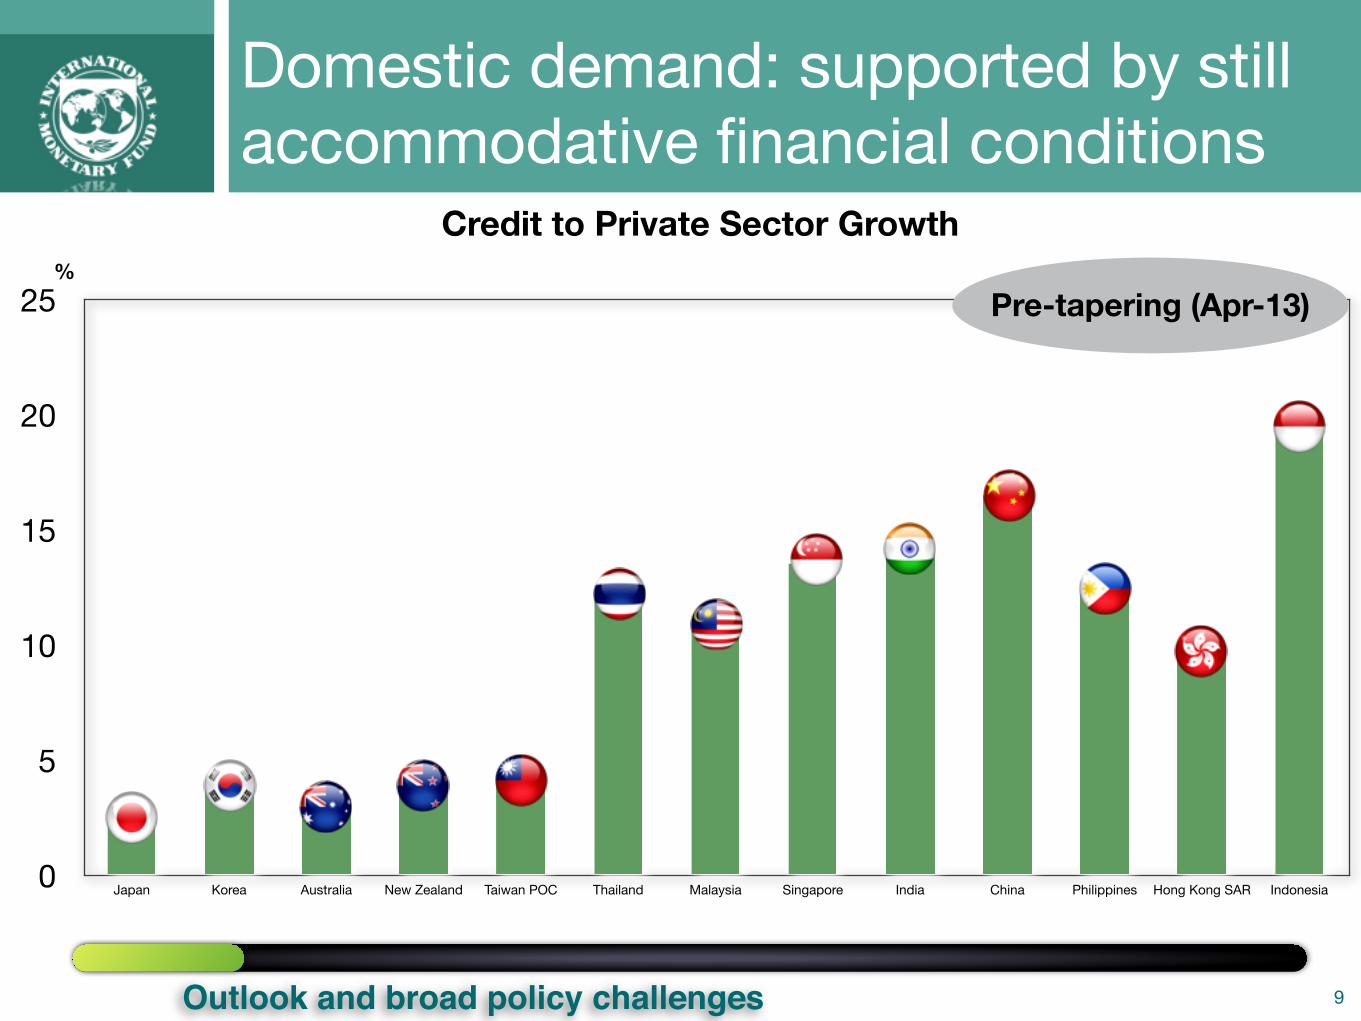
0
5
10
15
20
25
Japan Korea Australia New Zealand Taiwan POC Thailand Malaysia Singapore India China Philippines Hong Kong SAR Indonesia
Pre-tapering (Apr-13)
Credit to Private Sector Growth%
Domestic demand: supported by still accommodative financial conditions
Outlook and broad policy challenges
10
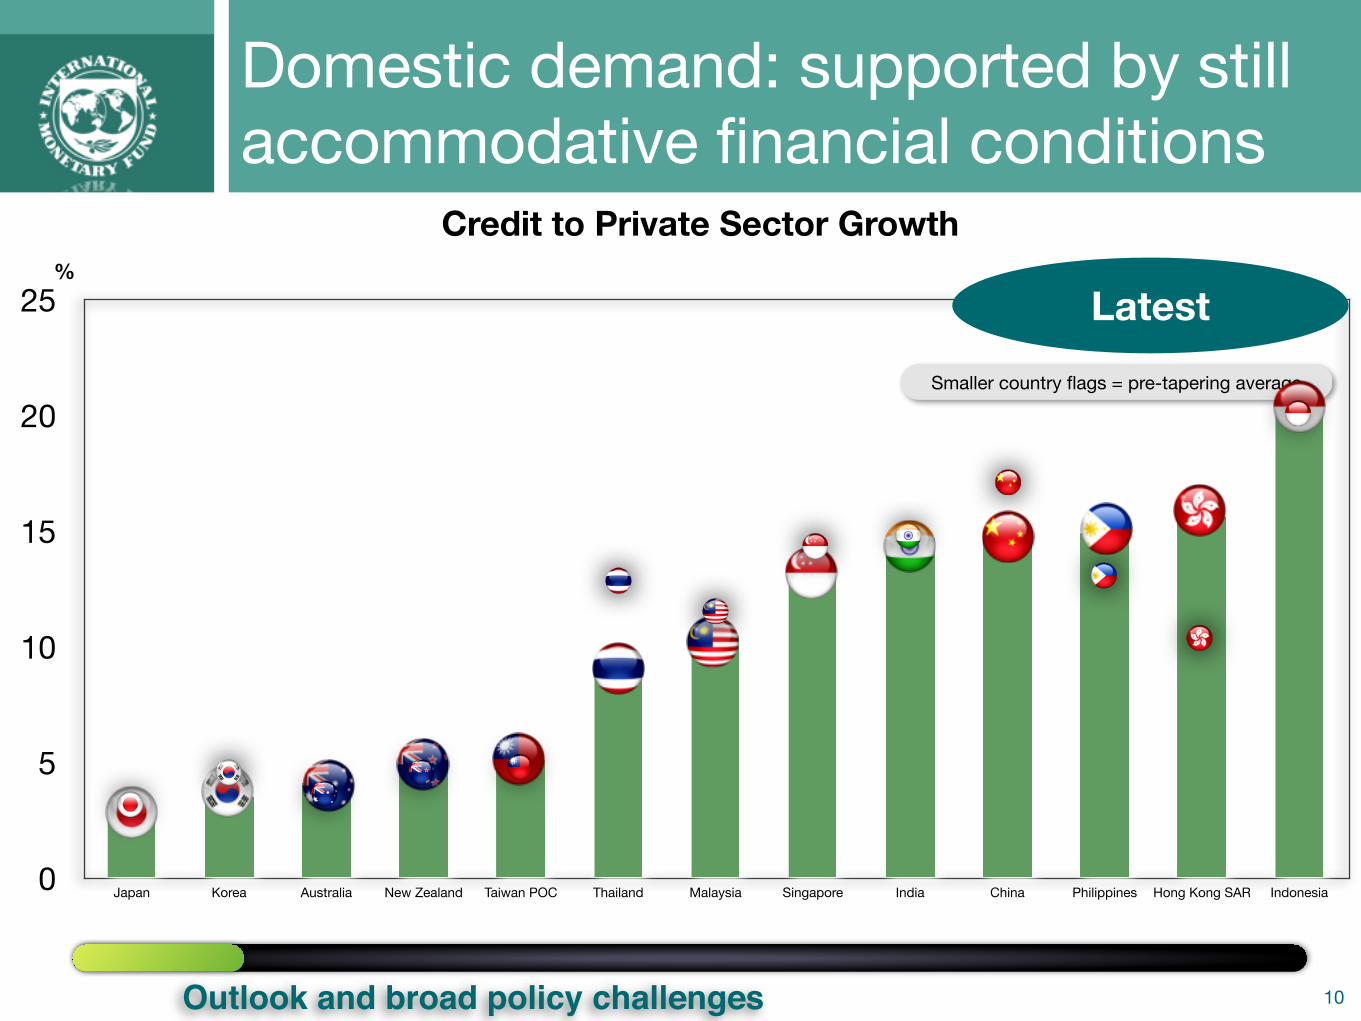
0
5
10
15
20
25
Japan Korea Australia New Zealand Taiwan POC Thailand Malaysia Singapore India China Philippines Hong Kong SAR Indonesia
Latest
Credit to Private Sector Growth%
Smaller country flags = pre-tapering average
Domestic demand: supported by still accommodative financial conditions
Outlook and broad policy challenges
-‐20
-‐15
-‐10
-‐5
0
5
10
-‐10 -‐5 0 5 10
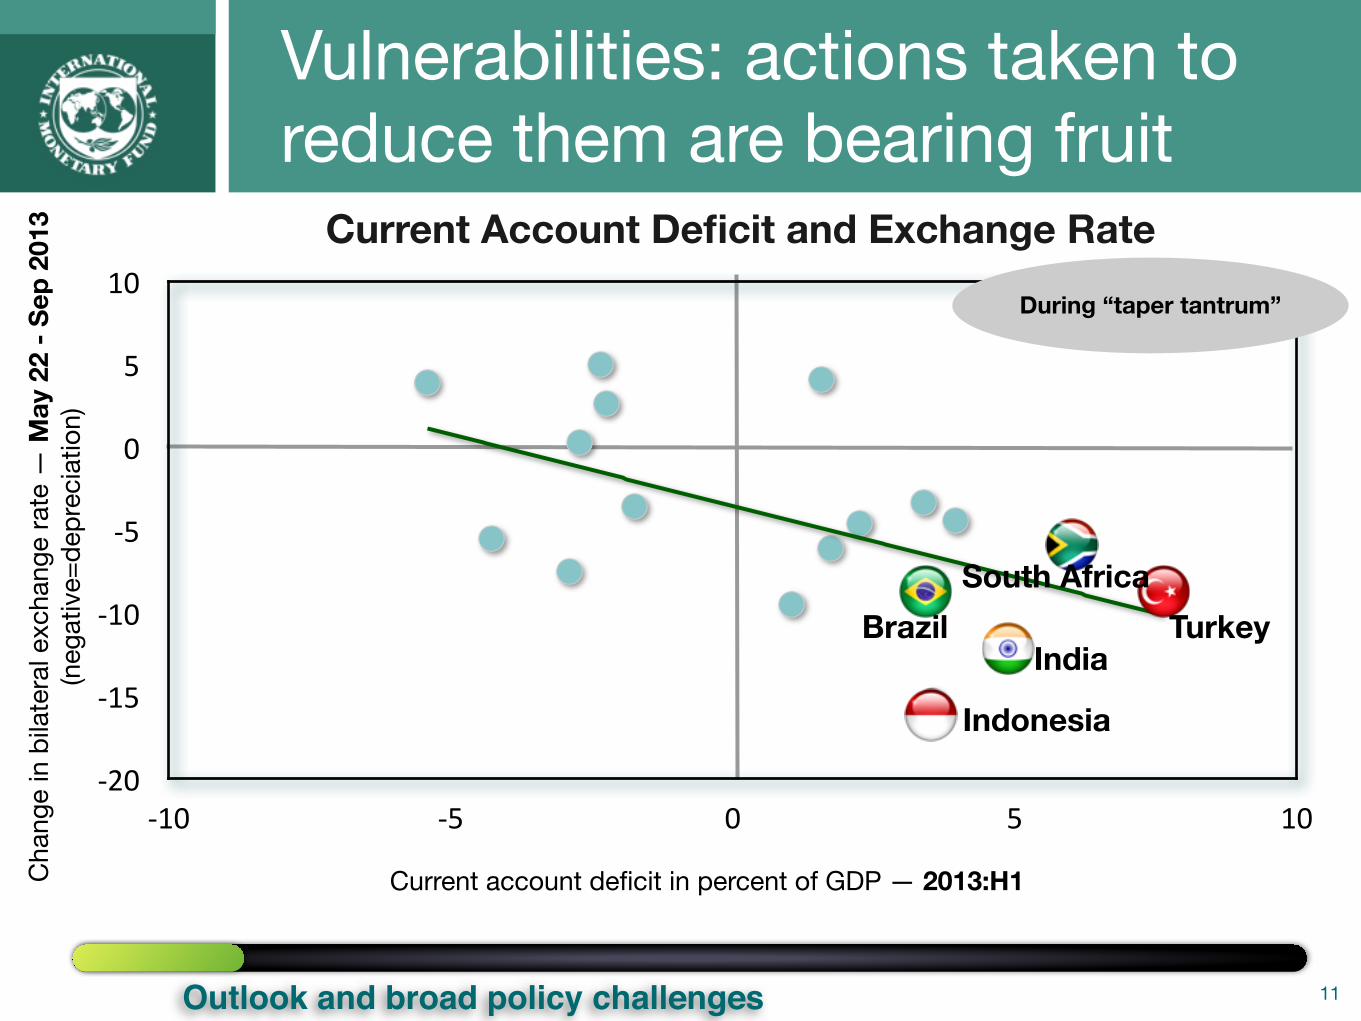
Current Account Deficit and Exchange Rate
11
Indonesia
India
Cha
nge
in b
ilate
ral e
xcha
nge
rate
— M
ay 2
2 - S
ep 2
013
(neg
ativ
e=de
prec
iatio
n)
Current account deficit in percent of GDP — 2013:H1
During “taper tantrum”
BrazilSouth Africa
Turkey
Vulnerabilities: actions taken to reduce them are bearing fruit
Outlook and broad policy challenges
-‐20
-‐15
-‐10
-‐5
0
5
10
-‐10 -‐5 0 5 10
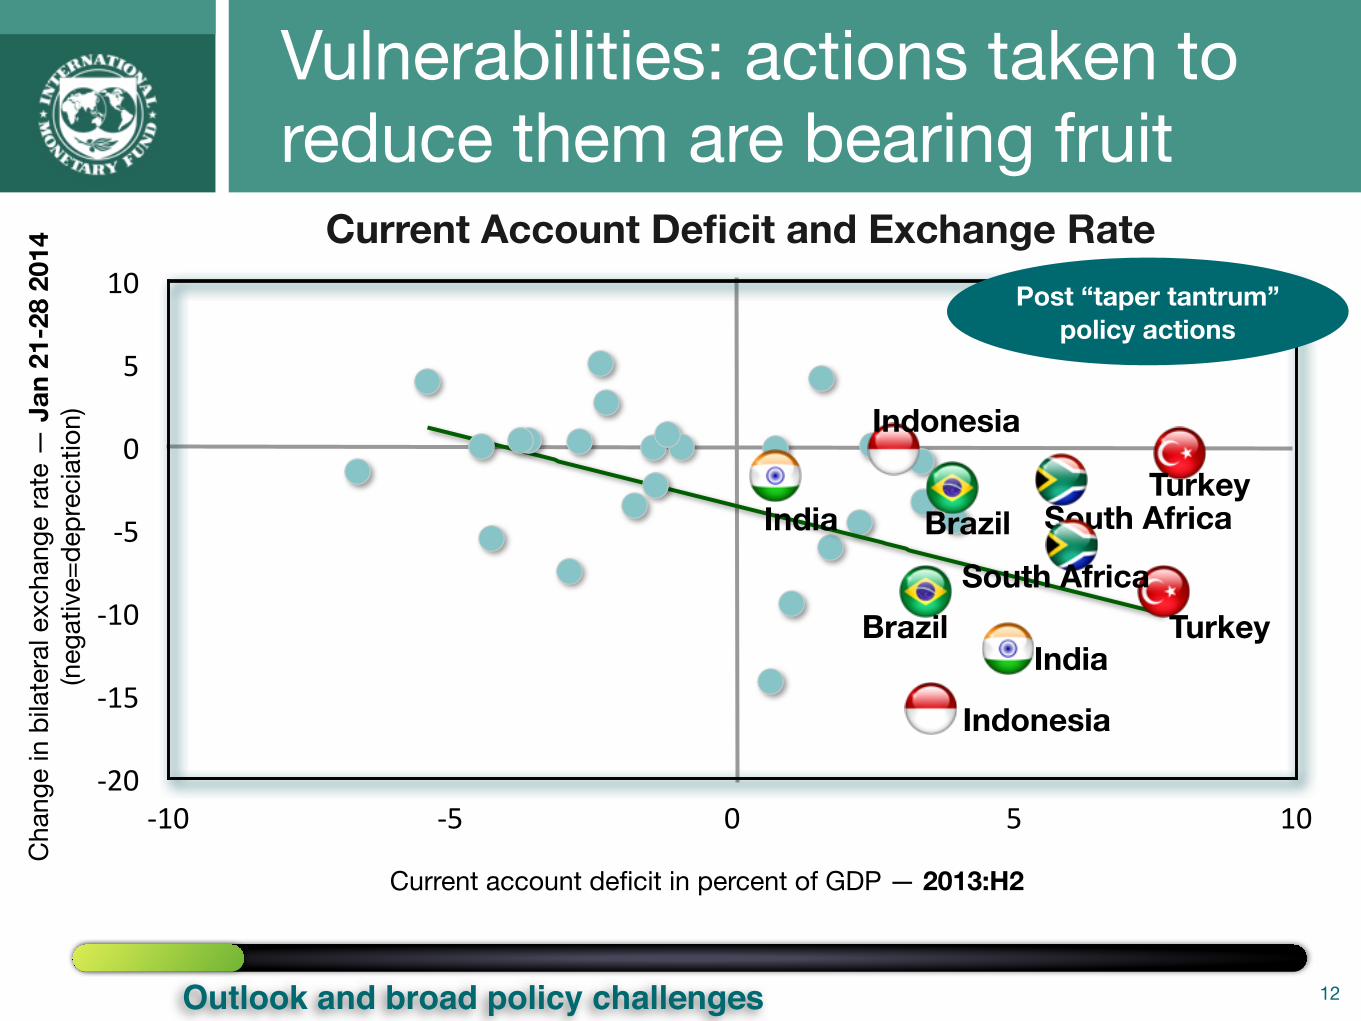
Current Account Deficit and Exchange Rate
12
Cha
nge
in b
ilate
ral e
xcha
nge
rate
— J
an 2
1-28
201
4(n
egat
ive=
depr
ecia
tion)
Current account deficit in percent of GDP — 2013:H2
Post “taper tantrum” policy actions
India
Indonesia
Indonesia
India
Brazil South AfricaTurkey
Brazil TurkeySouth Africa
Vulnerabilities: actions taken to reduce them are bearing fruit
Outlook and broad policy challenges
13
Policy settings and challenges- Monetary: progressive normalization as conditions warrant
- Fiscal: gradual consolidation
- Macroprudential: remains part of the toolkit
- Structural: key for both short-term financial stability and medium-term growth
- But no one size-fits-all: subregional specificities
Outlook and broad policy challenges
Theme 1. Leverage
Theme 1: Leverage: a fault line?
• Aggregate corporate leverage has remained stable in recent years
• But pockets of vulnerability: leveraged firms tend to be the weakest
• Leverage could amplify corporate stress created by higher global interest rates
• Leverage likely have adverse implications for investment
14
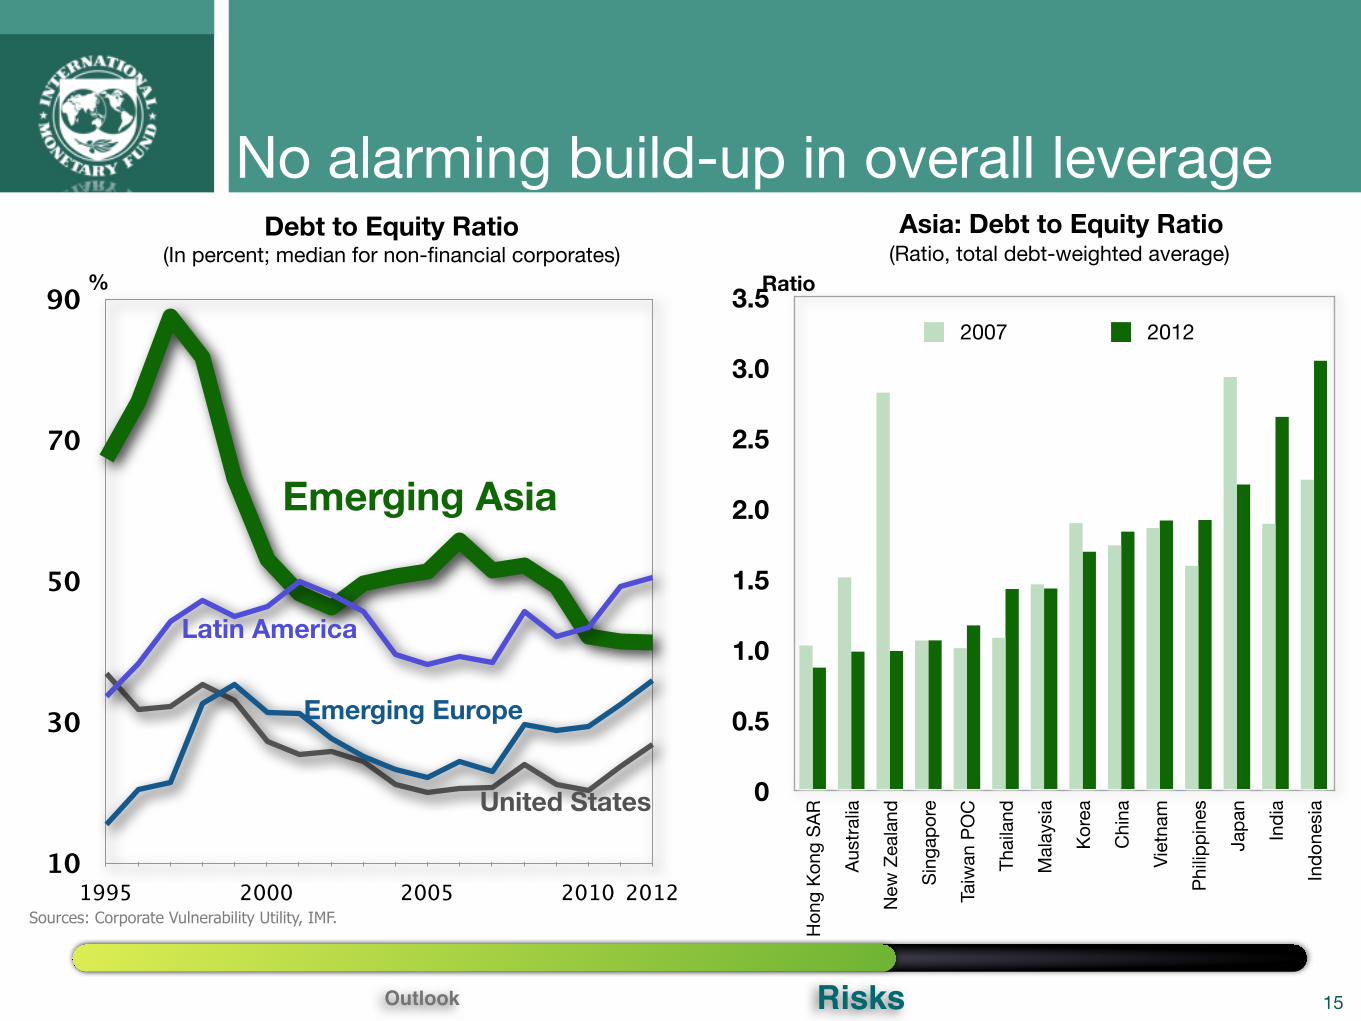
Debt to Equity Ratio (In percent; median for non-financial corporates)
Sources: Corporate Vulnerability Utility, IMF.
15
10
30
50
70
90
1995 2000 2005 2010 2012
Emerging Asia
Latin America
Emerging Europe
United States
RisksOutlook
0
0.5
1.0
1.5
2.0
2.5
3.0
3.5
Hon
g Ko
ng S
AR
Aust
ralia
New
Zea
land
Sing
apor
e
Taiw
an P
OC
Thai
land
Mal
aysi
a
Kore
a
Chi
na
Viet
nam
Philip
pine
s
Japa
n
Indi
a
Indo
nesi
a
Asia: Debt to Equity Ratio (Ratio, total debt-weighted average)
2007 2012
% Ratio
No alarming build-up in overall leverage
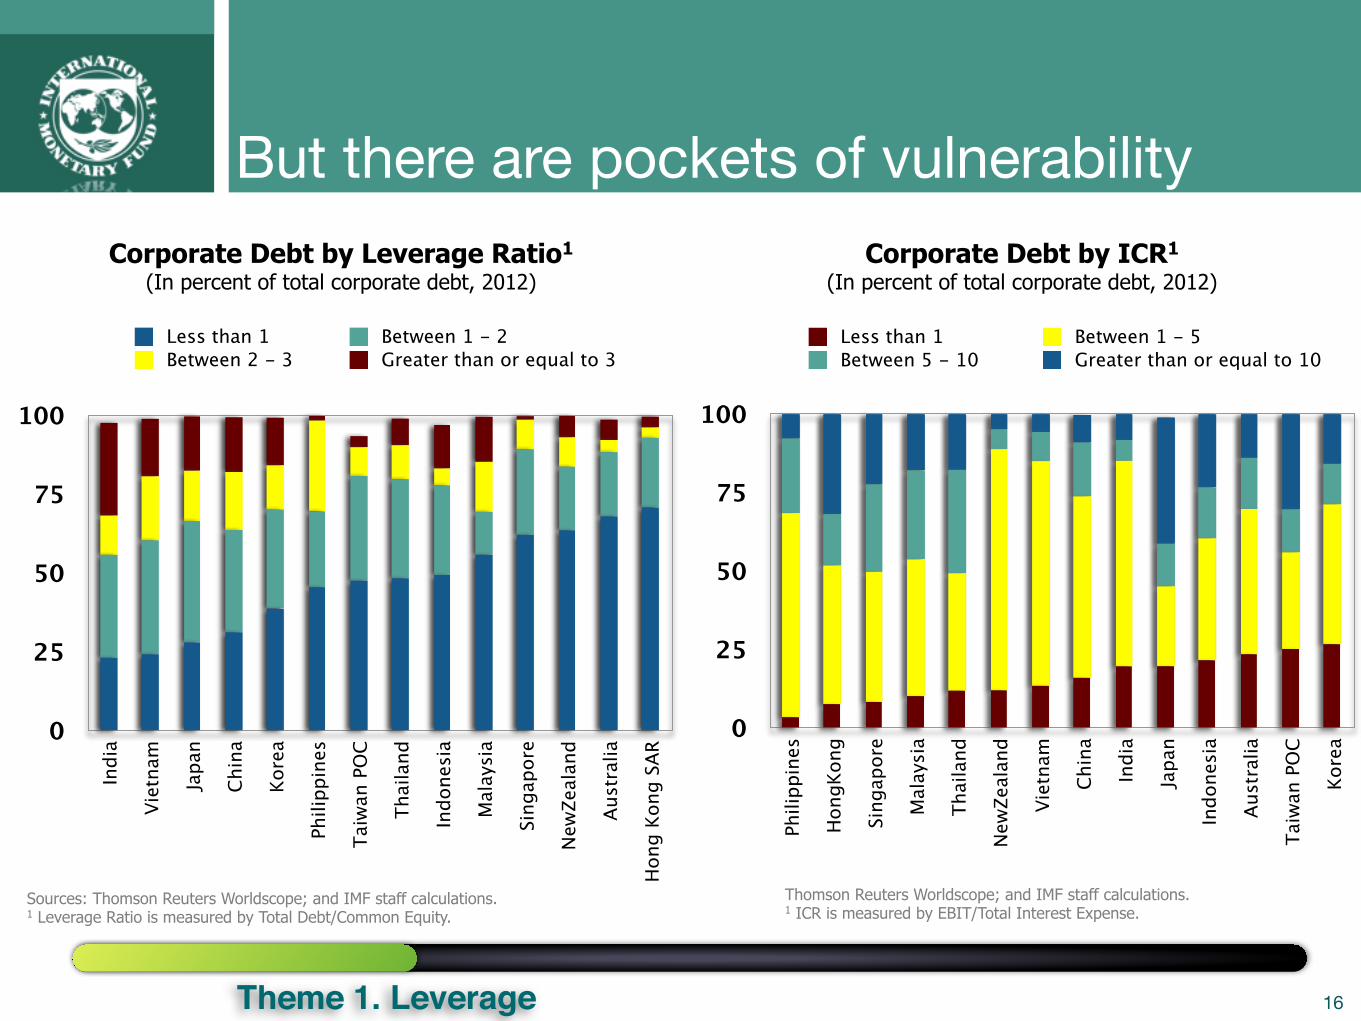
But there are pockets of vulnerability Corporate Debt by Leverage Ratio1
(In percent of total corporate debt, 2012) Corporate Debt by ICR1
(In percent of total corporate debt, 2012)
Sources: Thomson Reuters Worldscope; and IMF staff calculations.1 Leverage Ratio is measured by Total Debt/Common Equity.
Thomson Reuters Worldscope; and IMF staff calculations.1 ICR is measured by EBIT/Total Interest Expense.
16
0
25
50
75
100
Indi
a
Viet
nam
Japa
n
Chin
a
Kore
a
Phili
ppin
es
Taiw
an P
OC
Thai
land
Indo
nesi
a
Mal
aysi
a
Sing
apor
e
New
Zeal
and
Aust
ralia
Hon
g Ko
ng S
AR
Less than 1 Between 1 - 2Between 2 - 3 Greater than or equal to 3
0
25
50
75
100
Phili
ppin
es
Hon
gKon
g
Sing
apor
e
Mal
aysi
a
Thai
land
New
Zeal
and
Viet
nam
Chin
a
Indi
a
Japa
n
Indo
nesi
a
Aust
ralia
Taiw
an P
OC
Kore
a
Theme 1. Leverage
Less than 1 Between 1 - 5Between 5 - 10 Greater than or equal to 10
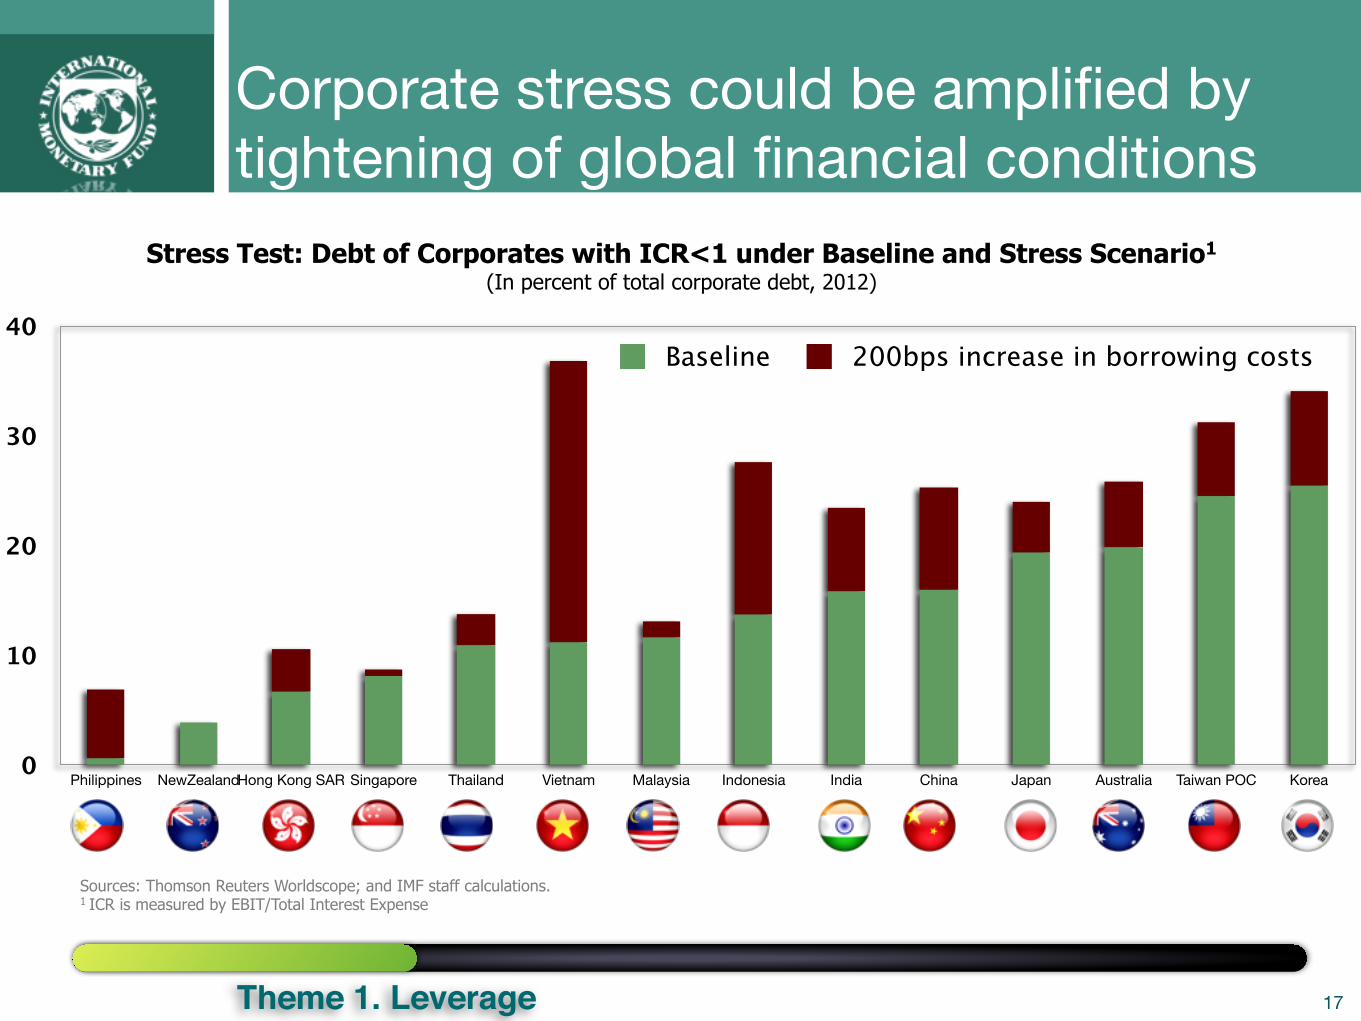
Corporate stress could be amplified by tightening of global financial conditions
Stress Test: Debt of Corporates with ICR<1 under Baseline and Stress Scenario1
(In percent of total corporate debt, 2012)
Sources: Thomson Reuters Worldscope; and IMF staff calculations.1 ICR is measured by EBIT/Total Interest Expense
17
0
10
20
30
40
Philippines NewZealandHong Kong SAR Singapore Thailand Vietnam Malaysia Indonesia India China Japan Australia Taiwan POC Korea
Baseline 200bps increase in borrowing costs
Theme 1. Leverage
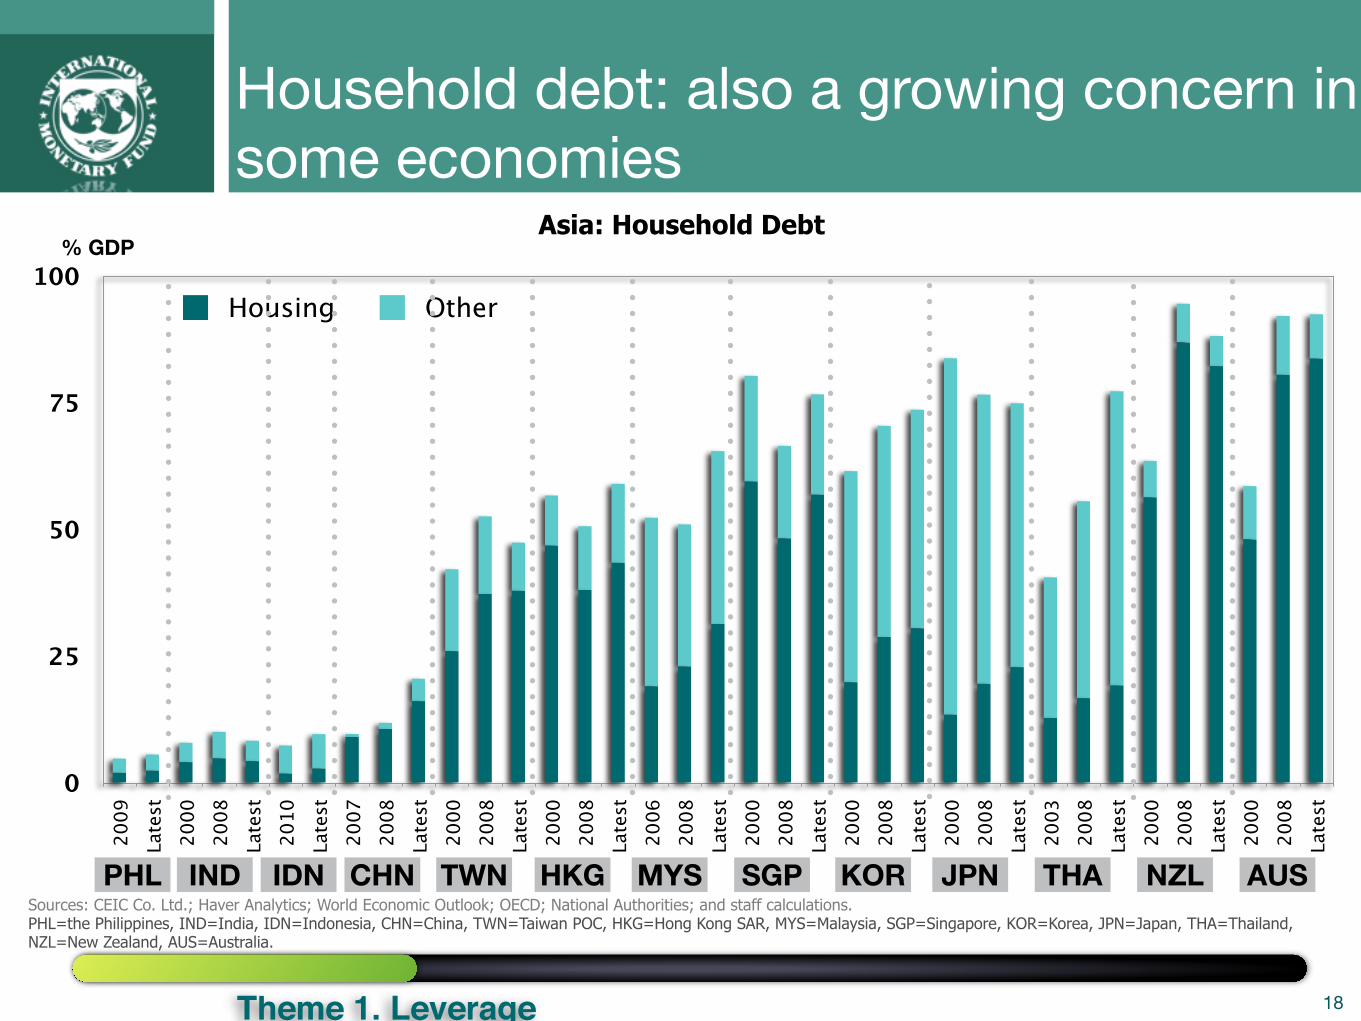
Household debt: also a growing concern in some economies
Asia: Household Debt
Sources: CEIC Co. Ltd.; Haver Analytics; World Economic Outlook; OECD; National Authorities; and staff calculations.PHL=the Philippines, IND=India, IDN=Indonesia, CHN=China, TWN=Taiwan POC, HKG=Hong Kong SAR, MYS=Malaysia, SGP=Singapore, KOR=Korea, JPN=Japan, THA=Thailand, NZL=New Zealand, AUS=Australia.
18
0
25
50
75
100
2009
Late
st20
0020
08La
test
2010
Late
st20
0720
08La
test
2000
2008
Late
st20
0020
08La
test
2006
2008
Late
st20
0020
08La
test
2000
2008
Late
st20
0020
08La
test
2003
2008
Late
st20
0020
08La
test
2000
2008
Late
st
Housing Other
PHL IND IDN CHN TWN HKG MYS SGP KOR JPN THA NZL AUS
Theme 1. Leverage
% GDP
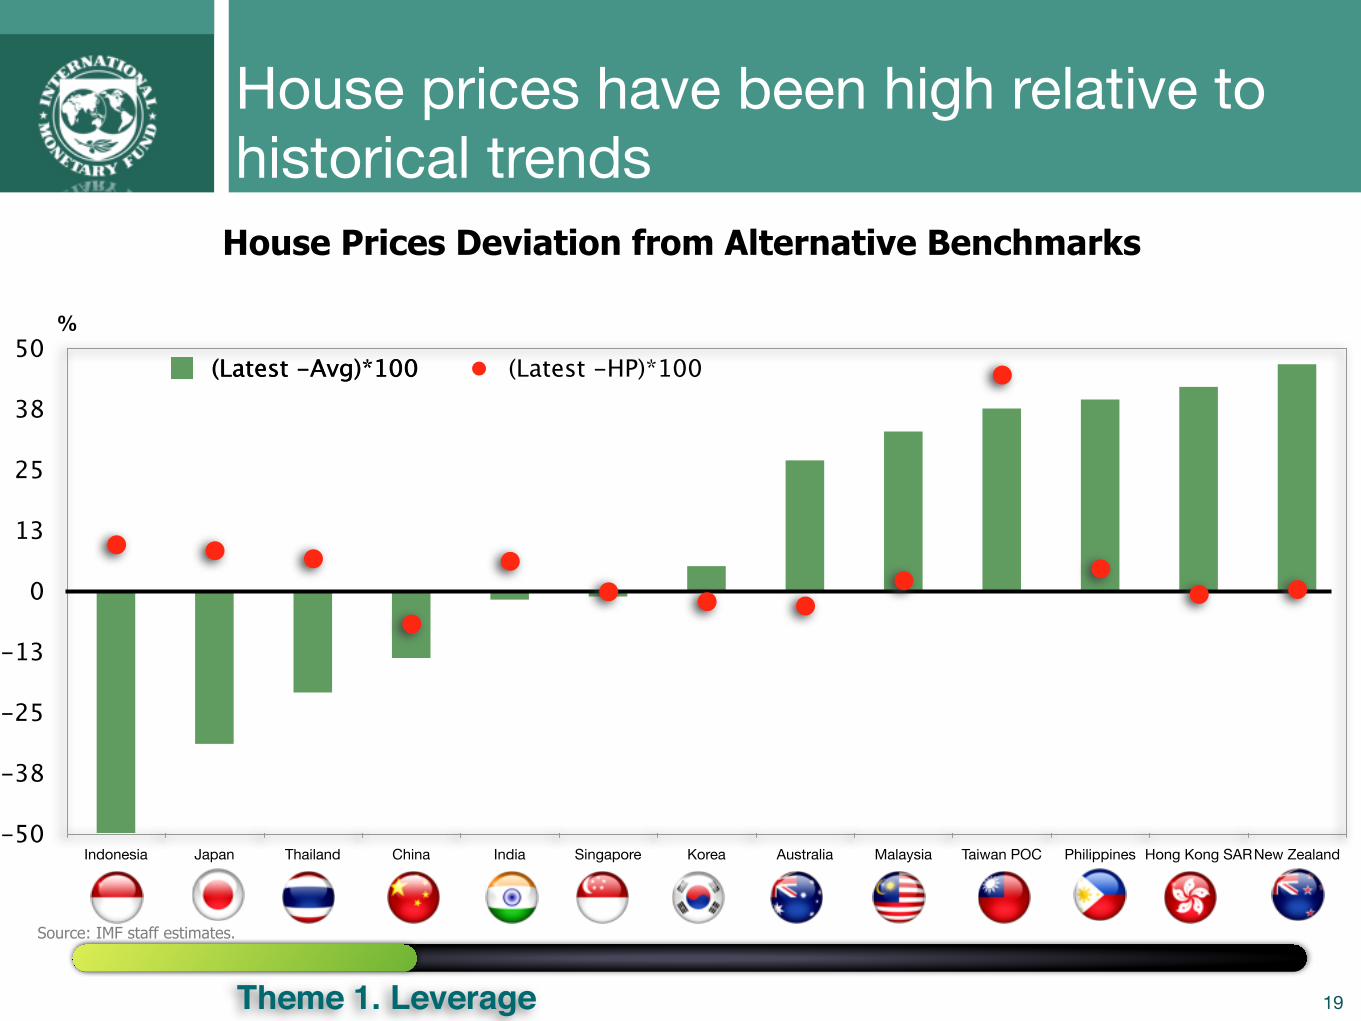
House prices have been high relative to historical trends
House Prices Deviation from Alternative Benchmarks(In percent)
Source: IMF staff estimates.
19
-50
-38
-25
-13
0
13
25
38
50
Indonesia Japan Thailand China India Singapore Korea Australia Malaysia Taiwan POC Philippines Hong Kong SARNew Zealand
(Latest -Avg)*100
Theme 1. Leverage
(Latest -Avg)*100 (Latest -HP)*100
%
Theme 2: Responding to financial risks— what role for Macro-prudential policies?
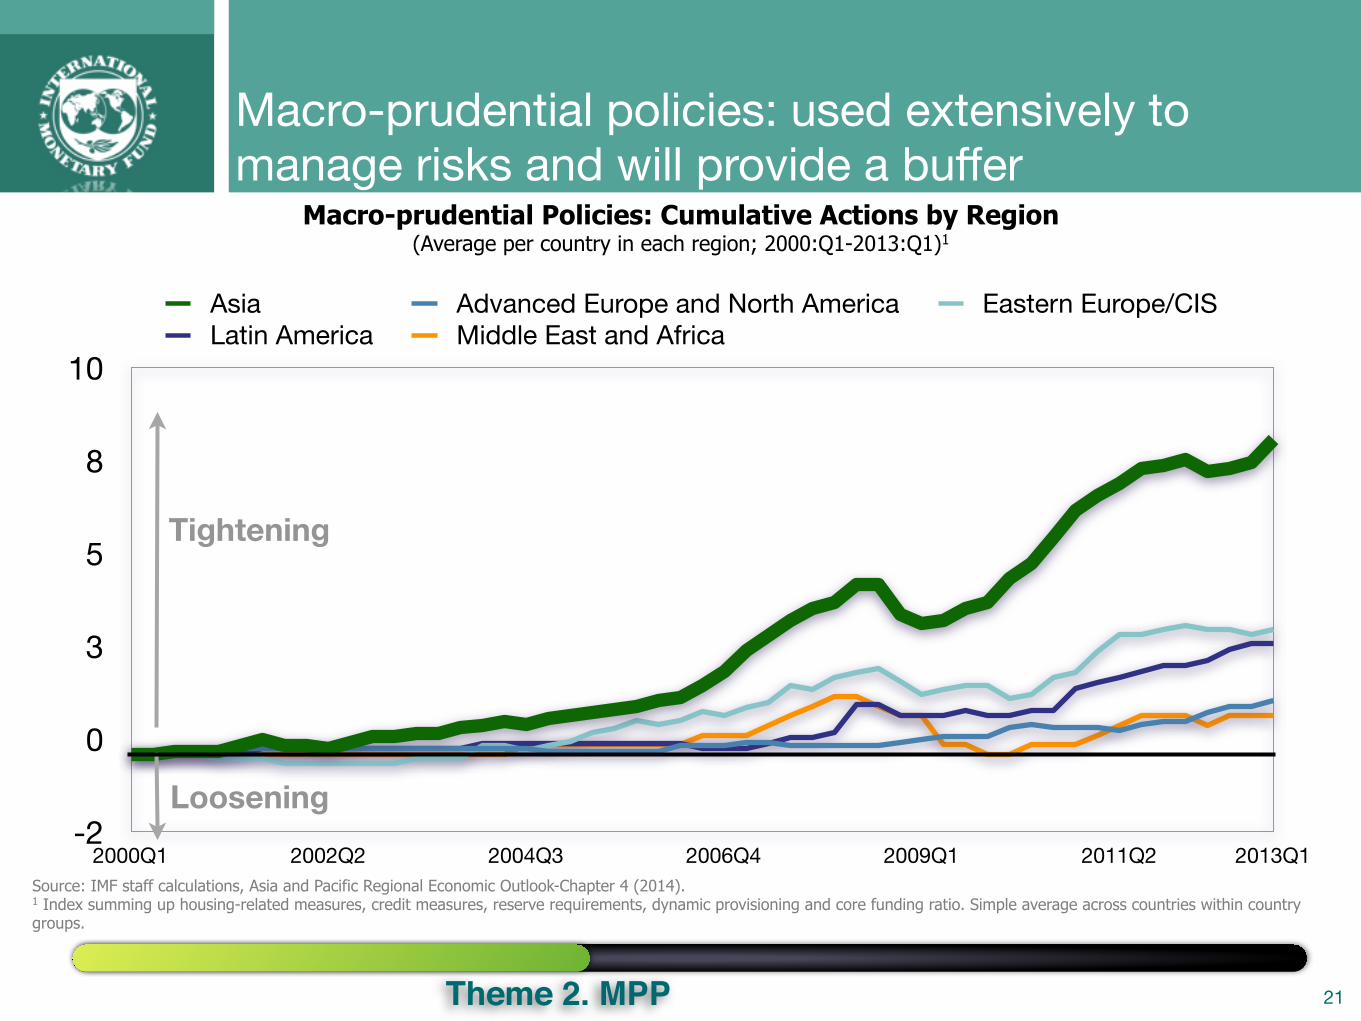
• Asia has used MPPs more than other regions
• Some measures are effective, particularly in housing
• Should they be eased in case of downturn in financial cycle?
20Theme 2. MPP
-2
0
3
5
8
10
2000Q1 2002Q2 2004Q3 2006Q4 2009Q1 2011Q2 2013Q1
Asia Advanced Europe and North America Eastern Europe/CISLatin America Middle East and Africa
Tightening
Loosening
Macro-prudential policies: used extensively to manage risks and will provide a buffer
21
Macro-prudential Policies: Cumulative Actions by Region (Average per country in each region; 2000:Q1-2013:Q1)1
Source: IMF staff calculations, Asia and Pacific Regional Economic Outlook-Chapter 4 (2014). 1 Index summing up housing-related measures, credit measures, reserve requirements, dynamic provisioning and core funding ratio. Simple average across countries within country groups.
Theme 2. MPP
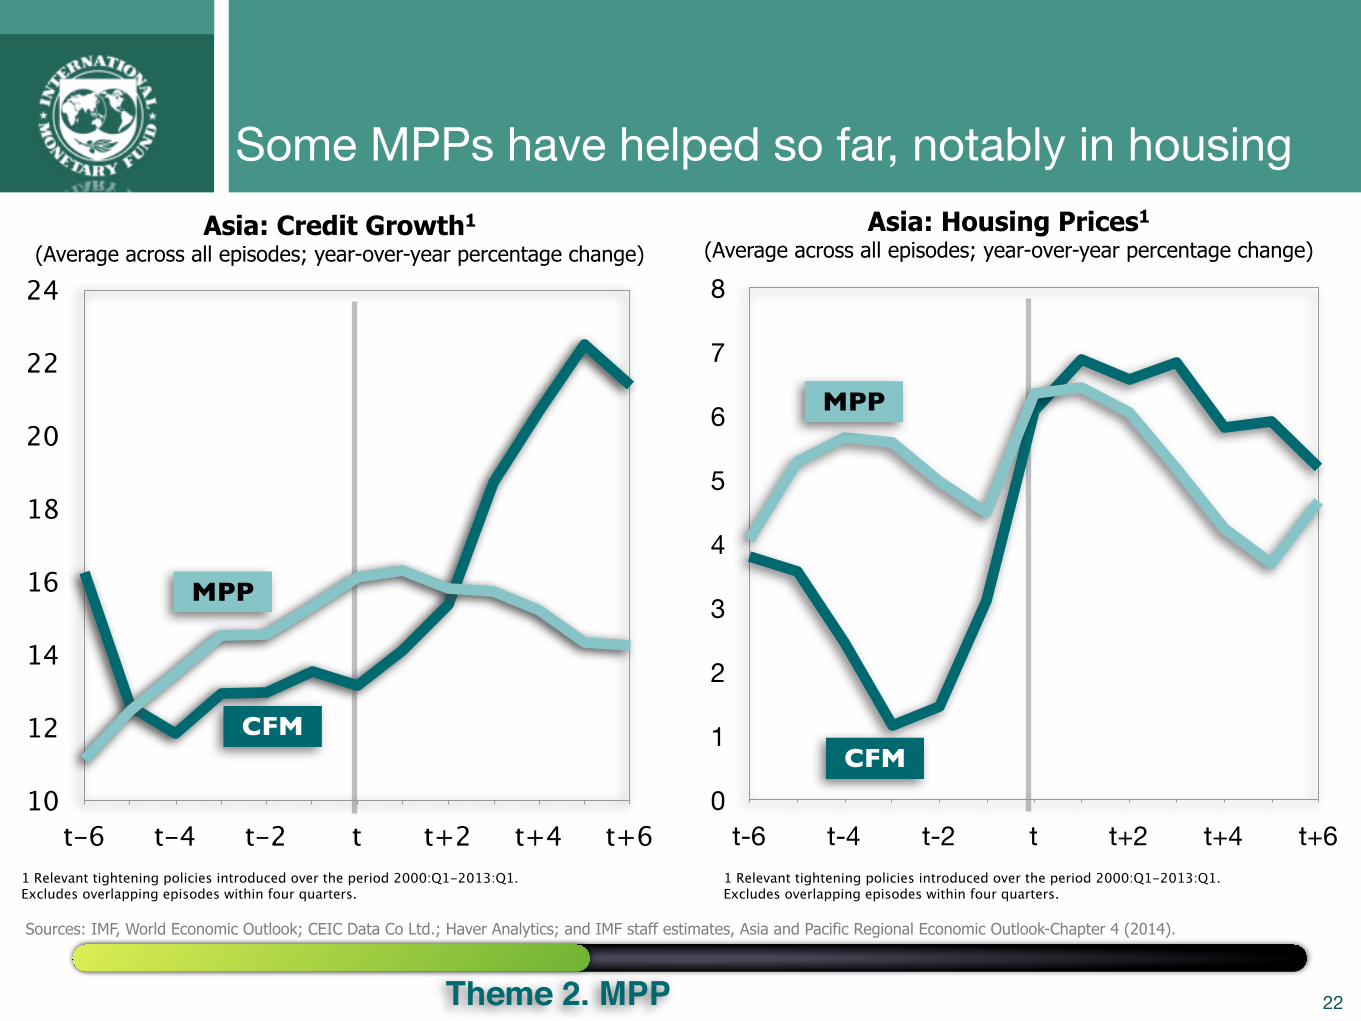
Some MPPs have helped so far, notably in housing
Sources: IMF, World Economic Outlook; CEIC Data Co Ltd.; Haver Analytics; and IMF staff estimates, Asia and Pacific Regional Economic Outlook-Chapter 4 (2014).
22Theme 2. MPP
Asia: Credit Growth1
(Average across all episodes; year-over-year percentage change)Asia: Housing Prices1
(Average across all episodes; year-over-year percentage change)
10
12
14
16
18
20
22
24
t-6 t-4 t-2 t t+2 t+4 t+61 Relevant tightening policies introduced over the period 2000:Q1-2013:Q1. Excludes overlapping episodes within four quarters.
0
1
2
3
4
5
6
7
8
t-6 t-4 t-2 t t+2 t+4 t+61 Relevant tightening policies introduced over the period 2000:Q1-2013:Q1. Excludes overlapping episodes within four quarters.
MPP
CFM
MPP
CFM
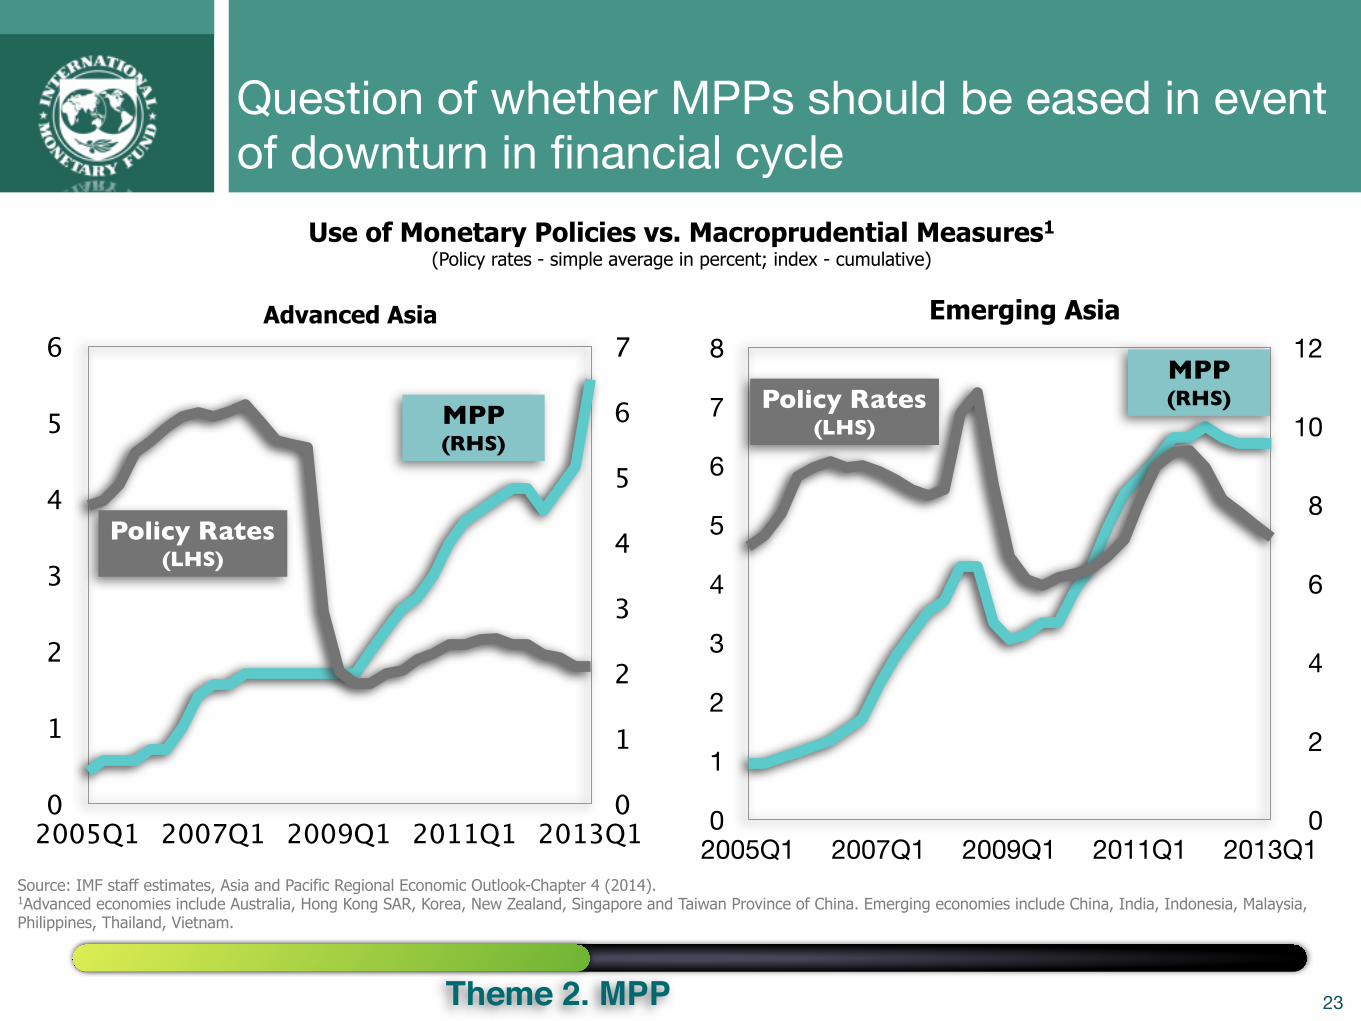
Question of whether MPPs should be eased in event of downturn in financial cycle
Use of Monetary Policies vs. Macroprudential Measures1
(Policy rates - simple average in percent; index - cumulative)
Source: IMF staff estimates, Asia and Pacific Regional Economic Outlook-Chapter 4 (2014).1Advanced economies include Australia, Hong Kong SAR, Korea, New Zealand, Singapore and Taiwan Province of China. Emerging economies include China, India, Indonesia, Malaysia, Philippines, Thailand, Vietnam.
23Theme 2. MPP
0
1
2
3
4
5
6
2005Q1 2007Q1 2009Q1 2011Q1 2013Q10
1
2
3
4
5
6
7Advanced Asia Emerging Asia
0
1
2
3
4
5
6
7
8
2005Q1 2007Q1 2009Q1 2011Q1 2013Q10
2
4
6
8
10
12
MPP (RHS)
Policy Rates (LHS)
MPP (RHS)Policy Rates
(LHS)
Theme 3. China
Theme 3: China’s reforms— what impact?
• Risks are building up...
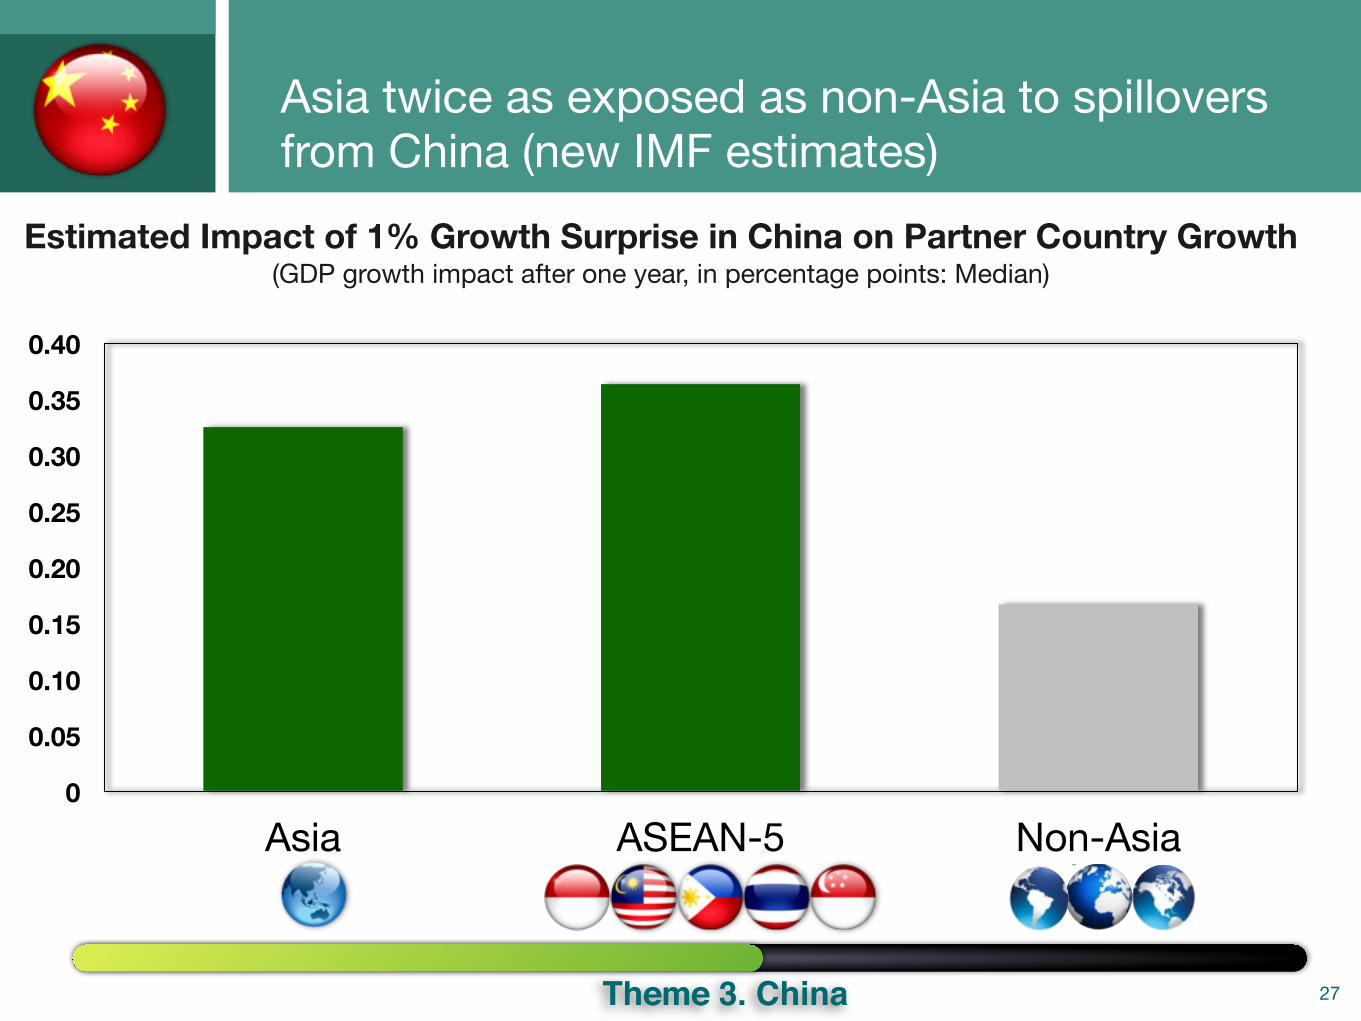
• ...and any sharp slowdown would affect Asia twice as much as non-Asia
• Reform blueprint should make growth more balanced and sustainable...
• ...and benefit region despite short-term transitional costs
24
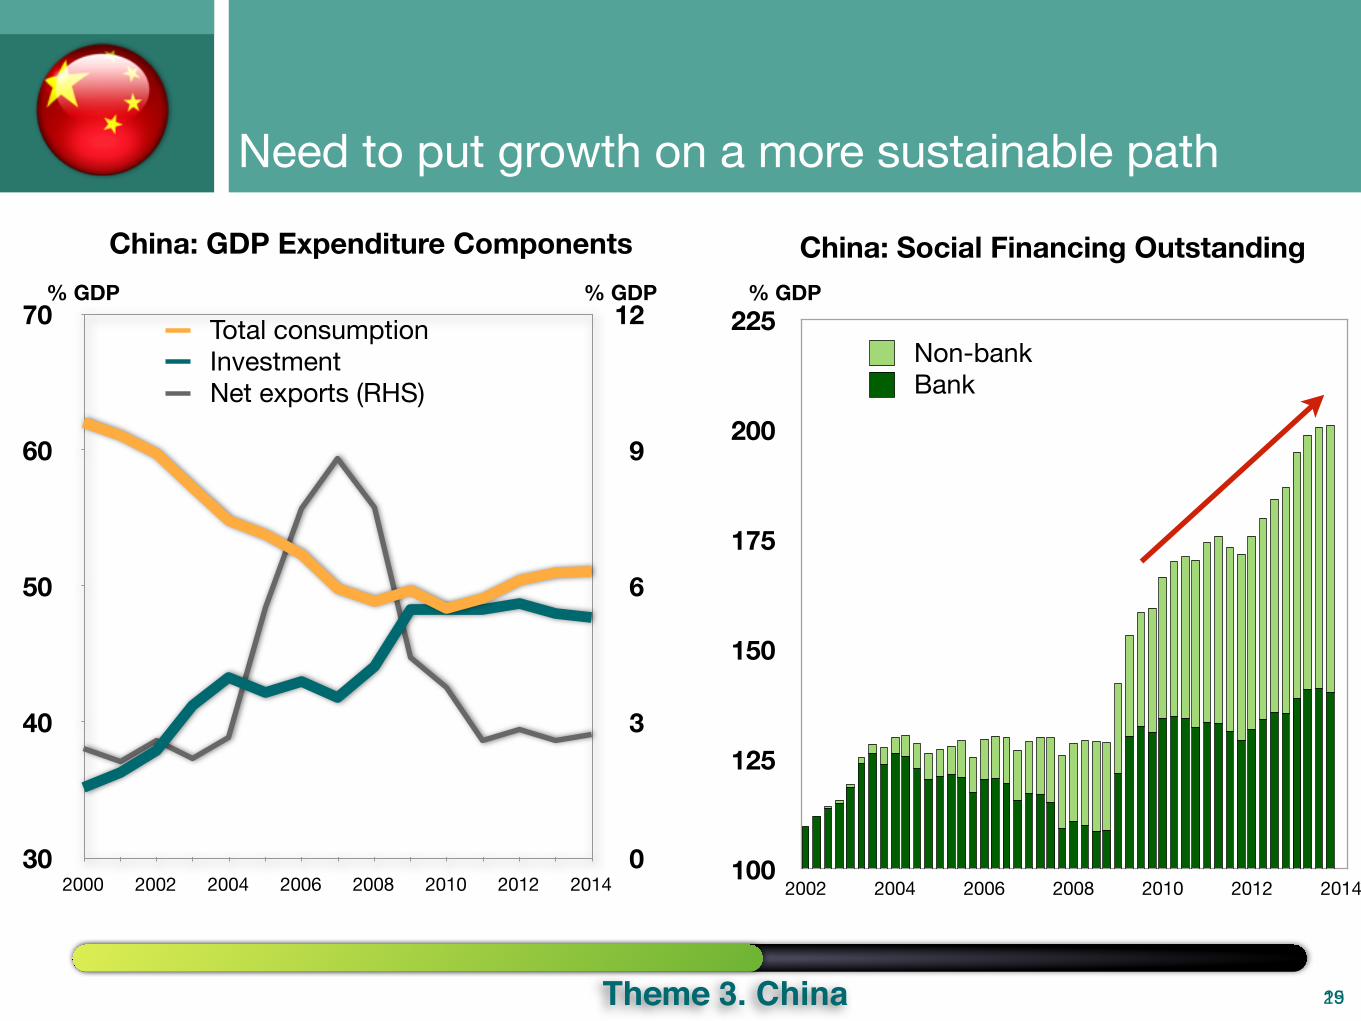
Need to put growth on a more sustainable path
25Theme 3. China 19
China: GDP Expenditure Components% GDP % GDP
100
125
150
175
200
225
2002 2004 2006 2008 2010 2012 2014
BankNon-bank
China: Social Financing Outstanding% GDP
30
40
50
60
70
2000 2002 2004 2006 2008 2010 2012 20140
3
6
9
12Total consumptionInvestmentNet exports (RHS)
-1.0
-0.8
-0.6
-0.3
-0.1
0.1
0.4
0.6
0.8
-1.5 -1.0 -0.5 0 0.5 1.0 1.5 2.0 2.5
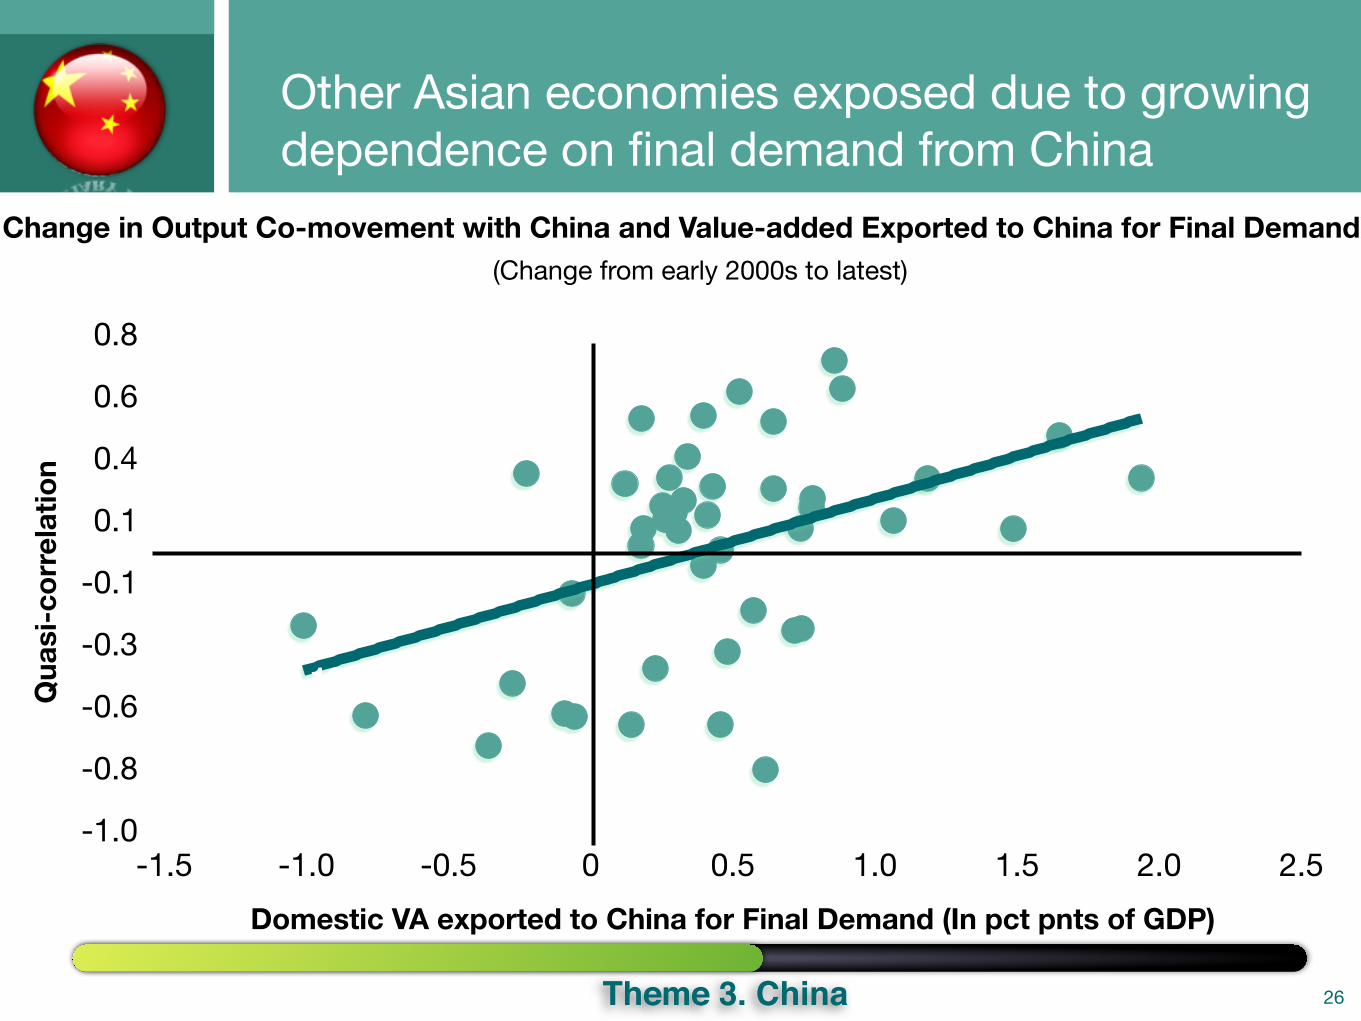
R² = 0.6395
R² = 0.1932Qua
si-c
orre
latio
n
Domestic VA exported to China for Final Demand (In pct pnts of GDP)
26
(Change from early 2000s to latest)Change in Output Co-movement with China and Value-added Exported to China for Final Demand
Other Asian economies exposed due to growing dependence on final demand from China
Theme 3. China
0
0.05
0.10
0.15
0.20
0.25
0.30
0.35
0.40
Asia ASEAN-5 Non-Asia
27
Asia twice as exposed as non-Asia to spillovers from China (new IMF estimates)
Estimated Impact of 1% Growth Surprise in China on Partner Country Growth(GDP growth impact after one year, in percentage points: Median)
Theme 3. China
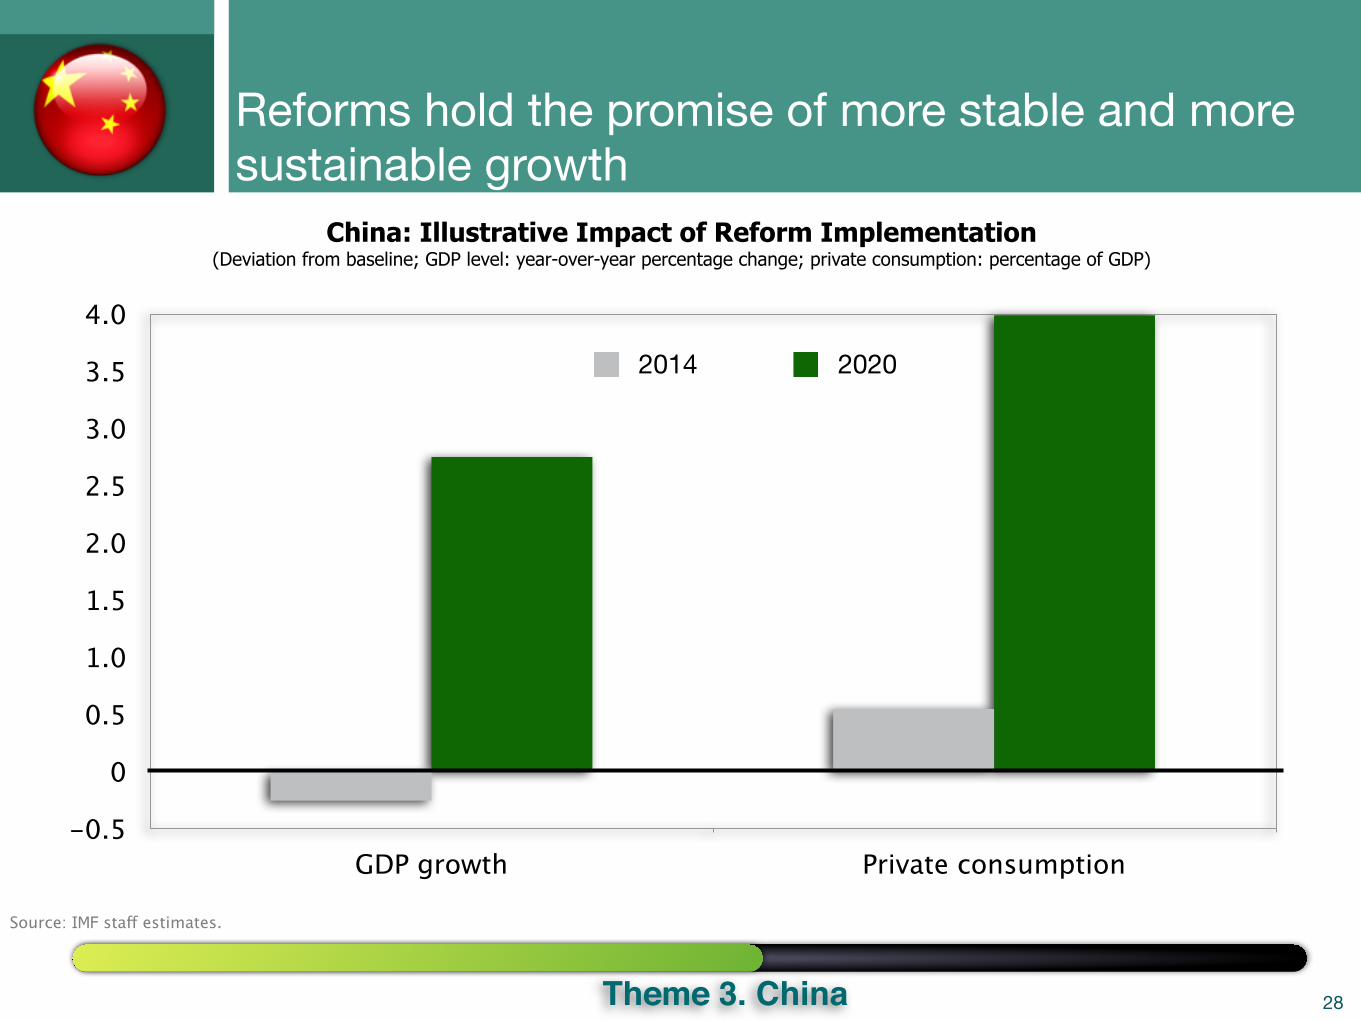
Reforms hold the promise of more stable and more sustainable growth
Source: IMF staff estimates.
China: Illustrative Impact of Reform Implementation(Deviation from baseline; GDP level: year-over-year percentage change; private consumption: percentage of GDP)
28Theme 3. China
-0.5
0
0.5
1.0
1.5
2.0
2.5
3.0
3.5
4.0
GDP growth Private consumption
2014 2020
Theme 4: Abenomics— temporary stimulus or break with the past?
• Abenomics has provided a boost but major challenges remain
• Need for further decisive reforms to achieve private-sector-led growth and durable exit from deflation
29Theme 4. Japan
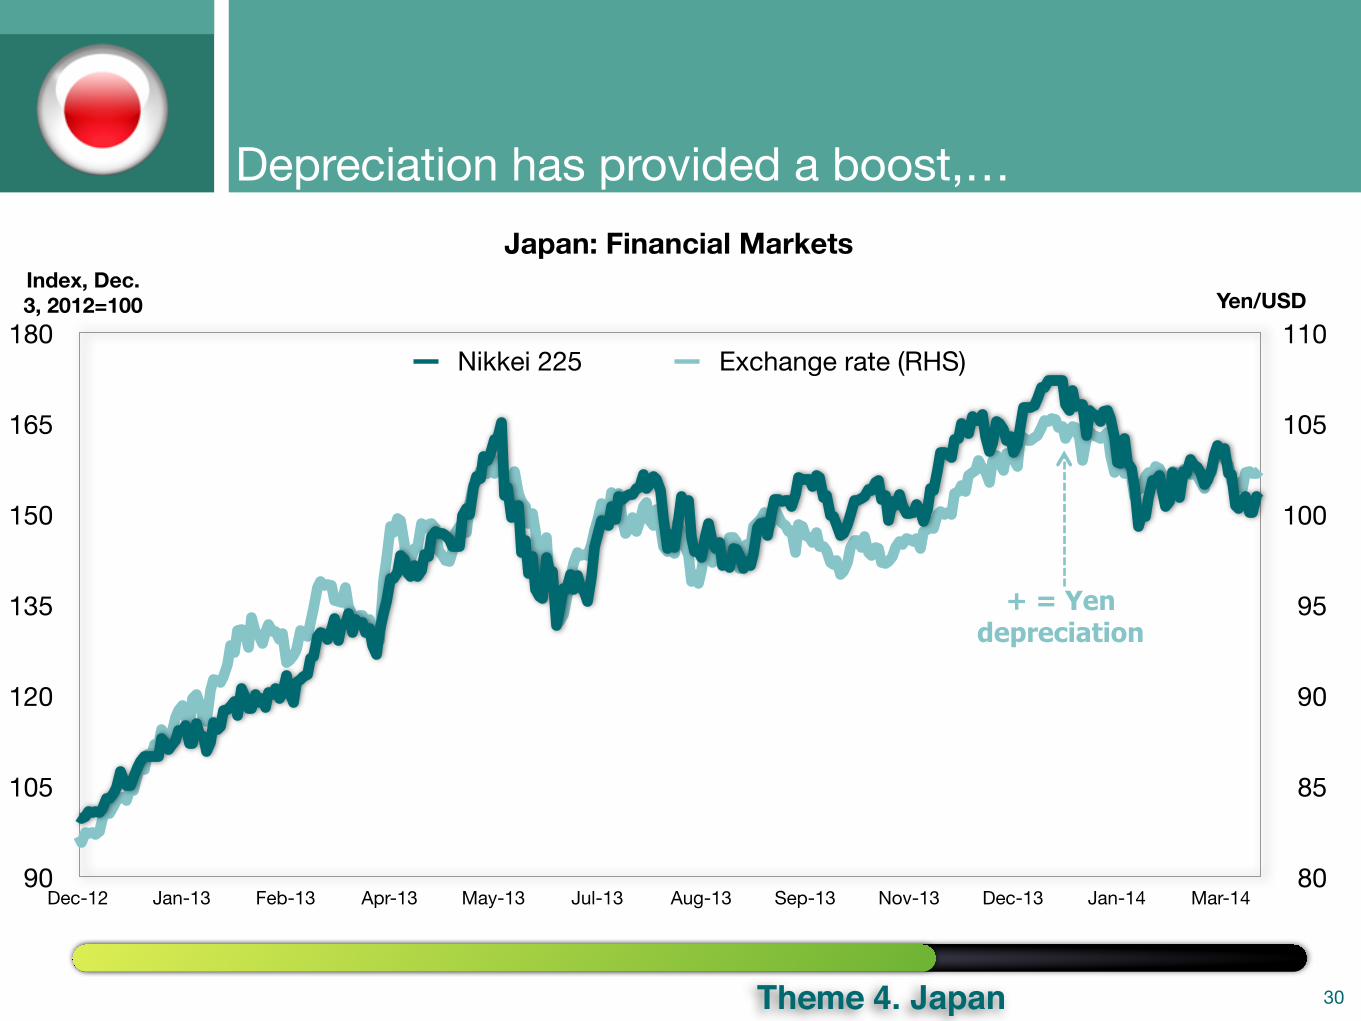
Japan: Financial MarketsIndex, Dec. 3, 2012=100 Yen/USD
90
105
120
135
150
165
180
Dec-12 Jan-13 Feb-13 Apr-13 May-13 Jul-13 Aug-13 Sep-13 Nov-13 Dec-13 Jan-14 Mar-1480
85
90
95
100
105
110Nikkei 225 Exchange rate (RHS)
+ = Yen depreciation
Depreciation has provided a boost,…
30Theme 4. Japan
95
100
105
110
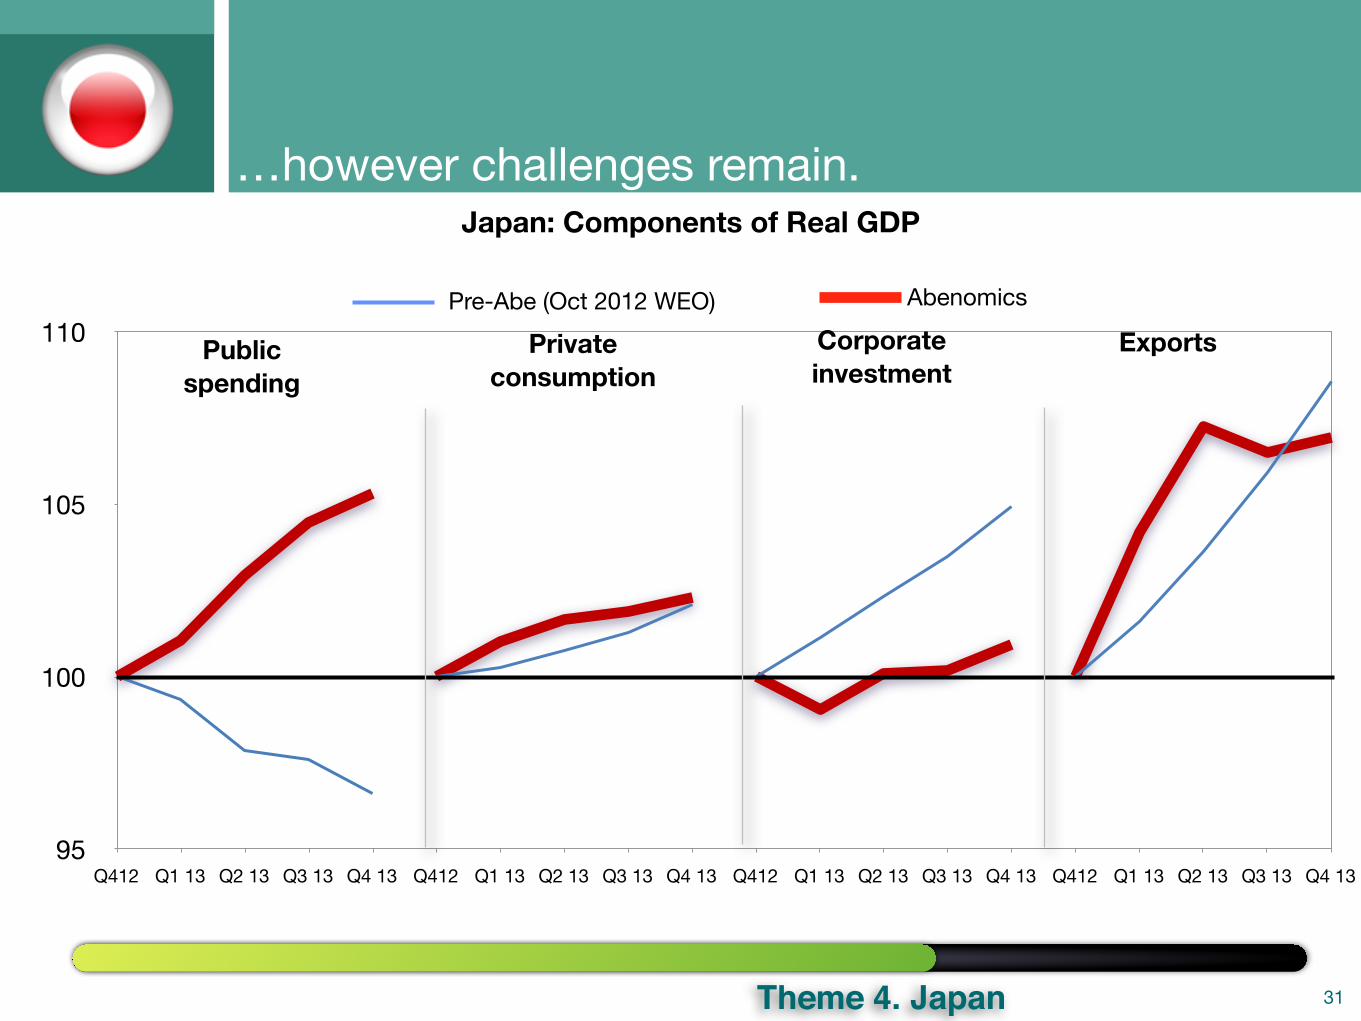
Q412 Q1 13 Q2 13 Q3 13 Q4 13 Q412 Q1 13 Q2 13 Q3 13 Q4 13 Q412 Q1 13 Q2 13 Q3 13 Q4 13 Q412 Q1 13 Q2 13 Q3 13 Q4 13
Privateconsumption
Corporate investment
ExportsPublicspending
Pre-Abe (Oct 2012 WEO) Abenomics
Japan: Components of Real GDP…however challenges remain.
31Theme 4. Japan
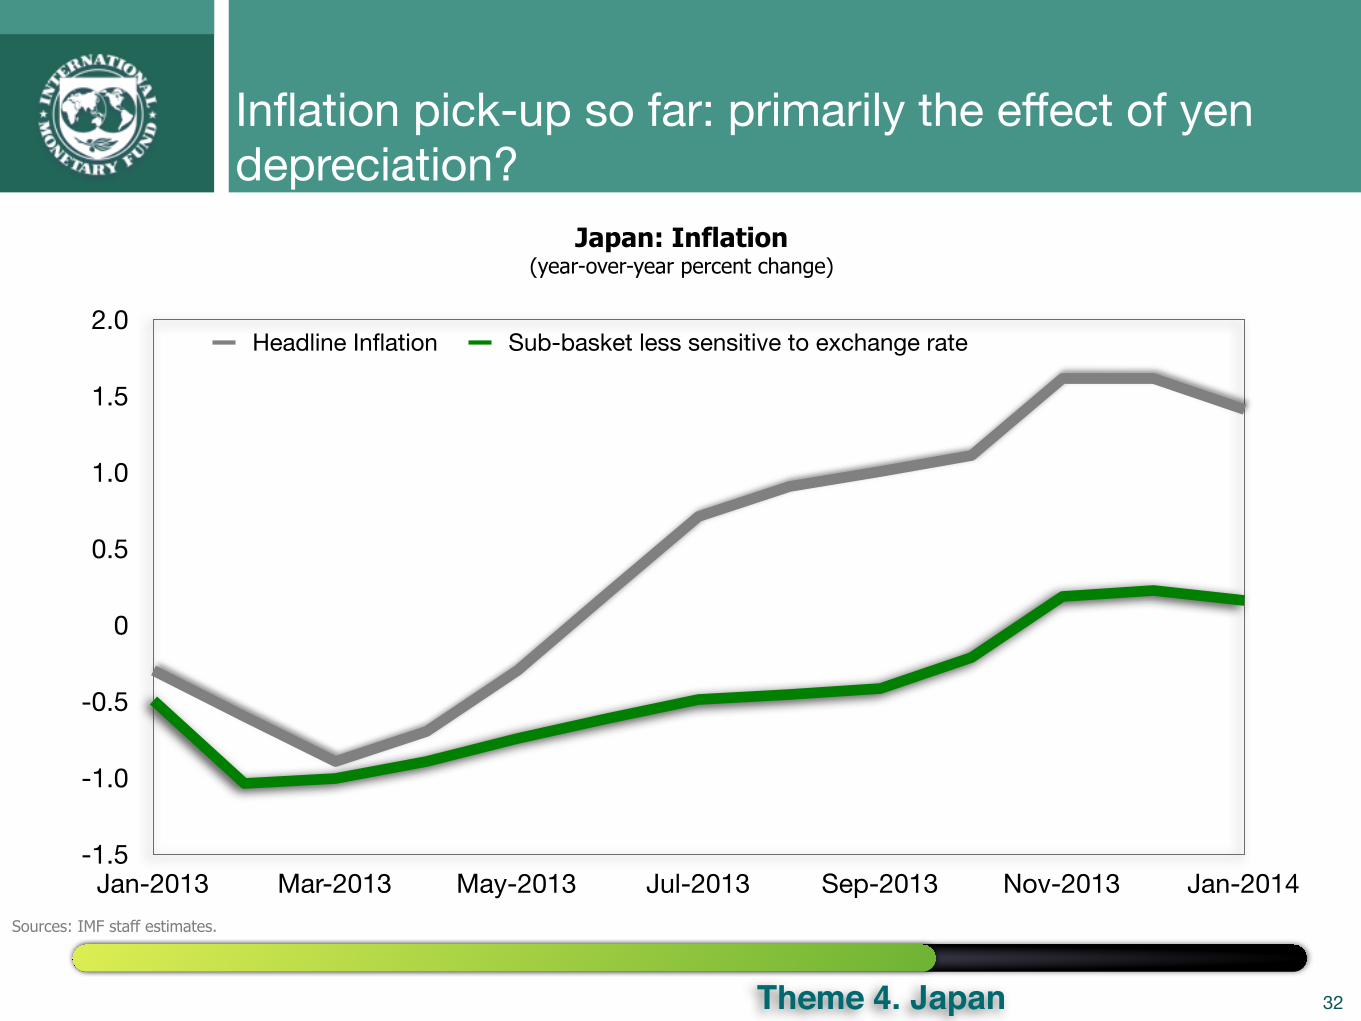
Inflation pick-up so far: primarily the effect of yen depreciation?
Sources: IMF staff estimates.
Japan: Inflation(year-over-year percent change)
32Theme 4. Japan
-1.5
-1.0
-0.5
0
0.5
1.0
1.5
2.0
Jan-2013 Mar-2013 May-2013 Jul-2013 Sep-2013 Nov-2013 Jan-2014
Headline Inflation Sub-basket less sensitive to exchange rate
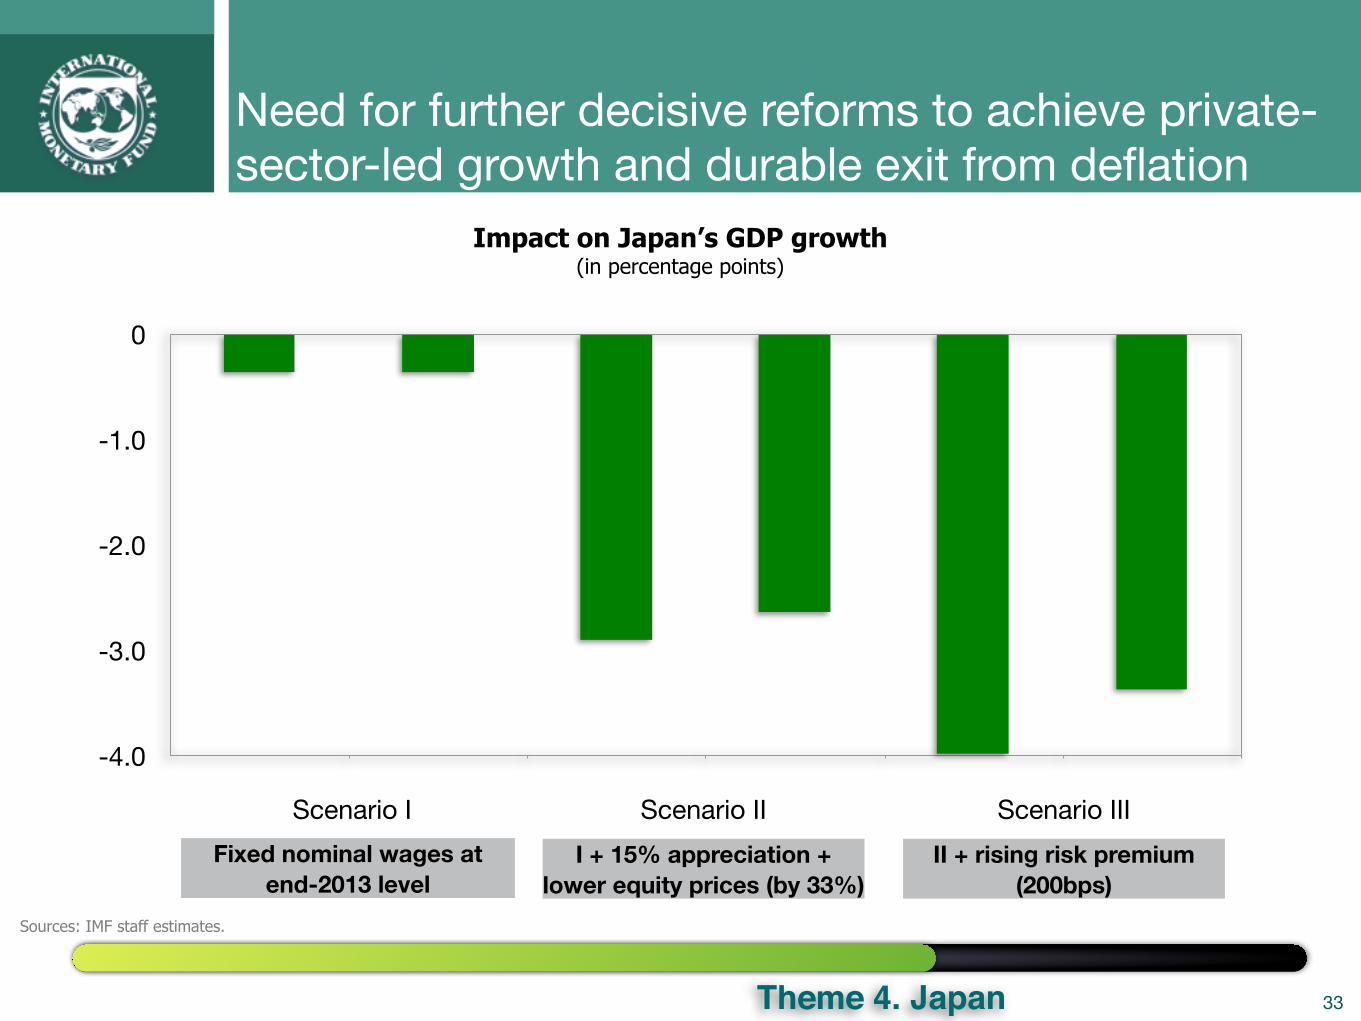
Need for further decisive reforms to achieve private-sector-led growth and durable exit from deflation
Sources: IMF staff estimates.
Impact on Japan’s GDP growth(in percentage points)
33
Fixed nominal wages at end-2013 level
I + 15% appreciation + lower equity prices (by 33%)
II + rising risk premium (200bps)
Theme 4. Japan
-4.0
-3.0
-2.0
-1.0
0
Scenario I Scenario II Scenario III
Theme 5: ASEAN— what is happening to growth?
• The recent growth slowdown in ASEAN-5 has been more cyclical than structural
• Domestic factors have played a bigger role
• But the pickup in global demand will help
34Theme 5. ASEAN
-1
0
1
2
3
4
5
6
7
8
9
2010-12 2013 2010-12 2013 2010-12 2013 2010-12 2013 2010-12 2013
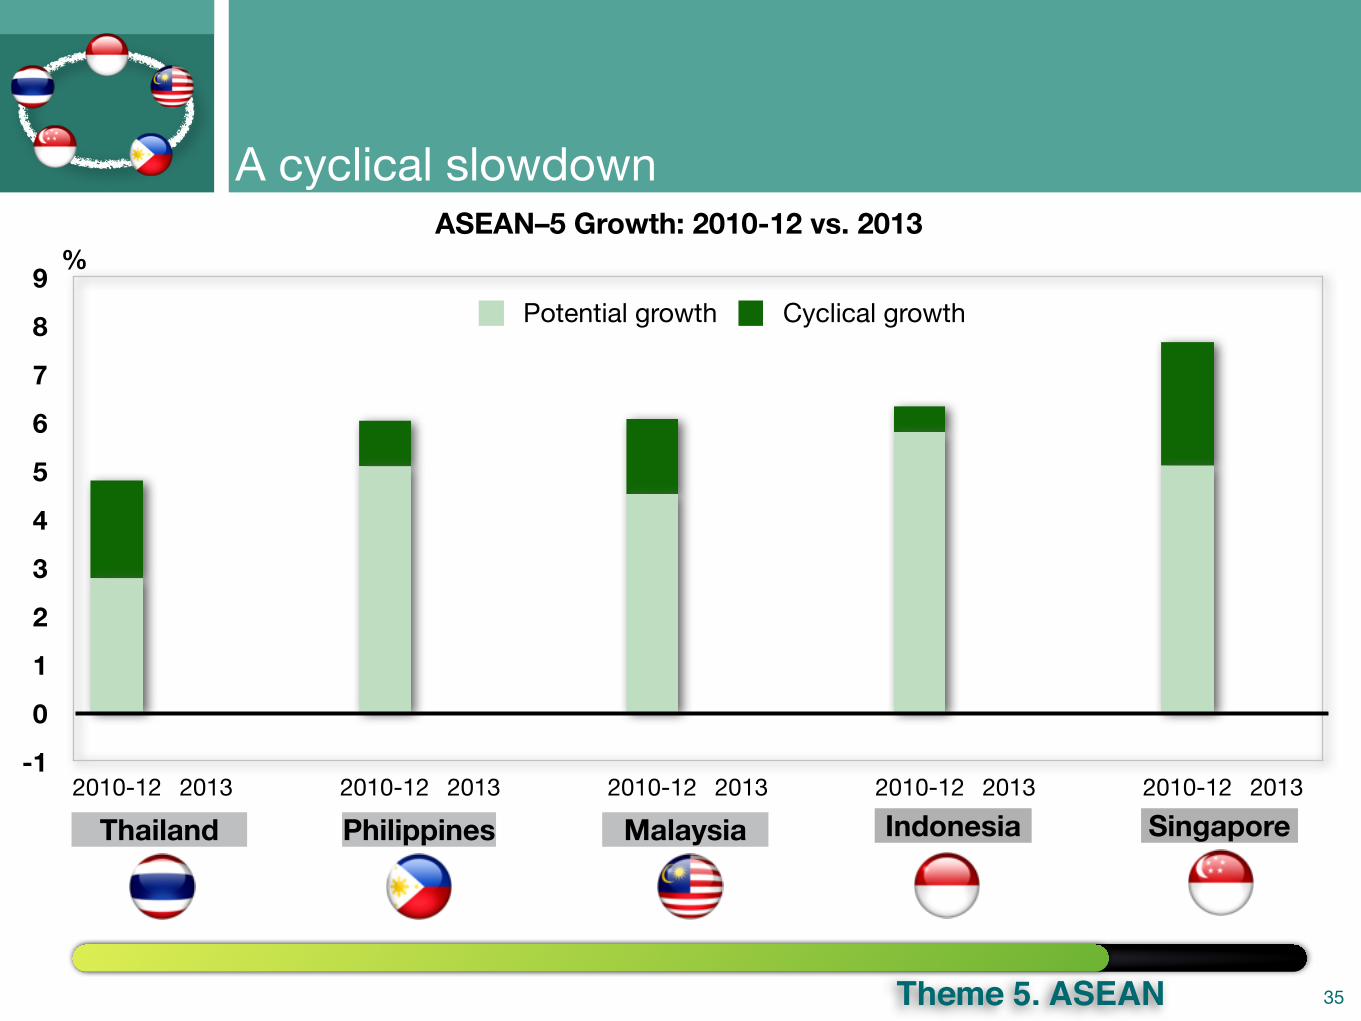
ASEAN–5 Growth: 2010-12 vs. 2013%
Potential growth Cyclical growth
Thailand Philippines Malaysia Indonesia Singapore
A cyclical slowdown
35Theme 5. ASEAN
-1
0
1
2
3
4
5
6
7
8
9
2010-12 2013 2010-12 2013 2010-12 2013 2010-12 2013 2010-12 2013
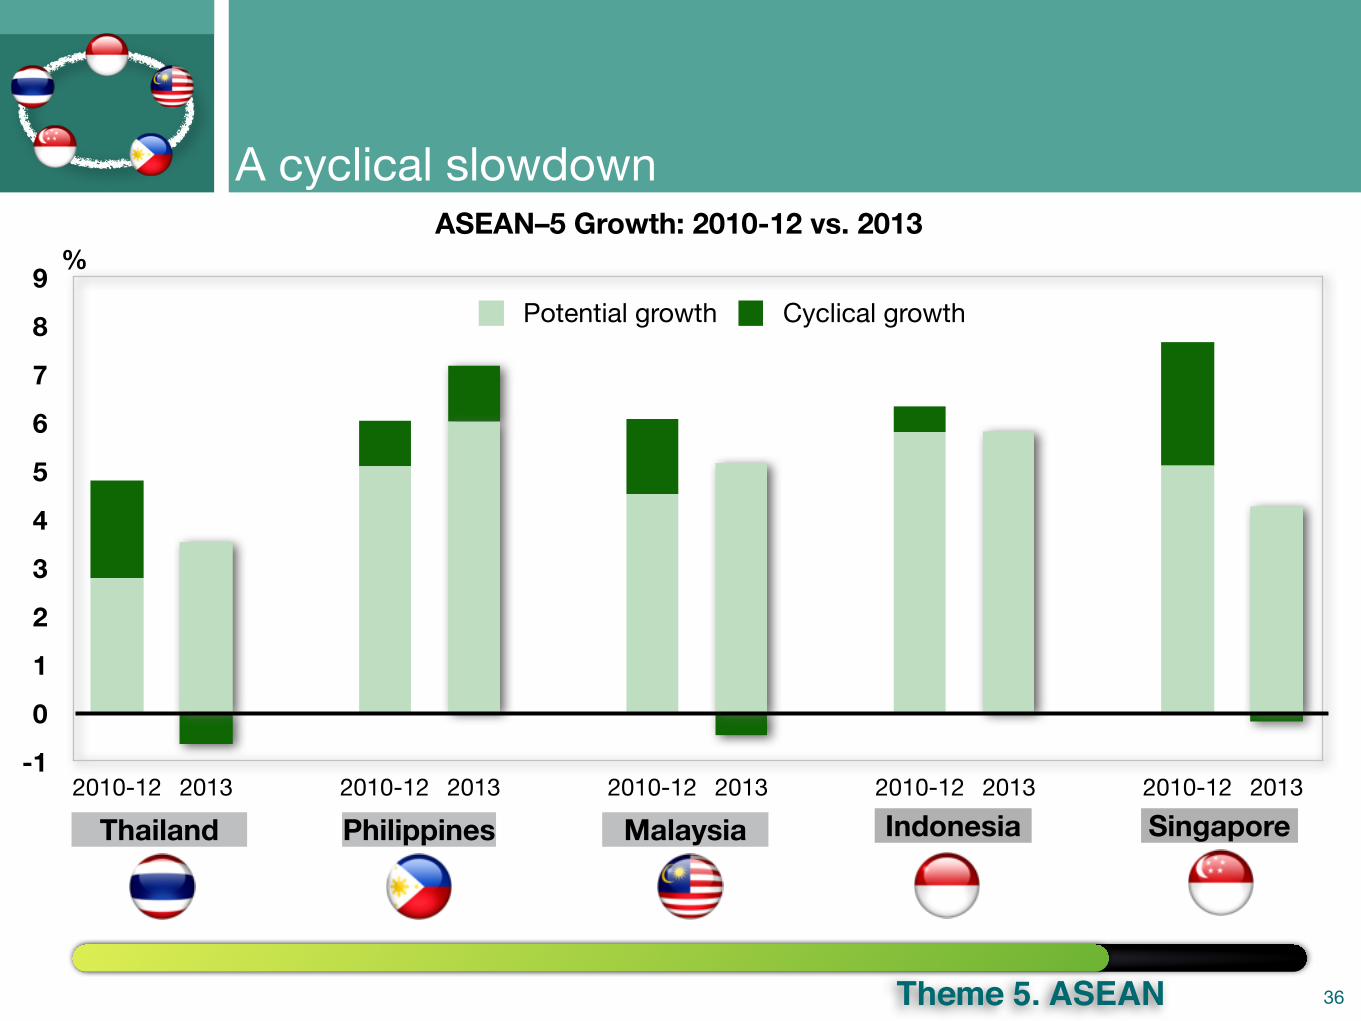
ASEAN–5 Growth: 2010-12 vs. 2013%
Potential growth Cyclical growth
Thailand Philippines Malaysia Indonesia Singapore
A cyclical slowdown
36Theme 5. ASEAN
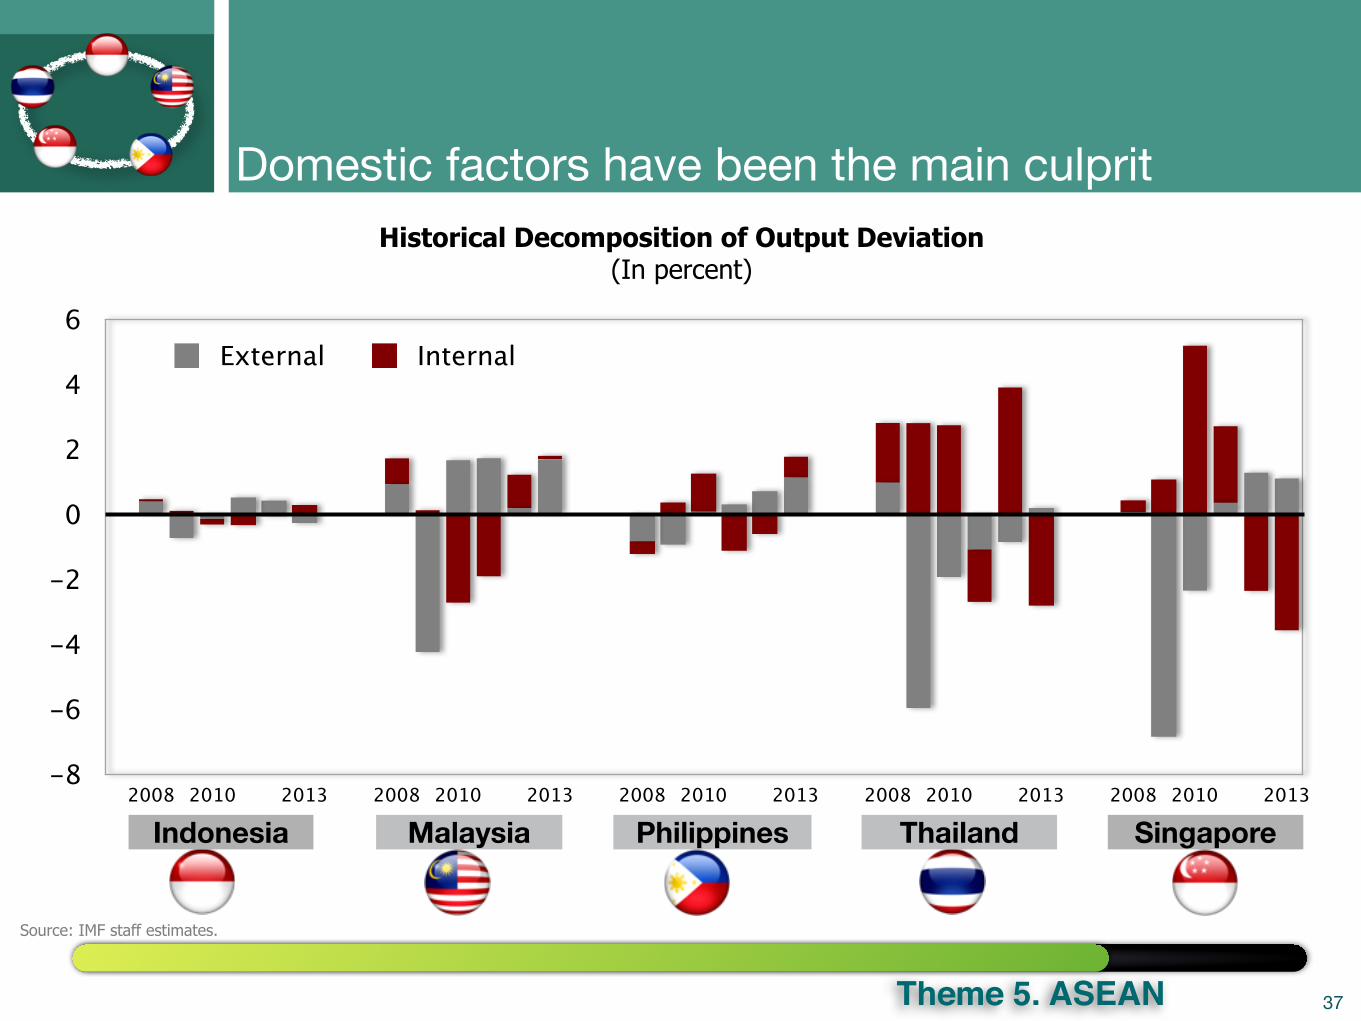
Domestic factors have been the main culprit
Source: IMF staff estimates.
Historical Decomposition of Output Deviation(In percent)
37Theme 5. ASEAN
-8
-6
-4
-2
0
2
4
6
2008 2010 2013 2008 2010 2013 2008 2010 2013 2008 2010 2013 2008 2010 2013
External Internal
ThailandPhilippinesMalaysiaIndonesia Singapore
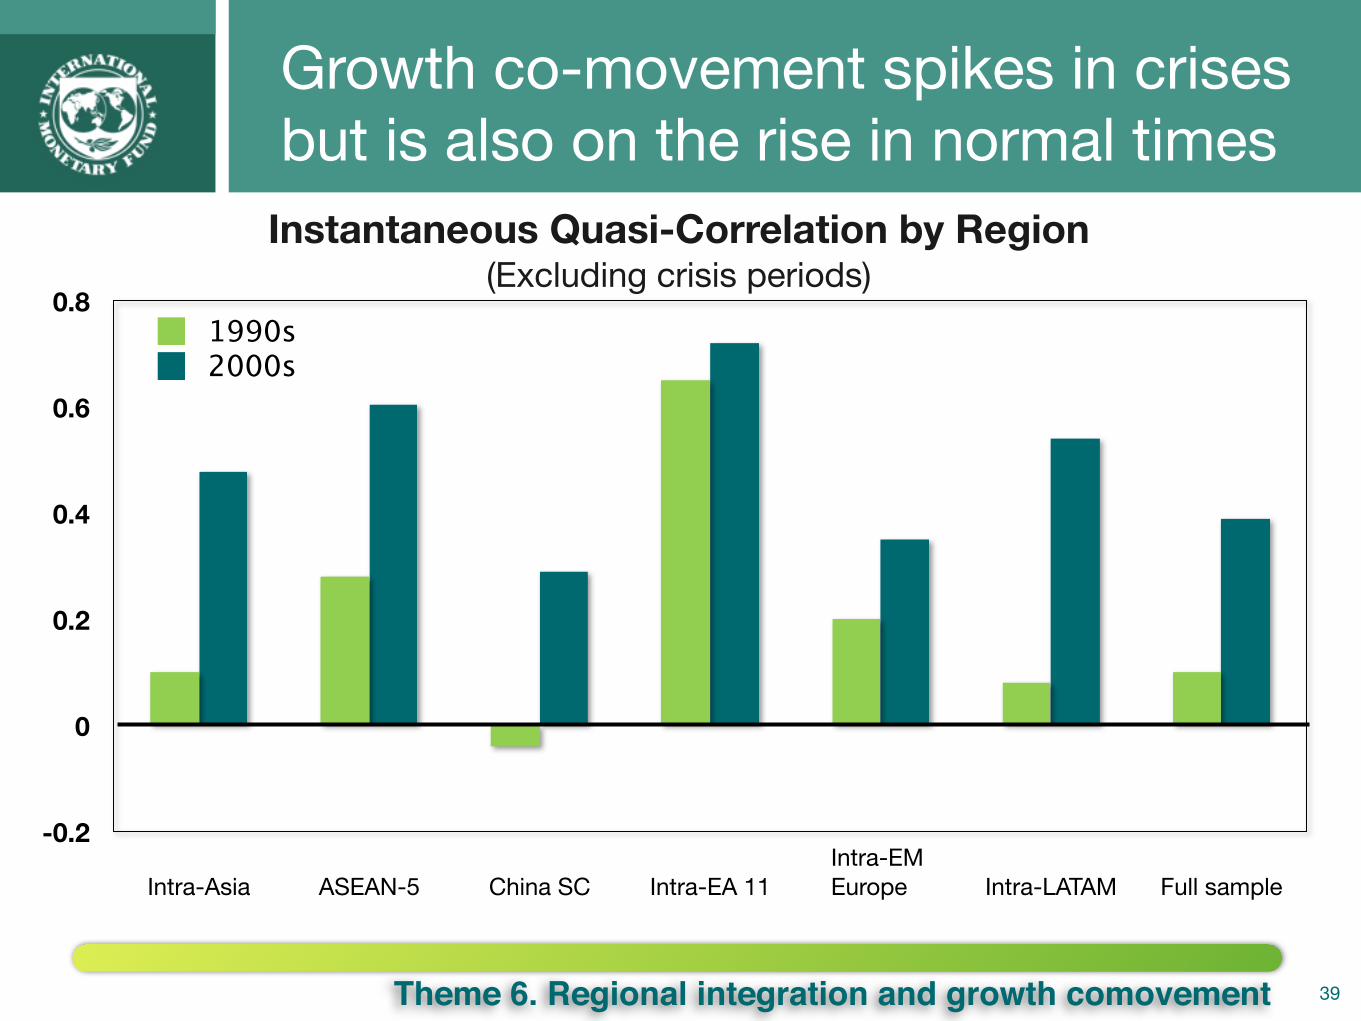
Theme 6: Regional integration— growing source of spillovers?• Asian economies are moving increasingly in synch...
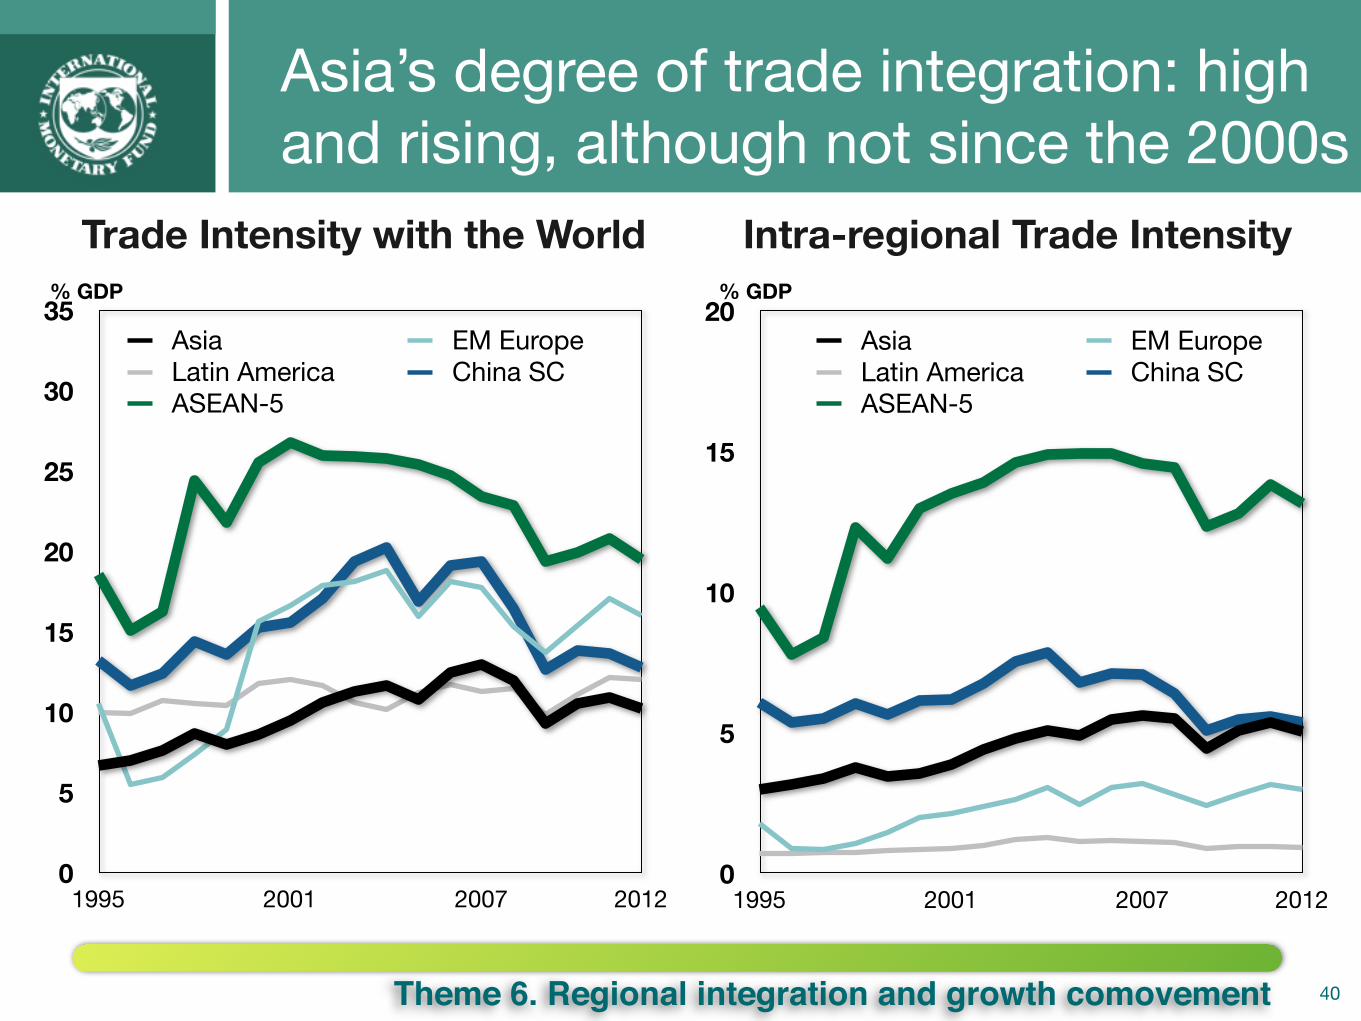
• ...partly due to growing trade integration (~ 1/4 of rise in comovement)
• ...which in turn reflects build-up of supply-chain linkages
• ...particularly around China, with Japan’s role declining
• The future: greater integration => greater growth comovement => role for regional and global financial safety nets
38Theme 5. ASEAN
39
Instantaneous Quasi-Correlation by Region(Excluding crisis periods)
Growth co-movement spikes in crises but is also on the rise in normal times
-0.2
0
0.2
0.4
0.6
0.8
Intra-Asia ASEAN-5 China SC Intra-EA 11Intra-EM Europe Intra-LATAM Full sample
1990s2000s
Theme 6. Regional integration and growth comovement
40
Trade Intensity with the World
Asia’s degree of trade integration: high and rising, although not since the 2000s
0
5
10
15
20
25
30
35
1995 2001 2007 2012
Asia EM EuropeLatin America China SCASEAN-5
% GDP
0
5
10
15
20
1995 2001 2007 2012
Asia EM EuropeLatin America China SCASEAN-5
Intra-regional Trade Intensity% GDP
Theme 6. Regional integration and growth comovement
0
5
10
15
20
25
30
35
AUS
KOR
HKG PH
L
TWN
JPN
MYS NZL
THA
IDN
SGP
IND
0
2
4
6
8
10
HKG PH
L
KOR
THA
TWN
SGP
MYS NZL IDN
IND
JPN
AUS
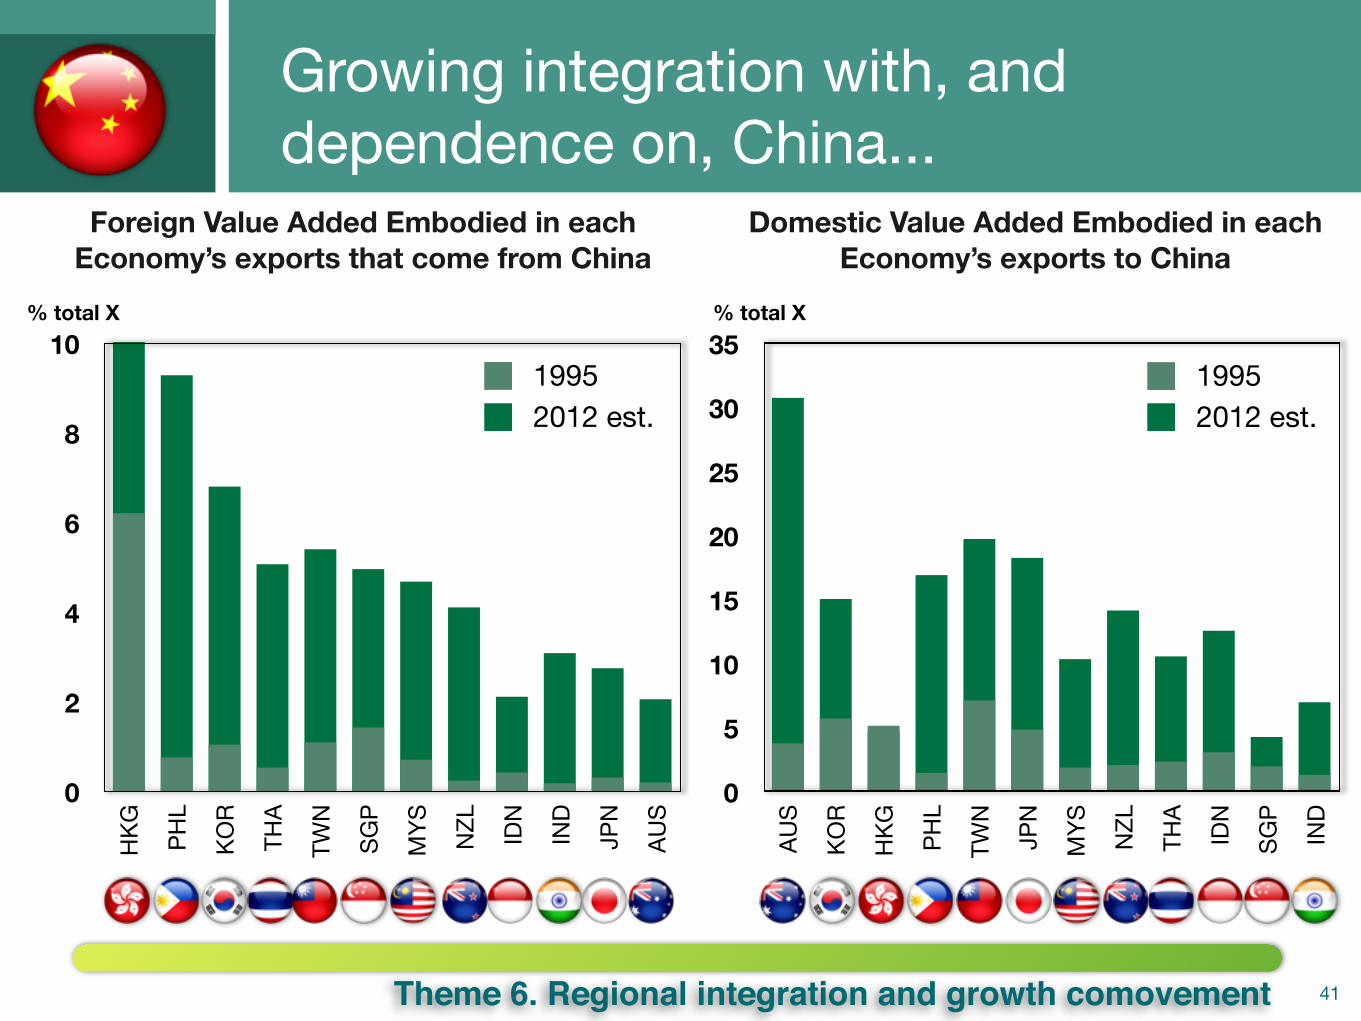
41
Growing integration with, and dependence on, China...
% total X
Foreign Value Added Embodied in each Economy’s exports that come from China
19952012 est.
1995
Domestic Value Added Embodied in each Economy’s exports to China
% total X
2012 est.
Theme 6. Regional integration and growth comovement
0
2
4
6
8
10
12
KOR
PHL
THA
MYS
HKG
TWN
SGP
CH
N
NZL IND
IDN
AUS
0
5
10
15
20
25
AUS
IDN
MYS TH
A
CH
N
NZL
KOR
PHL
TWN
IND
SGP
HKG
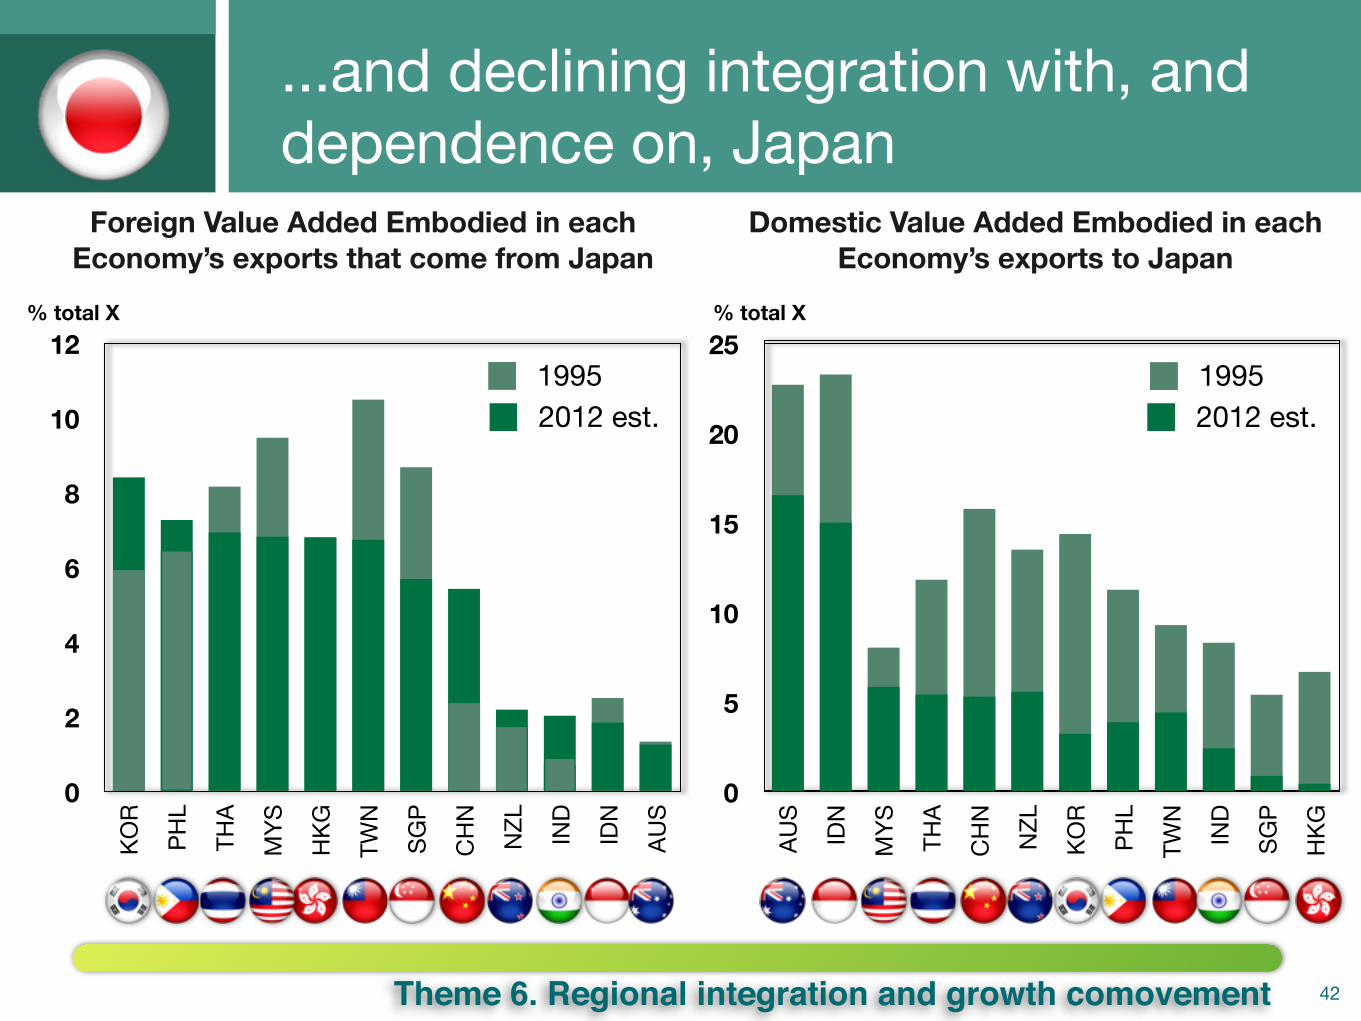
42
...and declining integration with, and dependence on, Japan
% total X
Foreign Value Added Embodied in each Economy’s exports that come from Japan
19952012 est.
1995
Domestic Value Added Embodied in each Economy’s exports to Japan
% total X
2012 est.
Theme 6. Regional integration and growth comovement
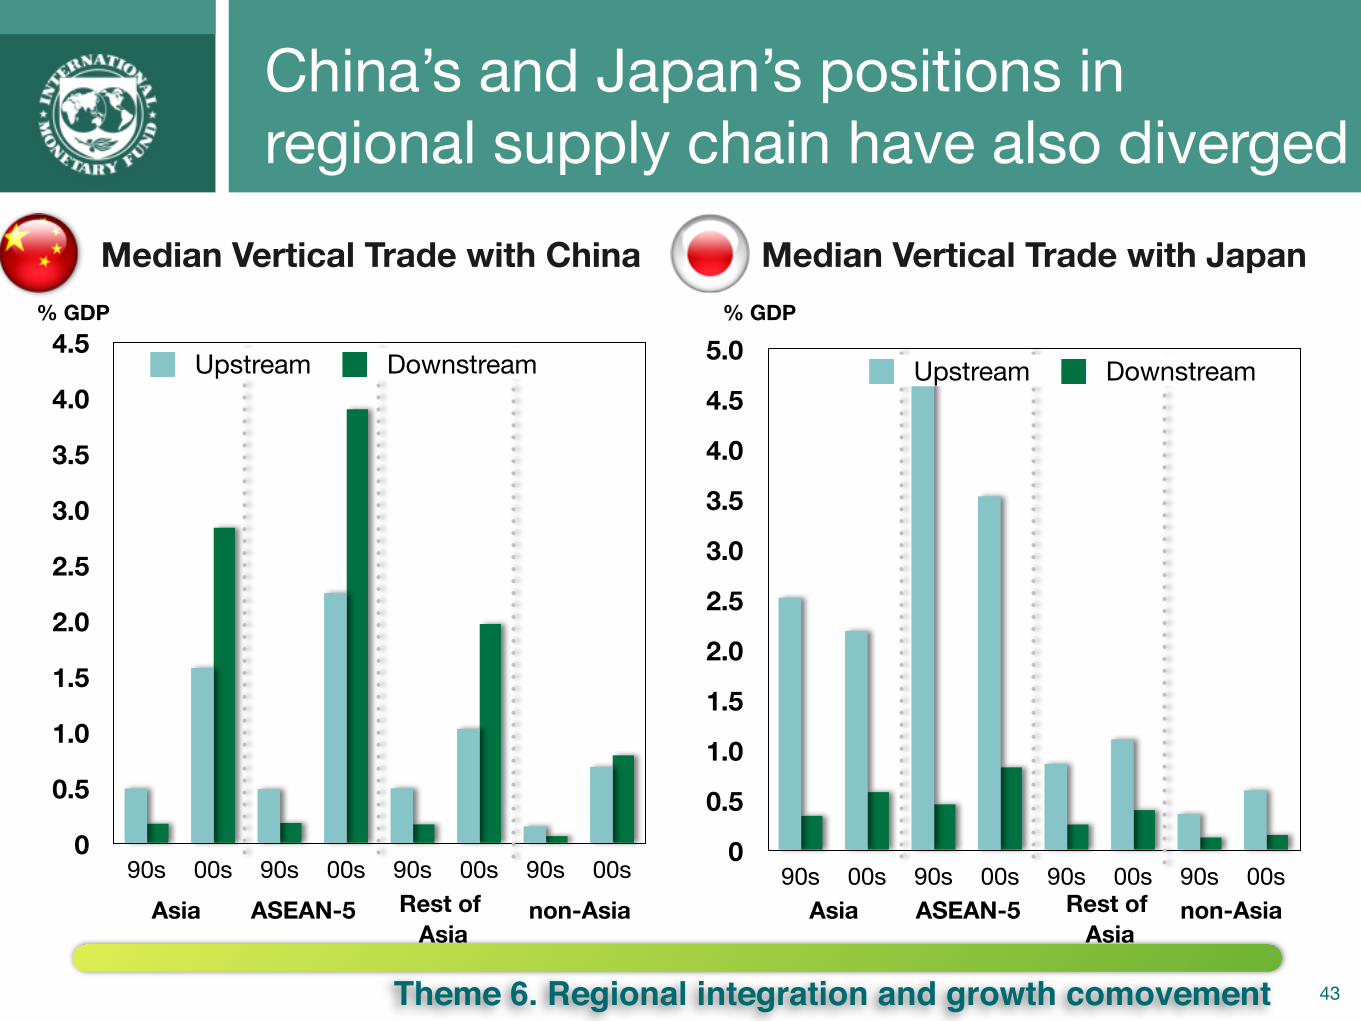
43
China’s and Japan’s positions in regional supply chain have also diverged
% GDP
Median Vertical Trade with China Median Vertical Trade with Japan% GDP
0
0.5
1.0
1.5
2.0
2.5
3.0
3.5
4.0
4.5
90s 00s 90s 00s 90s 00s 90s 00sAsia ASEAN-5 Rest of
Asianon-Asia
Upstream Downstream
0
0.5
1.0
1.5
2.0
2.5
3.0
3.5
4.0
4.5
5.0
90s 00s 90s 00s 90s 00s 90s 00sAsia ASEAN-5 Rest of
Asianon-Asia
Upstream Downstream
Theme 6. Regional integration and growth comovement
0
1.0
2.0
3.0
4.0
5.0
Asia ASEAN-5 Non-Asia
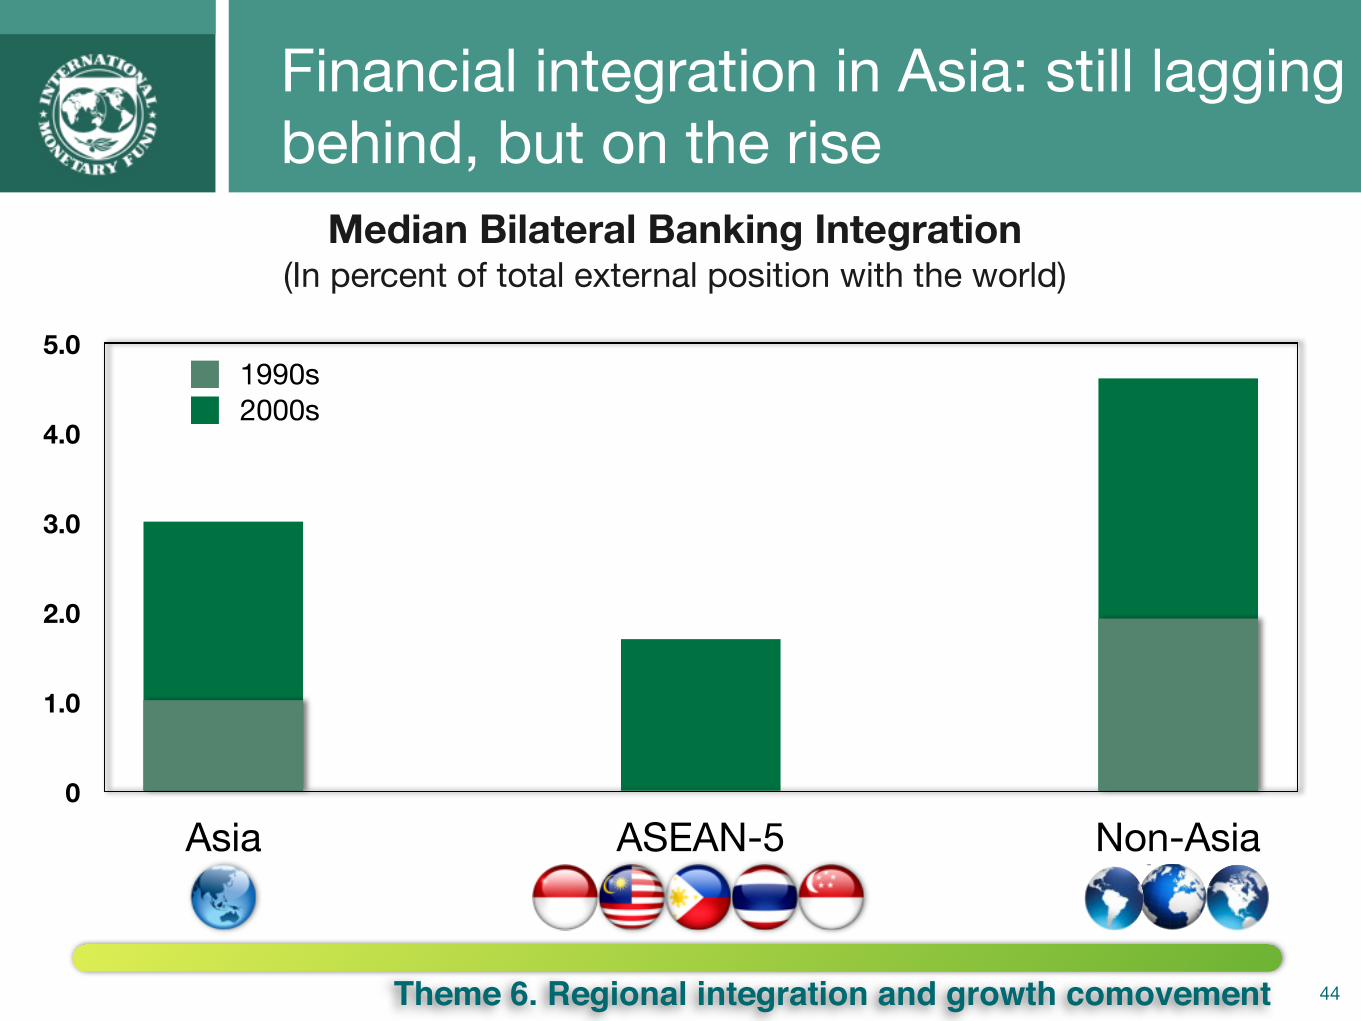
44
Financial integration in Asia: still lagging behind, but on the rise
Median Bilateral Banking Integration(In percent of total external position with the world)
1990s2000s
Theme 6. Regional integration and growth comovement
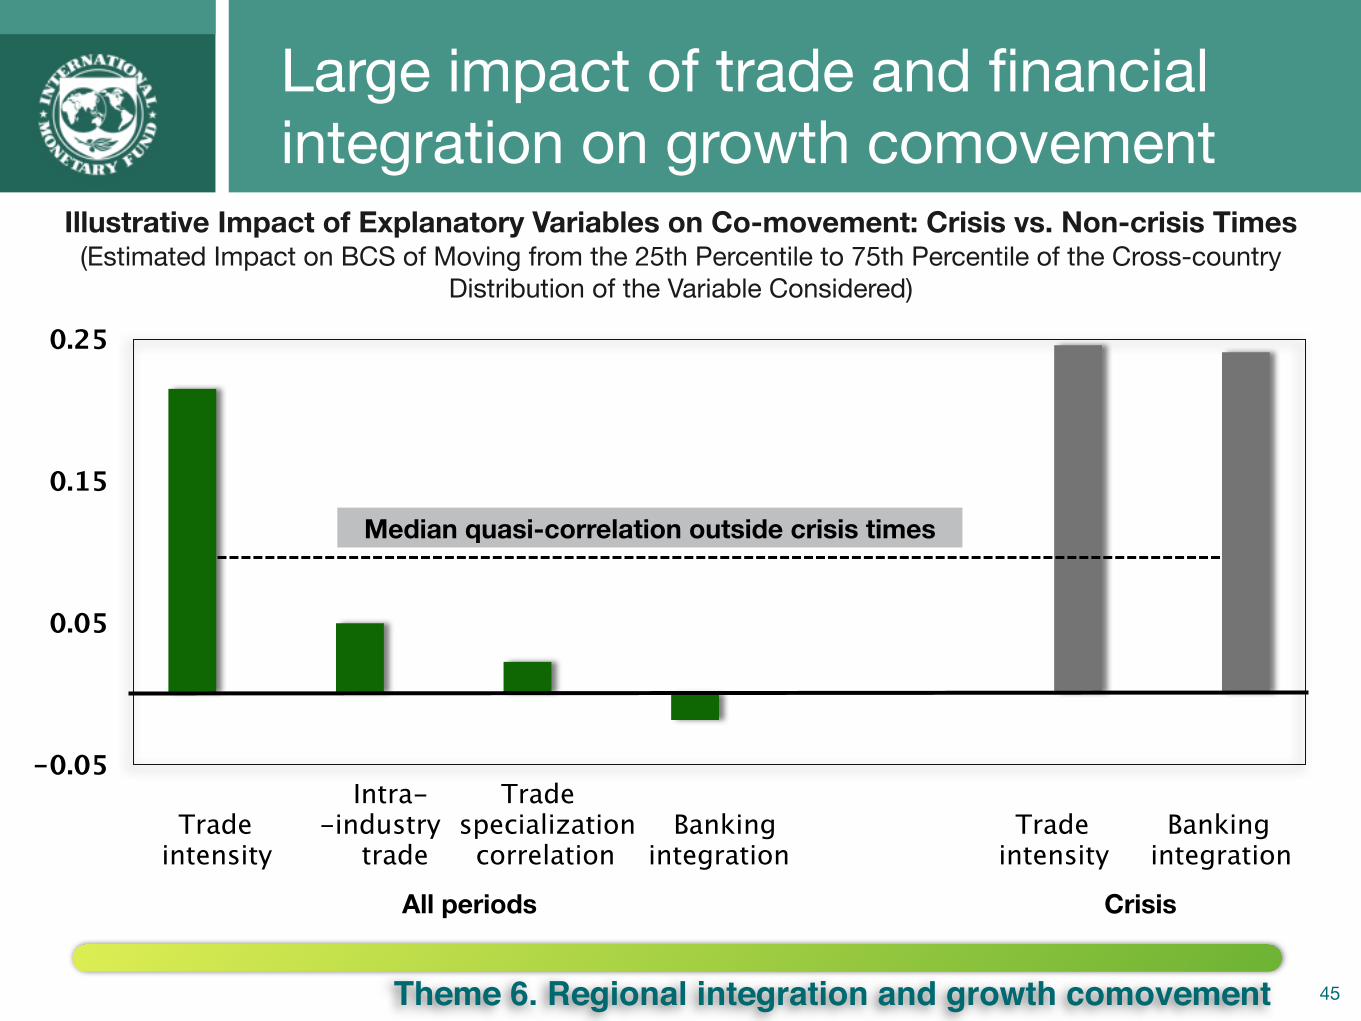
45
Large impact of trade and financial integration on growth comovement
Illustrative Impact of Explanatory Variables on Co-movement: Crisis vs. Non-crisis Times(Estimated Impact on BCS of Moving from the 25th Percentile to 75th Percentile of the Cross-country
Distribution of the Variable Considered)
-0.05
0.05
0.15
0.25
Trade intensity
Intra--industry trade
Trade specialization correlation
Banking integration
Trade intensity
Banking integration
Median quasi-correlation outside crisis times
All periods Crisis
Theme 6. Regional integration and growth comovement
46
Implications: The Future
• BCS to rise if economic integration increases further, especially in crisis times (financial integration)
• Role of China: increasing as a final demand source, declining as “assembly hub” ➡ greater spillovers from China shocks, but China less of a conduit for global shocks
• Higher BCS: bad for risk sharing ➡ need for individual policies to strengthen resilience and broad (regional and global) safety nets; global safety net especially useful in event of regional shocks/shocks originating from China
Theme 6. Regional integration and growth comovement

Thank You
Asia and Pacific Department, April 201447