Embed Size (px)
Citation preview
ASHTON SCHOOLNidia Karbonik, School Principal
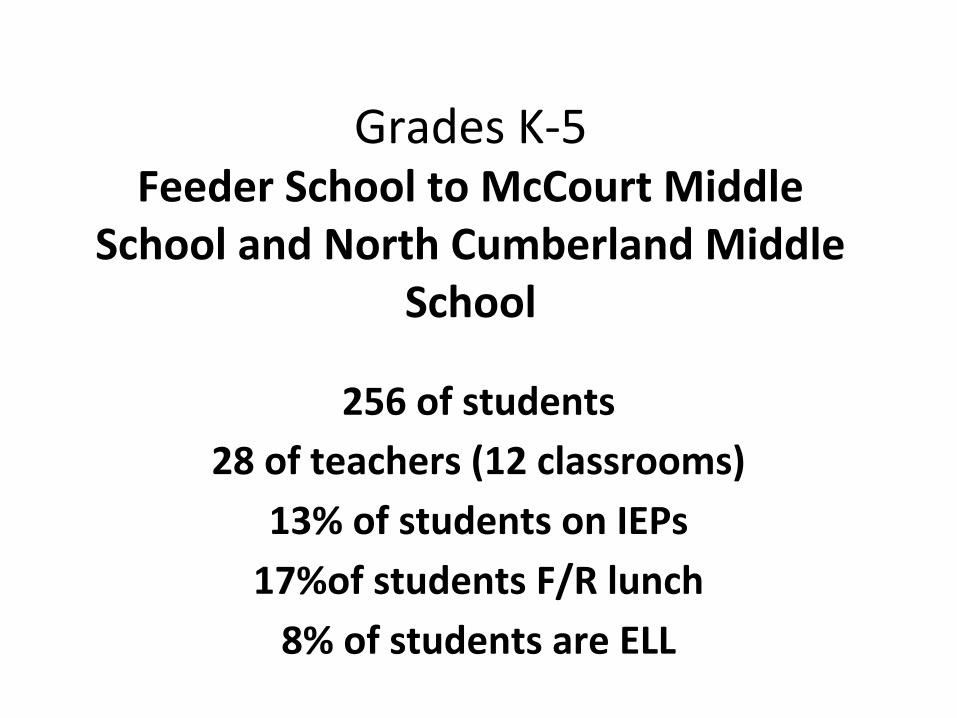
Grades K-5Feeder School to McCourt Middle
School and North Cumberland Middle School
256 of students
28 of teachers (12 classrooms)
13% of students on IEPs
17%of students F/R lunch
8% of students are ELL
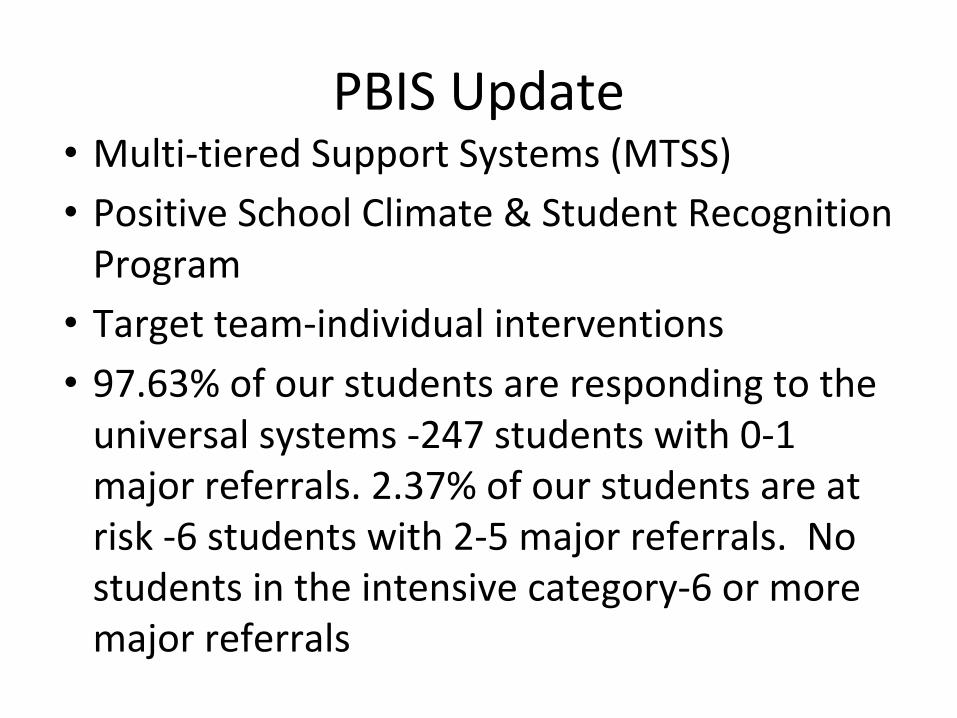
PBIS Update• Multi-tiered Support Systems (MTSS)
• Positive School Climate & Student Recognition Program
• Target team-individual interventions
• 97.63% of our students are responding to the universal systems -247 students with 0-1 major referrals. 2.37% of our students are at risk -6 students with 2-5 major referrals. No students in the intensive category-6 or more major referrals
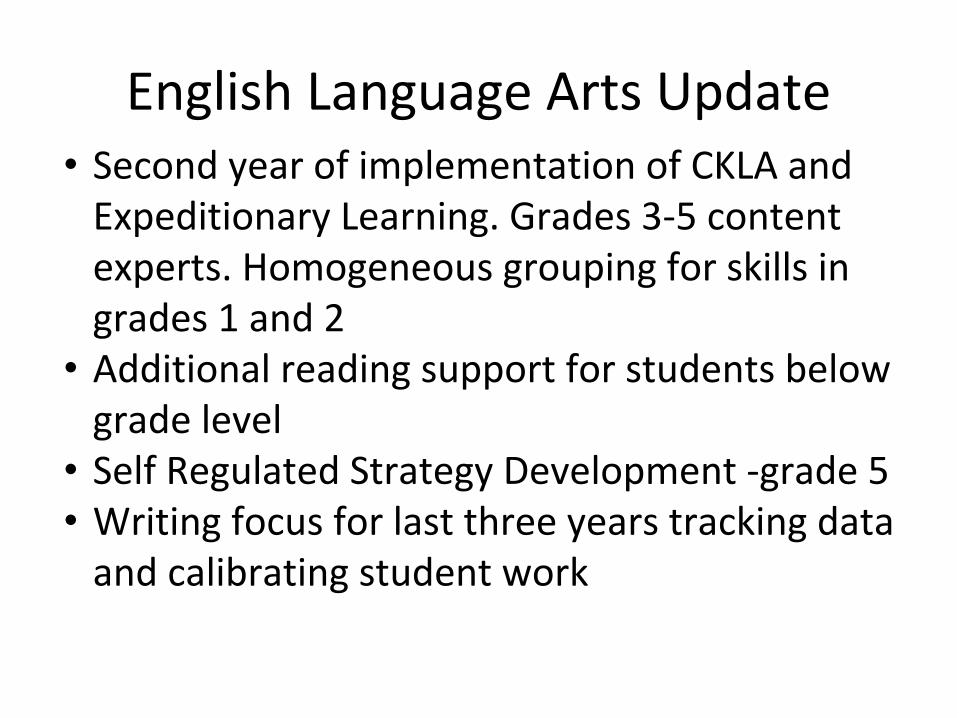
English Language Arts Update • Second year of implementation of CKLA and
Expeditionary Learning. Grades 3-5 content experts. Homogeneous grouping for skills in grades 1 and 2
• Additional reading support for students below grade level
• Self Regulated Strategy Development -grade 5• Writing focus for last three years tracking data
and calibrating student work
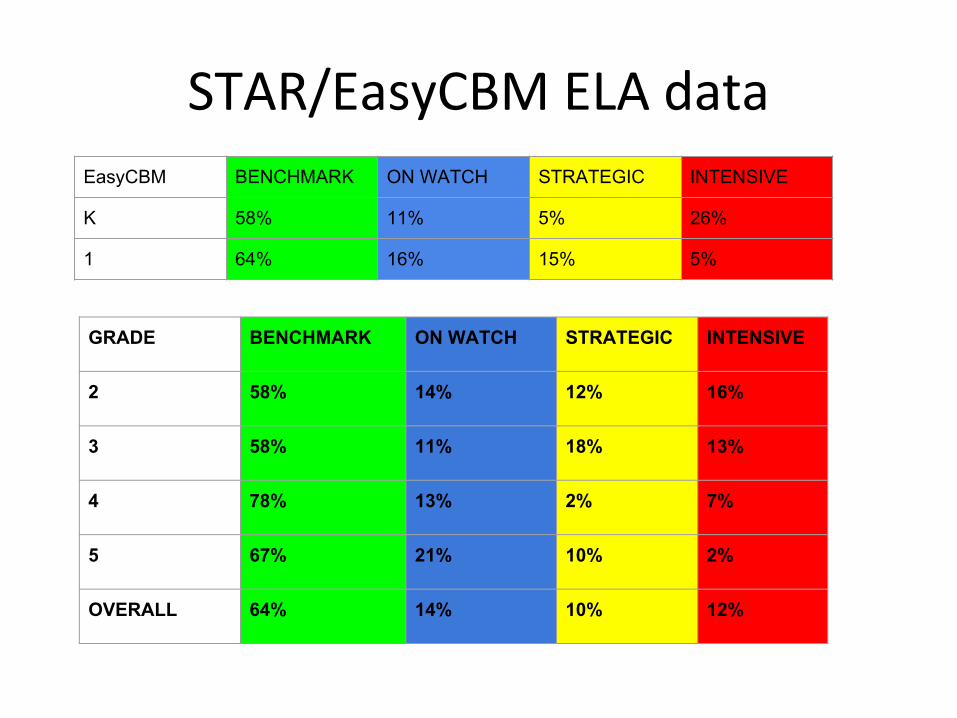
STAR/EasyCBM ELA data
GRADE BENCHMARK ON WATCH STRATEGIC INTENSIVE
2 58% 14% 12% 16%
3 58% 11% 18% 13%
4 78% 13% 2% 7%
5 67% 21% 10% 2%
OVERALL 64% 14% 10% 12%
EasyCBM BENCHMARK ON WATCH STRATEGIC INTENSIVE
K 58% 11% 5% 26%
1 64% 16% 15% 5%
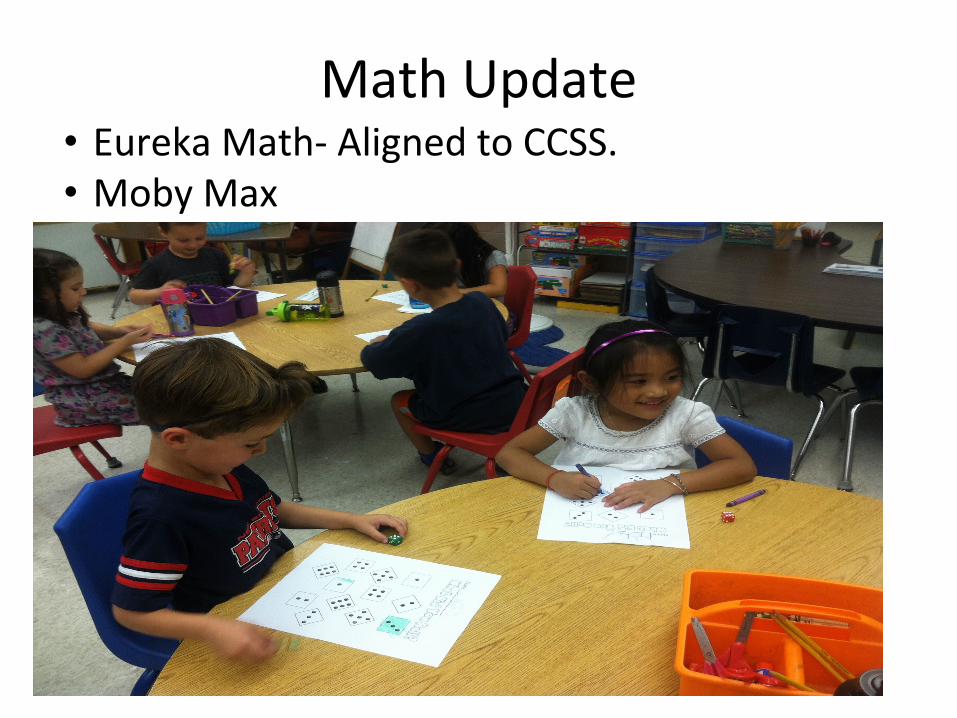
Math Update • Eureka Math- Aligned to CCSS. • Moby Max
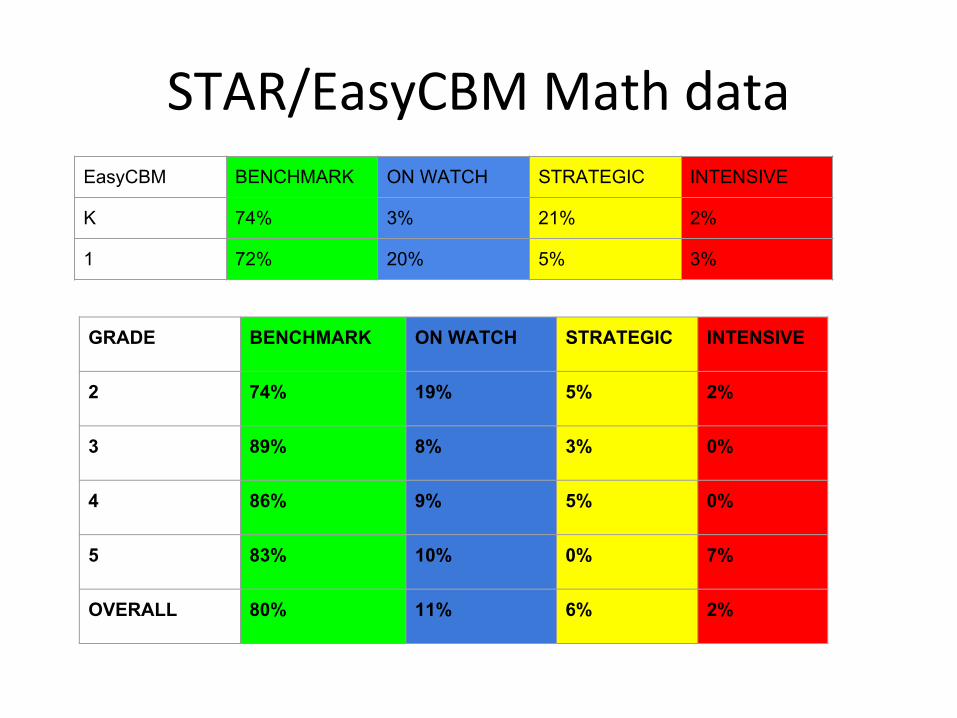
STAR/EasyCBM Math data
GRADE BENCHMARK ON WATCH STRATEGIC INTENSIVE
2 74% 19% 5% 2%
3 89% 8% 3% 0%
4 86% 9% 5% 0%
5 83% 10% 0% 7%
OVERALL 80% 11% 6% 2%
EasyCBM BENCHMARK ON WATCH STRATEGIC INTENSIVE
K 74% 3% 21% 2%
1 72% 20% 5% 3%
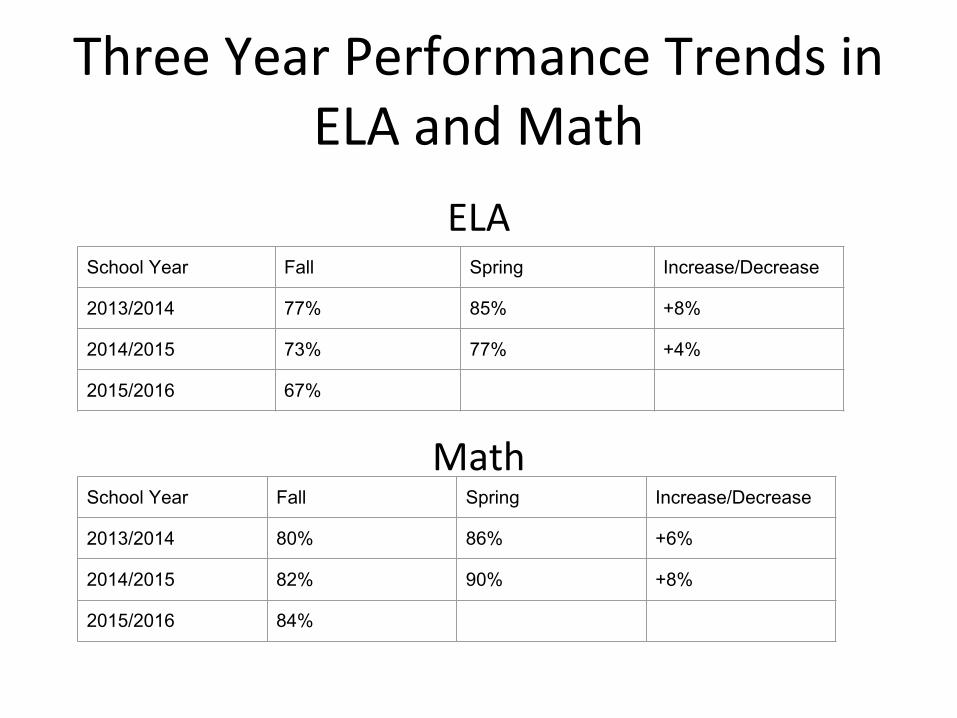
Three Year Performance Trends in ELA and Math
ELA
Math
School Year Fall Spring Increase/Decrease
2013/2014 77% 85% +8%
2014/2015 73% 77% +4%
2015/2016 67%
School Year Fall Spring Increase/Decrease
2013/2014 80% 86% +6%
2014/2015 82% 90% +8%
2015/2016 84%
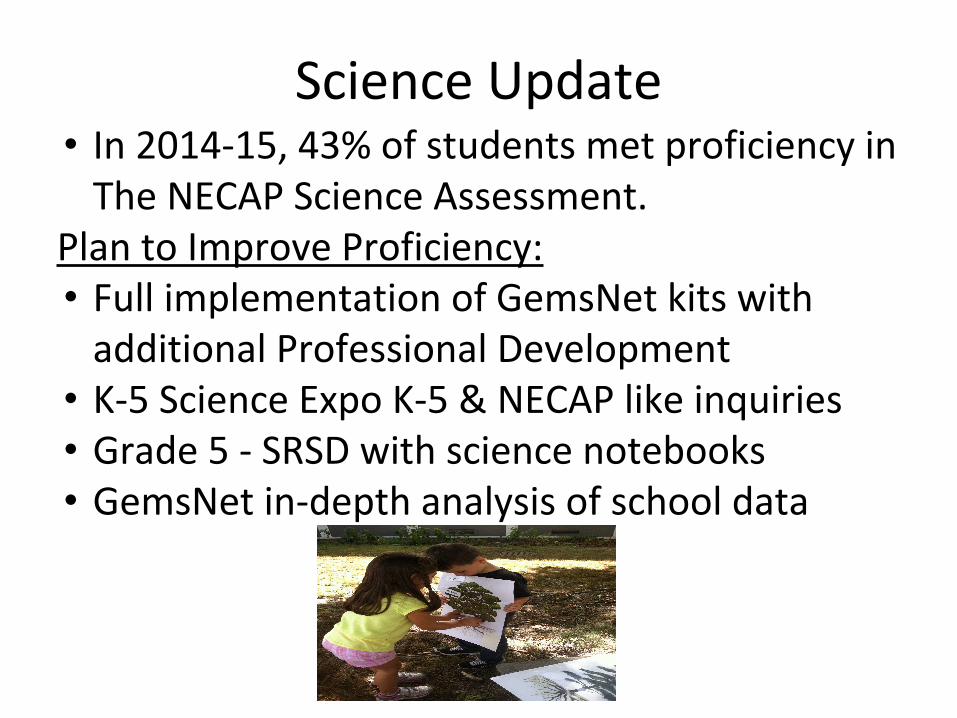
Science Update • In 2014-15, 43% of students met proficiency in
The NECAP Science Assessment.Plan to Improve Proficiency:• Full implementation of GemsNet kits with
additional Professional Development • K-5 Science Expo K-5 & NECAP like inquiries• Grade 5 - SRSD with science notebooks• GemsNet in-depth analysis of school data
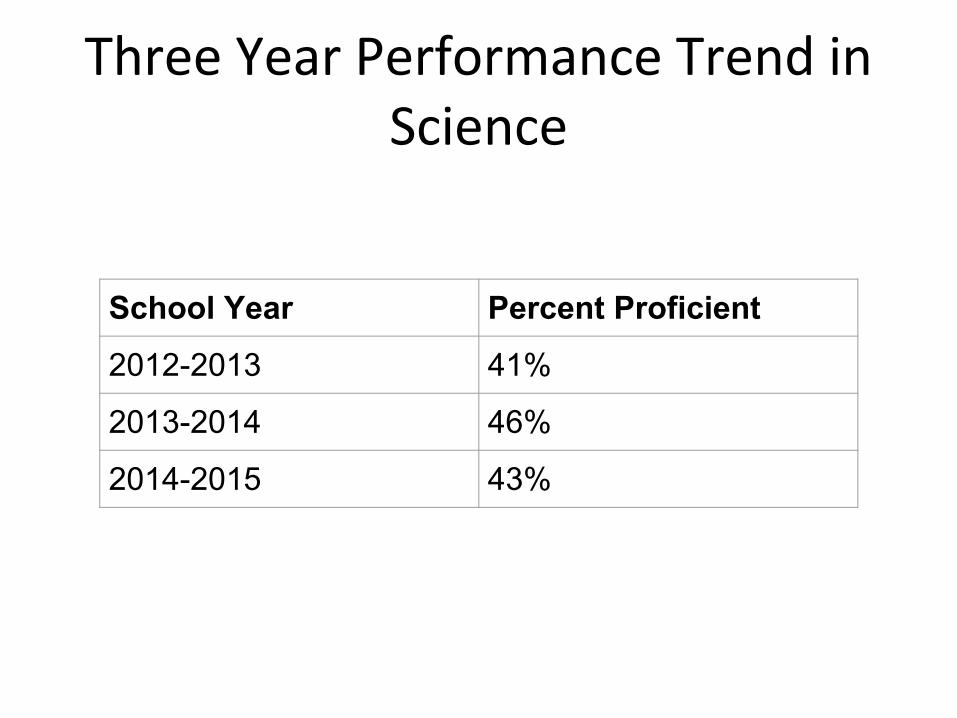
Three Year Performance Trend in Science
School Year Percent Proficient
2012-2013 41%
2013-2014 46%
2014-2015 43%
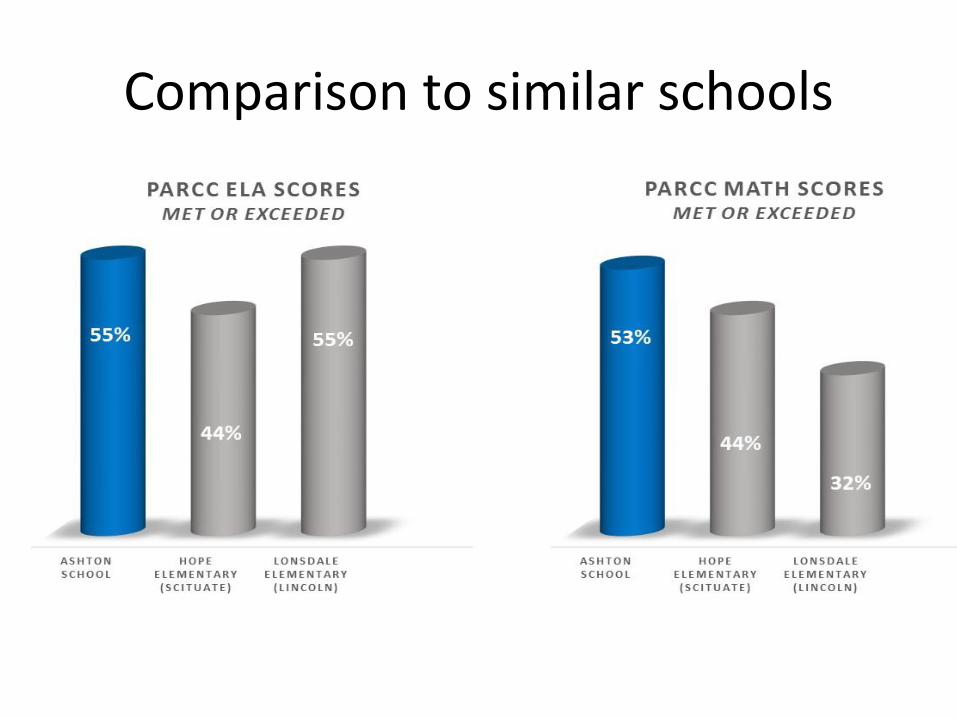
Comparison to similar schools
• How does your school compare to Lincoln and Smithfield in ELA, Math, and Science (send me data and we will create the chart for you if you like)
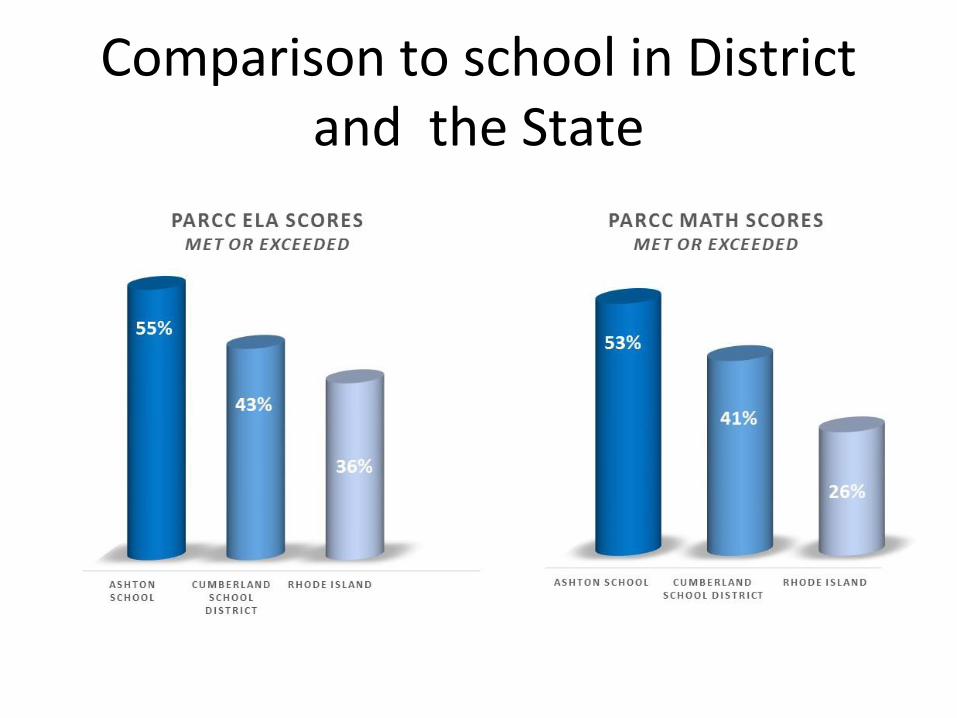
Comparison to school in District and the State
What is working? • PBIS• Thinking Maps K-5• Fidelity and consistency with curriculum
among classrooms and schools. • Teachers becoming experts in specific subjects
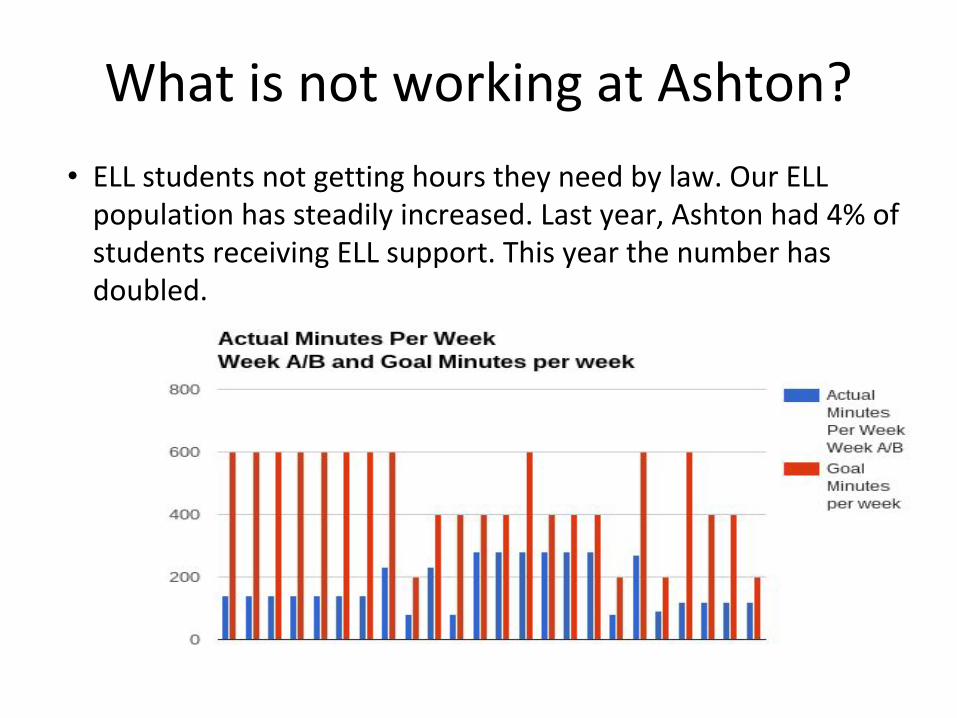
What is not working at Ashton?
• ELL students not getting hours they need by law. Our ELL population has steadily increased. Last year, Ashton had 4% of students receiving ELL support. This year the number has doubled.
What is not working at Ashton?
• Insufficient number of Special Educators and Paraprofessionals
• Teachers’ common planning time is not sufficient
• SRSD currently limited to grade 5• Insufficient substitute teachers
What do we need to succeed?• 1.0 ELL teacher • Implementation of SRSD school-wide (K-5)• Common planning time for the elementary
teachers to collaborate • Additional Special Education teacher or
Paraprofessional• Substitute teachers available when teachers
are absent• Technology to support blended learning
What is needed at the district level?
• Elementary schools need a technology plan & professional development in Google Classrooms as well as educational apps for blended learning and differentiation.
• Response to Intervention is not consistent between schools- need a district RTI coordinator with the expertise to guide this work
Thank you!