Embed Size (px)
Citation preview
1
ASHRAE’S NEW PERFORMANCE MEASUREMENT PROTOCOLS FOR
COMMERCIAL BUILDINGS
Jeff S. Haberl Hywel Davies Brendan Owens Bruce Hunn
Texas A&M University CIBSE USGBC ASHRAE
ABSTRACT
ASHRAE1, CIBSE
2and USGBC
3are
developing a standardized, consistent set of protocols
to facilitate the comparison of the measured
performance of buildings, especially those claimed to
be green, sustainable, and/or high performance. Such
protocols are needed because claims of high
performance cannot be credible without such
standardized protocols being applied consistently in
the U.S. as well as internationally. The protocols will
identify what is to be measured, how it is to be
measured (instrumentation and spatial resolution),
and how often it is to be measured. They will
address both the use and reporting of the measured
data, as well as appropriate benchmarks for each of
the following characteristics: Energy Use (site, and
source), Indoor Environmental Quality (IEQ)-
Thermal Comfort, IEQ-Indoor Air Quality, IEQ-
Lighting/Daylighting Quality, IEQ-Acoustics and
Water Use.
The primary users of the protocols document
will be building owners and facility managers, rating
and labeling system developers, government officials,
as well as architects and design engineers. To date, a
scoping document has been developed, an extensive
literature review has been performed (available on
ASHRAE’s web site), and a committee formed to
write the protocols, which are intended for
publication in January 2009.
INTRODUCTION
In the spring of 2005 the USGBC approached
ASHRAE to inquire about the development of
Performance Measurement Protocols for LEED4
buildings. In response to this inquiry ASHRAE,
CIBSE and USGBC formed a working group to
develop a scoping study to perform a preliminary
1 ASHRAE is the American Society of Heating, Refrigeration and
Air-Conditioning Engineers, Atlanta, Georgia.2 CIBSE is the Chartered Institution of Building Services
Engineers, London, England.3 USGBC is the United States Green Building Council,
Washington, D.C.4 LEED is the Leadership in Energy and Environmental Design
green building rating system of the USGBC.
survey of the relevant documents and develop
recommendations to ASHRAE Technology Council
regarding how to proceed. In January 2006 the
scoping study was completed (Haberl et al. 2006). It
identified the need to provide guidance regarding the
measurement and reporting of the performance of
new and existing commercial buildings. The scoping
study proposed a short-term and long-term effort to
accomplish this. In the short-term it was proposed
that a consensus ASHRAE protocol be developed for
rapid dissemination in an ASHRAE Special
Publication.
Over the long-term, an ASHRAE Standard or
Guideline was recommended by the Committee that
would be based on existing ASHRAE Standards,
Guidelines and other relevant documents that would
provide a consistent method of measuring, expressing
and comparing the energy use, water use, and indoor
environment of buildings. These documents would be
immediately useful to other organizations, including
the USGBC, CIBSE, AIA5, IES
6, USEPA
7, USDOE
8,
GSA9, the US Military, IEA
10, the European Union,
and other organizations interested in sustainable
design and performance.
In August 2007, ASHRAE joined with
USGBC and CIBSE to complete an extensive
literature survey, which surveyed over 400
documents that were analyzed and, with the help of
expert interviews, were ranked according to their
relevance to the protocols (McNeill et al. 2007).
Based on the survey of the literature, a committee of
industry experts was assembled to write the
protocols, or procedures for the performance
measurement of commercial buildings, including:
energy use, indoor environmental quality (IEQ:
thermal comfort, indoor air quality - IAQ, lighting,
acoustics), and water use (ASHRAE 2008).
5 AIA is the American Institute of Architects.6 IES is the Illuminating Engineering Society.7 USEPA is the United States Environmental Protection Agency.8 USDOE is the United States Department of Energy.9 GSA is the federal government’s General Services
Administration.10 IEA is the International Energy Agency.
ESL-IC-08-10-11
Proceedings of the Eighth International Conference for Enhanced Building Operations, Berlin, Germany, October 20-22, 2008

2
The resultant protocols are intended to
provide procedures for the performance measurement
of commercial buildings, including: energy use,
indoor environmental quality (i.e., thermal comfort,
Indoor Air Quality (IAQ), lighting, acoustics), and
water use. The protocols are meant for the
determination of the performance of an individual
building or facility. The energy protocols apply to all
forms of energy, including: electricity, gas, oil,
district heating/cooling, and renewables. The IEQ
protocols apply to thermal comfort, indoor air
quality, lighting, and acoustics. The water protocols
apply to individual facilities or meters. Cost and
resource information will also be discussed in each
section, as appropriate. The protocols are not
intended to provide: sampling methodologies used in
large-scale demand-side management programs;
metering standards, or major industrial loads.
The primary users of the protocols document
will be building owners and facility managers, rating
and labeling system developers, government officials,
as well as architects and design engineers. The
contents of the protocols will be written for these
professionals, however it must be written to be
understandable by owners, government officials and
decision makers, and others with little technical
background. Additional users include energy
researchers interested in whole building performance.
PERFORMANCE MEASUREMENT PROTOCOLS
Based in part on the experience gained from
the scoping document and the literature search, it was
decided to form a committee of recognized experts to
generate the material for the protocol. Table 1
contains a listing of the committee members that
were chosen to help with the protocols. For each of
the topical areas one or more experts were chosen to
generate the chapter that pertained to that material.
Overall reviewers and representatives of various
entities were also added to the committee to obtain an
industry-wide consensus.
Table 1: Performance Measurement Protocols Committee Members.
Jeff Haberl Chair, Energy Texas A & M University
Hywel Davies Vice-Chair, Energy CIBSE, UK
Bruce Hunn Staff Liaison ASHRAE
Lilas Pratt Staff ASHRAE
Brendan Owens USGBC Liaison USGBC
Klaus Sommer EU Representative Cologne Univ. of Applied Sciences
Karen Butler EPA/Energy Star EPA Energy Star Program
Mark Frankel USGBC/NBI Rep. New Buildings Institute
Mike MacDonald Energy Oak Ridge National Laboratory
Fred Bauman IEQ/Thermal Comfort Univ. of California, Berkeley
Gail Brager IEQ/Thermal Comfort Univ. of California, Berkeley
Ed Arens IEQ/Thermal Comfort Univ. of California, Berkeley
Barry Bridges IEQ/IAQ Sebesta Blomberg & Associates
Dave Marciniak IEQ/IAQ GSA
Fergus Nicol IEQ/IAQ Brookes College, Oxford
Richard Heinisch IEQ/Lighting Lithonia Lighting
Harvey Bryan IEQ/Lighting Arizona State Univ.
Curt Eichelberger IEQ/Acoustics Johnson Controls
Jim Bochat Water/NEEB Rep. Commissioning Concepts
Fred Goldner Water Energy Mgmt. & Research Assc.
John Swaffield Water Consultant, UK
The layout of the document was then
developed to include one chapter for each of the
relevant measurement areas (i.e., energy, IEQ-
thermal comfort, IAQ, lighting, acoustics, and water)
as well as an introduction, summary, references and
supporting appendices. Within each chapter authors
were asked to provide an introduction, three levels of
measurement methods (i.e., basic, intermediate and
advanced), a discussion of the relevant benchmarks,
other useful material and references. In the sections
that follow each of the chapters is discussed,
including a brief discussion of the three levels of
measurement.
ESL-IC-08-10-11
Proceedings of the Eighth International Conference for Enhanced Building Operations, Berlin, Germany, October 20-22, 2008

3
Chapter 1: Energy (Authors: MacDonald,
Haberl).
In Chapter 1 the protocols for measuring the
building’s energy use are presented. These protocols
begin with a collection of facility information and
whole-building, annual energy use using ASHRAE
Standard 105-2007 for the Level 1: basic method,
with suggested benchmarks such as the USEPA
Energy Star Portfolio Manager for buildings with
similar functions in similar climates. Table 2 is an
example of the type of information asked for in Form
1 of Standard 105. For Level 2, the protocols require
that Level 1 information be gathered and that a
monthly index be created for the whole-building
analysis. These monthly data can then be compared
to similar buildings in similar climates, or normalized
for weather conditions using ASHRAE’s Inverse
Model Toolkit (Haberl et al. 2003; Kissock et al.
2003).
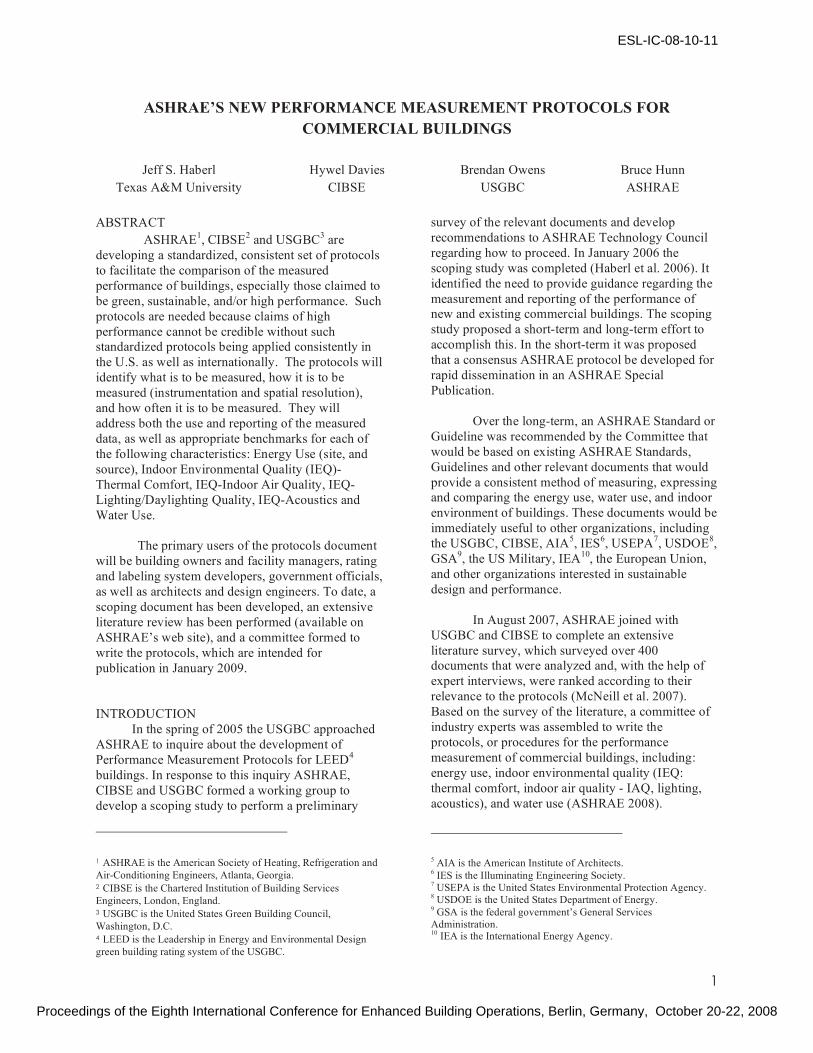
Figure 1 provides an example of a
temperature-dependent, four-parameter model
applied to the ASHRAE headquarters building in
Atlanta, Georgia using monthly utility billing data. In
Level 3: advanced methods, the user is required to
obtain all the information in Level 1 and then apply
the appropriate performance model from either a
whole-building daily model, component or sub-
system model, or calibrated simulation, using many
of the methods described in ASHRAE Guideline 14-
2002. For Level 3, depending upon the model chosen,
the benchmarks would be either similar equipment,
similar buildings or possibly
Table 2: ASHRAE Standard 105-2007 Form 1.
ESL-IC-08-10-11
Proceedings of the Eighth International Conference for Enhanced Building Operations, Berlin, Germany, October 20-22, 2008
4
0
500
1,000
1,500
2,000
2,500
3,000
3,500
10 20 30 40 50 60 70 80 90 100
Tdb (F)
ASHRAEHQBuilding ElectricUse
(Monthly -DailyAverageElectricUsevs.Tdb)
Monthly -DailyAvg. Data Model_Monthly -DailyAverage
Figure 1: ASHRAE Headquarters Building Whole Building Electric Energy Use (Monthly), Versus Monthly Average
Temperature (F), Including the Inverse Model Toolkit Four-Parameter (4-P) Model.
AASSHHRRAAEE HHQQ BBuuii llddiinngg EElleeccttrriicc
((DDaaii llyy EElleeccttrriicc UUssee vvss.. TTddbb)
0
500
1,000
1,500
2,000
2,500
3,000
3,500
10 20 30 40 50 60 70 80 90 100
TTddbb ((FF)
EEllee
ccttrrii
ccUU
ssee
((kkWW
hh//dd
aayy
))
Weekdays Saturdays Sundays
Holidays Weekdays Model Weekends Model
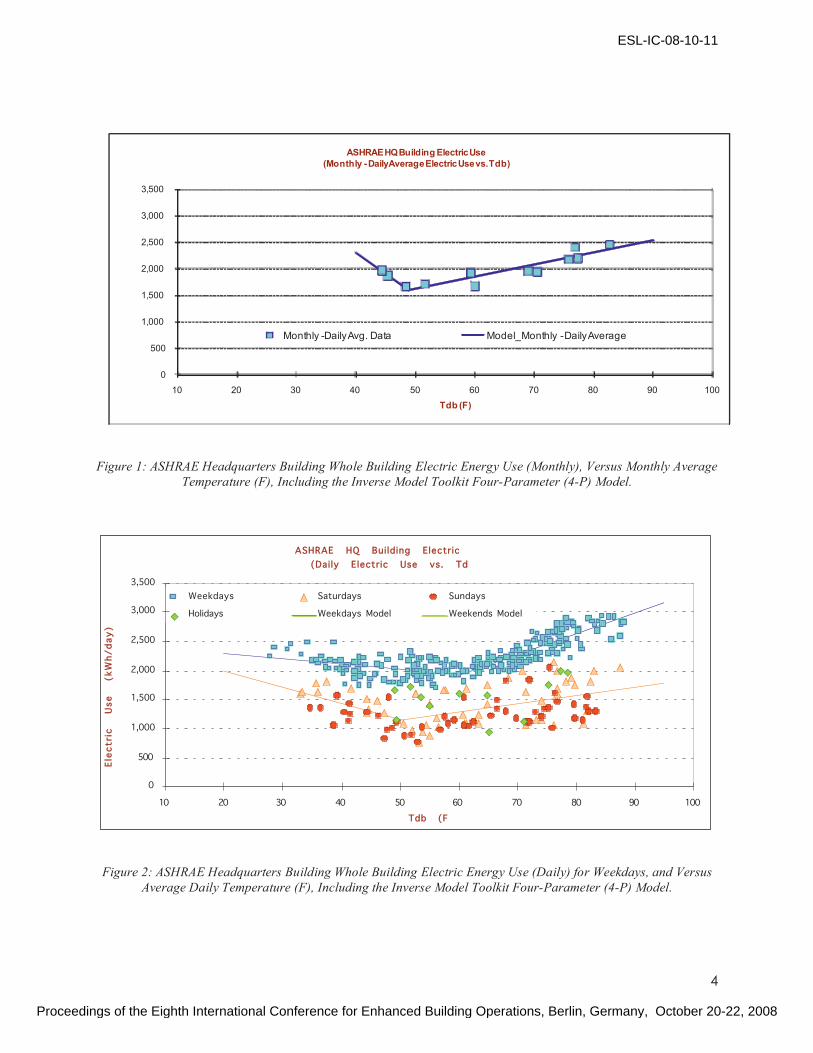
Figure 2: ASHRAE Headquarters Building Whole Building Electric Energy Use (Daily) for Weekdays, and Versus
Average Daily Temperature (F), Including the Inverse Model Toolkit Four-Parameter (4-P) Model.
ESL-IC-08-10-11
Proceedings of the Eighth International Conference for Enhanced Building Operations, Berlin, Germany, October 20-22, 2008

5
0.0
0.5
1.0
1.5
2.0
2.5
3.0
0.0 100.0 200.0 300.0 400.0 500.0 600.0
Chiller Load (Tons)
Ch
ille
rE
ffic
ien
cy
(kW
/to
n)
Data TriQuad
Figure 3: Example chiller analysis. Chiller performance plot of chiller efficiency (kW/ton) versus the chiller cooling
load. In this figure a tri-quadratic chiller model (R2
= 83.7%) is shown.
Figure 4: Example Architectural Rendering of the Robert E. Johnson Building, Austin, Texas.
ESL-IC-08-10-11
Proceedings of the Eighth International Conference for Enhanced Building Operations, Berlin, Germany, October 20-22, 2008
6
simulated data from design standards.
Figure 2 provides an example of a Level 3, whole-
building analysis applied to the daily electricity use
of the ASHRAE headquarters buildings for the same
period as Figure 3 provides an example chiller
analysis that shows measured data (kW/ton) and a
performance model constructed with a tri-quadratic
chiller model. Figure 4 provides an example of an
architectural rendering of the computer simulation
input file, which is used to verify the appropriate
positioning and placement of surfaces, shading, etc.,
during the calibration of the simulation program.
Chapter 2: Thermal Comfort (Authors:
Bauman, Brager, Arens).
In Chapter 2 protocols are presented for the
measurement of thermal comfort, which rely to a
large extent on the published work of the Center for
the Built Environment at the University of California
at Berkeley (CBE), and the Lawrence Berkeley
National Laboratory (LBNL). In Level 1 information
about the thermal comfort of a buildings relies on
operator or occupant surveys and spot measurements
(Tdb, RH, MRT, Vair), that can then be compared to
benchmarks such as those published by the CBE. In
Level 2, in addition to Level 1 information, the user
performs “right now” surveys near to the occupant
using 1-5 minute data logger measurements to
document temporal comfort conditions (Tdb, RH,
MRT, Vair) and uses ASHRAE Standard 55 or the
results of ASHRAE Research Project 887 as
benchmarks. In Level 3, in addition to the
information in Level 1, the user performs continuous
1-5 minute data logger measurements at multiple
heights to document temporal comfort conditions
(Tdb, RH, MRT, Vair) and uses ASHRAE Standard
55, Predicted Mean Vote (PMV), for comparison of
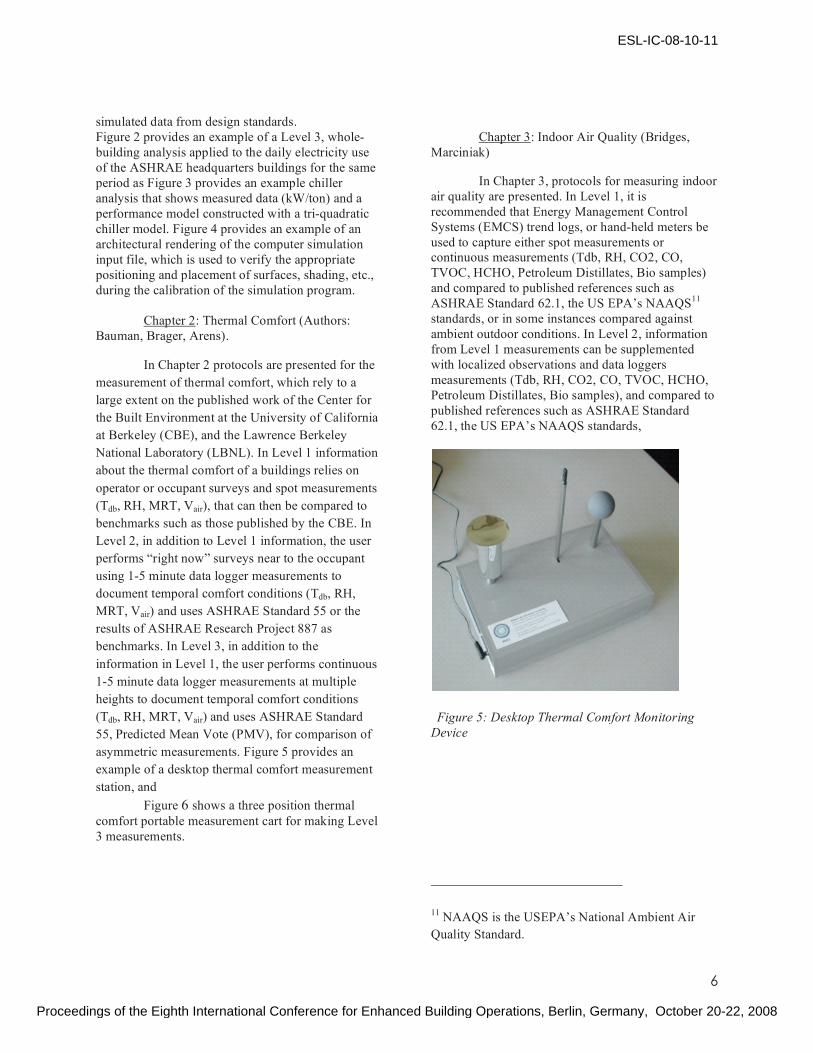
asymmetric measurements. Figure 5 provides an
example of a desktop thermal comfort measurement
station, and
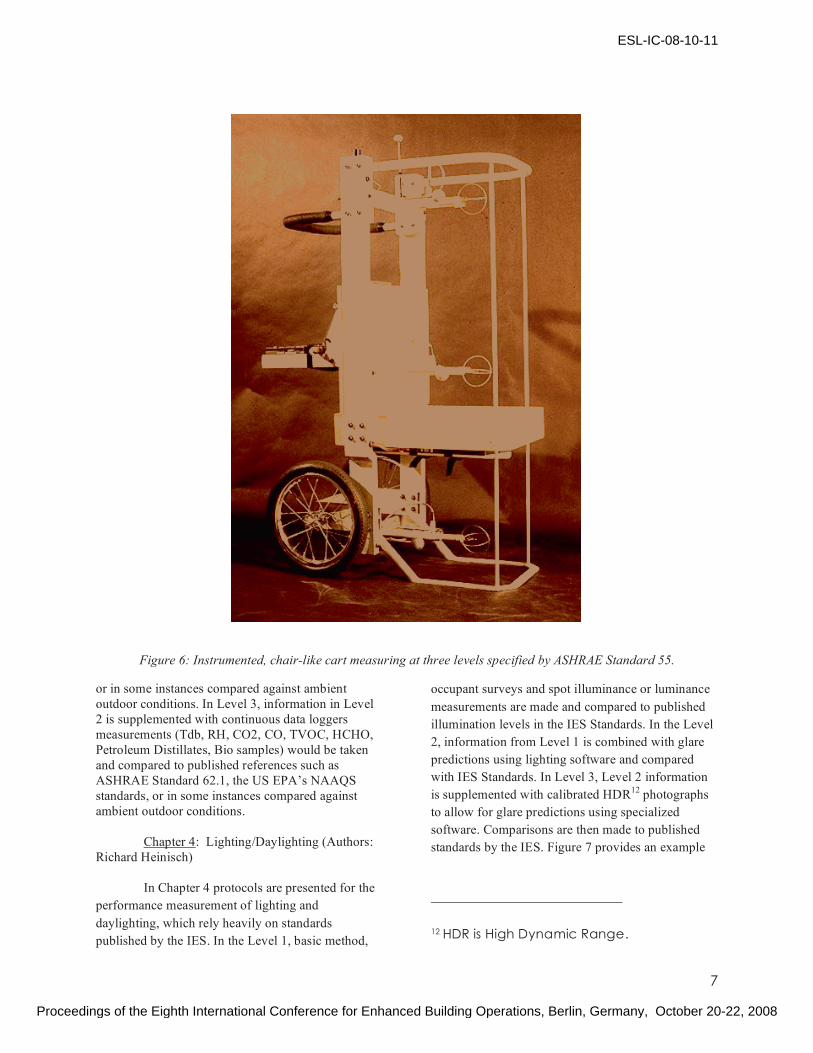
Figure 6 shows a three position thermal
comfort portable measurement cart for making Level
3 measurements.
Chapter 3: Indoor Air Quality (Bridges,
Marciniak)
In Chapter 3, protocols for measuring indoor
air quality are presented. In Level 1, it is
recommended that Energy Management Control
Systems (EMCS) trend logs, or hand-held meters be
used to capture either spot measurements or
continuous measurements (Tdb, RH, CO2, CO,
TVOC, HCHO, Petroleum Distillates, Bio samples)
and compared to published references such as
ASHRAE Standard 62.1, the US EPA’s NAAQS11
standards, or in some instances compared against
ambient outdoor conditions. In Level 2, information
from Level 1 measurements can be supplemented
with localized observations and data loggers
measurements (Tdb, RH, CO2, CO, TVOC, HCHO,
Petroleum Distillates, Bio samples), and compared to
published references such as ASHRAE Standard
62.1, the US EPA’s NAAQS standards,
Figure 5: Desktop Thermal Comfort Monitoring
Device
11NAAQS is the USEPA’s National Ambient Air
Quality Standard.
ESL-IC-08-10-11
Proceedings of the Eighth International Conference for Enhanced Building Operations, Berlin, Germany, October 20-22, 2008
7
Figure 6: Instrumented, chair-like cart measuring at three levels specified by ASHRAE Standard 55.
or in some instances compared against ambient
outdoor conditions. In Level 3, information in Level
2 is supplemented with continuous data loggers
measurements (Tdb, RH, CO2, CO, TVOC, HCHO,
Petroleum Distillates, Bio samples) would be taken
and compared to published references such as
ASHRAE Standard 62.1, the US EPA’s NAAQS
standards, or in some instances compared against
ambient outdoor conditions.
Chapter 4: Lighting/Daylighting (Authors:
Richard Heinisch)
In Chapter 4 protocols are presented for the
performance measurement of lighting and
daylighting, which rely heavily on standards
published by the IES. In the Level 1, basic method,
occupant surveys and spot illuminance or luminance
measurements are made and compared to published
illumination levels in the IES Standards. In the Level
2, information from Level 1 is combined with glare
predictions using lighting software and compared
with IES Standards. In Level 3, Level 2 information
is supplemented with calibrated HDR12
photographs
to allow for glare predictions using specialized
software. Comparisons are then made to published
standards by the IES. Figure 7 provides an example
12 HDR is High Dynamic Range.
ESL-IC-08-10-11
Proceedings of the Eighth International Conference for Enhanced Building Operations, Berlin, Germany, October 20-22, 2008
8
of commercial illuminance and luminance meters.
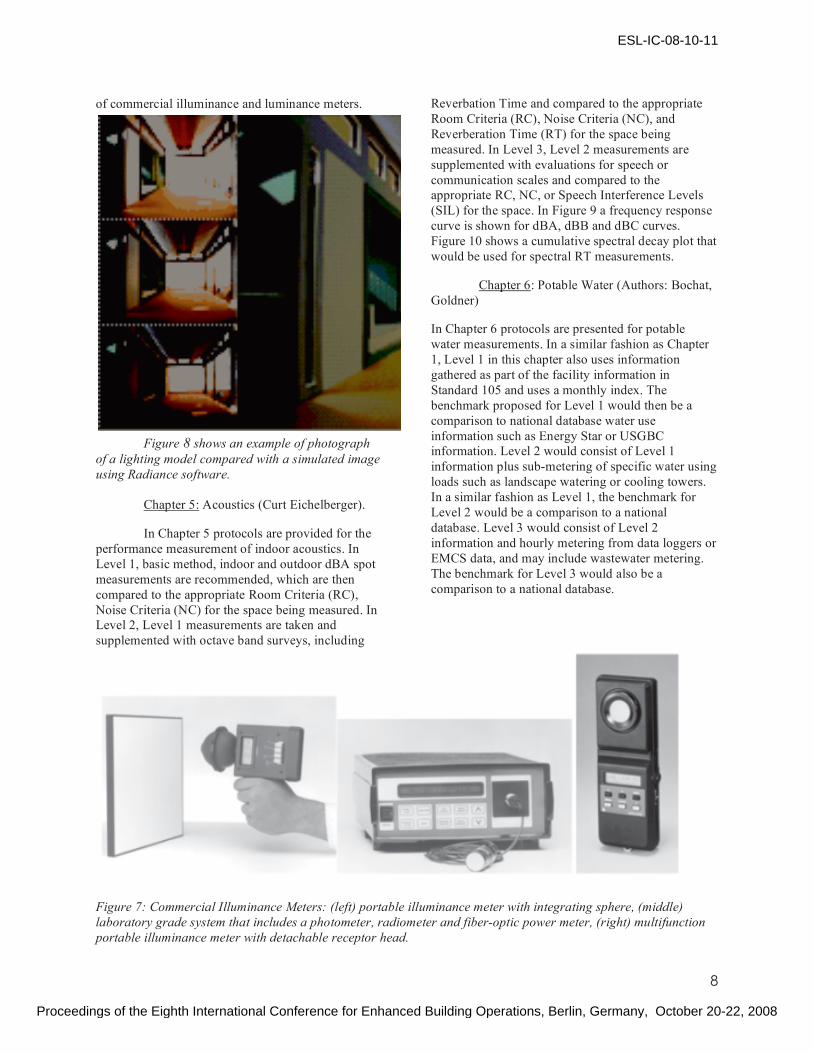
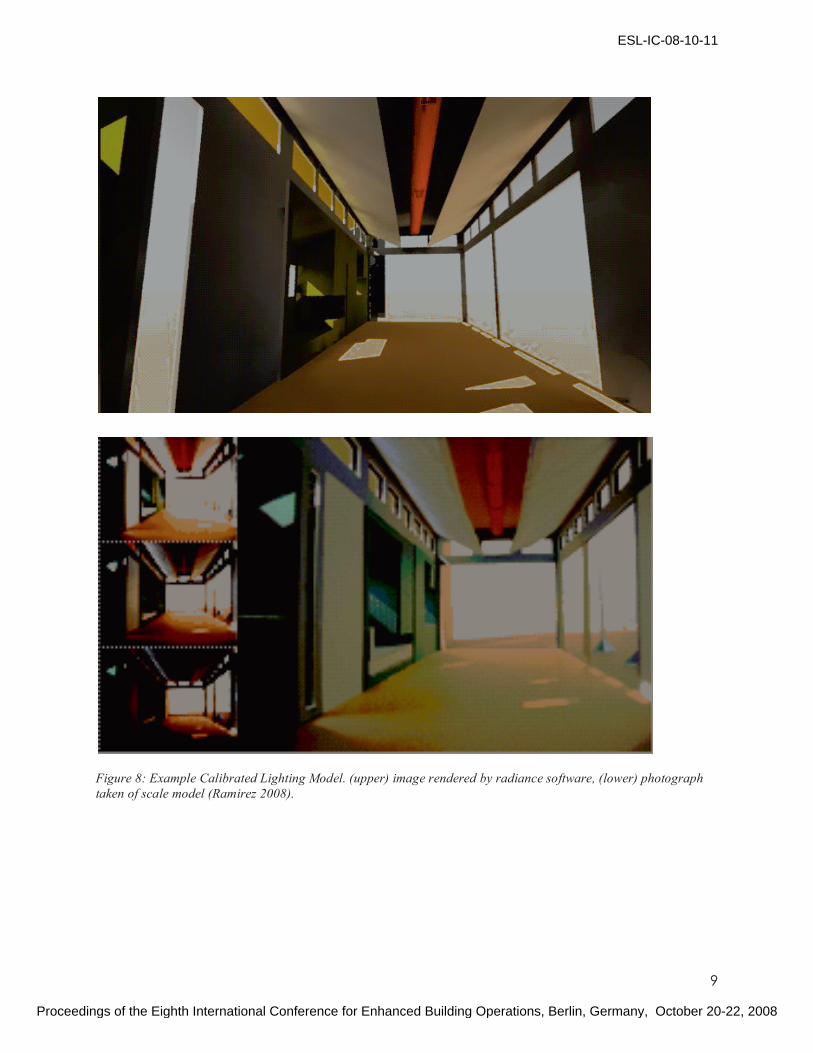
Figure 8 shows an example of photograph
of a lighting model compared with a simulated image
using Radiance software.
Chapter 5: Acoustics (Curt Eichelberger).
In Chapter 5 protocols are provided for the
performance measurement of indoor acoustics. In
Level 1, basic method, indoor and outdoor dBA spot
measurements are recommended, which are then
compared to the appropriate Room Criteria (RC),
Noise Criteria (NC) for the space being measured. In
Level 2, Level 1 measurements are taken and
supplemented with octave band surveys, including
Reverbation Time and compared to the appropriate
Room Criteria (RC), Noise Criteria (NC), and
Reverberation Time (RT) for the space being
measured. In Level 3, Level 2 measurements are
supplemented with evaluations for speech or
communication scales and compared to the
appropriate RC, NC, or Speech Interference Levels
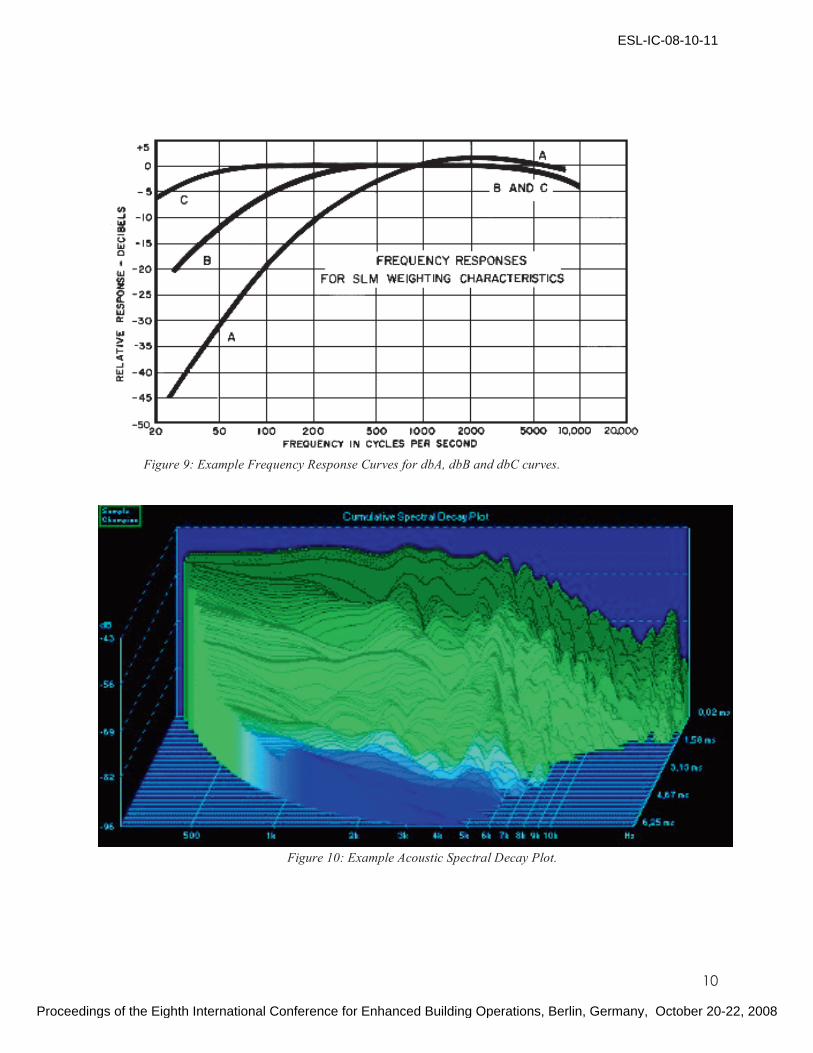
(SIL) for the space. In Figure 9 a frequency response
curve is shown for dBA, dBB and dBC curves.
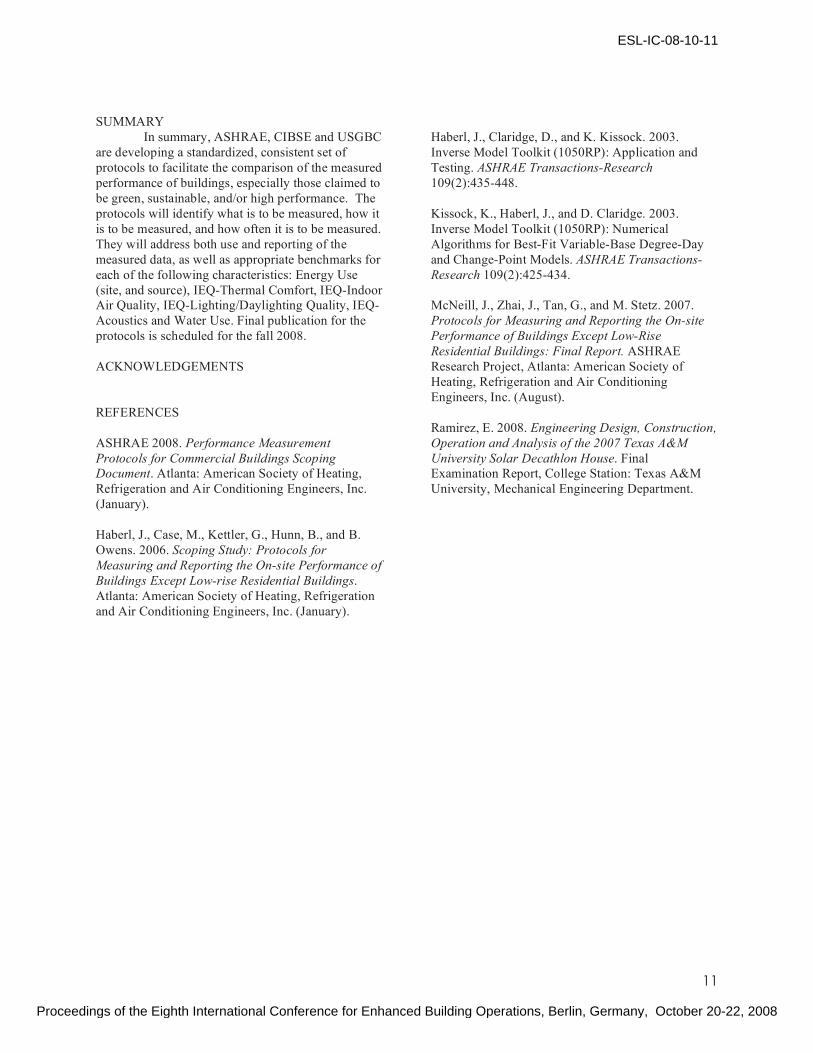
Figure 10 shows a cumulative spectral decay plot that
would be used for spectral RT measurements.
Chapter 6: Potable Water (Authors: Bochat,
Goldner)
In Chapter 6 protocols are presented for potable
water measurements. In a similar fashion as Chapter
1, Level 1 in this chapter also uses information
gathered as part of the facility information in
Standard 105 and uses a monthly index. The
benchmark proposed for Level 1 would then be a
comparison to national database water use
information such as Energy Star or USGBC
information. Level 2 would consist of Level 1
information plus sub-metering of specific water using
loads such as landscape watering or cooling towers.
In a similar fashion as Level 1, the benchmark for
Level 2 would be a comparison to a national
database. Level 3 would consist of Level 2
information and hourly metering from data loggers or
EMCS data, and may include wastewater metering.
The benchmark for Level 3 would also be a
comparison to a national database.
Figure 7: Commercial Illuminance Meters: (left) portable illuminance meter with integrating sphere, (middle)
laboratory grade system that includes a photometer, radiometer and fiber-optic power meter, (right) multifunction
portable illuminance meter with detachable receptor head.
ESL-IC-08-10-11
Proceedings of the Eighth International Conference for Enhanced Building Operations, Berlin, Germany, October 20-22, 2008
9
Figure 8: Example Calibrated Lighting Model. (upper) image rendered by radiance software, (lower) photograph
taken of scale model (Ramirez 2008).
ESL-IC-08-10-11
Proceedings of the Eighth International Conference for Enhanced Building Operations, Berlin, Germany, October 20-22, 2008
10
Figure 9: Example Frequency Response Curves for dbA, dbB and dbC curves.
Figure 10: Example Acoustic Spectral Decay Plot.
ESL-IC-08-10-11
Proceedings of the Eighth International Conference for Enhanced Building Operations, Berlin, Germany, October 20-22, 2008
11
SUMMARY
In summary, ASHRAE, CIBSE and USGBC
are developing a standardized, consistent set of
protocols to facilitate the comparison of the measured
performance of buildings, especially those claimed to
be green, sustainable, and/or high performance. The
protocols will identify what is to be measured, how it
is to be measured, and how often it is to be measured.
They will address both use and reporting of the
measured data, as well as appropriate benchmarks for
each of the following characteristics: Energy Use
(site, and source), IEQ-Thermal Comfort, IEQ-Indoor
Air Quality, IEQ-Lighting/Daylighting Quality, IEQ-
Acoustics and Water Use. Final publication for the
protocols is scheduled for the fall 2008.
ACKNOWLEDGEMENTS
REFERENCES
ASHRAE 2008. Performance Measurement
Protocols for Commercial Buildings Scoping
Document. Atlanta: American Society of Heating,
Refrigeration and Air Conditioning Engineers, Inc.
(January).
Haberl, J., Case, M., Kettler, G., Hunn, B., and B.
Owens. 2006. Scoping Study: Protocols for
Measuring and Reporting the On-site Performance of
Buildings Except Low-rise Residential Buildings.
Atlanta: American Society of Heating, Refrigeration
and Air Conditioning Engineers, Inc. (January).
Haberl, J., Claridge, D., and K. Kissock. 2003.
Inverse Model Toolkit (1050RP): Application and
Testing. ASHRAE Transactions-Research
109(2):435-448.
Kissock, K., Haberl, J., and D. Claridge. 2003.
Inverse Model Toolkit (1050RP): Numerical
Algorithms for Best-Fit Variable-Base Degree-Day
and Change-Point Models. ASHRAE Transactions-
Research 109(2):425-434.
McNeill, J., Zhai, J., Tan, G., and M. Stetz. 2007.
Protocols for Measuring and Reporting the On-site
Performance of Buildings Except Low-Rise
Residential Buildings: Final Report. ASHRAE
Research Project, Atlanta: American Society of
Heating, Refrigeration and Air Conditioning
Engineers, Inc. (August).
Ramirez, E. 2008. Engineering Design, Construction,
Operation and Analysis of the 2007 Texas A&M
University Solar Decathlon House. Final
Examination Report, College Station: Texas A&M
University, Mechanical Engineering Department.
ESL-IC-08-10-11
Proceedings of the Eighth International Conference for Enhanced Building Operations, Berlin, Germany, October 20-22, 2008