Embed Size (px)
Citation preview

ASHRAE Student Design Competition 2015
HVAC System Selection
University of Nebraska
Team NUE (Nebraska University Engineering) Air

4th year Architectural
Engineering Student
(402) 770-9860
Brianna
Brass4th year Architectural
Engineering Student
(407) 252-8409
Matthew
Easlon4th year Architectural
Engineering Student
(402) 707-5029
Mary
Kleinsasser4th year Architectural
Engineering Student
(402) 536-9115
Ben
MacKenzie4th year Architectural
Engineering Student
(402) 730-1982
Rachel
Obenland
NUE Air: Team Members

Industry Advisers
NUE Air: ASHRAE Mentors
PE, FPE, LEED AP BD+C
Healthcare Facility Design
Professional
Specialized Engineering
Solutions
(402) 991-5520
Joe T.
Hazel
P.E., LEED BD+C
Associate, Mechanical Project
Engineer
Leo A. Daly
(402) 391-8111
Daniel A.
Karnes
Ph.D., P.E.
Assistant Professor
Durham School of Architectural
Engineering and Construction
University of Nebraska -
Lincoln
(402) 554-4176
David P.
Yuill
Faculty Adviser

Table of Contents
Section 1.0: Executive Summary (1)
Section 2.0: Introduction (2)
2.1: Building Description (2)
2.2: Owner’s Requirements (2)
2.3: Reference Standards (2)
2.3.1: ASHRAE Standard 55 (2)
2.3.2: ASHRAE Standard 62.1 (2)
2.3.3: ASHRAE Standard 90.1 (2)
2.3.4: ASHRAE Standard 189.1 (2)
2.3.5: ASHRAE GreenGuide (2)
Section 3.0: Design Parameters (3)
3.1: Weather Data (3)
3.2: Outdoor Design Conditions (3)
3.3: Indoor Design Conditions (3)
3.4: Ventilation Requirements (3)
3.5: Hours of Operation (3)
3.6: Utility Rates (3)
Section 4.0: Design Goals (4 - 8)
4.1: Low Life Cycle Cost (4)
4.2: Low Environmental Impact (4)
4.3: Comfort and Indoor Environmental Quality (4)
4.4: Creative High Performance Green Design (5)
4.5: Synergy with Architecture (5)
4.6: High Efficiency (6)
4.7: Sustainability (6)
4.8: Reliability (7)
4.9: Noise Control (7)
4.10: LEED (8)
Section 5.0: Building Design (9)
5.1: Building Orientation (9)
5.2: Shading (9)
5.3: Envelope Assumptions (9)
Section 6.0: Load Calculations (10 – 11)
6.1: Modeling Software (10)
6.2: Zoning (10)
6.3: Pressurization (11)
6.4: Baseline (11)
Section 7.0: Major System Components (12)
7.1: VAV Air Handling System (12)
7.2: Fan Coil Units with Dedicated Outside Air System (12)
7.3: Water Source Heat Pump System (12)
7.4: Thermal Ice Storage (12)
7.5: Seawater Loop Field (12)
Section 8.0: Systems Considered (13)
8.1: Option 1 - VAV Air Handling System utilizing Thermal Ice
Storage (13)
8.2: Option 2 - Fan Coil Units with Dedicated Outside Air
System utilizing Thermal Ice Storage (13)
8.3: Option 3 - Water Source Heat Pump System utilizing a
Closed Seawater Loop Field (13)
Section 9.0: Cost (14)
9.1: Life Cycle Cost Analysis for each system (14)
9.2: Initial Cost (14)
9.3: Operating Cost (14)
9.4: Maintenance and Repair Cost (14)
Section 10.0: Decision Matrix (16)
Section 10.1: Decision Matrix Description (16)
Section 11.0: Selected System (17)
11.1: System Description (17)
Section 12.0: Conclusion (17)
12.1: Recommendation (17)
References (18)
Appendix A: Zoning Diagrams (19)
Appendix B: System Schematics (20 - 22)
B.1: Option 1 - VAV Air Handling System utilizing Thermal Ice
Storage (20)
B.2: Option 2 - Fan Coil Units with Dedicated Outside Air
System utilizing Thermal Ice Storage (20)
B.3: Option 3 - Water Source Heat Pump System utilizing a
Closed Seawater Loop Field (21)
B.4: One-Line Diagram (22)
B.5: Pressurization Diagram (22)
Appendix C: Life Cycle Cost Analysis (23 - 25)
Appendix D: Hand Calculations (26)
D.1: From Section 3.1: Weather Data - Dry climate calculation (26)
D.2: From Section 4.4: Creative High Performance Green
Design - Water fountain spray cooling tower calculation (26)
D.3: From Section 6.1: Modeling Software - Curtain wall
U-value calculations (26)
Appendix E: Noise Control Calculations (27)
E1.1: NC-35 compliant path report for air supplied at 350ft/min (27)
E1.2 NC-30 compliance path report for air supplied at 300ft/min (27)
E2.1: Shop to office transmission loss path report (27)
Table 3.1: Cooling and Heating Design Conditions (3)
Table 3.2: Indoor Design Conditions (3)
Table 3.3: Hours of Operation (3)
Table 3.4: Utility Rates (3)
Table 4.1: Total Building Energy (4)
Table 4.2: Noise Criteria (7)
Table 4.3: LEED Points (8)
List of Tables(labeled according to appearance within each report section)
List of Figures(labeled according to appearance within each report section)
Figure 2.1: Junior College in Doha, Qatar (2)
Figure 3.1: Daily High and Low Temperatures (3)
Figure 4.1: Acceptable range of operative temperature and humidity (4)
Figure 4.2: Water Fountain Spray Cooling Tower (5)
Figure 4.3: Lag of Water Temperature (5)
Figure 4.4: PV Louver Location (5)
Figure 4.5: PV Louver Representation (6)
Figure 4.6: Water fountain spray cooling tower at the Museum of Islamic Art in Doha, Qatar (6)
Figure 4.7: NC curve for space air supplied at 350ft/min (7)
Figure 4.8: NC curve for space air supplied at 300ft/min (7)
Figure 4.9: Sound Transmission Source and Receiver Spaces Defined (7)
Figure 5.1: Required LEED orientation (9)
Figure 5.2: Louver shading system (9)
Figure 6.1: Distribution of Building Load (10)
Figure 6.2: Welding hood (11)
Figure 6.3: Cone hood flexible exhaust connection (11)
Figure 6.4: Donaldson Torit Filter Unit (11)
Figure 9.1: Initial, Operating, and Maintenance Cost (14)
Figure 9.2: Life Cycle Cost (14)
Figure 10.1: Decision Matrix (16)
Figure 11.1: Junior College in Doha, Qatar (17)

1.0: Executive Summary
The purpose of this report is to analyze, compare, and select the most appropriate heating,
ventilation, and air conditioning (HVAC) system for a new three-story junior college located in
Doha, Qatar. This facility houses classrooms, administration spaces, faculty offices, special
instruction areas, and information technology areas. The building consists of approximately
48,000 square feet distributed on three levels, including woodworking/carpentry shop and
welding shop spaces on the first level.
The challenge of this system selection process includes fulfilling the requirements of the
Owner’s Project Requirements (OPR) while meeting ASHRAE Standards. The Owner requires
that the system provide a sustainable design, taking into account energy efficiency, indoor
environmental quality and safety, occupant comfort, functionality, longevity, flexibility,
serviceability, and maintainability. The selected system shall have the lowest life cycle cost
among the system options. Additionally, the owner requests that the energy consumption of
the building is reduced at least 15% more than required by ASHRAE Standard 90.1.
Load calculations and an energy simulation were completed using Trane TRACE 700. To
determine the best HVAC system for the building, three different systems were considered.
The first simulation in TRACE was performed on the ASHRAE Standard 90.1 Baseline system
of a packaged variable air volume DX cooling rooftop unit, with variable air volume hot water
reheat terminal units. Three other systems that fulfill the owner’s requirements were analyzed
and compared to both the Baseline and each other. These systems are:
Option 1 – VAV air handling system with electric reheat and a chiller utilizing thermal
ice storage with a water fountain spray cooling tower
Option 2 – Fan coil units with dedicated outside air system and a chiller utilizing
thermal ice storage with a water fountain spray cooling tower
Option 3 – Water source heat pump system with dedicated outside air system, utilizing
a closed seawater loop field
To compare the systems, a decision matrix was created including categories of initial cost, life
cycle cost, temperature control, humidity control, controllability, indoor air quality, system
reliability, design flexibility, spatial requirement, noise, sustainability, high performance building
compliance, maintenance requirement, and synergy with architecture. The HVAC system with
the highest point value was selected.
Based on this analysis, Option 3 - the water source heat pump system with dedicated outside
air system, utilizing a closed seawater loop field - is the most appropriate HVAC system for the
new junior college in Doha, Qatar. This system showed a 44% energy improvement over the
Baseline. This system is projected to cost $3.8 million over a 50 year period, which is $695,000
less than Option 1 - VAV air handling system with thermal ice storage - and $220,600 less than
Option 2 - FCU with thermal ice storage.
Design Goals
System Modeling
System Analysis
Compilation of Results
Professional Review
Design Goals:
Fully
understanding the
owner’s design
objectives in order
to select an HVAC
system that best
fits the building’s
needs, while
maintaining
efficient and
unique design.
System Modeling:
An accurate model
serves as the
foundation for the
entire system
selection process.
All models were
reviewed
thoroughly to
ensure accuracy in
this critical section.
System Analysis:
A rigorous matrix-
based analysis
process was
applied to all
systems. System
function, efficiency,
and environmental
impact were a few
of the many
categories used to
compare the
different systems.
Compilation of
Results:
Team NUE Air
went through many
revisions to ensure
a clear, concise,
and organized
deliverable was
produced to
convey the results
to the owner.
Professional
Review:
The submission of
an accurate
product is
paramount within
the engineering
industry. The
validity of the
deliverable was
ensured by
professional
industry review.
1
Team NUE Air’s design process flows as follows: establish design goals, model three system options, analyze the
systems, compile appropriate results, and review the results with industry professionals. This process is summarized
below. Each section of this report is summarized below.
Section 2.0: Introduction identifies the building, the owner’s requirements, and the ASHRAE standards that require
compliance.
Section 3.0: Design Parameters introduces the conditions to which each system option is designed.
Section 4.0: Design Goals outlines Team NUE Air’s goals in designing each system option. This section also specifies
and explains elements of the design that comply with these goals.
Section 5.0: Building Design defines elements of the building that directly affect the design of the building’s HVAC
system.
Section 6.0: Load Calculations describes Team NUE Air’s method for modeling the building in Trace TRACE 700.
Section 7.0: Major System Components details major components that are combined in various manners to compose
each system option.
Section 8.0: Systems Considered establishes Team NUE Air’s three system options.
Section 9.0: Cost outlines the life cycle cost analysis for each of the three system options.
Section 10.0: Decision Matrix describes Team NUE Air’s detailed decision-making process to select the optimal HVAC
system.
Section 11.0: Selected System identifies the system that Team NUE Air chose as the optimal system.
Section 12.0: Conclusion recommends the optimal system for the building.

2.0: Introduction
ASHRAE Standard 55 was used to determine the proper thermal
environment for occupant comfort. The factors that define thermal comfort
include: metabolic rate, air temperature, air speed, humidity, clothing
insulation, and radiant temperature. Metabolic rates were assumed to be
between 1.0 met and 1.3 met and clothing insulation values were
assumed to be between 0.5 clo and 1.0 clo. The following formulas from
Standard 55 Section 5.2.1.1 were used to find the acceptable operative
temperature range:
Building compliance with Standard 55 is described in Section 4.3.
ASHRAE Standard 62.1 was used to determine minimum ventilation and
exhaust rates for acceptable indoor air quality to minimize adverse
occupant health effects. Calculations for the minimum outdoor air
requirement were completed. Standard 62.1 Section 6.2 presents the
following formula, with values found in Table 6.1 and Table 6.2 of
ASHRAE Standard 62.1:
Compliance with this Standard was achieved by supplying each room
with the volume of ventilated air specified by the above equation for the
options that included a DOAS. For Option 1, multiple space effects were
considered by applying the equations in Section 6.2.5 of the standard.
Exhaust rates for areas with high pollutant generation rates were given by
a similar manner via ASHRAE Standard 62.1 Table 6.4, except for the
paint room, where other specific requirements dictated exhaust airflow.
Here an exhaust rate of 10 L/sec/person was used, and all ventilation air
passes through a standalone HVAC unit as discussed in Section 6.3 of
this document. Externally, all ventilation air inlets and outlets are
separated as per ASHRAE Standard 62.1 Table 5-1, taking care to keep
Class 4 air (as seen in the paint booth) outlets 30’ from any inlet.
For transfer air, flow rates are based upon air class. ASHRAE Standard
62.1 Section 5.16 states that it is acceptable to utilize transfer air in the
design at locations specified in Section 6.3 of this document. This is
possible because Class 1 corridor air is able to be moved from space to
space. ASHRAE Standard 62.1 Section 5.16 also states that Class 2
restroom air cannot be transferred to the adjacent corridor. As Class 4 air
cannot be transferred to any space, the design decision to fully isolate
and ventilate the paint booth is also supported.
ASHRAE Standard 90.1 was used to specify a Baseline system to
which the three system options were compared. New buildings per
ASHRAE 90.1 Section 4.2 must comply with sections 5, 6, 7, 8, 9,
and 10 or 11. Of these, Sections 5, 6, and 9 fall within the
mechanical design. Compliance of these sections was executed
by:
1) Section 5 - U-value hand calculations (see Appendix D.3)
2) Section 6 - Digital controls with automatic shutdown for each
zone, motorized dampers that automatically close and are tied
into the fire and smoke detection systems, demand control
ventilation (DCV) will be used for areas more than 500 ft2 with
higher than 40 people per 1000 ft2 , and variable speed drives
or two-speed motors for AHUs and FCUs
3) Section 9 - Lighting is controlled with scheduled lights and
occupancy sensors in most rooms.
ASHRAE Standard 189.1 was used to determine the minimum
equipment efficiencies. Standard 189.1 aligns with some LEED
requirements. Team NUE Air’s implementation of LEED (see
Section 4.10) aided in mechanical design compliance with
Standard 189.1.
ASHRAE defines a green building as one that achieves high
performance over the full life cycle in the following areas:
minimal consumption of nonrenewable and depletable natural
resources, minimal atmospheric emissions, minimal discharge of
harmful wastes including those from demolition of the building,
and minimal negative impacts on site ecosystems. Team NUE
Air used the ASHRAE GreenGuide to design a building as near
to the green building definition as possible. The ASHRAE
GreenGuide outlines a design process that team NUE Air
utilized in the following categories:
1) Commissioning - executed through the implementation of
LEED
2) High Performance Energy Strategies - executed through the
analysis of three energy-efficient HVAC systems
3) Occupant Comfort and Health - executed through
compliance with ASHRAE Standard 55 in combination with
“green tips” from the Guide, such as energy recovery and
DOAS
4) Integrated Building Design and Energy Sources – executed
through the use of a photovoltaic (PV) louver system
2.3.1: ASHRAE Standard 55
2.3.2: ASHRAE Standard 62.1
2.3.3: ASHRAE Standard 90.1
2.3.4: ASHRAE Standard 189.1
2.3.5: ASHRAE GreenGuide
2.1: Building Description
The new educational facility is a three-story junior college located in Doha,
Qatar. The building has a floor area of approximately 48,000 square feet.
The first floor is approximately 18,000 square feet and includes classrooms,
offices, conference rooms, a library/media center, a computer lab, and a
carpentry/woodworking/welding shop. The second floor is approximately
15,000 square feet and includes classrooms, a conference room, and a
student gathering area. Similarly, the third floor is approximately 15,000
square feet and includes classrooms, a conference room, a student
gathering area, and as a computer lab. A location within Doha near the
Persian Gulf was assumed as discussed in the design competition website’s
FAQ page. See Figure 2.1 for a rendering of the building.
2.2: Owner’s Requirements
Team NUE Air’s major design considerations were based on the Owner’s
Project Requirements. These criteria set a baseline for the functionality of
the HVAC system within the building. The Owner’s Project Requirements
include:
1) Sustainable design through energy efficiency, indoor environmental
quality and safety, occupant comfort, functionality, longevity, flexibility,
and serviceability/maintainability
2) Reduce energy consumption by at least 15% more than the baseline
prescribed in ASHRAE Standard 90.1
3) Lowest possible life cycle cost, considering initial cost of materials and
operation and maintenance costs
4) Operation and maintenance requirements with easy serviceability
5) Indoor environmental quality that facilitates occupant productivity,
comfort, and safety
6) Noise control encompassing superior acoustic criteria in classrooms and
minimal sound transmission from shop areas
7) Photovoltaic array that meets 5% of the building’s total energy needs
8) Compliance with ASHRAE Standard 55-2004, Standard 62.1-2010,
Standard 90.1-2010, and Standard 189.1-2011
2.3: Reference Standards
Figure 2.1: Junior College in Doha, Qatar
(source: authors)
2

3.0: Design Parameters
3.1: Weather DataDoha, Qatar has a hot desert climate, deemed equivalent to Climate Zone
1B in the United States. Doha’s warm season lasts from early May to late
September with an average daily high temperature of approximately 99°F.
The hottest day of the year usually occurs in early July with an average
high of 106°F and low of 87°F. Doha’s cold season lasts from early
December to early March with an average daily high temperature of
approximately 77°F. The coldest day of the year usually occurs in late
January with an average low of 57°F and high of 70°F. Figure 3.1 shows
the average daily high and low temperatures throughout the year in Doha
Figure 3.1: Daily High and Low Temperatures
(source: Weather Spark)
ASHRAE Standard 90.1 Section 5.1.4.2 defines how to determine the
climate zone number and letter. While ASHRAE documents do not directly
list Doha’s climate zone, they do provide the data necessary to determine
the city’s ASHRAE-defined zone. Table B-4: International Climate Zone
Definitions provides thermal criteria for each international climate zone.
Analysis of this figure shows the need for cooling degree day base 50 data
(CDD50), which is the annual amount of degrees per day that the mean
temperature is over 50°F. Examination of Doha’s climatic data and
subsequent calculations (see Appendix D.1) show that Doha is within the
Very Hot-Dry (1B) climate zone. This definition implies that Doha buildings
are cooling dominated.
3.2: Outdoor Design ConditionsASHRAE Handbook of Fundamentals 2013 provides design conditions for
the Hamad International Airport in Doha. Cooling design conditions were
based on the 2% criteria, as specified by the OPR. Heating design
conditions were not specified and have been based on the 99.6% design
condition. The conservative heating design condition was based on the
low first cost associated with adding heating capacity. The cooling and
heating design conditions are shown in Table 3.1. These design conditions
were used in the load calculations to size the HVAC equipment.
Table 3.1: Cooling and Heating Design Conditions
(source: 2009 ASHRAE Handbook of Fundamentals Supplemental
CDROM)
3.3: Indoor Design ConditionsThe indoor design conditions for the building were provided in the OPR
and can be seen in Table 3.2. These conditions were used within the
TRACE model for load calculations and the energy model. Thermostat
schedules for heat and cooling were designed around these conditions.
Table 3.2: Indoor Design Conditions
(source: Owner’s Project Requirements)
3.4: Ventilation RequirementsOutdoor air and exhaust ventilation rates were based on ASHRAE
Standard 62.1 Sections 6.1 and 6.2. Table 6-1 gives the Minimum
Ventilation Rates in Breathing Zones and Section 6.2.2.1 outlines the
formulae and procedure for calculating the outdoor airflow required in the
breathing zone. ASHRAE Standard 62.1 Equation 6-1:
Vbz=Rp*Pz+Ra*Az
where Rp is the outdoor airflow rate required per person and Ra is the
outdoor airflow rate required per unit area given in ASHRAE 62.1 Table 6-
1 for each zone’s occupancy category and room type.
3.5: Hours of OperationThe hours of operation of the building were used in creating an accurate
energy model. The occupancy hours can be seen in Table 3.3.
Table 3.3: Hours of Operation
(source: Owner’s Project Requirements)
Utilization schedules in TRACE were defined to account for occupancy,
lighting, ventilation, infiltration, and miscellaneous loads based on the
hours of operation of the building. Per ASHRAE Standard 90.1 Section
6.4.3.3, off-hour controls with automatic shutdown, setback controls,
optimum start controls, and zone isolation are incorporated to override
controls that are based on these schedules.
3.6: Utility RatesThe OPR provided the cost for electricity, natural gas, city water, and city
sewer. These are shown in Table 3.4.
Table 3.4: Utility Rates
(source: Owner’s Project Requirements)
On-peak time period for electricity is from 9:00 a.m. to 7:00 p.m. Monday
through Saturday. Off-peak time period for electricity includes all other
times and does not have a demand charge. Per the OPR, the utility
escalation rate was based on a 10 year average increase for utility
provided in the New York City area.
A thermal storage schedule was created for the two system options that
utilize thermal storage. The system charges from 7 p.m. to 9 a.m. and
satisfies load from 9 a.m. to 7 p.m.
3

Team NUE Air created a list of design goals to ensure that all aspects
of the project were considered and properly analyzed.
4.1: Low Life Cycle Cost
According to the OPR, the building’s allocated total budget was $200
per square foot. The life cycle cost analysis was completed with a
building life of 50 years, a 7% return on investment, and a 3% inflation
rate. First costs were calculated from prices provided by industry
professionals, Engineering News-Record (ENR) Mechanical/Electrical
Square Foot Costbook 2015 Edition, and direct quotes from
manufacturers for the large mechanical components. The operation,
maintenance, and replacement costs of each system were compared
over 50 years to comply with ASHRAE Standard 189.1 for a “Long
Life” building. A 50-year life cycle cost of each system was also
calculated and compared. A return on investment chart based on
present worth was created to show the year that the recommended
system life cycle cost payback would exceed the other systems (see
Section 9.0).
Present worth analysis was used for all costs. Simple present worth
cost is defined as the equation: P=(1+i)-n, where i is the interest rate
and n is the number of years. The present worth for each system was
calculated using the energy usage costs per year provided in TRACE
for each system and the utility rates provided in the OPR. See Section
9.0 for the full life cycle cost results of each system option.
4.2: Low Environmental Impact
The environmental impact of each system option was considered for
selection of refrigerant type, water usage, total building energy
consumption, and lighting controls.
Environmental effects such as ozone depletion were taken into
consideration when selecting a refrigerant. While HCFC R-22 is more
efficient than hydro fluorocarbon (HFC) refrigerants, R-22 was not
chosen due to its 2010 forbiddance of use in new HVAC equipment in
compliance with the EPAs phase-out schedule under Title VI of the
Clean Air Act. As a secondary choice HFC refrigerants R-410a and R-
134a were chosen for the system, neither of which contribute to ozone
depletion.
The chosen water source heat pump system has a clear advantage in
terms of water usage. Despite transferring heat via water, the entire
system is closed-loop and does not contaminate the environment.
Additionally, this system eliminates the use of evaporative cooling. In
this way, savings are made in water costs, which is imperative for cities
such as Doha, which lack naturally occurring fresh water.
Team NUE Air focused on minimizing total building energy
consumption in order to minimize carbon footprint. The total building
energy consumption for all three system options was found using
TRACE. These values are summarized in Table 4.1. Each system
option produced an energy improvement over the Baseline, thus
reducing overall environmental impact.
(source: authors)
Lighting controls for all spaces were designed in compliance with
ASHRAE Standard 90.1 Section 9.4 where each space will have a
manual on-switch that is readily accessible to occupants. An
occupancy sensor is present in each room with the exception of the
shop room and mechanical/electrical rooms, which will be time-of-day
controlled with a temporary one-hour override. This override will be
located at the thermostat that switches HVAC and lighting systems into
occupied mode. Manual switches in corridors, electrical/mechanical
rooms, and stairways will have an on and off setting, and all other
rooms will have an additional third setting of 50% power that turns half
of the lights off. Occupancy sensors automatically turn lights off within
30 minutes of all occupants leaving the space, and daylight harvesting
shuts off lights adjacent to windows if the lighting level is high enough.
4.3: Comfort and Indoor Environmental
Quality
The comfort and indoor environmental quality of the classrooms and
office spaces will differ from the woodworking and metal shops, due to
the function of the different spaces. The classrooms and offices require
a higher level of control and reduced noise levels, whereas the shop
area will be designed to reduce fumes and fugitive dust generated by
the equipment.
Table 3.2 shows that conditions fall within the acceptable range of
operative temperatures according to ASHRAE Standard 55 Section
5.2.1.1. The temperature range shown in Figure 4.1 is for 80%
occupant acceptability and comfort with humidity levels between 40%
and 60%. The system options were designed to meet the given
temperature and relative humidity requirements that comply with
Standard 55. Figure 4.1 shows the acceptable range of operative
temperature and humidity for this type of space.
Table 4.1: Total Building Energy
Figure 4.1: Acceptable range of operative temperature and humidity
(source: ASHRAE Standard 55-2004)
4.0: Design Goals4
System
Total Building
Energy (kBtu/yr)
Improvement
Over Baseline
Building Energy per
Square Foot
(kBtu/yr)/s.f.
Baseline 2,557,945 N/A 55.09
VAV AHU with Thermal Storage 2,138,311 17% 46.05
FCU with Thermal Storage 1,830,675 28% 39.43
WSHP with Sea Loop 1,445,622 44% 31.14

Section 6 of Standard 55 requires complete plans, equipment data,
descriptions, and operation and maintenance data for the building
systems to be provided and maintained. This will happen at the
completion of the design phase. Also, evaluations of the thermal
environment will take place after the construction of the building, to
confirm that the mechanical system is operating properly to provide
the most comfortable environment for the occupants. They include
measurements of temperature and humidity in zones when the
zone is loaded to at least 50% of the design load and heat gain by
occupants is simulated.
4.4: Creative High Performance Green
Design
PV Louvers – Applicable to Options 1, 2, & 3
To meet the criterion that a minimum of 5% of the building’s total
electrical load provided by photovoltaic (PV) panels, a louver-based
PV system is applied to the south facade of the structure. This
south-facing design will maximize the system’s exposure to solar
radiation. Additionally, the louver-based system provides shading to
the areas most vulnerable to solar heat gain: south-facing windows.
Analysis using the clean energy management software RETScreen
shows an expected total energy output of 53,700 kWh.
Water Fountain Spray Cooling Tower – Applicable to Options 1 & 2
As indicated in Section 3.1, Doha is very hot and dry, which allows
for the consideration of a water fountain spray cooling tower. (It
should be noted that an ASHRAE defined dry climate does not
necessarily mean a climate with low humidity, but data show that
the humidity levels in Doha are still low enough to justify this
design.) This creative design functions by utilizing evaporative
cooling from architecturally-pleasing water features to provide
adiabatic cooling for condenser water to supplement the cooling
tower. Evaporative cooling occurs partially via the large, relatively
still water pond, and more prominently (due to spray and higher
velocity) via the actual water jet. Calculations in Appendix D.2 show
that when combined, this water fountain spray cooling tower could
provide 30.6 tons of additional cooling to the structure. A heat
exchanger would be used to separate the water fountain spray
cooling tower from the cooling tower supply water, thus preventing
contamination.
Closed Seawater Loop field – Applicable to Option 3
Doha’s location adjacent to the Persian Gulf allows for another less
common design choice through the use of a closed seawater loop
field that rejects heat from a heat pump loop. As Doha sees nearly
year-round cooling loads, a traditional geothermal loop would
continuously reject heat to the soil. Without a substantial heating
season to offset the heat gain of the soil, heat soak would occur,
thus decreasing the efficiency of the loop.
The Persian Gulf maintains a constant daily temperature and, when
combined with water currents, eliminates heat soak. One concern
with this technology is high condenser water temperature. Figure
4.3 shows the average surface sea water temperatures, which
peaks at 95°F. Fortunately, the water’s peak temperature lags
behind the air peak by nearly two months. This means that there is
a larger ΔT between the system and the water temperature, which
raises the system efficiency.
4.5: Synergy with Architecture
PV Louvers – Applicable to Options 1, 2, & 3
The PV louver system provides an architecturally-pleasing
incorporation of PV panels. Traditional systems require large
panels to be placed near or on the structure, which can detract from
the appearance of the building. Team NUE Air understood that
shading would be required on the large glazed areas of the
southern facade, making the addition of the PV louver system an
obvious choice. With the louvers being a single unit with the PV
system, a cohesive, sleek design is created. Additionally, the costs
of a standalone shading system is eliminated. Figure 4.4 outlines
the areas of the south facade that will contain the PV louver
system. Figure 4.5 shows a representation of what the louver
system would look like on an exterior panel of the building.
Water Fountain Spray Cooling Tower – Applicable to Options 1 & 2
The water fountain spray cooling tower introduced in Section 4.4 is
another dual purpose creative green design that has both
performance and architectural benefits. The very nature of the
system - involving rising, spraying jets of water - serves to welcome
occupants into the building with a pleasant visual experience. By
providing initial cooling, the maximum load on the cooling tower is
decreased, thus allowing for a smaller size of cooling tower to be
installed. The water fountain spray cooling tower provides a
beautiful method of evaporative cooling and decreases both the
overall visual and cost impact of the cooling tower through the
reduction in size. Such a water fountain spray cooling tower has
been implemented at the Museum of Islamic Art in Doha, Qatar
(see photo in Figure 4.6).
Figure 4.2: Water Fountain Spray Cooling Tower
Figure 4.3: Lag of Water Temperature
(source: authors)
Figure 4.4: PV Louver Location
4.0: Design Goals5

Closed Seawater Loop field – Applicable to Option 3
A seawater heat pump system has the advantage of not having a
cooling tower to incorporate into the architecture. Unlike a system
utilizing a large primary cooling tower for heat rejection, a heat pump
system can reject its heat to a large reservoir of moving water (or in this
case, the Persian Gulf). The heat pump system will have a small
dedicated outdoor air system (DOAS) on the roof to treat incoming
outdoor air before it reaches the heat pumps. Accompanying the DOAS
unit will be an enthalpy wheel type of energy recovery ventilator detailed
in Section 7.1 to dramatically increase system efficiency. Since the
DOAS unit is simply supplementary to the heat pumps, it is small in
size, thus allowing it to be placed centrally on the roof with minimal
structural impact. Due to the building’s height, the DOAS will be
completely out of sight at this location.
Team NUE Air considered the internal architectural impacts of each
system in addition to the external architecture. The building space
usage and consistency of occupant comfort are addressed in the form
of two major categories:
1) Minimize use of occupied space for mechanical systems: Careful
consideration of system type and component location is vital to
avoid the need to use preferred occupied space for mechanical
space, as this is both expensive and visually unpleasant. With the
selection and zoning of the water source heat pump system, team
NUE Air was able to eliminate external cooling towers while keeping
internal heat pumps small in size, allowing for more flexibility in their
placement. The larger, harder to service and conceal heat pumps
(serving locations such as the library and construction rooms) are
placed centrally in the mechanical rooms, while the smaller units
serving individual rooms will be placed in the corridors adjacent to
their rooms, eliminating long duct runs and allowing the units to be
serviced outside of the room, avoiding the distractions of a closet-
mounted unit.
2) Minimize impact of diffusers: Diffusers are essential for the
distribution of treated air in mechanical systems, and must be
carefully considered in their placement in order to maintain an
unobtrusive environment for building occupants. Typical design
practice was used which considers diffuser spacing in order to avoid
airstream collisions, and coordination with lighting will be considered
to create a symmetric design. Finally, the use of transfer air in the
construction rooms allows for fewer supply diffusers needed in the
space, giving a more seamless look to the area.
4.6: High Efficiency
High efficiency was considered to ensure selection of an optimally-
performing system. Ambient air temperature (both dry bulb and wet
bulb) was considered when selecting system components. The amount
of cooling provided by an air-cooled condenser is a function of the
ambient dry bulb temperature, while the amount of cooling provided by
a water-cooled condenser is determined by the ambient wet-bulb
temperature. A water-cooled condenser is more efficient than an air-
cooled condenser due to the low monthly mean wet bulb temperature,
which contributes to a larger ΔT in the heat transfer equation:
Q=mCp (ΔT). Thus, a cooling tower was chosen for System Options 1
and 2.
4.7: Sustainability
Sustainable HVAC design takes into account energy conservation in
addition to environmental impact. In order to meet current sustainability
criteria, team NUE Air’s systems were designed in accordance with
ASHRAE Standard 189.1 (see Section 2.3.4). Sustainability for each of
the three system options was considered as part of the final decision
matrix located in Section 10.0.
PV Louvers – Applicable to Options 1, 2, & 3
The decision to use a hybrid photovoltaic louver shading system
allowed team NUE Air to take a novel approach in the design of the
photovoltaic panels. With shading being one of the primary functions of
the system, team NUE Air immediately turned its attention to the
southern facade of the building, where sun exposure and high amounts
of glazing combine to create a very problematic area from an HVAC
design perspective. The initial panel sizing and placement was based
upon the idea of providing shading to the large curtain walls on the East
side of the Southern facade.
The Colt Shadovoltaic Louver system was selected to be paired with
the Sunpower E19 320 Solar Panel. The energy analysis program
RETScreen was used to model the system. The proposed system was
modeled as a horizontally-mounted panel with single axis rotation to
reflect the louver’s ability to rotate its panels along a fixed horizontal
axis. This rotation enables controllers to track the sun’s altitude, thus
minimizing the angle of incidence. The targeted load would require
panels covering 126m2 (1356ft2) of the southern facade, accomplished
with the distribution of panels shown in Figure 4.4. This area was shown
by RETScreen to produce an annual energy output of 53,700 kWh, or
19.7% of the annual building energy load. This 19.7% energy
generation translates to 7 points of LEED Energy and Atmosphere
credit 2: On-Site Renewable Energy (see Section 4.10).
Figure 4.5: PV Louver Representation
(source: authors)
Figure 4.6: Water fountain spray cooling tower at the Museum of
Islamic Art in Doha, Qatar
(source: Industry Advisor/ASHRAE Mentor Joe T. Hazel)
4.0: Design Goals6

The subsidization of the initial cost of the photovoltaic array makes the
proposed panel and mounting feasible. While sandstorms can wreak
havoc on many building systems and they are a durability concern for
any photovoltaic system in the region, the chosen panel is guaranteed
to withstand the impact of a 1 inch hail stone traveling at 50 mph,
which is a force that far exceeds what the panel will undergo in
collision with sand particles.
See Section 9.1 for a complete life cycle cost analysis of this
photovoltaic system.
4.8: Reliability
Reliability is evaluated based on the longevity, dependability, and
overall quality of the building’s equipment and operations.
Accommodating component failure by the use of redundancy is
important in the design of a reliable system. The inclusion of
equipment redundancies is used to allow for the entire system to
continue operating even when one system component is in need of
replacement or repair. However, excessive redundancy leads to
excessive initial costs. Reliability of all system options is evaluated in
Section 10.0 as a consideration in the system selection matrix.
4.9: Noise Control
The acoustical qualities of the selected HVAC system are important to
ensure limited distractions to students and faculty. Important noise
control concerns were analyzed including self-generated noise created
by turbulent duct airflow, airborne noise transmission from mechanical
equipment through the ductwork, and noise transmission from the
shop to the adjacent spaces. Noise control design strategies were
implemented in order to comply with background noise criteria
provided in the OPR (see Table 4.2).
Owner-required NC levels of 30 and 35 were achieved for each
acoustically sensitive spaces given in Table 4.2 through use of duct
lining, turning vanes, and low supply air velocity in the supply duct
system. Trane Acoustics Program (TAP) analysis was used to select
a duct assembly that both minimized duct borne noise carried from the
heat pumps to the acoustically sensitive spaces as well as self-
generated noise created by duct air turbulence. The shortest heat
pump to diffuser path was analyzed in order to represent an acoustical
worst case scenario. Rectangular lined duct was found to provide
adequate attenuation, while the use of turning vanes and 2’’ corner
radiuses in the elbows and junctions was found to minimize
regenerated noise (see Appendix E1.1 and E1.2). Using the chosen
duct assembly a supply velocity of 350ft/min was chosen to meet the
NC 35 acoustic criteria of the office and administrative spaces, while a
supply velocity of 300ft/min was chosen to meet the NC 30 acoustic
criteria of the classrooms, study spaces, and library (see Figures 4.7
and 4.8).
Minimum sound transmission from the shop to the nearby acoustically
sensitive offices on the first floor was achieved through selection of an
appropriate STC shop wall assembly. Octave band sound levels
within the shop were estimated based on measured decibel level noise
data from woodworking equipment, where a total shop noise level was
approximated from the logarithmic addition of 5 table saws and 3 large
lathes. Representing this total dB level as a single sound source
located in the center of the shop floor, as seen in Figure 4.9, allowed
for TAP to be used to predict sound transmission between the shop
and nearby offices. Typical wall constructions expected to be used in
the pertinent spaces were chosen for analyses: a steel stud 5/8’’ single
gypsum board assembly for the office partition, and a 6”x8”x18”
concrete block masonry wall assembly for the shop partition. Results
showed that background noise levels on the order of NC 35 could be
satisfied within the offices given the chosen wall assemblies, therefore
no specialty wall assembly of high STC was needed (see Appendix
E2.1). However, special gasketed sound proof doors are
recommended for the shop wall partition in order to minimize sound
leakage from the shop.
Table 4.2: Noise Criteria
(source: Owner’s Project Requirements)
4.0: Design Goals7
Figure 4.7: NC curve for space air supplied at 350ft/min
(source: Trane Acoustics Program 2012)
Figure 4.8: NC curve for space air supplied at 300ft/min
(source: Trane Acoustics Program 2012)
Figure 4.9: Sound Transmission source and receiver spaces defined

4.10: LEED
Though the owner did not specify that the building be evaluated with
a building certification program, Team NUE Air investigated the
potential Leadership in Energy and Environmental Design (LEED)
points that each system option could achieve as an additional
indicator of the environmental soundness of each option. This will
also allow the owner to pursue LEED certification in the future if
desired.
LEED is a green building certification program that recognizes
buildings that have been designed, built, and operated in an
environmentally-friendly manner. Building projects must meet
prerequisites and earn credits toward LEED that are set in place by
the United States Green Building Council (USGBC). Compliance
with ASHRAE Standard 189.1 partially fulfilled most LEED
requirements for this building. Table 4.3 summarizes the points
earned by each system option that is outlined in Section 8.
4.0: Design Goals
Table 4.3: LEED Points
8

5.0: Building Design
5.1: Orientation
Building orientation was a key variable taken into consideration in order
to minimize the solar heat gain through the glass panels on the
structure’s exterior. The most efficient way to reduce this heat gain was
to minimize east and west direct exposure and maximize north and
south exposures. It was determined that the side of the building with the
entrance and the large amount of spandrel glass will face the south. This
orientation will be ideal for the use of the photovoltaic panels requested
in the OPR. Another LEED credit is possible if the east-west lengths of
the building are equal to or greater than the north south lengths, and the
east-west axis is within 15 degrees of geographic east-west. This is the
planned orientation for the building so a LEED credit is achievable.
Figure 5.1 shows the required LEED orientation.
5.2 Shading
The louver system described in Section 4.4 provides solar shading to
the southern façade of the building. Team NUE Air selected a louver
system that meets the owner’s requirements and provides an effective
shading solution to help control solar load. The solar heat gain will be
reduced which reduces a portion of the cooling load of the building. The
louver system is controllable so the louvers track the position of the sun
and automatically adjust to optimize the reduction in solar heat gain.
Figure 5.2 shows a basic diagram of the louver system from the
manufacturer that demonstrates how the louvers transmit daylight while
reflecting and absorbing infrared solar radiation.
5.3 Envelope Assumptions
The ASHRAE standard wall construction and windows specified in the
OPR were used in the design of the mechanical systems for this project.
Team NUE Air understands that with the implementation of a more
advanced wall construction and window design, the 15% energy saving
could have been reached. However, Team NUE Air believes the spirit of
this competition is to achieve the 15% savings through system selection,
so effort was focused there.
Figure 5.1: Required LEED orientation
(source: US Green Building Council)
Figure 5.2: Louver shading system
(source: Colt Solar Shading Systems)
9

6.1: Modeling
The Trane TRACE 700 Load Design program was used to model the
building. TRACE models energy and also the economic impact of
design decisions. A total of four models were created: one for the
Baseline and one for each system option. These models were utilized
throughout the design process. During the preliminary design phase, a
basic block load was calculated, treating the structure as a large space
with simplistically modeled features (i.e. windows, doors, walls), which
would give a general scale of the types of loading that would be placed
on the school (see Figure 6.1). In addition, verification of the
reasonableness of this preliminary model was made easy due to its
simplicity, which allowed it to serve as a quick-check tool for the team
throughout the rest of the design.
A load calculation model was created to find the peak load situation and
therefore was used to size all system equipment. This model contained
representations of each room in the building with all construction-
related variables representative of those presented to team NUE Air in
the OPR. Reasonable assumptions were made and verified with
industry mentors where required information was not provided in the
OPR. For example, the U-values of all curtain walls were found through
hand calculations and entered into TRACE (see Appendix D.3). The
TRACE load calculation showed a peak cooling load of 165 tons.
A second large contributor to building load is internal lighting load. This
was explicitly outlined in the design criteria, which required the team
NUE Air to research, assume, and justify the lighting load in the
building. In a climate such as Doha, heat mitigation is as important an
issue as low power usage. Thus, a 4000 lumen Lithonia 2VTL LED
fixture was selected as a reference due to its highly efficacious design.
Using luminaire placement at 10’ on center (O.C.) for general spaces
and classrooms; and 6’ O.C. spacing in smaller offices, team NUE Air
concluded that 0.7 W/ft2 served as a conservative lighting heat gain
load when averaged across the building.
TRACE checksums were created from the load calculation model and
used to size the main system components.
Next, Team NUE Air created an energy model. Schedules that were
supplied in the OPR were applied to the Load Calculation Model as to
more realistically represent the loads experienced by the building in
day-to-day function. The three system options were also fully modeled
and, in combination with the utilities outlined in the design documents,
the energy model was used to compare the energy and economic
performance of the key systems.
6.2: Zoning
Occupant comfort has long been the key design factor in mechanical
system design and selection, and the ability to precisely control the
temperature of a conditioned space is one of the most effective
methods in maintaining occupant satisfaction. By dividing each floor
into multiple thermostat-specific zones, the temperature can be more
accurately controlled on a per-room basis, allowing users to customize
spaces to his or her liking.
Zoning criteria primarily includes space function, exterior exposure, and
orientation; therefore, each classroom and large gathering space was
placed in an individual zone to effectively cope with the load variations
that can occur within a school throughout the day. Some exceptions to
this are the stairs, where each of the two stair columns are zoned
together. The stair columns and the elevator mechanical room are not
zoned with larger adjacent rooms in order to avoid ventilation
contamination during fire/smoke events (outlined in ASHRAE Standard
90.1 Section 6.4.3.4.1). Due to southern exposure and high amounts of
glazing, the three exterior offices on the first floor (as seen in Figure A.1
of Appendix A.1) were placed in an individual zone separate from the
other office spaces. To further increase control in these offices, special
self-modulating diffusers were used on the supply side of the system.
These diffusers each include their own motorized damper that allow the
occupants to closely control the airflow in the office, which is key in a
small room with high sensible load variation due to large southern-
exposed windows. Despite being interior rooms, self-modulating
diffusers were also added to the two additional offices to increase the
level of control. See Appendix A.1 for the zoning diagrams of each floor.
Figure 6.1: Distribution of Building Load
(source: authors)
6.0: Load Calculations10

6.3: Pressurization
As per standard design practice, all general spaces were
designed to maintain positive pressure. Exfiltration is maintained
with positive pressure, minimizing the amount of untreated
outdoor air entering the space. This untreated infiltrating air can
not only lead to space temperature variations, but more
importantly it can affect the humidity of the space. This added
humidity in the space occurs downstream of the air treatment
systems, which means it cannot sufficiently treated, which can
cause discomfort to the building occupants. Positive pressure is
achieved throughout all general spaces in the building by
providing more supply air to rooms than what is being removed
from a room via exhaust and return systems. A 10% oversupply
was chosen for this building based on industry standard.
Pressure differentials are used in the construction wing (special
instruction area) of the building which includes the welding,
woodworking, and painting spaces. These three spaces create
contaminants in the air (e.g. wood particulates, welding fumes,
paint overspray) that must be exhausted from the building
without reaching other surrounding spaces. In order to create
negative relative pressure, more air is removed from a specific
room than what is supplied. To increase building efficiency, the
overall supply air in the construction wing of the first floor is
decreased, allowing intake of corridor air via motorized dampers
located in the west wall of the construction area.
The total exhaust rate for the welding benches located in the
construction room is calculated as:
The total exhaust rate for the cone hood flexible exhaust
connections located in the construction room is calculated as:
The total exhaust rate for the construction room is the
summation of the above rates:
(source: ACGIH)
Air-to-cloth ratio is a typical form of rating for dust collectors.
This ratio represents the volumetric flow rate of air flowing
through a collector over the total area of cloth filter.
A baghouse dust collector with an air-to-cloth ratio between 6.0-
8.0 will be used in the woodworking area. The selected
Donaldson Torit unit shown in Figure 6.4 has a filter area of 450
square feet, and with a required airflow of approximately 3,100
CFM it is apparent that unit falls within the acceptable ratio and
is properly sized:
6.4: Baseline
Team NUE Air developed a Baseline system within TRACE to
create a model to which each system option could be compared.
A Baseline system consisting of a packaged variable air volume
DX cooling rooftop unit, with variable air volume hot water reheat
terminal units was used. All modeling complies with the
Performance Rating Method described in ASHRAE Standard
90.1, Appendix G. The Baseline has a total building energy
consumption of 2,558,000 kBtu/year.
Figure 6.2: Welding hood
(source: Industry Documentation)
Figure 6.4: Donaldson Torit filter unit
(source: Industry Documentation)
Figure 6.3: Cone hood flexible connection
(source: Industry Documentation)
6.0: Load Calculations11

7.0: Major System Components
7.1: VAV Air Handling System
Variable air volume systems (VAV) provide varying rates of
conditioned room air to each zone controlled via a motorized
damper. All air handling unit fans are also equipped with
variable frequency drives that modulate according to the
needs of the zones. These two areas of controllability provide
a substantial increase in efficiency over a constant volume
system. Each VAV box includes electric reheat which is used
when the damper in the VAV box reaches its minimum airflow
position in cooling, but the zone still requires heating. Each air
handling unit is coupled with an energy recovery ventilator
(ERV) in the form of an total enthalpy wheel. The enthalpy
wheel was chosen because it is the least expensive yet most
efficient energy recovery system due to its simple design.
Each air handling will also be equipped with UV lights for
germicidal radiation located 12 inches off of the cooling coils
to keep the pressure drop stable and maintain a healthy and
clean environment. The air handling units are equipped with
special sand louvers which are commonly used in desert
areas to prevent sand entrainment.
7.2: Fan Coil Units with Dedicated
Outside Air System
Fan coil units (FCU) use a heating and/or cooling coil coupled
with a fan to deliver conditioned air to a space. When space
temperature increases, the thermostat signals the unit to
begin circulating chilled water through its cooling coil. Air is
blown over the coil, thus cooling the air. Fan coil units are
located externally to each space, utilizing ducted runs to
mitigate noise issues.
Since fan coil units are stand alone in nature, they are unable
to bring outdoor air into the building under their own power,
requiring the implementation of a dedicated outdoor air
system (DOAS). The DOAS contains its own heating and
cooling coils in order to pretreat the ventilation air, which
reduces the load on the fan coils within the building. In
climates such as Doha, a cooling coil arrangement can be
utilized within the DOAS in order to adequately dehumidify
the outdoor air. This DOAS provides an outdoor air amount
that is compliant with ASHRAE Standard 62.1. Additionally,
the DOAS utilizes an ERV enthalpy wheel to precondition the
outside air using energy from the relief air to decrease wasted
energy.
7.3: Water Source Heat Pump System
with Dedicated Outside Air System
Water source heat pumps utilize a refrigeration cycle to heat or
cool the supply air. Water source heat pumps use a common
building-wide water loop for heat transfer through a water-to-
refrigerant heat exchanging process. By being able to
simultaneously reject and take on heat from this water loop, the
heat pump system can be self-regulating, meaning that an equal
amount of heat is being added (usually from interior spaces) and
removed (usually from exterior spaces) from the system, making it
extremely efficient. When outdoor conditions require perimeter
cooling as will usually be the case in Doha, additional heat can be
rejected through a geothermal or seawater loop, where conditions
are constant and predictable on a day-to-day basis.
A reversing valve dictates the direction of refrigerant flow based on
the conditioning mode. In cooling mode, the heat pumps reject
heat to the water loop. In heating mode, the water loop rejects heat
to the heat pump, where it is then supplied to the space. Next, the
refrigerant flows into an air-to-refrigerant coil. This provides the
required heating or cooling for the supply air.
Similar to fan coil units, heat pumps do not bring outdoor air into
the building. Thus, ventilation air is delivered to each space
through the use of a DOAS in the same manner outlined in Section
7.2.
7.4: Thermal Ice Storage
The thermal ice storage system uses the chiller to form ice
during off-peak utility rate hours that is then used as a source
for cooling during on-peak utility rate hours. Per the OPR, on-
peak utility rate hours occur from 9:00 a.m. to 7:00 p.m.
Monday through Saturday. During these on-peak hours, the
chilled water passes through the ice created in the thermal
storage tanks during off-peak hours to lower its temperature
before it enters the air handling unit. This reduces the amount
of electricity required to condition the air. Thus, the cost of
cooling for the building is reduced.
Thermal ice storage allows for humidity control due to the cold
temperature of chilled water. Additionally, pumping is saved by
lower temperature water with larger ΔT’s.
Based on the TRACE calculations, a 100 ton ice-making chiller
is required for the thermal storage system. Each thermal ice
storage unit has a capacity of 9150 gallons and provides 761
ton-hours
of cooling.
7.5: Seawater Loop Field
The closed seawater loop system utilizes the Persian Gulf,
located adjacent to Doha, as a heat sink or heat source. High-
density polyethylene (HDPE) piping was chosen to complete
the loop system due to its corrosion resistant properties. A
slinky configuration of overlapping HDPE coils running along
the floor of the gulf is distributed to the condensers in each
water source heat pump by means of a plate and frame heat
exchanger to reject heat from the condensers. The warmed
water is then discharged back to the slinky coil submerged in
the Persian Gulf. An environmentally safe corrosion inhibitor
will be added to the loop water to ensure no harmful chemicals
are introduced into the seawater.
12

8.0: Systems Considered
8.1: VAV air handling system with electric
reheat, a chiller with a cooling tower
assisted by water fountain spray
cooling tower, utilizing thermal ice
storage
The primary system of this option employs a supplemental water
fountain spray cooling tower, a primary cooling tower, and a water
cooled chiller. As a part of cost-saving strategies, the thermal ice
storage system outlined in Section 7.4 is utilized in this option as
well, reducing peak loads and hence first cost for the primary chiller.
The secondary side of this option employs an air handling unit with
zone-level VAV boxes including electric reheat (see Section 7.1). A
schematic of this system can be found in Appendix B.1. Utilizing
TRACE, this system was found to have a total building energy
consumption of 2,138,000 kBtu/year, making it 17% more efficient
than the Baseline model.
Advantages:• VAV has low initial cost
• VAV is easily maintained
• VAV has individual zone temperature control, thus increased
thermal comfort
• VAV allows for greater design flexibility
• Thermal storage generates chilled water less expensively during
peak loads
Disadvantages:• VAV may not always meet required ventilation air
• The noise associated with the airflow changes as a VAV box
modulates could be distracting for students
• Thermal storage requires a significant amount of space and may
not be visually pleasing
8.2: Fan coil units with dedicated outside
air system, a chiller with a cooling
tower assisted by water fountain
spray cooling tower, utilizing thermal
ice storage
Similar to Option 1, the primary system of this option employs a
supplemental water fountain spray cooling tower, a primary cooling
tower, and a water cooled chiller. This option also utilizes the same
thermal ice storage as Option 1, as outlined in Section 7.4. The
secondary side of this option employs fan coil units with a DOAS
system for the treatment of ventilation air, outlined in Section 7.2.
The DOAS is a variable volume system that motorized dampers at
the connection to each fan coil. This allows for energy reduction by
decreasing ventilation air rates whenever the fan coil zones are
unoccupied. This allows for the implementation of CO2 sensors that
control DOAS flow rate at the zone level. A schematic of this system
can be found in Appendix B.2. Utilizing TRACE, this system was
found to have a total building energy consumption of 1,831,000
kBtu/year, making it 28% more efficient than the Baseline model.
Advantages:
• FCU has lower initial cost due to lack of ductwork
• Pipes to the fan coil units are smaller than ducts, thus reducing
plenum size requirements
• DOAS is versatile, and easily paired with any system
• DOAS has low energy requirements
• DOAS controls humidity
• Thermal storage generates chilled water less expensively during
peak loads
Disadvantages:• Fan coil noise may be more apparent because they are located
directly in the space
• Thermal storage requires a significant amount of space and may
not be visually pleasing
8.3: Water source heat pump system with
dedicated outside air system utilizing a
closed seawater loop field
The primary side of this option employs a closed seawater loop
system (see Section 7.5). The secondary side of this option employs
water source heat pumps (see Section 7.3). Water source heat
pumps transfer the thermal energy from the condenser coils in the
heat pumps to the seawater loop. Both return and supply ductwork
connect directly to each heat pump in order to supply conditioned air
to and return air from the space. The ventilation system for this
option employs a dedicated outside air system. The outdoor air duct
from the DOAS connects on the return side of the heat pump,
allowing for mixing to occur before the air enters the unit. Similar to
Option 2, the DOAS is a variable volume system that utilizes
motorized dampers at the connection to each water source heat
pump. Again, energy reduction is realized by decreasing ventilation
air during unoccupied mode and CO2 sensors and controls are
easily applied at the zone level. A schematic of this system can be
found in Appendix B.3. Utilizing TRACE, this system was found to
have a total building energy consumption of 1,445,000 kBtu/year,
making it 44% more efficient than the Baseline model.
Advantages:• Seawater loop field through the Persian Gulf is a sustainable
energy source
• Seawater loop field is energy efficient
• Seawater loop field has low lifecycle cost
• DOAS is versatile, and easily paired with any system
• DOAS has low energy requirements
• DOAS controls humidity
Disadvantages:• High initial cost
• Burying of pipes in the Persian Gulf
• Heat pumps can create noise issues due to internal compressors
Option 1 Option 2 Option 3
13

9.1: Life Cycle Cost Analysis for each system
The life cycle cost of each system was calculated using a spreadsheet and then
compared to values calculated in TRACE. The initial cost of the WSHP with seawater loop
is higher than the other two systems, however the operation and maintenance costs are
substantially less giving it a lower life cycle cost. Using present worth analysis and
comparing the total cost per year, the WSHP with seawater loop was found to have a
payback of 4 years compared to Option 1, and a payback of 13 years compared to Option
2. Savings from choosing WSHP with seawater loop are $695,000 (18.3%) over VAV with
Ice Storage and $220,000 (5.8%) over FCU with Thermal Ice Storage over a 50 year
analysis. Figures 9.1 and 9.2 show the life cycle cost of each system over 50 years.
All costs are calculated using present worth analysis and include the rate of inflation,
return on investment, and utility rate increases as specified by the OPR.
9.2: Initial Cost
The initial cost for every system (besides the equipment specified within each option)
includes HVAC ductwork, hydronic piping, and temperature controls for the entirety of the
building (46,420 ft2). A design contingency of 10%, a construction contingency of 5%,
sales tax at 7%, and all labor costs were included as well.
9.3: Operating Cost
The operating cost for every system includes utilities for on-peak and off-peak electricity
consumption ($/kWh), on-peak electricity demand ($/kW), city water ($/ft3 ), and city sewer
($/gal).
9.4: Maintenance and Repair Cost
Two case studies in Chapter 37 of the 2011 ASHRAE Handbook HVAC Applications
covering over 500 buildings outline the mean and median maintenance cost per square
foot of buildings. From these studies, the maintenance costs were estimated. On average,
heat pumps are more expensive to maintain than their FCU and VAV counterparts, which
is accounted for in the annual maintenance cost per system. Chapter 37 also identifies the
median service life of components, including heat pumps, VAV units, FCU’s, chillers, and
cooling towers. A survival curve for centrifugal chillers over a 50 year span gives an
estimate for the survival of other components. This curve was used along with the median
service life to identify how many units are likely to fail over time.
The annual maintenance cost for every system includes the cost to clean and maintain the
photovoltaic array at a rate of $2,000 per year. The replacement cost for every system
includes the present cost of $21,150 to replace the photovoltaic array at year 25. All other
maintenance and replacement costs for each system vary depending on components
used.
$1,500,000
$2,000,000
$2,500,000
$3,000,000
$3,500,000
$4,000,000
$4,500,000
0 5 10 15 20 25 30 35 40 45 50
Pre
se
nt W
ort
h C
ost
Year
WSHP w/Sea Loop VAV w/Ice Storage FCU/DOAS w/Ice Storage
$1,800,482 $1,704,898 $1,630,881
$2,000,656$2,791,328
$2,390,868
$0
$500,000
$1,000,000
$1,500,000
$2,000,000
$2,500,000
$3,000,000
$3,500,000
$4,000,000
$4,500,000
$5,000,000
WSHP w/Sea Loop VAV w/Ice Storage FCU/DOAS w/Ice Storage
Pre
se
nt
Wo
rth
Co
st
Initial Cost Operating and Maintenance Cost
$3,801,138
$4,496,227
$4,021,749
9.0: Cost14
Figure 9.1: Initial, Operating, and Maintenance Cost
Figure 9.2: Life Cycle Cost

VAV with Thermal Ice Storage
Initial Cost
Annual Maintenance
Cost
Replacement Cost
Utility CostLife Cycle
Cost
Methods of calculation:
AHU per CFM; VAV boxes, chillers, and thermal storage per each; Temperature controls, HVAC ductwork, and
hydronic piping per square foot of the building. Other factors include sales tax at 7%, design contingency at 10%,
construction contingency at 5%, and overhead and profit at 5%.
Annual utility cost including electricity, water, and sewer.
$1.7M $14,000 $4,000-60,000 $105,600 $4.5M
FCU/DOAS with Thermal Ice Storage
Initial Cost
Annual Maintenance
Cost
Replacement Cost
Utility CostLife Cycle
Cost
$1.63M $14,000 $6,000-27,150 $87,900 $4.0M
WSHP with Seawater Loop
Initial Cost
Annual Maintenance
Cost
Replacement Cost
Utility CostLife Cycle
Cost
$1.8M $17,000 $9,000-30,150 $67,900 $3.8M
19.39%
18.36%
17.56%
15.0%
15.5%
16.0%
16.5%
17.0%
17.5%
18.0%
18.5%
19.0%
19.5%
20.0%
WSHP w/Sea Loop VAV w/Ice Storage FCU/DOAS w/Ice Storage
Initial Cost of System as a Percent of Total Building Budget
Cost Per Square Foot
WSHP w/Sea
Loop
VAV w/Ice
Storage
FCU/DOAS w/Ice
Storage
HVAC $/ft2 $38.78 $36.72 $35.13
%HVAC of Total Building Budget 19.39% 18.36% 17.56%
VAV with Thermal Ice StorageThe initial cost of the VAV with Ice Storage system is $1.7 million including 3 AHUs, 50
VAV units, a 100 ton water cooled chiller, and a 790 ton-hour thermal storage system.
The annual maintenance cost was estimated to be $14,000 starting after the first year.
In addition, the replacement cost of the chiller was estimated to be $60,000 at year 20
and 40 along with $4,000 replacement costs for VAV units starting in year 20.
FCU/DOAS with Thermal Ice StorageThe initial cost of the FCU/DOAS with Ice Storage system is $1.63 million including 50
FCUs, an energy recovery ventilator supplying 12,000 CFM, a 100 ton water cooled
chiller, and a 790 ton-hour thermal storage system. The annual maintenance cost was
estimated to be $14,000 starting after the first year. In addition, the replacement cost
was estimated to be $6,000/year starting in year 15.
WSHP with Seawater LoopThe initial cost of the WSHP with seawater loop system is $1.8 million including 50
WSHP units (starting at half ton), an energy recovery ventilator supplying 12,000 CFM,
and 77,400 feet of geothermal sea loop. The annual maintenance cost was estimated to
be $17,000 starting after the first year. In addition, the replacement cost was estimated
to be $9,000/year starting in year 20.
9.0: Cost15

10.0: Decision Matrix
10.1: Decision Matrix Description
Team NUE Air created a decision matrix in order to select an HVAC system for the
building that fulfills all design goals (see Figure 10.1). This matrix includes values on a
scale from 0 to 5 (0 as worst, 5 as best) for each system type in a variety of categories
and each category is weighted overall. The matrix is divided into plant systems and
distribution systems to allow a more detailed analysis of individual components for each
system option.
Figure 10.1: Decision Matrix
16
Initial
Cost
Operating
Cost
Temp
Control
Humidity
Control
Controll-
ability
Indoor Air
Quality
System
Reliability
Design
Flexibility
Spatial
RequirementNoise
Sustain-
ability
High
Performance
Building
Compliance
Maintenace
Requirement
Synergy with
ArchitectureTotal
Category Weighting 20% 20% n/a n/a 6% n/a 12% 9% 3% 3% 12% 6% 6% 3%
Air Cooled Condenser 5 1 n/a n/a 3 n/a 2 3 4 1 1 3 2 2 50%
Water Cooled Condenser 3 3 n/a n/a 3 n/a 3 3 3 2 4 4 2 2 61%
Ground Source Condenser 1 5 n/a n/a 3 n/a 4 3 3 5 4 4 3 3 67%
Non-condensing Boiler 4 2 n/a n/a 2 n/a 4 3 3 3 2 2 3 3 58%
Condensing Boiler 2 4 n/a n/a 4 n/a 3 3 3 3 4 3 3 3 64%
District Energy 5 1 n/a n/a 2 n/a 5 4 5 5 3 2 5 4 70%
Category Weighting 20% 20% 3% 3% 3% 6% 9% 9% 3% 3% 12% 3% 3% 3%
Constant Volume 3 3 2 3 2 3 3 3 4 3 3 1 3 2 58%
Variable Volume 2 3 5 3 5 4 3 3 3 2 3 3 3 3 59%
Many Air Source Heat Pumps 2 4 4 3 4 2 4 4 2 3 3 4 4 3 64%
Many Water Source Heat Pumps 3 4 4 4 4 3 4 4 3 4 4 4 4 4 74%
Fan Coil Unit 4 3 4 1 3 1 3 3 3 1 2 3 4 3 58%
Displacement Ventilation 2 4 3 1 3 4 3 2 2 4 2 3 3 3 56%
Energy Recovery Ventilator 2 4 4 3 3 4 3 4 3 4 3 5 4 4 67%
Pla
nt
Sy
ste
ms
Dis
trib
ute
d S
ys
tem
s

11.0: Selected System
11.1: System Description
After comparing all HVAC system options against the Baseline and each other, team
NUE Air chose the water source heat pump system utilizing a closed seawater loop
field as the optimal system for the building. This system fulfills all design goals
established by team NUE Air. The system has the lowest life cycle cost of the three
systems considered. The seawater loop field provides a sustainable energy source
with a low environmental impact. Comfort and indoor environmental quality are easily
maintained due to the adjustability of the system within the building. The system is a
high-performing, sustainable, low-carbon design that is easily integrated into the
building, making it architecturally-pleasing. As evidenced by the analysis conducted
by team NUE Air, the system provides a highly-efficient, sustainable, and reliable
option for the Doha Junior College.
12.0: Conclusion17
12.1: Recommendation
The water source heat pump system with dedicated outside air system utilizing a closed seawater
loop field is the optimal system selected. Team NUE Air recommends this system for
implementation to the new junior college in Doha, Qatar. While all three system options are viable
for the building, this water source heat pump with seawater loop field system scored the highest on
the decision matrix and provides the most suitable design for both the building’s and the Owner’s
requirements.
This system showed a 44% energy improvement over the Baseline. This system is projected to
cost $3.8 million over a 50 year period, which is $695,000 less than the VAV with thermal ice
storage option and $220,600 less than the FCU/DOAS with thermal ice storage option.
Team NUE Air chose the water source heat pump system with dedicated outside air system
utilizing a closed seawater loop field as the optimal system because it encompasses elements of
efficiency; occupant health, safety, and comfort; and sustainability in a single, maintainable design
that has a low life cycle cost.
Figure 11.1: Junior College in Doha, Qatar
(source: authors)

ANSI/ASHRAE/IES Standard 90.1-2010: Energy standard for buildings except low-rise residential buildings. (I-P ed.). (2010). American Society of Heating, Refrigeration, and Air Conditioning Engineers, Inc.
Atlanta: ASHRAE.
ANSI/ASHRAE Standard 55-2004: Thermal environmental conditions for human occupancy. (2004). American Society of Heating, Refrigeration, and Air Conditioning Engineers, Inc. Atlanta, Ga.: ASHRAE.
ANSI/ASHRAE Standard 62.1-2010: Ventilation for acceptable indoor air quality. (2010). American Society of Heating, Refrigeration, and Air Conditioning Engineers, Inc. Atlanta, GA: ASHRAE.
ANSI/ASHRAE Standard 189.1-2013: Standard for the design of high-performance green buildings.(I-P ed). (2013). American Society of Heating, Refrigeration, and Air Conditioning Engineers, Inc. Atlanta:
ASHRAE.
ASHRAE GreenGuide: The Design, Construction, and Operation of Sustainable Buildings. 2nd ed. American Society of Heating, Refrigeration, and Air Conditioning Engineers, Inc. Atlanta, GA: ASHRAE,
2006. Print.
2011 ASHRAE Handbook: Applications. American Society of Heating, Refrigeration, and Air Conditioning Engineers, Inc. Atlanta, GA: ASHRAE, 2011. Print.
2013 ASHRAE Handbook: Fundamentals. American Society of Heating, Refrigeration, and Air Conditioning Engineers, Inc. Atlanta, GA: ASHRAE, 2013. Print.
2012 ASHRAE Handbook: Heating, Ventilating, and Air-conditioning Systems and Equipment. American Society of Heating, Refrigeration, and Air Conditioning Engineers, Inc. Atlanta, GA: ASHRAE, 2012.
Print.
Climate change 2007: Impacts, adaptation and vulnerability : Working Group II contribution to the Fourth Assessment Report of the IPCC Intergovernmental Panel on Climate Change. (2008). Geneva: IPCC
Secretariat.
2015 ENR Mechanical Electrical Costbook
Mehta, M., Johnson, J., & Rocafort, J., (1999). Architectural acoustics: Principles and design. Upper Saddle River, N.J.: Prentice Hall.
References18

Figure A1.1: First Floor Zoning Diagram
Figure A1.2: Second Floor Zoning Diagram
Figure A1.3: Third Floor Zoning Diagram
Appendix A: Zoning Diagrams19

B.1: Option 1 – VAV Air Handling System Utilizing Thermal Storage
B.2: Option 2 – Fan Coil Units With Dedicated Outside Air System Utilizing Thermal Ice Storage
Appendix B: System Schematics20

B.3: Option 3 – Water Source Heat Pump System Utilizing a Closed Seawater Loop Field
Appendix B: System Schematics21

B.4: One-Line Diagram
B.5: Pressurization Diagram
Appendix B: System Schematics22

Year Utility Cost
Annual
Maintenance
Cost
Replacement
Cost Initial Cost Present Worth
0 $1,800,482 $1,800,482
1 $67,929 $17,510 $79,850
2 $70,287 $18,035 $77,144
3 $72,727 $18,576 $74,531
4 $75,252 $19,134 $72,006
5 $77,864 $19,708 $69,567
6 $80,568 $20,299 $67,212
7 $83,365 $20,908 $64,936
8 $86,260 $21,535 $62,738
9 $89,256 $22,181 $60,614
10 $92,356 $22,847 $58,563
11 $95,564 $23,532 $56,582
12 $98,884 $24,238 $54,667
13 $102,319 $24,965 $52,818
14 $105,873 $25,714 $51,032
15 $109,552 $26,485 $49,306
16 $113,358 $27,280 $47,639
17 $117,298 $28,098 $46,029
18 $121,374 $28,941 $44,473
19 $125,592 $29,810 $42,970
20 $129,957 $30,704 $14,400 $45,239
21 $134,474 $31,625 $14,670 $43,658
22 $139,148 $32,574 $14,940 $42,132
23 $143,986 $33,551 $15,210 $40,659
24 $148,991 $34,557 $15,480 $39,238
25 $154,171 $35,594 $31,613 $40,789
26 $159,532 $36,662 $16,020 $36,542
27 $165,079 $37,762 $16,290 $35,265
28 $170,819 $38,895 $16,560 $34,032
29 $176,760 $40,062 $16,830 $32,843
30 $182,907 $41,263 $17,100 $31,695
31 $189,269 $42,501 $17,370 $30,588
32 $195,852 $43,776 $17,640 $29,519
33 $202,664 $45,090 $17,910 $28,488
34 $209,714 $46,442 $18,180 $27,494
35 $217,010 $47,836 $18,450 $26,534
36 $224,560 $49,271 $18,720 $25,609
37 $232,373 $50,749 $18,990 $24,715
38 $240,458 $52,271 $19,260 $23,854
39 $248,825 $53,839 $19,530 $23,022
40 $257,483 $55,455 $19,800 $22,220
41 $266,444 $57,118 $20,070 $21,447
42 $275,717 $58,832 $20,340 $20,700
43 $285,313 $60,597 $20,610 $19,980
44 $295,243 $62,415 $20,880 $19,285
45 $305,520 $64,287 $21,150 $18,615
46 $316,155 $66,216 $21,420 $17,968
47 $327,160 $68,202 $21,690 $17,344
48 $338,550 $70,248 $21,960 $16,742
49 $350,336 $72,356 $22,230 $16,161
50 $362,534 $74,526 $22,500 $15,601
Total $3,801,138
Life Cycle Cost for WSHP w/Sea Loop
Year Utility Cost
Annual
Maintenance
Cost
Replacement
Cost Initial Cost Present Worth
0 $1,630,881 $1,630,881
1 $87,939 $14,420 $95,663
2 $90,992 $14,853 $92,448
3 $94,150 $15,298 $89,343
4 $97,419 $15,757 $86,342
5 $100,801 $16,230 $83,442
6 $104,302 $16,717 $80,640
7 $107,923 $17,218 $77,932
8 $111,671 $17,735 $75,316
9 $115,550 $18,267 $72,787
10 $119,563 $18,815 $70,344
11 $123,716 $19,379 $67,984
12 $128,014 $19,961 $65,703
13 $132,461 $20,559 $63,498
14 $137,064 $21,176 $61,368
15 $141,826 $21,812 $8,700 $62,463
16 $146,754 $22,466 $8,880 $60,329
17 $151,854 $23,140 $9,060 $58,267
18 $157,131 $23,834 $9,240 $56,275
19 $162,592 $24,549 $9,420 $54,351
20 $168,244 $25,286 $9,600 $52,492
21 $174,092 $26,044 $9,780 $50,697
22 $180,144 $26,825 $9,960 $48,964
23 $186,406 $27,630 $10,140 $47,289
24 $192,887 $28,459 $10,320 $45,672
25 $199,593 $29,313 $26,363 $47,033
26 $206,533 $30,192 $10,680 $42,602
27 $213,715 $31,098 $10,860 $41,146
28 $221,147 $32,031 $11,040 $39,739
29 $228,838 $32,992 $11,220 $38,381
30 $236,797 $33,982 $11,400 $37,069
31 $245,033 $35,001 $11,580 $35,802
32 $253,556 $36,051 $11,760 $34,579
33 $262,376 $37,133 $11,940 $33,398
34 $271,503 $38,247 $12,120 $32,258
35 $280,949 $39,394 $12,300 $31,156
36 $290,723 $40,576 $12,480 $30,093
37 $300,839 $41,793 $12,660 $29,066
38 $311,307 $43,047 $12,840 $28,074
39 $322,139 $44,338 $13,020 $27,117
40 $333,349 $45,669 $13,200 $26,192
41 $344,950 $47,039 $13,380 $25,300
42 $356,956 $48,450 $13,560 $24,438
43 $369,380 $49,903 $13,740 $23,605
44 $382,237 $51,400 $13,920 $22,801
45 $395,542 $52,942 $14,100 $22,025
46 $409,311 $54,531 $14,280 $21,276
47 $423,560 $56,167 $14,460 $20,552
48 $438,306 $57,852 $14,640 $19,853
49 $453,566 $59,587 $14,820 $19,178
50 $469,358 $61,375 $15,000 $18,526
Total $4,021,749
Life Cycle Cost for FCU/DOAS w/Ice Storage
Year Utility Cost
Annual
Maintenance
Cost
Replacement
Cost Initial Cost Present Worth
0 $1,704,898 $1,704,898
1 $105,609 $14,420 $112,177
2 $109,238 $14,853 $108,386
3 $112,993 $15,298 $104,724
4 $116,877 $15,757 $101,186
5 $120,895 $16,230 $97,768
6 $125,052 $16,717 $94,467
7 $129,353 $17,218 $91,277
8 $133,803 $17,735 $88,196
9 $138,406 $18,267 $85,219
10 $143,168 $18,815 $82,344
11 $148,095 $19,379 $79,566
12 $153,192 $19,961 $76,882
13 $158,466 $20,559 $74,289
14 $163,922 $21,176 $71,784
15 $169,566 $21,812 $69,364
16 $175,406 $22,466 $67,026
17 $181,448 $23,140 $64,767
18 $187,699 $23,834 $62,585
19 $194,166 $24,549 $60,476
20 $200,857 $25,286 $102,400 $84,902
21 $207,779 $26,044 $6,520 $58,046
22 $214,941 $26,825 $6,640 $56,069
23 $222,351 $27,630 $6,760 $54,159
24 $230,018 $28,459 $6,880 $52,314
25 $237,950 $29,313 $22,863 $53,455
26 $246,156 $30,192 $7,120 $48,812
27 $254,647 $31,098 $7,240 $47,150
28 $263,432 $32,031 $7,360 $45,545
29 $272,521 $32,992 $7,480 $43,995
30 $281,925 $33,982 $7,600 $42,498
31 $291,655 $35,001 $7,720 $41,052
32 $301,722 $36,051 $7,840 $39,656
33 $312,138 $37,133 $7,960 $38,307
34 $322,914 $38,247 $8,080 $37,005
35 $334,064 $39,394 $8,200 $35,747
36 $345,601 $40,576 $8,320 $34,532
37 $357,537 $41,793 $8,440 $33,359
38 $369,888 $43,047 $8,560 $32,226
39 $382,666 $44,338 $8,680 $31,132
40 $395,888 $45,669 $140,800 $38,890
41 $409,568 $47,039 $8,920 $29,054
42 $423,722 $48,450 $9,040 $28,068
43 $438,367 $49,903 $9,160 $27,116
44 $453,520 $51,400 $9,280 $26,197
45 $469,199 $52,942 $9,400 $25,309
46 $485,422 $54,531 $9,520 $24,451
47 $502,207 $56,167 $9,640 $23,622
48 $519,575 $57,852 $9,760 $22,822
49 $537,546 $59,587 $9,880 $22,049
50 $556,140 $61,375 $10,000 $21,303
Total $4,496,227
Life Cycle Cost for VAV w/Ice Storage
Appendix C: Life Cycle Cost Analysis23
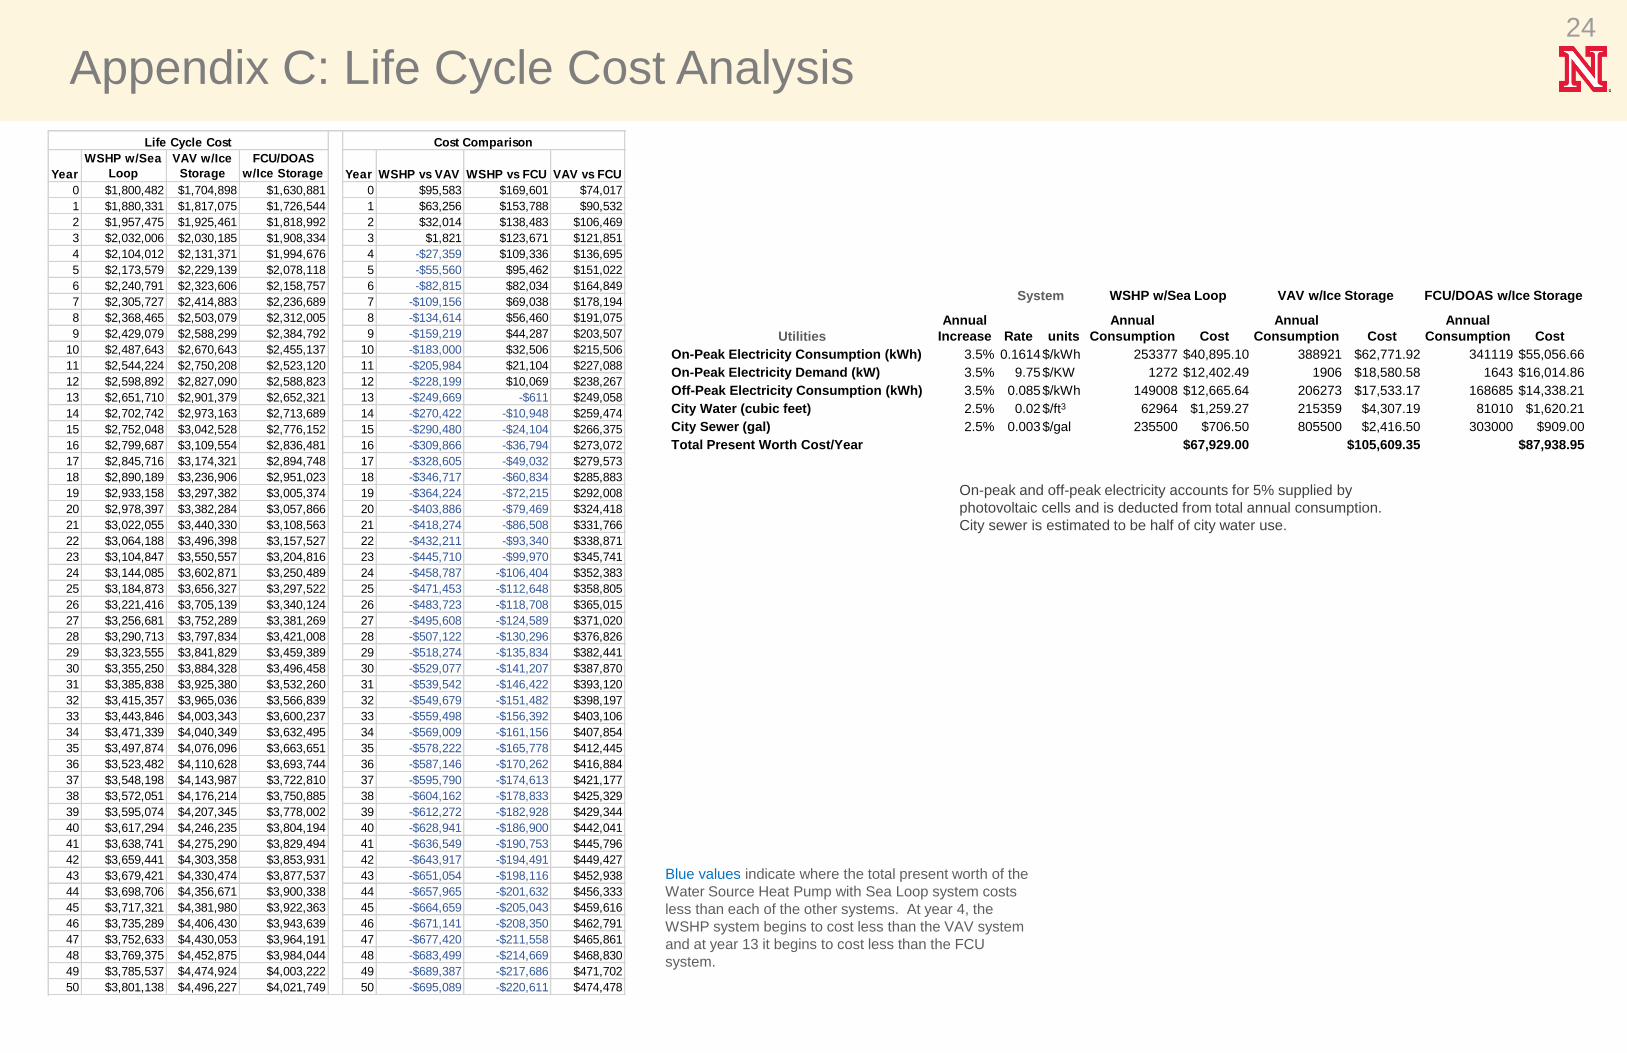
Blue values indicate where the total present worth of the
Water Source Heat Pump with Sea Loop system costs
less than each of the other systems. At year 4, the
WSHP system begins to cost less than the VAV system
and at year 13 it begins to cost less than the FCU
system.
Year
WSHP w/Sea
Loop
VAV w/Ice
Storage
FCU/DOAS
w/Ice Storage Year WSHP vs VAV WSHP vs FCU VAV vs FCU
0 $1,800,482 $1,704,898 $1,630,881 0 $95,583 $169,601 $74,017
1 $1,880,331 $1,817,075 $1,726,544 1 $63,256 $153,788 $90,532
2 $1,957,475 $1,925,461 $1,818,992 2 $32,014 $138,483 $106,469
3 $2,032,006 $2,030,185 $1,908,334 3 $1,821 $123,671 $121,851
4 $2,104,012 $2,131,371 $1,994,676 4 -$27,359 $109,336 $136,695
5 $2,173,579 $2,229,139 $2,078,118 5 -$55,560 $95,462 $151,022
6 $2,240,791 $2,323,606 $2,158,757 6 -$82,815 $82,034 $164,849
7 $2,305,727 $2,414,883 $2,236,689 7 -$109,156 $69,038 $178,194
8 $2,368,465 $2,503,079 $2,312,005 8 -$134,614 $56,460 $191,075
9 $2,429,079 $2,588,299 $2,384,792 9 -$159,219 $44,287 $203,507
10 $2,487,643 $2,670,643 $2,455,137 10 -$183,000 $32,506 $215,506
11 $2,544,224 $2,750,208 $2,523,120 11 -$205,984 $21,104 $227,088
12 $2,598,892 $2,827,090 $2,588,823 12 -$228,199 $10,069 $238,267
13 $2,651,710 $2,901,379 $2,652,321 13 -$249,669 -$611 $249,058
14 $2,702,742 $2,973,163 $2,713,689 14 -$270,422 -$10,948 $259,474
15 $2,752,048 $3,042,528 $2,776,152 15 -$290,480 -$24,104 $266,375
16 $2,799,687 $3,109,554 $2,836,481 16 -$309,866 -$36,794 $273,072
17 $2,845,716 $3,174,321 $2,894,748 17 -$328,605 -$49,032 $279,573
18 $2,890,189 $3,236,906 $2,951,023 18 -$346,717 -$60,834 $285,883
19 $2,933,158 $3,297,382 $3,005,374 19 -$364,224 -$72,215 $292,008
20 $2,978,397 $3,382,284 $3,057,866 20 -$403,886 -$79,469 $324,418
21 $3,022,055 $3,440,330 $3,108,563 21 -$418,274 -$86,508 $331,766
22 $3,064,188 $3,496,398 $3,157,527 22 -$432,211 -$93,340 $338,871
23 $3,104,847 $3,550,557 $3,204,816 23 -$445,710 -$99,970 $345,741
24 $3,144,085 $3,602,871 $3,250,489 24 -$458,787 -$106,404 $352,383
25 $3,184,873 $3,656,327 $3,297,522 25 -$471,453 -$112,648 $358,805
26 $3,221,416 $3,705,139 $3,340,124 26 -$483,723 -$118,708 $365,015
27 $3,256,681 $3,752,289 $3,381,269 27 -$495,608 -$124,589 $371,020
28 $3,290,713 $3,797,834 $3,421,008 28 -$507,122 -$130,296 $376,826
29 $3,323,555 $3,841,829 $3,459,389 29 -$518,274 -$135,834 $382,441
30 $3,355,250 $3,884,328 $3,496,458 30 -$529,077 -$141,207 $387,870
31 $3,385,838 $3,925,380 $3,532,260 31 -$539,542 -$146,422 $393,120
32 $3,415,357 $3,965,036 $3,566,839 32 -$549,679 -$151,482 $398,197
33 $3,443,846 $4,003,343 $3,600,237 33 -$559,498 -$156,392 $403,106
34 $3,471,339 $4,040,349 $3,632,495 34 -$569,009 -$161,156 $407,854
35 $3,497,874 $4,076,096 $3,663,651 35 -$578,222 -$165,778 $412,445
36 $3,523,482 $4,110,628 $3,693,744 36 -$587,146 -$170,262 $416,884
37 $3,548,198 $4,143,987 $3,722,810 37 -$595,790 -$174,613 $421,177
38 $3,572,051 $4,176,214 $3,750,885 38 -$604,162 -$178,833 $425,329
39 $3,595,074 $4,207,345 $3,778,002 39 -$612,272 -$182,928 $429,344
40 $3,617,294 $4,246,235 $3,804,194 40 -$628,941 -$186,900 $442,041
41 $3,638,741 $4,275,290 $3,829,494 41 -$636,549 -$190,753 $445,796
42 $3,659,441 $4,303,358 $3,853,931 42 -$643,917 -$194,491 $449,427
43 $3,679,421 $4,330,474 $3,877,537 43 -$651,054 -$198,116 $452,938
44 $3,698,706 $4,356,671 $3,900,338 44 -$657,965 -$201,632 $456,333
45 $3,717,321 $4,381,980 $3,922,363 45 -$664,659 -$205,043 $459,616
46 $3,735,289 $4,406,430 $3,943,639 46 -$671,141 -$208,350 $462,791
47 $3,752,633 $4,430,053 $3,964,191 47 -$677,420 -$211,558 $465,861
48 $3,769,375 $4,452,875 $3,984,044 48 -$683,499 -$214,669 $468,830
49 $3,785,537 $4,474,924 $4,003,222 49 -$689,387 -$217,686 $471,702
50 $3,801,138 $4,496,227 $4,021,749 50 -$695,089 -$220,611 $474,478
Cost ComparisonLife Cycle Cost
On-peak and off-peak electricity accounts for 5% supplied by
photovoltaic cells and is deducted from total annual consumption.
City sewer is estimated to be half of city water use.
System WSHP w/Sea Loop VAV w/Ice Storage FCU/DOAS w/Ice Storage
Utilities
Annual
Increase Rate units
Annual
Consumption Cost
Annual
Consumption Cost
Annual
Consumption Cost
On-Peak Electricity Consumption (kWh) 3.5% 0.1614$/kWh 253377 $40,895.10 388921 $62,771.92 341119 $55,056.66
On-Peak Electricity Demand (kW) 3.5% 9.75$/KW 1272 $12,402.49 1906 $18,580.58 1643 $16,014.86
Off-Peak Electricity Consumption (kWh) 3.5% 0.085$/kWh 149008 $12,665.64 206273 $17,533.17 168685 $14,338.21
City Water (cubic feet) 2.5% 0.02$/ft3 62964 $1,259.27 215359 $4,307.19 81010 $1,620.21
City Sewer (gal) 2.5% 0.003$/gal 235500 $706.50 805500 $2,416.50 303000 $909.00
Total Present Worth Cost/Year $67,929.00 $105,609.35 $87,938.95
Appendix C: Life Cycle Cost Analysis24

Appendix C: Life Cycle Cost Analysis25
VAV w/Ice Storage
Item Quantity Material Labor Total Cost
# Units Unit Unit Rate Total Unit Rate Total
Central Air Handling Unit (low end) 56000 CFM $3 $168,000 $2 $112,000 $280,000
VAV Units 50 EA $1,600 $80,000 $800 $40,000 $120,000
HVAC Ductwork 46430 SF $4 $185,720 $4 $185,720 $371,440
Hydronic Piping 46430 SF $2 $92,860 $3 $139,290 $232,150
Water Cooled Chiller (100 tons) 1 EA $45,000 $45,000 $15,000 $15,000 $60,000
Thermal Storage Sys (790 ton-hr) 1 EA $100,000 $100,000 $75,000 $75,000 $175,000
Temperature Controls 46430 SF $2 $69,645 $2 $92,860 $162,505
Subtotal $741,225 $659,870 $1,401,095
Design Contingency 10% $74,123 10% $65,987 $140,110
Sales Tax 7% $5,189 $0 $5,189
Subtotal $820,536 $725,857 $1,546,393
Overhead and Profit 5% $41,027 5% $36,293 $77,320
City Multiplier 100% $861,563 100% $762,150 $1,623,713
Total Contractor Cost $861,563 $762,150 $1,623,713
Construction Contingency 5% $43,078 5% $38,107 $81,186
Total Cost $904,641 $800,257 $1,704,898
FCU/DOAS w/Ice Storage
Item Quantity Material Labor Total Cost
# Units Unit Unit Rate Total Unit Rate Total
Energy Recovery Ventilator with DX cooling and HGR 12000 CFM $6 $72,000 $2 $24,000 $96,000
Fan Coil Units 50 EA $2,000 $100,000 $1,000 $50,000 $150,000
HVAC Ductwork 46430 SF $4 $185,720 $4 $185,720 $371,440
Hydronic Piping 46430 SF $4 $185,720 $3 $139,290 $325,010
Water Cooled Chiller (100 tons) 1 EA $45,000 $45,000 $15,000 $15,000 $60,000
Thermal Storage Sys (600 ton-hr) 1 EA $100,000 $100,000 $75,000 $75,000 $175,000
Temperature Controls 46430 SF $2 $69,645 $2 $92,860 $162,505
Subtotal $758,085 $581,870 $1,339,955
Design Contingency 10% $75,809 10% $58,187 $133,996
Sales Tax 7% $5,307 $0 $5,307
Subtotal $839,200 $640,057 $1,479,257
Overhead and Profit 5% $41,960 5% $32,003 $73,963
City Multiplier 100% $881,160 100% $672,060 $1,553,220
Total Contractor Cost $881,160 $672,060 $1,553,220
Construction Contingency 5% $44,058 5% $33,603 $77,661
Total Cost $925,218 $705,663 $1,630,881
WSHP w/Sea Loop
Item Quantity Material Labor Total Cost
# Units Unit Unit Rate Total Unit Rate Total
Water Source Heat Pumps 165 Ton $1,050 $174,000 $510 $84,000 $258,000
Energy Recovery Ventilator with DX cooling and HGR 12000 CFM $6 $72,000 $2 $24,000 $96,000
HVAC Ductwork 46430 SF $4 $185,720 $4 $185,720 $371,440
Hydronic Piping 46430 SF $2 $92,860 $3 $139,290 $232,150
Geothermal Loopfield (300 foot deep = 1.5 tons) 120 EA $1,000 $120,000 $2,000 $240,000 $360,000
Temperature Controls 46430 SF $2 $69,645 $2 $92,860 $162,505
Subtotal $712,225 $767,870 $1,480,095
Design Contingency 10% $71,223 10% $76,787 $148,010
Sales Tax 7% $4,986 $0 $4,986
Subtotal $788,433 $844,657 $1,633,090
Overhead and Profit 5% $39,422 5% $42,233 $81,655
City Multiplier 100% $827,855 100% $886,890 $1,714,745
Total Contractor Cost $827,855 $886,890 $1,714,745
Construction Contingency 5% $41,393 5% $44,344 $85,737
Total Cost $869,247 $931,234 $1,800,482

D.1: From Section 3.1: Weather Data - Dry climate calculation:
D.2: From Section 4.4: Creative High Performance Green Design - Water fountain
spray cooling tower calculation:
##
Assuming 50%, 39°C
Find rate of evaporation per area :
Where: Saturation vapor pressure at water temperature
Saturation vapor pressure at room air dew point
Velocity accounting for water jet and wind
Latent heat of evaporation
Find surface areas :
Find rate of evaporation :
Convert to tons of cooling:
D.3: From Section 6.1: Modeling Software - Curtain wall U-value
calculations:
Appendix D: Hand Calculations26

Appendix E: Noise Control Calculations27
Figure E1.1: NC-35 compliant path report for air supplied at 350ft/min
(source: Trane Acoustics Program 2012)
Figure E1.2: NC-30 compliance path report for air supplied at 300ft/min
(source: Trane Acoustics Program 2012)
Figure E2.1: Shop to office transmission loss path report
(source: Trane Acoustics Program 2012)