Embed Size (px)
Citation preview
ASHRAE Level II
Energy and Water Assessment
State University of New York College of Optometry 33 West 42nd Street
New York, NY 10036
Version 2.7 November 25, 2013
Prepared For: SUNY State College of Optometry
33 W 42nd Street New York, NY 10036
Prepared By:
Lilker EMO Energy Solutions 3130 Fairview Park Drive, Suite 125
Falls Church, VA 22042
ASHRAE Level II Energy Audit
SUNY College of Optometry
EMO Energy Solutions Confidential and Proprietary Information-Unauthorized Disclosure Prohibited
Page 2 of 97
TABLE OF CONTENTS AUDIT DISCLAIMER ................................................................................................................................................ 4
CONTACTS ............................................................................................................................................................. 5
DEFINITION OF ACRONYMS ................................................................................................................................... 6
PROJECT OVERVIEW .............................................................................................................................................. 7
RESOURCE USAGE AND FACILITY BENCHMARK .................................................................................................... 11
METHODOLOGY ................................................................................................................................................... 16
FACILITY OVERVIEW ............................................................................................................................................. 16
MECHANICAL SYSTEMS ........................................................................................................................................ 16 CONDENSER WATER SYSTEM ......................................................................................................................................... 17 COOLING SYSTEM ........................................................................................................................................................ 18 HEATING SYSTEM ......................................................................................................................................................... 22 AIR DISTRIBUTION SYSTEM ............................................................................................................................................ 22 DOMESTIC HOT WATER ................................................................................................................................................ 23 OUTSIDE AIR/BUILDING VENTILATION ............................................................................................................................. 23
ELECTRICAL SYSTEMS ........................................................................................................................................... 24 LIGHTING ................................................................................................................................................................... 24 TRANSFORMERS .......................................................................................................................................................... 24 ENERGY MANAGEMENT SYSTEM ..................................................................................................................................... 25 MISCELLANEOUS EQUIPMENT ........................................................................................................................................ 26
BUILDING SHELL ................................................................................................................................................... 28 WINDOWS ................................................................................................................................................................. 28 ROOF ........................................................................................................................................................................ 28
ENERGY CONSERVATION MEASURES ................................................................................................................... 29
LOW/NO COST MEASURES................................................................................................................................... 29 ECM-1: CONDENSER WATER RESET ............................................................................................................................... 29 ECM-2: IMPROVE OCCUPIED TEMPERATURE SETTINGS ...................................................................................................... 31 ECM-3: SYNCHRONOUS AND COG BELTS ......................................................................................................................... 33 ECM-4: LOW FLOW SHOWERHEADS ............................................................................................................................... 35 ECM-5: PROGRAM COMPUTERS TO HIBERNATE ................................................................................................................ 37 ECM-6: SHUT OFF PRINTERS AT NIGHTS AND ON WEEKENDS .............................................................................................. 39 ECM-7: CAGE WASH HOT WATER FROM DOMESTIC HOT WATER LOOP ............................................................................... 41 ECM-8: SUPPLY AIR TEMPERATURE RESET ....................................................................................................................... 43 ECM-9: OUTDOOR LIGHTING ........................................................................................................................................ 45 ECM-10: DEMAND CONTROL VENTILATION .................................................................................................................... 47 ECM-11: VFD DOMESTIC WATER BOOSTER PUMP ........................................................................................................... 49
CAPITAL INTENSIVE MEASURES ........................................................................................................................... 51 ECM-12: VFD CONTROLS ON CONDENSER WATER PUMPS ................................................................................................ 51 ECM-13: IMPROVED WATER TREATMENT FOR COOLING TOWERS ....................................................................................... 53 ECM-14: SOLAR FILM ON SOUTH SIDE WINDOWS ............................................................................................................ 56
ASHRAE Level II Energy Audit
SUNY College of Optometry
EMO Energy Solutions Confidential and Proprietary Information-Unauthorized Disclosure Prohibited
Page 3 of 97
ECM-15: RETRO-COMMISSIONING BUILDING .................................................................................................................. 58 ECM-16: DATA CENTER VIRTUALIZATION ........................................................................................................................ 62 ECM-17: OPTIMIZE DATA CENTER POWER AND UTILIZATION MANAGEMENT ......................................................................... 65 ECM-18: OCCUPANCY SENSORS .................................................................................................................................... 69 ECM-19: INDOOR LIGHTING ......................................................................................................................................... 71 ECM-20: ENERGY STAR ELECTRIC TRANSFORMERS ........................................................................................................... 73 ECM-21: REPLACE SELF CONTAINED UNITS .................................................................................................................... 75 ECM-22: ZONE BOXES REPLACED ................................................................................................................................. 77 ECM-23: IMPROVED PERIMETER HEATING WITH VFD, ZONE CONTROLS AND NIGHT SETBACK .................................................. 79 ECM-24: CONDENSATE RECOVERY (INCLUDING CAGE WASH) ............................................................................................. 81 ECM-25: INSULATE STEAM STATION PIPING.................................................................................................................... 83 ECM-26: COMBINED HEAT AND POWER ........................................................................................................................ 85
MEASURES CONSIDERED BUT NOT RECOMMENDED ........................................................................................... 86 DEMAND CONTROL VENTILATION ................................................................................................................................... 86 SCU’S ON OPTIMAL START/STOP ................................................................................................................................... 86 SOLAR FILM ON EAST AND WEST SIDES OF THE BUILDING .................................................................................................... 86 PV SOLAR PANELS ....................................................................................................................................................... 86 WIND POWER ............................................................................................................................................................. 86
APPENDIX A: ........................................................................................................................................................ 87 ECONOMIC PRIORITY OF ENERGY CONSERVATION MEASURES ............................................................................................... 87
APPENDIX B: ........................................................................................................................................................ 88 O&M BEST PRACTICES CHECKLIST .................................................................................................................................. 88
APPENDIX C: ........................................................................................................................................................ 96 UTILITY USAGE CHARTS ................................................................................................................................................. 96
ASHRAE Level II Energy Audit
SUNY College of Optometry
EMO Energy Solutions Confidential and Proprietary Information-Unauthorized Disclosure Prohibited
Page 4 of 97
Audit Disclaimer The energy conservation opportunities contained in this report have been reviewed for technical accuracy. The reader is reminded energy savings ultimately depend on variable factors including behavior, weather, and quality of installation. Estimated installation costs are based on a variety of sources, including our own experience at similar facilities, our own pricing research using local contractors and vendors, and cost handbooks such as those produced by RS Means. The cost estimates represent the best judgment of the auditors for the proposed action. The Owner is encouraged to confirm these cost estimates independently since actual installed costs can vary widely for a particular installation. Lilker EMO does not guarantee installed cost estimates and shall in no event be liable should actual installed costs vary from the estimated costs herein.
Lilker EMO will not benefit in any way from any decision by the Owner to select a particular contractor, vendor or manufacturer to supply or install any materials described or recommended herein.

ASHRAE Level II Energy Audit
SUNY College of Optometry
EMO Energy Solutions Confidential and Proprietary Information-Unauthorized Disclosure Prohibited
Page 5 of 97
Contacts
Director of Management Services
Primary Contact: Frank Orehek Director or Management Services/Chief of Police Company: SUNY State College of Optometry Address: 33 West 42nd Street New York, NY 10036 Phone: 212.938.5582 Email: [email protected]
College Capital Projects
Primary Contact: Sudeep Lamichhane Capital Projects Coordinator Company: SUNY State College of Optometry Address: 33 West 42nd Street New York, NY 10036 Phone: 212.938.5921 Email: [email protected]
Building Engineering
Primary Contact: Paul Astarita Associate Director Physical Plant & Maintenance Company: SUNY State College of Optometry Address: 33 West 42nd Street New York, NY 10036 Phone: 212.938.5580 Email: [email protected]
Energy Audit Team Leader
Primary Contact: John Segletes, Director Company: Lilker EMO Energy Solutions, LLC Address: 3130 Fairview Park Drive, Suite 125 Falls Church, VA 22042 Phone: 703.205.0445 Email: [email protected]
ASHRAE Level II Energy Audit
SUNY College of Optometry
EMO Energy Solutions Confidential and Proprietary Information-Unauthorized Disclosure Prohibited
Page 6 of 97
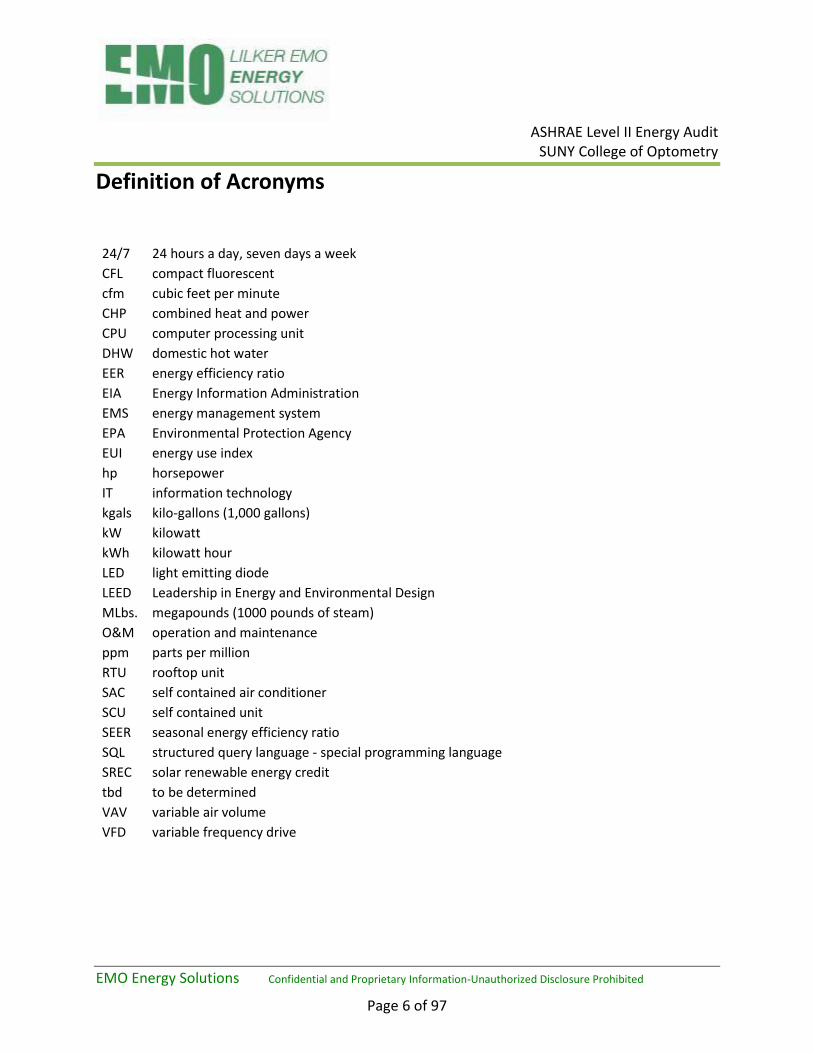
Definition of Acronyms
24/7 24 hours a day, seven days a week
CFL compact fluorescent
cfm cubic feet per minute
CHP combined heat and power
CPU computer processing unit
DHW domestic hot water
EER energy efficiency ratio
EIA Energy Information Administration
EMS energy management system
EPA Environmental Protection Agency
EUI energy use index
hp horsepower
IT information technology
kgals kilo-gallons (1,000 gallons)
kW kilowatt
kWh kilowatt hour
LED light emitting diode
LEED Leadership in Energy and Environmental Design
MLbs. megapounds (1000 pounds of steam)
O&M operation and maintenance
ppm parts per million
RTU rooftop unit
SAC self contained air conditioner
SCU self contained unit
SEER seasonal energy efficiency ratio
SQL structured query language - special programming language
SREC solar renewable energy credit
tbd to be determined
VAV variable air volume
VFD variable frequency drive
ASHRAE Level II Energy Audit
SUNY College of Optometry
EMO Energy Solutions Confidential and Proprietary Information-Unauthorized Disclosure Prohibited
Page 7 of 97
Project Overview Lilker EMO Energy Solutions, LLC has performed an energy and water conservation opportunity assessment of the SUNY State College of Optometry building located at 33 West 42nd Street, New York, NY.
Lilker EMO is providing a Comprehensive Grade Energy Audit based on the requirements of an ASHRAE Level II energy audit. An ASHRAE Level II audit is defined by 1995 ASHRAE Applications Handbook as follows:
Level II: Energy Survey and Analysis. This includes a more detailed building survey and energy analysis than a Level I analysis. A breakdown of energy use in the building is provided. Level II analysis identifies and provides the savings and cost analysis of all practical measures that meet the owner’s constraints and economic criteria, along with a discussion of any effect on operation and maintenance procedures. It also lists potential capital-intensive improvements that require more thorough data collection and analysis, along with an initial judgment of potential costs and savings. This level of analysis is adequate for most buildings and measures.
Lilker EMO’s audit included an on-site survey of building equipment (September 24, 2013), discussing operations with building staff, collecting pertinent data on existing conditions (space temperature, ventilation rates, etc), and evaluating the building’s utility consumption history. After identifying a series of energy conservation measures (ECMs), Lilker EMO analyzed each measure for estimated initial cost and energy saving potential.
This report summarizes Lilker EMO’s analysis of the building’s existing equipment, energy usage patterns, and energy conservation opportunities. Lilker EMO identified a total of eleven low-cost/no-cost opportunities and fifteen additional capital intensive opportunities, including six capital intensive measures already recommended by Lilker Associates. If all energy conservation opportunities are implemented (including Phase I and Phase II improvements), the building will reduce its electricity consumption by 1,740,300 kWh/year, steam consumption by 2,300 MLbs., water consumption by 270 kgals, and associated costs by $428,000/year, including O&M reductions. It is estimated that there will be an initial cost of $5,691,800 for a payback period of about 14.9 years based on energy and water savings alone, or 12.4 years including O&M savings and NYSERDA utility rebates. NYSERDA rebates are based on the Performance Based Incentives for Existing Facilities Program for Downstate.
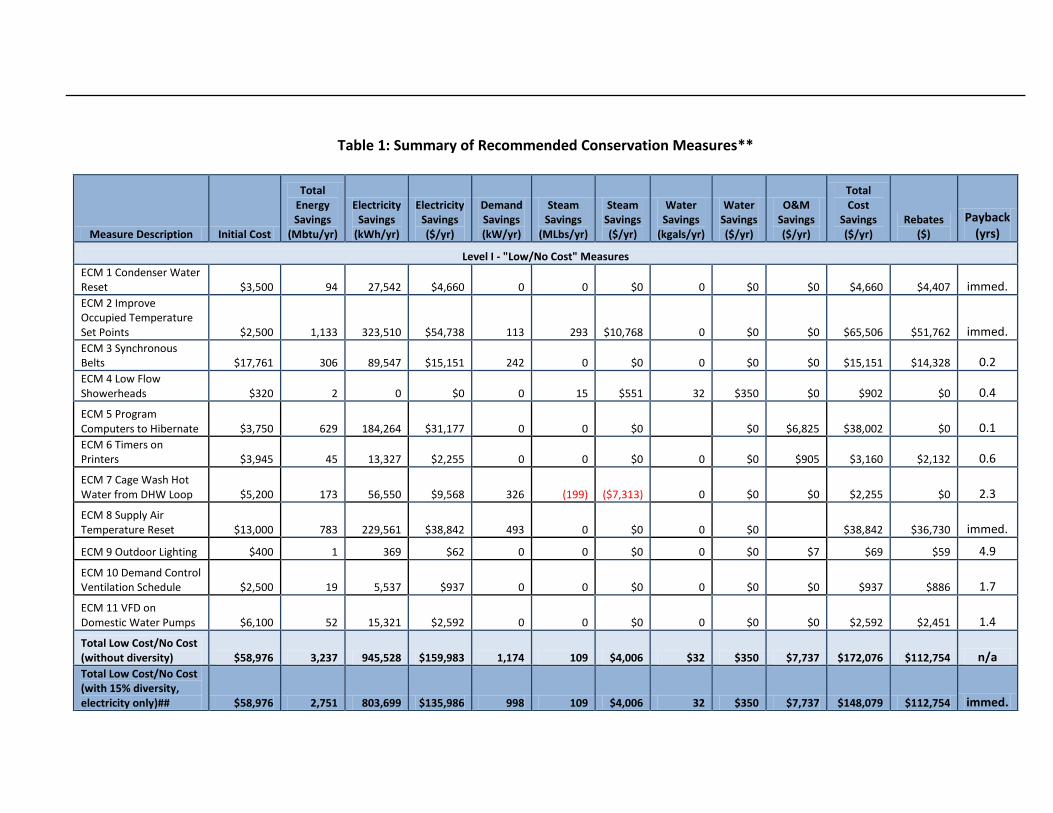
Table 1: Summary of Recommended Conservation Measures**
Measure Description Initial Cost
Total Energy Savings
(Mbtu/yr)
Electricity Savings
(kWh/yr)
Electricity Savings ($/yr)
Demand Savings (kW/yr)
Steam Savings
(MLbs/yr)
Steam Savings ($/yr)
Water Savings
(kgals/yr)
Water Savings ($/yr)
O&M Savings ($/yr)
Total Cost
Savings ($/yr)
Rebates ($)
Payback (yrs)
Level I - "Low/No Cost" Measures
ECM 1 Condenser Water Reset $3,500 94 27,542 $4,660 0 0 $0 0 $0 $0 $4,660 $4,407 immed. ECM 2 Improve Occupied Temperature Set Points $2,500 1,133 323,510 $54,738 113 293 $10,768 0 $0 $0 $65,506 $51,762 immed. ECM 3 Synchronous Belts $17,761 306 89,547 $15,151 242 0 $0 0 $0 $0 $15,151 $14,328 0.2 ECM 4 Low Flow Showerheads $320 2 0 $0 0 15 $551 32 $350 $0 $902 $0 0.4
ECM 5 Program Computers to Hibernate $3,750 629 184,264 $31,177 0 0 $0 $0 $6,825 $38,002 $0 0.1 ECM 6 Timers on Printers $3,945 45 13,327 $2,255 0 0 $0 0 $0 $905 $3,160 $2,132 0.6
ECM 7 Cage Wash Hot Water from DHW Loop $5,200 173 56,550 $9,568 326 (199) ($7,313) 0 $0 $0 $2,255 $0 2.3
ECM 8 Supply Air Temperature Reset $13,000 783 229,561 $38,842 493 0 $0 0 $0 $38,842 $36,730 immed.
ECM 9 Outdoor Lighting $400 1 369 $62 0 0 $0 0 $0 $7 $69 $59 4.9
ECM 10 Demand Control Ventilation Schedule $2,500 19 5,537 $937 0 0 $0 0 $0 $0 $937 $886 1.7
ECM 11 VFD on Domestic Water Pumps $6,100 52 15,321 $2,592 0 0 $0 0 $0 $0 $2,592 $2,451 1.4
Total Low Cost/No Cost (without diversity) $58,976 3,237 945,528 $159,983 1,174 109 $4,006 $32 $350 $7,737 $172,076 $112,754 n/a Total Low Cost/No Cost (with 15% diversity, electricity only)## $58,976 2,751 803,699 $135,986 998 109 $4,006 32 $350 $7,737 $148,079 $112,754 immed.
ASHRAE Level II Energy Audit SUNY College of Optometry
EMO Energy Solutions Confidential and Proprietary Information-Unauthorized Disclosure Prohibited
Page 9 of 97
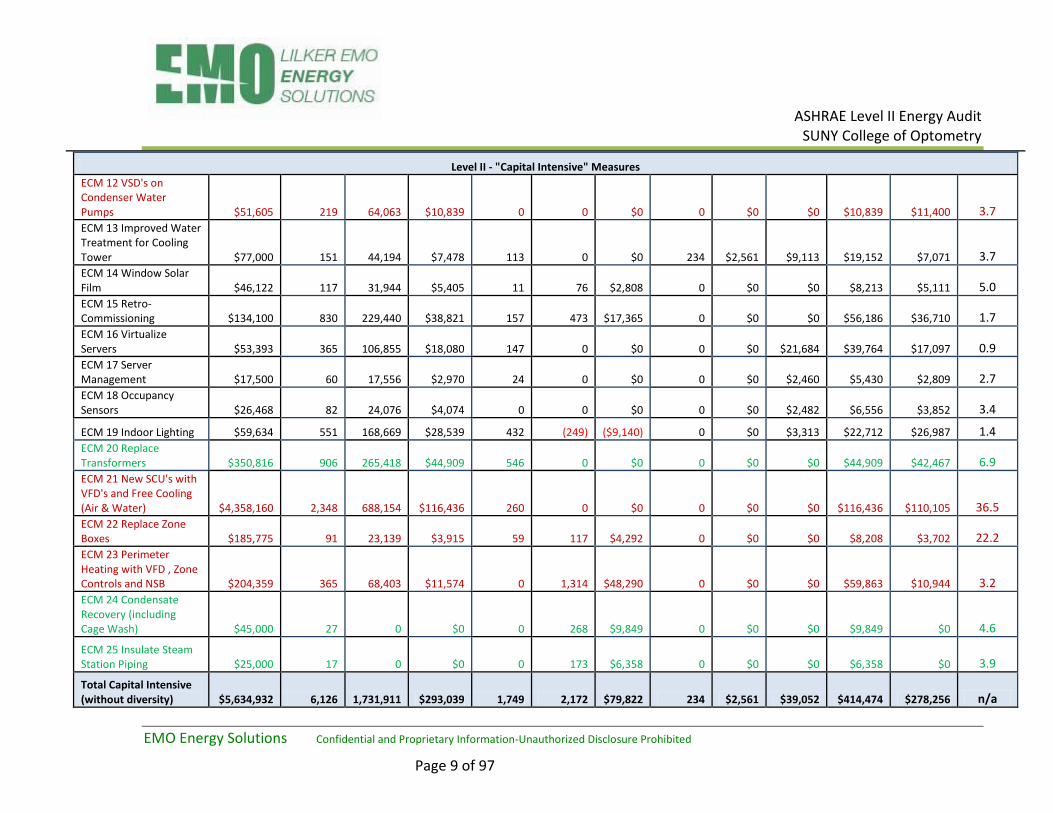
Level II - "Capital Intensive" Measures
ECM 12 VSD's on Condenser Water Pumps $51,605 219 64,063 $10,839 0 0 $0 0 $0 $0 $10,839 $11,400 3.7 ECM 13 Improved Water Treatment for Cooling Tower $77,000 151 44,194 $7,478 113 0 $0 234 $2,561 $9,113 $19,152 $7,071 3.7 ECM 14 Window Solar Film $46,122 117 31,944 $5,405 11 76 $2,808 0 $0 $0 $8,213 $5,111 5.0 ECM 15 Retro-Commissioning $134,100 830 229,440 $38,821 157 473 $17,365 0 $0 $0 $56,186 $36,710 1.7 ECM 16 Virtualize Servers $53,393 365 106,855 $18,080 147 0 $0 0 $0 $21,684 $39,764 $17,097 0.9 ECM 17 Server Management $17,500 60 17,556 $2,970 24 0 $0 0 $0 $2,460 $5,430 $2,809 2.7 ECM 18 Occupancy Sensors $26,468 82 24,076 $4,074 0 0 $0 0 $0 $2,482 $6,556 $3,852 3.4
ECM 19 Indoor Lighting $59,634 551 168,669 $28,539 432 (249) ($9,140) 0 $0 $3,313 $22,712 $26,987 1.4 ECM 20 Replace Transformers $350,816 906 265,418 $44,909 546 0 $0 0 $0 $0 $44,909 $42,467 6.9 ECM 21 New SCU's with VFD's and Free Cooling (Air & Water) $4,358,160 2,348 688,154 $116,436 260 0 $0 0 $0 $0 $116,436 $110,105 36.5 ECM 22 Replace Zone Boxes $185,775 91 23,139 $3,915 59 117 $4,292 0 $0 $0 $8,208 $3,702 22.2 ECM 23 Perimeter Heating with VFD , Zone Controls and NSB $204,359 365 68,403 $11,574 0 1,314 $48,290 0 $0 $0 $59,863 $10,944 3.2 ECM 24 Condensate Recovery (including Cage Wash) $45,000 27 0 $0 0 268 $9,849 0 $0 $0 $9,849 $0 4.6
ECM 25 Insulate Steam Station Piping $25,000 17 0 $0 0 173 $6,358 0 $0 $0 $6,358 $0 3.9
Total Capital Intensive (without diversity) $5,634,932 6,126 1,731,911 $293,039 1,749 2,172 $79,822 234 $2,561 $39,052 $414,474 $278,256 n/a
ASHRAE Level II Energy Audit SUNY College of Optometry
EMO Energy Solutions Confidential and Proprietary Information-Unauthorized Disclosure Prohibited
Page 10 of 97
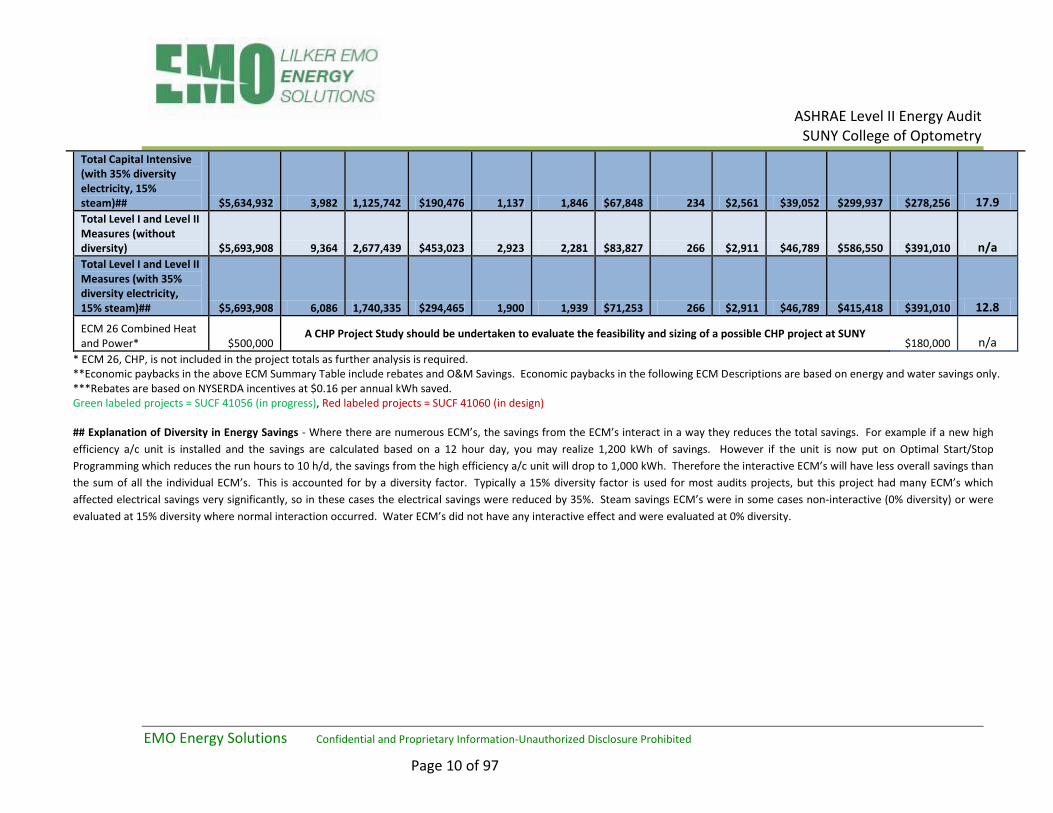
Total Capital Intensive (with 35% diversity electricity, 15% steam)## $5,634,932 3,982 1,125,742 $190,476 1,137 1,846 $67,848 234 $2,561 $39,052 $299,937 $278,256 17.9 Total Level I and Level II Measures (without diversity) $5,693,908 9,364 2,677,439 $453,023 2,923 2,281 $83,827 266 $2,911 $46,789 $586,550 $391,010 n/a Total Level I and Level II Measures (with 35% diversity electricity, 15% steam)## $5,693,908 6,086 1,740,335 $294,465 1,900 1,939 $71,253 266 $2,911 $46,789 $415,418 $391,010 12.8
ECM 26 Combined Heat and Power* $500,000
A CHP Project Study should be undertaken to evaluate the feasibility and sizing of a possible CHP project at SUNY $180,000 n/a
* ECM 26, CHP, is not included in the project totals as further analysis is required. **Economic paybacks in the above ECM Summary Table include rebates and O&M Savings. Economic paybacks in the following ECM Descriptions are based on energy and water savings only. ***Rebates are based on NYSERDA incentives at $0.16 per annual kWh saved. Green labeled projects = SUCF 41056 (in progress), Red labeled projects = SUCF 41060 (in design) ## Explanation of Diversity in Energy Savings - Where there are numerous ECM’s, the savings from the ECM’s interact in a way they reduces the total savings. For example if a new high
efficiency a/c unit is installed and the savings are calculated based on a 12 hour day, you may realize 1,200 kWh of savings. However if the unit is now put on Optimal Start/Stop
Programming which reduces the run hours to 10 h/d, the savings from the high efficiency a/c unit will drop to 1,000 kWh. Therefore the interactive ECM’s will have less overall savings than
the sum of all the individual ECM’s. This is accounted for by a diversity factor. Typically a 15% diversity factor is used for most audits projects, but this project had many ECM’s which
affected electrical savings very significantly, so in these cases the electrical savings were reduced by 35%. Steam savings ECM’s were in some cases non-interactive (0% diversity) or were
evaluated at 15% diversity where normal interaction occurred. Water ECM’s did not have any interactive effect and were evaluated at 0% diversity.
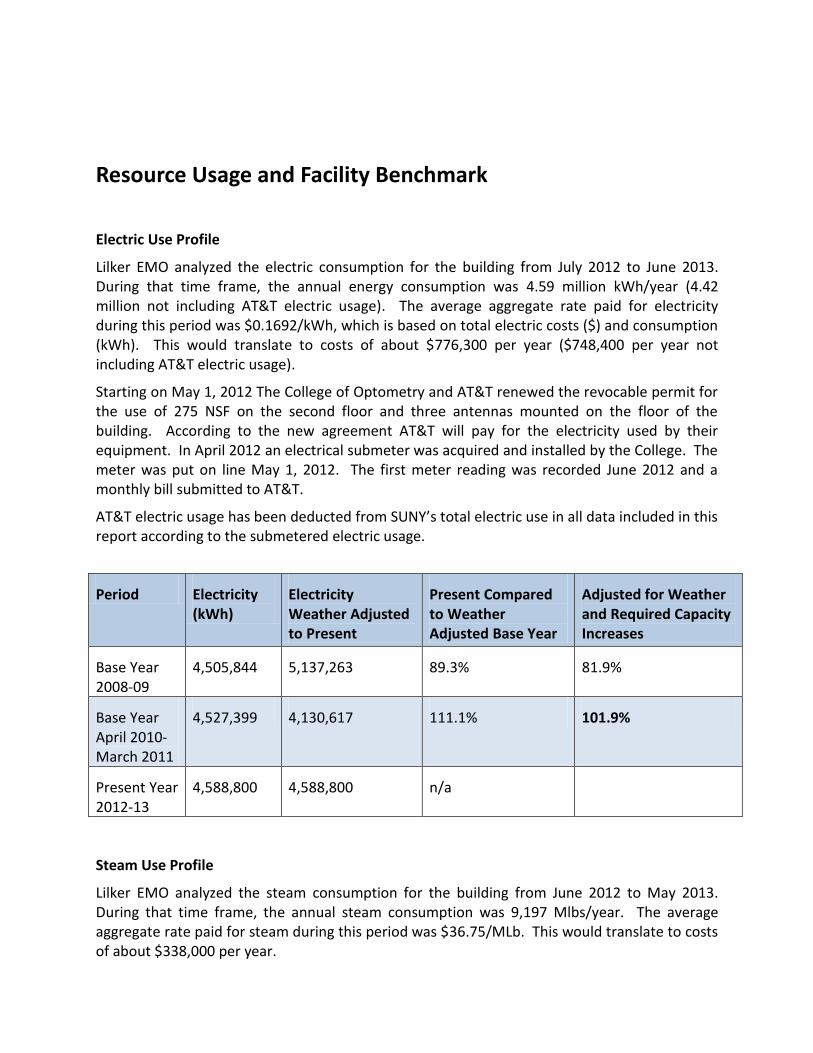
Resource Usage and Facility Benchmark
Electric Use Profile
Lilker EMO analyzed the electric consumption for the building from July 2012 to June 2013. During that time frame, the annual energy consumption was 4.59 million kWh/year (4.42 million not including AT&T electric usage). The average aggregate rate paid for electricity during this period was $0.1692/kWh, which is based on total electric costs ($) and consumption (kWh). This would translate to costs of about $776,300 per year ($748,400 per year not including AT&T electric usage).
Starting on May 1, 2012 The College of Optometry and AT&T renewed the revocable permit for the use of 275 NSF on the second floor and three antennas mounted on the floor of the building. According to the new agreement AT&T will pay for the electricity used by their equipment. In April 2012 an electrical submeter was acquired and installed by the College. The meter was put on line May 1, 2012. The first meter reading was recorded June 2012 and a monthly bill submitted to AT&T.
AT&T electric usage has been deducted from SUNY’s total electric use in all data included in this report according to the submetered electric usage.
Period Electricity (kWh)
Electricity Weather Adjusted to Present
Present Compared to Weather Adjusted Base Year
Adjusted for Weather and Required Capacity Increases
Base Year 2008-09
4,505,844 5,137,263 89.3% 81.9%
Base Year April 2010-March 2011
4,527,399 4,130,617 111.1% 101.9%
Present Year 2012-13
4,588,800 4,588,800 n/a
Steam Use Profile
Lilker EMO analyzed the steam consumption for the building from June 2012 to May 2013. During that time frame, the annual steam consumption was 9,197 Mlbs/year. The average aggregate rate paid for steam during this period was $36.75/MLb. This would translate to costs of about $338,000 per year.

ASHRAE Level II Energy Audit
SUNY College of Optometry
EMO Energy Solutions Confidential and Proprietary Information-Unauthorized Disclosure Prohibited
Page 12 of 97
Period Steam (MLbs)
Steam Weather Adjusted to Present
Present Compared to Weather Adjusted Base Year
Adjusted for Weather and Required Capacity Increases
Base Year 2008-09
8,116.7 7,683.7 123.0% 112.8%
Base Year April 2010- March 2011
8,533.1 8,699.3 108.6% 99.6%
Present Year 2012-13
9,450.3 9,450.3 n/a
Water Use Profile
Water and sewer service to the building was provided by New York City Water Board. Lilker
EMO analyzed bills from June 2011 to March 2012. Over the time frame, typical water
consumption was about 620 kgal each month. Water and sewer was charged at a rate of $4.23
and $6.72 per kgal of water consumption and sewer discharge respectively, where sub-metered
cooling tower water usage is deducted from the sewer charges. Total annualized water and
sewer charges are $31,465 and $50,029 respectively for a combined total of $81,493 per year.
Capacity Increases
SUNY is experiencing growth in several areas including:
1) A SUNY-approved increase in student enrollments;
2) Expanding research programs in both laboratory and clinical settings;
3) The conversion of space to meet student quality of life or academic program needs that places greater demands on energy resources.
Growth in the student body, research programs and new and improved functionality of student and academic spaces has resulted in an increase in the building’s HVAC capacity of 9.03 percent. This increase in the building’s HVAC capacity is representative of the overall increase in power requirements, which also include steam, lighting, computer and plug loads.
Increases in the SUNY College of Optometry energy use have been offset in the electric and steam usage tables above based on degree day weather differences and the 9.03 percent

ASHRAE Level II Energy Audit
SUNY College of Optometry
EMO Energy Solutions Confidential and Proprietary Information-Unauthorized Disclosure Prohibited
Page 13 of 97
increase in SUNY’s growth, for comparison to base year energy consumption in years 2008-09 and 2010-11.
Period Energy Cap EUI
(kBtu/sf)
EUI Adjusted for Capacity Increases
Base Year April 2010- March 2011
223.7** 223.7**
Present Year April 2012-March 2013
216 (210*) 200.9
*Does not include AT&T electric usage
** Appendix B: Page 53 of Build Smart NY (July 2013), Building Energy Performance
of New York State Government Buildings.
Energy and Energy Cost Statistics
The energy usage and rates are summarized in Table 2. Charts detailing monthly historical utility usage information can be found in the appendix of this report.
Table 2: Utility Usage and Rates*
Utility 12-month
Usage
Average Aggregate
Rate
Electric - Consumption 4,423,632 kWh $0.1692 / kWh
Electric – Demand 13,435 kW $12.50 / kW
Steam 9,450.3 MLbs. $36.75 / MLbs.
Water/Sewer 7,440 kgal (water)
$4.23 / kgal (water) $6.72 / kgal (sewer)
*Does not include AT&T electric usage
Energy Consumption by End Use The estimated building energy consumption by end use is shown in Figure 1. Estimates are based on installed lighting and equipment power and the estimated annual hours of operation for equipment.

ASHRAE Level II Energy Audit
SUNY College of Optometry
EMO Energy Solutions Confidential and Proprietary Information-Unauthorized Disclosure Prohibited
Page 14 of 97
Figure 1: Estimated Energy End Use Breakdown
Energy Benchmark and Targets
The US Environmental Protection Agency (EPA) Energy Star® benchmarking tools allows owners
to track energy consumption and compare building energy performance to other buildings.
EPA’s Portfolio Manager uses consumption, gross floor area, occupancy, total number of PCs,
and actual weather data to benchmark the consumption of a building against Energy
Information Administration (EIA) averages; for similar building types with similar operational
hours.
Target reductions for this building were chosen by Lilker EMO to be 34 percent less than the
current building energy consumption. This is based on an expected 34 percent minimum
savings from the ASHRAE Level II analysis.
Energy Star benchmarking for this building could not be determined as Portfolio Manager
only benchmarks Dormitories and Residence Halls for University buildings, not any other
building types.
Cooling 33%
Domestic Water
2%
IT 2%
Transformers 4%
Lighting 9%
Plug Load 4%
HVAC Fans 6%
Elevators 3%
Heating 37%
Energy
ASHRAE Level II Energy Audit
SUNY College of Optometry
EMO Energy Solutions Confidential and Proprietary Information-Unauthorized Disclosure Prohibited
Page 15 of 97
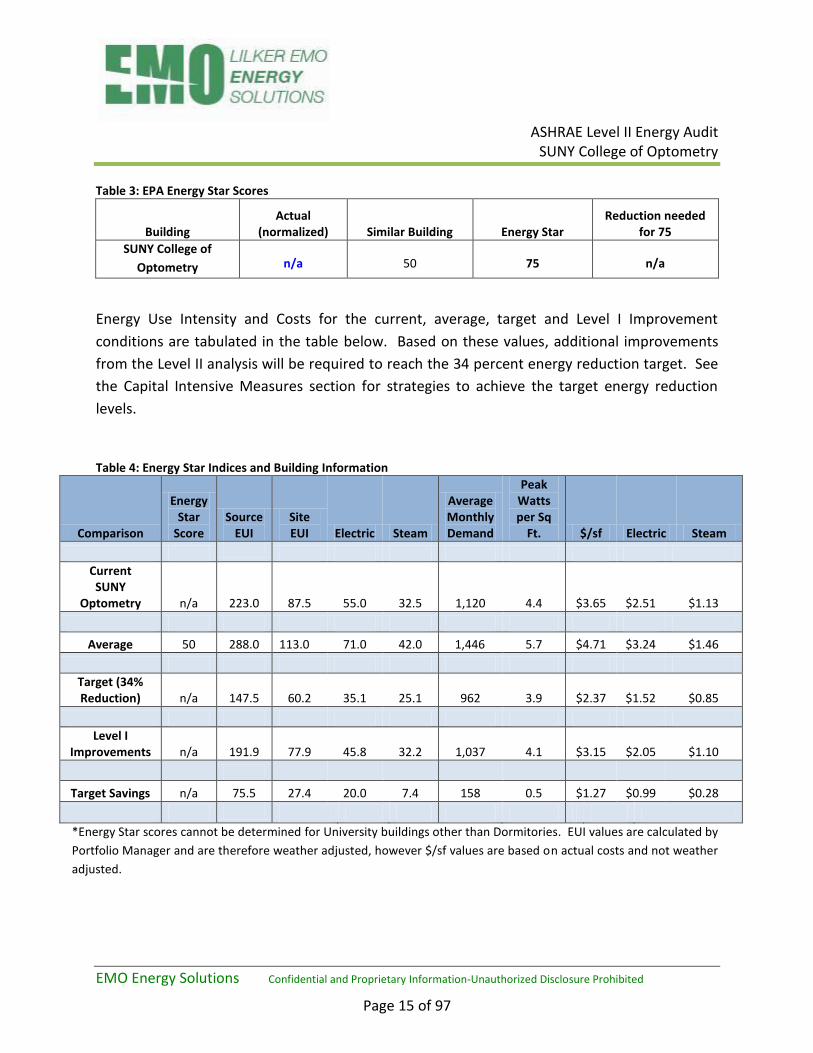
Table 3: EPA Energy Star Scores
Building Actual
(normalized) Similar Building Energy Star Reduction needed
for 75
SUNY College of
Optometry n/a 50 75 n/a
Energy Use Intensity and Costs for the current, average, target and Level I Improvement
conditions are tabulated in the table below. Based on these values, additional improvements
from the Level II analysis will be required to reach the 34 percent energy reduction target. See
the Capital Intensive Measures section for strategies to achieve the target energy reduction
levels.
Table 4: Energy Star Indices and Building Information
Comparison
Energy Star
Score Source
EUI Site EUI Electric Steam
Average Monthly Demand
Peak Watts per Sq
Ft. $/sf Electric Steam
Current SUNY
Optometry n/a 223.0 87.5 55.0 32.5 1,120 4.4 $3.65 $2.51 $1.13
Average 50 288.0 113.0 71.0 42.0 1,446 5.7 $4.71 $3.24 $1.46
Target (34% Reduction) n/a 147.5 60.2 35.1 25.1 962 3.9 $2.37 $1.52 $0.85
Level I Improvements n/a 191.9 77.9 45.8 32.2 1,037 4.1 $3.15 $2.05 $1.10
Target Savings n/a 75.5 27.4 20.0 7.4 158 0.5 $1.27 $0.99 $0.28
*Energy Star scores cannot be determined for University buildings other than Dormitories. EUI values are calculated by
Portfolio Manager and are therefore weather adjusted, however $/sf values are based on actual costs and not weather
adjusted.
ASHRAE Level II Energy Audit
SUNY College of Optometry
EMO Energy Solutions Confidential and Proprietary Information-Unauthorized Disclosure Prohibited
Page 16 of 97
Methodology The energy audit performed on the SUNY College of Optometry included an inspection of the common areas, offices, classrooms, laboratories, mechanical and electrical spaces, penthouses, and rooftop. The inspection focused on all aspects of the building envelope, electrical, heating, cooling, ventilation, and the domestic hot water systems. Lilker EMO collected information during the audit and developed a detailed list of potential energy efficiency opportunities for the project.
The “Whole Building Design” analysis approach was used for this analysis. In the “Whole Building Design” analysis approach all elements of a building are considered simultaneously so that interactive effects of all building systems and loads can be accurately accounted for and the diversity associated with the implementation of multiple potential energy savings measured can be accurately calculated.
Facility Overview The SUNY College of Optometry building is a nineteen story university building with a 17 occupied floors above grade, two levels of basement and a sub-basement. The building totals approximately 298,000 square feet of building space. The building was originally constructed in 1911. The college took occupancy of the building in 2000.
The windows on the north and south sides of the building were replaced in 2008 with double pane metal frame fixtures. The windows on the east and west sides of the building are 1960s vintage single pane metal frame windows.
The building is open to occupants Monday through Friday from 7:00 AM to 10:00 PM. It is open to occupants on Saturday from 8:00 AM to 5:00 PM. It is closed to occupants on Sunday.
The College of Optometry currently has an enrollment of 340 students. There is 301 full time equivalent staff in the building; this includes 284 that are employed by the College and 27 that work for SUNY Systems Administration. The College of Optometry is also one of the largest eye and vision care facilities in the United States seeing over 74,000 yearly patients.
Mechanical Systems The majority of the building is cooled by twenty-six self contained units (SCU’s) that are most typically located to provide cooling and ventilation for an entire floor. The cooling capacity of the SCU’s total 963 tons, and provides cold air to the zone and variable air volume boxes, both electric and hot water heated. The condenser cooling water for the building is provided by a single two cell, 1,000 ton cooling tower located on the roof. Condenser water is circulated by two 40 hp, condenser water pumps to the self contained units. Additionally there is a smaller
ASHRAE Level II Energy Audit
SUNY College of Optometry
EMO Energy Solutions Confidential and Proprietary Information-Unauthorized Disclosure Prohibited
Page 17 of 97
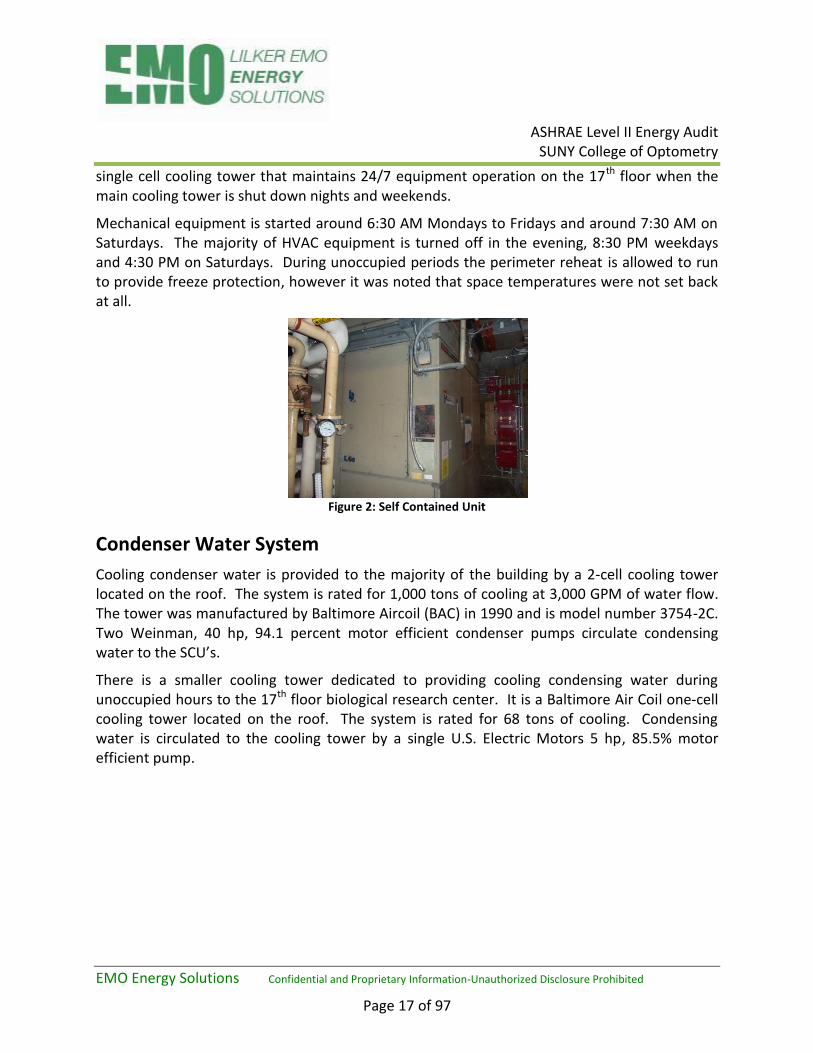
single cell cooling tower that maintains 24/7 equipment operation on the 17th floor when the main cooling tower is shut down nights and weekends.
Mechanical equipment is started around 6:30 AM Mondays to Fridays and around 7:30 AM on Saturdays. The majority of HVAC equipment is turned off in the evening, 8:30 PM weekdays and 4:30 PM on Saturdays. During unoccupied periods the perimeter reheat is allowed to run to provide freeze protection, however it was noted that space temperatures were not set back at all.
Figure 2: Self Contained Unit
Condenser Water System
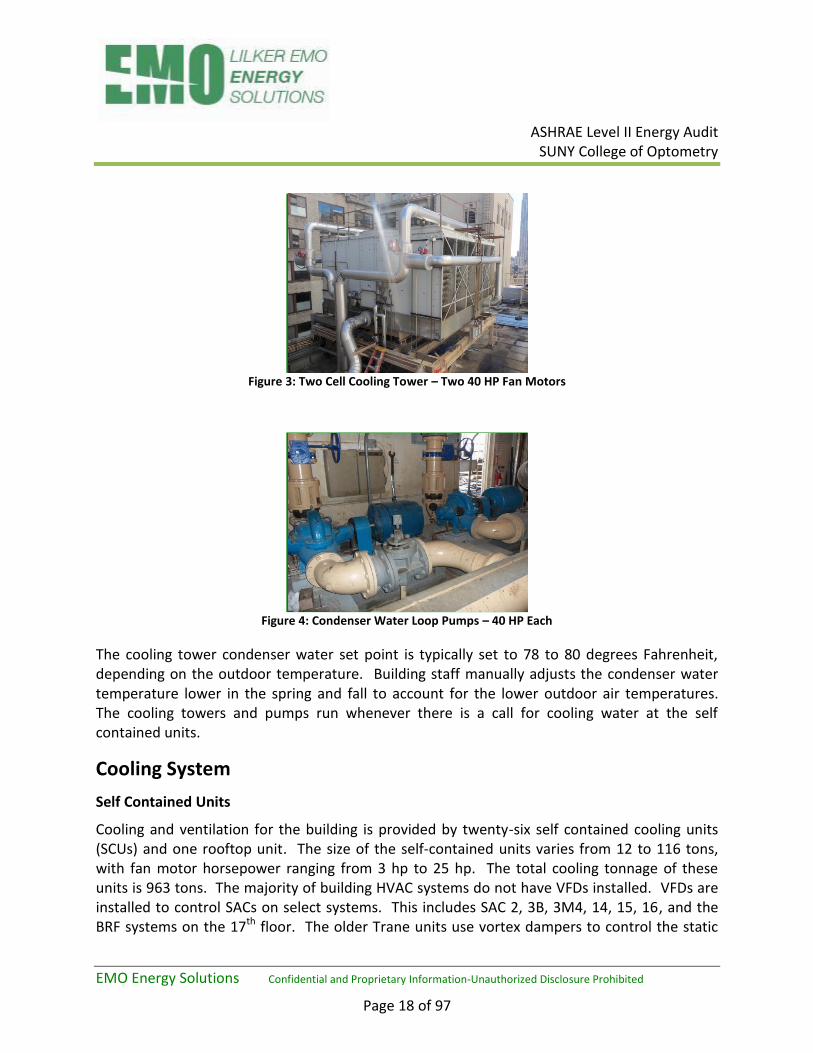
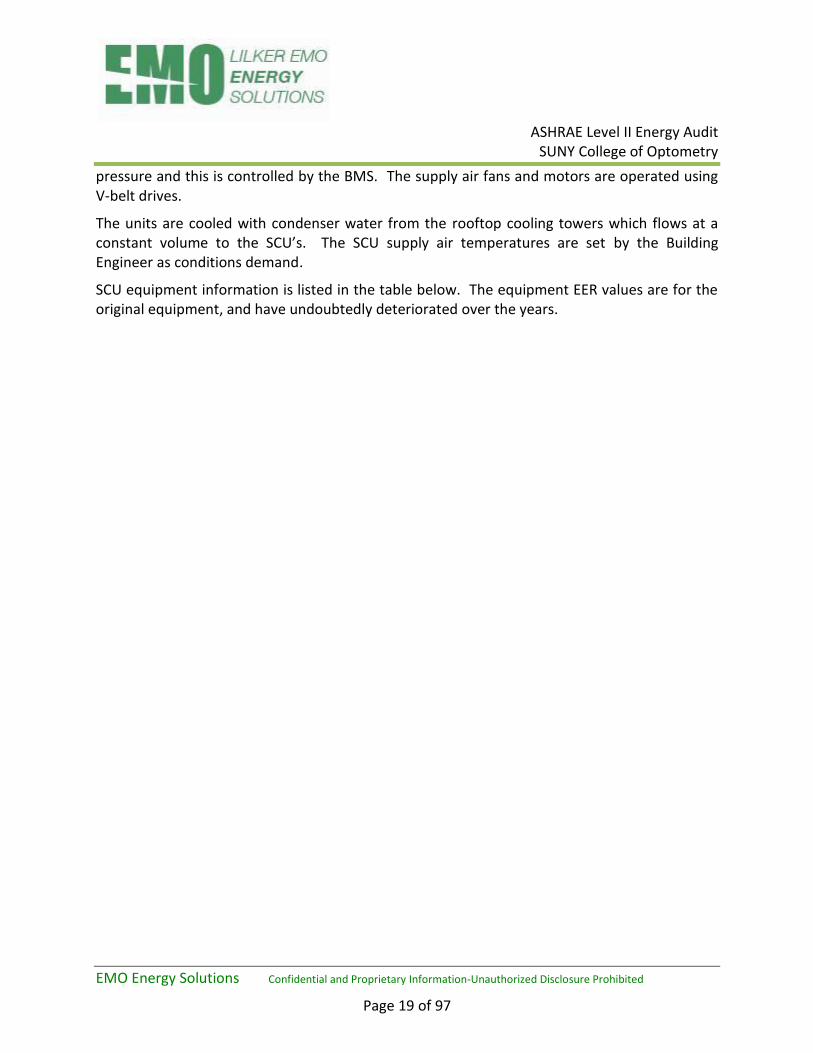
Cooling condenser water is provided to the majority of the building by a 2-cell cooling tower located on the roof. The system is rated for 1,000 tons of cooling at 3,000 GPM of water flow. The tower was manufactured by Baltimore Aircoil (BAC) in 1990 and is model number 3754-2C. Two Weinman, 40 hp, 94.1 percent motor efficient condenser pumps circulate condensing water to the SCU’s.
There is a smaller cooling tower dedicated to providing cooling condensing water during unoccupied hours to the 17th floor biological research center. It is a Baltimore Air Coil one-cell cooling tower located on the roof. The system is rated for 68 tons of cooling. Condensing water is circulated to the cooling tower by a single U.S. Electric Motors 5 hp, 85.5% motor efficient pump.
ASHRAE Level II Energy Audit
SUNY College of Optometry
EMO Energy Solutions Confidential and Proprietary Information-Unauthorized Disclosure Prohibited
Page 18 of 97
Figure 3: Two Cell Cooling Tower – Two 40 HP Fan Motors
Figure 4: Condenser Water Loop Pumps – 40 HP Each
The cooling tower condenser water set point is typically set to 78 to 80 degrees Fahrenheit, depending on the outdoor temperature. Building staff manually adjusts the condenser water temperature lower in the spring and fall to account for the lower outdoor air temperatures. The cooling towers and pumps run whenever there is a call for cooling water at the self contained units.
Cooling System
Self Contained Units
Cooling and ventilation for the building is provided by twenty-six self contained cooling units (SCUs) and one rooftop unit. The size of the self-contained units varies from 12 to 116 tons, with fan motor horsepower ranging from 3 hp to 25 hp. The total cooling tonnage of these units is 963 tons. The majority of building HVAC systems do not have VFDs installed. VFDs are installed to control SACs on select systems. This includes SAC 2, 3B, 3M4, 14, 15, 16, and the BRF systems on the 17th floor. The older Trane units use vortex dampers to control the static
ASHRAE Level II Energy Audit
SUNY College of Optometry
EMO Energy Solutions Confidential and Proprietary Information-Unauthorized Disclosure Prohibited
Page 19 of 97
pressure and this is controlled by the BMS. The supply air fans and motors are operated using V-belt drives.
The units are cooled with condenser water from the rooftop cooling towers which flows at a constant volume to the SCU’s. The SCU supply air temperatures are set by the Building Engineer as conditions demand.
SCU equipment information is listed in the table below. The equipment EER values are for the original equipment, and have undoubtedly deteriorated over the years.

ASHRAE Level II Energy Audit
SUNY College of Optometry
EMO Energy Solutions Confidential and Proprietary Information-Unauthorized Disclosure Prohibited
Page 20 of 97
Table 5: Building Self Contained Units
Tag Make Capacity Supply Fan HP Return Fan HP EER
SAC-B TRANE 38 25 7.5 10.9
SAC-BA TRANE 29 15 7.5 11.1
SAC-1 MAMMOTH 24 10 3 12.9
SAC-1M MAMMOTH 12 3 1 14.8
SAC-1MA MAMMOTH 12 3 1 13.4
SAC-2 MAMMOTH 29 15 3 12.7
SAC-2A MAMMOTH 12 3 1.5 13.4
SAC-3 TRANE 38 25 7.5 10.9
SAC-3B MAMMOTH 30 15 3 9.7
SAC-3M4 MAMMOTH 12 10 1 13.4
SAC-4 TRANE 38 25 7.5 10.9
SAC-5 TRANE 38 25 7.5 10.9
SAC-6 TRANE 38 25 7.5 10.9
SAC-7 TRANE 38 25 7.5 10.9
SAC-8 TRANE 38 25 7.5 10.9
SAC-9 TRANE 38 25 7.5 10.9
SAC-10 TRANE 38 25 7.5 10.9
SAC-11 TRANE 38 25 7.5 10.9
SAC-12 TRANE 38 25 7.5 10.9
SAC-14 MAMMOTH 50 20 7.5 13.1
SAC-15 MAMMOTH 41 20 7.5 13
SAC-16 MAMMOTH 116 25 20 12.8
SAC-17 TRANE 38 25 7.5 10.9
SAC-17A MAMMOTH 41 7.5 15 n/a
SAC-17B MAMMOTH 41 7.5 15 n/a
SAC-18 TRANE 38 25 7.5 10.9
RTU AAON 20 7.5 5 12.7
ASHRAE Level II Energy Audit
SUNY College of Optometry
EMO Energy Solutions Confidential and Proprietary Information-Unauthorized Disclosure Prohibited
Page 21 of 97
Split System Condensing Units
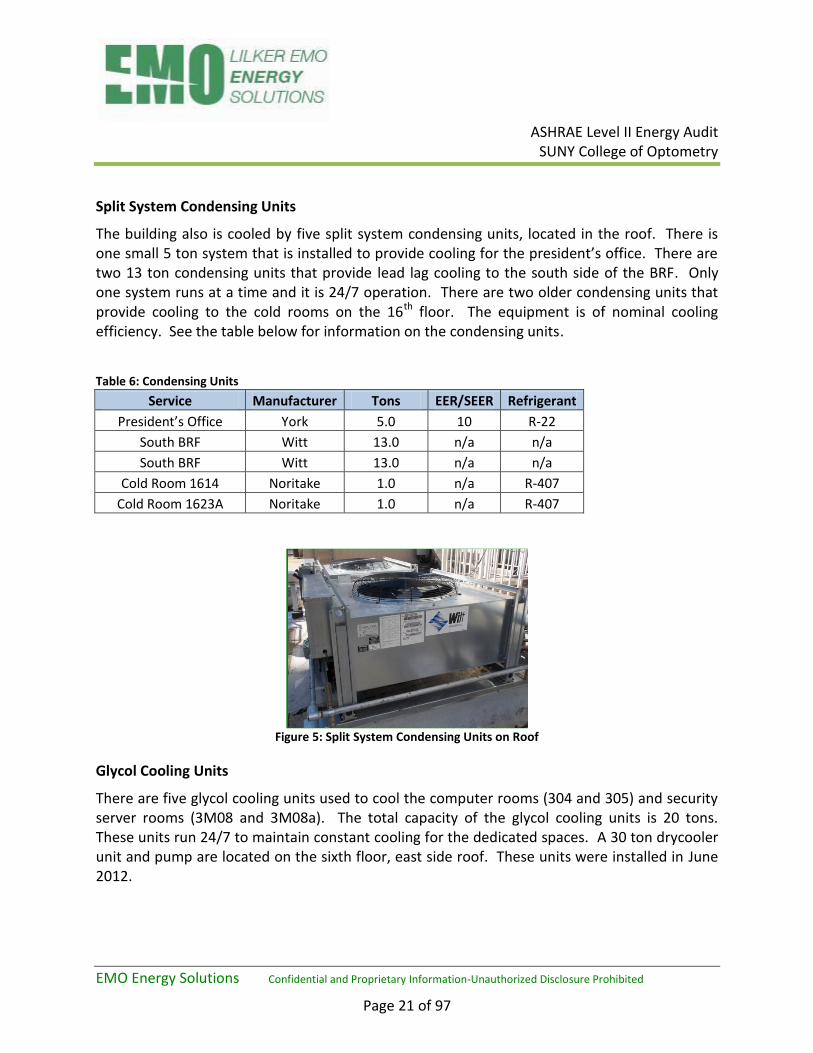
The building also is cooled by five split system condensing units, located in the roof. There is one small 5 ton system that is installed to provide cooling for the president’s office. There are two 13 ton condensing units that provide lead lag cooling to the south side of the BRF. Only one system runs at a time and it is 24/7 operation. There are two older condensing units that provide cooling to the cold rooms on the 16th floor. The equipment is of nominal cooling efficiency. See the table below for information on the condensing units.
Table 6: Condensing Units
Service Manufacturer Tons EER/SEER Refrigerant
President’s Office York 5.0 10 R-22
South BRF Witt 13.0 n/a n/a
South BRF Witt 13.0 n/a n/a
Cold Room 1614 Noritake 1.0 n/a R-407
Cold Room 1623A Noritake 1.0 n/a R-407
Figure 5: Split System Condensing Units on Roof
Glycol Cooling Units
There are five glycol cooling units used to cool the computer rooms (304 and 305) and security server rooms (3M08 and 3M08a). The total capacity of the glycol cooling units is 20 tons. These units run 24/7 to maintain constant cooling for the dedicated spaces. A 30 ton drycooler unit and pump are located on the sixth floor, east side roof. These units were installed in June 2012.
ASHRAE Level II Energy Audit
SUNY College of Optometry
EMO Energy Solutions Confidential and Proprietary Information-Unauthorized Disclosure Prohibited
Page 22 of 97
Table 7: Glycol Cooling Units
Service Manufacturer Tons Refrigerant
3M08a Liebert 3.0 R-407
3M08a Liebert 3.0 R-407
3M08 Liebert 1-1/2 R-407
304 Liebert 5.0 R-407
305 Liebert 10.0 R-407
Drycooler Liebert 30.0 R-407
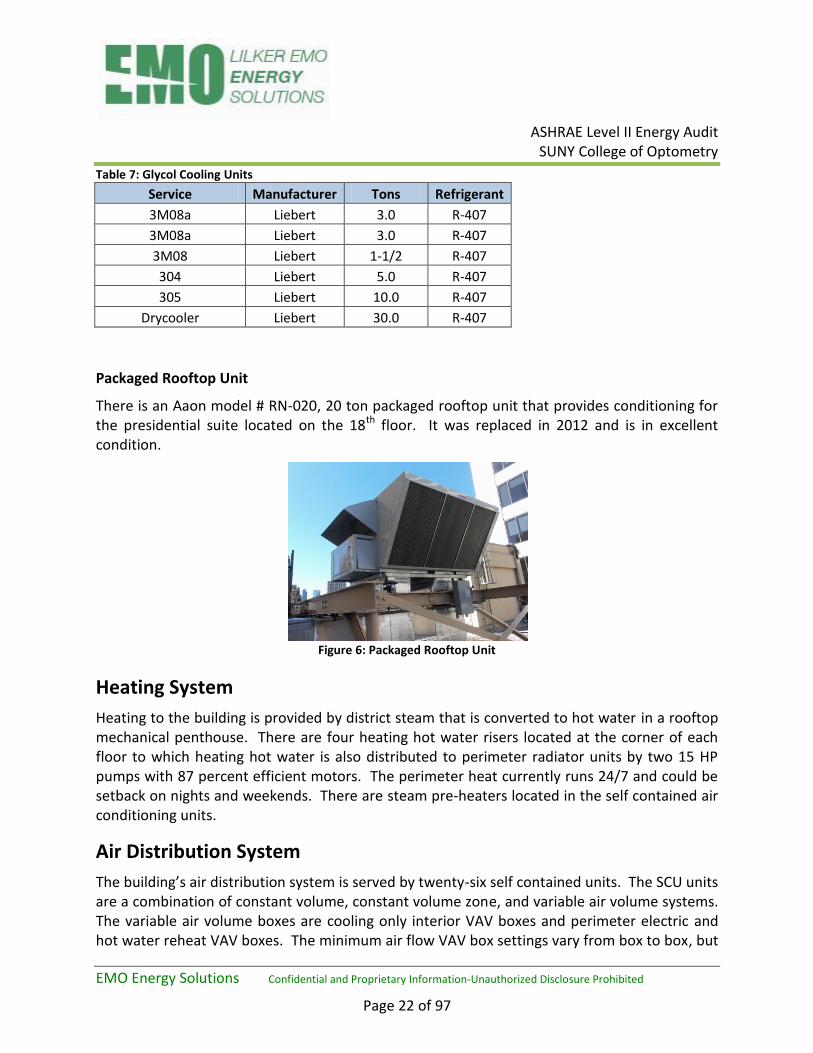
Packaged Rooftop Unit
There is an Aaon model # RN-020, 20 ton packaged rooftop unit that provides conditioning for the presidential suite located on the 18th floor. It was replaced in 2012 and is in excellent condition.
Figure 6: Packaged Rooftop Unit
Heating System
Heating to the building is provided by district steam that is converted to hot water in a rooftop mechanical penthouse. There are four heating hot water risers located at the corner of each floor to which heating hot water is also distributed to perimeter radiator units by two 15 HP pumps with 87 percent efficient motors. The perimeter heat currently runs 24/7 and could be setback on nights and weekends. There are steam pre-heaters located in the self contained air conditioning units.
Air Distribution System
The building’s air distribution system is served by twenty-six self contained units. The SCU units are a combination of constant volume, constant volume zone, and variable air volume systems. The variable air volume boxes are cooling only interior VAV boxes and perimeter electric and hot water reheat VAV boxes. The minimum air flow VAV box settings vary from box to box, but

ASHRAE Level II Energy Audit
SUNY College of Optometry
EMO Energy Solutions Confidential and Proprietary Information-Unauthorized Disclosure Prohibited
Page 23 of 97
are typically around 30 to 40 percent of full flow. Air flow from the SCU’s to the zone and VAV boxes is controlled by inlet guide vanes on the Trane SCU supply air fans and by VFD’s on the Mammoth SCU’s. It is estimated the SCU’s can supply a maximum of 300,000 cfm of supply air which is provided by 481 fan motor horsepower.
Space temperatures set point is at 72 -73 degrees Fahrenheit in all office portions of the building throughout the year. It was noted by building staff space temperatures with this set point vary from 70 to 73 degrees Fahrenheit.
Domestic Hot Water
Domestic hot water (DHW) for sinks is provided by a steam to hot water conversation system that is located in the sub-basement of the building. A shell and tube heat exchanger heats water, which is stored in large domestic water storage tank located in the sub-basement. Domestic hot water is circulated to the building by alternating duplex 25 hp pump. There are two commercial type electric water heaters also located in the basement for backup. One of the units is a Vanguard Energy Efficient electric hot water heater, model 6E724, with 80 gallons storage and 4.5 kW of electric heat. The second unit is a Reco, model 200R5-STA, electric hot water heater with 80 gallons storage and 4.5 kW of electric heat.
Figure 7: Domestic Hot Water Heater Storage Tank
Additionally there are two commercial type electric hot water heaters that supply the cage wash located in a mechanical closet on the 17th floor. The units are A. O. Smith Custom electric water heaters rated for 15 kW each.
Outside Air/Building Ventilation
The outside ventilation air is ducted directly into each mechanical room from two louvered intakes for introduction into the return air of the self contained units. The outside ventilation air is untreated at the intake and is conditioned at the SCU after it has mixed with the return air stream. Each of these systems was designed to enable some degree of free cooling.
ASHRAE Level II Energy Audit
SUNY College of Optometry
EMO Energy Solutions Confidential and Proprietary Information-Unauthorized Disclosure Prohibited
Page 24 of 97
The labs on the 16th and 17th floors are fitted with exhaust hoods with six exhaust fans located on the roof. These floors are also served by dedicated 100% outside air systems and air is directly exhausted to the roof.
If attempts are made to tighten the building envelope, an air balancing of the building’s ventilation and exhaust systems should be undertaken. Based on the mechanical equipment schedules the building is supplied with approximately 55,000 cfm of outside air through the SAC units. The current outside ventilation air appears to be higher than what is required, however a detailed space by space evaluation is required to determine where reductions may be possible. It was also noted at the time of the audit that the building is under a strong negative pressure on the first floor. This should be addressed when air balancing the building.
Electrical Systems
Lighting
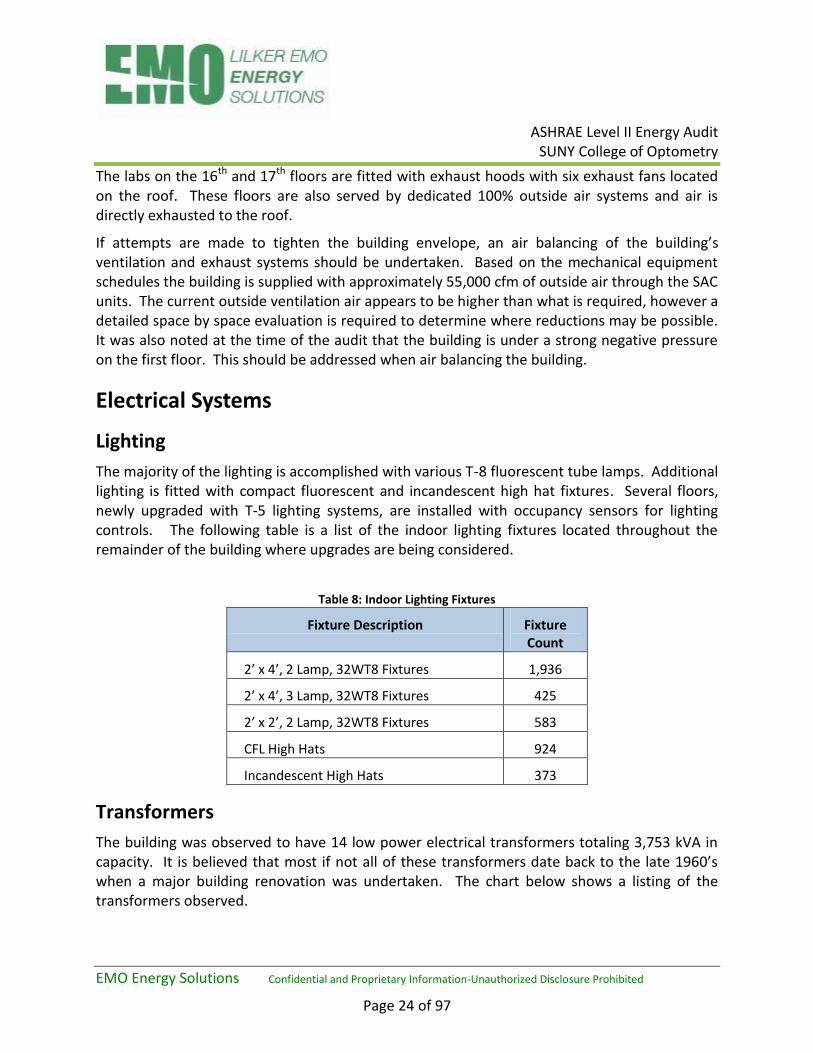
The majority of the lighting is accomplished with various T-8 fluorescent tube lamps. Additional lighting is fitted with compact fluorescent and incandescent high hat fixtures. Several floors, newly upgraded with T-5 lighting systems, are installed with occupancy sensors for lighting controls. The following table is a list of the indoor lighting fixtures located throughout the remainder of the building where upgrades are being considered.
Table 8: Indoor Lighting Fixtures
Fixture Description Fixture Count
2’ x 4’, 2 Lamp, 32WT8 Fixtures 1,936
2’ x 4’, 3 Lamp, 32WT8 Fixtures 425
2’ x 2’, 2 Lamp, 32WT8 Fixtures 583
CFL High Hats 924
Incandescent High Hats 373
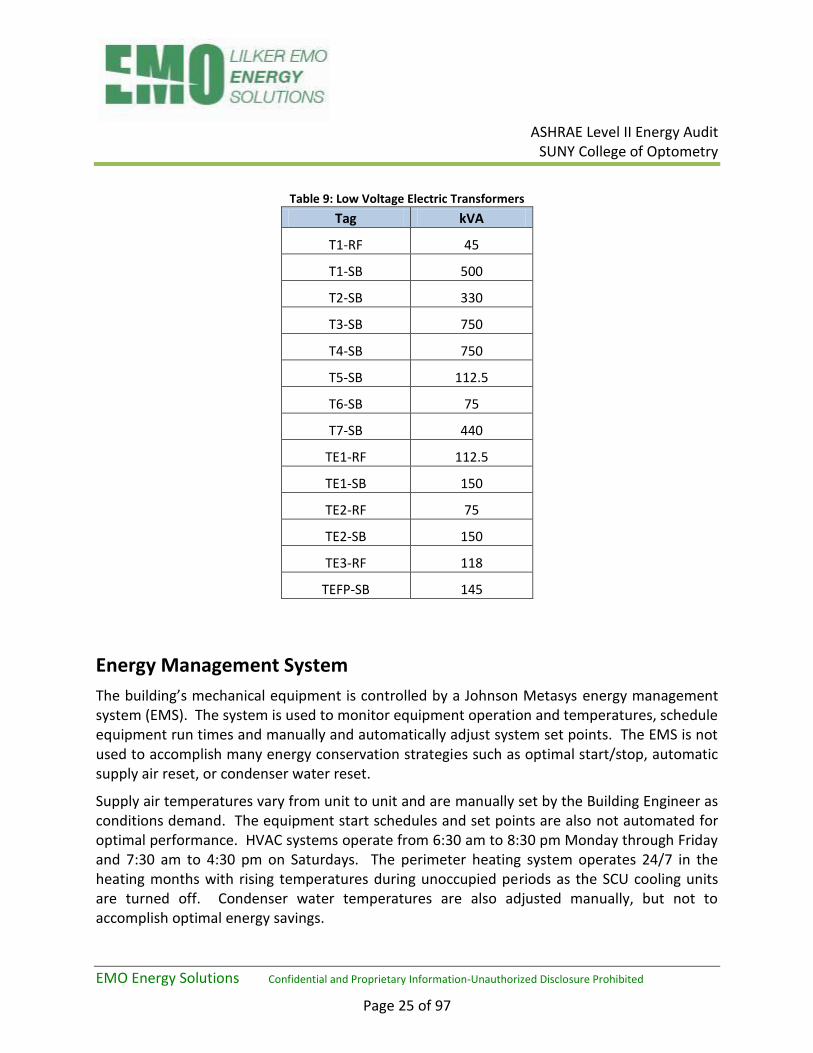
Transformers
The building was observed to have 14 low power electrical transformers totaling 3,753 kVA in capacity. It is believed that most if not all of these transformers date back to the late 1960’s when a major building renovation was undertaken. The chart below shows a listing of the transformers observed.
ASHRAE Level II Energy Audit
SUNY College of Optometry
EMO Energy Solutions Confidential and Proprietary Information-Unauthorized Disclosure Prohibited
Page 25 of 97
Table 9: Low Voltage Electric Transformers
Tag kVA
T1-RF 45
T1-SB 500
T2-SB 330
T3-SB 750
T4-SB 750
T5-SB 112.5
T6-SB 75
T7-SB 440
TE1-RF 112.5
TE1-SB 150
TE2-RF 75
TE2-SB 150
TE3-RF 118
TEFP-SB 145
Energy Management System
The building’s mechanical equipment is controlled by a Johnson Metasys energy management system (EMS). The system is used to monitor equipment operation and temperatures, schedule equipment run times and manually and automatically adjust system set points. The EMS is not used to accomplish many energy conservation strategies such as optimal start/stop, automatic supply air reset, or condenser water reset.
Supply air temperatures vary from unit to unit and are manually set by the Building Engineer as conditions demand. The equipment start schedules and set points are also not automated for optimal performance. HVAC systems operate from 6:30 am to 8:30 pm Monday through Friday and 7:30 am to 4:30 pm on Saturdays. The perimeter heating system operates 24/7 in the heating months with rising temperatures during unoccupied periods as the SCU cooling units are turned off. Condenser water temperatures are also adjusted manually, but not to accomplish optimal energy savings.

ASHRAE Level II Energy Audit
SUNY College of Optometry
EMO Energy Solutions Confidential and Proprietary Information-Unauthorized Disclosure Prohibited
Page 26 of 97
Figure 8: EMS Screenshot
Miscellaneous Equipment
Elevators
There are eight elevators located in the building including six passenger elevators and two freight elevators. These are powered by 41 hp and 49 hp motors.
Figure 9: Elevator Motors in Penthouse Mechanical Room
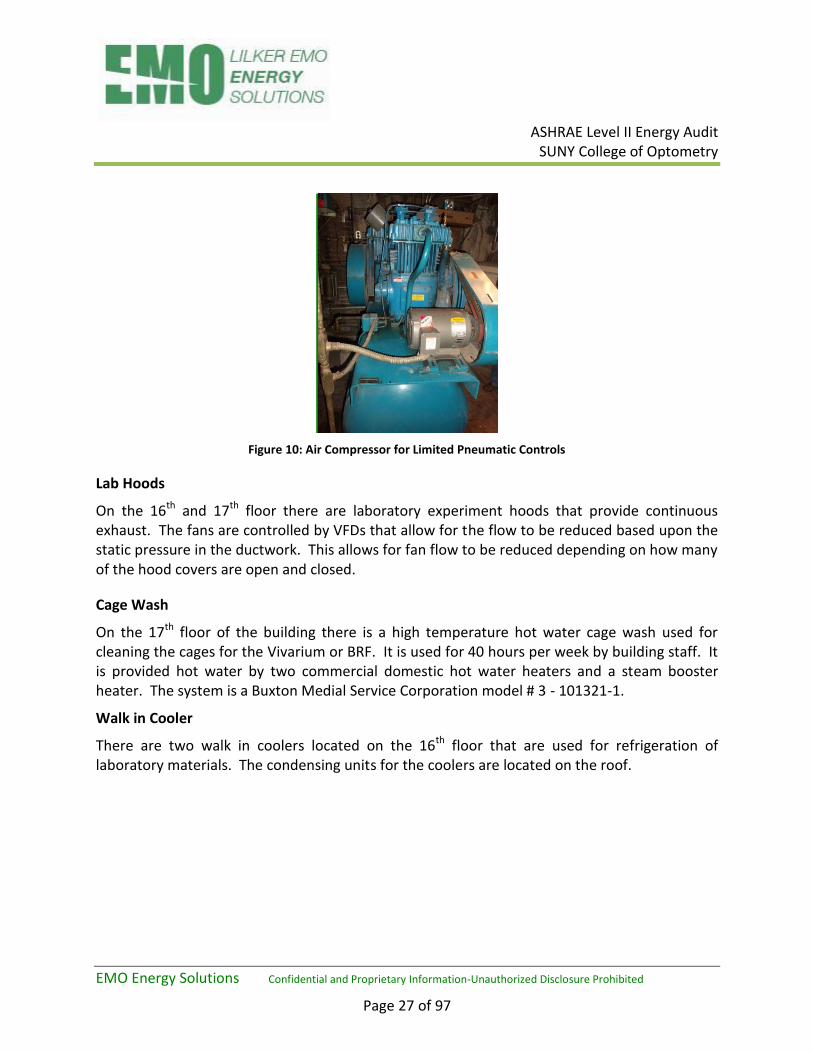
Air Compressors
There is an air compressor and air dryer located in the 17th floor mechanical room that is used for compressed air in the labs. There is also an air compressor located in the penthouse mechanical room that is used for the older pneumatic controls in the building.
ASHRAE Level II Energy Audit
SUNY College of Optometry
EMO Energy Solutions Confidential and Proprietary Information-Unauthorized Disclosure Prohibited
Page 27 of 97
Figure 10: Air Compressor for Limited Pneumatic Controls
Lab Hoods
On the 16th and 17th floor there are laboratory experiment hoods that provide continuous exhaust. The fans are controlled by VFDs that allow for the flow to be reduced based upon the static pressure in the ductwork. This allows for fan flow to be reduced depending on how many of the hood covers are open and closed.
Cage Wash
On the 17th floor of the building there is a high temperature hot water cage wash used for cleaning the cages for the Vivarium or BRF. It is used for 40 hours per week by building staff. It is provided hot water by two commercial domestic hot water heaters and a steam booster heater. The system is a Buxton Medial Service Corporation model # 3 - 101321-1.
Walk in Cooler
There are two walk in coolers located on the 16th floor that are used for refrigeration of laboratory materials. The condensing units for the coolers are located on the roof.
ASHRAE Level II Energy Audit
SUNY College of Optometry
EMO Energy Solutions Confidential and Proprietary Information-Unauthorized Disclosure Prohibited
Page 28 of 97
Building Shell
Windows
The windows on the north and south sides of the building are double pane metal frame and were replaced in 2008. The windows on the east and west sides of the building are single pane metal frame and are of 1960s vintage.
Roof
The existing roof is composed of a built up structure with rigid insulation installed between the concrete slab and bituminous exterior layer. The roof is in good condition and is only tens year old, but because of construction activity on the roof there have been a few leaks that have been repaired.
ASHRAE Level II Energy Audit
SUNY College of Optometry
EMO Energy Solutions Confidential and Proprietary Information-Unauthorized Disclosure Prohibited
Page 29 of 97
Energy Conservation Measures
Low/No Cost Measures
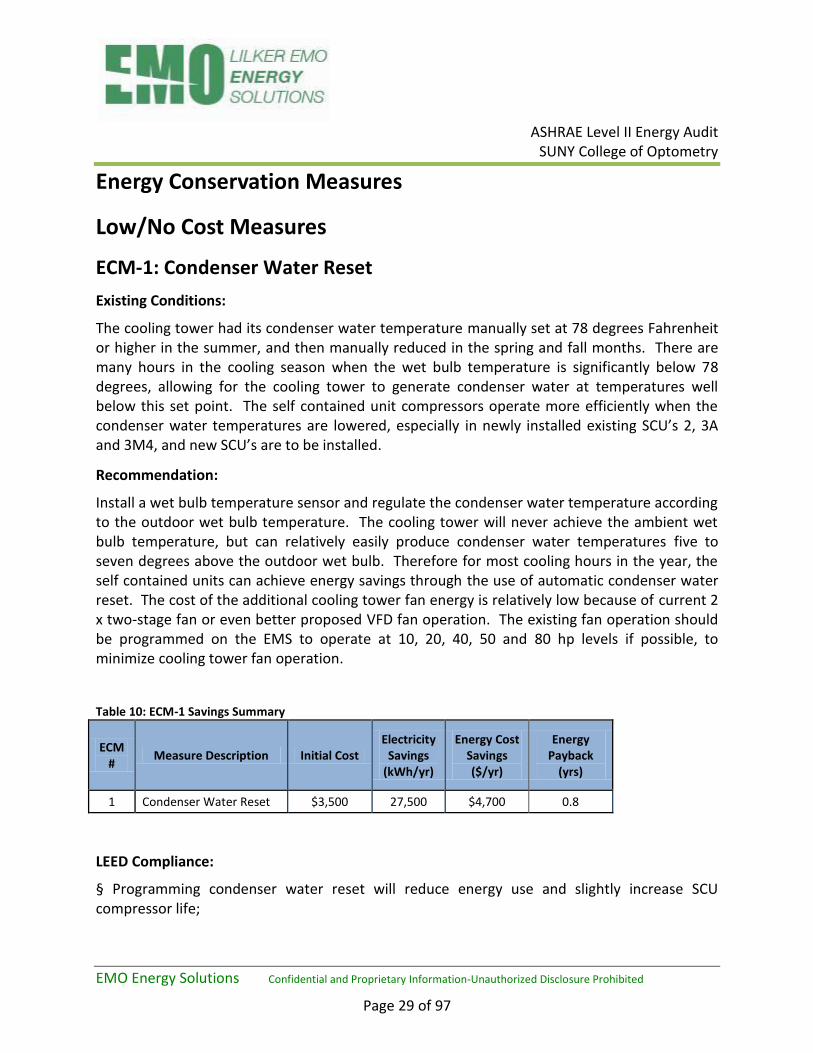
ECM-1: Condenser Water Reset
Existing Conditions:
The cooling tower had its condenser water temperature manually set at 78 degrees Fahrenheit or higher in the summer, and then manually reduced in the spring and fall months. There are many hours in the cooling season when the wet bulb temperature is significantly below 78 degrees, allowing for the cooling tower to generate condenser water at temperatures well below this set point. The self contained unit compressors operate more efficiently when the condenser water temperatures are lowered, especially in newly installed existing SCU’s 2, 3A and 3M4, and new SCU’s are to be installed.
Recommendation:
Install a wet bulb temperature sensor and regulate the condenser water temperature according to the outdoor wet bulb temperature. The cooling tower will never achieve the ambient wet bulb temperature, but can relatively easily produce condenser water temperatures five to seven degrees above the outdoor wet bulb. Therefore for most cooling hours in the year, the self contained units can achieve energy savings through the use of automatic condenser water reset. The cost of the additional cooling tower fan energy is relatively low because of current 2 x two-stage fan or even better proposed VFD fan operation. The existing fan operation should be programmed on the EMS to operate at 10, 20, 40, 50 and 80 hp levels if possible, to minimize cooling tower fan operation.
Table 10: ECM-1 Savings Summary
ECM #
Measure Description Initial Cost Electricity
Savings (kWh/yr)
Energy Cost Savings ($/yr)
Energy Payback
(yrs)
1 Condenser Water Reset $3,500 27,500 $4,700 0.8
LEED Compliance:
§ Programming condenser water reset will reduce energy use and slightly increase SCU compressor life;
ASHRAE Level II Energy Audit
SUNY College of Optometry
EMO Energy Solutions Confidential and Proprietary Information-Unauthorized Disclosure Prohibited
Page 30 of 97
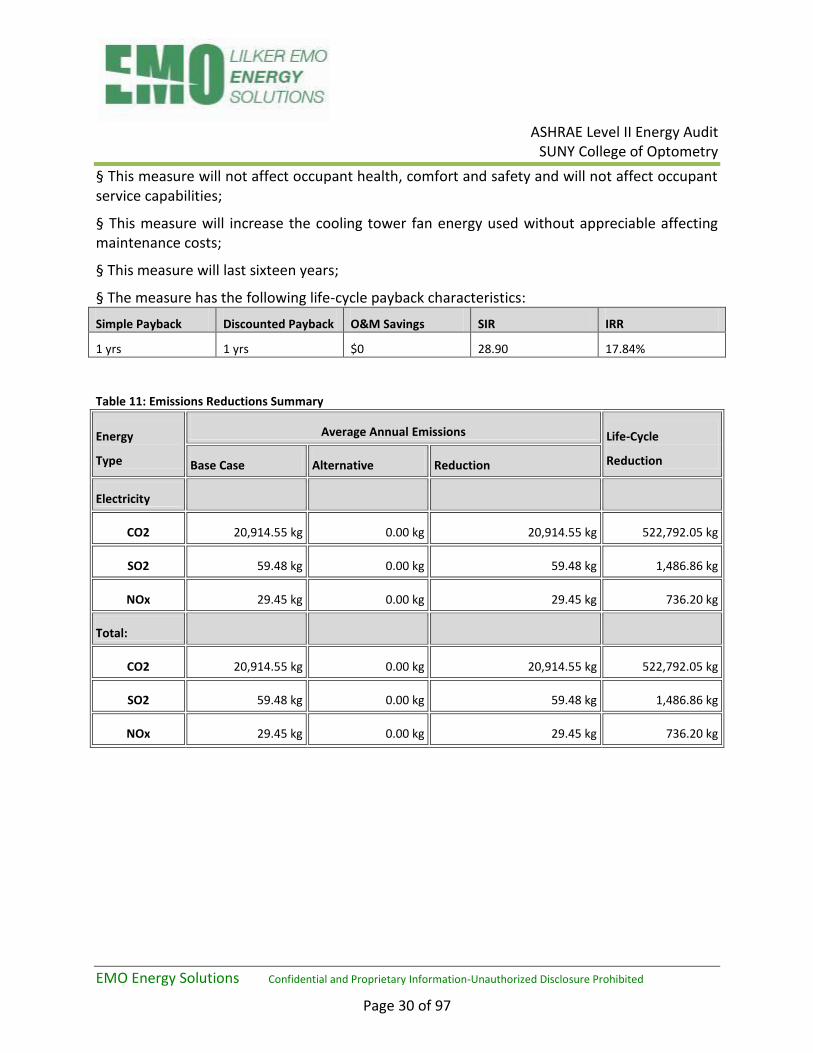
§ This measure will not affect occupant health, comfort and safety and will not affect occupant service capabilities;
§ This measure will increase the cooling tower fan energy used without appreciable affecting maintenance costs;
§ This measure will last sixteen years;
§ The measure has the following life-cycle payback characteristics:
Simple Payback Discounted Payback O&M Savings SIR IRR
1 yrs 1 yrs $0 28.90 17.84%
Table 11: Emissions Reductions Summary
Energy
Type
Average Annual Emissions Life-Cycle
Reduction Base Case Alternative Reduction
Electricity
CO2 20,914.55 kg 0.00 kg 20,914.55 kg 522,792.05 kg
SO2 59.48 kg 0.00 kg 59.48 kg 1,486.86 kg
NOx 29.45 kg 0.00 kg 29.45 kg 736.20 kg
Total:
CO2 20,914.55 kg 0.00 kg 20,914.55 kg 522,792.05 kg
SO2 59.48 kg 0.00 kg 59.48 kg 1,486.86 kg
NOx 29.45 kg 0.00 kg 29.45 kg 736.20 kg
ASHRAE Level II Energy Audit
SUNY College of Optometry
EMO Energy Solutions Confidential and Proprietary Information-Unauthorized Disclosure Prohibited
Page 31 of 97
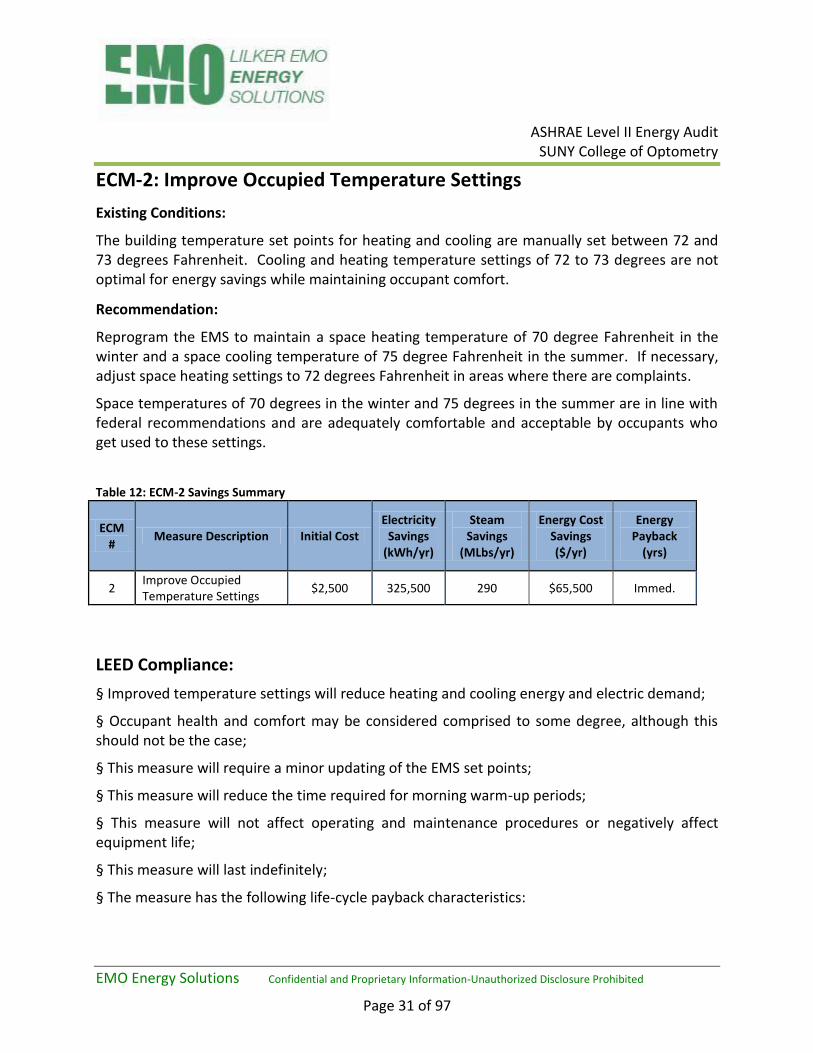
ECM-2: Improve Occupied Temperature Settings
Existing Conditions:
The building temperature set points for heating and cooling are manually set between 72 and 73 degrees Fahrenheit. Cooling and heating temperature settings of 72 to 73 degrees are not optimal for energy savings while maintaining occupant comfort.
Recommendation:
Reprogram the EMS to maintain a space heating temperature of 70 degree Fahrenheit in the winter and a space cooling temperature of 75 degree Fahrenheit in the summer. If necessary, adjust space heating settings to 72 degrees Fahrenheit in areas where there are complaints.
Space temperatures of 70 degrees in the winter and 75 degrees in the summer are in line with federal recommendations and are adequately comfortable and acceptable by occupants who get used to these settings.
Table 12: ECM-2 Savings Summary
ECM #
Measure Description Initial Cost Electricity
Savings (kWh/yr)
Steam Savings
(MLbs/yr)
Energy Cost Savings ($/yr)
Energy Payback
(yrs)
2 Improve Occupied Temperature Settings
$2,500 325,500 290 $65,500 Immed.
LEED Compliance:
§ Improved temperature settings will reduce heating and cooling energy and electric demand;
§ Occupant health and comfort may be considered comprised to some degree, although this should not be the case;
§ This measure will require a minor updating of the EMS set points;
§ This measure will reduce the time required for morning warm-up periods;
§ This measure will not affect operating and maintenance procedures or negatively affect equipment life;
§ This measure will last indefinitely;
§ The measure has the following life-cycle payback characteristics:
ASHRAE Level II Energy Audit
SUNY College of Optometry
EMO Energy Solutions Confidential and Proprietary Information-Unauthorized Disclosure Prohibited
Page 32 of 97
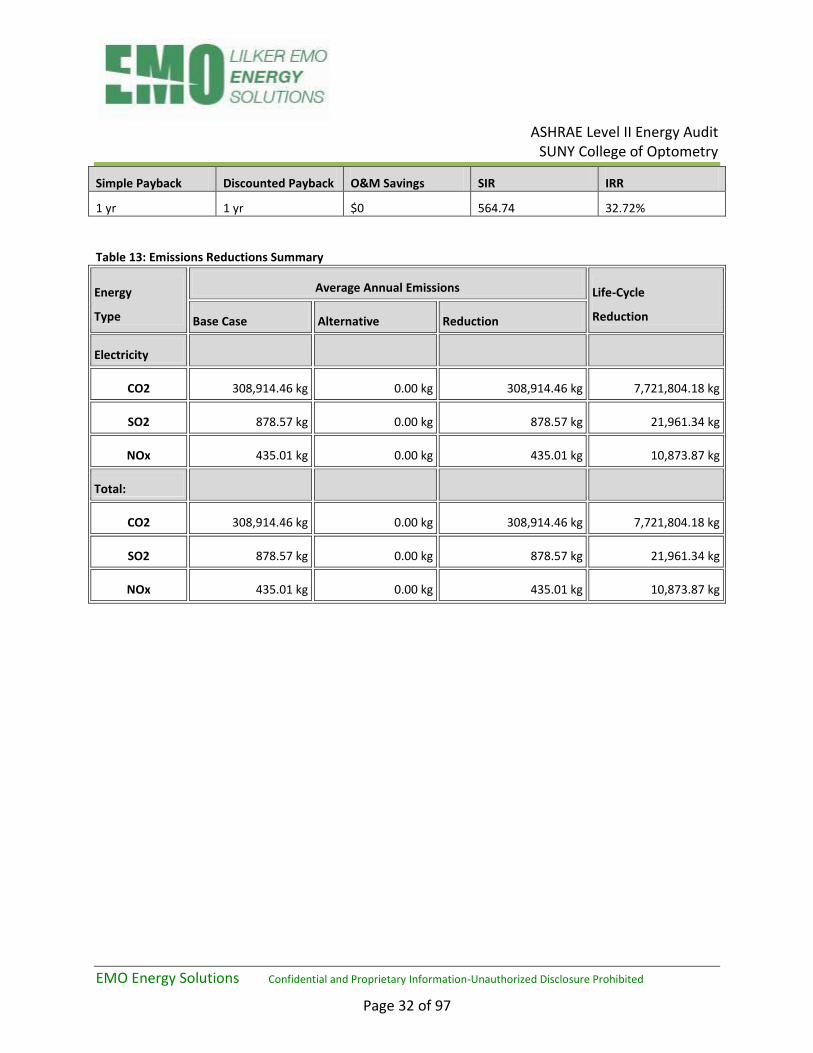
Simple Payback Discounted Payback O&M Savings SIR IRR
1 yr 1 yr $0 564.74 32.72%
Table 13: Emissions Reductions Summary
Energy
Type
Average Annual Emissions Life-Cycle
Reduction Base Case Alternative Reduction
Electricity
CO2 308,914.46 kg 0.00 kg 308,914.46 kg 7,721,804.18 kg
SO2 878.57 kg 0.00 kg 878.57 kg 21,961.34 kg
NOx 435.01 kg 0.00 kg 435.01 kg 10,873.87 kg
Total:
CO2 308,914.46 kg 0.00 kg 308,914.46 kg 7,721,804.18 kg
SO2 878.57 kg 0.00 kg 878.57 kg 21,961.34 kg
NOx 435.01 kg 0.00 kg 435.01 kg 10,873.87 kg

ASHRAE Level II Energy Audit
SUNY College of Optometry
EMO Energy Solutions Confidential and Proprietary Information-Unauthorized Disclosure Prohibited
Page 33 of 97
ECM-3: Synchronous and Cog Belts
Existing Conditions:
The fan motors on the existing self contained units, cooling tower fans and air compressor operate using V-belt drives. V-belt slippage is typically seven percent which wastes fan motor energy.
Recommendation:
Have the manufacturer of the new self contained units and cooling tower install synchronous belts and pulleys on all motors fan motors to reduce belt slippage to two percent, minimizing energy losses in the fan/motor assembly. Also install synchronous belts and pulleys on the existing Mammoth self contained units and Aaon rooftop unit, wherever fan motors are five hp or larger. Synchronous belts will reduce fan motor operating costs by five percent over V-belts, requiring less maintenance and adjustment. They also run quieter, can operate at slower speeds, and are less likely to jump out of their pulleys.
For the penthouse air compressor motors and roof exhaust fans, replace the V-belts with cog belts when belt replacement is required, to reduce belt slippage to five percent, minimizing energy losses by two percent.
Figure 11: Synchronous Belts and Pulleys
Table 14: ECM-3 Savings Summary
ECM #
Measure Description Initial Cost Electricity
Savings (kWh/yr)
Energy Cost Savings ($/yr)
Energy Payback
(yrs)
3 Synchronous and Cog Belts $17,800 89,500 $15,200 1.2
ASHRAE Level II Energy Audit
SUNY College of Optometry
EMO Energy Solutions Confidential and Proprietary Information-Unauthorized Disclosure Prohibited
Page 34 of 97
LEED Compliance:
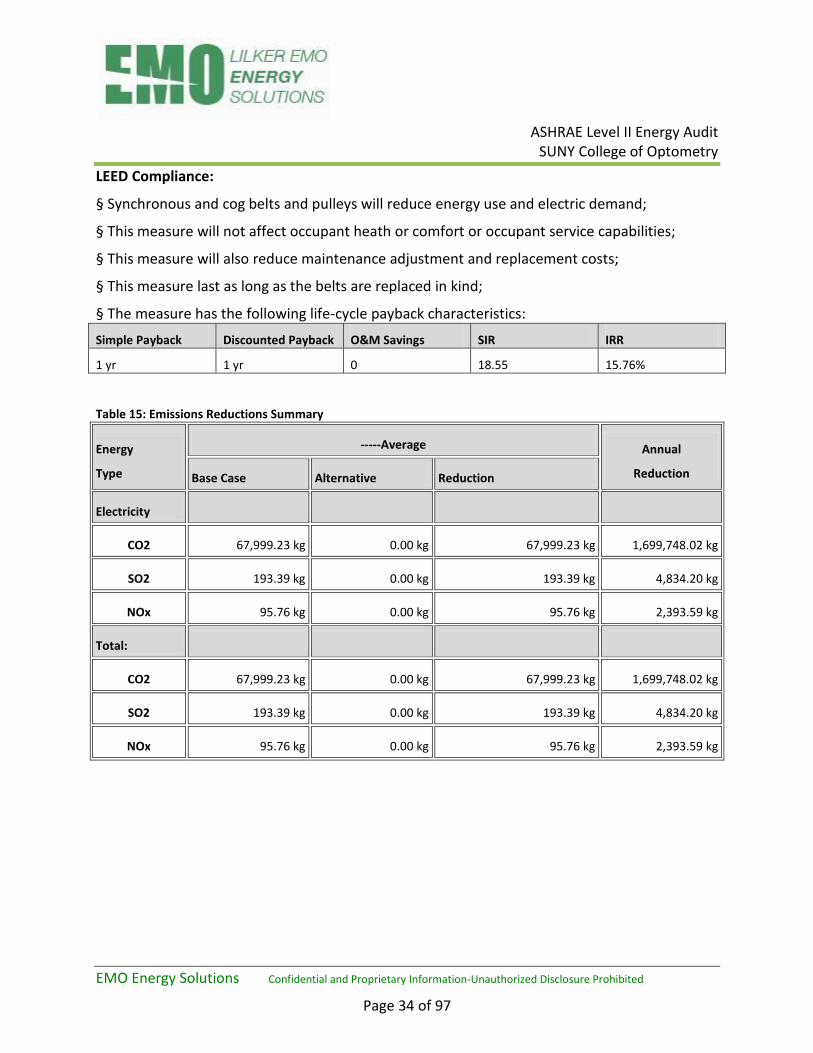
§ Synchronous and cog belts and pulleys will reduce energy use and electric demand;
§ This measure will not affect occupant heath or comfort or occupant service capabilities;
§ This measure will also reduce maintenance adjustment and replacement costs;
§ This measure last as long as the belts are replaced in kind;
§ The measure has the following life-cycle payback characteristics:
Simple Payback Discounted Payback O&M Savings SIR IRR
1 yr 1 yr 0 18.55 15.76%
Table 15: Emissions Reductions Summary
Energy
Type
-----Average Annual
Reduction Base Case Alternative Reduction
Electricity
CO2 67,999.23 kg 0.00 kg 67,999.23 kg 1,699,748.02 kg
SO2 193.39 kg 0.00 kg 193.39 kg 4,834.20 kg
NOx 95.76 kg 0.00 kg 95.76 kg 2,393.59 kg
Total:
CO2 67,999.23 kg 0.00 kg 67,999.23 kg 1,699,748.02 kg
SO2 193.39 kg 0.00 kg 193.39 kg 4,834.20 kg
NOx 95.76 kg 0.00 kg 95.76 kg 2,393.59 kg
ASHRAE Level II Energy Audit
SUNY College of Optometry
EMO Energy Solutions Confidential and Proprietary Information-Unauthorized Disclosure Prohibited
Page 35 of 97
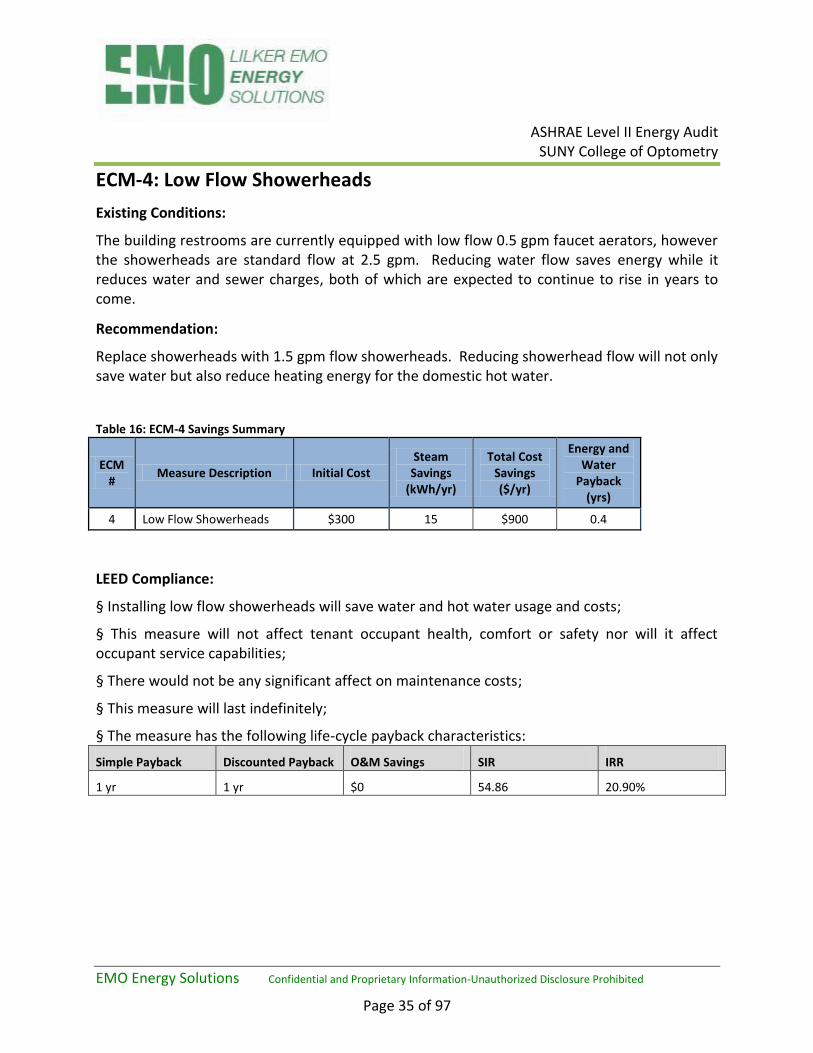
ECM-4: Low Flow Showerheads
Existing Conditions:
The building restrooms are currently equipped with low flow 0.5 gpm faucet aerators, however the showerheads are standard flow at 2.5 gpm. Reducing water flow saves energy while it reduces water and sewer charges, both of which are expected to continue to rise in years to come.
Recommendation:
Replace showerheads with 1.5 gpm flow showerheads. Reducing showerhead flow will not only save water but also reduce heating energy for the domestic hot water.
Table 16: ECM-4 Savings Summary
ECM #
Measure Description Initial Cost Steam
Savings (kWh/yr)
Total Cost Savings ($/yr)
Energy and Water
Payback (yrs)
4 Low Flow Showerheads $300 15 $900 0.4
LEED Compliance:
§ Installing low flow showerheads will save water and hot water usage and costs;
§ This measure will not affect tenant occupant health, comfort or safety nor will it affect occupant service capabilities;
§ There would not be any significant affect on maintenance costs;
§ This measure will last indefinitely;
§ The measure has the following life-cycle payback characteristics:
Simple Payback Discounted Payback O&M Savings SIR IRR
1 yr 1 yr $0 54.86 20.90%

ASHRAE Level II Energy Audit
SUNY College of Optometry
EMO Energy Solutions Confidential and Proprietary Information-Unauthorized Disclosure Prohibited
Page 36 of 97
Table 17: Emissions Reductions Summary
Energy
Type
Average Annual Emissions Life-Cycle
Reduction Base Case Alternative Reduction
Electricity
CO2 3,238.10 kg 0.00 kg 3,238.10 kg 80,941.49 kg
SO2 9.21 kg 0.00 kg 9.21 kg 230.20 kg
NOx 4.56 kg 0.00 kg 4.56 kg 113.98 kg
Total:
CO2 3,238.10 kg 0.00 kg 3,238.10 kg 80,941.49 kg
SO2 9.21 kg 0.00 kg 9.21 kg 230.20 kg
NOx 4.56 kg 0.00 kg 4.56 kg 113.98 kg

ASHRAE Level II Energy Audit
SUNY College of Optometry
EMO Energy Solutions Confidential and Proprietary Information-Unauthorized Disclosure Prohibited
Page 37 of 97
ECM-5: Program Computers to Hibernate
Existing Conditions:
The building was reported to have 450 desktops with monitors and laptops. Based on discussions with the IT Department of SUNY College of Optometry, many computer workstations are not turned off at night. Computers still use considerable power in the power savings stand-by mode (approx. 120 watts) but use almost no power in the hibernate mode (3-6 watts).
After the field site visit the IT Department reported on a pinging of the building’s computers that 273 computers or approximately 60 percent of the computers were operational in the standby mode overnight.
Recommendation:
SUNY can advise their employees to turn off their personal computers every night, which wastes time when starting up in the morning, or the computers can all be programmed to switch over to the hibernate mode when they are not being used. This can be done from the Control Panel found on each computer and then going to the Power Options icon to switch the computer to the hibernate mode when it is not in use for 30 minutes or an hour. When logging off at night, put the computer in the hibernate mode.
Table 18: ECM-5 Savings Summary
ECM #
Measure Description Initial Cost Electricity
Savings (kWh/yr)
Energy Cost Savings ($/yr)
Energy Payback
(yrs)
5 Computer in Hibernate Mode
$3,800 184,300 $31,200 0.1
LEED Compliance:
§ Placing computers in hibernate mode will reduce electric usage;
§ Occupant health and comfort will not be comprised;
§ This measure will require adjustments to each computer Control Panel/Power Options screen;
§ Computer warm up periods in the morning may be increased slightly;
§ This measure will reduce computer and monitor operating and maintenance costs while increasing equipment life;
§ This measure will last as long as the computers are in use;

ASHRAE Level II Energy Audit
SUNY College of Optometry
EMO Energy Solutions Confidential and Proprietary Information-Unauthorized Disclosure Prohibited
Page 38 of 97
§ The measure has the following life-cycle payback characteristics:
Simple Payback Discounted Payback O&M Savings SIR IRR
1 yr 1 yr $6,825 204.41 27.43%
Table 19: Emissions Reductions Summary
Energy
Type
-----Average Annual
Reduction Base Case Alternative Reduction
Electricity
CO2 139,924.40 kg 0.00 kg 139,924.40 kg 3,497,631.07 kg
SO2 397.95 kg 0.00 kg 397.95 kg 9,947.50 kg
NOx 197.04 kg 0.00 kg 197.04 kg 4,925.38 kg
Total:
CO2 139,924.40 kg 0.00 kg 139,924.40 kg 3,497,631.07 kg
SO2 397.95 kg 0.00 kg 397.95 kg 9,947.50 kg
NOx 197.04 kg 0.00 kg 197.04 kg 4,925.38 kg

ASHRAE Level II Energy Audit
SUNY College of Optometry
EMO Energy Solutions Confidential and Proprietary Information-Unauthorized Disclosure Prohibited
Page 39 of 97
ECM-6: Shut Off Printers at Nights and on Weekends
Existing Conditions:
The building was reported to have 181 black and white and color printers. Discussions with the building engineer indicated that the printers are not turned off at night. Even in the sleep mode the printers will use 10 to 36 watts per hour of power. All of these printers are located in areas unoccupied at nights and on weekends, leaving as much as 118 hours per week of possible energy savings.
Recommendation:
Install a simple 24 hour, 7 day week timer switch (GE model #15089) on each printer to turn off all printers at 5:00 to 9:00 in the evening and turn them on again at 7:30 in the morning, Mondays through Fridays and possibly Saturdays. In rooms with several printers located near each other, several printers could be controlled by one timer switch.
Alternatively SUNY staff could be directed to turn off the printers each night to realize the same savings without any of the costs.
Table 20: ECM-6 Savings Summary
ECM #
Measure Description Initial Cost Electricity
Savings (kWh/yr)
Energy Cost Savings ($/yr)
Energy Payback
(yrs)
6 Turn Off Printers $3,900 13,300 $2,300 1.7
LEED Compliance:
§ Printer shut off will reduce electric usage;
§ Occupant health, comfort and safety will not be comprised;
§ This measure will require installation of a seven day plug in timer switch at each printer or printer group;
§ Printer start up and the warm up period can be timed before building occupants arrive;
§ This measure will reduce printer operating and maintenance costs while increasing equipment life;
§ This measure will last as long as the timer switches are maintained and replaced;
§ The measure has the following life-cycle payback characteristics:
ASHRAE Level II Energy Audit
SUNY College of Optometry
EMO Energy Solutions Confidential and Proprietary Information-Unauthorized Disclosure Prohibited
Page 40 of 97
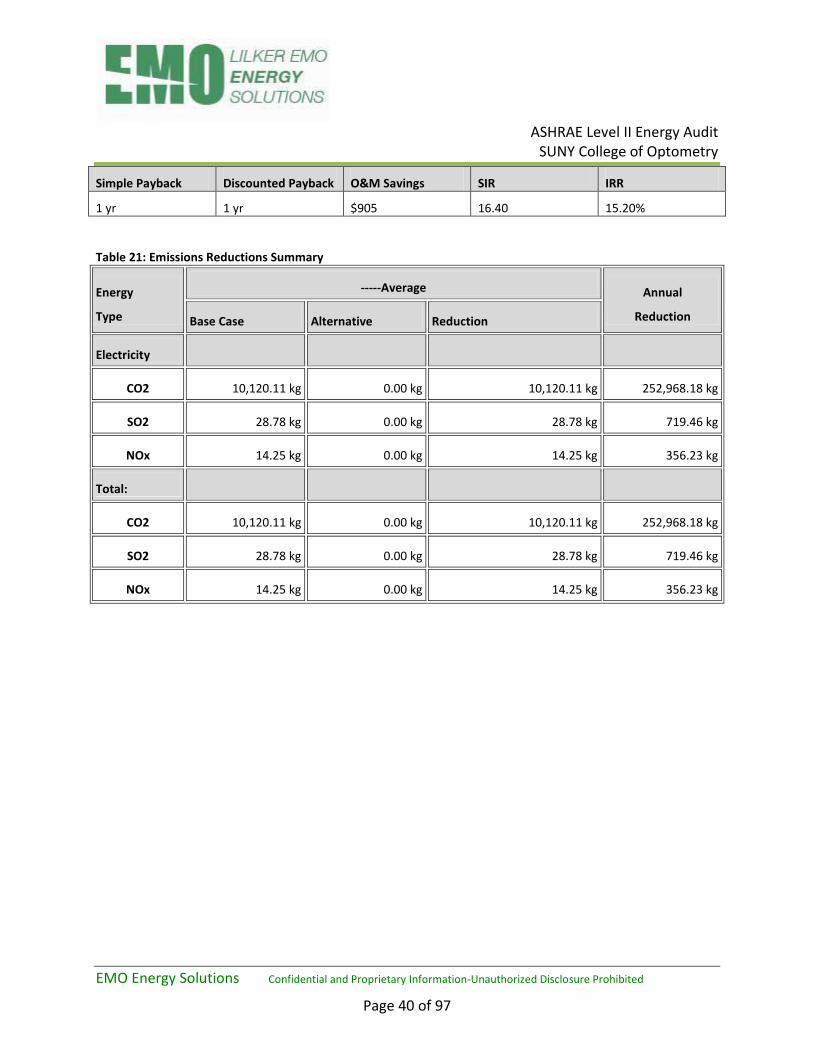
Simple Payback Discounted Payback O&M Savings SIR IRR
1 yr 1 yr $905 16.40 15.20%
Table 21: Emissions Reductions Summary
Energy
Type
-----Average Annual
Reduction Base Case Alternative Reduction
Electricity
CO2 10,120.11 kg 0.00 kg 10,120.11 kg 252,968.18 kg
SO2 28.78 kg 0.00 kg 28.78 kg 719.46 kg
NOx 14.25 kg 0.00 kg 14.25 kg 356.23 kg
Total:
CO2 10,120.11 kg 0.00 kg 10,120.11 kg 252,968.18 kg
SO2 28.78 kg 0.00 kg 28.78 kg 719.46 kg
NOx 14.25 kg 0.00 kg 14.25 kg 356.23 kg
ASHRAE Level II Energy Audit
SUNY College of Optometry
EMO Energy Solutions Confidential and Proprietary Information-Unauthorized Disclosure Prohibited
Page 41 of 97
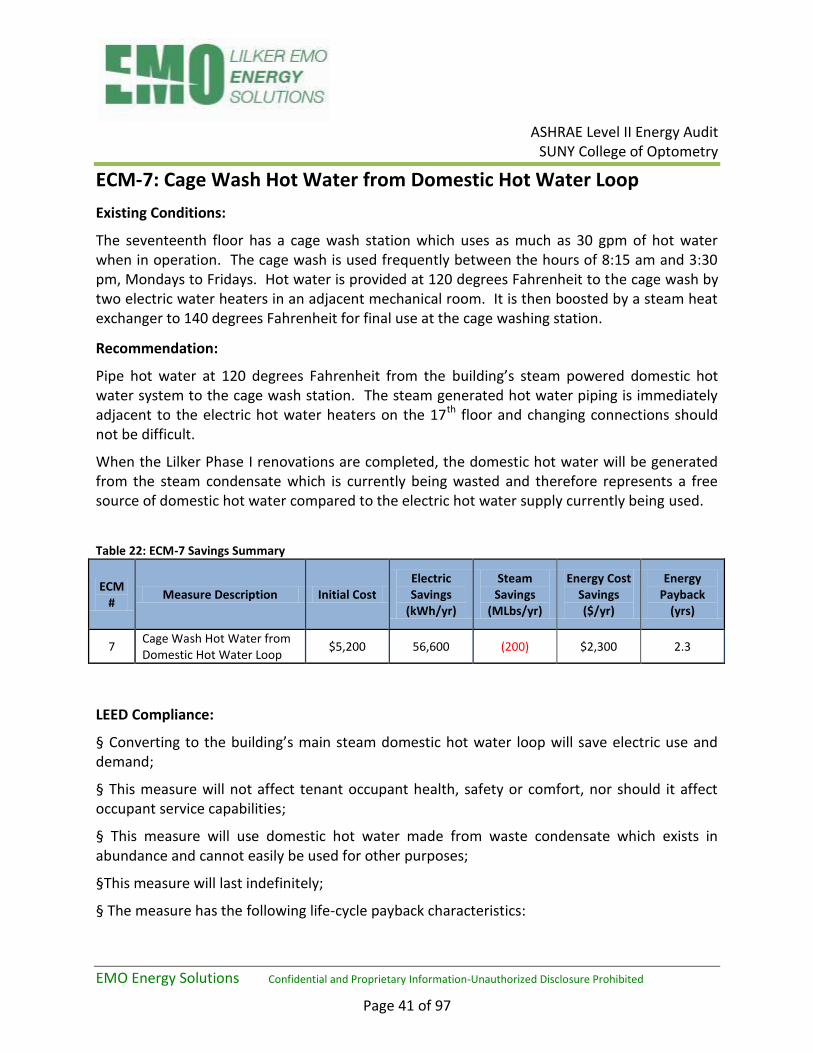
ECM-7: Cage Wash Hot Water from Domestic Hot Water Loop
Existing Conditions:
The seventeenth floor has a cage wash station which uses as much as 30 gpm of hot water when in operation. The cage wash is used frequently between the hours of 8:15 am and 3:30 pm, Mondays to Fridays. Hot water is provided at 120 degrees Fahrenheit to the cage wash by two electric water heaters in an adjacent mechanical room. It is then boosted by a steam heat exchanger to 140 degrees Fahrenheit for final use at the cage washing station.
Recommendation:
Pipe hot water at 120 degrees Fahrenheit from the building’s steam powered domestic hot water system to the cage wash station. The steam generated hot water piping is immediately adjacent to the electric hot water heaters on the 17th floor and changing connections should not be difficult.
When the Lilker Phase I renovations are completed, the domestic hot water will be generated from the steam condensate which is currently being wasted and therefore represents a free source of domestic hot water compared to the electric hot water supply currently being used.
Table 22: ECM-7 Savings Summary
ECM #
Measure Description Initial Cost Electric Savings
(kWh/yr)
Steam Savings
(MLbs/yr)
Energy Cost Savings ($/yr)
Energy Payback
(yrs)
7 Cage Wash Hot Water from Domestic Hot Water Loop
$5,200 56,600 (200) $2,300 2.3
LEED Compliance:
§ Converting to the building’s main steam domestic hot water loop will save electric use and demand;
§ This measure will not affect tenant occupant health, safety or comfort, nor should it affect occupant service capabilities;
§ This measure will use domestic hot water made from waste condensate which exists in abundance and cannot easily be used for other purposes;
§This measure will last indefinitely;
§ The measure has the following life-cycle payback characteristics:

ASHRAE Level II Energy Audit
SUNY College of Optometry
EMO Energy Solutions Confidential and Proprietary Information-Unauthorized Disclosure Prohibited
Page 42 of 97
Simple Payback Discounted Payback O&M Savings SIR IRR
3 yrs 3 yrs $0 9.01 12.47%
Table 23: Emissions Reductions Summary
Energy
Type
Average Annual Emissions Life-Cycle
Reduction Base Case Alternative Reduction
Electricity
CO2 42,942.33 kg 42,958.83 kg -16.50 kg -412.56 kg
SO2 122.13 kg 122.18 kg -0.05 kg -1.17 kg
NOx 60.47 kg 60.49 kg -0.02 kg -0.58 kg
Total:
CO2 42,942.33 kg 42,958.83 kg -16.50 kg -412.56 kg
SO2 122.13 kg 122.18 kg -0.05 kg -1.17 kg
NOx 60.47 kg 60.49 kg -0.02 kg -0.58 kg

ASHRAE Level II Energy Audit
SUNY College of Optometry
EMO Energy Solutions Confidential and Proprietary Information-Unauthorized Disclosure Prohibited
Page 43 of 97
ECM-8: Supply Air Temperature Reset
Existing Conditions:
The SCU supply air temperatures are set manually by the Building Engineer based on tenant comfort levels and complaints to maintain an acceptable space temperature. However the EMS could continually regulate the supply air set point temperatures automatically for each SCU during all seasons of the year to minimize electric cooling and even some electric reheat costs to their optimal levels.
Recommendation:
Program the EMS with supply air reset to automatically adjust the supply air temperature for each SCU individually, based on the cooling requirements of the least satisfied zone or VAV box served by the SCU. With this strategy, the supply air temperatures will be maximized for each SCU, reducing cooling, and where applicable electric reheat costs, to their maximum savings levels.
Table 24: ECM-8 Savings Summary
ECM #
Measure Description Initial Cost Electricity
Savings (kWh/yr)
Energy Cost Savings ($/yr)
Energy Payback
(yrs)
8 Supply Air Reset $13,000 229,600 $38,800 0.3
LEED Compliance:
§ Programming supply air reset will reduce energy use and slightly increase SCU compressor life;
§ This measure will not affect occupant health, comfort and safety and will not affect occupant service capabilities;
§ This measure will reduce the cooling tower fan energy used.
§ Maintenance costs will not be appreciably affected;
§ This measure will last indefinitely;
§ The measure has the following life-cycle payback characteristics:
Simple Payback Discounted Payback O&M Savings SIR IRR
1 yr 1 yr $0 64.60 21.69%

ASHRAE Level II Energy Audit
SUNY College of Optometry
EMO Energy Solutions Confidential and Proprietary Information-Unauthorized Disclosure Prohibited
Page 44 of 97
Table 25: Emissions Reductions Summary
Energy
Type
Average Annual Emissions Life-Cycle
Reduction Base Case Alternative Reduction
Electricity
CO2 174,321.54 kg 0.00 kg 174,321.54 kg 4,357,441.96 kg
SO2 495.78 kg 0.00 kg 495.78 kg 12,392.86 kg
NOx 245.48 kg 0.00 kg 245.48 kg 6,136.17 kg
Total:
CO2 174,321.54 kg 0.00 kg 174,321.54 kg 4,357,441.96 kg
SO2 495.78 kg 0.00 kg 495.78 kg 12,392.86 kg
NOx 245.48 kg 0.00 kg 245.48 kg 6,136.17 kg
ASHRAE Level II Energy Audit
SUNY College of Optometry
EMO Energy Solutions Confidential and Proprietary Information-Unauthorized Disclosure Prohibited
Page 45 of 97
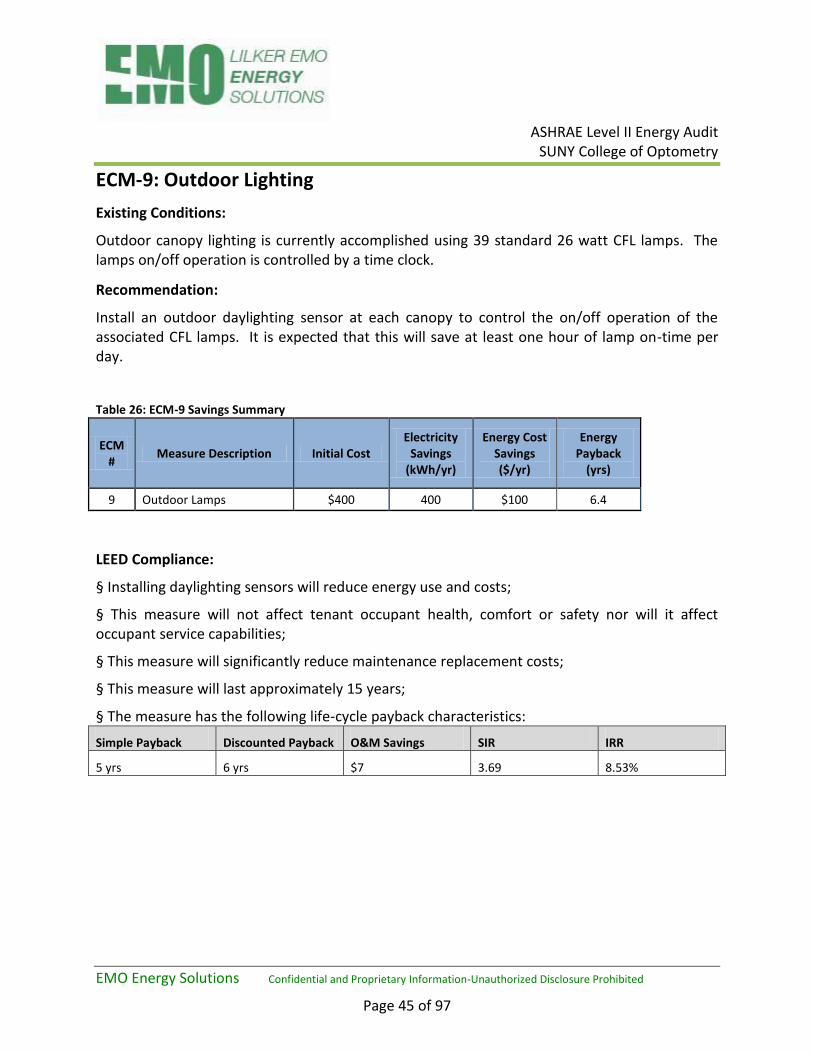
ECM-9: Outdoor Lighting
Existing Conditions:
Outdoor canopy lighting is currently accomplished using 39 standard 26 watt CFL lamps. The lamps on/off operation is controlled by a time clock.
Recommendation:
Install an outdoor daylighting sensor at each canopy to control the on/off operation of the associated CFL lamps. It is expected that this will save at least one hour of lamp on-time per day.
Table 26: ECM-9 Savings Summary
ECM #
Measure Description Initial Cost Electricity
Savings (kWh/yr)
Energy Cost Savings ($/yr)
Energy Payback
(yrs)
9 Outdoor Lamps $400 400 $100 6.4
LEED Compliance:
§ Installing daylighting sensors will reduce energy use and costs;
§ This measure will not affect tenant occupant health, comfort or safety nor will it affect occupant service capabilities;
§ This measure will significantly reduce maintenance replacement costs;
§ This measure will last approximately 15 years;
§ The measure has the following life-cycle payback characteristics:
Simple Payback Discounted Payback O&M Savings SIR IRR
5 yrs 6 yrs $7 3.69 8.53%

ASHRAE Level II Energy Audit
SUNY College of Optometry
EMO Energy Solutions Confidential and Proprietary Information-Unauthorized Disclosure Prohibited
Page 46 of 97
Table 27: Emissions Reductions Summary
Energy
Type
-----Average Annual
Reduction Base Case Alternative Reduction
Electricity
CO2 280.21 kg 0.00 kg 280.21 kg 7,004.22 kg
SO2 0.80 kg 0.00 kg 0.80 kg 19.92 kg
NOx 0.39 kg 0.00 kg 0.39 kg 9.86 kg
Total:
CO2 280.21 kg 0.00 kg 280.21 kg 7,004.22 kg
SO2 0.80 kg 0.00 kg 0.80 kg 19.92 kg
NOx 0.39 kg 0.00 kg 0.39 kg 9.86 kg

ASHRAE Level II Energy Audit
SUNY College of Optometry
EMO Energy Solutions Confidential and Proprietary Information-Unauthorized Disclosure Prohibited
Page 47 of 97
ECM-10: Demand Control Ventilation
Existing Conditions:
The building mechanical drawings indicate that 30,870 cfm of outside ventilation air is being provided to the building whenever the self-contained units fans are operating (excluding laboratory 100 percent outside air systems), which is from 6:30 am until 8:30 pm weekdays, and 7:30 am until 4:30 pm on Saturdays. Therefore the building is being ventilated as if it were fully occupied in the early mornings, evenings and Saturday hours, even though the building is largely unoccupied during that time.
Recommendation:
A. Install carbon dioxide sensors to control the outside air shut off dampers in the all of the SCU mechanical rooms. During the cooling months, maintain carbon dioxide levels at 1,000 ppm or less, in the mechanical rooms and all other rooms with carbon dioxide sensors. When carbon dioxide levels drop below 950 ppm shut off the outside air damper to that mechanical room until the carbon dioxide levels rise above 1,000 ppm in the mechanical room or any of the rooms associated with that SCU.
B. A less costly means to achieve energy and cost savings is to ventilate the building according to the following schedule. This would not require the installation of carbon dioxide sensors, but would regulate the outside air fan motors using VFD’s according to an EMS schedule.
Day Off 25% 100% 30% Off
Weekdays 12:00 am-6:30 am 6:30 am-8:00 am 8:00 am-4:00 pm 4:00pm-8:30pm 8:30 pm-12:00am
Saturdays 12:00 am-7:30 am 7:30 am-4:30 pm - - 4:30 pm-12:00am
Sundays 12:00 am -12:00 am - - - -
Table 28: ECM-10 Savings Summary
ECM #
Measure Description Initial Cost Electricity
Savings (kWh/yr)
Energy Cost Savings ($/yr)
Energy Payback
(yrs)
10a Demand Control Ventilation
$33,000 13,600 $2,300 14.4
10b Ventilation Control Schedule
$2,500 5,500 $900 2.7
ASHRAE Level II Energy Audit
SUNY College of Optometry
EMO Energy Solutions Confidential and Proprietary Information-Unauthorized Disclosure Prohibited
Page 48 of 97
LEED Compliance:
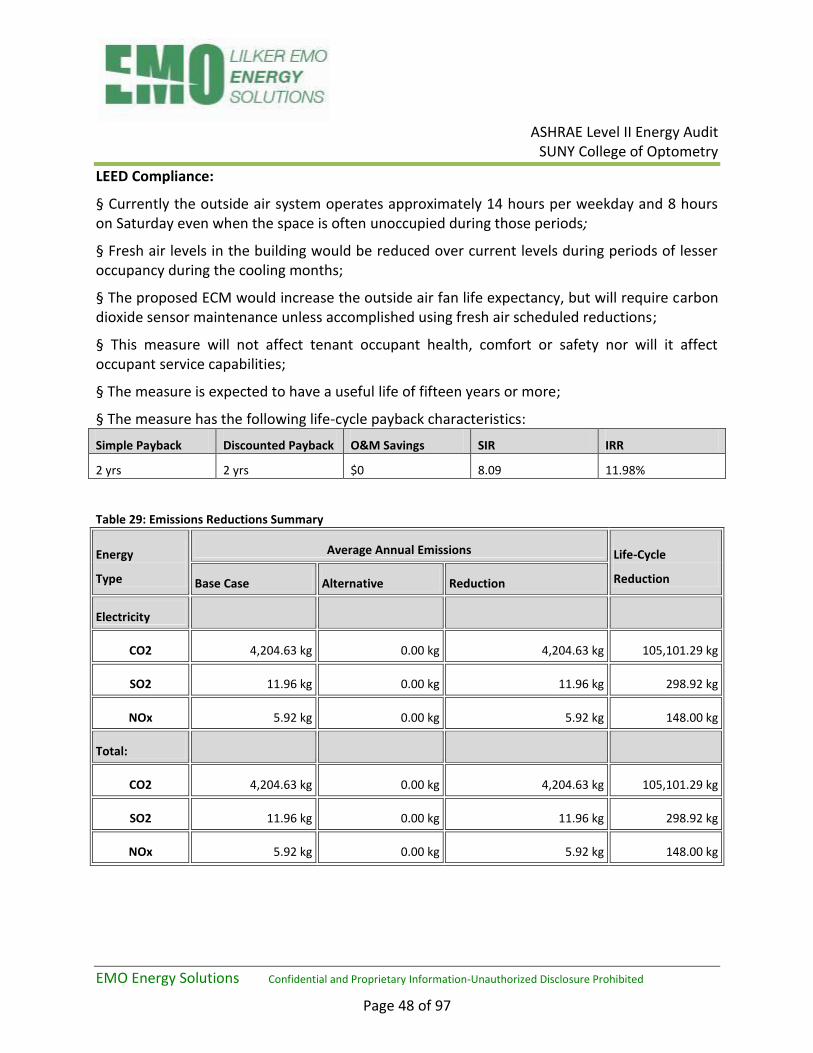
§ Currently the outside air system operates approximately 14 hours per weekday and 8 hours on Saturday even when the space is often unoccupied during those periods;
§ Fresh air levels in the building would be reduced over current levels during periods of lesser occupancy during the cooling months;
§ The proposed ECM would increase the outside air fan life expectancy, but will require carbon dioxide sensor maintenance unless accomplished using fresh air scheduled reductions;
§ This measure will not affect tenant occupant health, comfort or safety nor will it affect occupant service capabilities;
§ The measure is expected to have a useful life of fifteen years or more;
§ The measure has the following life-cycle payback characteristics:
Simple Payback Discounted Payback O&M Savings SIR IRR
2 yrs 2 yrs $0 8.09 11.98%
Table 29: Emissions Reductions Summary
Energy
Type
Average Annual Emissions Life-Cycle
Reduction Base Case Alternative Reduction
Electricity
CO2 4,204.63 kg 0.00 kg 4,204.63 kg 105,101.29 kg
SO2 11.96 kg 0.00 kg 11.96 kg 298.92 kg
NOx 5.92 kg 0.00 kg 5.92 kg 148.00 kg
Total:
CO2 4,204.63 kg 0.00 kg 4,204.63 kg 105,101.29 kg
SO2 11.96 kg 0.00 kg 11.96 kg 298.92 kg
NOx 5.92 kg 0.00 kg 5.92 kg 148.00 kg
ASHRAE Level II Energy Audit
SUNY College of Optometry
EMO Energy Solutions Confidential and Proprietary Information-Unauthorized Disclosure Prohibited
Page 49 of 97
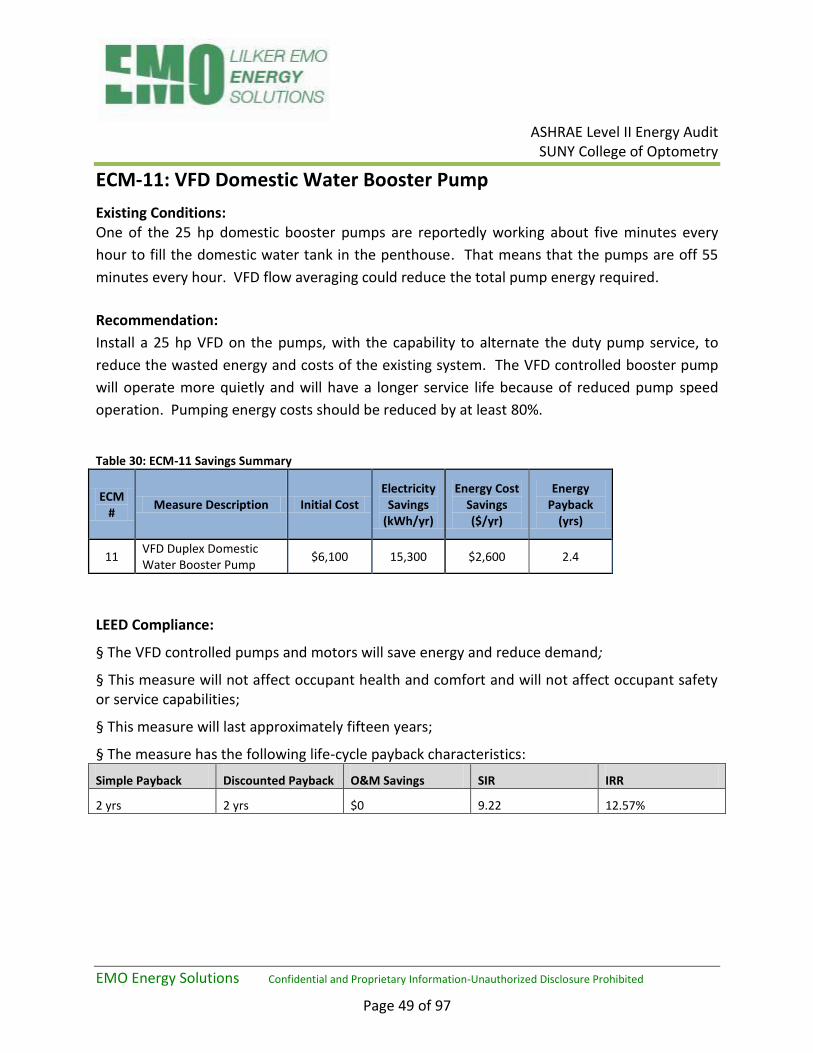
ECM-11: VFD Domestic Water Booster Pump
Existing Conditions: One of the 25 hp domestic booster pumps are reportedly working about five minutes every
hour to fill the domestic water tank in the penthouse. That means that the pumps are off 55
minutes every hour. VFD flow averaging could reduce the total pump energy required.
Recommendation:
Install a 25 hp VFD on the pumps, with the capability to alternate the duty pump service, to
reduce the wasted energy and costs of the existing system. The VFD controlled booster pump
will operate more quietly and will have a longer service life because of reduced pump speed
operation. Pumping energy costs should be reduced by at least 80%.
Table 30: ECM-11 Savings Summary
ECM #
Measure Description Initial Cost Electricity
Savings (kWh/yr)
Energy Cost Savings ($/yr)
Energy Payback
(yrs)
11 VFD Duplex Domestic Water Booster Pump
$6,100 15,300 $2,600 2.4
LEED Compliance:
§ The VFD controlled pumps and motors will save energy and reduce demand;
§ This measure will not affect occupant health and comfort and will not affect occupant safety or service capabilities;
§ This measure will last approximately fifteen years;
§ The measure has the following life-cycle payback characteristics:
Simple Payback Discounted Payback O&M Savings SIR IRR
2 yrs 2 yrs $0 9.22 12.57%

ASHRAE Level II Energy Audit
SUNY College of Optometry
EMO Energy Solutions Confidential and Proprietary Information-Unauthorized Disclosure Prohibited
Page 50 of 97
Table 31: Emissions Reductions Summary
Energy
Type
Average Annual Emissions Life-Cycle
Reduction Base Case Alternative Reduction
Electricity
CO2 11,634.29 kg 0.00 kg 11,634.29 kg 290,817.55 kg
SO2 33.09 kg 0.00 kg 33.09 kg 827.11 kg
NOx 16.38 kg 0.00 kg 16.38 kg 409.53 kg
Total:
CO2 11,634.29 kg 0.00 kg 11,634.29 kg 290,817.55 kg
SO2 33.09 kg 0.00 kg 33.09 kg 827.11 kg
NOx 16.38 kg 0.00 kg 16.38 kg 409.53 kg
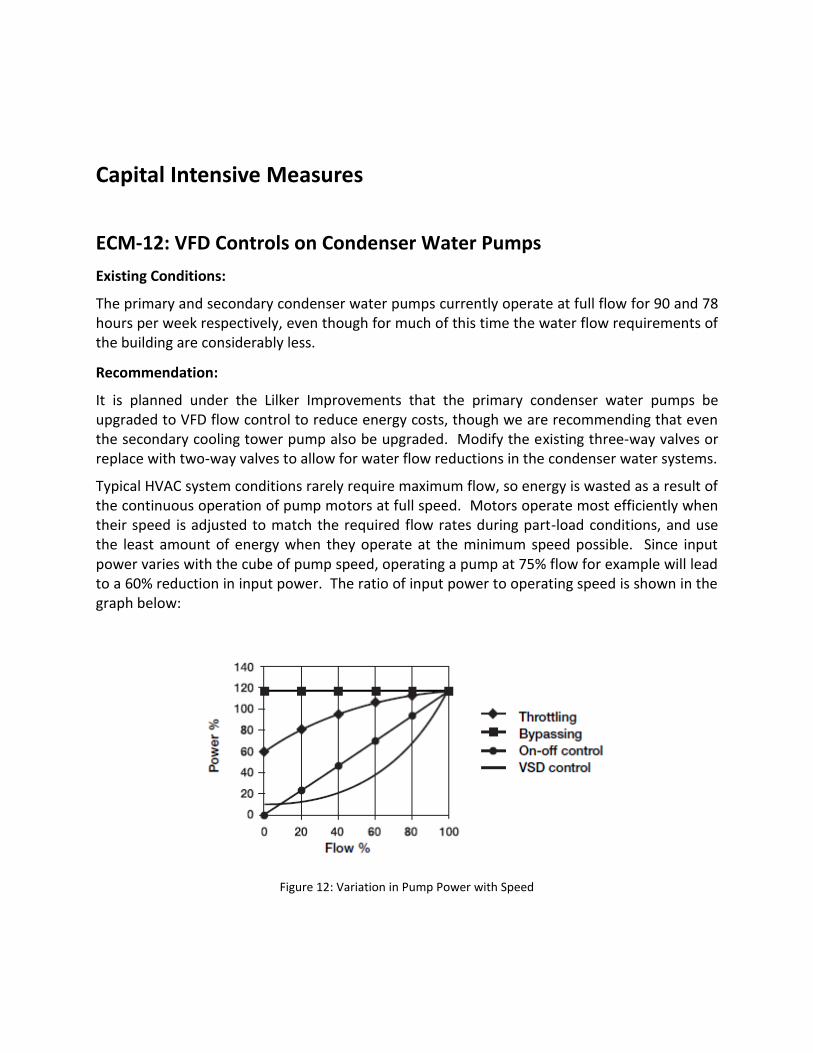
Capital Intensive Measures
ECM-12: VFD Controls on Condenser Water Pumps
Existing Conditions:
The primary and secondary condenser water pumps currently operate at full flow for 90 and 78 hours per week respectively, even though for much of this time the water flow requirements of the building are considerably less.
Recommendation:
It is planned under the Lilker Improvements that the primary condenser water pumps be upgraded to VFD flow control to reduce energy costs, though we are recommending that even the secondary cooling tower pump also be upgraded. Modify the existing three-way valves or replace with two-way valves to allow for water flow reductions in the condenser water systems.
Typical HVAC system conditions rarely require maximum flow, so energy is wasted as a result of the continuous operation of pump motors at full speed. Motors operate most efficiently when their speed is adjusted to match the required flow rates during part-load conditions, and use the least amount of energy when they operate at the minimum speed possible. Since input power varies with the cube of pump speed, operating a pump at 75% flow for example will lead to a 60% reduction in input power. The ratio of input power to operating speed is shown in the graph below:
Figure 12: Variation in Pump Power with Speed
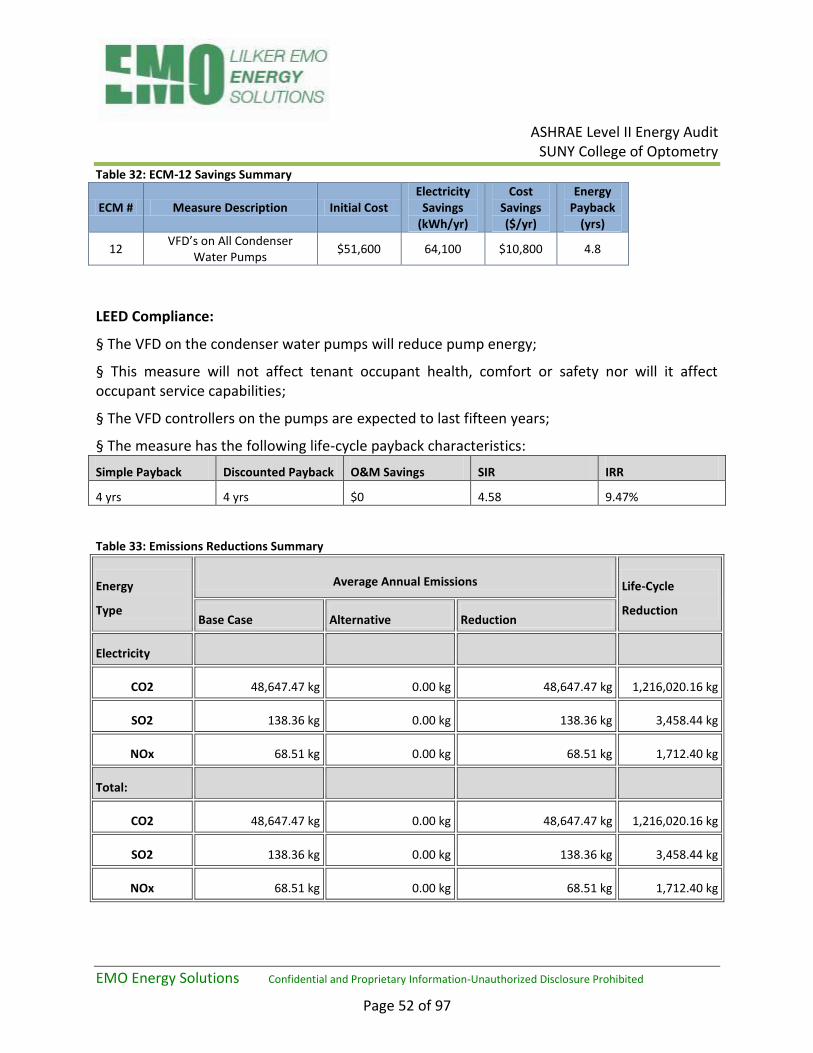
ASHRAE Level II Energy Audit
SUNY College of Optometry
EMO Energy Solutions Confidential and Proprietary Information-Unauthorized Disclosure Prohibited
Page 52 of 97
Table 32: ECM-12 Savings Summary
ECM # Measure Description Initial Cost Electricity
Savings (kWh/yr)
Cost Savings ($/yr)
Energy Payback
(yrs)
12 VFD’s on All Condenser
Water Pumps $51,600 64,100 $10,800 4.8
LEED Compliance:
§ The VFD on the condenser water pumps will reduce pump energy;
§ This measure will not affect tenant occupant health, comfort or safety nor will it affect occupant service capabilities;
§ The VFD controllers on the pumps are expected to last fifteen years;
§ The measure has the following life-cycle payback characteristics:
Simple Payback Discounted Payback O&M Savings SIR IRR
4 yrs 4 yrs $0 4.58 9.47%
Table 33: Emissions Reductions Summary
Energy
Type
Average Annual Emissions Life-Cycle
Reduction Base Case Alternative Reduction
Electricity
CO2 48,647.47 kg 0.00 kg 48,647.47 kg 1,216,020.16 kg
SO2 138.36 kg 0.00 kg 138.36 kg 3,458.44 kg
NOx 68.51 kg 0.00 kg 68.51 kg 1,712.40 kg
Total:
CO2 48,647.47 kg 0.00 kg 48,647.47 kg 1,216,020.16 kg
SO2 138.36 kg 0.00 kg 138.36 kg 3,458.44 kg
NOx 68.51 kg 0.00 kg 68.51 kg 1,712.40 kg
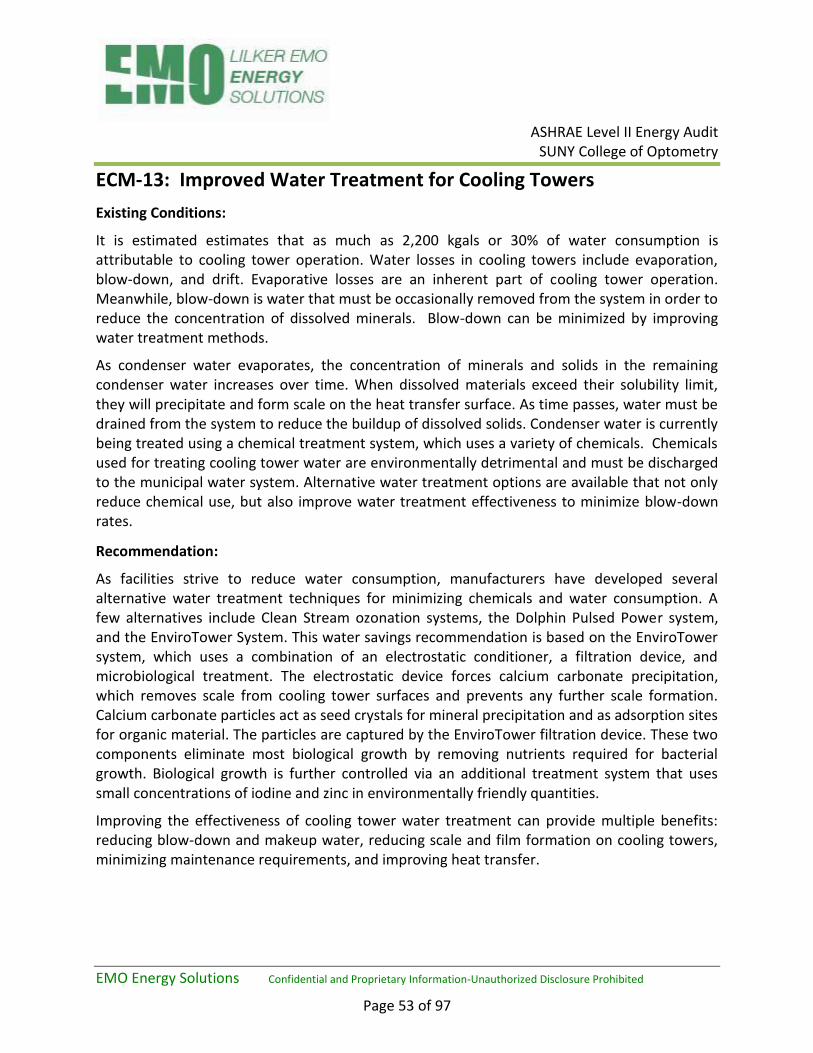
ASHRAE Level II Energy Audit
SUNY College of Optometry
EMO Energy Solutions Confidential and Proprietary Information-Unauthorized Disclosure Prohibited
Page 53 of 97
ECM-13: Improved Water Treatment for Cooling Towers
Existing Conditions:
It is estimated estimates that as much as 2,200 kgals or 30% of water consumption is attributable to cooling tower operation. Water losses in cooling towers include evaporation, blow-down, and drift. Evaporative losses are an inherent part of cooling tower operation. Meanwhile, blow-down is water that must be occasionally removed from the system in order to reduce the concentration of dissolved minerals. Blow-down can be minimized by improving water treatment methods.
As condenser water evaporates, the concentration of minerals and solids in the remaining condenser water increases over time. When dissolved materials exceed their solubility limit, they will precipitate and form scale on the heat transfer surface. As time passes, water must be drained from the system to reduce the buildup of dissolved solids. Condenser water is currently being treated using a chemical treatment system, which uses a variety of chemicals. Chemicals used for treating cooling tower water are environmentally detrimental and must be discharged to the municipal water system. Alternative water treatment options are available that not only reduce chemical use, but also improve water treatment effectiveness to minimize blow-down rates.
Recommendation:
As facilities strive to reduce water consumption, manufacturers have developed several alternative water treatment techniques for minimizing chemicals and water consumption. A few alternatives include Clean Stream ozonation systems, the Dolphin Pulsed Power system, and the EnviroTower System. This water savings recommendation is based on the EnviroTower system, which uses a combination of an electrostatic conditioner, a filtration device, and microbiological treatment. The electrostatic device forces calcium carbonate precipitation, which removes scale from cooling tower surfaces and prevents any further scale formation. Calcium carbonate particles act as seed crystals for mineral precipitation and as adsorption sites for organic material. The particles are captured by the EnviroTower filtration device. These two components eliminate most biological growth by removing nutrients required for bacterial growth. Biological growth is further controlled via an additional treatment system that uses small concentrations of iodine and zinc in environmentally friendly quantities.
Improving the effectiveness of cooling tower water treatment can provide multiple benefits: reducing blow-down and makeup water, reducing scale and film formation on cooling towers, minimizing maintenance requirements, and improving heat transfer.
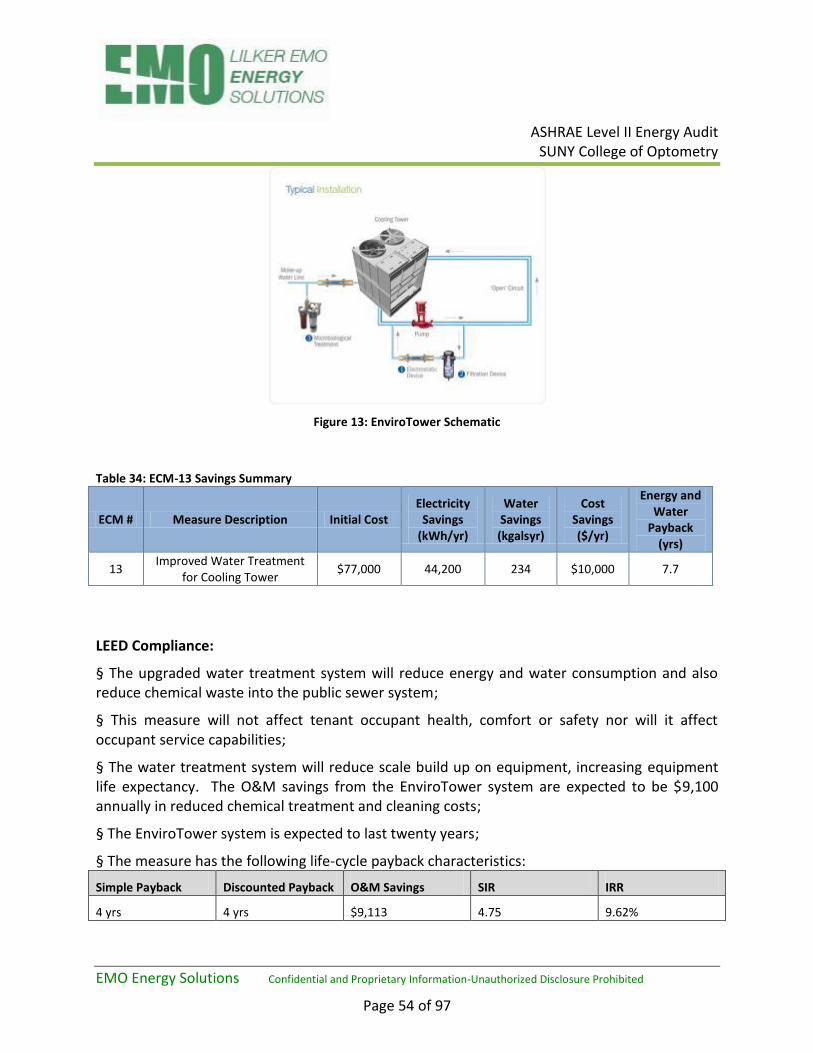
ASHRAE Level II Energy Audit
SUNY College of Optometry
EMO Energy Solutions Confidential and Proprietary Information-Unauthorized Disclosure Prohibited
Page 54 of 97
Figure 13: EnviroTower Schematic
Table 34: ECM-13 Savings Summary
ECM # Measure Description Initial Cost Electricity
Savings (kWh/yr)
Water Savings (kgalsyr)
Cost Savings ($/yr)
Energy and Water
Payback (yrs)
13 Improved Water Treatment
for Cooling Tower $77,000 44,200 234 $10,000 7.7
LEED Compliance:
§ The upgraded water treatment system will reduce energy and water consumption and also reduce chemical waste into the public sewer system;
§ This measure will not affect tenant occupant health, comfort or safety nor will it affect occupant service capabilities;
§ The water treatment system will reduce scale build up on equipment, increasing equipment life expectancy. The O&M savings from the EnviroTower system are expected to be $9,100 annually in reduced chemical treatment and cleaning costs;
§ The EnviroTower system is expected to last twenty years;
§ The measure has the following life-cycle payback characteristics:
Simple Payback Discounted Payback O&M Savings SIR IRR
4 yrs 4 yrs $9,113 4.75 9.62%

ASHRAE Level II Energy Audit
SUNY College of Optometry
EMO Energy Solutions Confidential and Proprietary Information-Unauthorized Disclosure Prohibited
Page 55 of 97
Table 35: Emissions Reductions Summary
Energy
Type
Average Annual Emissions Life-Cycle
Reduction Base Case Alternative Reduction
Electricity
CO2 33,559.56 kg 0.00 kg 33,559.56 kg 838,874.16 kg
SO2 95.45 kg 0.00 kg 95.45 kg 2,385.82 kg
NOx 47.26 kg 0.00 kg 47.26 kg 1,181.31 kg
Total:
CO2 33,559.56 kg 0.00 kg 33,559.56 kg 838,874.16 kg
SO2 95.45 kg 0.00 kg 95.45 kg 2,385.82 kg
NOx 47.26 kg 0.00 kg 47.26 kg 1,181.31 kg
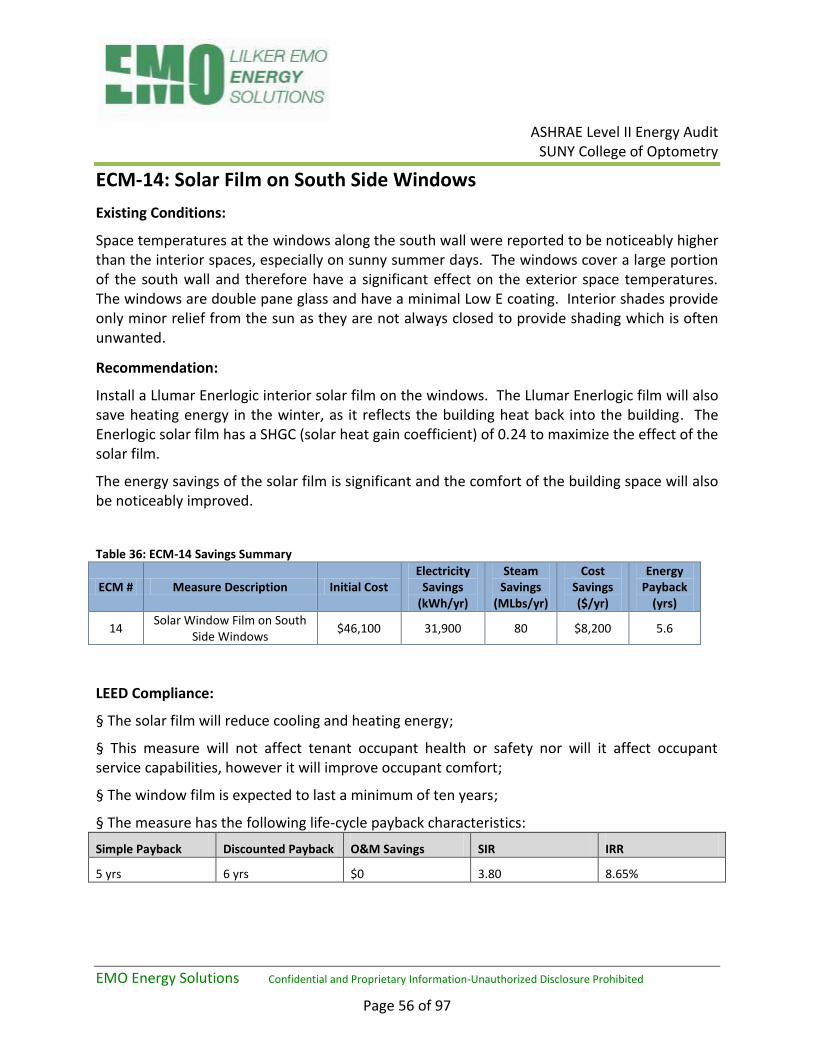
ASHRAE Level II Energy Audit
SUNY College of Optometry
EMO Energy Solutions Confidential and Proprietary Information-Unauthorized Disclosure Prohibited
Page 56 of 97
ECM-14: Solar Film on South Side Windows
Existing Conditions:
Space temperatures at the windows along the south wall were reported to be noticeably higher than the interior spaces, especially on sunny summer days. The windows cover a large portion of the south wall and therefore have a significant effect on the exterior space temperatures. The windows are double pane glass and have a minimal Low E coating. Interior shades provide only minor relief from the sun as they are not always closed to provide shading which is often unwanted.
Recommendation:
Install a Llumar Enerlogic interior solar film on the windows. The Llumar Enerlogic film will also save heating energy in the winter, as it reflects the building heat back into the building. The Enerlogic solar film has a SHGC (solar heat gain coefficient) of 0.24 to maximize the effect of the solar film.
The energy savings of the solar film is significant and the comfort of the building space will also be noticeably improved.
Table 36: ECM-14 Savings Summary
ECM # Measure Description Initial Cost Electricity
Savings (kWh/yr)
Steam Savings
(MLbs/yr)
Cost Savings ($/yr)
Energy Payback
(yrs)
14 Solar Window Film on South
Side Windows $46,100 31,900 80 $8,200 5.6
LEED Compliance:
§ The solar film will reduce cooling and heating energy;
§ This measure will not affect tenant occupant health or safety nor will it affect occupant service capabilities, however it will improve occupant comfort;
§ The window film is expected to last a minimum of ten years;
§ The measure has the following life-cycle payback characteristics:
Simple Payback Discounted Payback O&M Savings SIR IRR
5 yrs 6 yrs $0 3.80 8.65%

ASHRAE Level II Energy Audit
SUNY College of Optometry
EMO Energy Solutions Confidential and Proprietary Information-Unauthorized Disclosure Prohibited
Page 57 of 97
Table 37: Emissions Reductions Summary
Energy
Type
Average Annual Emissions Life-Cycle
Reduction Base Case Alternative Reduction
Electricity
CO2 40,663.68 kg 0.00 kg 40,663.68 kg 1,016,452.73 kg
SO2 115.65 kg 0.00 kg 115.65 kg 2,890.86 kg
NOx 57.26 kg 0.00 kg 57.26 kg 1,431.37 kg
Total:
CO2 40,663.68 kg 0.00 kg 40,663.68 kg 1,016,452.73 kg
SO2 115.65 kg 0.00 kg 115.65 kg 2,890.86 kg
NOx 57.26 kg 0.00 kg 57.26 kg 1,431.37 kg
ASHRAE Level II Energy Audit
SUNY College of Optometry
EMO Energy Solutions Confidential and Proprietary Information-Unauthorized Disclosure Prohibited
Page 58 of 97
ECM-15: Retro-Commissioning Building
Existing Conditions:
Over time, building operations shift away from the original design intent. The audit team noted multiple instances where building control systems required improvement. Below is a sample list of noted issues:
Unoccupied temperature settings for perimeter heating have not been programmed and it was noticed on the EMS that space temperatures actually increased at night.
The first floor entrances to the building experience high levels of infiltration owing to a negative pressure on the first floor level.
Building exhaust systems were not shut down or reduced during partially occupied periods. Outside ventilation air is very expensive to cool, dehumidify, heat and reheat, and therefore should be reduced to off or minimum levels when the buildings are unoccupied.
Space temperatures are not consistently the same and some temperature readings were believed to be in error because of miscalibration.
Specialty rooms like elevator machine rooms which required constant cooling had fans running to maintain spaces at lower temperatures (70 to 74 degrees Fahrenheit) than required.
The building currently has excessive simultaneous heating and cooling to maintain temperature set points.
Recommendation:
Building performance typically declines over time as equipment ages, building usage changes, or as maintenance personnel make “quick fixes” in response to comfort complaints. Retro-commissioning is the practice of commissioning existing buildings — testing and adjusting the building systems to meet the original design intent and/or optimize the systems to satisfy current operational needs. Retro-commissioning relies on building and equipment documentation, along with functional testing to optimize performance.
The savings from retro-commissioning vary depending on the extent of commissioning performed and on the number of building performance problems identified. A 2004 study sponsored by the US Department of Energy evaluated the results of retro-commissioning 100 existing buildings across the United States, and found that typical energy cost savings were around 15%. Initial costs were usually around $0.27 per square foot, and median payback periods were around 1 year (0.7 years if non-energy savings are included). In current dollars, costs would be about $0.37 per square foot. EMO is using a cost of $0.50 per square foot to account for equipment upgrades associated with building retro-commissioning.
We recommend that a qualified commissioning authority is hired to retro-commission the building systems. The retro-commissioning process should:
ASHRAE Level II Energy Audit
SUNY College of Optometry
EMO Energy Solutions Confidential and Proprietary Information-Unauthorized Disclosure Prohibited
Page 59 of 97
Re-enable existing capabilities Verify that existing system capabilities are being employed. Re-enable any controls that have been overridden (e.g. economizer control and variable speed drives on air handling units). Re-enable automatic controls for set-points, weekends, and holidays. Verify that overrides are released.
Verify equipment performance Review performance mechanical equipment including cooling towers, air handling units, and terminal units. Equipment should be operated in the most efficient combination of part load performance, economizer cycles, and fan control. Identify issues with simultaneous heating and cooling, broken valves, malfunctioning or stuck dampers, and malfunctioning variable speed drives.
Balance and adjust air and water distribution systems Ensure that all sections of the building operate at a positive pressure, 100% of the time, to avoid the costs and complaints caused by infiltration and high humidity. The building may also require rebalancing of both air and water distribution due to drift and changing building/workspace mission and/or tenant requirements.
Calibrate sensors Ensure that zone temperature sensors, AHU discharge temperature sensors, water temperature sensors, static pressure sensors, outside air sensors, and humidistats are properly calibrated.
Adjust temperature settings, reset, and setback temperatures Facility managers adjust settings from time to time in order maintain comfort control or to compensate for inadequate system operation or faulty sensors. These should be reset once sensors have been recalibrated and other underlying issues have been resolved. Ordinary temperature set points of 70 F heating and 75 F cooling, with setback temperatures of 60 F heating should be maintained consistently through the facilities. Mechanical and electrical rooms can be maintained at 60 F heating and 80 F cooling.
Modify control strategies for standard hours of operation Most motors, pumps, fans, and air handlers operate on an extended schedule even though not required by either the building tenants or the building operating plan. All occupancy schedules should be reviewed for consistency with the building mission.
Savings from retro-commissioning are difficult to quantify in advance. Based on the study of 240 buildings performed by Mills et. al, typical savings average about 15 percent.
Retro-commissioning should be done in two phases for this project. The first phase should be to go through the building and determine the current status. Any pieces of equipment needing to be replaced should be identified. Any overrides to current systems should be noted and
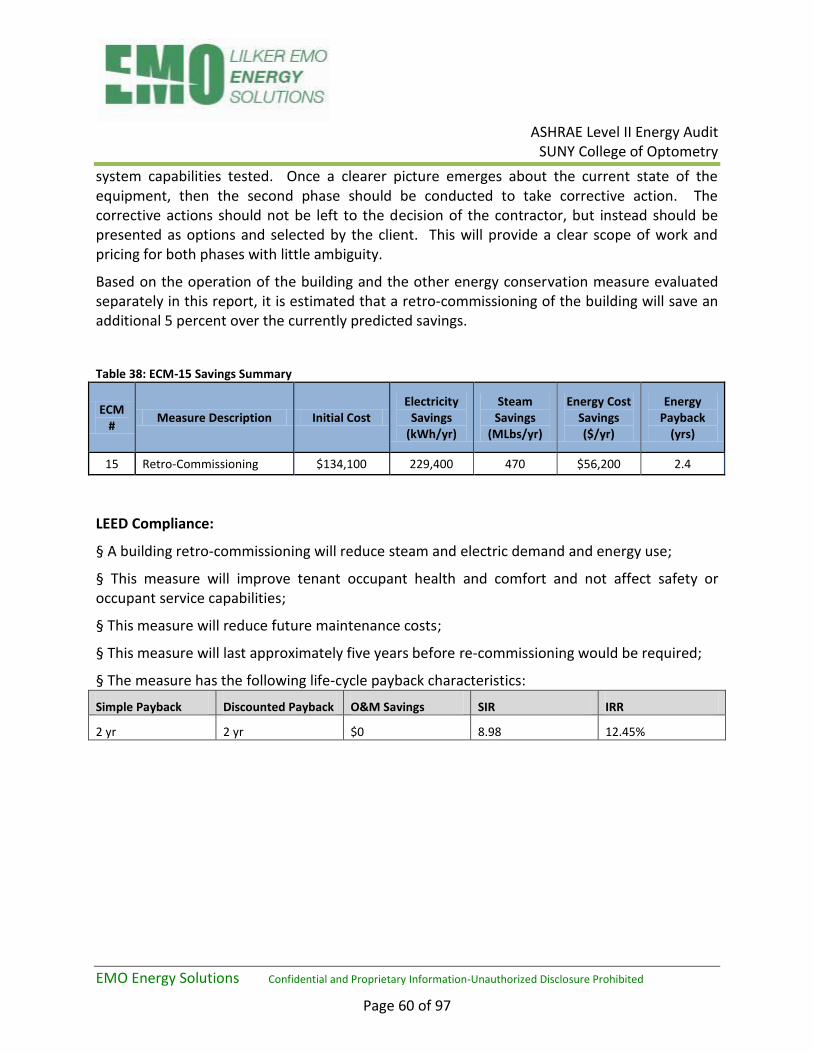
ASHRAE Level II Energy Audit
SUNY College of Optometry
EMO Energy Solutions Confidential and Proprietary Information-Unauthorized Disclosure Prohibited
Page 60 of 97
system capabilities tested. Once a clearer picture emerges about the current state of the equipment, then the second phase should be conducted to take corrective action. The corrective actions should not be left to the decision of the contractor, but instead should be presented as options and selected by the client. This will provide a clear scope of work and pricing for both phases with little ambiguity.
Based on the operation of the building and the other energy conservation measure evaluated separately in this report, it is estimated that a retro-commissioning of the building will save an additional 5 percent over the currently predicted savings.
Table 38: ECM-15 Savings Summary
ECM #
Measure Description Initial Cost Electricity
Savings (kWh/yr)
Steam Savings
(MLbs/yr)
Energy Cost Savings ($/yr)
Energy Payback
(yrs)
15 Retro-Commissioning $134,100 229,400 470 $56,200 2.4
LEED Compliance:
§ A building retro-commissioning will reduce steam and electric demand and energy use;
§ This measure will improve tenant occupant health and comfort and not affect safety or occupant service capabilities;
§ This measure will reduce future maintenance costs;
§ This measure will last approximately five years before re-commissioning would be required;
§ The measure has the following life-cycle payback characteristics:
Simple Payback Discounted Payback O&M Savings SIR IRR
2 yr 2 yr $0 8.98 12.45%

ASHRAE Level II Energy Audit
SUNY College of Optometry
EMO Energy Solutions Confidential and Proprietary Information-Unauthorized Disclosure Prohibited
Page 61 of 97
Table 39: Emissions Reductions Summary
Energy
Type
Average Annual Emissions Life-Cycle
Reduction Base Case Alternative Reduction
Electricity
CO2 276,337.83 kg 0.00 kg 276,337.83 kg 6,907,500.10 kg
SO2 785.92 kg 0.00 kg 785.92 kg 19,645.40 kg
NOx 389.14 kg 0.00 kg 389.14 kg 9,727.17 kg
Total:
CO2 276,337.83 kg 0.00 kg 276,337.83 kg 6,907,500.10 kg
SO2 785.92 kg 0.00 kg 785.92 kg 19,645.40 kg
NOx 389.14 kg 0.00 kg 389.14 kg 9,727.17 kg
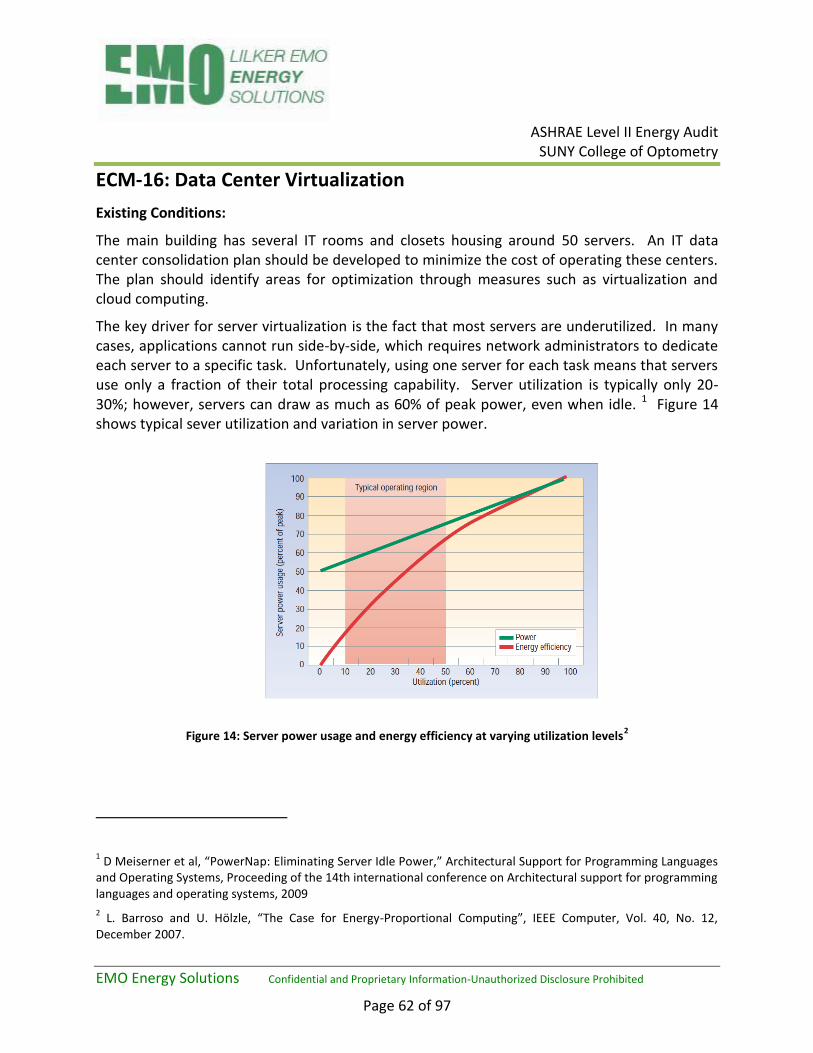
ASHRAE Level II Energy Audit
SUNY College of Optometry
EMO Energy Solutions Confidential and Proprietary Information-Unauthorized Disclosure Prohibited
Page 62 of 97
ECM-16: Data Center Virtualization
Existing Conditions:
The main building has several IT rooms and closets housing around 50 servers. An IT data center consolidation plan should be developed to minimize the cost of operating these centers. The plan should identify areas for optimization through measures such as virtualization and cloud computing.
The key driver for server virtualization is the fact that most servers are underutilized. In many cases, applications cannot run side-by-side, which requires network administrators to dedicate each server to a specific task. Unfortunately, using one server for each task means that servers use only a fraction of their total processing capability. Server utilization is typically only 20-30%; however, servers can draw as much as 60% of peak power, even when idle. 1 Figure 14 shows typical sever utilization and variation in server power.
Figure 14: Server power usage and energy efficiency at varying utilization levels2
1 D Meiserner et al, “PowerNap: Eliminating Server Idle Power,” Architectural Support for Programming Languages
and Operating Systems, Proceeding of the 14th international conference on Architectural support for programming languages and operating systems, 2009
2 L. Barroso and U. Hölzle, “The Case for Energy-Proportional Computing”, IEEE Computer, Vol. 40, No. 12,
December 2007.
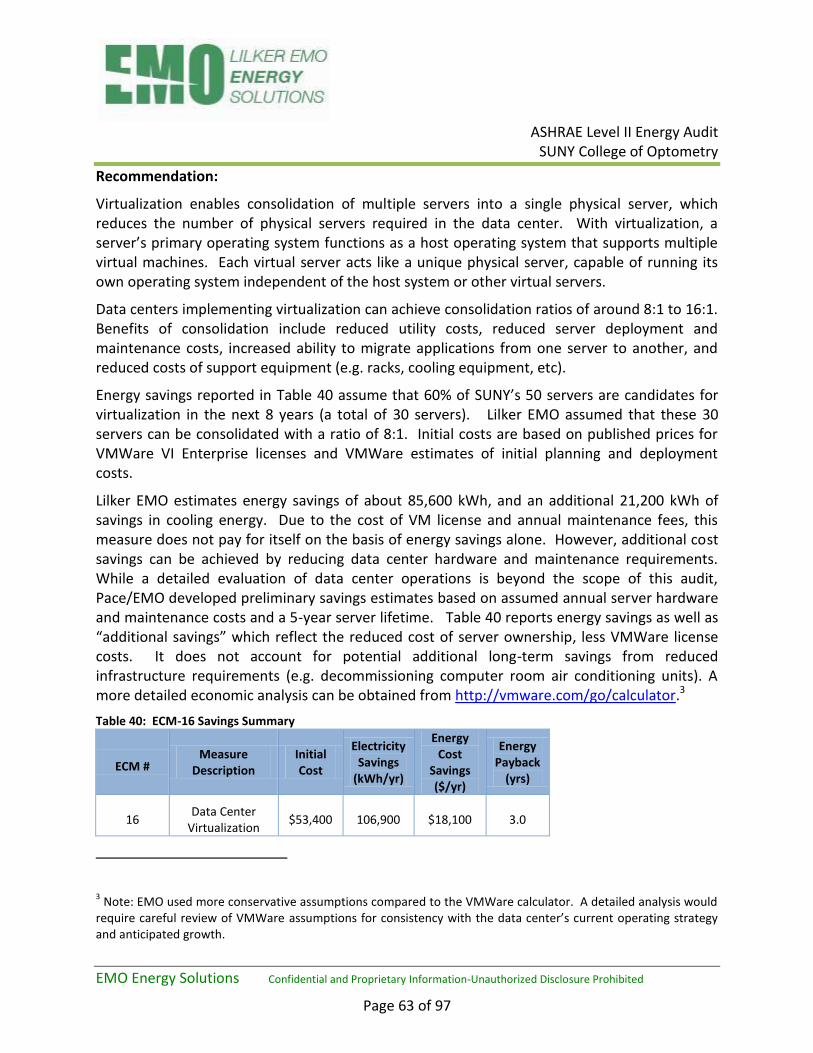
ASHRAE Level II Energy Audit
SUNY College of Optometry
EMO Energy Solutions Confidential and Proprietary Information-Unauthorized Disclosure Prohibited
Page 63 of 97
Recommendation:
Virtualization enables consolidation of multiple servers into a single physical server, which reduces the number of physical servers required in the data center. With virtualization, a server’s primary operating system functions as a host operating system that supports multiple virtual machines. Each virtual server acts like a unique physical server, capable of running its own operating system independent of the host system or other virtual servers.
Data centers implementing virtualization can achieve consolidation ratios of around 8:1 to 16:1. Benefits of consolidation include reduced utility costs, reduced server deployment and maintenance costs, increased ability to migrate applications from one server to another, and reduced costs of support equipment (e.g. racks, cooling equipment, etc).
Energy savings reported in Table 40 assume that 60% of SUNY’s 50 servers are candidates for virtualization in the next 8 years (a total of 30 servers). Lilker EMO assumed that these 30 servers can be consolidated with a ratio of 8:1. Initial costs are based on published prices for VMWare VI Enterprise licenses and VMWare estimates of initial planning and deployment costs.
Lilker EMO estimates energy savings of about 85,600 kWh, and an additional 21,200 kWh of savings in cooling energy. Due to the cost of VM license and annual maintenance fees, this measure does not pay for itself on the basis of energy savings alone. However, additional cost savings can be achieved by reducing data center hardware and maintenance requirements. While a detailed evaluation of data center operations is beyond the scope of this audit, Pace/EMO developed preliminary savings estimates based on assumed annual server hardware and maintenance costs and a 5-year server lifetime. Table 40 reports energy savings as well as “additional savings” which reflect the reduced cost of server ownership, less VMWare license costs. It does not account for potential additional long-term savings from reduced infrastructure requirements (e.g. decommissioning computer room air conditioning units). A more detailed economic analysis can be obtained from http://vmware.com/go/calculator.3
Table 40: ECM-16 Savings Summary
ECM # Measure
Description Initial Cost
Electricity Savings
(kWh/yr)
Energy Cost
Savings ($/yr)
Energy Payback
(yrs)
16 Data Center
Virtualization $53,400 106,900 $18,100 3.0
3 Note: EMO used more conservative assumptions compared to the VMWare calculator. A detailed analysis would
require careful review of VMWare assumptions for consistency with the data center’s current operating strategy and anticipated growth.
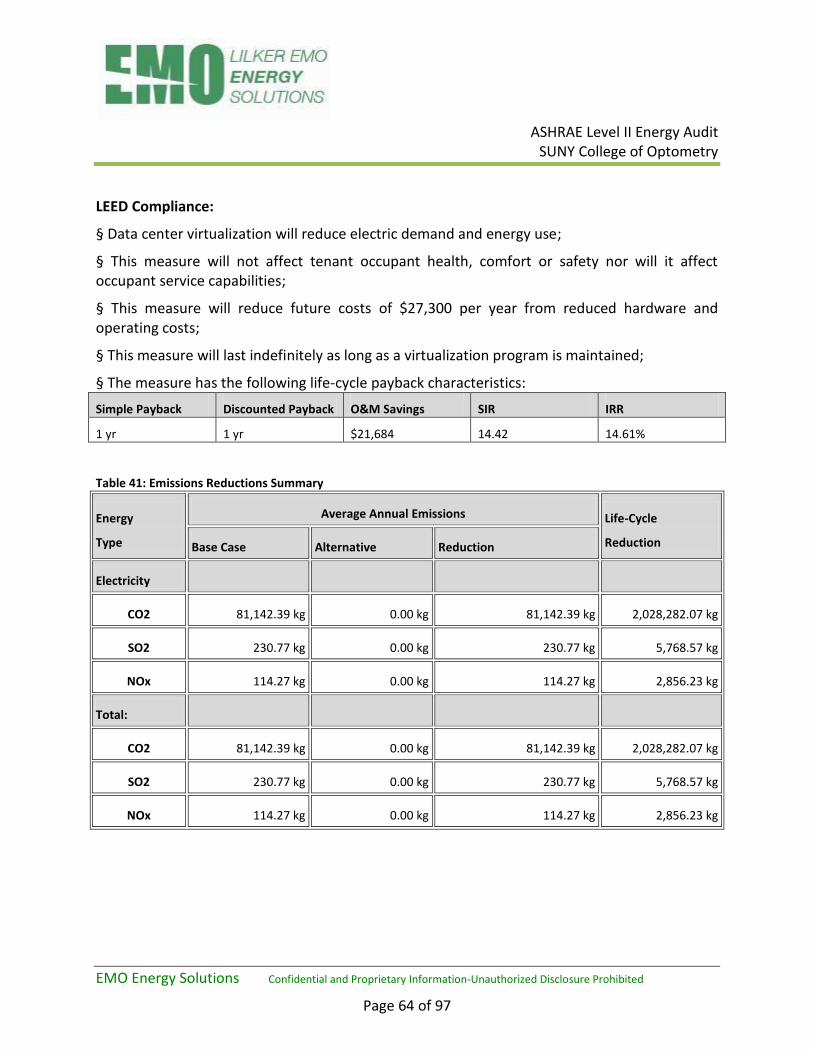
ASHRAE Level II Energy Audit
SUNY College of Optometry
EMO Energy Solutions Confidential and Proprietary Information-Unauthorized Disclosure Prohibited
Page 64 of 97
LEED Compliance:
§ Data center virtualization will reduce electric demand and energy use;
§ This measure will not affect tenant occupant health, comfort or safety nor will it affect occupant service capabilities;
§ This measure will reduce future costs of $27,300 per year from reduced hardware and operating costs;
§ This measure will last indefinitely as long as a virtualization program is maintained;
§ The measure has the following life-cycle payback characteristics:
Simple Payback Discounted Payback O&M Savings SIR IRR
1 yr 1 yr $21,684 14.42 14.61%
Table 41: Emissions Reductions Summary
Energy
Type
Average Annual Emissions Life-Cycle
Reduction Base Case Alternative Reduction
Electricity
CO2 81,142.39 kg 0.00 kg 81,142.39 kg 2,028,282.07 kg
SO2 230.77 kg 0.00 kg 230.77 kg 5,768.57 kg
NOx 114.27 kg 0.00 kg 114.27 kg 2,856.23 kg
Total:
CO2 81,142.39 kg 0.00 kg 81,142.39 kg 2,028,282.07 kg
SO2 230.77 kg 0.00 kg 230.77 kg 5,768.57 kg
NOx 114.27 kg 0.00 kg 114.27 kg 2,856.23 kg
ASHRAE Level II Energy Audit
SUNY College of Optometry
EMO Energy Solutions Confidential and Proprietary Information-Unauthorized Disclosure Prohibited
Page 65 of 97
ECM-17: Optimize Data Center Power and Utilization Management
Existing Conditions:
One challenge in managing data centers is that it is difficult to keep track what each server is
doing, and whether or not it is performing useful work. It is estimated that about 15% of
servers in data centers are not doing useful work, but remain plugged in.4,5 A great way to save
energy is to simply turn off unused servers. In many cases, administrators may evaluate server
usage based on CPU utilization, however the challenge is gauging whether or not server
utilization is productive. For example a SQL Server doing SQL processing is performing useful
work; however a server doing routine anti-virus scanning may appear to be working even
though it is not actually serving end users.
Recommendation:
Tools such as NightWatchman® Server Edition performs a “useful work” analysis that identifies
which servers are being productive, and which are simply wasting energy. Figure 15 below
shows a sample graphical output for a well-utilized server, while Figure 16 shows a sample
underutilized server. In this case, after continued monitoring, data center administrators can
identify which servers are actually needed, and which servers can be decommissioned or
redeployed. It can also help eliminate unnecessary servers prior to any efforts for server
virtualization, thereby minimizing virtualization costs. Finally, the software also monitors server
utilization over time and identifies periods of the day that servers are not doing work (Figure
17). During these periods, the server can be put into a “drowsy” mode that reduces server
energy by around 12%.
4 Kenneth Brill, “To Trim Data Center Energy costs, Disconnect Unused Servers”
5 Server Energy and Efficiency Report, Study by Kelton Research Group, commissioned by Alliance to Save Energy
and 1E

ASHRAE Level II Energy Audit
SUNY College of Optometry
EMO Energy Solutions Confidential and Proprietary Information-Unauthorized Disclosure Prohibited
Page 66 of 97
Figure 15: Graphical Representation of Server Work (Well-utilized server)
Figure 16: Graphical Representation of Server Work (Unproductive Server)
Figure 17: Graphical Representation of Server Work (Periods of Useful and Unproductive Work)
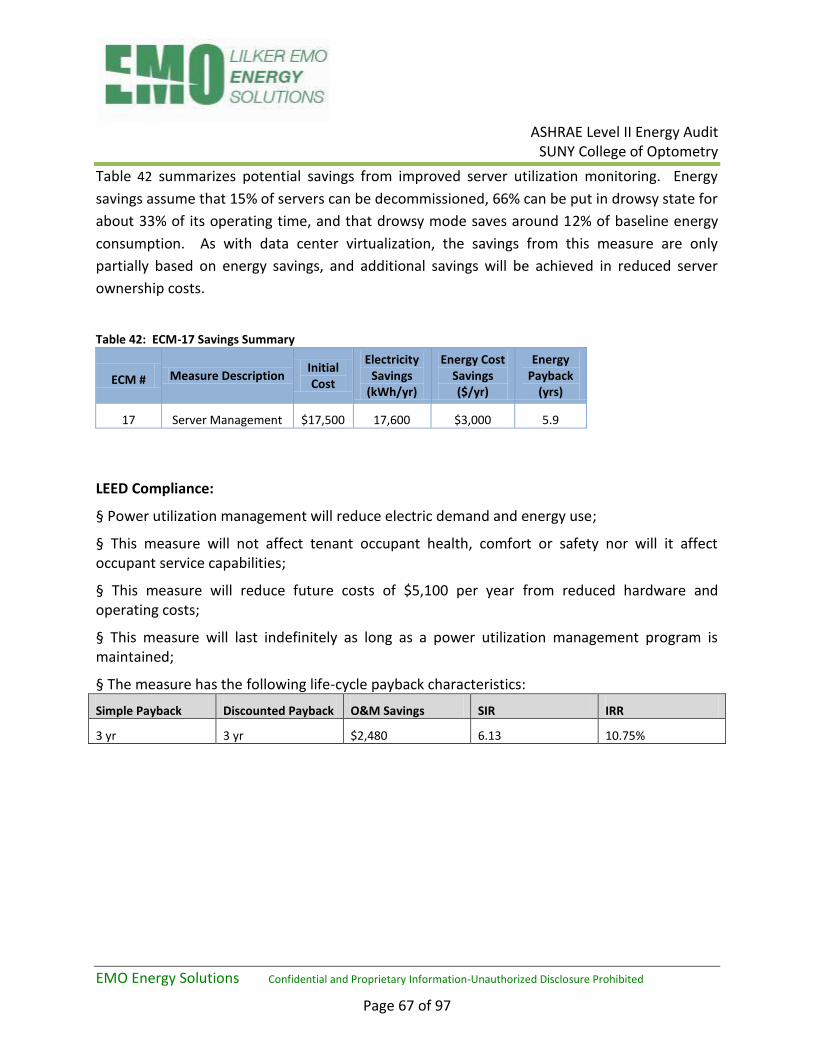
ASHRAE Level II Energy Audit
SUNY College of Optometry
EMO Energy Solutions Confidential and Proprietary Information-Unauthorized Disclosure Prohibited
Page 67 of 97
Table 42 summarizes potential savings from improved server utilization monitoring. Energy
savings assume that 15% of servers can be decommissioned, 66% can be put in drowsy state for
about 33% of its operating time, and that drowsy mode saves around 12% of baseline energy
consumption. As with data center virtualization, the savings from this measure are only
partially based on energy savings, and additional savings will be achieved in reduced server
ownership costs.
Table 42: ECM-17 Savings Summary
ECM # Measure Description Initial Cost
Electricity Savings
(kWh/yr)
Energy Cost Savings ($/yr)
Energy Payback
(yrs)
17 Server Management $17,500 17,600 $3,000 5.9
LEED Compliance:
§ Power utilization management will reduce electric demand and energy use;
§ This measure will not affect tenant occupant health, comfort or safety nor will it affect occupant service capabilities;
§ This measure will reduce future costs of $5,100 per year from reduced hardware and operating costs;
§ This measure will last indefinitely as long as a power utilization management program is maintained;
§ The measure has the following life-cycle payback characteristics:
Simple Payback Discounted Payback O&M Savings SIR IRR
3 yr 3 yr $2,480 6.13 10.75%
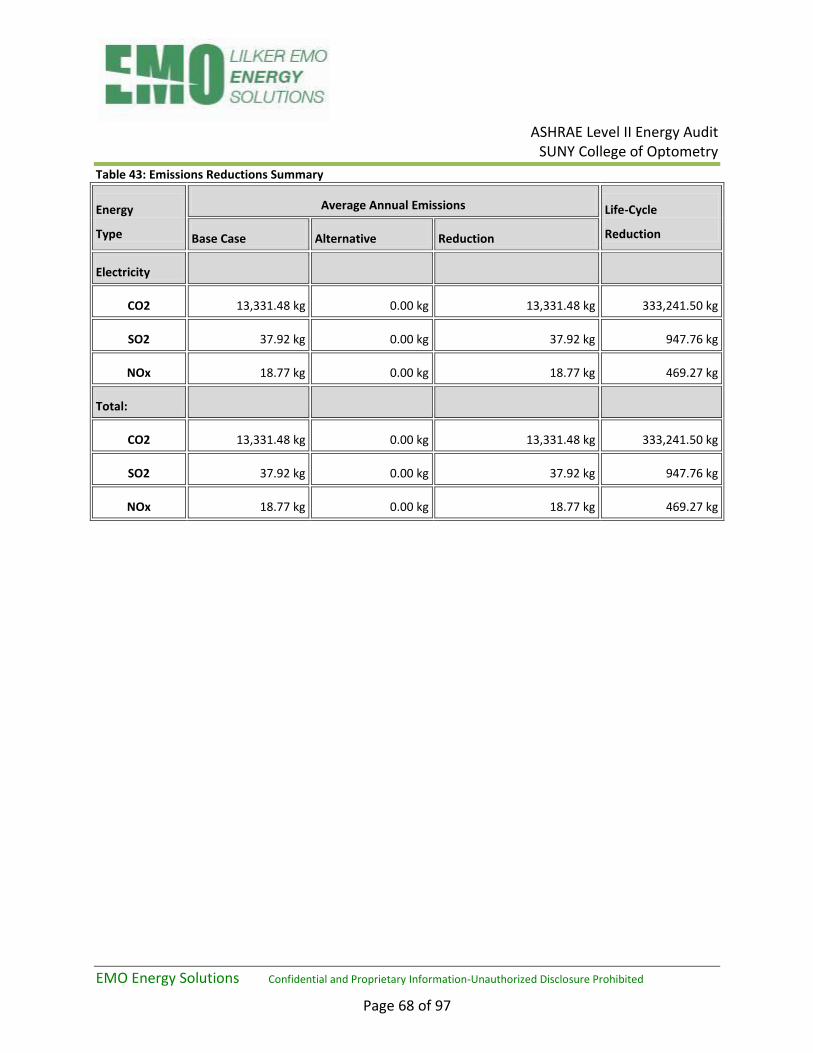
ASHRAE Level II Energy Audit
SUNY College of Optometry
EMO Energy Solutions Confidential and Proprietary Information-Unauthorized Disclosure Prohibited
Page 68 of 97
Table 43: Emissions Reductions Summary
Energy
Type
Average Annual Emissions Life-Cycle
Reduction Base Case Alternative Reduction
Electricity
CO2 13,331.48 kg 0.00 kg 13,331.48 kg 333,241.50 kg
SO2 37.92 kg 0.00 kg 37.92 kg 947.76 kg
NOx 18.77 kg 0.00 kg 18.77 kg 469.27 kg
Total:
CO2 13,331.48 kg 0.00 kg 13,331.48 kg 333,241.50 kg
SO2 37.92 kg 0.00 kg 37.92 kg 947.76 kg
NOx 18.77 kg 0.00 kg 18.77 kg 469.27 kg
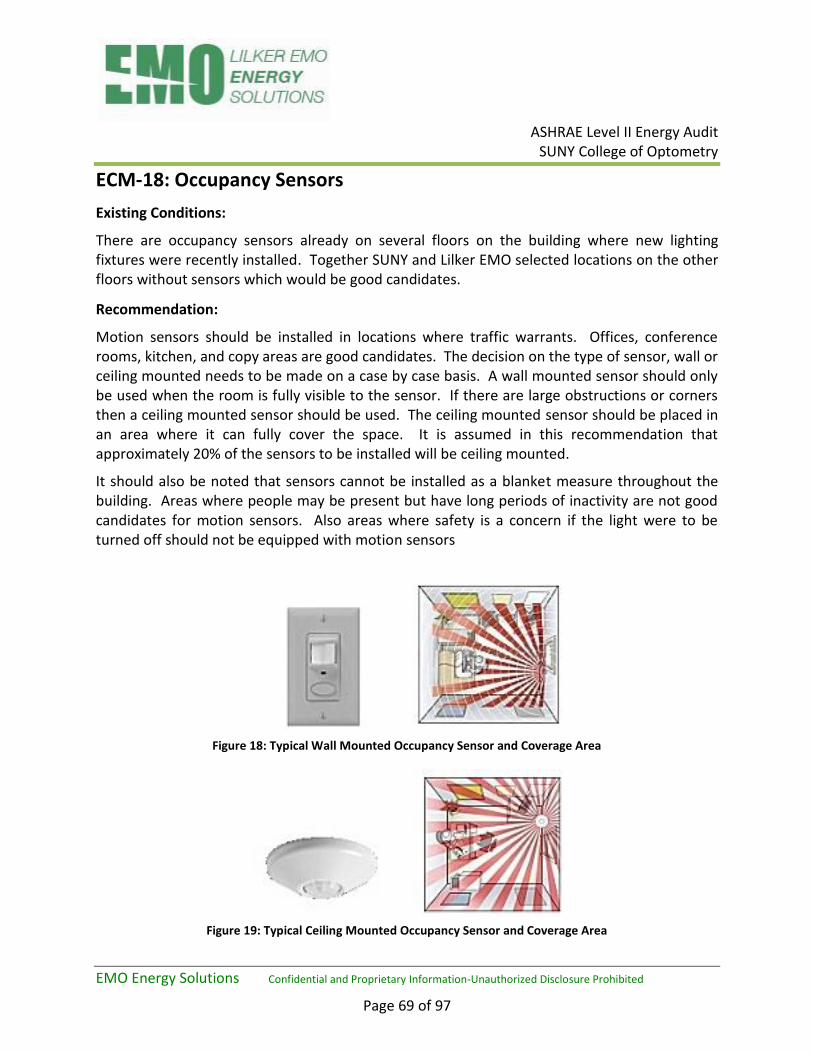
ASHRAE Level II Energy Audit
SUNY College of Optometry
EMO Energy Solutions Confidential and Proprietary Information-Unauthorized Disclosure Prohibited
Page 69 of 97
ECM-18: Occupancy Sensors
Existing Conditions:
There are occupancy sensors already on several floors on the building where new lighting fixtures were recently installed. Together SUNY and Lilker EMO selected locations on the other floors without sensors which would be good candidates.
Recommendation:
Motion sensors should be installed in locations where traffic warrants. Offices, conference rooms, kitchen, and copy areas are good candidates. The decision on the type of sensor, wall or ceiling mounted needs to be made on a case by case basis. A wall mounted sensor should only be used when the room is fully visible to the sensor. If there are large obstructions or corners then a ceiling mounted sensor should be used. The ceiling mounted sensor should be placed in an area where it can fully cover the space. It is assumed in this recommendation that approximately 20% of the sensors to be installed will be ceiling mounted.
It should also be noted that sensors cannot be installed as a blanket measure throughout the building. Areas where people may be present but have long periods of inactivity are not good candidates for motion sensors. Also areas where safety is a concern if the light were to be turned off should not be equipped with motion sensors
Figure 18: Typical Wall Mounted Occupancy Sensor and Coverage Area
Figure 19: Typical Ceiling Mounted Occupancy Sensor and Coverage Area

ASHRAE Level II Energy Audit
SUNY College of Optometry
EMO Energy Solutions Confidential and Proprietary Information-Unauthorized Disclosure Prohibited
Page 70 of 97
Table 44: ECM-18 Savings Summary
ECM #
Measure Description Initial Cost Electricity
Savings (kWh/yr)
Cost Savings ($/yr)
Energy Payback
(yrs)
18 Occupancy Sensors $26,500 24,100 $4,100 6.5
LEED Compliance:
§ Installing occupancy sensors will reduce energy use, cooling loads and electric demand, but increase heating loads;
§ This measure will not affect tenant occupant health, comfort or safety nor will it affect occupant service capabilities;
§ This measure will also reduce short term maintenance replacement costs;
§ This measure will last approximately 15 years;
§ The measure has the following life-cycle payback characteristics:
Simple Payback Discounted Payback O&M Savings SIR IRR
4 yrs 4 yrs $2,482 4.97 9.83%
Table 45: Emissions Reductions Summary
Energy
Type
-----Average Annual
Reduction Base Case Alternative Reduction
Electricity
CO2 18,282.57 kg 0.00 kg 18,282.57 kg 457,001.72 kg
SO2 52.00 kg 0.00 kg 52.00 kg 1,299.74 kg
NOx 25.75 kg 0.00 kg 25.75 kg 643.55 kg
Total:
CO2 18,282.57 kg 0.00 kg 18,282.57 kg 457,001.72 kg
SO2 52.00 kg 0.00 kg 52.00 kg 1,299.74 kg
NOx 25.75 kg 0.00 kg 25.75 kg 643.55 kg
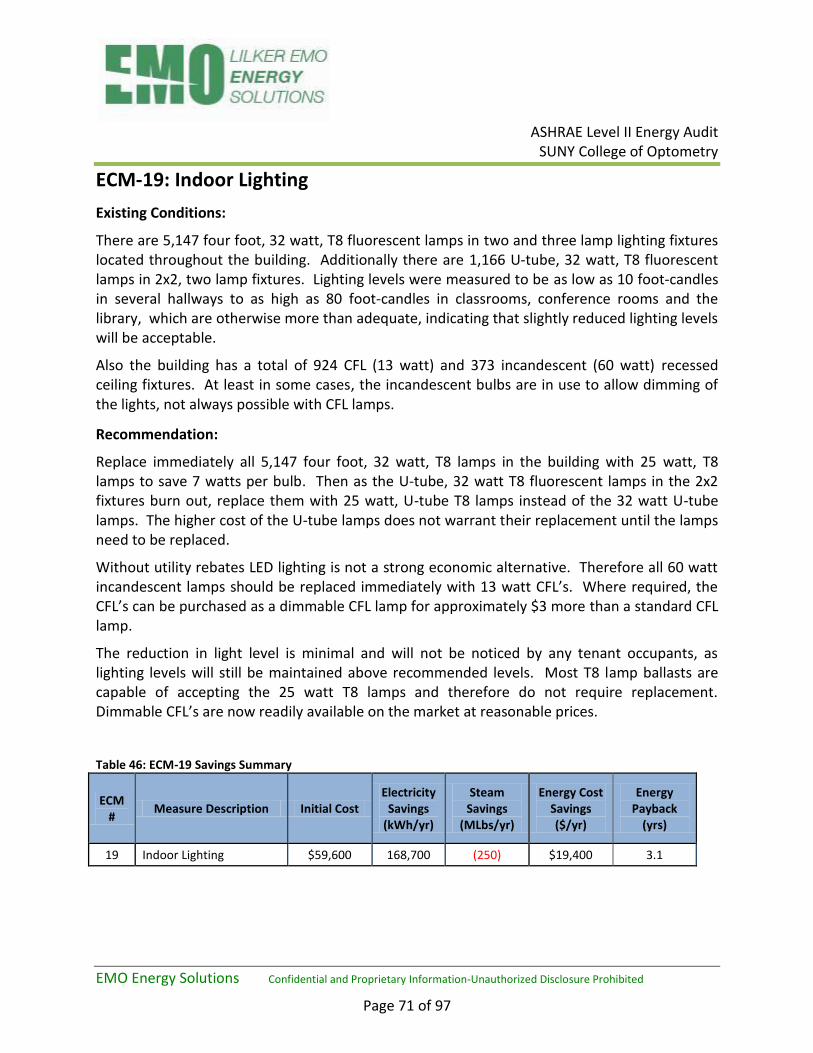
ASHRAE Level II Energy Audit
SUNY College of Optometry
EMO Energy Solutions Confidential and Proprietary Information-Unauthorized Disclosure Prohibited
Page 71 of 97
ECM-19: Indoor Lighting
Existing Conditions:
There are 5,147 four foot, 32 watt, T8 fluorescent lamps in two and three lamp lighting fixtures located throughout the building. Additionally there are 1,166 U-tube, 32 watt, T8 fluorescent lamps in 2x2, two lamp fixtures. Lighting levels were measured to be as low as 10 foot-candles in several hallways to as high as 80 foot-candles in classrooms, conference rooms and the library, which are otherwise more than adequate, indicating that slightly reduced lighting levels will be acceptable.
Also the building has a total of 924 CFL (13 watt) and 373 incandescent (60 watt) recessed ceiling fixtures. At least in some cases, the incandescent bulbs are in use to allow dimming of the lights, not always possible with CFL lamps.
Recommendation:
Replace immediately all 5,147 four foot, 32 watt, T8 lamps in the building with 25 watt, T8 lamps to save 7 watts per bulb. Then as the U-tube, 32 watt T8 fluorescent lamps in the 2x2 fixtures burn out, replace them with 25 watt, U-tube T8 lamps instead of the 32 watt U-tube lamps. The higher cost of the U-tube lamps does not warrant their replacement until the lamps need to be replaced.
Without utility rebates LED lighting is not a strong economic alternative. Therefore all 60 watt incandescent lamps should be replaced immediately with 13 watt CFL’s. Where required, the CFL’s can be purchased as a dimmable CFL lamp for approximately $3 more than a standard CFL lamp.
The reduction in light level is minimal and will not be noticed by any tenant occupants, as lighting levels will still be maintained above recommended levels. Most T8 lamp ballasts are capable of accepting the 25 watt T8 lamps and therefore do not require replacement. Dimmable CFL’s are now readily available on the market at reasonable prices.
Table 46: ECM-19 Savings Summary
ECM #
Measure Description Initial Cost Electricity
Savings (kWh/yr)
Steam Savings
(MLbs/yr)
Energy Cost Savings ($/yr)
Energy Payback
(yrs)
19 Indoor Lighting $59,600 168,700 (250) $19,400 3.1
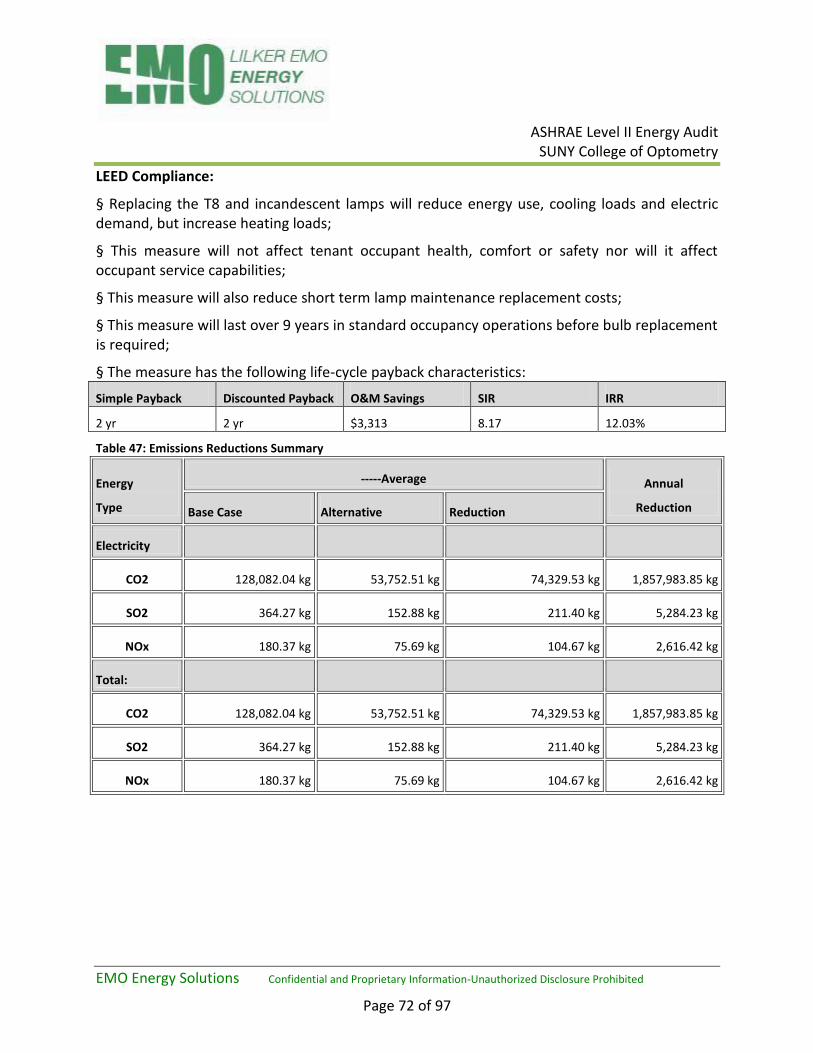
ASHRAE Level II Energy Audit
SUNY College of Optometry
EMO Energy Solutions Confidential and Proprietary Information-Unauthorized Disclosure Prohibited
Page 72 of 97
LEED Compliance:
§ Replacing the T8 and incandescent lamps will reduce energy use, cooling loads and electric demand, but increase heating loads;
§ This measure will not affect tenant occupant health, comfort or safety nor will it affect occupant service capabilities;
§ This measure will also reduce short term lamp maintenance replacement costs;
§ This measure will last over 9 years in standard occupancy operations before bulb replacement is required;
§ The measure has the following life-cycle payback characteristics:
Simple Payback Discounted Payback O&M Savings SIR IRR
2 yr 2 yr $3,313 8.17 12.03%
Table 47: Emissions Reductions Summary
Energy
Type
-----Average Annual
Reduction Base Case Alternative Reduction
Electricity
CO2 128,082.04 kg 53,752.51 kg 74,329.53 kg 1,857,983.85 kg
SO2 364.27 kg 152.88 kg 211.40 kg 5,284.23 kg
NOx 180.37 kg 75.69 kg 104.67 kg 2,616.42 kg
Total:
CO2 128,082.04 kg 53,752.51 kg 74,329.53 kg 1,857,983.85 kg
SO2 364.27 kg 152.88 kg 211.40 kg 5,284.23 kg
NOx 180.37 kg 75.69 kg 104.67 kg 2,616.42 kg
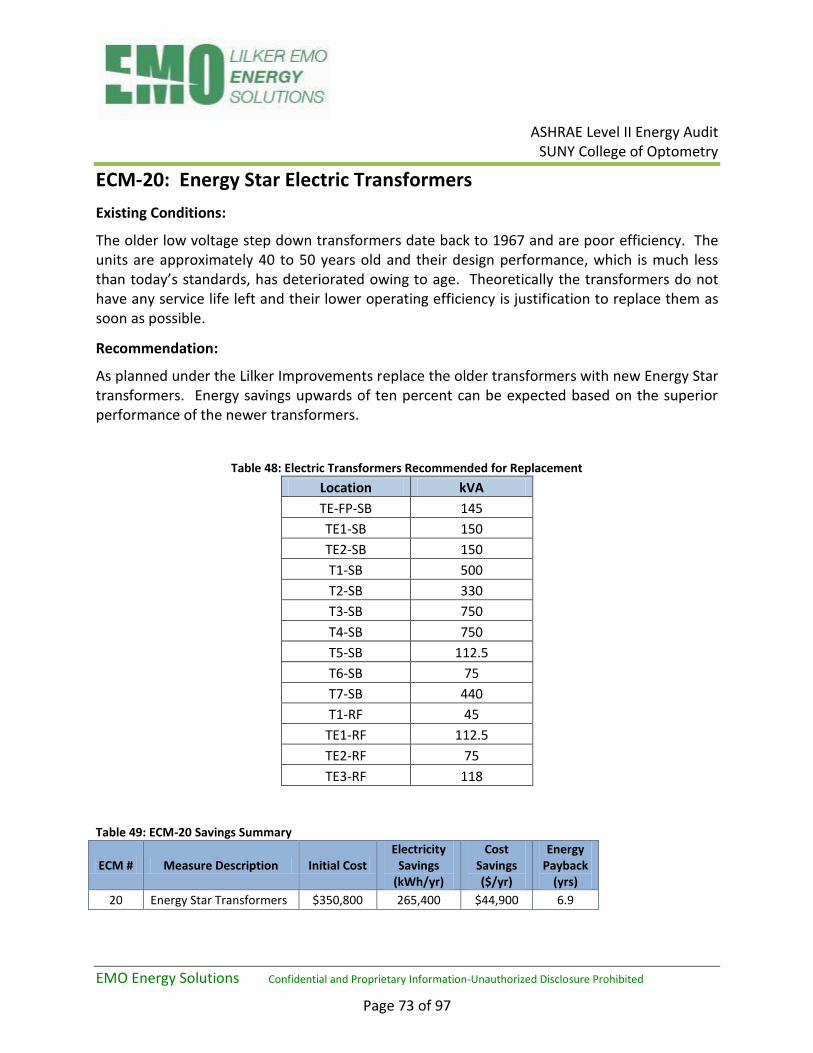
ASHRAE Level II Energy Audit
SUNY College of Optometry
EMO Energy Solutions Confidential and Proprietary Information-Unauthorized Disclosure Prohibited
Page 73 of 97
ECM-20: Energy Star Electric Transformers
Existing Conditions:
The older low voltage step down transformers date back to 1967 and are poor efficiency. The units are approximately 40 to 50 years old and their design performance, which is much less than today’s standards, has deteriorated owing to age. Theoretically the transformers do not have any service life left and their lower operating efficiency is justification to replace them as soon as possible.
Recommendation:
As planned under the Lilker Improvements replace the older transformers with new Energy Star transformers. Energy savings upwards of ten percent can be expected based on the superior performance of the newer transformers.
Table 48: Electric Transformers Recommended for Replacement
Location kVA
TE-FP-SB 145
TE1-SB 150
TE2-SB 150
T1-SB 500
T2-SB 330
T3-SB 750
T4-SB 750
T5-SB 112.5
T6-SB 75
T7-SB 440
T1-RF 45
TE1-RF 112.5
TE2-RF 75
TE3-RF 118
Table 49: ECM-20 Savings Summary
ECM # Measure Description Initial Cost Electricity
Savings (kWh/yr)
Cost Savings ($/yr)
Energy Payback
(yrs)
20 Energy Star Transformers $350,800 265,400 $44,900 6.9
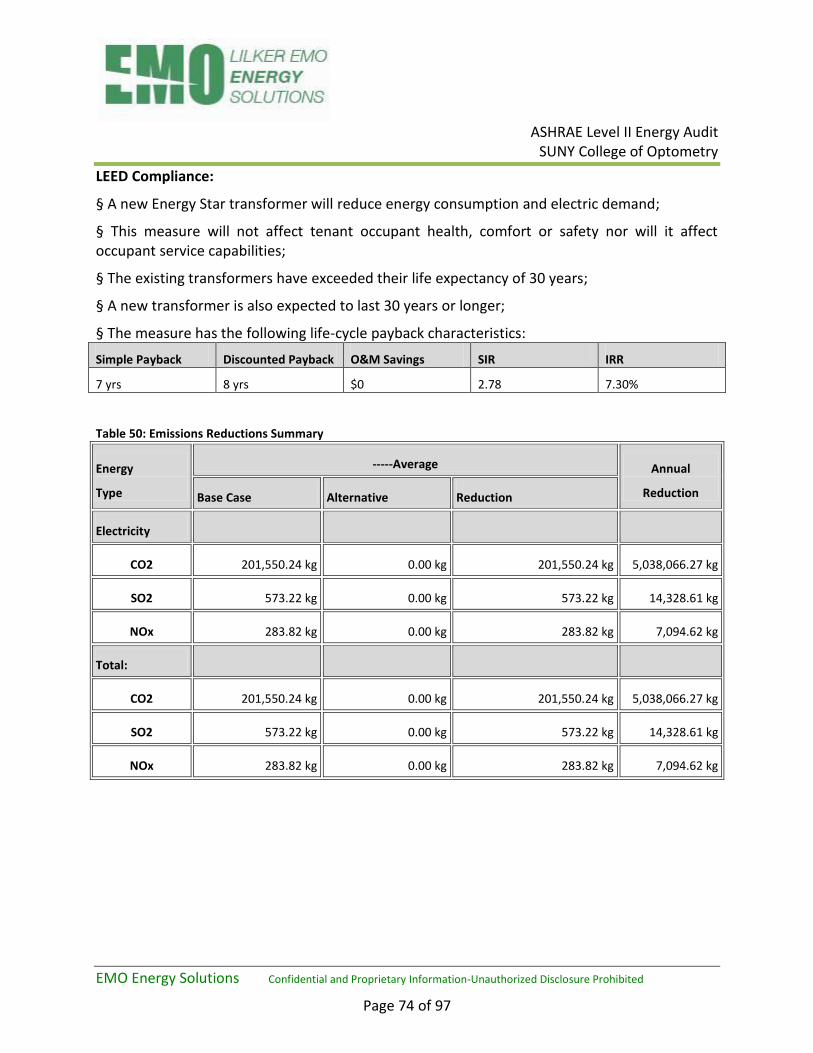
ASHRAE Level II Energy Audit
SUNY College of Optometry
EMO Energy Solutions Confidential and Proprietary Information-Unauthorized Disclosure Prohibited
Page 74 of 97
LEED Compliance:
§ A new Energy Star transformer will reduce energy consumption and electric demand;
§ This measure will not affect tenant occupant health, comfort or safety nor will it affect occupant service capabilities;
§ The existing transformers have exceeded their life expectancy of 30 years;
§ A new transformer is also expected to last 30 years or longer;
§ The measure has the following life-cycle payback characteristics:
Simple Payback Discounted Payback O&M Savings SIR IRR
7 yrs 8 yrs $0 2.78 7.30%
Table 50: Emissions Reductions Summary
Energy
Type
-----Average Annual
Reduction Base Case Alternative Reduction
Electricity
CO2 201,550.24 kg 0.00 kg 201,550.24 kg 5,038,066.27 kg
SO2 573.22 kg 0.00 kg 573.22 kg 14,328.61 kg
NOx 283.82 kg 0.00 kg 283.82 kg 7,094.62 kg
Total:
CO2 201,550.24 kg 0.00 kg 201,550.24 kg 5,038,066.27 kg
SO2 573.22 kg 0.00 kg 573.22 kg 14,328.61 kg
NOx 283.82 kg 0.00 kg 283.82 kg 7,094.62 kg

ASHRAE Level II Energy Audit
SUNY College of Optometry
EMO Energy Solutions Confidential and Proprietary Information-Unauthorized Disclosure Prohibited
Page 75 of 97
ECM-21: Replace Self Contained Units
Existing Conditions:
Fourteen older Trane self-contained units totaling 523 tons are scheduled for possible replacement under the Lilker Phase II Improvements with brand new, higher efficiency Mammoth SCU’s. The older Trane units have a combined average design efficiencies of 10.91 EER while the newer Mammoth units will have an average efficiency of 13.93 EER. The Trane units have VAV fan control with inlet guide vanes and the Mammoth units with higher efficiency VFD’s. Additionally the older units do not have water side economizer free cooling coils while the new units include free cooling. Finally when installing the new SCU’s the outside air dampers will be modified to allow for 100 percent air side economizing as outdoor temperature conditions permit.
Recommendation:
The replacement Mammoth units will save energy based on SCU efficiency (EER) improvements, water and air side economizer improvements and VFD fan speed control. Although these savings will not offset the total costs of the newer units, they do allow for significant amounts of increased energy savings.
Table 51: ECM-21 Savings Summary
ECM # Measure Description Initial Cost Electricity
Savings (kWh/yr)
Cost Savings ($/yr)
Energy Payback
(yrs)
21 Replace Self Contained Units $4,358,200 688,200 $116,400 37.4
LEED Compliance:
§ New self contained units will reduce electric demand and energy use;
§ Equipment operation and maintenance costs will be reduced dramatically in the near term future;
§ This measure will not affect tenant occupant health, comfort or safety nor will it affect occupant service capabilities;
§ New SCU’s are expected to last twenty years or longer;
§ The measure has the following life-cycle payback characteristics:
Simple Payback Discounted Payback O&M Savings SIR IRR
n/a n/a $0 0.58 0.76%
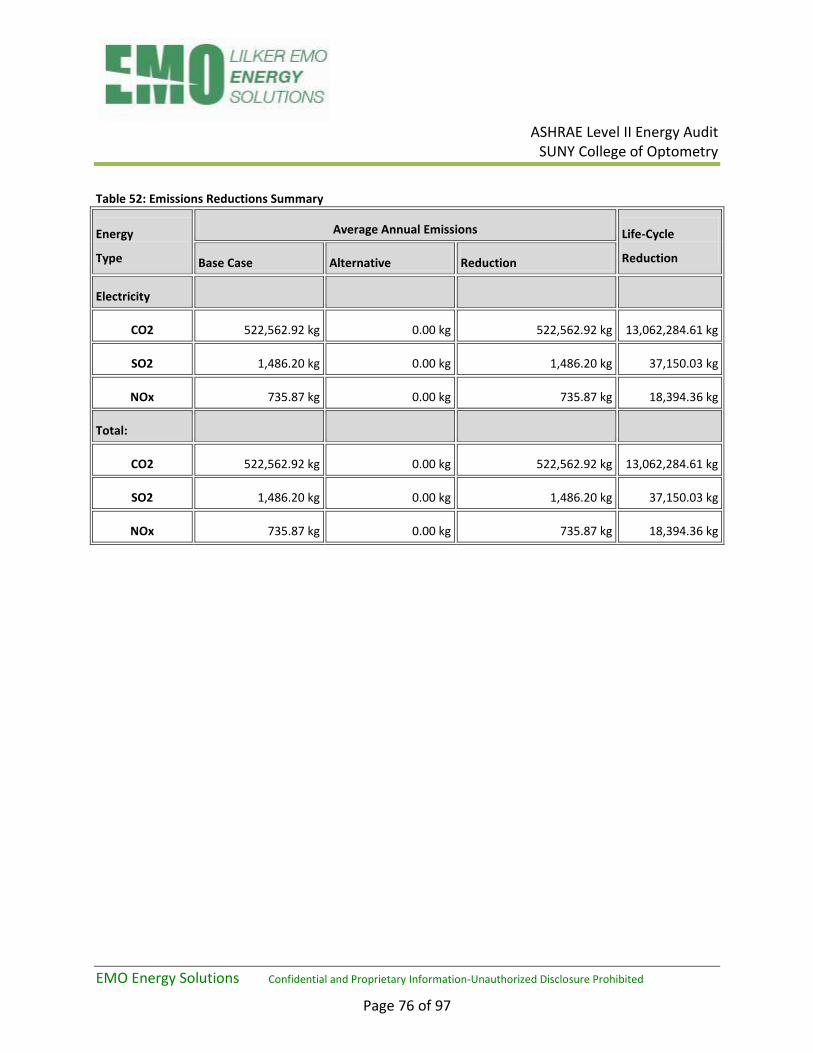
ASHRAE Level II Energy Audit
SUNY College of Optometry
EMO Energy Solutions Confidential and Proprietary Information-Unauthorized Disclosure Prohibited
Page 76 of 97
Table 52: Emissions Reductions Summary
Energy
Type
Average Annual Emissions Life-Cycle
Reduction Base Case Alternative Reduction
Electricity
CO2 522,562.92 kg 0.00 kg 522,562.92 kg 13,062,284.61 kg
SO2 1,486.20 kg 0.00 kg 1,486.20 kg 37,150.03 kg
NOx 735.87 kg 0.00 kg 735.87 kg 18,394.36 kg
Total:
CO2 522,562.92 kg 0.00 kg 522,562.92 kg 13,062,284.61 kg
SO2 1,486.20 kg 0.00 kg 1,486.20 kg 37,150.03 kg
NOx 735.87 kg 0.00 kg 735.87 kg 18,394.36 kg
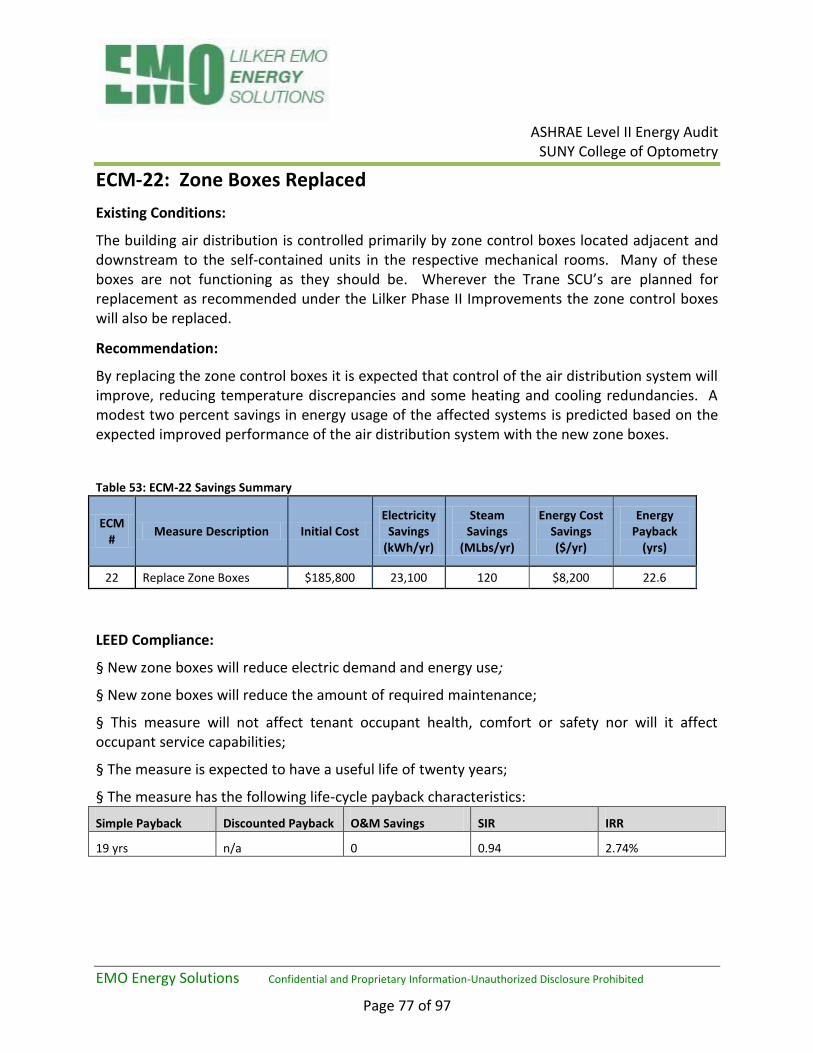
ASHRAE Level II Energy Audit
SUNY College of Optometry
EMO Energy Solutions Confidential and Proprietary Information-Unauthorized Disclosure Prohibited
Page 77 of 97
ECM-22: Zone Boxes Replaced
Existing Conditions:
The building air distribution is controlled primarily by zone control boxes located adjacent and downstream to the self-contained units in the respective mechanical rooms. Many of these boxes are not functioning as they should be. Wherever the Trane SCU’s are planned for replacement as recommended under the Lilker Phase II Improvements the zone control boxes will also be replaced.
Recommendation:
By replacing the zone control boxes it is expected that control of the air distribution system will improve, reducing temperature discrepancies and some heating and cooling redundancies. A modest two percent savings in energy usage of the affected systems is predicted based on the expected improved performance of the air distribution system with the new zone boxes.
Table 53: ECM-22 Savings Summary
ECM #
Measure Description Initial Cost Electricity
Savings (kWh/yr)
Steam Savings
(MLbs/yr)
Energy Cost Savings ($/yr)
Energy Payback
(yrs)
22 Replace Zone Boxes $185,800 23,100 120 $8,200 22.6
LEED Compliance:
§ New zone boxes will reduce electric demand and energy use;
§ New zone boxes will reduce the amount of required maintenance;
§ This measure will not affect tenant occupant health, comfort or safety nor will it affect occupant service capabilities;
§ The measure is expected to have a useful life of twenty years;
§ The measure has the following life-cycle payback characteristics:
Simple Payback Discounted Payback O&M Savings SIR IRR
19 yrs n/a 0 0.94 2.74%

ASHRAE Level II Energy Audit
SUNY College of Optometry
EMO Energy Solutions Confidential and Proprietary Information-Unauthorized Disclosure Prohibited
Page 78 of 97
Table 54: Emissions Reductions Summary
Energy
Type
Average Annual Emissions Life-Cycle
Reduction Base Case Alternative Reduction
Electricity
CO2 42,828.24 kg 0.00 kg 42,828.24 kg 1,070,559.54 kg
SO2 121.81 kg 0.00 kg 121.81 kg 3,044.74 kg
NOx 60.31 kg 0.00 kg 60.31 kg 1,507.57 kg
Total:
CO2 42,828.24 kg 0.00 kg 42,828.24 kg 1,070,559.54 kg
SO2 121.81 kg 0.00 kg 121.81 kg 3,044.74 kg
NOx 60.31 kg 0.00 kg 60.31 kg 1,507.57 kg
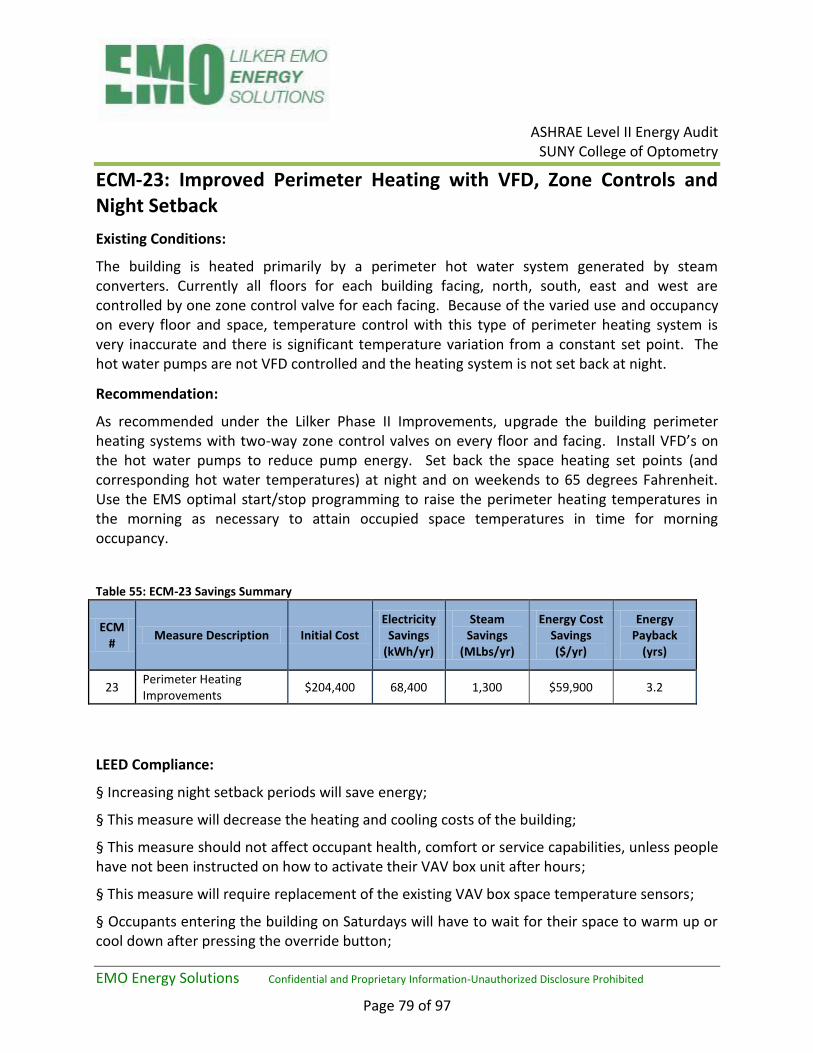
ASHRAE Level II Energy Audit
SUNY College of Optometry
EMO Energy Solutions Confidential and Proprietary Information-Unauthorized Disclosure Prohibited
Page 79 of 97
ECM-23: Improved Perimeter Heating with VFD, Zone Controls and Night Setback
Existing Conditions:
The building is heated primarily by a perimeter hot water system generated by steam converters. Currently all floors for each building facing, north, south, east and west are controlled by one zone control valve for each facing. Because of the varied use and occupancy on every floor and space, temperature control with this type of perimeter heating system is very inaccurate and there is significant temperature variation from a constant set point. The hot water pumps are not VFD controlled and the heating system is not set back at night.
Recommendation:
As recommended under the Lilker Phase II Improvements, upgrade the building perimeter heating systems with two-way zone control valves on every floor and facing. Install VFD’s on the hot water pumps to reduce pump energy. Set back the space heating set points (and corresponding hot water temperatures) at night and on weekends to 65 degrees Fahrenheit. Use the EMS optimal start/stop programming to raise the perimeter heating temperatures in the morning as necessary to attain occupied space temperatures in time for morning occupancy.
Table 55: ECM-23 Savings Summary
ECM #
Measure Description Initial Cost Electricity
Savings (kWh/yr)
Steam Savings
(MLbs/yr)
Energy Cost Savings ($/yr)
Energy Payback
(yrs)
23 Perimeter Heating Improvements
$204,400 68,400 1,300 $59,900 3.2
LEED Compliance:
§ Increasing night setback periods will save energy;
§ This measure will decrease the heating and cooling costs of the building;
§ This measure should not affect occupant health, comfort or service capabilities, unless people have not been instructed on how to activate their VAV box unit after hours;
§ This measure will require replacement of the existing VAV box space temperature sensors;
§ Occupants entering the building on Saturdays will have to wait for their space to warm up or cool down after pressing the override button;
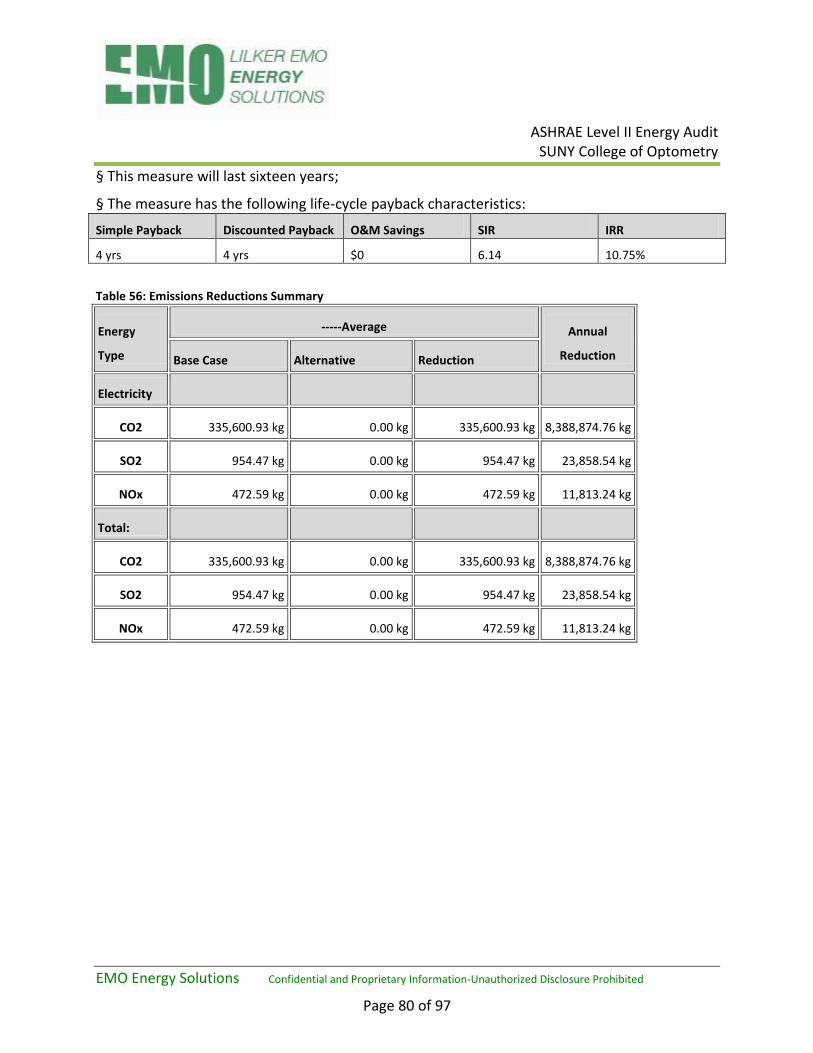
ASHRAE Level II Energy Audit
SUNY College of Optometry
EMO Energy Solutions Confidential and Proprietary Information-Unauthorized Disclosure Prohibited
Page 80 of 97
§ This measure will last sixteen years;
§ The measure has the following life-cycle payback characteristics:
Simple Payback Discounted Payback O&M Savings SIR IRR
4 yrs 4 yrs $0 6.14 10.75%
Table 56: Emissions Reductions Summary
Energy
Type
-----Average Annual
Reduction Base Case Alternative Reduction
Electricity
CO2 335,600.93 kg 0.00 kg 335,600.93 kg 8,388,874.76 kg
SO2 954.47 kg 0.00 kg 954.47 kg 23,858.54 kg
NOx 472.59 kg 0.00 kg 472.59 kg 11,813.24 kg
Total:
CO2 335,600.93 kg 0.00 kg 335,600.93 kg 8,388,874.76 kg
SO2 954.47 kg 0.00 kg 954.47 kg 23,858.54 kg
NOx 472.59 kg 0.00 kg 472.59 kg 11,813.24 kg
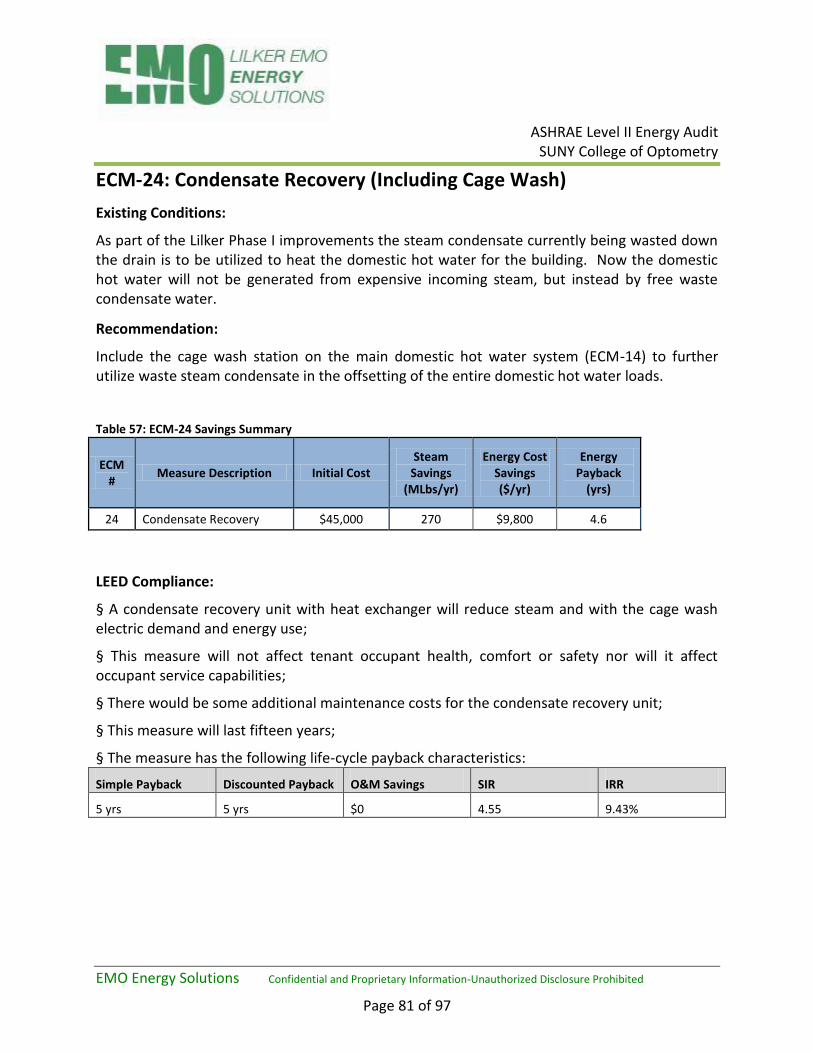
ASHRAE Level II Energy Audit
SUNY College of Optometry
EMO Energy Solutions Confidential and Proprietary Information-Unauthorized Disclosure Prohibited
Page 81 of 97
ECM-24: Condensate Recovery (Including Cage Wash)
Existing Conditions:
As part of the Lilker Phase I improvements the steam condensate currently being wasted down the drain is to be utilized to heat the domestic hot water for the building. Now the domestic hot water will not be generated from expensive incoming steam, but instead by free waste condensate water.
Recommendation:
Include the cage wash station on the main domestic hot water system (ECM-14) to further utilize waste steam condensate in the offsetting of the entire domestic hot water loads.
Table 57: ECM-24 Savings Summary
ECM #
Measure Description Initial Cost Steam
Savings (MLbs/yr)
Energy Cost Savings ($/yr)
Energy Payback
(yrs)
24 Condensate Recovery $45,000 270 $9,800 4.6
LEED Compliance:
§ A condensate recovery unit with heat exchanger will reduce steam and with the cage wash electric demand and energy use;
§ This measure will not affect tenant occupant health, comfort or safety nor will it affect occupant service capabilities;
§ There would be some additional maintenance costs for the condensate recovery unit;
§ This measure will last fifteen years;
§ The measure has the following life-cycle payback characteristics:
Simple Payback Discounted Payback O&M Savings SIR IRR
5 yrs 5 yrs $0 4.55 9.43%
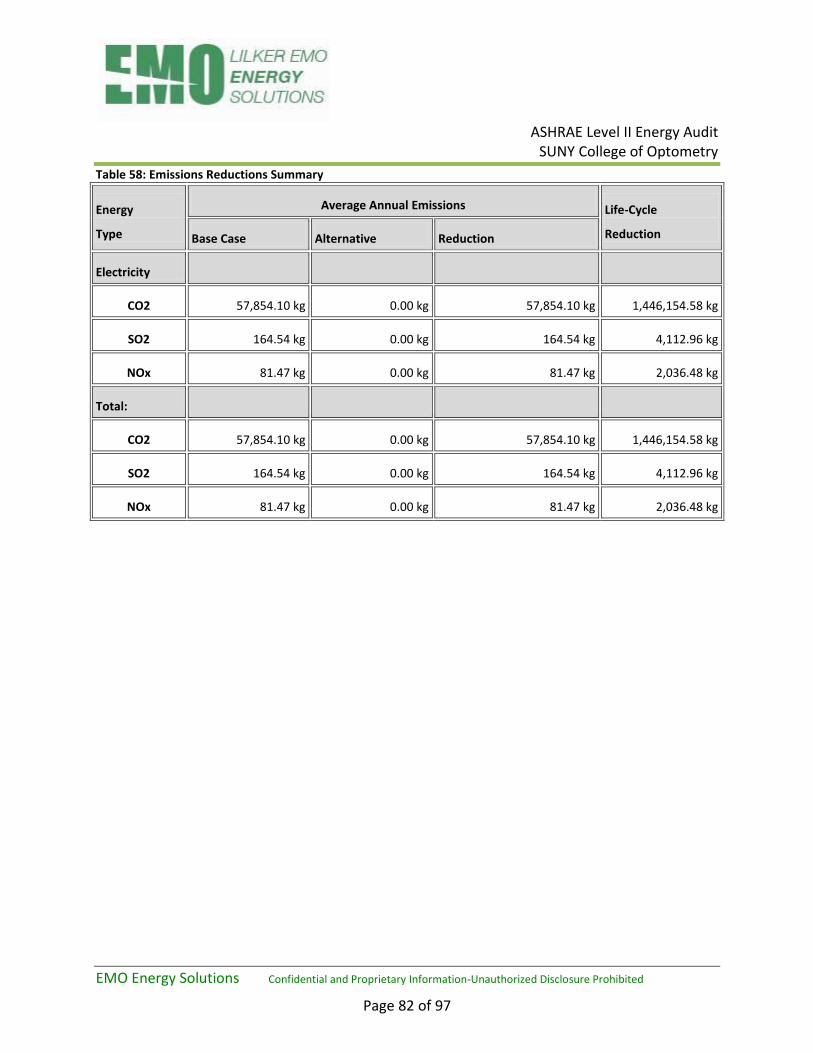
ASHRAE Level II Energy Audit
SUNY College of Optometry
EMO Energy Solutions Confidential and Proprietary Information-Unauthorized Disclosure Prohibited
Page 82 of 97
Table 58: Emissions Reductions Summary
Energy
Type
Average Annual Emissions Life-Cycle
Reduction Base Case Alternative Reduction
Electricity
CO2 57,854.10 kg 0.00 kg 57,854.10 kg 1,446,154.58 kg
SO2 164.54 kg 0.00 kg 164.54 kg 4,112.96 kg
NOx 81.47 kg 0.00 kg 81.47 kg 2,036.48 kg
Total:
CO2 57,854.10 kg 0.00 kg 57,854.10 kg 1,446,154.58 kg
SO2 164.54 kg 0.00 kg 164.54 kg 4,112.96 kg
NOx 81.47 kg 0.00 kg 81.47 kg 2,036.48 kg

ASHRAE Level II Energy Audit
SUNY College of Optometry
EMO Energy Solutions Confidential and Proprietary Information-Unauthorized Disclosure Prohibited
Page 83 of 97
ECM-25: Insulate Steam Station Piping
Existing Conditions:
The existing steam station piping is uninsulated or poorly insulated in many places, especially at valves, meters, and other steam control devices. The poorly insulated sections are allowing for large amounts of waste heat to escape into the lower basements, overheating the spaces and wasting energy. As part of Lilker Phase I Improvements plans have been made to reinsulate the entire steam station piping.
Recommendation:
The insulation of poorly insulated sections, or the reinsulation of the entire steam station piping will significantly reduce the amount of waste heat rejected into the basement, saving incoming steam energies and costs.
Table 59: ECM-25 Savings Summary
ECM # Measure Description Initial Cost Steam
Savings (MLbs/yr)
Energy Cost Savings ($/yr)
Energy Payback
(yrs)
25 Insulate Steam Station Piping $25,000 170 $6,400 3.9
LEED Compliance:
§ The insulated steam station will reduce steam usage;
§ Occupant health, safety and comfort will be improved as the lower basement levels will not be overheated. Occupant service capabilities will not be comprised;
§ This measure will reduce future pipe insulation maintenance costs;
§ This measure has a life expectancy of twenty years;
§ The measure has the following life-cycle payback characteristics:
Simple Payback Discounted Payback O&M Savings SIR IRR
4 yrs 5 yrs $0 5.28 10.09%
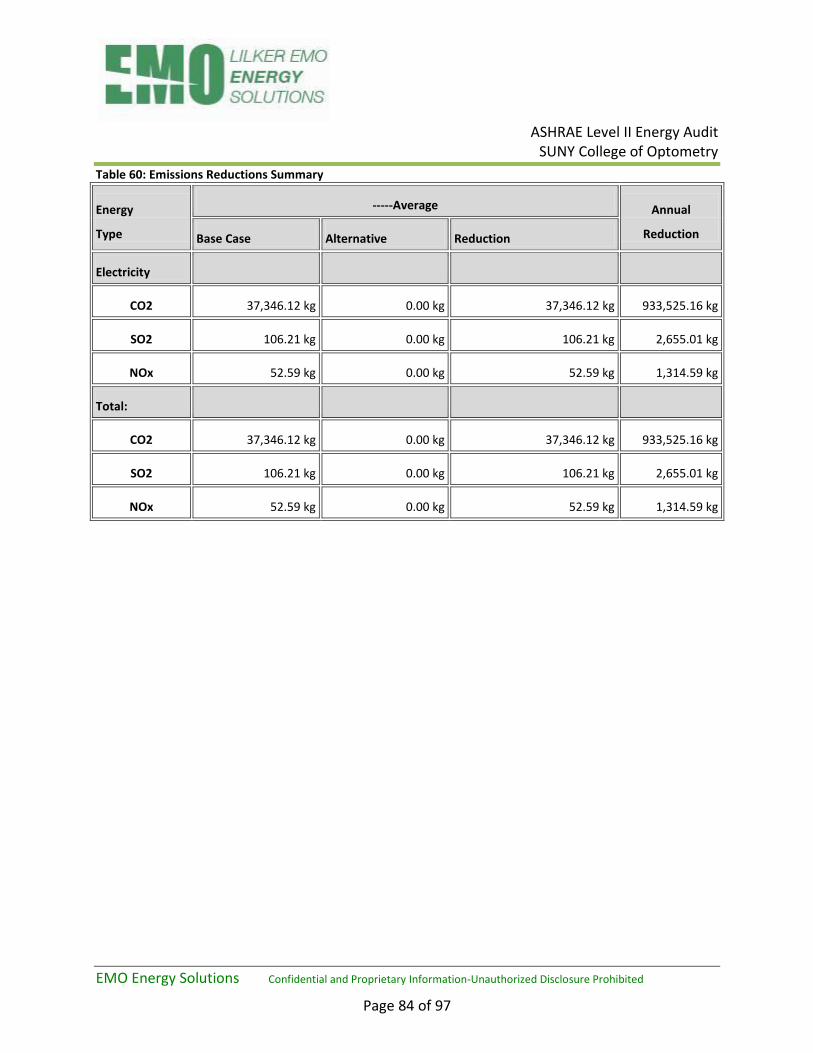
ASHRAE Level II Energy Audit
SUNY College of Optometry
EMO Energy Solutions Confidential and Proprietary Information-Unauthorized Disclosure Prohibited
Page 84 of 97
Table 60: Emissions Reductions Summary
Energy
Type
-----Average Annual
Reduction Base Case Alternative Reduction
Electricity
CO2 37,346.12 kg 0.00 kg 37,346.12 kg 933,525.16 kg
SO2 106.21 kg 0.00 kg 106.21 kg 2,655.01 kg
NOx 52.59 kg 0.00 kg 52.59 kg 1,314.59 kg
Total:
CO2 37,346.12 kg 0.00 kg 37,346.12 kg 933,525.16 kg
SO2 106.21 kg 0.00 kg 106.21 kg 2,655.01 kg
NOx 52.59 kg 0.00 kg 52.59 kg 1,314.59 kg
ASHRAE Level II Energy Audit
SUNY College of Optometry
EMO Energy Solutions Confidential and Proprietary Information-Unauthorized Disclosure Prohibited
Page 85 of 97
ECM-26: Combined Heat and Power
Existing Conditions:
The building has a large and constant electric requirement, however the hot water requirements will be declining because of the condensate recovery system and limited to about six month of heating hot water.
Recommendation:
The possibility of 100 to 200 kW of CHP cogeneration seems feasible owing to the high costs of steam and electric supply and demand, and a generous rebate of $180,000 per 100 kW unit from NYSERDA. We recommend a more detailed analysis of the existing situation by means of a CHP Feasibility Analysis and Study, which goes beyond the scope of this report, to determine the exact project savings and costs of a possible CHP installation.

Measures Considered But Not Recommended
Demand Control Ventilation
The outside air supply to the building appears to exceed the basic ventilation needs. Additionally this high level of ventilation air is provided 90 hours per week when the building is only partially occupied for about half of those hours. However outside air is being used in large quantities to provide free cooling to the SCU’s in the heating months and therefore demand control ventilation savings are limited to the cooling months. The relatively high cost of installing carbon dioxide sensors in all mechanical rooms made it more practical to schedule the outside air volumes according to time of day, which is much less costly.
SCU’s on Optimal Start/Stop
The late starting of the SCU’s in the morning did not indicate a need for Optimal Start/Stop in the building.
Solar Film on East and West Sides of the Building
The east and west sides of the building only have single pane clear glass, which are normally ideal candidates for solar film. However it was reported that most of these windows saw little or no incidence of direct solar light because of the buildings located adjacent to them. In this case solar film will not have a good payback based on SUNY’s expectation of 7 years or less.
PV Solar Panels
The roof of SUNY College of Optometry does not have much roof space for Solar PV panels. Additionally, the State of New York does not currently have a SREC (Solar Renewable Energy Credit) market to provide monies for each kWh generated. With an SREC market, PV Solar is not an economic feasibility at this time.
Wind Power
The only wind projects in NYC are either very small scale residential or larger offshore wind turbines. It would appear that NYC is not allowing large wind turbines on top of tall buildings. Given the increased wind load that would have to be transmitted to the building structure, this makes sense.
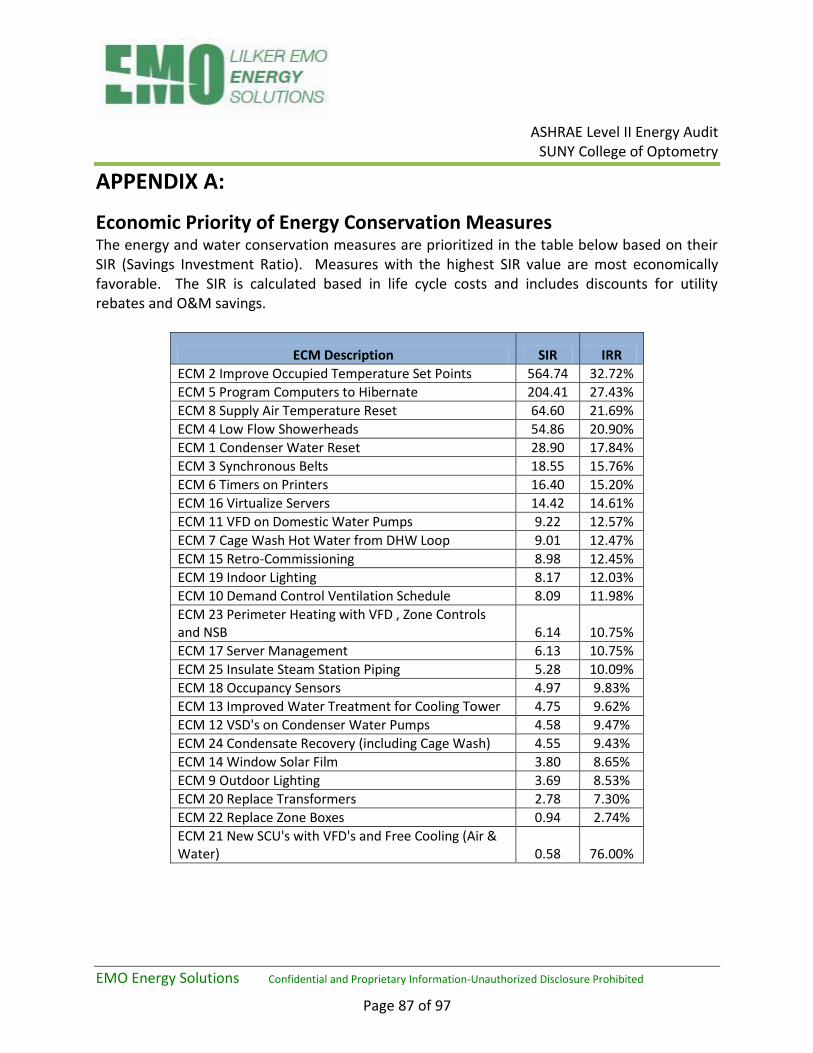
ASHRAE Level II Energy Audit
SUNY College of Optometry
EMO Energy Solutions Confidential and Proprietary Information-Unauthorized Disclosure Prohibited
Page 87 of 97
APPENDIX A:
Economic Priority of Energy Conservation Measures The energy and water conservation measures are prioritized in the table below based on their SIR (Savings Investment Ratio). Measures with the highest SIR value are most economically favorable. The SIR is calculated based in life cycle costs and includes discounts for utility rebates and O&M savings.
ECM Description SIR IRR
ECM 2 Improve Occupied Temperature Set Points 564.74 32.72%
ECM 5 Program Computers to Hibernate 204.41 27.43%
ECM 8 Supply Air Temperature Reset 64.60 21.69%
ECM 4 Low Flow Showerheads 54.86 20.90%
ECM 1 Condenser Water Reset 28.90 17.84%
ECM 3 Synchronous Belts 18.55 15.76%
ECM 6 Timers on Printers 16.40 15.20%
ECM 16 Virtualize Servers 14.42 14.61%
ECM 11 VFD on Domestic Water Pumps 9.22 12.57%
ECM 7 Cage Wash Hot Water from DHW Loop 9.01 12.47%
ECM 15 Retro-Commissioning 8.98 12.45%
ECM 19 Indoor Lighting 8.17 12.03%
ECM 10 Demand Control Ventilation Schedule 8.09 11.98%
ECM 23 Perimeter Heating with VFD , Zone Controls and NSB 6.14 10.75%
ECM 17 Server Management 6.13 10.75%
ECM 25 Insulate Steam Station Piping 5.28 10.09%
ECM 18 Occupancy Sensors 4.97 9.83%
ECM 13 Improved Water Treatment for Cooling Tower 4.75 9.62%
ECM 12 VSD's on Condenser Water Pumps 4.58 9.47%
ECM 24 Condensate Recovery (including Cage Wash) 4.55 9.43%
ECM 14 Window Solar Film 3.80 8.65%
ECM 9 Outdoor Lighting 3.69 8.53%
ECM 20 Replace Transformers 2.78 7.30%
ECM 22 Replace Zone Boxes 0.94 2.74%
ECM 21 New SCU's with VFD's and Free Cooling (Air & Water) 0.58 76.00%
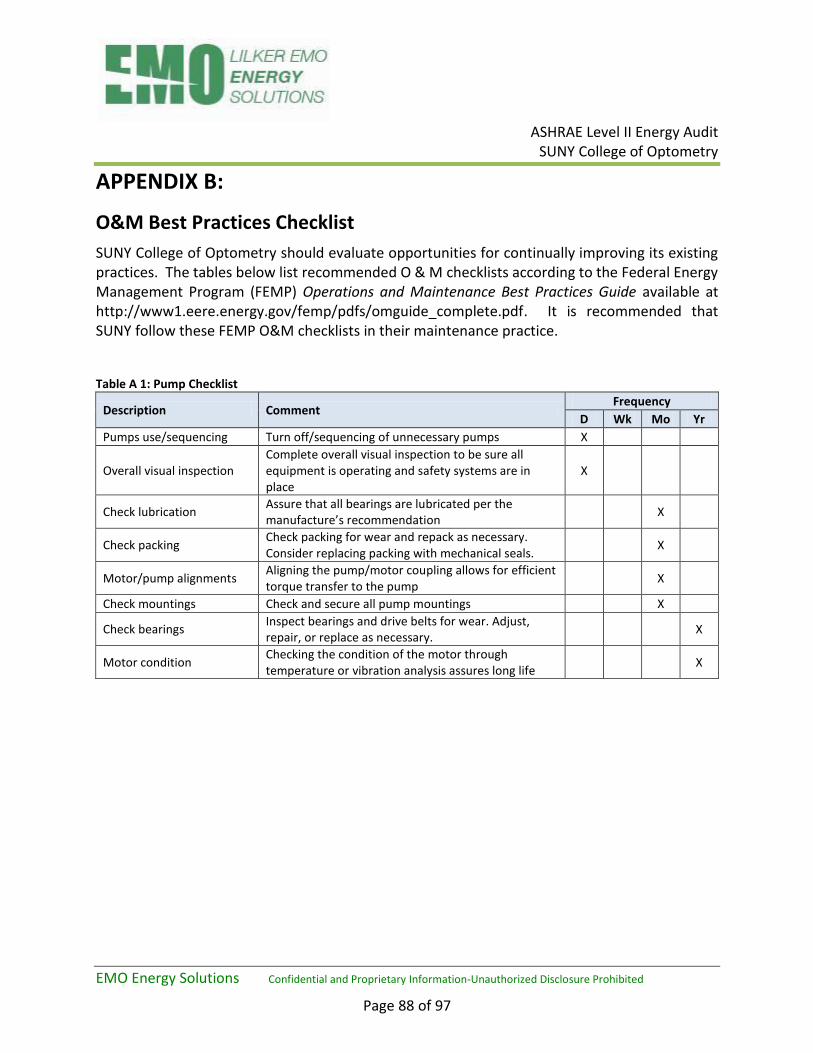
ASHRAE Level II Energy Audit
SUNY College of Optometry
EMO Energy Solutions Confidential and Proprietary Information-Unauthorized Disclosure Prohibited
Page 88 of 97
APPENDIX B:
O&M Best Practices Checklist
SUNY College of Optometry should evaluate opportunities for continually improving its existing practices. The tables below list recommended O & M checklists according to the Federal Energy Management Program (FEMP) Operations and Maintenance Best Practices Guide available at http://www1.eere.energy.gov/femp/pdfs/omguide_complete.pdf. It is recommended that SUNY follow these FEMP O&M checklists in their maintenance practice.
Table A 1: Pump Checklist
Description Comment Frequency
D Wk Mo Yr
Pumps use/sequencing Turn off/sequencing of unnecessary pumps X
Overall visual inspection Complete overall visual inspection to be sure all equipment is operating and safety systems are in place
X
Check lubrication Assure that all bearings are lubricated per the manufacture’s recommendation
X
Check packing Check packing for wear and repack as necessary. Consider replacing packing with mechanical seals.
X
Motor/pump alignments Aligning the pump/motor coupling allows for efficient torque transfer to the pump
X
Check mountings Check and secure all pump mountings X
Check bearings Inspect bearings and drive belts for wear. Adjust, repair, or replace as necessary.
X
Motor condition Checking the condition of the motor through temperature or vibration analysis assures long life
X
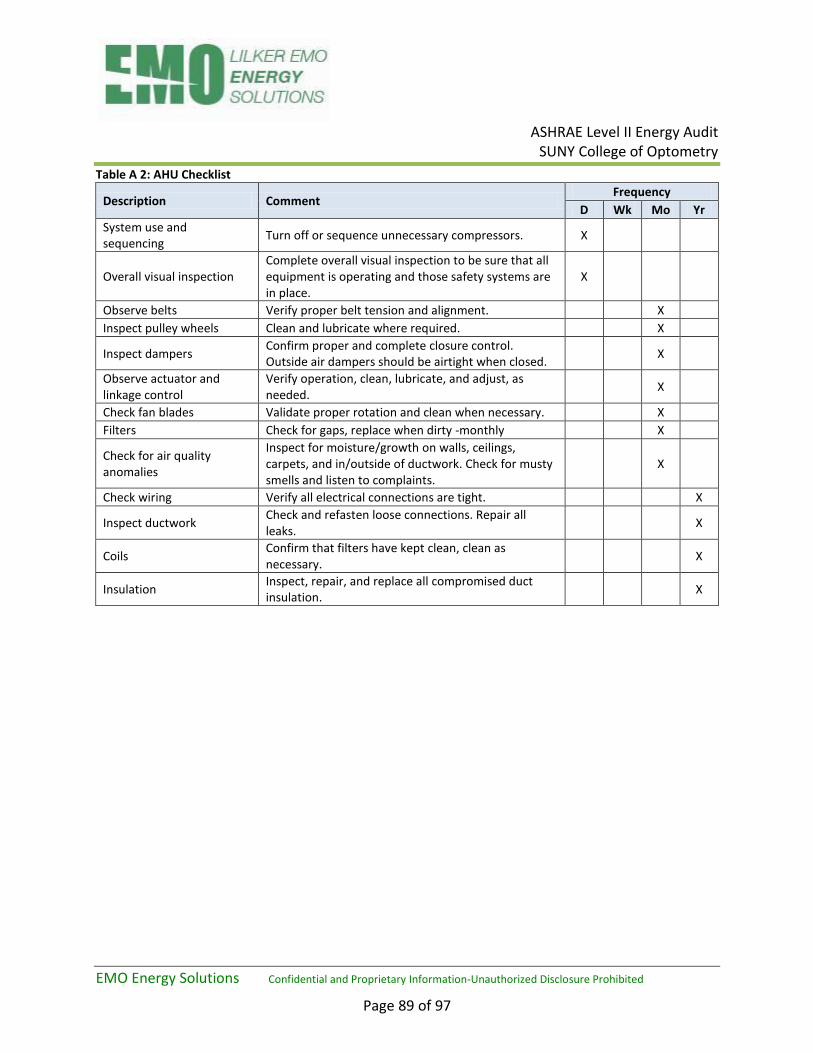
ASHRAE Level II Energy Audit
SUNY College of Optometry
EMO Energy Solutions Confidential and Proprietary Information-Unauthorized Disclosure Prohibited
Page 89 of 97
Table A 2: AHU Checklist
Description Comment Frequency
D Wk Mo Yr
System use and sequencing
Turn off or sequence unnecessary compressors. X
Overall visual inspection Complete overall visual inspection to be sure that all equipment is operating and those safety systems are in place.
X
Observe belts Verify proper belt tension and alignment. X
Inspect pulley wheels Clean and lubricate where required. X
Inspect dampers Confirm proper and complete closure control. Outside air dampers should be airtight when closed.
X
Observe actuator and linkage control
Verify operation, clean, lubricate, and adjust, as needed.
X
Check fan blades Validate proper rotation and clean when necessary. X
Filters Check for gaps, replace when dirty -monthly X
Check for air quality anomalies
Inspect for moisture/growth on walls, ceilings, carpets, and in/outside of ductwork. Check for musty smells and listen to complaints.
X
Check wiring Verify all electrical connections are tight. X
Inspect ductwork Check and refasten loose connections. Repair all leaks.
X
Coils Confirm that filters have kept clean, clean as necessary.
X
Insulation Inspect, repair, and replace all compromised duct insulation.
X
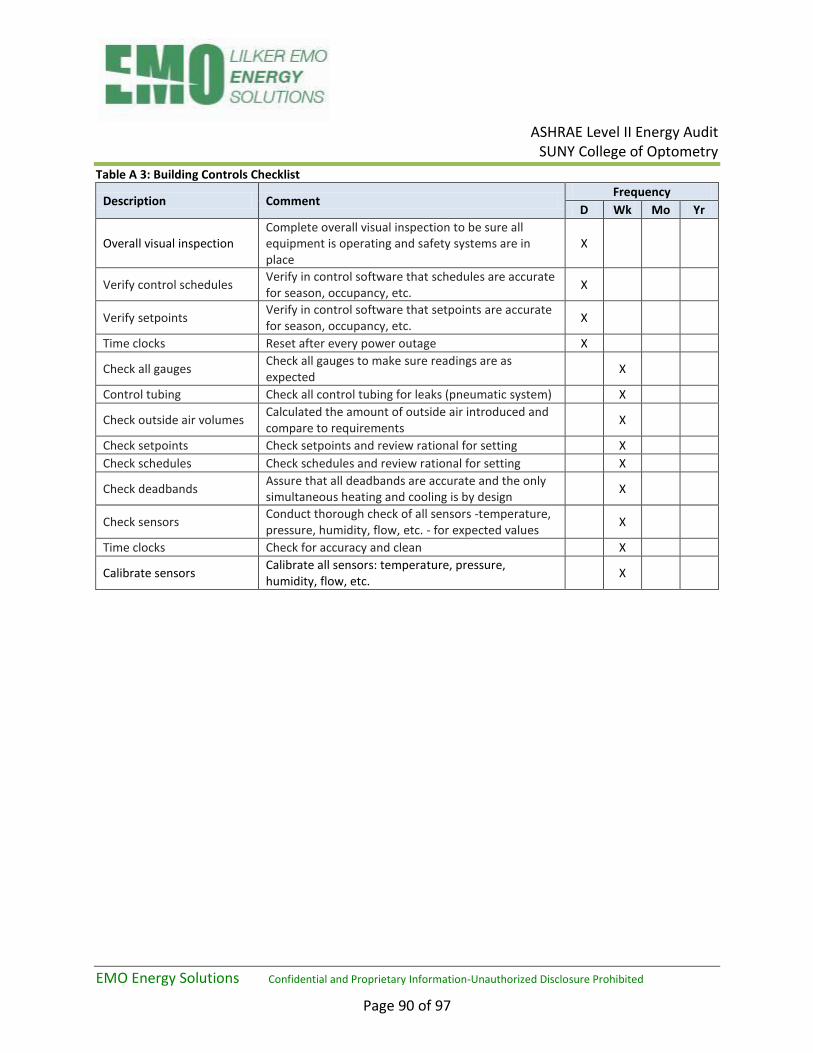
ASHRAE Level II Energy Audit
SUNY College of Optometry
EMO Energy Solutions Confidential and Proprietary Information-Unauthorized Disclosure Prohibited
Page 90 of 97
Table A 3: Building Controls Checklist
Description Comment Frequency
D Wk Mo Yr
Overall visual inspection Complete overall visual inspection to be sure all equipment is operating and safety systems are in place
X
Verify control schedules Verify in control software that schedules are accurate for season, occupancy, etc.
X
Verify setpoints Verify in control software that setpoints are accurate for season, occupancy, etc.
X
Time clocks Reset after every power outage X
Check all gauges Check all gauges to make sure readings are as expected
X
Control tubing Check all control tubing for leaks (pneumatic system) X
Check outside air volumes Calculated the amount of outside air introduced and compare to requirements
X
Check setpoints Check setpoints and review rational for setting X
Check schedules Check schedules and review rational for setting X
Check deadbands Assure that all deadbands are accurate and the only simultaneous heating and cooling is by design
X
Check sensors Conduct thorough check of all sensors -temperature, pressure, humidity, flow, etc. - for expected values
X
Time clocks Check for accuracy and clean X
Calibrate sensors Calibrate all sensors: temperature, pressure, humidity, flow, etc.
X

ASHRAE Level II Energy Audit
SUNY College of Optometry
EMO Energy Solutions Confidential and Proprietary Information-Unauthorized Disclosure Prohibited
Page 91 of 97
Table A 4: Cooling Tower Checklist
Description Comment Frequency
D Wk Mo Yr
Cooling tower use and sequencing
Turn off or sequence unnecessary cooling towers. X
Overall visual inspection Complete overall visual inspection to be sure all equipment is operating and that safety systems are in place.
X
Inspect for clogging Make sure water is flowing in tower. X
Fan motor condition Check the condition of the fan motor through temperature or vibration analysis and compare to baseline values.
X
Clean suction screen Physically clean screen of all debris. X
Test water samples Test for proper concentrations of dissolved solids, and chemistry. Adjust blow down and chemicals as necessary.
X
Operate make-up water float switch
Operate switch manually to ensure proper operation. X
Vibration Check for excessive vibration in motors, fans, and pumps.
X
Check tower structure Check for loose fill, connections, leaks, etc. X
Check belts and pulleys Adjust all belts and pulleys X
Check lubrication Assure that all bearings are lubricated per the manufacturer's recommendation.
X
Check motor supports and fan blades
Check for excessive wear and secure fastening. X
Motor alignment Align the motor coupling to allow for efficient torque transfer.
X
Check drift eliminators, louvers, and fill
Look for proper positioning and scale buildup. X
Clean tower Remove all dust, scale, and algae from tower basin, fill, and spray nozzles.
X
Check bearings Inspect bearings and drive belts for wear. Adjust, repair, or replace as necessary.
X
Motor condition Check the condition of the motor through temperature or vibration analysis to assure long life.
X
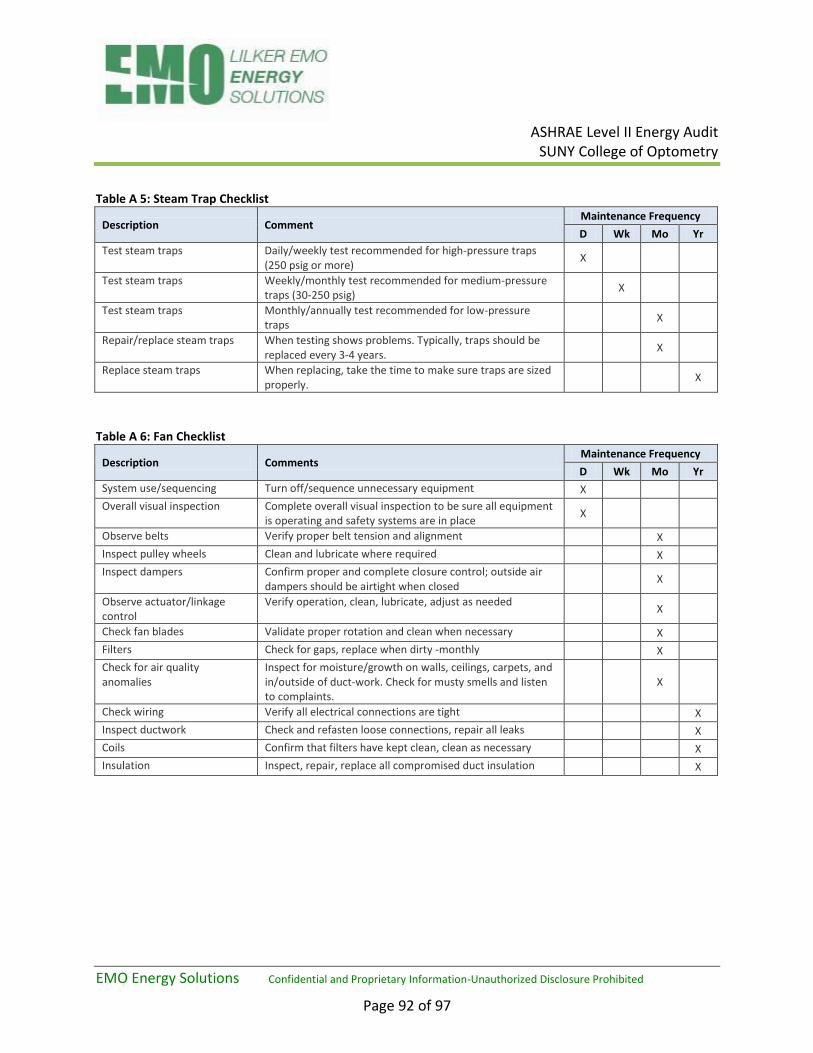
ASHRAE Level II Energy Audit
SUNY College of Optometry
EMO Energy Solutions Confidential and Proprietary Information-Unauthorized Disclosure Prohibited
Page 92 of 97
Table A 5: Steam Trap Checklist
Description Comment Maintenance Frequency
D Wk Mo Yr
Test steam traps Daily/weekly test recommended for high-pressure traps (250 psig or more)
X
Test steam traps Weekly/monthly test recommended for medium-pressure traps (30-250 psig)
X
Test steam traps Monthly/annually test recommended for low-pressure traps
X
Repair/replace steam traps When testing shows problems. Typically, traps should be replaced every 3-4 years.
X
Replace steam traps When replacing, take the time to make sure traps are sized properly.
X
Table A 6: Fan Checklist
Description Comments Maintenance Frequency
D Wk Mo Yr
System use/sequencing Turn off/sequence unnecessary equipment X
Overall visual inspection Complete overall visual inspection to be sure all equipment is operating and safety systems are in place
X
Observe belts Verify proper belt tension and alignment X
Inspect pulley wheels Clean and lubricate where required X
Inspect dampers Confirm proper and complete closure control; outside air dampers should be airtight when closed
X
Observe actuator/linkage control
Verify operation, clean, lubricate, adjust as needed X
Check fan blades Validate proper rotation and clean when necessary X
Filters Check for gaps, replace when dirty -monthly X
Check for air quality anomalies
Inspect for moisture/growth on walls, ceilings, carpets, and in/outside of duct-work. Check for musty smells and listen to complaints.
X
Check wiring Verify all electrical connections are tight X
Inspect ductwork Check and refasten loose connections, repair all leaks X
Coils Confirm that filters have kept clean, clean as necessary X
Insulation Inspect, repair, replace all compromised duct insulation X
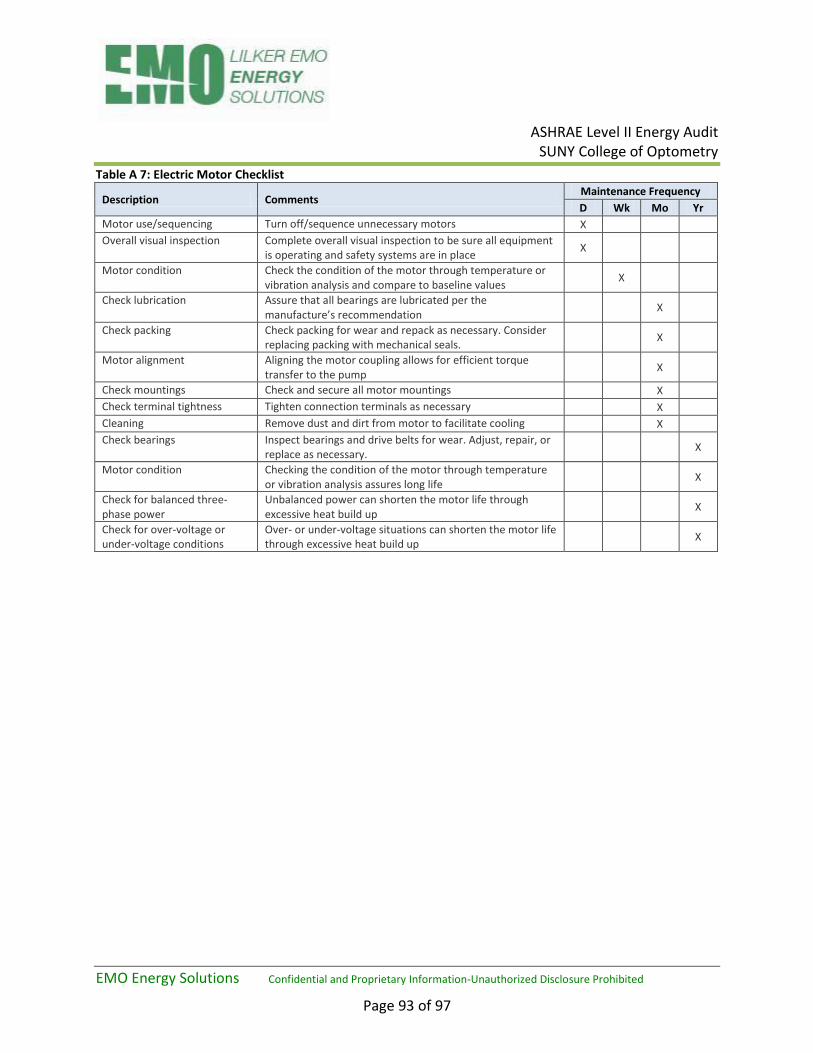
ASHRAE Level II Energy Audit
SUNY College of Optometry
EMO Energy Solutions Confidential and Proprietary Information-Unauthorized Disclosure Prohibited
Page 93 of 97
Table A 7: Electric Motor Checklist
Description Comments Maintenance Frequency
D Wk Mo Yr
Motor use/sequencing Turn off/sequence unnecessary motors X
Overall visual inspection Complete overall visual inspection to be sure all equipment is operating and safety systems are in place
X
Motor condition Check the condition of the motor through temperature or vibration analysis and compare to baseline values
X
Check lubrication Assure that all bearings are lubricated per the manufacture’s recommendation
X
Check packing Check packing for wear and repack as necessary. Consider replacing packing with mechanical seals.
X
Motor alignment Aligning the motor coupling allows for efficient torque transfer to the pump
X
Check mountings Check and secure all motor mountings X
Check terminal tightness Tighten connection terminals as necessary X
Cleaning Remove dust and dirt from motor to facilitate cooling X
Check bearings Inspect bearings and drive belts for wear. Adjust, repair, or replace as necessary.
X
Motor condition Checking the condition of the motor through temperature or vibration analysis assures long life
X
Check for balanced three-phase power
Unbalanced power can shorten the motor life through excessive heat build up
X
Check for over-voltage or under-voltage conditions
Over- or under-voltage situations can shorten the motor life through excessive heat build up
X

ASHRAE Level II Energy Audit
SUNY College of Optometry
EMO Energy Solutions Confidential and Proprietary Information-Unauthorized Disclosure Prohibited
Page 94 of 97
Table A 8: Air Compressor Checklist
Description Comments Maintenance Frequency
D Wk Mo Yr
Compressor use/sequencing Turn off/sequence unnecessary compressors X
Overall visual inspection Complete overall visual inspection to be sure all equipment is operating and safety systems are in place
X
Leakage assessment Look for and report any system leakages X
Compressor operation Monitor operation for run time and temperature variance from trended norms
X
Dryers Dryers should be observed for proper function X
Compressor ventilation Make sure proper ventilation is available for compressor and inlet
X
Compressor lubricant Note level, color, and pressure. Compare with trended values.
X
Condensate drain Drain condensate from tank, legs, and/or traps X
Operating temperature Verify operating temperature is per manufacturer specification
X
Pressure relief valves Verify all pressure relief valves are functioning properly X
Check belt tension Check belt tension and alignment for proper settings X
Intake filter pads Clean or replace intake filter pads as necessary X
Air-consuming device check All air-consuming devices need to be inspected on a regular basis for leakage. Leakage Typically occurs in: worn/cracked/frayed hoses, sticking air valves, cylinder packing
X
Drain traps Clean out debris and check operation X
Motor bearings Lubricate motor bearings to manufacturer’s specification X
System oil Depending on use and compressor size, develop periodic oil sampling to monitor moisture, particulate levels, and other contamination. Replace oil as required.
X
Couplings Inspect all couplings for proper function and alignment X
Shaft seals Check all seals for leakage or wear X
Air line filters Replace particulate and lubricant removal elements when pressure drop exceeds 2-3 psi
X
Check mountings Check and secure all compressor mountings X
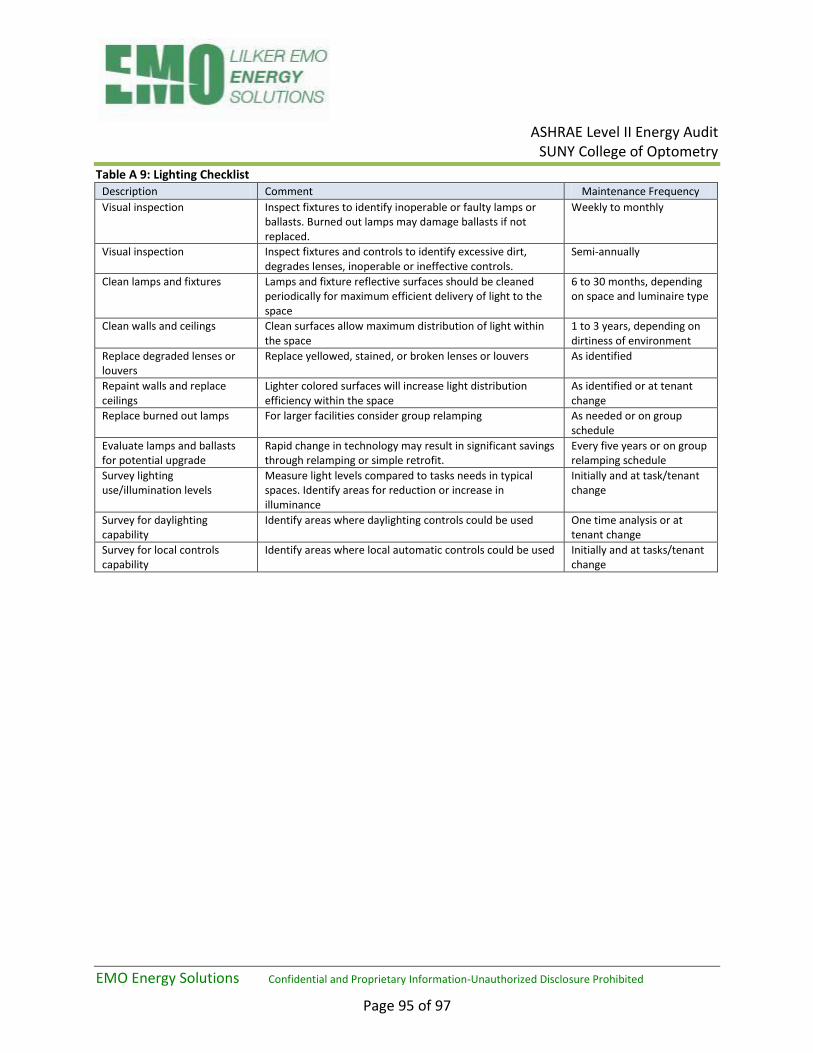
ASHRAE Level II Energy Audit
SUNY College of Optometry
EMO Energy Solutions Confidential and Proprietary Information-Unauthorized Disclosure Prohibited
Page 95 of 97
Table A 9: Lighting Checklist Description Comment Maintenance Frequency
Visual inspection Inspect fixtures to identify inoperable or faulty lamps or ballasts. Burned out lamps may damage ballasts if not replaced.
Weekly to monthly
Visual inspection Inspect fixtures and controls to identify excessive dirt, degrades lenses, inoperable or ineffective controls.
Semi-annually
Clean lamps and fixtures Lamps and fixture reflective surfaces should be cleaned periodically for maximum efficient delivery of light to the space
6 to 30 months, depending on space and luminaire type
Clean walls and ceilings Clean surfaces allow maximum distribution of light within the space
1 to 3 years, depending on dirtiness of environment
Replace degraded lenses or louvers
Replace yellowed, stained, or broken lenses or louvers As identified
Repaint walls and replace ceilings
Lighter colored surfaces will increase light distribution efficiency within the space
As identified or at tenant change
Replace burned out lamps For larger facilities consider group relamping As needed or on group schedule
Evaluate lamps and ballasts for potential upgrade
Rapid change in technology may result in significant savings through relamping or simple retrofit.
Every five years or on group relamping schedule
Survey lighting use/illumination levels
Measure light levels compared to tasks needs in typical spaces. Identify areas for reduction or increase in illuminance
Initially and at task/tenant change
Survey for daylighting capability
Identify areas where daylighting controls could be used One time analysis or at tenant change
Survey for local controls capability
Identify areas where local automatic controls could be used Initially and at tasks/tenant change

ASHRAE Level II Energy Audit
SUNY College of Optometry
EMO Energy Solutions Confidential and Proprietary Information-Unauthorized Disclosure Prohibited
Page 96 of 97
APPENDIX C:
Utility Usage Charts Figure 20: Historical Electric Consumption (not including AT&T)
Figure 21: Historical Electric Demand (not including AT&T)
0
50,000
100,000
150,000
200,000
250,000
300,000
350,000
400,000
450,000
500,000
J A S O N D J F M A M J
kilo
wat
t h
ou
rs
2012 - 2013
Annual Electric Usage
0
200
400
600
800
1,000
1,200
1,400
J A S O N D J F M A M J
kilo
wat
ts
2012 - 2013
Annual Electric Demand

ASHRAE Level II Energy Audit
SUNY College of Optometry
EMO Energy Solutions Confidential and Proprietary Information-Unauthorized Disclosure Prohibited
Page 97 of 97
Figure 22: Historical Steam Consumption
0.0
200.0
400.0
600.0
800.0
1000.0
1200.0
J A S O N D J F M A M J
MLb
s.
2012 - 2013
Monthly Steam