Embed Size (px)
Citation preview

Ashita Allamraju
Indian Economy: Trends and Challenges

Growth- Economy wide and Sectoral Macroeconomic concerns
◦ Inflation◦ Fiscal deficit Growth vs Development
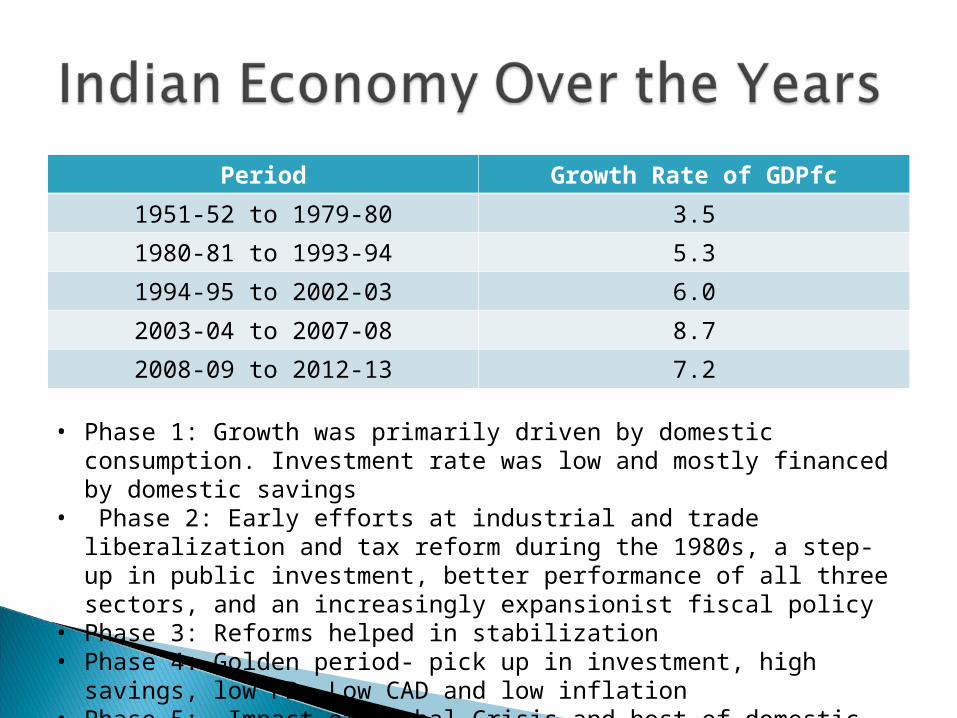
Period Growth Rate of GDPfc
1951-52 to 1979-80 3.5
1980-81 to 1993-94 5.3
1994-95 to 2002-03 6.0
2003-04 to 2007-08 8.7
2008-09 to 2012-13 7.2
• Phase 1: Growth was primarily driven by domestic consumption. Investment rate was low and mostly financed by domestic savings
• Phase 2: Early efforts at industrial and trade liberalization and tax reform during the 1980s, a step-up in public investment, better performance of all three sectors, and an increasingly expansionist fiscal policy
• Phase 3: Reforms helped in stabilization• Phase 4: Golden period- pick up in investment, high savings, low FD, Low
CAD and low inflation• Phase 5: Impact of Global Crisis and host of domestic factors

Growth of 6.8 per cent in 2008-09 after having registered a growth rate exceeding 9 per cent for three consecutive years.
Achieved a growth rate of 8.4 per cent in 2009-10, despite a severe drought.
The growth rate was maintained at 8.4 per cent in 2010-11 as well. There was a substantial jump in agricultural production. The manufacturing sector grew by 7.6 per cent and the services sector by 9.4 per cent.

Growth in 2011/12 of 6.5% In 2012-13, growth is 5% 2013-14 first quarter 4.4% and 4.8% in
second quarter and 4.7% in third Poor compared to pre-crisis growth
- but also compared to immediate post crisis yrs
- lowest annual growth in the last decade


Massive increase in capacity as investment jumped from 24% of GDP in 2003 to 33% of GDP in 2008.
Overall investment rate largely driven by the private corporate sector.
Investment was financed mostly by higher domestic saving The attraction of higher growth made it easier to access
foreign sources of funding. Rise in investment was accompanied by rise in productivity.
7
Underlying all these factors was…

6.1%5.3%
8.9%9.5% 9.2%
18.0%
5.0% 4.7%
7.0%6.2%
5.6%
4.5%
0%
2%
4%
6%
8%
10%
12%
14%
16%
18%
20%
91-2to97-8 98-9 to 02-3 03-4to07-8
Gdpmp GDCF PFCEdm GFCE
8
The growth acceleration wascontributed by high domestic saving accompanied by improvement in productivity.

Investment growth led by ◦ Fixed investment i.e. not inventory build up ◦ Private Investment i.e. Profitable
Increase in productive capacity of the economy
Savings rate also rose: Private & Public sectors
9
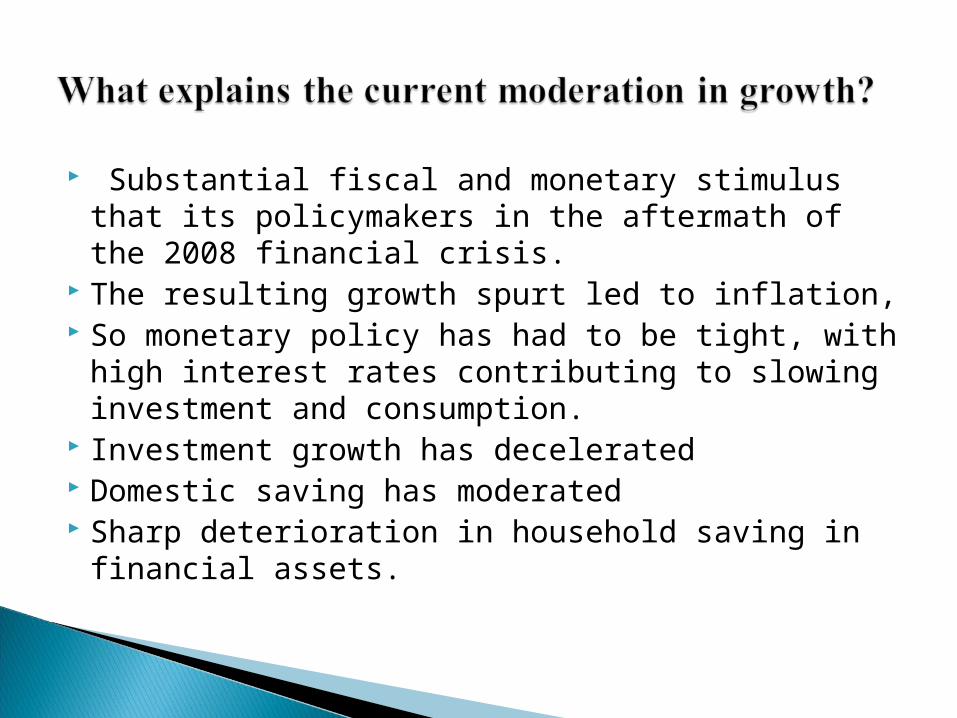
Substantial fiscal and monetary stimulus that its policymakers in the aftermath of the 2008 financial crisis.
The resulting growth spurt led to inflation, So monetary policy has had to be tight, with
high interest rates contributing to slowing investment and consumption.
Investment growth has decelerated Domestic saving has moderated Sharp deterioration in household saving in
financial assets.

Preliminary estimates suggest that household financial saving has plummeted to 7.8% of GDP in 2011-12 from an already low of 9.3% in 2010-11 as compared with an average of 11.6% in the high growth phase.
Inflation
Increase in preference for gold
2 Reasons

India’s institutions for acquiring land, allocating natural resources, and granting clearances were overwhelmed during the period of strong growth.
Growth increased the rents to corruption. many large projects came to a grinding halt. The post- crisis fiscal-stimulus packages sent
the government budget deficit soaring from to over 6 percent.
Higher imports of coal, iron and gold and increasing CAD

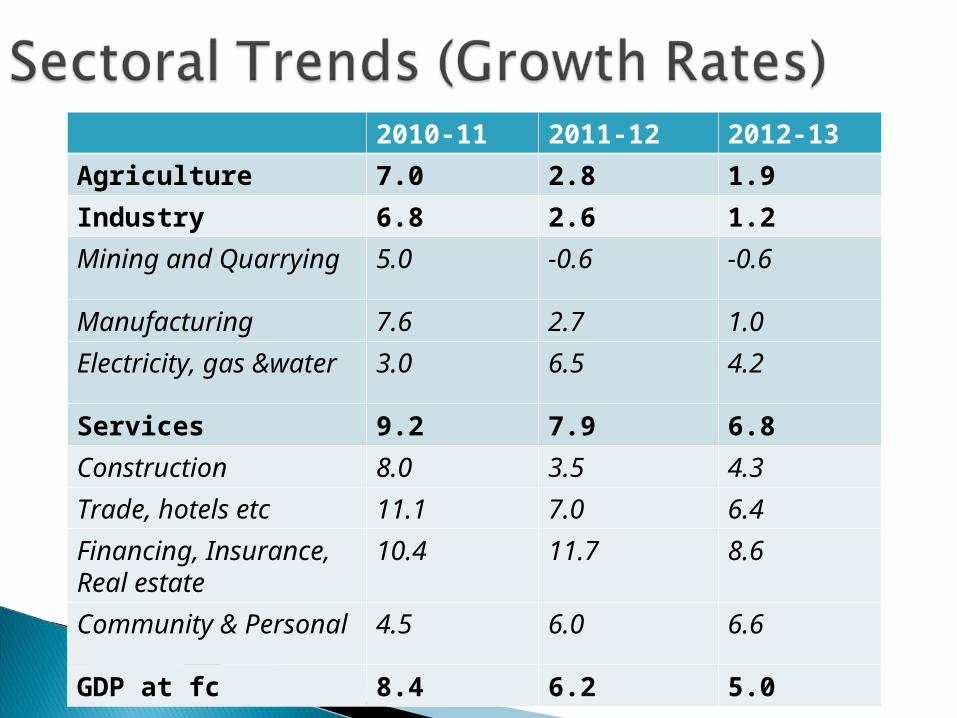
2010-11 2011-12 2012-13
Agriculture 7.0 2.8 1.9
Industry 6.8 2.6 1.2
Mining and Quarrying 5.0 -0.6 -0.6
Manufacturing 7.6 2.7 1.0
Electricity, gas &water 3.0 6.5 4.2
Services 9.2 7.9 6.8
Construction 8.0 3.5 4.3
Trade, hotels etc 11.1 7.0 6.4
Financing, Insurance, Real estate
10.4 11.7 8.6
Community & Personal 4.5 6.0 6.6
GDP at fc 8.4 6.2 5.0
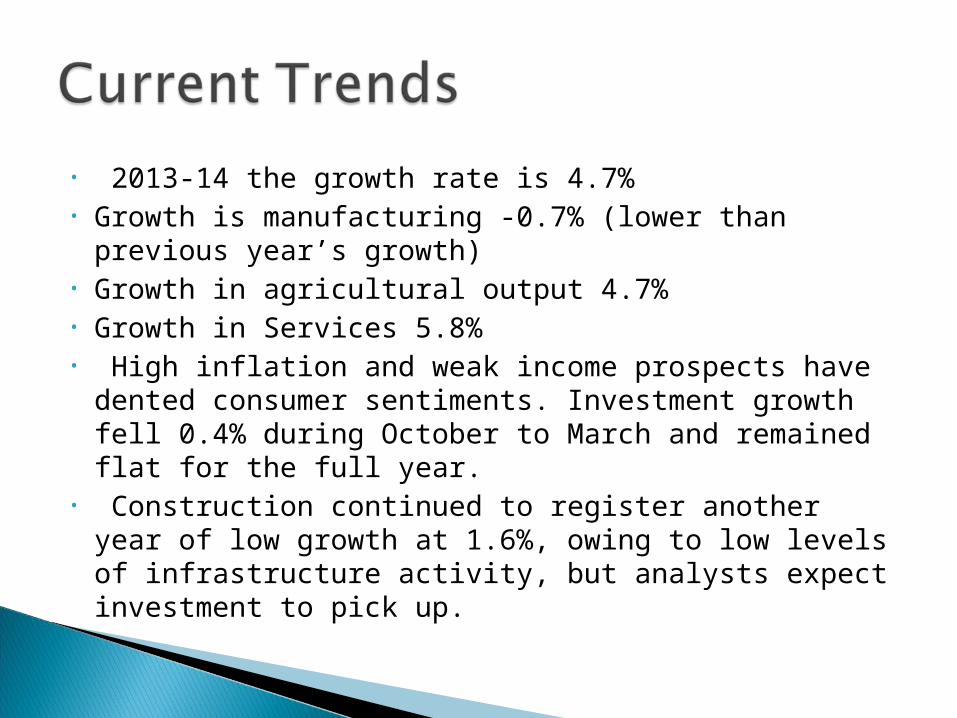
• 2013-14 the growth rate is 4.7%• Growth is manufacturing -0.7% (lower than previous
year’s growth)• Growth in agricultural output 4.7% • Growth in Services 5.8%• High inflation and weak income prospects have
dented consumer sentiments. Investment growth fell 0.4% during October to March and remained flat for the full year.
• Construction continued to register another year of low growth at 1.6%, owing to low levels of infrastructure activity, but analysts expect investment to pick up.
16
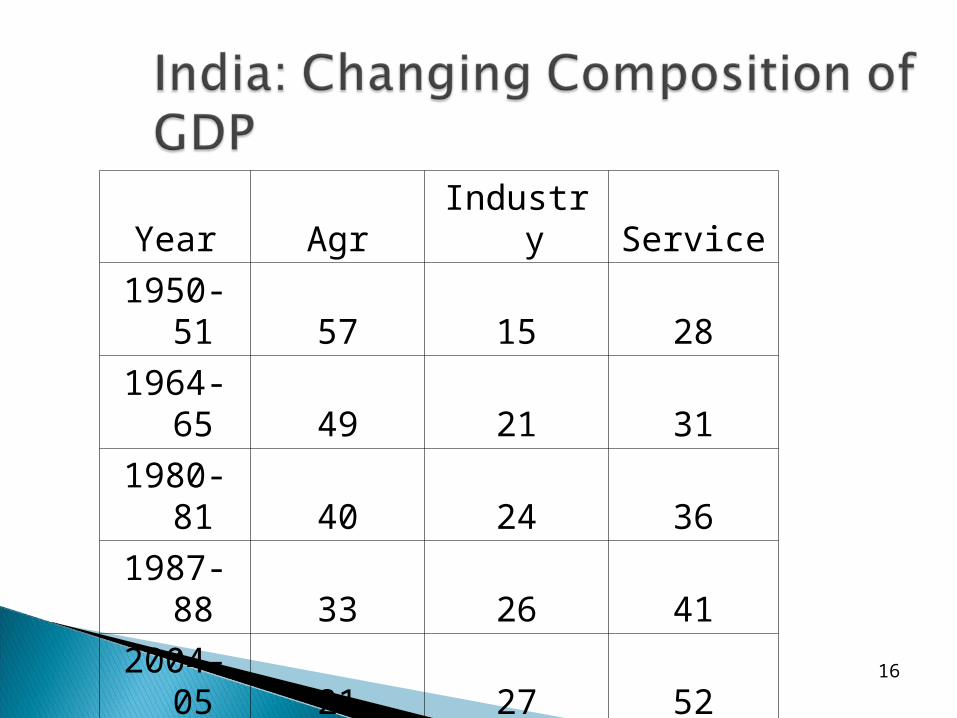
Year Agr Industry Service1950-51 57 15 281964-65 49 21 311980-81 40 24 361987-88 33 26 412004-05 21 27 522010-11 14.5 27.8 57.72011-12 14 27 592012-13 13.7 19.1 67.2

Share in India’s economy has progressively declined to less than 15% but the sector’s importance in India’s economic and social fabric goes well beyond this indicator. •Nearly three-quarters of India’s families depend on rural incomes. •The majority of India’s poor (some 770 million people or about 70 percent) are found in rural areas. •India’s food security depends on producing cereal crops, as well as increasing its production of fruits, vegetables and milk to meet the demands of a growing population with rising incomes. •To do so, a productive, competitive, diversified and sustainable agricultural sector will need to emerge at an accelerated pace.

Growth performance in agriculture%)1950-1 to 1964-5: 2.51 (area gro. +yield gro)1967-8 to 1980-1: 2.20 (yield gr. green revol)1980-1 to 1990-1: 3.07 (spread of green
rev)1992-3 to 2004-5: 2.76 1997-8 to 2004-5: 1.60 (neglect of agri.)2004-5 to 2010-1: 3.47 (revival of growth) The policy, institutional and investment focus
during green revolution time helped India achieve its food self sufficiency goals.
However, now different policies are needed to focus on small holdings, rainfed areas, women, lagging regions, rural non-farm for sustainable agricultural transformation

-15
-10
-5
0
5
10
15
20 Plan CommWB-WDI Annual Growth Rate
-1.00
0.00
1.00
2.00
3.00
4.00
5.00
6.00
7.00
1965
1967
1969
1971
1973
1975
1977
1979
1981
1983
1985
1987
1989
1991
1993
1995
1997
1999
2001
2003
2005
2007
2009
2011
5-Year Average Growth Rate

Concerns and challenges in Agriculture--Green Revolution technology mainly benefited the
high potential and irrigated areas. They have less impact on dry land and rainfed areas. Also, yield growth plateaued in the irrigated areas. Technology fatigue.
---With urbanization and income growth, consumption patterns have shifted from cereals to non-cereal food (pulses, edible oils, fruits, vegetables, dairy and other livestock, fisheries)
-- Supply of these commodities are in short supply compared to demand. As a result food inflation increased in recent years
-- Deceleration in growth from 3.5% during 1981-97 to 2% during 1997-2005. Decline in yield growth.

--This led to rising rural distress and also farmers’ suicides.
--Disparities in growth across regions and crops: growth rate declined more in rainfed areas.
Long term factors: Steeper decline in per capita land availability.
Shrinking of farm size Slow reduction in share of employment (still 55%) Main problem is low land and labour productivity in
agriculture. Gap between agri. and non-agri. is widening.

What are the reasons for slow growth in agri. during mid-1990s to mid-2000s Steering Group for 11th Plan had estimated sources of growthSources of growth: Five factors: (a) Public invest. (b) private invest. (c) Technology; (d) diversification (e) fertilizerThere has been slowdown in all these factorsTerms of trade also declinedHigher growth in the post-reform period only in the case of agricultural credit
4% growth in agri. During 2004-08. Record foodgrain production during 2008-09 (241 m.t.). Exports in cotton, rice and sugar till 2008.
Revolution in cotton. Cotton prod. doubled in six years. Some positive signs on bio technology (BT cotton). Success in hybrid maize.
Some increase in high value agriculture Some rainfed regions showing high growth in
agri: Bihar. Gujarat showed 9% growth in agri.2001-09
Comfortable buffer stocks; 60 million tonnes Terms of trade in agri. improved

Industrial growth slowed down to 2.9 % during 2011-12, ◦ weak demand for consumer durables, ◦ deceleration in external demand and ◦ subdued investment
In 2012-13, growth in the index of industrial production (IIP) witnessed a slowdown to 1.1 per cent largely due to - infrastructure and input constraints, - rising costs and - moderation of external demand

Contraction in capital goods- Subdued Investment Climate
The growth of the manufacturing sector remained highly concentrated.
Of the 22-major industry groups, the fastest growing top five manufacturing industries had the largest contribution (of 169%)
Shortage of power was a major constraining factor for the growth of the industrial sector.
Growth in electricity generation decelerated during 2012-13 to 4.0 per cent from 8.2 per cent in the year before. The gap between requirement and availability of power increased to 8.7 per cent during the period.

Dismal growth in IIP◦ cumulative growth for the period April-October
2013-14 over the corresponding period of the previous year stands at 0.0%.
Important industries such as machinery and equipment, basic metals, fabricated metal products, computing machinery, food products and motor vehicles registered contraction in output during the period.
Mining Manufacturing
Electricity General
2012-13
2013-14
2012-13
2013-14
2012-13
2013-14
2012-13
2013-14
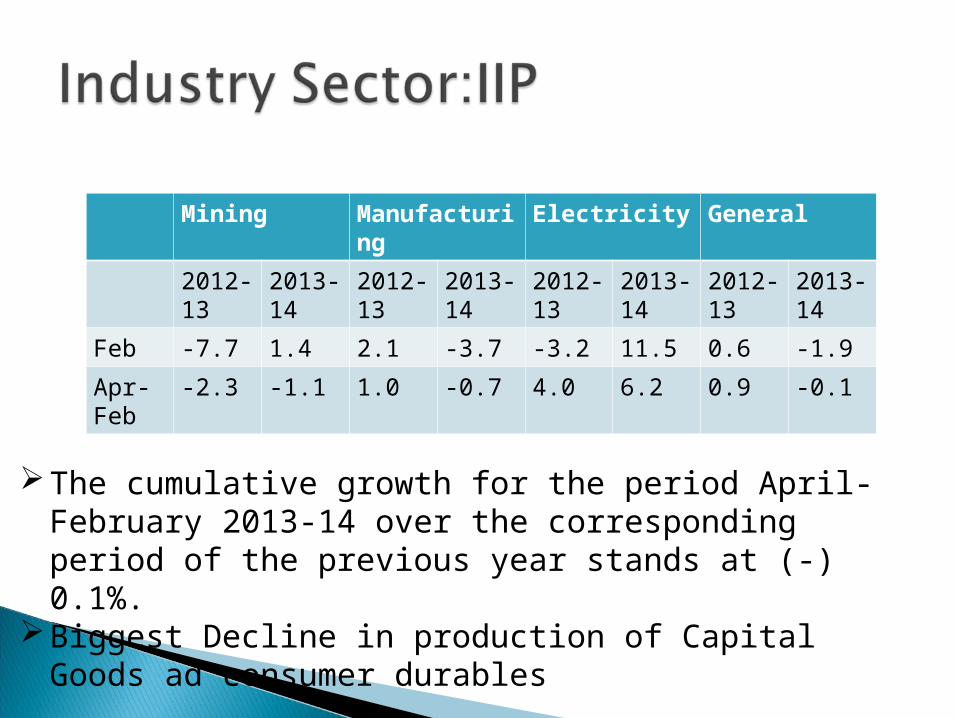
Feb -7.7 1.4 2.1 -3.7 -3.2 11.5 0.6 -1.9
Apr-Feb
-2.3 -1.1 1.0 -0.7 4.0 6.2 0.9 -0.1
The cumulative growth for the period April-February 2013-14 over the corresponding period of the previous year stands at (-) 0.1%.
Biggest Decline in production of Capital Goods ad consumer durables

At 6.5%, the services sector registered its lowest growth in 11 years during 2012-13. (80% contribution to growth)
Largely due to the weak performance of ‘trade, hotels, transport, storage and communication’ sector.
Contraction of the industrial sector and weak demand conditions have constrained the growth of the services sector.

Average WPI inflation over the five year period 2003-04 to 2007-08 was about 5.5 %.
Headline WPI inflation, which was negative in June-July 2009, rose sharply beginning October 2009.
WPI peaked at 10% in September 2011, WPI started moderating starting December 2011. But still above acceptable levels.

WPI inflation has stayed around 7.5 per cent from 2012-13 . This reflects a combination of factors: the spillover impact from fiscal imbalances, some pass-through from earlier exchange rate depreciation and feeble supply response.
Persistence in the non-food manufactured products inflation, even as growth has slowed, has emerged as a concern.
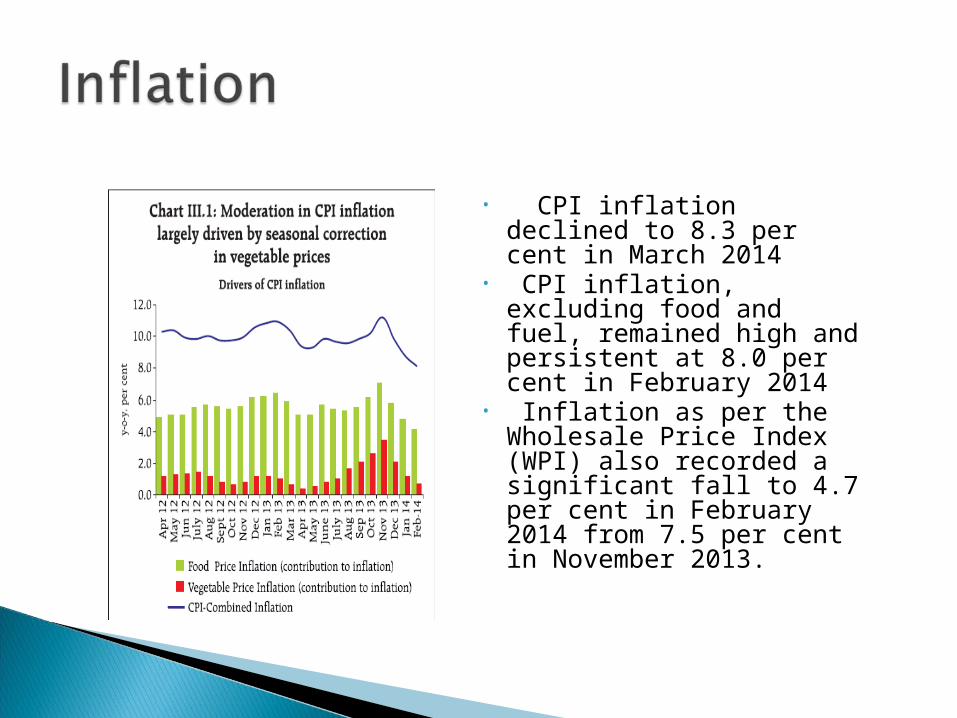
• CPI inflation declined to 8.3 per cent in March 2014
• CPI inflation, excluding food and fuel, remained high and persistent at 8.0 per cent in February 2014
• Inflation as per the Wholesale Price Index (WPI) also recorded a significant fall to 4.7 per cent in February 2014 from 7.5 per cent in November 2013.

Food inflation remains close to double digits. ◦ Both cyclical and structural factors are responsible. ◦ Protein food inflation nearly 15% , vegetable prices
Fiscal deficit is bad for a number of reasons. It also exacerbates inflation. ◦ Even as investment has moderated, consumption remained
strong benefitting from fiscal expansion. Fiscal deficit is adding to consumption demand.
◦ Note that rural wages have gone up by 20% (10% in real terms)
◦ In an economy with per capita income of $1500, any increase in income translates quickly to consumption

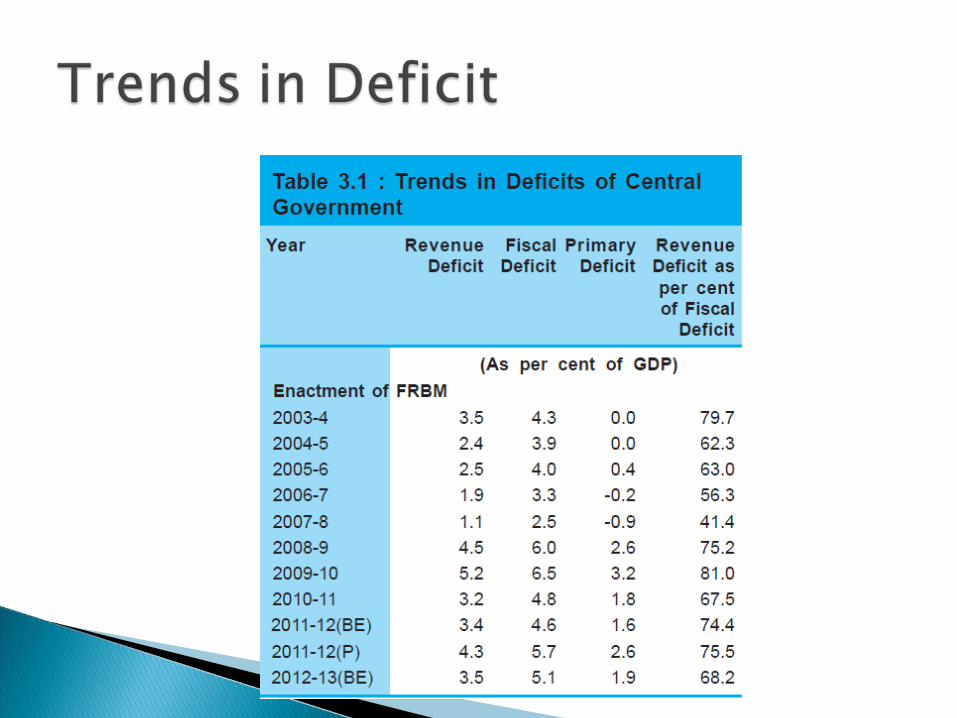

High deficit Quality of Deficit


The deficit indicators of the central government widened significantly during 2013-14.
Low growth of the centre’s net tax revenue on the one hand and a significant increase in revenue expenditure on the other increased the revenue deficit of the central government, which has already reached 87.4 per cent of budget estimates.
The widening of revenue deficit coupled with higher capital expenditure resulted in a gross fiscal deficit of 74.6 per cent of budget estimates during the 5-month period

In the United Nations Millennium Summit in 2000, 147 countries adopted MDGs◦ Eradicate extreme poverty and hunger by half
relative to 1990◦ Achieve universal primary education ◦ Promote gender equality and empower women◦ Ensure environmental sustainability◦ Reduce child mortality by two thirds relative
to 1990◦ Improve maternal health, including reducing
maternal mortality by three quarters relative to 1990
◦ Prevent the spread of HIV/ AIDS, malaria and other diseases
◦ Develop a global partnership for development

Revised Methodology- Tendulkar Committee Report
1990 poverty 47.8% Target 2015 is 23.9% With the new method applied to the earlier
years, it shows that the percentage of the population in poverty declined from 45 per cent in 1993-94 to 37 per cent in 2004-05.
In 2009-10, the all-India HCR has declined from 37.2% in 2004-05 to 29.8%,
2011-12 poverty declined to 21.9%
Rural poverty declined from 41.8% to 33.8% and urban poverty declining from 25.7% to 20.9%.

Bihar : 41.4% (36.9 m) Chhattisgarh : 40.9% (9.09 m) Jharkhand : 40.3% (11.64 m) M.P. : 38.3% (24.96 m) Orissa : 46.4% (17.85 m) Rajasthan : 22.1% (13.49 m) U. P. : 32.8% (59 m)
% of people in social groups below national poverty line –◦ Scheduled Caste: 36.8%◦ Scheduled Tribe: 47.2%◦ Other Backward Castes: 26.7%◦ Muslims: 31%
◦ Also rural urban divide
Target 1c: Reduce by half the proportion of people who suffer from hunger◦ 1.8 Prevalence of underweight children under-
five years of age
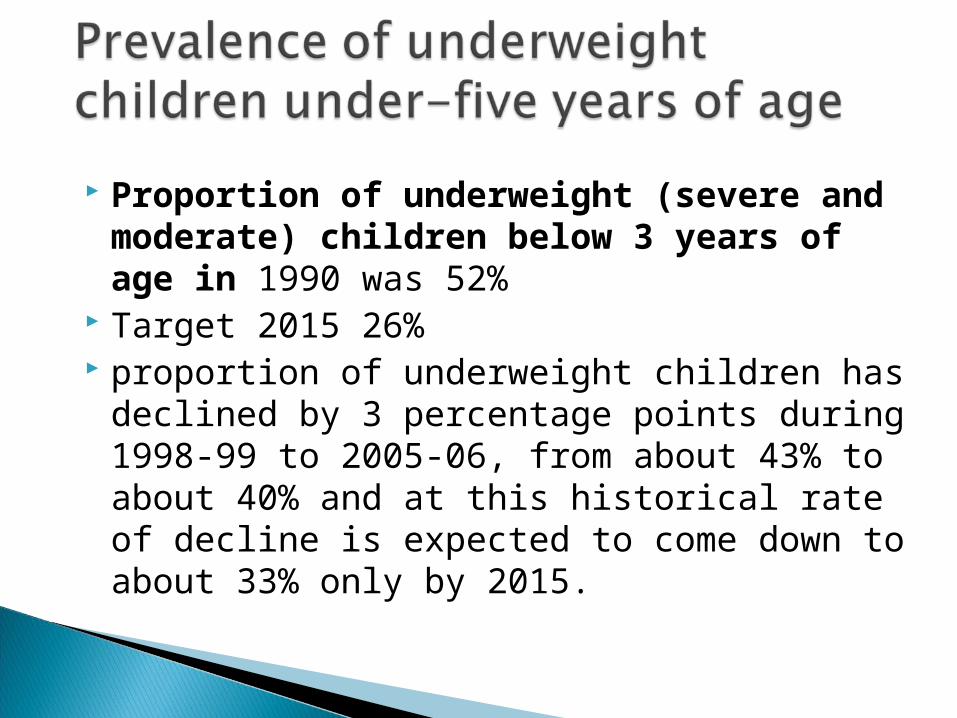
Proportion of underweight (severe and moderate) children below 3 years of age in 1990 was 52%
Target 2015 26% proportion of underweight children has
declined by 3 percentage points during 1998-99 to 2005-06, from about 43% to about 40% and at this historical rate of decline is expected to come down to about 33% only by 2015.

The proportion of population that has dietary energy consumption below 2100/2400 kcal in India tends to rise since 1987‐88 with about 64% below the norm in 1987‐ 88 increasing to 76% in 2004‐05.
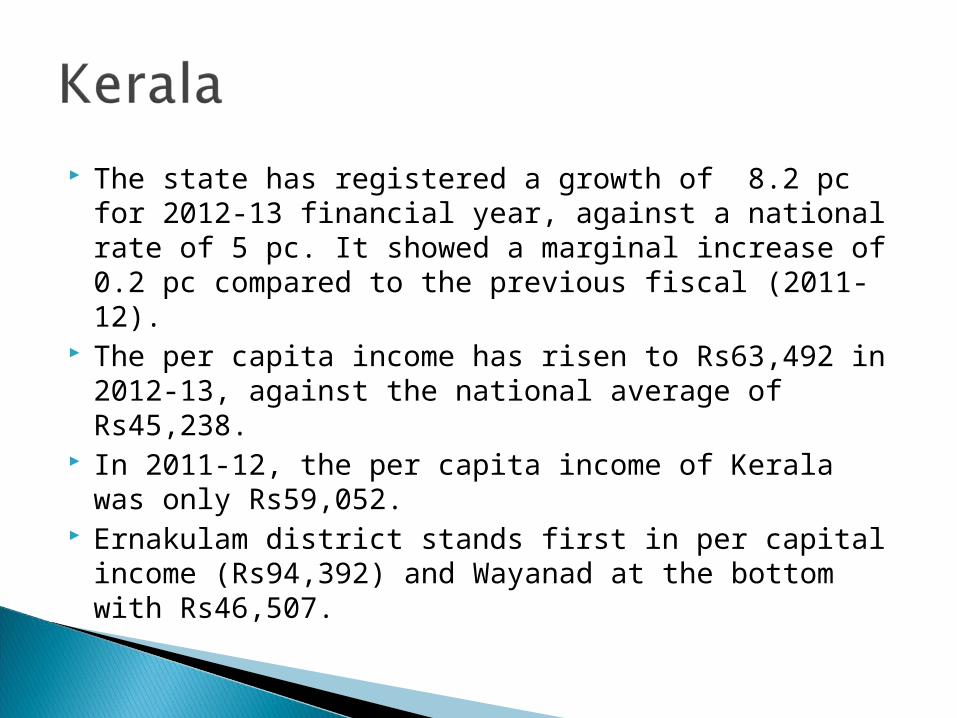
The state has registered a growth of 8.2 pc for 2012-13 financial year, against a national rate of 5 pc. It showed a marginal increase of 0.2 pc compared to the previous fiscal (2011-12).
The per capita income has risen to Rs63,492 in 2012-13, against the national average of Rs45,238.
In 2011-12, the per capita income of Kerala was only Rs59,052.
Ernakulam district stands first in per capital income (Rs94,392) and Wayanad at the bottom with Rs46,507.
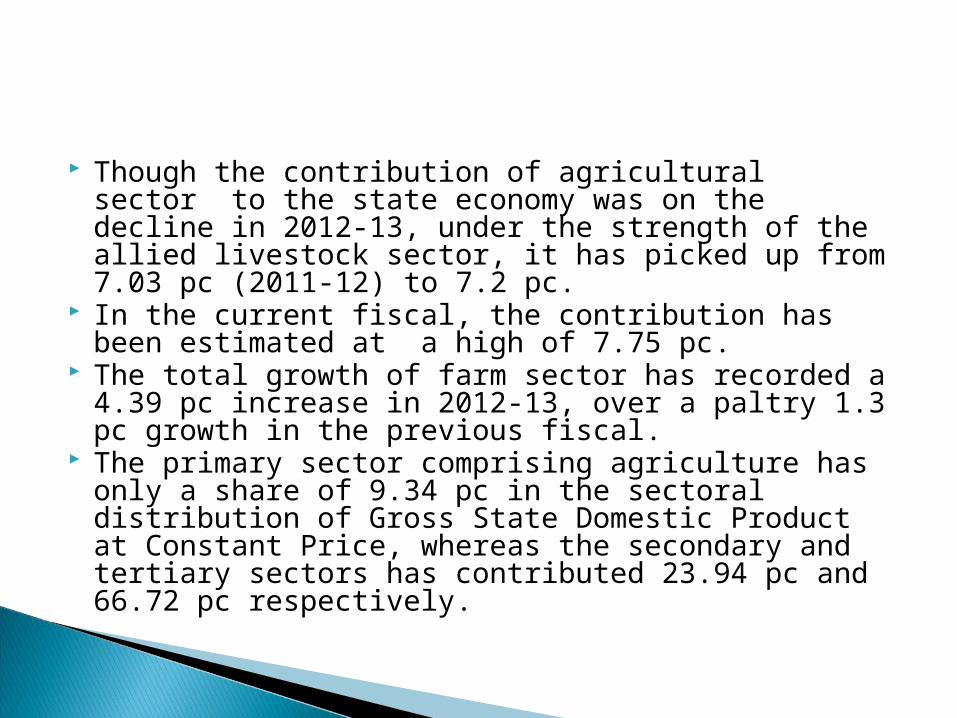
Though the contribution of agricultural sector to the state economy was on the decline in 2012-13, under the strength of the allied livestock sector, it has picked up from 7.03 pc (2011-12) to 7.2 pc.
In the current fiscal, the contribution has been estimated at a high of 7.75 pc.
The total growth of farm sector has recorded a 4.39 pc increase in 2012-13, over a paltry 1.3 pc growth in the previous fiscal.
The primary sector comprising agriculture has only a share of 9.34 pc in the sectoral distribution of Gross State Domestic Product at Constant Price, whereas the secondary and tertiary sectors has contributed 23.94 pc and 66.72 pc respectively.

Kerala has the highest effective literacy rate of 94 per cent among Indian states.
The sex ratio ( number of females per thousand males ) of Kerala according to census 2011, has improved by 26 points to reach 1084.The sex ratio of Kerala was 1022 in 1961.
, Among the districts Kannur has the highest sex ratio(1136) (1132). followed by Pathanamthitta While
(1006) , Idukki has the lowest score Ernakaulam is 1027. just above with All the districts have the index
1000. above