Embed Size (px)
Citation preview
Dynamic Contrast-Enhanced MR Perfusion Kumar et al. THIEME
30
Assessment of Blood–Brain Barrier Integrity in Tuberculous Meningitis Using Dynamic Contrast-Enhanced MR Perfusion Shruti Kumar 1 Paramjeet Singh 1 Sameer Vyas 1 Manish Modi 2 Vivek Agarwal 1 Manoj Kumar Goyal 2 Naveen Sankhyan 3
1 Department of Radiodiagnosis and Imaging, Post Graduate Institute of Medical Education and Research (PGIMER), Chandigarh, India
2 Department of Neurology, Post Graduate Institute of Medical Education and Research (PGIMER), Chandigarh, India
3 Department of Pediatric Neurology, Post Graduate Institute of Medical Education and Research (PGIMER), Chandigarh, India
Address for correspondence Paramjeet Singh, MD Radiodiagnosis , Department of Radiodiagnosis and Imaging, Post Graduate Institute of Medical Education and Research (PGIMER) , Chandigarh160012 , India (e-mail: [email protected] ) .
Objective Tuberculous meningitis (TBM) is the most common form of central nervous system tuberculosis. The aim of the study was to quantitatively evaluate blood–brain barrier (BBB) perfusion changes in TBM patients using dynamic contrast-enhanced (DCE) MR perfusion. Methods and Material Thirty untreated patients of TBM and 10 healthy controls were prospectively evaluated by conventional imaging and DCE MR perfusion. Mean permeability indices— K trans and Ve—were calculated from multiple regions of interest (ROIs) placed in basal cisterns and comparison was done between the patients and controls. Results The permeability indices were significantly higher (where p < 0.001) in cisterns of TBM patients who showed basal meningeal enhancement when compared with healthy controls. Significant differences in permeability were observed between “enhancing” cases and controls as well as in “enhancing” cases when compared with the “non-enhancing” cases. However, no significant difference was observed in the mean cisternal value between “non-enhancing” cases and the controls. K trans with a cutoff value of > 0.0838 had 81.6% sensitivity and 78.6% specificity in differentiating cases and controls while V e mean value with a cutoff value of 0.0703 showed 86.8% sensitivity and 91.4% specificity in predicting the permeability difference between the cases and controls. Conclusion DCE MR perfusion is useful in the quantitative measurement of disrup-tion of BBB and perfusion alterations in patients of TBM.
Abstract
DOI https://doi.org/10.1055/s-0041-1729119ISSN 0971-3026
© 2021. Indian Radiological AssociationThis is an open access article published by Thieme under the terms of the Creative Commons Attribution-NonDerivative-NonCommercial-License, permitting copying and reproduction so long as the original work is given appropriate credit. Contents may not be used for commercial purposes, or adapted, remixed, transformed or built upon. (https://creativecommons.org/licenses/by-nc-nd/4.0/).Thieme Medical and Scientific Publishers Private Ltd. A-12, Second Floor, Sector -2, NOIDA -201301, India
Indian J Radiol Imaging 2021;31:30–36.
Keywords ► blood–brain barrier ► MR perfusion ► tuberculous
meningitis
Original Article
Published online: 2021-06-01

31Dynamic Contrast-Enhanced MR Perfusion Kumar et al.
Indian Journal of Radiology and Imaging Vol. 31 No. 1/2021 ©2021. Indian Radiological Association.
IntroductionCentral nervous system (CNS) infection due to TB includes two clinical categories: tuberculous meningitis (TBM) and parenchymal disease of brain and spine.1 TBM remains the commonest cause of chronic meningitis in developing coun-tries like India. TBM is the most lethal form of extrapulmo-nary TB and remains a major global health problem with a high mortality rate.2 Prompt diagnosis and institution of proper treatment is essential because the clinical outcome depends greatly on the stage at which treatment is initiated. The causative organism of TBM is Mycobacterium tuberculo-sis, which spreads via hematogenous route to the meninges as well as brain parenchyma. The dissemination occurs from the lungs which is the primary source of infection in majority of the cases. Following this, multiple tubercular granulomas are formed in the subpial location of the brain. The tubercu-lar bacteria are released in the CSF after their rupture which leads to the pathogenesis of TBM. The hallmark of TBM is meningeal inflammation and formation of thick gelatinous exudates in the basal parts of the brain.3,4
Meningeal inflammation in TB is attributed to inflamma-tory cytokines and chemokines as well as factors released by the infectious organisms which lead to disruption of blood–brain barrier (BBB).5-7 Methods to quantitatively measure the disruption of BBB and the ongoing inflammation have been limited in the past, owing to the complexity of the techniques involved. Hitherto, MRI in meningitis is used to demonstrate meningeal enhancement and other intracra-nial complications associated with the disease.8,9 dynamic contrast-enhanced magnetic resonance (DCE MR) perfusions and their physiological indices of permeability (Ktrans) and leakage (Ve) give information related to the integrity of BBB and changes in the extravascular extracellular space and help in the quantitative measurement of BBB disruption, which is not possible by routine post-contrast T1-weighted MRI.10-12 We have tried to highlight MRI’s capability to pro-vide quantitative data on BBB functionality in patients of TB meningitis by acquiring quantifiable permeability parame-ters. We hypothesize that leakiness of BBB in TBM leads to perfusion changes which can be measured quantitatively using DCE perfusion MR imaging.
Materials and MethodsPatientsThis was a prospective study performed in a tertiary care hospital with Institutional ethical clearance in which 30 consecutive patients with clinical diagnostic criteria of TB meningitis were included. Taking the clinical picture, CSF changes, and the presence of extra neural TB into account, diagnostic criteria for TBM, modified from Ahuja et al, were used.13 The criteria included clinical picture of meningitis like fever, headache, vomiting, neck stiffness, altered mentation, etc., along with supporting CSF evidence of the disease (high protein, low glucose and raised lymphocytes, and acid fast bacilli), and presence of extra neural site of tuberculosis as evidenced by appropriate mycobacterial tests and radiology,
along with response to antituberculosis therapy (ATT). The gold standard for confirmation in our study was TB PCR of CSF samples and only those patients who tested positive were included in the final study.
Informed and written consent was taken from all the patients or guardians before the study. All patients were eval-uated for their demographical profile (age and sex), clinical symptoms (seizure, fever, signs of meningitis, etc.) and lab-oratory findings. Only those cases of TBM were included in the study who had either not been started on ATT or were in early stage of empirical treatment (< 2 weeks) on the basis of clinical findings, on the assumption that short period of treatment would not alter the permeability characteristics. Apart from the patients, we also included 10 controls in our study who underwent brain MRI for nonspecific complaints and were found to have normal structural brain MRI findings. These were patients who underwent MRI brain for other clinical conditions like headache, vertigo, and neuropsychiat-ric illnesses; and were found to have normal structural brain MRI findings. Informed and written consent was taken from all the controls as well.
MRI ProtocolAll patients underwent DCE MRI using a dedicated 16 element head coil at1.5T MR Unit (Siemens, Magnetom Aera; Siemens Healthcare, Erlangen, Germany). DCE was per-formed after acquiring routine brain sequences. DCE imaging was performed using a three-dimensional-spoiled gradient recalled echo (3D-SPGR) sequence (repetition time or TR: 4.65 milliseconds; echo time or TE: 1.6 seconds; field of view (FOV): 230 × 100; matrix: 230 × 230; flip angle of 12 degrees; slice thickness: 3.6). At the fourth acquisition, gadolin-ium contrast agent gadodiamide (Gd-DTPA-BMA), at a dose of 0.1 mmol/kg of body weight was administered intrave-nously at a rate of injection of 2.5 to 3 mL/s (using an MR com-patible power injector, MEDRAD, Spectris Solaris EP), followed by a bolus injection of 15 to 20 mL saline flush. A total of three series were acquired. To calculate the baseline T1 relaxation time per pixel (baseline T1 map), two T1 reference series with different flip angles (2 and 15 degrees, respectively) were acquired. The two-reference series were identical to the DCE series in terms of field of view, orientation, resolution, slice thickness, number of slices with a TR of 3.79 milliseconds and TE of 1.38 milliseconds. A DCE series was acquired with 40 dynamics, with high temporal resolution and flow artifact reduction.
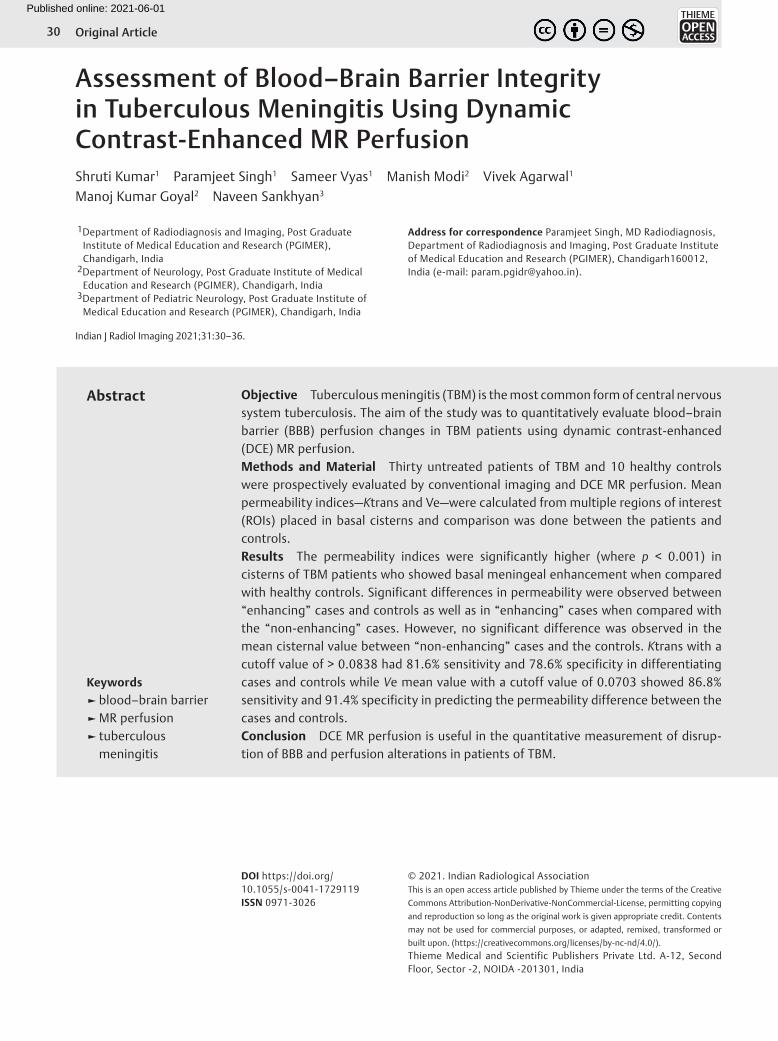
Image Processing and AnalysisParametric maps that reflected different permeability indices were generated on the Syngo MR workplace for post-processing. Bilateral symmetrical region of interests (ROIs) were placed on seven regions (area: 2–2.5 cm2) of the brain (►Fig. 1): (1) Suprasellar cistern; (2) Interpedun-cular cistern; (3) Prepontine cistern; (4) Ambient cistern; (5) Bilateral sylvian fissures (right and left); (6) Quadrigeminal cistern. Two ROIs were placed symmetrically in each of the areas described above and a mean of those two ROIs was taken. Detailed analysis of the parametric maps was done,

32
Indian Journal of Radiology and Imaging Vol. 31 No. 1/2021 ©2021. Indian Radiological Association.
Dynamic Contrast-Enhanced MR Perfusion Kumar et al.
and the mean permeability indices were accordingly calcu-lated. This was done by an independent observer who was blinded to the clinical data. The pharmacokinetic calculation was done on a pixel-by-pixel basis using a two-compartment model. The calculation was done based on the Extended Tofts Model.14 The results were provided as parametric maps and in tabular form. The perfusion parameters consisting of Ktrans, Ve thus obtained at the end of the study were ana-lyzed to look for BBB disruption as a result of meningeal inflammation. DCE MR perfusion results were interpreted by two experienced neuroradiologists having 15 and 10 years of experience, respectively.
Statistical AnalysisAnalysis was conducted using IBM SPSS statistics (version 22.0). All statistical tests were two-sided and were performed at a significance level of α = 0.05. Mann–Whitney test for comparison of permeability indices between two groups (cases vs. controls, basal enhancement vs. controls, no basal enhancement vs. controls) was made for each ROI. Receiver operating characteristic (ROC) curves were calcu-lated to find maximal cutoff values of permeability indices by plotting of sensitivity versus specificity.
ResultsThere were 20 males and 10 females with age ranged from 11 to 68 years (mean age: 29.5 years). Nine patients in their early stages of the disease presented with fever, headache, neck stiffness, vomiting, etc. Thirteen patients showed focal neurological deficits in addition to the above-mentioned symptoms while eight cases were brought in
comatose state (►Table 1 showing clinical findings in the patients). Distributions of structural MRI changes are shown in ►Table 2 and distributions of location of basal exudates are shown in ►Table 3. The basal cisterns showed variable enhancing exudates in 17 patients. Tuberculomas were seen in 17 patients. Hydrocephalus was seen in 16 patients. Cerebral infarction was seen in 14 patients. Convexity/lep-tomeningeal enhancement was seen in only eight patients. Ten cases showed basal exudates in interpeduncular cistern, eight in suprasellar cistern, and seven in ambient cistern. Five cases showed basal exudates in the sylvian fissures, five in prepontine, and three in quadrigeminal cisterns.
Comparison of mean permeability indices: among the cases analyzed, the mean cistern Ktrans ± SD value for patients showing visible meningeal enhancement (“enhanc-ing cases”) was 0.1382 ± 0.06636 while the mean cisternal Ve ± SD value was 0.2841 ± 0.22813 and showed higher permeability (►Fig. 2). The mean cisternal Ktrans ± SD value for patients not showing visible meningeal enhance-ment (“non-enhancing cases”) was 0.0506 ± 0.05279 while the mean cisternal Ve ± SD value was 0.0403 ± 0.05074 and showed lower permeability (►Fig. 3). Among the controls analyzed, the mean cisternal Ktrans ± SD value was 0.0566 ± 0.0686 while the mean cisternal Ve ± SD value was 0.0331
Fig. 1 Axial MR images showing placement of ROIs in the basal cis-terns. Bilateral symmetrical ROIs were placed in the following basal cisterns-suprasellar cistern (A), interpeduncular cistern (B), ambient cistern (C), prepontine cistern (D), quadrigeminal cistern (E), and bilateral sylvian fissures (F). MR, magnetic resonance; ROI, region of interests.
Table 1 Clinical findings in the patients
Clinical features Number of patients
Fever, headache, vomiting, neck stiffness (stage 1)
9
Meningeal signs associated with focal neurological deficit (stage 2)
13
Comatose (stage 3) 8
Table 2 Distribution of structural MRI changes
Structural MRI changes Number of patients
Basal exudates 17
Tuberculomas 17
Hydrocephalus 16
Cerebral infarction 14
Convexity enhancement 8
Table 3 Distribution of location of basal exudates
Location of basal exudates Number of patients
Interpeduncular 10
Suprasellar 8
Ambient 7
Sylvian fissures (right, left) 5
Prepontine 5
Quadrigeminal 3

33Dynamic Contrast-Enhanced MR Perfusion Kumar et al.
Indian Journal of Radiology and Imaging Vol. 31 No. 1/2021 ©2021. Indian Radiological Association.
± 0.04179 and also showed lower permeability (►Fig. 4). The mean cisternal permeability indices analyses among the cases as well as the controls are summarized in ►Table 4. Statistically significant difference in the permeability indices was observed (p < 0.001) between “enhancing cases” versus the controls. There was also statistically significant difference in the permeability indices (p < 0.001) between “enhancing cases” versus “non-enhancing cases,” but no statistically significant difference as observed in any of the permeability indices between “non-enhancing” cases versus the controls. ROC curve analysis (►Fig. 5) showed Ktrans with a cutoff value of > 0.0838 had 81.6% sensitivity and 78.6% specificity in differentiating cases and controls, while Ve with a cutoff value of > 0.0703 had 86.8% sensitivity and 91.4% specificity in differentiating cases and controls (►Table 5). Statistically significant positive correlation was seen between clinical
Fig. 2 Perfusion changes in patient with “enhancing” basal exudates: 21-year female presented with complaints of headache and signs of meningeal irritation. T2W (A) image shows dilated temporal horns of bilateral lateral ventricles with hypointense exudates in the suprasel-lar cistern (black arrow). T1 post contrast (B) image shows thick basal exudates involving the suprasellar cistern (white arrow). Physiological map (C) shows (mean Ktrans 0.254 minute–1 and mean Ve 0.482) high permeability of contrast in the cistern. Signal intensity-time curve (D) shows increased intensity above the baseline.
Fig. 3 Perfusion changes in patient with “non-enhancing” basal cisterns: 35-year male presented with headache, fever, and altered sensorium. CSF PCR was positive for Mycobacterium tuberculosis. T2W (A) image shows normal appearing prepontine cistern (black arrow). T1 post contrast (B) image shows no enhancement in the prepontine cistern (white arrow). Physiological map (C) shows (mean Ktrans 0.047 minute–1 and mean Ve 0.067) low permeability of con-trast in the cistern. Signal intensity–time curve (D) of the cistern shows reduced intensity with flattened baseline. CSF, cerebrospinal fluid; PCR, polymerase chain reaction.
Fig. 4 Perfusion changes in control: 17-year female presented with neuropsychiatric complaints. Contrast-enhanced MRI brain was nor-mal. T2W (A) image shows normal suprasellar cistern (black arrow). T1 post contrast (B) image shows no enhancement in the suprasellar cistern (white arrow). Physiological map (C) shows low permeability of contrast in the cistern (solid white arrow). Signal intensity–time curve (D) shows flattened curve with reduced perfusion. MRI, mag-netic resonance imaging.
Table 4 Mean Ktrans and Ve values in cases and controls and their statistical significance (p-value <0.001 in differentiating between “enhancing” cases and controls as well as between “enhancing” cases and “non-enhancing” cases; Note nonsignificant p-value between “non-enhancing” cases and controls)
Patient category Ktrans mean ± SD Ve mean ± SD
“Enhancing” cases 0.1382 ± 0.06636 0.2841 ± 0.22813
“Non-enhancing” cases
0.0506 ± 0.05279 0.0403 ± 0.05074
Controls 0.0566 ± 0.06867 0.0331 ± 0.04179
Abbreviation: SD, standard deviation.

34
Indian Journal of Radiology and Imaging Vol. 31 No. 1/2021 ©2021. Indian Radiological Association.
Dynamic Contrast-Enhanced MR Perfusion Kumar et al.
staging and Ve mean (where p < 0.05). No significant correla-tion was seen between clinical staging and Ktrans mean in our study.
DiscussionDCE MRI-derived permeability indices provide information about the distribution of contrast in the pathological tissues and thus the functional and structural composition of the tis-sues and integrity of BBB. BBB disruption and leakiness are increasingly being recognized in various pathological con-ditions like stroke, multiple sclerosis, dementia, infections, and intracranial tumors.12,15-19 Limited literature is available on the role of DCE MRI in assessing the integrity of BBB in infective conditions. We found highly significant difference (p < 0.001) in the permeability values of “enhancing cases” and normal controls. Some authors have used permeability indices to distinguish between various intracranial patholo-gies. Singh et al showed statistical significance between var-ious intracranial space occupying lesions using physiological perfusion indices.20 They found that the mean Ktrans as well as the mean Ve values were significantly higher in tubercu-lomas compared with gliomas. Another study by Haris et al used mean Ktrans and mean Ve in the differentiation of infec-tive lesions from neoplastic lesions and found significantly higher permeability indices in infective lesions18 Recently, Haris et al have performed DCE-MRI in 13 patients with brain tuberculomas and have found a significant positive correlation between Ktrans and matrix metalloproteinase
9 (MMP-9) expression, which is a marker of BBB disruption in excised tuberculomas.10 Correlation between Ktrans and MMP-9 suggests that Ktrans can be used as a marker of BBB disruption. In another study, Haris et al showed a decrease in Ktrans at the end of 4 months of ATT in the patients of brain tuberculomas who showed either clinical or imaging improvement or were clinically stable. The serial decrease in Ktrans suggested a gradual reduction in BBB permeability owing to the low expression of inflammatory mediators in response to treatment.14 Brandt et al in their experimental model on rats affected by pneumococcal meningitis demon-strated increased vascular permeability in cases of rats affected by meningitis. Following intracisternal infection of rats with Streptococcus pneumoniae, dynamic MRI was used to assess BBB permeability and subsequently obtain cerebral perfusion. The BBB permeability as well as the ven-tricular size was significantly increased among the infected rats. The evolution of the disease was also followed with MRI with increasing breakdown as the disease progressed.11 Their study used semiquantitative techniques like signal intensity profiles for the analysis of cases. They found sig-nificant differences in perfusion between cases and controls. Our study not only corroborated the findings of their exper-imental model but also gave quantitative values to the men-ingeal enhancement. The most important mediator in loss of BBB integrity in cases of TBM is vascular endothelial growth factor (VEGF).10,21 Due to BBB disruption, there is increased leakiness of the contrast material into the cerebral microvas-culature which is responsible for significant increase in the permeability indices in the pathological tissues affected by TBM as compared with the controls.
The degree of breakdown of BBB also differed within the subset of cases as was demonstrated by the significant differences in permeability parameters between “enhancing cases” compared with the “non-enhancing” ones. This differ- ence was noted because the kinetics of meningeal inflam-mation is such that it progresses with the course and severity of the disease. Hence, early stages of disruption of BBB with no visible contrast enhancement on routine MRI sequences did not show raised permeability indices. On the other hand, with increase in organization of the exu-dates and more severe neuroinflammation, we noted visible meningeal enhancement as well as significantly raised per-fusion parameters. We did not find any significant difference in the mean cisternal value between “non-enhancing” cases and the controls. These findings can be explained by the fact that in early stages of pathogenesis of the disease, the disruption of BBB has just started, and it takes some time before florid inflammation sets in. Hence, in the early course of the disease, visible contrast enhancement is not noted on routine MRI sequences and there are subtle perfusion alter-ations which are not significant when compared with nor-mal healthy controls. Although DCE MRI is a useful sequence as it provides quantitative data on BBB functionality, its role needs to be explored further in cases showing low levels of BBB disruption. Hence, more work needs to be done in this field to determine the role of DCE-derived variables in quan-tifying perfusion alterations before structural changes are
Fig. 5 ROC curve displaying the capability of Ve mean and Ktrans mean in differentiating between cases and controls. ROC, receiver operating characteristic.
Table 5 Diagnostic performance of Ktrans and Ve for differen-tiation between cases and controls
Variable (mean)
Cut-off Sensitivity Specificity
Ktrans > 0.0838 81.6% 78.6%
Ve > 0.0703 86.8% 91.4%

35Dynamic Contrast-Enhanced MR Perfusion Kumar et al.
Indian Journal of Radiology and Imaging Vol. 31 No. 1/2021 ©2021. Indian Radiological Association.
noted in routine MRI imaging. To the best of our knowledge, it is the first study of its kind which compared the permea-bility changes in the inflamed basal meninges with clinical parameters. No significant correlation could be established between clinical staging and mean Ktrans. However, it was observed that clinical staging of the disease correlated well with DCE derived Ve mean (where p < 0.05). This can be explained by the fact that along with the upregulation of neuroinflammatory markers and recruitment of inflamma-tory cells during the course of disease, the disruption of the BBB also increases which manifests as perfusion changes in the inflamed meninges. Hence, DCE- derived Ve mean can be used as a marker for staging of the disease and can prognos-ticate the patients with respect to the clinical severity and expected outcome. However, this area needs further explo-ration as concrete evidence of a positive correlation would have ideally required significant correlations between clin-ical staging and both the permeability parameters (mean Ktrans and Ve mean) rather than with Ve mean alone. One major limitation of our study is its small sample size. As the prevalence of tuberculosis is high in our country, a larger population size would have enabled us to validate our results with greater accuracy and confidence. There is also lack of histopathological confirmation of the final diagnosis. In our study, we also recruited patients who were in early stage of treatment (< 2 weeks), based on assumption that short period of treatment would not alter the permeability characteristics of the inflamed basal meninges. However, subtle alterations in permeability parameters because of the commencement of the treatment could not be accounted for in our study. Temporal changes in permeability parameters were also not evaluated as all the patients could not be fol-lowed up.
ConclusionAlthough DCE MRI has diverse applications in brain imaging, its role in the quantitative measurement of BBB integrity in infectious lesions and meningitis is still not well established. We conclude that DCE MR perfusion is useful in the quanti-tative measurement of disruption of BBB and perfusion alter-ations in patients of TBM. It makes it possible to differentiate between infected individuals and healthy controls more objectively than routine contrast-enhanced MRI. However, its role is limited in cases with low level of BBB disruption and minor inflammatory changes that occur in early stages of disease. DCE MRI may play a promising role in the assess-ment of BBB integrity in cases of TBM which in future could have a role in prognostication of patients and in optimization of therapeutic strategies in patients of TBM.
Ethical ApprovalAll procedures performed in the studies involving human participants were in accordance with the ethical stan-dards of the institutional and/or national research com-mittee and with the 1964 Helsinki Declaration and its later amendments or comparable ethical standards.
Informed ConsentInformed consent was obtained from all individual partic-ipants included in the study.
Financial Support and SponsorshipNone.
Conflicts of InterestNone declared.
References
1 Shirani K, Talaei Z, Yaran M, Ataei B, Mehrabi-Koushki A, Khorvash F. Diagnosed tuberculous meningitis using cerebro-spinal fluid polymerase chain reaction in patients hospital-ized with the diagnosis of meningitis in referral hospitals in Isfahan. J Res Med Sci 2015;20(3):224–227
2 Kashyap RS, Agarwal NP, Chandak NH, et al. The applica-tion of the Mancini technique as a diagnostic test in the CSF of tuberculous meningitis patients. Med Sci Monit 2002;8(6):MT95–MT98
3 Garg RK, Malhotra HS, Jain A. Neuroimaging in tuberculous meningitis. Neurol India 2016;64(2):219–227
4 Schoeman JF, Donald PR. Tuberculous meningitis. Handb Clin Neurol 2013;112:1135–1138
5 Abbott NJ, Friedman A. Overview and introduction: the blood-brain barrier in health and disease. Epilepsia 2012;53 (suppl 6):1–6
6 Sharma S, Goyal MK, Sharma K, et al. Cytokines do play a role in pathogenesis of tuberculous meningitis: a prospective study from a tertiary care center in India. J Neurol Sci 2017; 379:131–136
7 Domingo-Gonzalez R, Prince O, Cooper A, Khader SA. Cytokines and chemokines in mycobacterium tuberculosis infection. Microbiol Spectr 2016;4(5):10
8 Abdelmalek R, Kanoun F, Kilani B, et al. Tuberculous meningi-tis in adults: MRI contribution to the diagnosis in 29 patients. Int J Infect Dis 2006;10(5):372–377
9 Sanei Taheri M, Karimi MA, Haghighatkhah H, Pourghorban R, Samadian M, Delavar Kasmaei H. Central nervous system tuberculosis: an imaging-focused review of a reemerging disease. Radiol Res Pract 2015;2015:202806
10 Haris M, Husain N, Singh A, et al. Dynamic contrast-enhanced (DCE) derived transfer coefficient (Ktrans) is a surrogate marker of matrix metalloproteinase 9 (MMP-9) expression in brain tuberculomas. J Magn Reson Imaging 2008;28(3):588–597
11 Brandt CT, Simonsen H, Liptrot M, et al. In vivo study of exper-imental pneumococcal meningitis using magnetic resonance imaging. BMC Med Imaging 2008;8:1
12 Heye AK, Culling RD, Valdés Hernández MdelC, Thrippleton MJ, Wardlaw JM. Assessment of blood-brain bar-rier disruption using dynamic contrast-enhanced MRI. A sys-tematic review. Neuroimage Clin 2014;6:262–274
13 Ahuja GK, Mohan KK, Prasad K, Behari M. Diagnostic criteria for tuberculous meningitis and their validation. Tuber Lung Dis 1994;75(2):149–152
14 Tofts PS, Kermode AG. Measurement of the blood-brain barrier permeability and leakage space using dynamic MR imaging. 1. Fundamental concepts. Magn Reson Med 1991;17(2):357–367
15 Kassner A, Roberts T, Taylor K, Silver F, Mikulis D. Prediction of hemorrhage in acute ischemic stroke using permeability MR imaging. AJNR Am J Neuroradiol 2005;26(9):2213–2217
16 Varatharaj A, Liljeroth M, Darekar A, Larsson HBW, Galea I, Cramer SP. Blood-brain barrier permeability measured using dynamic contrast-enhanced magnetic resonance imaging: a validation study. J Physiol 2019;597(3):699–709

36
Indian Journal of Radiology and Imaging Vol. 31 No. 1/2021 ©2021. Indian Radiological Association.
Dynamic Contrast-Enhanced MR Perfusion Kumar et al.
17 Starr JM, Farrall AJ, Armitage P, McGurn B, Wardlaw J. Blood-brain barrier permeability in Alzheimer’s disease: a case-con-trol MRI study. Psychiatry Res 2009;171(3):232–241
18 Haris M, Gupta RK, Singh A, et al. Differentiation of infective from neoplastic brain lesions by dynamic contrast-enhanced MRI. Neuroradiology 2008;50(6):531–540
19 Ghosh RN, Vyas S, Singh P, Khandelwal N, Sankhyan N, Singhi P. Perfusion magnetic resonance imaging in differenti-ation of neurocysticercosis and tuberculoma. Neuroradiology 2019;61(3):257–263
20 Singh A, Haris M, Rathore D, et al. Quantification of physiolog-ical and hemodynamic indices using T(1) dynamic contrast- enhanced MRI in intracranial mass lesions. J Magn Reson Imaging 2007;26(4):871–880
21 van der Flier M, Hoppenreijs S, van Rensburg AJ, et al. Vascular endothelial growth factor and blood-brain barrier disrup-tion in tuberculous meningitis. Pediatr Infect Dis J 2004; 23(7):608–613