Embed Size (px)
Citation preview

Provisional
January 16, 2012
Annual Status of Education Report (Rural) 2011

ii ASER 2011
They reached the remotest villages of India
ANDHRA PRADESH
Government DIET College, Adilabad
Government DIET College, Anantapur
Government DIET College, Chittor
Government DIET College, East Godavari
Government DIET College, Guntur
Government DIET College, Kadapa
Government DIET College, Karimnagar
Government DIET College, Khammam
Government DIET College, Krishna
Government DIET College, Kurnool
Government DIET College, Mahbubnagar
Government DIET College, Medak
Government DIET College, Nalgonda
Government DIET College, Nellore
Government DIET College, Nizamabad
Government DIET College, Prakasam
Government DIET College, Ranga Reddy
Government DIET College, Srikakulum
Government DIET College, Vishakhapatnam
Government DIET College, Vizianagaram
Government DIET College, Warangal
Government DIET College, West Godavari
ARUNACHAL PRADESH
NSS Unit of Government Higher Secondary School,
Tawang
Rupa Town Club, West Kameng
Students of Lohit College
Students of Tirap College
Tarhuk Samaj
Local Volunteers of Changlang, Dibang Valley, East
Kameng, East Siang, West Siang, Upper Siang and
Upper Subansiri
ASSAM
All India Student’s Federation (AISF), Golaghat
All India Student’s Federation (AISF), Jorhat
Assam Mahila Samata Society (AMSS), Nagaon
Assam Valley Academy (AVA)
Bhawanipur Cultural Society
Bordaulguri Socio-Economic and Health Development
Organisation (SEHDO)
Daogaphu Youth Club
Goalpara Cultural Society
Integrated Community Development Society
Kalang Kapili Integrated Development Society
Klirdap Welfare Society
Nabarun Shangha Community Centre
North East Educational Social Forum
North East Society for the Promotion of Youth and
Masses
Parijat Self Help Group
Sankalpa
Sishu Adhikar Suraksha Samiti
Social Unity Keeper’s Association for All
Society for Progressive Implementation and
Development
Udayan
Uttaran
Wodiwichee
BIHAR
Aid India
Akhil Bharatiya Gramin Vikas Parishad
Akhil Bhartiya Shikshit Berojgar Yuva Kalyan Sansthan
Akriti Samajik Sansthan
All India Centre For Urban And Rural Development
An Unit Of Research
Chhatrachhaya
Dalit Mukti Mission
Disha Bihar
Garima Samaj Vikas Sansthan
Harijan Sewa Samiti
Islahe Ummat
Jan Kalyan Kendra
Jawahar Jyoti Bal Vikas Kendra
Nav Jeevan Ambedkar Mission
Nav Jivan Manav Uthan Kendra
Pandit Shree Ram Sharma Seva Sansthan
Parivesh Purn Jagran Sansthan
Popular Organization Women Empowerment &
Research Sanhauli
Pragati Bharti (Tulbul)
Prerna Development Foundation
Ram Kripal Sewa Sansthan
R-Teach Commuication
Sadbhavana Vikash Mandal
Sahyoginee
Samagra Manav Seva Samiti
Samagra Vikas evam Shikshan Sansthan
Sarv Shree Seva Sadan
Sarvodaya Yuva Kalyan Sangh
Shankar Human Advance Society for Initiative Mission
Shanti Shilp Kala Kendra
The Message Welfare Foundation
Trishna
Vidhyapati Jan Vikas Samiti
Vikash Sarthi
Local Volunteers of Madhepura
CHHATTISGARH
Adhar Svansevi Sansthan
Chhattisgarh Janjati Vikas Parishad
Government DIET College, Dhamtari
Government DIET College, Durg
Government DIET College, Janjgir Champa
Government DIET College, Kawardha
Government DIET College, Mahasamund
Gramin Vikas Seva Sansthan
Lalit Kala Manch
Nav Jivan Jankalyan Sewa Samiti
Nicchay Seva Samiti
Pahela Kadam Sewa Sansthan
Prakruti Sewa Sansthan
SROTH
Pratham Volunteers of Jashpur
DADRA AND NAGAR HAVELI
Dadra Nagar Haveli Education Department
Govt. HHS Khanvel
Govt. HHS Golonda
Govt. HHS Naroli
Govt. HHS Rakholi
Govt. HHS Silvassa
Govt. HHS Dudhani
GOA
D M C College, Mhapasa
Khemrag Memorial New English School, Bandha
Sridoracaculo college, Korli, Mhapasa, Goa
GUJARAT
Anandi, Dahod
Anandi, Panchmahal
GLS College
Gram Seva Trust
Hina & Friends Group
Innovative BSW college
J.M. Patel Institute of Social Work
K.R. Doshi MSW College
KSKSV University
Mahila Samakhya
Manav Ekta Charitable Trust
Memdabad Co-operative College
Navbharti Vikas Trust
Navratri Yuvak Mandal
Nootanbharti Gramseva Mahavidhyalay
Salal MSW College
Samarpan Foundation
Sarswati BSW College
Sarvajanik MSW College
Satkariya Seva Trust
Shikshan & Samaj Kalyan Kendra
Shree Kedareshvar Education & Charitable Trust (MSW
College)
Surbhi MSW College
Yogeshvar Yuvak Mandal
Local Volunteers of Valsad
HARYANA
All Indian Jat Heroes’ Memorial College, Rohtak
Chandan Mal Karnani College
Chaudhari Devi Lal College for Women, Murthal
DN College, Hisar
Dronacharya Govt. College
Dyal Singh College, Karnal
Government College, Barwala
Government College, Kalka
Government College, Narnaul
Government PG College, Bhiwani
Government PG College, Jind
Maharaja Agrasen Girls College, Jhajjar
MM College, Fatehabad
Mukund Lal National College
Nehru Yuva Kendra, Faridabad
Nehru Yuva Kendra, Kurukshetra
PRS Legislative Research, New Delhi
Radha Krishan College
RDS College (Girls), Rewari
Sanathan Dharam College, Ambala
SD College, Panipat
Yasin Meo College, Mewat

iiiASER 2011
HIMACHAL PRADESH
General Jorawar Singh College, Nadaun (Hamirpur)
Govt. PG College, Kullu
Govt. College, Balav, Mandi
Govt. Degree College, Nahan
Govt. Degree College, Una
Govt. Degree Collage, Kinnaur
Govt. PG College Seema (Rohru)
Govt. Degree College, Theog
Gyan Vigyan Samiti, Dharamshala
Himachal Pradesh University, Summer Hill, Shimla
Santosh Industrial Training Centre Ghumarawin
Society For Human Interest and Rural Advancement
Yuva Vikas Mandal, Jabli
ZCA Academy, Chamba
JAMMU AND KASHMIR
Govt. Degree College, Ramban
Government Degree College, Udhampur
Government DIET College, Kargil
Government PG College, Bhaderwah
Govt. Degree College, Kistwar
Govt. Degree College, Pulwama
Jehlum Education Trust College of Education,
Baramulla
Kamariya B Ed College, Srinagar
Naushera Degree College,Rajouri
Nehru Yuva Centre, Poonch
The Student’s Educational and Cultural Movement
of Ladakh
Shah-i-Hamdan College of Education, Siligam
Sheikh-ul-Alam College of Education, Kupwara
Syed Ali Memorial Educational Trust, Beerwah
Pratham Volunteers of Jammu and Kathua
JHARKHAND
Abhiyan
Chetna Vikas
Child Fund India
Diya Seva Sansthan
Gram Jyoti Kendra
Jal Swaraj
Jan Shabagi Kendra
Jana Kalyan Parisad, Pattbari
Lohardagga Gram Swaraj Sansthan
Lok Hit Sansthan
Lok Prerna Kendra
Mahila Samagra Utthan Samiti
Nav Bharat Jagriti Kendra
Rural Outright Development Society
Sahyogini
Samaj Pragati Kendra
Samajik Parivartan Sansthan
Santhal Pargana Gram Rachna Sansthan
Veer Jharkhand Vikas Seva Manch
Vikash Bharti, Bishunpur
Youth Welfare Committee
KARNATAKA
Akshara Foundation
Basaveshwara Vidya Vardhaka Sangha Rural
Development Foundation
Center for Rural Development, Bellary
Centre for Rural Studies, Manipal University
Development Association Reconstruction for Institute
DRC, Dharwad
EMBARK Youth Association, Virajapet
Institute of Social Studies And Research (ISSAR)
Janaprayathna
Malenadu Education And Rural Development Society
Navachetana Rural Development Society
Navodaya Educational and Environment
Development Service (NEEDS)
Nirantara Social Welfare Society
PADI, Mangalore
Parivarthan
People’s Organisation for Waste Land and
Environment Regeneration
Pragathi Urban and Rural Development
Priyadashini Grameen Abhivruddi Sanste
Sajjalashree SKA & GAS Lingasgur
Sarvodaya Integrated Rural Development Society
SCOPE Dharwad
Seva Society Gataprabha
SPOORTHI Samsthe
Sri Balaji Sarvodaya Central Rural & Urban
Development Trust
Sri Kantha Vidya Samsthe
Vishwabharati Trust, Anavatti
Yashaswi Swayam Seva Samsthe
Yashaswini Vividhodhesha Samaja Seva Samsthe
Pratham Volunteers of Mysore
KERALA
Government DIET College, Kollam
Government DIET College, Kozhikode
Government DIET College, Palakkad
Government DIET College, Pathanamitta
Government DIET College, Thrissur
Government DIET College, Wayanad
Government DIET College, Kannur
Kudumbashree
MADHYA PRADESH
Bahi Parshavnath Balkalyan Shikshan Samiti
Bal Pragati evam Mahila Shikshan Sansthan, Datia
Betul Upkar Gramin Vikas Sansthan, Betul
Bhimrao Jagruk Vikas Samiti
Bread For Tribal Village
Darshna Mahila Kalyan Samiti
Dhara Vikas Samiti
Dharti Gramothan evam Shabhagi Gramin Vikas
Samiti
Diksha Shaikshanik Samajik Seva Sansthan
Disha Samajik Vikas Sansthan Samiti, Shivpuri
Dr. Bhimrao Ambedkar Seva Parishad
GD Public Society, Sheopur
Gram Seva Trust, Paraswada
Gramin Swalamban Samiti
Gramin Vikas Mandal, Chhindwara
Gramm Vikash Prasfutan Samiti Pindrukhi
Gramm Vikash Prasfutan Samiti Silua
Human and culture Society (Hans), Sidhi
Jan Abhiyan Parishad
Jan Sansadhan Vikas Evam Jiv Kalyan Samiti
Jan Vikas Sansthan
Jati Yuva Mandal, Gwalior
Khandwa Mahak Education Society
Krushna Vikas evam Prakuti Prabhandhan Santhan
Lok Rujhan evam Manav Vikas Soudh Sansthan
M.P. Paryavaran Sudhar Sangathan
Ma Pitambara Lok Hit Sewa Sansthan
Matrubhumi Manav Vikas Sansthan
Narmada Welfare Society
Path Pragati Samaj Kalyan Samiti, Shahdol
Prakash Yuva Mandal Itora Samiti
Pritam Shiksha evam Samaj Kalyan Sewa Samiti
Rang Welfare Society
Reform Activities by Youth Society
Sahara Manch
Sankalp Samajik Vikas Sansthan, Shivpuri
Saress Welfare Society, Seoni
Sharda Shiksha Samiti, Shahjapur
Sharda Yog evam Prakrutik Shodh Sansthan, Umaria
Shri Atal Behari Vajpayee Govt. Art & Commerce
College
Smt Susheel Gayan Shiksha Prachar Prasar Samitee,
Guna
Swadesh Gramotthan Samiti, Datia
Swami Prakashand Samajik Sanshthan
Swar Bharti Devi Samaj Kalyan Yuva Mandal, Sagar
Synergy Sansthan
The Initiative Educational and Welfare Society
MAHARASHTRA
Sanchar Infotech Foundation
AVHAN Bahuudeshiya Santha
Disha Foundation
Dr. Babasaheb Ambedkar Smajkarya Mahavidyalaya
Gulbnabi Azad Samjkarya Mahavidyalaya
Jagat Art. Comm & IHP Science College, Goregaon
Mahatma Foundation
Model Arts & Commerce College
Nirmik Samajik Sanshodhan Va Vikas Kendra
NSS Unit, Ahmadnagar
NSS Unit, Akola
NSS Unit, Aurangabad
NSS Unit, Beed
NSS Unit, Bhandara
NSS Unit, Buldhana
NSS Unit, Dhule
NSS Unit, Hingoli
NSS Unit, Jalgaon
NSS Unit, Jalna
NSS Unit, Kolhapur
NSS Unit, Latur
NSS Unit, Nagpur
NSS Unit, Nandurbar
NSS Unit, Nashik
NSS Unit, Osmanabad
NSS Unit, Ratnagiri
NSS Unit, Sangli
NSS Unit, Satara

iv ASER 2011
NSS Unit, Sindhudurg
NSS Unit, Solapur
NSS Unit, Washim
Prahar Samajik Kalyankari Sanstha
R.C. Bidkar Mahavidyalaya
Saibaba Mahavidyalaya
Sankalp Bahuudeshiya Prakalp
Uday Bahuudesiya Sanstha
Vanchit Vikas Loksanstha Nanded
Yash Bahuudeshiya Sanstha
Pratham Volunteers of Amravati, Pune, Raigad and
Thane
MANIPUR
Action for Women and Child Development
Chingri Society
Community Development Society
Komlathabi Development Club
Kumbi Kangjeibung Mapal Fishermen Association
Our Carrom Club
People’s Development for Social Change
The Youth Goodwill Association
MEGHALAYA
Khasi Student’s Union
Local Volunteers of Jaintia Hills
Martin Luther Christian University
Ri-Bhoi Youth Federation
Williamnagar College Student’s Union
MIZORAM
Hmarveng Football Club
HS Adventure Club
JF Sporting Club
Kristian Thalai Pawl, Aizwal Branch
Kristian Thalai Pawl, Dinthar Branch, Mamit
Thalai Kristian Pawl, Kolasib Unit
Thalai Kristian Pawl, Moria Unit, Lunglei
Young Mizo Association, Kahrawt Branch, Champhai
NAGALAND
Confederation of Chang Student’s Union
Govt Primary School Teachers of Mokukchung District
Hills Club
Lesiema Student’s Union
Lotha Student’s Union
Nagaland Society
People’s Agency for Development
Walo Organisation
Working Brigade
Zunheboto Range Student’s Union
Pratham Volunteers of Dimapur
ODISHA
Abha Mahila Mandal
AMCS College
Anchalika Mahavidyala, Natha Sahi
AOMA,Malkangiri
Basudevpur ITI College
Bhairav Mahavidyalaya, Dabugan
Bhaskar Multi Action Seva Samity
Biswa Vikas
Dakhina Rourkela Unnayana Parisada
Deogarh Govt City School
Gatiswar College
Gopabundhu ITC College
Govt. Autonomous College, Bhabanipatna
Jiral College
Khaira College
Khambeswripali Mahabidyala
Khyama Meher Degree College
Maa Bhagabati Mahavidyalaya, Konark, Puri
Mahima College, Panchan Gan
Panchayat college, Baragarh
Parsuram Gurukula Mahavidyalay
Patitapaban Degree College
Phulmatin Hemram Mahavidyalay
Rural Organisation for People’s Empowerment
SADBHABANA,Keonjhar
Sailandra Narayan College
Science College, Polosara
Sidheswar Baba Anchalika Vidyalaya
Sri Ugratara College, J.K. Pur, Rayagada
Swami Arupananda Mahavidyalaya.
PUNJAB
Akalia College of Education, Faridkot
Bhramchari Club, Balachaour
D. M College of Education, Moga
Government DIET College, Sangrur
Govt Senior Secondary School, Gurdaspur
Govt Sr. Sec School, Kapurthala
Innocent B.Ed College, Jalandhar
J.D College of Education, Muktsar
Jeevan Jyoti Polytechnical College, Ferozpur
Malwa Central College of Education, Ludhiana
Mata Sahib Kaur Girls College, Tarn Taran
Nehru Yuva Kendra, Mansa
Punjabi University Campus, Mour
Regional Institute of Management and
Technology, Mandi Gobindgarh
Sahara Trust, Rajpura
Sajri Saver Club, Ropar
Shaheed Bhagat Singh Youth Club, Hoshiarpur
Sidhana Institute of Education, Amritsar
Winner Cultural and Sports Club, Mohali
RAJASTHAN
Shiv Arogya Sansthan
AIMT College
CUTs
Diamond Shikshan Prashikshan Avam Shodh
Sansthan, Makarana
Doosra Dashak
Educate Girls, Globally
Gramin Yuva Vikas Samiti
IIRM, Jaipur
LUPIN
M. L. V. PG College
Mahant Shri Ragunandan Das T.T. College
Matashree Gomati Devi Jan Sewa Nidhi
Modi Institute of Management and Technology
Parivartan Sansthan
Prashafvi B Ed College
Pratap Sansthan
Rajasthan T.T. College
Ranthambhore PG College
Sahaj Sansthan
Shekhawati B.Ed. College
Shiv Shiksha Samiti
Society for Agriculture and Rural Dovelopmet (SARD)
Society to Uplift Rural Economy
Suratgarh Educational and Social Welfare Trust
The Ankur B.Ed College
Udaipur School of Social Work
VAAGDHARA
Veena Group
Vidhya Bharti Sansthan
Pratham Voulnteers of Ajmer, Hanumangarh and
Jhalawar
SIKKIM
Govt College, Namchi
Govt College, Rhenock
Govt College, Tadong
TAMIL NADU
Aid-et-action
AVVAI Village Welfare Society
Award Trust
Council for Integrated Development (CID Trust)
Gramodhaya Social Service Society
GrassRoot
Institute of Human Rights Education
Jeeva Anbalayam Trust
Leaf Society
Manitham Charitable Trust
Needs Trust
New life for Differently Disabled Fedaration
News Trust
PRESS Trust
Raise India Trust
READ
Rights Trust
Rural Women Development Trust
SODEWS
Tamil Nadu Green Movement (TNGM Trust)
Valarum Vandavasi
VEPAGA
WORLD Trust
TRIPURA
Agragati Social Organisation
Chetna Social Organisation
Kasturba Gandhi National Memorial Trust, Tripura
Pushparaj Club
UTTAR PRADESH
Akhil Bhartiya Shrawasti Gramodyog Sewa Sansthan
Anuragini
Bhartiya Gramotthan Seva Vikash Sansthan
Devlopment of Human Enviroment and Study of
Human Activities
Disha Sewa Samiti
Grameen Development Society

vASER 2011
Gramin Mahila Kalyan Sansthan
Gramin Manav Seva evam Paryavaran Sudhar Samiti
Gramoday Seva Asharm
Gyan Sewa Samiti
Indian Gospel Charitable Society
Indian Medical Practioner Welfare Association
Jadaun Gramodhyog Seva Sansthan
Jan Kalyan Samiti
Jankalyan Shikshan Prasar Samiti
Janta Sewa Samiti
Lakshya Gramin Vikas Society
Manav Sewa Kendra
Nehru Yuva Sansthan
Nehru Yuva Mandal
New Public School Samiti
Open Sky Welfare Society
Paramlal Seva Samiti
Parmarth Gramodyog Janseva Sansthan
Saptrang Vikas Sansthan
Sarvangeen Grameen Vikas Sansthan
Sarvjan Sewa Sansthan
Savera
Sharaddha Jan Kalyan Sikshan Sewa Sansthan
Social Welfare Organization
The Help Jan Kalyan Samiti
Yuva Vikash Evam Prasikshan Sansthan
Local Volunteers of Jhansi, Devoria, Ghaziabad,
Bijnore, Etah, Mirzapur, Lucknow, J.P. Nagar, Kannauj
and Ramabai Nagar
Pratham Volunteers of Etawah, Mainpuri, Aligarh,
Agra, Mathura, Firozabad, Varanasi, Ambedkar
Nagar, Azamgarh, Jaunpur, Basti, Gorakhpur,
Bareilly, Moradabad, Meerut, Rampur, Gautam Budh
Nagar, Gonda, Bahraich, Sitapur, Pratapgarh,
Kaushambi, Rae Bareilly, Hardoi and Barabanki
UTTARAKHAND
Association for Rural Planning & Action
Dolphin (PG) Institute of Bio Medical and Natural
Sciences
Faculty of Management Studies Gurukul Kangri
University
Government Polytechnic, Kashipur, U.S. Nagar
Gram Suraxa Samiti, Manjiyali Naugaon, Uttarkashi
Gram Vikas Sansthan, Dhali
Kumaun Seva Samiti, Sitarganj, U.S.Nagar
Manav Kalyan Samiti, Ukhimath, Rudraprayag
Nav Jyoti Jan Kalyan Samiti, Kandikhal, Tehri
Omkarananda Institute of Management & Technology,
Rishikesh
P.G.College, Bageshwar
Prakhar Yuva evam Grameen Jan Jagrati Samiti
R.N.I Inter College, Bhagwanpur (Haridwar)
Society For Agriculture and Administrative Research
Swami Vivekanand Samaj Sevi Sanstha
Yuvak Mangal Dal (Samiti)
WEST BENGAL
Baharampur Krishnath College, History Department,
Baharampur, Murshidabad.
Bankura Christian College, Department of Sociology
Barddhaman Sanjog Human Social Welfare Society
Chatrya Kalyan Samity
Dakshin Dinajpur Foundation for Rural Integration
Economic and Nature Development
Gour Mahavidyalay, NSS in Charge Unit -3
Jaganath Kishore College, NSS Unit
Kajla Jana Kalyan Samity
Mainaguri College, NCC Unit
Vivekananda College, NSS UNIT
Mathabhanga College, NCC Unit
Matri O Shishu Bikash Kendra
Raiganj University College
Ramnarayanpur Kalika Sangha
St Joseph’s College
Turku Halasda Lapsa Hembrom Mahavidyalaya
University of Kalyani, Department Of Rural
Development & Management.

vi ASER 2011
Supporters of ASER 2011
Special thanks toA.P.M Mohammed HanishAnkur VajaBendangBommo KamchiBremil M. SangmaC. VanengmaweiChow NakasangD.W. WangzaDilbag SinghDimasahau Student’s UnionDipak SharmaDr Jayaprakash NarayanDr. O.P Verma, NSS Coordinator, Himachal PradeshUniversityDr. S.S. Rajagopalan, Kalvi NetworkDr. Vasanthi Devi, Kalvi NetworkDreams FoundationDwidengra BrahmaGrace ZamnuH. Pauchen PhomH. LalrinfehHaigam KauringHopeful KhongstiaJapinder Singh, Regional Institute of Management& TechnologyK.R. VariusmauiiKalaveni SrinivasKelouzie KeisiezieKerala Shasthra Sahithya ParishadKhrawboklang TansongKhukheto Y YepthomiKripendra DasL. C. Somoranjit MeiteiLalhlinpuiiLoksattaMadhusudhanan, SCERT
Manoranjan MondalManosh KumarMary LalrunruatiMary SadaMr. Ejanthang NgullieMr. KelouzieMr. Muzzamil Ahmed, Secretary to Dean CollegeDevelopment Council, Kashmir UniversityMr. Subor RangslangMr. YapangchangMr. Baikuntha Pandey, State Pedagogy, SSAMr. Harishwar Dayal, Prof. St. Xavier’s CollegeMr. Pashupati Nath Singh, Director-ADRIMTs of Dreams FoundationMTs of LoksattaMTs of Pragati Marg KendraMTs of Sankranti FoundationMTs of Vasavya Mahila MandaliNamkhinlung PameiNgorum Besterday MoyonNongmeithem Shyamjoy SinghP. SetsachoP. Subash SinghPadam RaiPangarsenba JamirPangloi KonyakPradip Tanti, President, Kumbha Panchayat, CacharPragathi Marg KendraPriyadarsini NairProf. Nandeibam MohendroProfessor Mushtaq A. Kaw, Dean, CollegeDevelopment Council, Kashmir UniversityProfessor Talat Ahmad, Vice Chancellor, KashmirUniversityPunuto AyeR Lalchhingpuii
R. Adeno NguillieBinay Pattanayak, Education Officer, UNICEFRanchiRemdorness SunnReshmi ThapaRijiedstar MarbaniangRobert C PaoboiRoluk BuiiRoshan RaiSankurathi FoundationSatish G, DRC DharwadShankar Singh YadavShowrish Kudkuli, Manipal University, ManipalShri M Shivshanker, Secretary General Education,Government of KeralaSmt Saumya Gupta, DM, North DistrictSuraj SharmaT. Chuba ChangTaba Anjum, Journalist, Arunachal TimesTakar BaganTamal ChakrabortyTatro SawinTenzing LepchaTobom DaiTokyo MidaTrilok Bandhu, Malwa Central College of EducationTumpe BasarVanlalrualfela HlondoVasavya Mahila MandaliWasim RajaYaben TapakYambem Chingshang SinghZakaria ChoudhuryZhoto TunyiAll Pratham State Heads, MTs and Accountants
Abhijit Banerjee
Abhimanyu Banerji
Accountability Initiative
Akhilesh Richhariya
Amit Kaushik
Amita Chudgar
Anant Prakash Vyas
Arvind Amin
Ganesh Tak
Gita Rao & Bhaskar Chakravorti
Iqbal Dhaliwal
ITC
Kabir Bogra
Maya Mitra
Michael Walton
Pratham UK
Rishi Rajvanshi
Rohini Mukherjee
Rukmini Banerji
Salimah Samji
Shantanu Banerji
Shobhini Mukerji
Siddharth Jain
Uttarayan Trust
V.B Bewtra
Viplow Shivhare

viiASER 2011
Contents
Co ■ List of partners.......................................................................................................................................................... ii
■ Supporters of ASER 2011.......................................................................................................................................... vi
1. Notes on ASER 2011
■ The unseen change............................................................ Madhav Chavan ..................................................... 1
■ ASER and learning profiles: The pace of learning is too slow... Lant Pritchett ......................................................... 11
■ Bringing hard evidence to the table..................................... M.R. Madhavan ...................................................... 13
■ From a Right to Schooling to a Right to Learning:
Rethinking education finance .............................................. Yamini Aiyar ........................................................... 14
■ Taking mothers along........................................................... Rukmini Banerji ....................................................... 17
■ 1,902 ASER partners............................................................ Suman Bhattacharjea ............................................. 19
■ From Mumbai, Multan to Mombasa or Karachi,
Kanyakumari to Kilimanjaro ................................................ Baela Raza Jamil .................................................... 21
■ Addressing inequalities: Breaking the cycles of illiteracy ...... John Mugo.............................................................. 22
2. About the survey
■ Note on Sampling: ASER 2011 Rural.................................... Wilima Wadhwa...................................................... 24
■ ASER 2011 Training ................................................................................................................................................... 25
■ ASER 2011 Monitoring & Recheck ............................................................................................................................ 27
■ How to make a map and make sections.................................................................................................................... 28
■ What to do in each section/ hamlet........................................................................................................................... 29
■ How to sample households in a hamlet in a village..................................................................................................... 30
■ What to do in each household................................................................................................................................... 31
■ From 2005 to 2011: Evolution of ASER...................................................................................................................... 35
■ ASER 2011: Reading tasks......................................................................................................................................... 36
■ How to test reading?................................................................................................................................................ 37
■ ASER 2011: Arithmetic tasks..................................................................................................................................... 38
■ How to test arithmetic?............................................................................................................................................. 39
■ What to do in a school?.............................................................................................................................................. 40
■ School and home language information in ASER 2011 .............................................................................................. 43
3. Sample survey formats ............................................................................................................................................. 44
4. Maps
■ Private schools 6-14 year olds ................................................................................................................................... 54
■ Attendance in Primary School .................................................................................................................................. 55
■ Reading: Std III & V ................................................................................................................................................... 56
■ Math: Std III & V ....................................................................................................................................................... 58
■ Multigrade classrooms: Std II .................................................................................................................................... 60
5. ASER 2011 (Rural) Findings ...................................................................................................................................... 61
6. India ............................................................................................................................................................................ 65
7. Andhra Pradesh, Arunachal Pradesh, Assam, Bihar, Chhattisgarh, Gujarat ......................................................... 75
8. Haryana, Himachal Pradesh, Jammu and Kashmir, Jharkhand, Karnataka, Kerala ............................................... 113
9. Madhya Pradesh, Maharashtra, Manipur, Meghalaya, Mizoram, Nagaland .......................................................... 151
10. Odisha, Punjab, Rajasthan, Tamil Nadu, Tripura, Uttarakhand .............................................................................. 189
11. Uttar Pradesh, West Bengal, Daman & Diu, Puducherry ....................................................................................... 227
12. Divisional estimates
■ Divisional estimates of learning outcomes and schooling status: Precision of ASER estimates...... Wilima Wadhwa..... 246
■ Divisional estimates for states 2007-2011.................................................................................................................. 250
Annexures
■ Sample description .................................................................................................................................................... 275
■ Village infrastructure and household characteristics ................................................................................................. 276
■ Class-wise distribution of children in sample 2007-2011............................................................................................. 277
■ Age-class composition in sample 2011........................................................................................................................ 282
■ Sample design of rural ASER 2011...................................... Wilima Wadhwa ..................................................... 287

Notes on ASER 2011

1ASER 2011
Madhav Chavan 1
The unseen change
I
The first news of 2012 based on ASER 2011 is that private school enrollment in most states is increasing althoughthe Right to Education Act for free and compulsory education is in place. Over 25% of rural India’s children go toprivate schools and the numbers will rise in coming years as education and wealth increase. ASER covers ruraldistricts. The urban numbers are probably changing more rapidly towards private education.
The second piece of news is that not only are India’s learning levels very poor on an international absolute scale,the levels in government schools in the North have steadily declined with the exception of Punjab and HimachalPradesh. The decline is quite alarming and we expect that the results will be discussed, debated and perhapseven contested in some states. At first glance the decline of reading levels by 10-20 percentage points can seemshockingly impossible but I think there is enough in the data gathered over the years that indicates that this hasbeen gradually building up possibly due to multiple factors, and something like Census 2011 has caused a majordip in the less functional state systems. It is noteworthy that private schools by and large everywhere, and thestates of the South plus Gujarat and Maharashtra do not show a decline of reading levels as measured by ASER.In fact, some states show steady improvement over the years. On another note, a recent study by EducationInitiatives- Wipro concludes that scores on common questions in tests given five years apart have declined about7-10% among Std 4 children of elite schools of India.2 There is an urgent need to find out why learning levels aredeclining and to at least arrest the decline and improve the learning levels.
When we started seven years ago, many doubted that we could do the first survey successfully and yet we calledit the ANNUAL Status of Education Report from the very first year. Later there were questions raised if there wasa need to do this massive survey every year. Those who do this year after year also wondered when not muchchange was observed year after year, whether all this annual business was worthwhile. But in 2011, the effortsin doing the annual survey seem to be even more justifiable at least for some time to come.
This article attempts to explore the trends as seen from ASER measurements and observations over the last halfa dozen years, or over a whole Plan period of India. I am sure the issue is more complex and many factors canbe studied. We will be more than happy if researchers feel inspired to use our data to explore this fascinatingphase of gradual but big, measurable but unseen changes in elementary education.
Ever since we launched ASER, our focus has been on two simple key points. First; are all children enrolled inschool? What kind of school? Second; are the children learning at least the very basics of reading and numeracy?While ASER has won many friends and admirers, we have had our share of critics. We have chosen to focus onsome very basic outcomes of education. If these outcomes improve, there is reason to believe that inputs areworking. When they decline, it is a sure sign that inputs are not working.
Before we did the first survey, it was difficult for us to believe that over 90% rural children of this vast countrywere enrolled in schools. But once we had done the survey, we believed it. Many others including some eminentpeople did not, and said it was not consistent with their experience. A government sponsored independentsurvey around the same time came up with practically the same proportion of enrolled children. Every subsequentASER threw up self-consistent numbers and trends at state and national level to further emphasize the validityand utility of the survey. Subsequently we also measured attendance, which showed that while enrollment wasincreasing in the Northern states, attendance of children in schools, which should be the real measure ofenrollment, remained poor.
The increase in enrollment was an intended clear goal of the system and the system responded to the signalscoming from Delhi and state capitals. Large centralized systems respond to simple and clear instructions or goalsand not fine print. In a centralized but ill-functioning system with huge gaps of knowledge and skill-sets, acomplex message is lost in the game of Chinese whispers. Worse, it may lead to a dysfunctional system becomingworse. A few months ago a senior government official was heard explaining to a gathering of head teachers theessence of the Right to Education Act. “Enroll all children. Do not beat them. Promote them to the next class.Make sure they do not drop out. Once you have done all this, you will have achieved RTE”. But will learninghappen simply if children stay in school?
1 Madhav Chavan is CEO and President, Pratham Education Foundation.2 See http://www.ei-india.com/wp-content/uploads/Executive_Summary.pdf

2 ASER 2011
The Government of India has not emphasized improvement in learning goals. The results framework of theministry that goes with the annual plan guidelines gives learning outcomes a late and vague mention - all this inspite of all the evidence pointing towards dismal learning by every measure.
The ASER survey of children’s reading and arithmetic levels has its critics and admirers. Our admirers like itssimplicity and the fact that it has been tested and proven to be robust. The tools and techniques have beenreplicated and found to work in other parts of the world. But, the detractors have other views ranging fromdoubting the very integrity of the exercise to whether it is correct to measure outcomes at all and everything inbetween. Unfortunately, surveys, their potential, their meaning, and their limitations are not well-understood.Subsequent to ASER, other higher level and more sophisticated studies have been undertaken by EducationInitiatives. NCERT studies have been published, and many state governments have been measuring learninglevels using different methods, some of which are close to the ASER approach. Often these results do not matchthanks to different approaches, methods, and tools. However, broadly all indicate that learning is poor in Indianschools.
ASER has followed the same basic procedures and has made sure that basic testing tools and methods ofsampling and testing are the same every year for the core tests. As a result, although some of our findings maybe inconsistent with other studies, they are self consistent year after year indicating good precision of the methodand the techniques used.
The massive data gathered over the last years are showing some interesting trends that deserve the attention ofpolicy-makers and researchers alike. The right to free and compulsory education is now on the ground. How arepeople reacting to it? How is it impacting schools? We cannot merely look at its impact every five years. In fiveyears a Std 1 child will complete primary education and a Std 6 child will either drop out or go on to completesecondary schooling. But, if we let things go on the way they are, demographic disaster awaits us at the end ofthe decade if not sooner.
There is plenty new. The RTE act, if seriously implemented, will make it impossible for ‘low cost’ or ‘affordable’schools to operate. But over the last six years private school enrollment in rural India has gone up by 5.5percentage points, which translates into an increase of just over 25%. It is quite likely that many, if not most, ofthe rural private schools do not meet RTE norms. So unless these children are all enrolled in RTE-compliantprivate schools, nearly 40 million rural children will have to be provided place in government schools. But, willthe parents want to put their children in government schools even if they are ‘good’? Can they be compelled todo so? What information do we have relevant to this question?
As far as private school enrollment is concerned, India can be divided into some broad regions. In the North-West, states like Punjab, Rajasthan, Haryana have had high enrollment in private schools. Since 2006, theseenrollment numbers have gone up by 5-7 percentage points- that is a 15-20% increase. The North-East showsmixed ratios with Assam and Arunachal being moderate, Tripura low, and Meghalaya, Mizoram, Nagaland andManipur on the high side of private enrollment. In the East, states have traditionally had low enrollment inprivate schools, and these have gone up by about 1-3 percentage points- also a 20% increase. In this regionBihar has the unique distinction of actually decreasing the proportion enrolled in private school which is a likelyreflection of the massive efforts to open schools, bring out of school children into school and appointing largenumbers of teachers. But we also know that children’s attendance in Bihar is the lowest in the country and nearly60% elementary school children in this state go to private tutors. Bihar’s immediate neighbors are also high tutorstates. Maharashtra and AP show under 10% increase over their previous level of about 29% private schoolenrollment. But, the rest of the South is increasingly sending children to private schools.
The major enrollment story is in Tamil Nadu, Kerala, Maharashtra, and Uttar Pradesh. Each story is different inthese extremely diverse states.
In Tamil Nadu, there are several strong reasons for attracting children to government schools - mid-day meal issaid to be a major success over many years in bringing children to government schools. A few years ago a newchild-centric, joyful, print-rich ABL methodology was introduced across the state. Yet, there is an overall increaseof about 8 to 12 percentage points in private enrollment between Std 1 and 8 over five years. But a look at thecharts below makes it obvious that the major increase is in Std 1-5 amounting to about 16 percentage points or

3ASER 2011
almost a doubling of private school enrollment. In Std 6-7-8 the increase is about 7 percentage points. It appearsthat the government schools in Tamil Nadu are not able to convince the parents that government schools arebetter. Is this only because parents associate some kind of a status with private schools and are not concernedwith what goes on in the classroom? If so, is there not a need to reach out to parents and convince them?
. Tamil Nadu, Kerala, Uttar Pradesh and Maharashtra: Trends in percentage of children enrolled inprivate schools, Std 1-8
In Uttar Pradesh, which could be seen as the exact opposite of Tamil Nadu as far as government school functioningis concerned, private school enrollment in Std 1-5 has jumped up almost 20 percentage points to double theoriginal number; while in upper primary segments, which had a high private enrollment, the increase is small butstill substantial at 5 percentage points. The data suggest that in earlier cohorts private school enrollment in theearly grades was relatively low and it rose as we moved to higher grades. Now it looks like private schoolenrollment starts high from as early as Std 1. Perhaps, upper primary private schools are expanding to includeprimary segments and those who can afford it are sending their children to private schools.
What is common between UP and Tamil Nadu apart from this big move towards private education? Seriousresearch is needed to understand why parents in these two very different states are behaving similarly in massivenumbers.
In Kerala, where there was already more than 50% enrollment in private schools, there is still an eight percentagepoint increase in private enrollment. In the North-Western states, private school enrollment seems to haveremained steady around 35-40% or inched up slowly, indicating a saturation effect. But Kerala seems to bebreaking through any such saturation. It must be remembered that a very large proportion of private schools inKerala are government aided, which are largely absent in the North-Western states. It is not clear if the existingprivate schools in Kerala are expanding, or more unaided private schools are opening.
The RTE Act offers ‘per child cost’ to unaided schools to accept 25% children of weaker sections. In Kerala,where only 40% are now in government schools and the number is going down, would it not make more senseto convert all government schools into ‘aided schools’ rather than keeping them under a centralized governmentcontrol? Why not opt for a ‘government funded locally managed school’ model with either private groups or

4 ASER 2011
Panchayats running the schools? Or, Kerala, with a very high proportion of private schools, may be ready forvouchers even though there will be political question marks.
Maharashtra presents a different case in contrast. Its private enrollment in primary segments has hardly gone upand the enrollments in upper primary segment, which are largely government aided schools, show no majorincrease either. The secondary segment in Maharashtra is largely private and aided, which is reflected in thechart. Why is the Maharashtra response to private schools like that of the Eastern states, which are poorereconomically and educationally and not like Kerala?
These four states in some ways represent the variation among education systems in different states of India. Isthere one “Indian education system”?
These questions present good research opportunities. However, it is almost predictable that unless regulationprevents it or unless suddenly a large population starts believing in neighborhood/common schools run by thegovernment, the proportion of children going to private schools will go on increasing. The question is, how far?Based on previous ASERs and other studies, it is quite obvious that with increasing income and education ofparents, people want to send their children to a private school if one is available nearby. Can governmentschools alone convince parents to do otherwise? Is there a need for greater social and political mobilization? Canit succeed?
When we published ASER2005 (the first one) many people were shocked (as were we), and some actually angrythat the proportion of government school children in Bihar who could read was higher than in many othereconomically better off states. “Bihar, of all the places!” was an exclamation full of contempt often heard. Butno one seemed to object that the ability to read in Bihar government schools was much higher than in UP orRajasthan government schools.
As gurus of surveys say, what surveys provide are measurements and observations. These give estimates uponprocessing, which are perceptions of reality through the lenses of the survey tools. There are statistical methodsavailable to measure how good these are (and ASER passes these tests quite well3). ASER methods and toolshave been replicated successfully by different groups in African countries and in Pakistan. What they mean ormight mean is another thing. It is up to individuals to decide what comparisons to draw and what interpretationsand inferences to make.
So, let us try to unravel the mystery of why Bihar children do better in reading. I will leave it to the economists todo detailed work and test a primary hypothesis that emerges from the table below.
. Percent children in different states and systems who can read at least a Std 1 text in Std 3, 2006-11;and % going to tutors in 2011
3 See http://images2.asercentre.org/ASER_survey_/ASER-Reliability-Validity-Evaluation.pdf
State and school type * 2006 2007 2008 2009 2010 2011% going
to tutors in2011
Bihar (Govt) 51.7 52.6 49.7 42.3 43.9 29.9 42.0Bihar (Pvt) 69.6 71.4 73.4 72.5 65.9 72.7 67.2W Bengal (Govt) X X 47.9 49.3 51.7 46.8 67.9Rajasthan( Govt) 31.6 28.7 31.5 25.8 27.2 22.6 4.7Rajasthan( Pvt) 53.9 53.8 60.2 52.1 50.3 53.2 9.4UP (Govt) 23.5 25.8 24.5 23.3 26.5 18.0 1.2UP (Pvt) 50.3 53.2 56.3 48.7 51.3 50.7 13.5* W Bengal private school data not included due to small observation numbers. Bihar private school data points are also small.
Note that the estimated percentage of children who can at least read a Std 1 text in Std 3 in Bihar and WestBengal lies in between private schools and government schools of Rajasthan and UP. There is a dip in 2011 in allthese government schools. We shall deal with the decline in 2011 a bit later. For the moment let us work only

5ASER 2011
with numbers up to 2010. We know that there are many household factors that affect the learning levels of achild. Once these are controlled, as Dr. Wilima Wadhwa has shown in ASER 2009, the contribution of the privateschools to the child’s learning seems negligible in several states. In the present case, does tutoring represent allthese factors to equalize?
. Percent government school children who can read depending upon whether they go to tutor or not
4 ASER is a household survey with sampling done to ensure a representative sample of children at the district level. However for every village that is sampledfor the survey, one government school with primary sections is also visited. The ASER school data is based on these school observations.
W BengalGovernment school
OdishaGovernment school
BiharGovernment school
JharkhandGovernment school
Based on ASER2011
% Std 3 who can readat least a Std 1 text
% Std 5 who can readat least a Std 2 text
In all of the above states large but varied proportions of children go to private tutors. In other states the correspondingdata points are low. The percentage of readers among government school children who go to tutors is unmistakablyhigh in these high tutor and low private school states.
If the effectiveness of a school system was measured by the proportion of children without tutors who can readtexts of Std 1 and 2 respectively at Std 3 or Std 5, we see an even worse picture. In fact, for those who wish tocompare states, once the tutor effect is removed, most states excepting Kerala, Maharashtra, Punjab, andHimachal Pradesh start looking very similar.
It is observed in states where learning levels are declining that while the same proportion of children go to tutorsyear after year, their contribution to the child’s learning level diminishes. This may mean that the tutor is acomplementary factor and if the school functioning declines, the effectiveness of tutoring is lower too. Thisshould make sense. It is noticeable that the impact of tutors is not the same in every state and in every class. Itis as though tutoring is also a ‘system’, that functions well in some states and not in others.
In other words, the learning level of a child in a government school results from many factors. School is animportant factor but it is only one of the factors.
Let us come to the observation that in 2011 the learning levels of government schools drop substantially. In fact,in government schools in Rajasthan, UP, and Bihar there is a continuous decline in learning levels over time untilit drops sharply in 2011. It is noteworthy at the same time that the private school learning levels remain more orless unchanged.
What is going on? One likely contributing factor for big a drop in 2011 is that there was Census in early 2011 andteachers were pulled out of classrooms right in the most productive part of the school year after the October-November festive season. But there are other factors changing as well.
The school observation data from ASER can be used to track trends.4 The school attendance observed in UP andBihar over the last five years is down from 67% in 2007 to 57% in UP and from 59% to 50% in Bihar. The dropbetween 2010 and 2011 is sharp. Rajasthan shows no such drop but W Bengal does so in 2011. Teacherattendance in Bihar and Rajasthan remains at around 85-90% but has declined in UP from 92% to 82%.
Another important observation is that in Rajasthan, which remained unchanged in terms of children’s or teachers’attendance, the proportion of multigrade classrooms has gone up from 52% to 62%. In UP it has gone up from43% to 52%. In Kerala it has gone up from 2% to 9%. Note that all these are states with high proportions ofchildren moving to private schools. With the exception of Maharashtra, Karnataka, and Tamil Nadu, the proportionof multigrade classes has increased in most states. Whether this is a consequence of a consciously adoptedpedagogy or whether this reflects rationalization of teachers is not clear.
withtutor
withtutor
withouttutor
withtutor
withouttutor
withtutor
withouttutor
withouttutor
53.9 32.9 55.9 27.6 35.5 27.9 38.1 24.0
44.1 35.0 52.8 31.3 53.8 44.1 52.9 33.1
6 ASER 2011
Just to be clear, I am not at all opposed to multigrade classrooms. In fact, I would prefer grouping childrenaccording to their current level rather than age alone. But the classroom management techniques and teacherpreparation required in such situations is very high. If these are weak, as they today are, a multigrade classroomcan prove to be a disaster. If ASER school observations over the years are correct, we are witnessing a quietdisaster.
The declining levels of learning and other factors are not unique to Rajasthan, UP, and Bihar. But there areexceptions as well.
The effectiveness of a system can be increased or decreased by changing a variety of factors. But to clearlyidentify these, we first need to have a measure of effectiveness of the system. This is only possible if the systemdefines the outcomes it wants and works towards achieving them. If construction of toilets and ensuring thatthey function is the desired outcome that the system is aiming for, then the system will respond accordingly aslong as there are no other conflicting factors such as lack of water. If the idea is to ensure that children learnreading, writing, arithmetic, a focused system can achieve this. If we further want the child to be free of fear,able to think and express, that can be done. But for all this, the system must function and it should be capableof receiving messages and translating them effectively into appropriate action.
The exact opposite is also possible. In other words, the estimates of declining percentage of readers in everyclass may lead us to infer that the message being interpreted is that learning is not important.
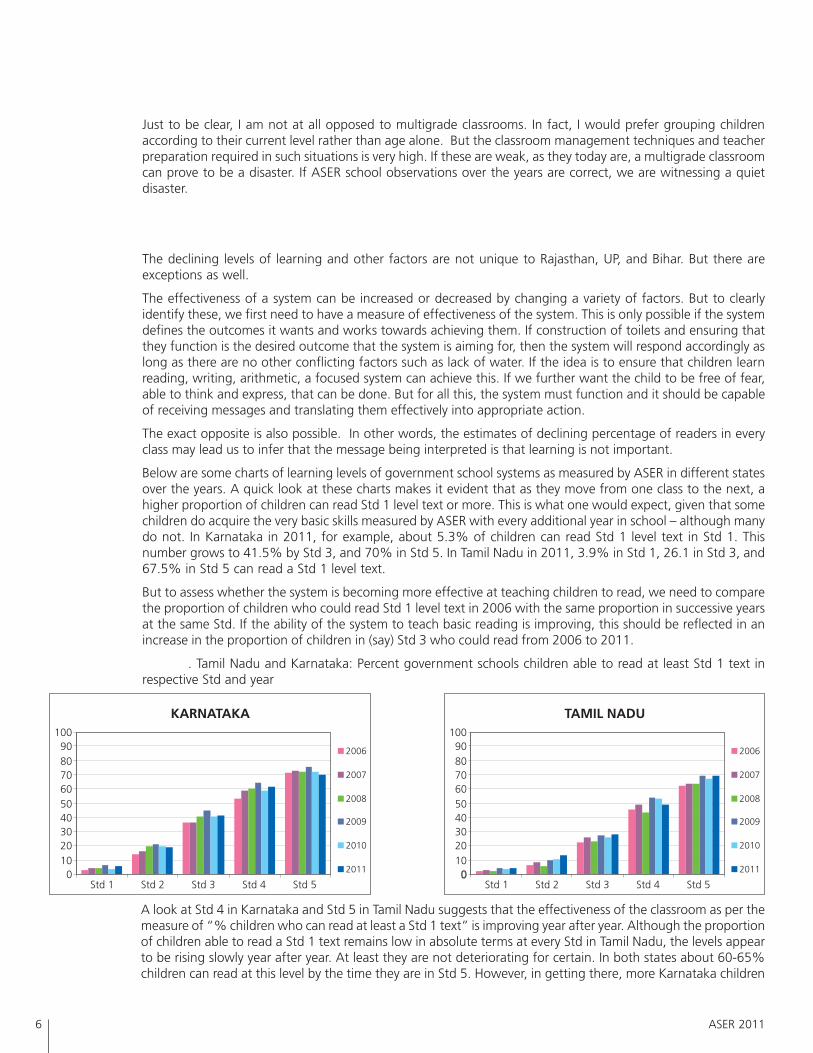
Below are some charts of learning levels of government school systems as measured by ASER in different statesover the years. A quick look at these charts makes it evident that as they move from one class to the next, ahigher proportion of children can read Std 1 level text or more. This is what one would expect, given that somechildren do acquire the very basic skills measured by ASER with every additional year in school – although manydo not. In Karnataka in 2011, for example, about 5.3% of children can read Std 1 level text in Std 1. Thisnumber grows to 41.5% by Std 3, and 70% in Std 5. In Tamil Nadu in 2011, 3.9% in Std 1, 26.1 in Std 3, and67.5% in Std 5 can read a Std 1 level text.
But to assess whether the system is becoming more effective at teaching children to read, we need to comparethe proportion of children who could read Std 1 level text in 2006 with the same proportion in successive yearsat the same Std. If the ability of the system to teach basic reading is improving, this should be reflected in anincrease in the proportion of children in (say) Std 3 who could read from 2006 to 2011.
. Tamil Nadu and Karnataka: Percent government schools children able to read at least Std 1 text inrespective Std and year
A look at Std 4 in Karnataka and Std 5 in Tamil Nadu suggests that the effectiveness of the classroom as per themeasure of “% children who can read at least a Std 1 text” is improving year after year. Although the proportionof children able to read a Std 1 text remains low in absolute terms at every Std in Tamil Nadu, the levels appearto be rising slowly year after year. At least they are not deteriorating for certain. In both states about 60-65%children can read at this level by the time they are in Std 5. However, in getting there, more Karnataka children

7ASER 2011
learn to read in Std 2 and 3, while more Tamil Nadu children become readers with a jump as they move from Std3 and 4.
In Kerala, Andhra, and Maharashtra there is no observed improvement nor loss of effectiveness of schools by thesame measure.5
Gujarat should be mentioned as a state that has also started showing a steady although slow improvement inreading levels over the last three years. One major initiative in the state for the last three years is that governmentofficers visit randomly chosen schools to assess performance of children around November and cross checkteachers’ evaluations.
Children’s attendance, teacher attendance, and the proportion of multigrade classrooms in these states arelargely unchanged or have improved and remain at high levels.
. Punjab and Haryana: Percent children in government schools able to read at least a Std 1 text inrespective Std and year
Here is an interesting case: Haryana and Punjab - neighbours who share a common capital - show opposingtrends. The two states are almost identical with respect to private school enrollment, student and teacherattendance, and multigrade classrooms. Outwardly, they should function with the same effectiveness. Yet, oneis getting better while the other is in decline. While Punjab shows year after year improvement especially afterStd 2, Haryana seems to show deterioration especially when children reach Std 5. In other words, the Punjabsystem has been converting non-readers into readers at Std 3 and 4 with increasing effectiveness year after yearso far. In contrast, in Haryana, although more children learn to read as they go from say Std 2 to 3 or Std 3 to 4,each year fewer children are learning to read at each step and this shows up as a cumulative decline in thepercentage of children reading at the same Std when compared across years. In Haryana, the proportion ofchildren who can read in Std 5 was around 85% in 2006 while it has steadily declined to 75% in 2011. Theincrease in Punjab and the decline in Haryana are both obvious and statistically significant.
. Odisha and Jharkhand: Percent children in government schools able to read at least a Std 1 text inrespective Std and year.
5 I have used only reading at Std 1 text level as a measure. It could look different if we used another measure, say ability to solve division sums.

The estimated decline in learning levels at Std 3 in UP, W. Bengal, Rajasthan, and Bihar was already shown in atable above. The decline in Odisha and Jharkhand is sharper at all grade levels especially after 2008. Particularlynoteworthy is the sharp decline at every Std in 2011. It may be noted that average attendance of children inthese states is observed to be around 90%, and teacher attendance is also higher than the average amongNorthern and Eastern states. However, the main common factor is that multigrade classrooms have gone up by7 to 10 percentage points. We are not aware of what else may have changed in the system. The sharp declinein 2011 is common with other Northern states and might be due to the additional Census factor laid over alreadypoorly functioning systems.
It should be reiterated that private schools systems in the North do not show a similar decline in these basiclearning levels.
These examples provide sufficient evidence that ASER can capture positive changes, negative changes, andnote status quo in school systems over years.
This brings us to a major negative change in two states of Madhya Pradesh and Chhattisgarh. In MadhyaPradesh, according to ASER 2005 36% government school children in Std 3 could read at least a Std 1 text. By2006 this had jumped to 65%. There was a further jump in 2008 to 81% after stability for one year. However, insubsequent years the Std 3 classes had lesser and lesser proportion of children who could read. The conversionto readers after Std 3 also slowed down. As a result we see that by 2011 the proportion of basic readers hasfallen way below what it was in Std 3 and Std 5 in 2005-2006.
. MP and Chhattisgarh: Percent children in government school able to read at least a Std 1 text inrespective Std and year.
In neighbouring Chhattisgarh, the decline is observed after academic year 2008. The Chhattisgarh decline looksrelatively smaller than in MP today. However, it is comparable to what MP had seen in 2010. In other words, itis more than likely that unless corrective action is taken, the Chhattisgarh chart of the next ASER in 2012 willlook like the MP chart of 2011.
How are the two states doing on other parameters observed by ASER?
. MP and Chhattisgarh: School indicators, 2007 and 2011
8 ASER 2011
Data for primary schools (1-5) %Madhya Pradesh Chhattisgarh
2007 2011 2007 2011
Children’s attendance 67.0 54.5 72.0 73.1
Teachers’ attendance 91.3 87.7 92.7 84.6
Multigrade classrooms 61.8 70.8 48.1 62.5
Water provision and functioning 78.5 69.1 77.6 73.4
Private school enrollment 13.0 19.0 9.0 12.5

It appears that there is a general decline. The increase in multigrade classrooms combined with increasedteacher absenteeism and lower attendance of children (not in Chhattisgarh) from already low levels could causea decline in reading levels like in other states. There is no documentation available for any other negative factorscreeping into the MP and Chhattisgarh systems that could lead to additional negative effects.
The drops in learning levels are very high compared to other states because the baseline of learning levels in2007-2008 for these two states was very high. How can such huge drops in the learning levels be explained? Theanswer may lie in why the learning levels might have gone up in the first place.
We have seen above that in Punjab and Tamil Nadu, although to varying extents, the proportion of children ableto read has gone up steadily. In Punjab, the government took up a specific program to improve basic reading andnumeracy for three years. The whole system was oriented towards achievement of goals that would be measured.The campaign had intended consequences as the State Project Director of SSA provided from-the-front leadership.The learning levels were quite high to begin with and they went up in small jumps over the years. In Tamil Nadu,the SSA provided similar leadership for about 4 years to establish the ABL methodology. The explicit and primarygoal of ABL is not improvement of reading, which may be an outcome of an overall change in pedagogy thatallows children to learn at their own pace rather than being encouraged to achieve reading skills as a priority.Hence, a slower pace of change may be expected. It is important to note that gains in reading levels due to bothare captured by ASER over the years.
In Madhya Pradesh in 2005-06, and then again in 2007-08, the SSA took up very strong focused campaigns toimprove reading and basic literacy with the involvement of teachers and village volunteers. In both years therespective State Project Directors provided leadership. Goals were set, officers and teachers were involved toachieve specific learning goals. In Chhattisgarh, there was a similar campaign for just one year, 2007-08. Onceagain, an energetic State Project Director of SSA led from the front, the school system was geared towardsachieving set goals of basic reading and numeracy and there was a massive mobilization of volunteers inpractically each village. In MP too, there was a massive volunteer campaign with volunteers working withchildren in each village.
The impact that a systemic momentum can have is easy to believe. What is missed is the impact that volunteerscan have on such a large scale when working with the system.
Some individuals question our integrity and say that ASER cooks up figures to show Pratham’s work in good light.There are others more kind in questioning our integrity. In our defence we can point out that similar campaignstaken up in UP or in Assam failed to show improvement although the government was involved and there werevolunteers mobilized. In Uttarakhand, learning levels hardly moved. In Maharashtra and Gujarat the respectivegovernments took certain steps without Pratham involvement and reading levels went up. It is our experiencethat when the government leadership took up something energetically and when volunteers also participated,learning levels showed improvements. With the momentum of the school system missing or weak, learninglevels did not show improvement. In other words in the period 2007-2009, any large scale volunteer-basedcampaign without the government’s involvement yielded no noticeable improvement. This is noted in variousPratham reports.
Fortunately, the world renowned MIT-based research group J-PAL has conducted rigorous randomized evaluationsof Pratham’s work with volunteers.6 These large scale studies conducted in varied places such as Mumbai,Baroda, Jaunpur (UP) and West Champaran (Bihar) all point to the impact volunteers have on learning levels ofchildren at the very basic level that ASER measures. There is also a large scale study involving school teachers inBettiah in West Champaran in summer camps, where children were grouped according to their learning levelsrather than by grade or age and taught basic reading and literacy with focus. This study showed that not only didchildren who attended camps make progress, but they retained their advantage over other children for at leasttwo years.7
We have already seen the impact tutors have on learning levels of children in government schools although theschool attendance in Bihar is recorded at about 60%. If the school system was more effective, learning levelswould probably be higher (unless parents stop sending their children to tutors because schools are more effective,but this does not seem to happen in private schools and in advanced states such as Kerala).
6 http://www.povertyactionlab.org/search/apachesolr_search/pratham?filters=type:evaluation7 See Abhijit Banerjee and Esther Duflo’s recent book Poor Economics, published in 2011.
9ASER 2011

The volunteers who helped children in massive numbers can be thought of as tutors focusing on certain tasks ofreading. With this it is entirely possible to see the kind of jumps at the basic level of learning that are noted byASER.
The effect of the campaigns in MP and Chhattisgarh is reflected in the measurement of their intended outcomes.The effect of campaigns of the previous year(s) is seen in ASER measurements which happen in October-November of the following academic year. The 2006 measurement in MP is a reflection of the campaign in2005-2006 academic year and the 2008 measurement in Chhattisgarh is a reflection of the campaign of 2007-2008. The low learning levels jumped tremendously with the boost that came from the energetic campaigns.After 2008/2009, the campaigns were simply switched off by the new State Project Directors in the two states.The momentum was completely lost. Now, we see that not only are the focused learning improvement effortsoff but other parameters are also going downhill.
The impact of school summer vacations on children’s loss of learning has been studied in the United States andis said to impact socioeconomically disadvantaged children much more. Similar studies related to regular disruptionsand vacations are badly needed in India. What happens if school and classroom functioning deteriorates? Is itpossible that the fragile reading and numeracy skills acquired by a disadvantaged child in Std 2-3 will beforgotten or become rusty enough to once again classify the child as a non-reader? Our data suggests that thisis what is happening in several states and needs to be studied further in depth.
In short, the rise in learning levels is a combination of an energised school system which would enhance itseffectiveness as compared to other neighbouring states and the volunteer/tutor effect would be added on to this.Once these effects are switched off, and other parameters also deteriorate, the consequences can be dramaticallyobserved in falling of learning levels as seen above.
The ASER data over the years are self consistent and have thrown up trends in enrollment and changes inlearning levels that require more research to be done but even as they are, they deserve close attention.
There are two clear trends observable around the country.
One is that private school enrollment is increasing in most states and where there are few private schools, privatetutoring is a surrogate for private schooling that seems to have an equalizing impact to some extent in severalbackward states in the East. Should tutoring be seen as a harmful nuisance or a necessary support system in asociety that is semi-literate with low skills and knowledge all around? At a time when the government has putin place an act for free and compulsory education with planned increase in spending on government schools andcurbs on private schools, there is a need to understand why and how the private sector is expanding now that itcaters to nearly half the rural children in several states, and a possibly larger share of urban children in manylarge states.
The second is that while there are differences in the effectiveness of systems in different states in teachingchildren at different stages of schooling, the general level of effectiveness is scattered in a narrow band arounda poor mean. Fortunately, everyone agrees with this! Trends over the last five-six years indicate that learninglevels are gradually dropping in most large Northern and Eastern states while they are steady or improving slowlyin the Southern and Western states. Private school effectiveness varies from state to state but ASER cannotdetect a decline in private school effectiveness at the level of its measurement. These observations of learninglevel changes in government schools are correlated to other school observations that might affect the teaching-learning process. In addition, the special efforts undertaken by different state systems or the absence or reversalof these have to be taken into account to understand why the outcome measurements show changes. If this isdone, a more practical strategy to improve learning levels in the more backward states can be evolved.
10 ASER 2011

11ASER 2011
ASER and learning profiles:The pace of learning is too slow
Lant Pritchett 1
One of the big advantages of the ASER approach of testing children out of school is that it can assess theperformance of children at a wide variety of grade (and age) levels. Rather than seeing just a snapshot of howchildren at one grade do against some grade-based standard, the ASER approach shows the entire learningprofile of what fraction of children in each grade are in which level of performance on literacy and numeracy. Inthe case of ASER this is easiest to interpret at the highest and lowest categories of performance, for instancewhat fraction of children can read a level 2 story and what fraction of children can do division of a one digit intoa three digit number. The point I want to make about these learning profiles is that the differences across gradesreveal important facts about the dynamics of learning, in particular the fact that progress is so slow that 4 out of5 children who do not have mastery will fail to acquire mastery in an entire year of schooling. Let me explainusing the overall rural results from 2010.
Table 1 starts from the numbers from last year’s report on the fraction of children who can read at level 2 or dosubtraction, both grade 2 curricular objectives. Many children finish grade 2 not having mastered these simpleskills, which is not perhaps shocking. What is shocking is the bottom line for reading, which is that 75 percent ofchildren (3 out of every 4) who do not acquire reading or arithmetic mastery at the “grade appropriate” leveldon’t acquire it in the following year either, and 3 out of 4 of those who still don’t master these skills won’t getit even after another entire year of schooling. This implies that only 1 in 4 students is making progress acrossthese very low thresholds of literacy and numeracy per year of schooling.
I’ll explain this simple calculation using reading from grade 4 to 5. The fraction of students that could read Level2 text in grade 4 was 38.1 percent and in grade 5 was 53.4 percent, so the proportion that could read increasedby 15.3 percentage points. But many children already could read, so if we want to see what fraction of thosewho could not read acquired this ability, let’s adjust this gain by the fraction who could not read in grade 4 whichwas 61.9 percent (100-38.1). So the gain from grade 5 over grade 4 as a percent of those who could not read
Table 1. Children gain slowly in skills even as they progress through grades—three out of four children whoenter grade 3 or higher without a grade 2 skill leave without gaining mastery
Grade Reading Arithmetic
Can readlevel 2 text a
Gain fromgrade tograde
Fraction of thosewho did not
learn b
Can subtract(or above) a
Gain fromgrade to
grade
Fraction of thosewho did not learn b
1 3.4% 5.5%
2 9.1% 5.7% 94.1% 17.1% 11.6% 87.7%
3 20.0% 10.9% 88.0% 36.4% 19.3% 76.7%
4 38.1% 18.1% 77.4% 57.4% 21.0% 67.0%
5 53.4% 15.3% 75.3% 70.3% 12.9% 69.7%
6 67.5% 14.1% 69.7% 80.1% 9.8% 67.0%
7 76.2% 8.7% 73.2% 84.3% 4.2% 78.9%
8 82.9% 6.7% 71.8% 85.4% 1.1% 93.0%
Total gain fromGrade 3 to Grade 8
Average gain,Grades 3 to 8
75.9%(3 of 4 do not gainmastery in a yearof instruction)
75.4%(3 of 4 do not gainmastery in a year ofinstruction)
62.9% 49.0%
12.3% 11.4%
a. Data from ASER 2010 (Rural) report tables 4 and 6.b. Formula is 100-((gain from previous grade)/(100-fraction that could do in previous grade))*100.
1 Lant Pritchett is Professor of the Practice of International Development, Harvard Kennedy School. He is a member of ASER Centre’s advisory board.

12 ASER 2011
in grade 4 was 24.7 percent (=15.3/61.9). This implies that one of each four children who entered grade 4 notable to read at Level 2 passed that threshold of literacy during that year. But it also means that three out of fourchildren who came into grade 4 not reading at a Standard 2 level progressed on to grade 5 without havinglearned how to read.
Overall this problem is exactly the same in arithmetic, with a slightly different pattern. More children pick upbasic arithmetic quickly, so that by grade 3, 36.4 percent of children can do subtraction. But in the five additionalyears from grade 3 to grade 8 only 49 percent gain that level of arithmetic capability. This is because progresspeters out and by grade 8, even though 15 percent still cannot do subtraction, there is almost no progress at all.
This formulation of the learning problem in Indian rural basic education comes from seeing the entire learningprofile and has been a contribution of the ASER approach. The flat learning profile which is the result of moststudents making no progress in answering particular questions has now been replicated in studies in AndhraPradesh by the APRest study and in the work of Education Initiatives which have asked common questions acrossgrades (see Beatty and Pritchett 2012).
I also find this formulation of the learning problem—that three out of four don’t learn enough to pass a lowthreshold in a year—the most stark and striking. Imagine you are a child who came to school with the hope andpromise that getting an education could transform your and your family’s future by opening up the opportunitiesthat learning enables. You perhaps weren’t “school ready” and so in grade 3 you still cannot read a simple(level 2) paragraph but you still have hope. But the odds are 3 out of 4 against you learning in grade 3. So nowyou are passed along to grade 4 as one of the 62 percent still not reading. You come again hoping that someonewill notice, someone will help. Again the odds are against your hope, 3 out of 4 that you don’t learn in grade4 either. The result is that you could easily be one of the one in three children who complete lower primaryschooling, passed through five entire years of schooling, having spent roughly 5,000 hours in school, still lackingthe most fundamental of skills. And so, year after year, a dream deferred becomes a dream denied.

13ASER 2011
Bringing hard evidence to the tableM R Madhavan 1
The ASER reports have performed a remarkable feat: bringing hard evidence to the table to measure outcomesof our elementary education system. To see the importance of this achievement, just look at the public discoursein various fields.
Most government schemes and budgets track allocation and utilisation of funds. A department that has utiliseda large proportion of its allocated funds in a year is judged to have performed well, and gets further funding forthe next year. This frequently results in significant spending towards the end of the financial year, as departmentswant to show “performance”.
In some cases, outputs are measured. For example, in a child immunisation programme, the measure mayinclude (in addition to spending targets), the number of children who have been vaccinated. However, even thismetric only measures the means to the end target of less disease or lower child mortality. Rarely is the desiredoutcome measured and even rarer is the link made with financial outlays.
Another example can be used to illustrate the lack of outcome measures. The MNREGS is one of the keypoverty alleviation schemes of the government. The central government publishes periodic data on the fundstransferred to each state and the amount utilised. There is some further measurement – the number of person-days of employment generated. However, the idea that the scheme is designed to be a safety net has been lost.Low utilisation can be interpreted in two ways: the government is unable to provide sufficient jobs to the job-seekers (bad result), or that there is sufficient availability in the economy for alternate jobs leading to lowdemand for the scheme (good result). The way to answer this is by asking whether potential NREGS job seekersare able to get jobs in the scheme. This can be obtained only by surveying people on whether they needed toaccess the scheme and whether they obtained jobs. The answer to this question is not available.
Indeed, data on many social and economic indicators are not even collected or reported at annual intervals.India must be one of the few large economies which have no idea of their employment levels – the only datacomes from the National Sample Survey every five years; most countries provide such data on a quarterly basis.Most health statistics – such as child and maternal mortality, malnutrition, use of family planning methods – arecollected in the NFHS surveys, at approximately five year intervals. Poverty levels are estimated every five years.
It is in this context that the ASER reports have become invaluable. These reports measure the learning levels ofchildren across the country at annual intervals. There are two main contributions. First, time-series and cross-sectional (district-wise) data is available to researchers who can link this data to various inputs and see the effectof various policy interventions. More importantly, ASER has changed the discourse in the field of education fromthat of measuring outlays (money spent) and outputs (teachers hired, schools built) to that of outcomes (abilityof children to read and do arithmetic).
This change has not been reflected in some policies, though. The Right of Children to Free and CompulsoryEducation Act was passed in 2009 and brought into effect in April 2010. The Act guarantees access to schools– yesterday’s problem that has been solved as evidenced by the 90% plus enrollment rates of children in firstgrade. The Act also requires all schools to have certain minimum norms – which are measured as physicalinfrastructure (building, library, kitchen, toilets), teacher-student ratio, teaching hours. What the Bill misses is afocus on whether the students are actually learning. Indeed, the Bill prohibits schools from holding back studentsin the same class if they do not perform adequately, but it does not provide for any special measures to be takento ensure that no child is left behind. Hopefully, the data from the ASER reports will indicate the gaps andmotivate policy implementers to deliver quality education to children. This means a shift of focus from inputs tooutcomes such as ensuring that children in elementary schools are learning basic skills of the 3 R’s, and developingthe ability to think and create. Such skills will be essential for them to prosper in tomorrow’s knowledgeeconomy.
ASER has done an impressive job of measuring education outcomes. The skills built by the team in collating,assessing and evaluating data can be used to measure outcomes in areas such as health, livelihoods, and theeffect of various government schemes. Perhaps, it is time for ASER Centre to expand to other socio-economicsectors.
1 MR Madhavan co-founded and heads research at PRS Legislative Research. He is a member of ASER Centre’s advisory board.

14 ASER 2011
From a Right to Schooling to a Right to Learning:Rethinking education finance
Yamini Aiyar 1
1 Director, Accountability Initiative, Centre for Policy Research. This is a summary version of a longer introduction to the PAISA District Studies, 2011. Forthose interested, the study is available on the following link: www.accountabilityindia.in2 Ministry of Human Resource Development (2011) ‘Analysis of Budgeted Expenditure on Education 2007-08 to 2009-10’, Statement No. 7, Plan and Non-Plan Budgeted Expenditure on Elementary Education (Revenue Account), www.education.nic.in/planbudget/ABE-2007-10.pdf3 Some states like Bihar and Madhya Pradesh experimented with decentralizing the hiring process to local governments, who were empowered only to hirecontract teachers. However, even here all critical decisions related to salaries and regularization remained with the administration.
India’s elementary education system is at a crossroads. In 2009, the Indian Parliament passed the Right toEducation (RTE) Act guaranteeing the provision of free and compulsory education to all children between theages of 6 to 14 years. At the heart of the law is a guarantee to ensure ‘age-appropriate mainstreaming’ for allchildren. In other words, the Act is a guarantee that every child in India acquires skills and knowledge appropriateto her age. Now, as efforts to deliver on this guarantee gain ground, the country faces an important choice:should elementary education be delivered through the current model that focuses on the expansion of schoolingthrough a top-down, centralized delivery system? Or should we use the RTE as an opportunity to fundamentallyalter the current system and create a bottom-up delivery model that builds on an understanding of children’slearning needs and privileges accountability for learning rather than schooling?
For decades, the primary goal of the Indian government’s elementary education policy has been to create auniversal elementary education system by expanding schooling through inputs. Substantial finances have beenprovided to meet this goal. Between 2007-08 and 2009-10, India’s elementary education budget increased fromRs. 68,710 to Rs. 97,255 crore in 2009-10.2
Most of this money has been used to build school-level inputs through a large education bureaucracy controlledand managed by state and central governments. To illustrate, PAISA analyzed the elementary education budgetsof 7 states in the country for 2009-10 and 2010-11 (see Table 1 below for a state by state analysis). Accordingto PAISA, on average, 77% of the education budget is invested in teachers and management costs. All criticalteacher-related decision-making, for instance hiring or salary payment, lies with the state administration.3 Followingteachers, the next largest investment is on the creation of school infrastructure - 15% of the budget. Funds forinfrastructure development are often channeled to schools; however, key decisions related to sanctions andprocurement are taken by the district. Importantly, while a school can demand infrastructure funds, it has nodecision-making power over the timing of receipt of these funds and de-facto funds have to be spent based onpriorities set by the state and district administration. Interventions aimed directly at children, such as the provisionof free textbooks and uniforms and addressing the problem of out of school children, account for just 7% of thetotal investment.
Interwoven in this top-down system is an intent to involve parents in decision-making. In 2001, the Governmentof India (GOI) launched the Sarva Shiksha Abhiyan ((SSA), now the programmatic vehicle for the delivery of theRTE) with a mandate that expenditure decisions be taken based on plans made at the school level throughVillage Education Committees (VEC). These plans are then aggregated at the district and state levels. Drawingon this model, the RTE mandates the creation of School Management Committees (SMCs) tasked with similarresponsibilities. Despite this bottom-up planning structure, the centralized delivery system has disempoweredthese committees and in fact created disincentives for parental participation in a number of ways:
Table 1. Breakdown of elementary education budgets in 7 states
Teachers 72% 59% 79% 64% 86% 83% 67%
School 13% 25% 9% 21% 5% 9% 19%
Children 4% 10% 1% 8% 5% 1% 10%
Quality 2% 1% 1% 1% 1% 2% 1%
Management 9% 4% 9% 5% 4% 4% 4%
Misc 0% 0% 1% 0% 0% 1% 0%
AndhraPradesh
Bihar HimachalPradesh
MadhyaPradesh
Maharashtra Rajasthan WestBengal

15ASER 2011
First, teachers, as pointed out already, are not accountable to SMCs.
Second, committees have spending powers over very little money. In 2010-11, committees had spending powersover just about 5% of SSA funds. Even these funds are expected to be spent based on norms set by GOI. So, ifa school wants to spend more than the norm on, say, purchasing teacher material or if a school wants to investmore in improving children’s reading capabilities by dipping in to its maintenance fund - it can’t. Table 2 belowoffers an illustrative example from Hyderabad of the different activities over which an SMC can actually takedecisions.
Third, governance inefficiencies further curtail SMC powers. As PAISA has repeatedly pointed out, school grantsrarely reach schools before October (the PAISA district studies found that on average school grants reach schoolbank accounts toward the end of September/early October). These delays in fund flows mean that needs at theschool often remain unmet owing to lack of money. More worryingly, PAISA found that in many districts,expenditures even for school grants are based on formal or informal orders received from district and blockofficials. Consequently, often monies are spent without adequate consideration to school needs.
In essence, SSA has promoted a bottom-up delivery system with no bottom-up control or decision-makingpower. The result is thus a de-facto centralized, top-down system.
4 Ministry of Human Resource Development (2011), ‘ Sarva ShIksha Abhiyan: Framework of Implementation’
Table 2. Activities for which SMCs in Hyderabad city can take decisions
The shift towards enhancing learning requires that the system focus on the needs of individual schools andchildren. GOI has argued that implementing the RTE requires a system that recognizes ‘the need for the creationof capacity within the education system and the school for addressing the diversified learning needs of differentgroups of children who are now in the school system.’4
School Management Committees hold the key to implementing such a decentralized structure. The first andmost critical step therefore in the shift from schooling to learning will be to empower school managementcommittees. There are three immediate reform measures that could be implemented to achieve this goal:
Activity Is SMCresolutionsufficient?
Is anyadditionalapprovalneeded?
From
whom?
How long willit
take?
Who can dothe procurementor appointment
What documents andother things will be
needed?
Desksand
Chairs
No Yes SSA Planning 2 months SSA office Approval of design;Three quotatiions
from local suppliers
SintexWaterTank
Yes No 2 weeks SMC Local purchase atPWD rates
RoofRepairs
No Yes SSA Civil / JE 1 month SMC + SSA Approval of workand measurements;
Materials boughtlocally as per PWDrates; vouchers of
paymentsmaintained
Ayah Yes No 1 week SMC Interview Noticewith Date and Time

16 ASER 2011
1. Moving away from the current norm-based funding system for SMCs to an untied block grant structure thatwould enable the school to take spending decisions based on its own felt needs. The quantum of the grantcould be determined on the basis of per-child enrollment in schools, thus linking grant amounts with school-specific characteristics.
2. Strengthening planning capacity through focused community level trainings. With the launch of RTE, budgetsfor community training have been significantly enhanced. However, for the moment, much of this moneyremains unspent as training is not priority. Prioritizing training and developing innovative methods to buildplanning capacity at the SMC level is essential.
3. Strengthening transparency and monitoring. A transparent tracking system holds the key to a strong,accountable, decentralized system of delivery. Building structures to ensure real time tracking of finances isthus critical.
Will this lead to more learning for school children? At the very least, such a system will serve to strengthenparent engagement and ownership with the school and encourage accountability to parents. This is a critical firststep.

17ASER 2011
Taking mothers alongRukmini Banerji 1
Not far from the village primary school, there was a group of women. I started chatting with them. “How is theeducation in this school?” I asked. “I send my children to school” said one lady. “I even send my son anddaughter to tuition and buy them books.” Several women joined the conversation. “How do you know if yourchild is learning well?” I wanted to know. “How can we tell?” they said. “We are not literate. But we send ourchildren to school and we send them to tuition also. So they must be learning.”
It was a mild November day in Rohtas district in south-western Bihar. Rohtas is known as the rice bowl of thestate. Canals criss-cross the district. The rice fields were green and stretched in all directions. Our village was inthe Dehri block. It was afternoon. School was over. Children had come home, left their books and bags andwere playing outside. Women sat in the sun cleaning rice and talking to each other. It felt good to sit in theafternoon sunshine. It was a good time for conversations.
I had been asking children to come and read. What I had were several sets of reading tasks - letters, words,simple paragraphs and a short 8-10 line story - all in big black font, printed on white paper. Children werecurious. I had been sitting on the edge of the women’s group. Children crowded around me, some looking overmy shoulder, some from the side. All of the texts contained basic, simple and familiar words that are easy tospell, everyday words, sentences and contexts that children could relate to. Nothing more than what is in the StdII textbook. Everyone tried to read. Many could read the letters and some could read the words, only a fewmanaged to read the paragraph and the story.
The women watched their children’s attempts. There was a woman in a blue sari. Her daughter was in Std 4 andcould not read. “Do you know if your child can read this?” I asked the blue sari mother. “How am I supposed toknow?” she argued back. “I myself cannot read.” “Which of these are the hardest to read, do you think?” Icontinued, pointing to the letters, words and sentences. “I don’t know. I am illiterate,” she answered, somewhatirritated. “Look at the paper, look at these things, what seems easy and what seems difficult?” Now my bluesari mother became adamant. “Why are you forcing me? I told you I cannot read.” On the sidelines, her eightyear old daughter was enjoying the interaction. Perhaps she was enjoying it because the tables were turned.She began to persuade her mother to focus on the paper. With some hesitation on her side and muchencouragement from her daughter, the lady adjusted her pallu on her head and leaned over. “This one must beeasy”, she said, pointing to the letters, “because many children could do it. That one (pointing to the story) is noteasy because even bigger children could not do it.”
“Okay”, I persisted. “Do you know when your child has a fever?” “Of course!!!” She looked at me in surprise;all mothers know when their child is sick. “What do you do when your child has a fever?” I asked her. The bluesari mother replied instantly. “That’s simple. I feel her forehead. If it is hot then I know she has a fever. I do somesimple things at home. If in two or three days the fever does not go down, I take her to the doctor. I can eventake her to a private doctor. I ask the doctor for some medicine. After another few days if the fever does not godown then I will take her back to the same doctor and fight with him.......” “So you have an MBBS degree” Isaid. “What is that?” she asked suspiciously. “That is a medical degree” I replied. “Oh no no” she laughed.“Remember I told you that I am illiterate!”
“I am very puzzled,” I continued. ‘Why is that even though you are illiterate you know exactly what you need todo when a child has fever but when it comes to her schooling you don’t do anything when she cannot read?”Now the blue sari mother was ready with her answer. “That is very simple” she explained. “We go to the doctoronly sometimes when there is problem. He cannot come to my house to cook and feed and take care of mychildren. I have to do it. But the teacher is with my child every day. My job is to send my child to school andteacher-ji’s job is to teach my child. I am doing my job and so she should do her job”.
India’s Parliament passed the Right to Education Act in 2009, thereby guaranteeing quality free and compulsoryeducation to all children in the age group six to fourteen across the country. While most of the provisions of theAct are concerned with ensuring adequate inputs to schools, there are four key elements that have the potentialto fundamentally transform the landscape of elementary education in India.
1 Rukmini Banerji is Director, ASER Centre

18 ASER 2011
First, in spirit the goal of the RTE Act is to ensure that every child (whether currently out of school or presentlyenrolled in school) has the opportunity to reach grade level competencies/educational levels appropriate to his orher age all the way up to age fourteen.
Second, continuous, comprehensive evaluation of children’s progress through the elementary years means thatteachers need to understand where the children are today, and plan for where to take them next based on thatunderstanding.
Third, efforts have to be made to explain children’s progress to parents.
Fourth, every school has to develop a School Development Plan with the help of the local School ManagementCommittee. By design, many members of these committees will be parents.
Today, almost all of India’s children are enrolled in school. The journey to ensure schooling for all has neededefforts from both sides - governments and communities. The credit goes to governments who provided schoolingand to parents who send their children to school. The next journey must be that of ensuring learning for all.Taking parents along on this journey is critical, urgent and long overdue. ASER 2011 shows that 46% of mothersof children who are in school today have not been to school themselves. At a rough estimate, there are probably100 million mothers who are like our blue sari mother in Rohtas. New methods and mechanisms need to beinnovated on scale to allow mothers to meaningfully participate in discussions and actions related to howchildren’s learning can be improved. Simple tools like those used in ASER are a good starting point. Withoutreal participation of parents, especially mothers, the key objectives of RTE cannot be effectively translated frompolicy into practice.

19ASER 2011
1,902 ASER partnersSuman Bhattacharjea 1
“Namaste, I am [name] from [organization] in [district], and I am xxASERs old”.
Every year, the ASER roll out in the field begins around Septemberwith state level training workshops for master trainers, one or twofrom each district in the state. Some come from ASER partnerorganizations and others from Pratham. There’s usually a mix of thosewho are four, five, or six “ASERs old” and those who are brand new,and this novel way of introducing themselves quickly separates theveterans from the ‘freshers’.
So where do all these people – around 1,000 master trainers and25,000 volunteers each year – actually come from? An incrediblevariety of partner organizations conduct ASER each year. From theDepartment of Sheep Husbandry in Kargil to Google in Gurgaon;from IIT Rourkee to Our Carrom Club in Manipur; from District Institutesfor Education and Training (DIETs) in Chhattisgarh to the Tejas MahilaMandal in Nagpur; from Deutsche Bank staff in Hyderabad to highschool students all across Arunachal Pradesh. These are the institutionsthat visit 300,000 households and meet 700,000 children each year.Year after year, they make ASER possible.
Given the basic calculation of close to 600 districts x 7 years, onemight expect the total number of partners to date to be higher still.But ASER has been fortunate to partner with organizations with asteady presence across multiple districts and even multiple states.For example, Kudumbashree in Kerala has participated in ASER fromits inception in 2005, and ‘did’ ASER in the entire state single handedlyfor six consecutive years. Then there’s Nehru Yuva Kendra, the networkof youth clubs whose huge presence across rural India has facilitatedASER every year in multiple districts across ten states.
Many organizations have participated in ASER more than once, andmore than 10% - 200 organizations –are veterans of four or moreASERs. Of these, 18 have been ASER partners every single year, from2005 to 2011 (see box). More than a third of these are located inJharkhand.
ASER has found twice as many partners in Maharashtra than in anyother state, testimony in part to the vibrant presence of colleges andnon government organizations, but also due to Pratham’s long historyand extensive network in the state. On the flip side, there are statesand districts where every year there’s a long struggle to find partners,and state ASER teams have on occasion come up with creativesolutions. In Kargil, the only people willing to travel extensively aroundthe district were personnel from the Department of Sheep Husbandry,who were pressed into service three years in a row. In Arunachal Pradesh, where colleges and NGOs are few andfar between, students from government secondary schools have been regular ASER volunteers.
Across India, some fascinating patterns emerge in terms of the type of organizations that do ASER. In Haryana,the ASER partner lists are heavily populated by colleges, and NGOs are sparse; whereas in Jharkhand, thesituation is exactly the reverse. In Nagaland and Meghalaya, ASER is conducted mainly by students’ unions, andin Rajasthan, large numbers of B.Ed colleges have joined in.
The increasing participation of DIETs across the country is a very welcome trend. In 2007, all DIETs in AndhraPradesh were instructed by the State Project Director (SPD) to participate in ASER, but since 2008, they havevoluntarily chosen to do so – and have conducted the survey across the entire state for five years in a row now.
Veteran ASER partners
Institutions that haveparticipated in ASER every year,from 2005 to 2011:
Abhiyan, Jharkhand
Akshara Foundation, Karnataka
Consumer Unity and TrustSociety, Rajasthan
EMBARK Youth Association,Karnataka
Gram Jyoti Kendra, Jharkhand
Grassroot, Tamil Nadu
Jawahar Jyoti Bal Vikas Kendra,Bihar
Jiral College, Odisha
Khaira College, Odisha
Kudumbashree, Kerala
Lohardaga Gram SwarajSansthan, Jharkhand
Lok Prerna Kendra, Jharkhand
Mahima College, Odisha
Malenadu Education and RuralDevelopment Society, Karnataka
Nav Bharat Jagriti Kendra,Jharkhand
Sahyogini, Jharkhand
Samajik Parivartan Sansthan,Jharkhand
Sankalp Bahuuddeshiya Prakalp,Maharashtra
1 Suman Bhattacharjea is Director (Research), ASER Centre
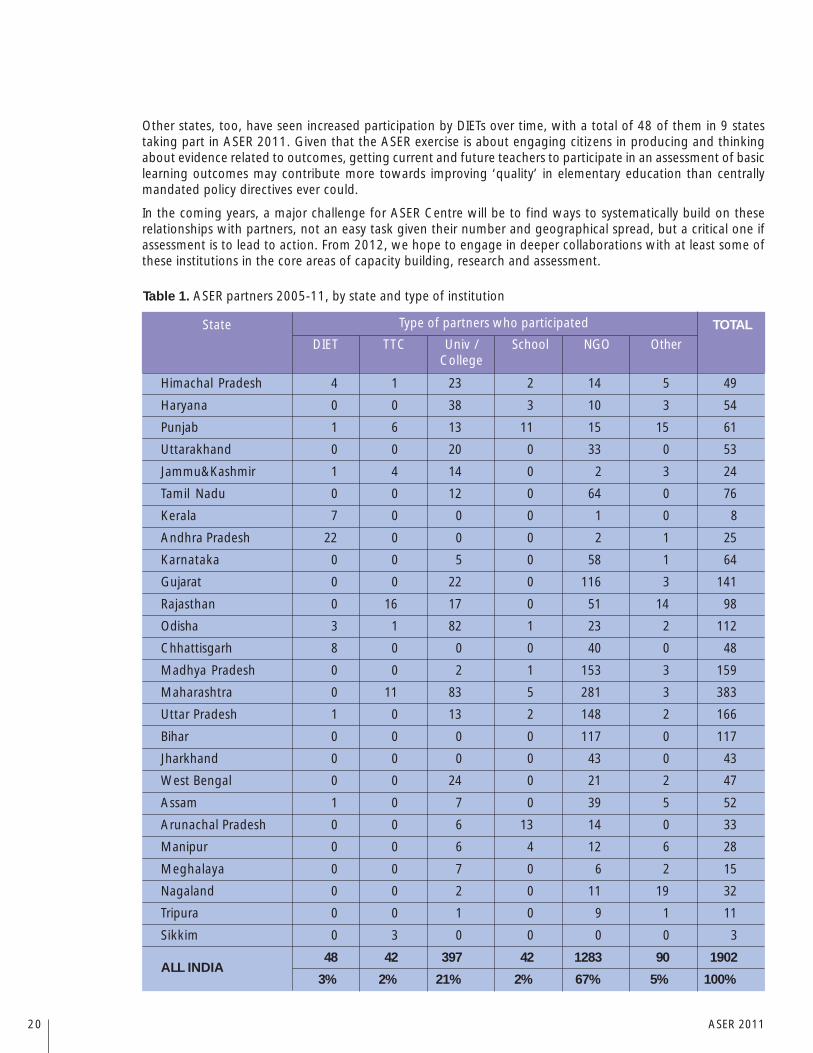
20 ASER 2011
Other states, too, have seen increased participation by DIETs over time, with a total of 48 of them in 9 statestaking part in ASER 2011. Given that the ASER exercise is about engaging citizens in producing and thinkingabout evidence related to outcomes, getting current and future teachers to participate in an assessment of basiclearning outcomes may contribute more towards improving ‘quality’ in elementary education than centrallymandated policy directives ever could.
In the coming years, a major challenge for ASER Centre will be to find ways to systematically build on theserelationships with partners, not an easy task given their number and geographical spread, but a critical one ifassessment is to lead to action. From 2012, we hope to engage in deeper collaborations with at least some ofthese institutions in the core areas of capacity building, research and assessment.
Himachal Pradesh 4 1 23 2 14 5 49
Haryana 0 0 38 3 10 3 54
Punjab 1 6 13 11 15 15 61
Uttarakhand 0 0 20 0 33 0 53
Jammu&Kashmir 1 4 14 0 2 3 24
Tamil Nadu 0 0 12 0 64 0 76
Kerala 7 0 0 0 1 0 8
Andhra Pradesh 22 0 0 0 2 1 25
Karnataka 0 0 5 0 58 1 64
Gujarat 0 0 22 0 116 3 141
Rajasthan 0 16 17 0 51 14 98
Odisha 3 1 82 1 23 2 112
Chhattisgarh 8 0 0 0 40 0 48
Madhya Pradesh 0 0 2 1 153 3 159
Maharashtra 0 11 83 5 281 3 383
Uttar Pradesh 1 0 13 2 148 2 166
Bihar 0 0 0 0 117 0 117
Jharkhand 0 0 0 0 43 0 43
West Bengal 0 0 24 0 21 2 47
Assam 1 0 7 0 39 5 52
Arunachal Pradesh 0 0 6 13 14 0 33
Manipur 0 0 6 4 12 6 28
Meghalaya 0 0 7 0 6 2 15
Nagaland 0 0 2 0 11 19 32
Tripura 0 0 1 0 9 1 11
Sikkim 0 3 0 0 0 0 3
48 42 397 42 1283 90 1902
3% 2% 21% 2% 67% 5% 100%ALL INDIA
State TOTALType of partners who participated
DIET TTC Univ /College
School NGO Other
Table 1. ASER partners 2005-11, by state and type of institution

21ASER 2011
From Mumbai, Multan to Mombasa or Karachi,Kanyakumari to Kilamanjaro…!
Baela Raza Jamil 1
In Lahore today (January 2, 2012), we kicked off our week-long training of 35 ASER district and provincialassociates from all 9 regions of the country to build capacity for disseminating the results of ASER 2011. Thespirit of ASER was buzzing with a unique chemistry of a youthful group. We decided to begin with personalstatements on ‘aser ne kya aser kiya’ (how did ASER impact me?) followed by names and backgrounds in thatorder. These confessional or declaratory identity markers are vital for the growing global ASER community, fordefining ourselves in this unique program of citizen-led surveys. ASER is, after all, about citizens’ voices onlearning and accountability. It can only be captured through an extension of the personal and the public voice asone, and we at ASER Pakistan are practicing that art of expression that commits to the challenges of learningand improvement - from parents and teacher union members to elected representatives. ASER truly bridges thepublic and private divide, merging field, theory and practice to address the crises in and opportunities foreducation.
A journey that began perhaps as education tourism for the Pakistani civil society organizations in the summer of2006-7 just outside Jaipur, Rajasthan and Delhi through open source sharing, truly hallmarked as the PrathamWay, has now been mainstreamed as an annual ritual for the measuring of education systems in Pakistan for thethird year running. UWEZO in East Africa and ASER India are comrades in arms for informing and taking actionfor the EFA movement. With almost one million children surveyed in 5 countries annually, the methodology forliteracy and numeracy measurement in ASER is neither ‘quick nor dirty’ but very rigorous. As the countdown to2015 gets underway, the local, national and global community has come to expect that this survey will provideinformation about progress made and challenges remaining.
Dialogues are intensifying on: whole system/whole school reforms; what assessments tell us about learninggaps across gender and geographies; how to bridge inequality gaps; whether consensus is possible on thetheme of ‘quality’ exacerbating the inequality and transition gaps at all levels of the education spectrum. Theever-widening relevance gap due to knowledge obsolescence in a world inhabited by 7 billion people compelsus towards perennial renewal of ‘learning’ interfaced with local contexts and accessible technologies in classroomsand outside. While the centrality of the teacher as the universal provocateur and innovator cannot be minimized,what does this mean for countries diverse in terrain, practices and resources?
Like ASER India, or UWEZO in East Africa, we are deeply cognizant that ASER Pakistan is not about naming andshaming governments but really about calling citizens to action as the primary stakeholders – what is to be donefor OUR children and what can we do NOW? On a popular note the India-Pakistan exchanges for ASER andChalo Parho Barho (let’s read and grow) initiatives are affectionately termed as the learning caravans ‘fromMumbai to Multan’. As teams navigate the spectrum of emergent relationships from South Asia to Africa in2012 these could be from Mumbai, Multan to Mombasa or from Karachi, Kanyakumari to Kilamanjaro! Eitherway, the collaborations for people-led research will generate new genres of monitoring and sharing of learningresources. We love them at ITA/SAFED and are proud of the emergent multiple and distributed centers ofleadership triggered by ASER India in 2008, and would be happy to support other South Asian countries in thismuch needed people’s enterprise of claiming their fundamental rights to quality education.
1 Baela Raza Jamil is Director, Programs for Idara-e-Taleem-o-Aagahi (ITA) and Coordinator for the South Asian Forum for Education Development (SAFED),Pakistan

22 ASER 2011
Addressing inequalities:Breaking the cycles of illiteracy
John Mugo 1
In August 2011, Zippora, Grace and I visited ASER from Uwezo East Africa. The experience in Delhi wasrefreshing, providing a taste of what Pratham and ASER are doing to promote learning in the various states inIndia. But besides the walk through Safdarjung, or the night train ride to Lucknow, or even the breath-taking visitto the Taj Mahal, one memory lingers vivid - the contrast I experienced in one rural village, around 30 kilometersfrom Delhi.
As I cowardly walked behind my ASER friends to test children in this village, unsure whether the buffaloes wouldattack (the Kenyan buffalo is extremely wild), some children and mothers disappeared behind doors, not surewhat our mission was. Getting them to direct us to a certain household took time as they could not understandwell, nor could they read the list of names we attempted to present to them. But anyhow, we always got our feetinto the right households. The encounter with so many non-literate parents openly revealed the hard time theirchildren had, trying to break the chains of illiteracy in households without role models. Adults and childrenlooked curiously at me, wondering perhaps which state of India I was from, but lacking the confidence to ask.On a number of occasions, I volunteered, through a translator, to reveal that I came from Africa, a country calledKenya. More often than not, this was followed by plain nods of appreciation, with no further discussion.
But a little bit later, we walked into a well-built home, met a neatly-dressed father. Before I could sit down, herequested his daughter to offer me a glass of water. Hardly did I know the hospitality awaiting me. As we roseto proceed to the next household, the man quickly called in Hindi - ask this visitor to remain with us, and tell usmore about Africa! This caught me off-guard, after the rhythm of under-confident and non-literate parents. I wasconfused, since I wanted to experience a little bit more of households and children. But my colleagues werequick to come to a decision - you remain, we will come back to collect you. I sat down again, the mandisappeared behind the curtains and reappeared with a bowl of sweets and more water. I learned that he wasan advocate. We held discussions in English (with translations for the daughter) comparing learning in India andin Kenya, and analyzing the various challenges related to poor quality of education. The confident and brilliantdaughter informed me that she wanted to be a world badminton star, but her priority was also to get goodgrades in school.
The contrast between these families was very familiar to me, as this is often the inequality between the urbanand rural, the poor and the wealthy in most parts of Kenya. But the most disturbing observation relates to theextent to which these inequalities are affecting learning. In Kenya, we have established that children of educatedmothers and fathers are by far more likely to remain in school and acquire basic learning competences, ascompared to their counterparts whose parents have not completed the primary school cycle. Indeed, girls whosemothers have no schooling are 7 times more likely to be out of school than their peers whose mothers havecompleted primary education. Yet, the Uwezo Kenya findings reveal that 15% of fathers and 19% of mothershad never been to school. This is truly the biggest challenge of literacy. In both Kenya and India, a certain cycleis definitely prevailing - recycling illiteracy down the generations.
My thought is that just as we consider orphans, children with disability and girls as vulnerable children andchildren with special learning needs, I would argue that children of non-literate parents need to be included inthis category. Only if we focus on breaking the illiteracy cycles within these households, can we truly break theilliteracy cycles in our countries.
But thanks for the water and the sweets!
1 John Mugo is Country Coordinator, Uwezo Kenya. Adapted from the ASER model, Uwezo is a four year initiative that aims to improve competencies inliteracy and numeracy among children aged 6-16 in Kenya, Tanzania and Uganda, by using an innovative approach to social change that is citizen drivenand accountable to the public.

23ASER 2011
About the survey

24 ASER 2011
What’s new in ASER 2011
The purpose of ASER 2011’s rapid assessment survey in rural areas is twofold: (i) to get reliable estimates of thestatus of children’s schooling and basic learning (reading and arithmetic level) at the district level; and (ii) tomeasure the change in these basic learning and school statistics from last year. Every year a core set of questionsregarding schooling status and basic learning levels remains the same. However a set of new questions areadded for exploring different dimensions of schooling and learning in the elementary stage. The latter set ofquestions is different each year.
ASER 2011 brings together elements from various previous ASERs. The core questions on school status and basicreading and arithmetic remain. From 2009-10, we retain questions on paid tuition, parents’ education, householdand village characteristics. ASER 2011 once again visited one government primary school in every sampledvillage.
Sampling Strategy (Household sample - children’s learning and enrollment data)
The sampling strategy used helps to generate a representative picture of each district. All rural districts aresurveyed. The estimates obtained are then aggregated (using appropriate weights) to the state and all-Indialevels. Like last year, the sample size is 600 households per district. The sample is obtained by selecting 30villages per district and 20 households per village.
The villages were randomly selected using the village directory of the 2001 Census. The sampling was doneusing the PPS (Probability Proportional to Size) sampling technique. PPS is a widely used standard samplingtechnique and is the appropriate technique to use when the sampling units are of different sizes. In our case,the sampling units are the villages. This method allows villages with larger populations to have a higher chanceof being selected in the sample.
In ASER 2010, we retained 10 villages from 2008 and 2009 and added 10 new villages. In ASER 2011 wedropped the 10 villages from ASER 2008, kept the 10 villages from 2009 and 2010 and added 10 more villagesfrom the Census village directory. The 10 new villages were also chosen using PPS. The 20 old villages and the10 new villages will give us a “rotating panel” of villages, which generates more precise estimates of changes.Since one of the objectives of ASER is to measure the change in learning, creating a panel is a more appropriatesampling strategy.
Each district receives a village list with appropriate block information along with the data from the 2001Census on total number of households and total population. The village list also specifies which villages are from2009, from 2010 and which are new villages.
Like past ASERs, the village list is final and cannot be replaced. This is to maintain randomness of the sample toobtain reliable estimates.
For further information
The ASER team has consulted with national level sampling experts including those at NSSO and ISI. For moreinformation, please email [email protected].
Note on sampling : ASER 2011 RuralWilima Wadhwa

25ASER 2011
ASER 2011 – Training
Each year since 2005, ASER has been done in practically every rural district in the country. In every district,ASER is conducted by volunteers from a local organization in the district; these are colleges and universities,NGOs, youth groups, women’s organizations and others. We estimate that close to 25,000 young peoplevolunteer to do ASER each year. This is how we are able to reach close to 3,00,000 households and meet morethan 7,00,000 children annually. ASER is the largest annual effort to understand the status of schooling andlearning of children in India. For such an effort to sustain itself year after year, it is critical to focus on strengtheningand improving its internal processes. Training is one of the most important processes that help us to equip ourvolunteers with skills necessary for surveying a village and assessing children.
Typically, ASER follows a 3 tier training structure. The National Workshop is followed by a state level training inevery state. This is followed by district level training where volunteers are trained to conduct the ASER survey.
National Workshop: During this workshop ASER state teams are oriented on ASER processes and surveymaterial for the year is finalized. The workshop is also used to plan for state level trainings and partner selection.Each ASER state team comprises anywhere between 2 to 5 full time people, depending on the size and complexityof the state.1
New features this year:
■ An important feature of the National Workshop this year was the emphasis given to mock trainings. Memberswere informed in advance about the topics they had to train on and thus had an opportunity to plan theircontent and delivery.
■ An elaborate recheck process was designed this year. The formats were piloted in the National Workshopand subsequent discussions during the workshop helped to crystallize the process.
State level training workshops: These workshops prepare Master Trainers who will then take charge ofrolling out ASER in their districts. Master Trainers are usually a combination of participants from the districtlocal partners and Pratham team members. Close to 800 Master Trainers from partner organizations participatedin ASER 2011.
Usually, state level trainings are organized for 4 days and have four main components:
■ Classroom sessions: To orient the participants on ASER process. Simple presentations and case studieshelp state teams carry out these sessions.
■ Field practice sessions: Every element of ASER is practised extensively in the field. During the workshop,participants and trainers go to nearby villages.
■ Mock Training: These sessions are intended to improve the training capabilities of participants and thusprepare them to impart training at the district level.
■ Quiz: A quiz is administered towards the end of each state level training and immediate feedback is providedto participants. This helps to ensure that all participants have understood the ASER process and to identifyparticipants who may not have obtained the minimal understanding required to conduct ASER.
Performance in mock trainings, field visits and the quiz was analyzed to identify weak Master Trainers, whowere either eliminated or provided with additional support during district trainings.
District level training workshops: In the past, these trainings were generally held for 2 days. However, inorder to improve the quality of training, the time for training was increased for ASER 2011. Trainings in mostdistricts were organized for 3 days this year. Like state level trainings, the key elements of district trainingsincluded classroom sessions, field practice sessions, and a quiz. Typically, in most districts, volunteers scoringlow on the quiz were either eliminated or paired with strong volunteers to carry out the survey.
1 ASER state team members are called ASER Associates or ASER Regional Team members. They are “fellows” with ASER Centre for a period of 2 -3 years.In addition to leading all ASER related activities in their state, they also participate in a course run by ASER Centre on assessment, survey, evaluation,research and communication. This course has recently received certification from Indira Gandhi National Open University.

26 ASER 2011
Some useful and effective innovations this year included the use of large flex banners. At the district level it isdifficult to have a projector to show the survey formats to the whole group while training. To deal with thisproblem, we printed our survey formats on large flex banners that could be displayed easily while explaininghow to fill survey formats to volunteers. These banners are quite portable, easy to use and an effective low costsubstitute for projectors.
Another innovation implemented in most states for ASER 2011 was the establishment of a “call centre” tosupport master trainers and volunteers in the field.
Monitoring of trainings: A few processes were instated to ensure that the important aspects of trainingswere implemented across all state and district trainings. Some of these were:
■ Call Centre: In most states, a person was assigned to interact with the Master Trainers on a daily basis andensure that they have taken care of the basic processes in trainings, survey and recheck
■ District Compilation Sheet: Survey results for every village in a district were compiled in a district compilationsheet. The sheet also had quiz marks and attendance records for volunteers. A lot of emphasis was given onthis sheet for monitoring and recheck and it was ensured that quiz scores and daily attendance of volunteersare entered.
■ In addition, most state trainings were attended by the respective Pratham State Head and a member of theCentral ASER team.
Our effort each year is to improve our training processes. We have been able to substantially improve thequality of trainings this year. However, there is still scope to improve the training skills of our master trainers aswell the quality of trainings at the district level. The detailed feedback received from ASER staff as well as froman external consultant will be instrumental in enabling us to make further improvements next year.

27ASER 2011
ASER 2011 – Monitoring & Recheck
The credibility of any survey rests on the validity of its data. Over the past 6 years, many measures have beentaken to ensure that the ASER survey is done as well as possible. In 2011, we went one step further. Keepingin mind the cost and time constraints, and drawing on the extensive field experiences of our ASER team frompast years, we instituted some new processes with a view to provide more support to the survey in the field andto further strengthen the survey.
Some of the major changes were:
■ Training Duration – Training for volunteers was extended to 3 days in most districts instead of the usual 2days as in past years.
■ Survey Duration – In most districts, the survey was conducted on two consecutive weekends instead of one.This allowed increased amount of monitoring and recheck of villages between the two weekends.
■ Purposive Monitoring & Recheck – Almost everywhere, villages to be monitored and rechecked were selectedon the basis of certain predefined criteria. This ensured that poorly surveyed villages could be identified andresurveyed immediately. In previous years, villages to be rechecked were selected randomly
■ Documentation – For the first time in ASER 2011, we recorded contact numbers, attendance informationand quiz performance of all 25,000 surveyors. These data will be used for further analyses and disseminationpurposes.
In ASER 2011, approximately 41% of all villages surveyed were either monitored or rechecked by MasterTrainers.
Some new features in ASER 2011 for supporting ASER in the field:
■ Call Centre – In many states, an ASER call centre was set up at the state level. An ASER team member wasresponsible for regularly telephoning Master Trainers in every district to monitor the progress of the survey.This ensured instant troubleshooting of problems and prompt support to remote or problematic districts.
■ Monitoring and Recheck – This year’s process had several new elements and operated at different levels:1
● Master Trainers visited at least four villages per district during the weekends when the survey was in thefield.
● Master Trainers visited 4-8 villages out of the 30 villages in the district to recheck. These villages wereselected based on examining the survey formats that were handed back by the volunteers and a districtsummary sheet compiled by Master Trainers.
● A recheck was also done across 14 states and 43 districts by a central team of ASER staff. These werecross-state visits by ASER team members from other states.
● SMS Recheck – In Rajasthan, Gujarat, Chhattisgarh and Himachal Pradesh, Master Trainers texted testingdata to a designated phone number. All the SMSs could be viewed on and downloaded from a website.These numbers were then analyzed by members of the ASER Central team and recheck villages chosen.This also enabled us to get a sense of the quality of the survey in these states at a very early stage.
In most cases, rechecked villages where problems were found were re-surveyed. If for any reason this was notpossible, the data for that village was dropped.
1 At ASER Centre, we lay great emphasis on piloting all formats before they are finalized. The extremely detailed recheck format which was used this yearwas extensively piloted by all ASER team members who have many years of experience in the field. More importantly, the monitoring and recheck processwas explained to and practiced by all master trainers in state trainings. Close to 25% of the time at these trainings was devoted to understanding andpractising these processes.

28 ASER 2011
How to make a map and make sections
To start MAKING A MAP — walk & talk:
■ To get to know the village, walk around the whole village first before you start mapping. Talk to people:How many different hamlets/sections are there in the village? Where are they located? What is the estimatednumber of households in each hamlet/section? Ask the children to take you around the village. Tell themabout ASER. This initial process of walking and talking may take more than an hour.
Map:
■ Rough map : It is often helpful to first draw all the roads or paths leading to the village. It helps to firstdraw a map on the ground so that people around you can see what is being done. Use the help of localpeople to show the main landmarks – temples, mosques, river, road, school, bus-stop, panchayat bhavan,shop etc. Mark the main roads/streets/paths through the village prominently on the map. If you can, markthe directions – north, south, east, west.
■ Final map : Once everyone agrees that this map is a good representation of the village, and it matches withyour experience of having walked around the whole village, copy it on to the map sheet that has been givento you.
ONCE THE MAP IS MADE, WE NEED TO PICK 4 SECTIONS OF IT. WE WILL SURVEY 5 HOUSEHOLDS INEACH SECTION.
■ How to mark and number sections on the map you have made?
1. VILLAGE WITH HAMLETS
If the village is divided into hamlets:
1
2 34
5
● Mark the hamlets on the map and indicate approximate numberof households in each hamlet.
● If the village consists of more than 4 different hamlets, thenmake chits with numbers for each hamlet. Randomly pick 4chits.
● On the map, indicate which hamlets were randomly pickedfor surveying. If there are 4 or less hamlets, then go to all ofthese hamlets.
● Do not worry if there are more people in one hamlet than inanother. We will survey a hamlet as long as there are householdsin it.
● Note: Marking selected hamlets on the map is very important.It helps in re-check.
2. VILLAGE WITH LESS THAN 4 HAMLETS
● 2 hamlets: Divide each hamlet in 2 parts and take 5 households from each section.
● 3 hamlets: Take 7,7 and 6 households from the 3 hamlets respectively.
WHAT TO DO IF :
● The hamlet has less than 5 households - then survey all thehouseholds in the hamlet and survey the remaining householdsfrom other hamlets.
● The village has less than 20 households- then survey all thehouseholds in the village.
3. CONTINUOUS VILLAGE
If it is a village with continuous habitations:
● Divide the entire village into 4 sections geographically.
● For each section, note the estimated number of households.
● We will survey all 4 sections of the village.

29ASER 2011
What to do in each section/hamlet
In the entire village, information will be collected from a total of 20 randomly selected households.
To do this, you need to select 5 households from each of the 4 previously selected hamlets/sections, regardlessof the total number of households in each hamlet or section. Use the following procedure:
■ Go to each selected hamlet/section. Try to find the central point in that hamlet/section. Stand facingdwellings in the center of the habitation and start household selection from the left.
■ Select households to survey using the every 5th household rule. While selecting households count onlythose dwellings that are residential.
■ Household in this case refers to every 'door or entrance to a house from the street'.
WHAT TO DO IF :
● The household has multiple kitchens: In each house ask how many kitchens or 'chulhas' there are?If there is more than one kitchen in a household, then randomly select any one of the kitchens inthat household. You will survey only those individuals who eat from the selected kitchen. After completingsurvey in this house proceed to next 5th house (counting from the next house on the street, NOT fromthe next 'Chulha').
● The household has no children: If there are no children at all or no children in the age group 3 - 16in the selected household but there are inhabitants, INCLUDE THAT HOUSEHOLD. Take the informationabout the name of head of the household, total number of members of the household and householdassets. Such a household WILL COUNT as one of the 5 surveyed households in each hamlet/section butNO information about mothers or fathers will be collected.
● The house is closed: If the selected house is closed or if there is nobody at home, note that down onyour compilation sheet as "house closed". THIS HOUSEHOLD DOES NOT COUNT AS A SURVEYEDHOUSEHOLD. DO NOT INCLUDE THIS HOUSEHOLD IN THE SURVEY SHEET. Move to the next/adjacentopen house.
● There is no response: If a household refuses to participate, record the house on your compilationsheet in the "No response" box. However, as above, THIS HOUSEHOLD DOES NOT COUNT AS ASURVEYED HOUSEHOLD. DO NOT INCLUDE THIS HOUSEHOLD IN THE SURVEY SHEET. Move on tothe next adjacent house.
■ Continue until you have 5 households in that hamlet/section in which the inhabitants were present, andthey participated in the survey. Remember that you need to survey 5 households, regardless of the numberof children you find.
■ If you have reached the end of the section before 5 households are sampled, go around again using thesame every 5th household rule. If a surveyed household gets selected again then go to the next household.Continue till you have 5 households in the section.
■ Stop after you have completed 5 households in the hamlet/section. Now move to the next selectedhamlet/section. Follow the same process using the 5th household rule.
■ Make sure that you go to households ONLY when children are likely to be at home. This means that itshould be on a Sunday.

30 ASER 2011
12
34
5
6 79 10
13 12 11
1615
14
1718192021
22
3231
3029
23 2425
262728
CENTRE
Locked/No response
What to do in a housewith
mutiple kitchens?
How to sample households in a hamlet in a village?
8

31ASER 2011
What to do in each household
1. General information
Household Number: Write down the household number in every sheet. Write 1 for the first householdsurveyed, 2 for the second household surveyed and so on till the 20th household.
Total number of members in the household who eat from the same kitchen: Ask the adults present andwrite down the total number. If there are multiple kitchens/’chulhas’ in the household, include only thosehousehold members who eat from the same kitchen.
2. Information about children aged 3-16 years
We will collect information from the sample household about all children age 3-16 who regularly live inthe household and eat from the same kitchen. Ask members of the household as well as neighbours tohelp you identify these children. ALL such children should be included, even if their parents live in anothervillage or if they are the children of the domestic help in the household.
WHAT TO DO IF:
■ There are older children: Often older girls and boys (in the age group 11 to 16) may not be thoughtof as children. Be sensitive to this issue. Avoid saying “children”. Probe about who all live in thehousehold to make sure that nobody in this age group gets left out. Often older children who cannot readare very shy and hesitant about being tested.
■ Children not at home: Sometimes children may not be at home during your visit to the house. They maybe in the market, fields or even visiting a nearby town/village.If the child is somewhere nearby, but not athome, take down information about the child, like name, age, and schooling status. Ask family members tocall the child so that you can speak to her/him directly. If she does not come immediately, mark thathousehold and revisit it once you are done surveying the other households. In case you are unable tomeet with the child directly, because she/he may be outside the village, leave the testing information blank.
■ There are relatives’ children who live in the sample household on regular basis: Sometime you willfind children of relatives who live in the sample household. We will include these children because they livein the same household on a regular basis. But we will NOT take information about their parents becausethey do not live in this household.
■ Children not living in the household: If there are children in the family who do not regularly live in thehousehold, for e.g. children who are studying in another village or children who got married and are livingelsewhere, we will not include them
■ There are visiting children: Do not include children who have come to visit their relatives or friends inthe sampled village or household. They do not regularly live in the sample household.
Many children may come up to you and want to be included out of curiosity. Do not discourage children whowant to be tested. You can interact with them. But data must be noted down ONLY for children living in the 20households that have been randomly selected.
Now that we have identified which children to survey, let us review what information to collectabout each child. One row of the household format will be used for each child.
■ Mother’s name: At the beginning of the entry for each child, we will write the name of the child’s mother.Note down her name ONLY if she is alive and regularly living in the household. If the child’s mother is deador not living in the household we will NOT write her name.
If the mother has died or has been divorced and the child’s stepmother (father’s present wife) is living in thehousehold, we will include her as the child’s mother.
■ Father’s background information: At the end of the entry for each child, we ask for the age and schoolinginformation of the child’s father. As in the case of the mother, we will only write this information if thefather is alive and regularly living in the household. If the father is dead or not living in the household we willnot ask for this information.

32 ASER 2011
If the father has died or has been divorced and the child’s stepfather (mother’s present husband) is living inthe household, we will include him as the child’s father.
Child’s name, age, sex and schooling status:
The child’s name, age and sex should be filled for all children aged 3 to 16 from the sample household selectedfor the survey.
After noting down these details, there are two main blocks of information about each child.
Children aged 3-16 years
The first block “For age 3-16” is to be asked for ALL children aged 3 to 16 in the household. On thehousehold sheet:
■ Note down if the child is attending anganwadi (ICDS), balwadi, or nursery/LKG/UKG, etc. This informationwill be recorded in the first column “Anganwadi or Pre-School Status”.
■ If the child goes to school, this information will be noted in the “Schooling Status” column. Note downtheir Std., whether they go to government/ private school, madarsa, EGS/AIE or any other school.
■ If the child has never been to any anganwadi/preschool or school etc., record it in the “Out of Schoolchildren (Never enrolled)” column.
■ For children who have dropped out of/left school, note this information in the “Out of School (Drop out)”column.
● Probe carefully to find out the class the child was in when she/he left/dropped out of school. Note theclass in which the child was studying when she/he dropped out irrespective of the fact whether thechild passed or failed in that class.
● Record the actual year when the child left school. E.g. if the child dropped out in 2002 write ‘2002’.Similarly if the child dropped out in the last few months write ‘2011’.
Children aged 5-16 years
The remaining blocks of information “For age 5-16” are to be filled ONLY for children aged 5 to 16.
■ Ask all children if they take any tuition, meaning paid classes in addition to regular school and note theresponse in “Tuition” column. If yes, ask if any school teacher takes the tuition class attended by thechild. The school teacher could be teaching in ANY school, not necessarily the school where the childstudies. If the child does not take tuition, do not ask this question.
■ Also ask children if they attend the specific school which you have/will be surveying and note it in the“Does child go to the surveyed school” section.
■ Askthe child/ parent what the official ‘medium of instruction’ in the child’s school is.
■ All children in this age group will be tested in basic reading and basic math. (We know that youngerchildren will not be able to read much or do sums but still follow the same process for all children so as tokeep the process uniform).
3. Mother’s background information
We will ask some additional questions about the mother of each child in the age group 3-16 years who hasbeen surveyed. We will ONLY ask this information about mothers whose names have been recorded earlier,against individual children’s name. No other mothers will be included.
If the mother is not present in the household at the time of the survey, ask other adults/members in the familyand note down the information .

33ASER 2011
For each mother, we will ask her age, whether she has attended school or not and if yes, up to what class hasshe studied. Note down the class that she has successfully completed/passed. For example, if she has gone toschool but says that she did not complete Std 1, enter 0 under ‘Std. completed’.
4. Children living outside the village (10-16 years)
Ask the child/adult the names of all children of the sampled household in the age group of 10-16 who liveoutside the village. (More than 6 months in a year)
■ The child from the sampled household means that if the child had been staying in the household, she wouldhave eaten from the same kitchen/chulha.
■ Living outside means
1. The child has been living away from home for more than 6 months a year, or
2. The child left home in the last 6 months and will be living away for more than 6 months a year in the future.
5. Household indicators
All information on household indicators is to be recorded based, as much as possible, on observationand evidence. However, if for some reason you cannot observe it note down what is reported by householdmembers only and not by others.
■ Type of house the child lives in: Types of houses are defined as follows:
● Pucca House: A pucca house is one which has walls and roof made of the following material:
■ Wall material: Burnt bricks, stones (packed with lime or cement), cement concrete, timber, ekra etc
■ Roof Material: Tiles, GCI (Galvanised Corrugated Iron) sheets, asbestos cement sheet, RBC (ReinforcedBrick Concrete), RCC (Reinforced Cement Concrete), timber etc.
● Kutcha House: A Kutcha house is one which has walls and/or roof which are made of material otherthan those mentioned above, such as un-burnt bricks, bamboos, mud, grass, reeds, thatch, looselypacked stones, etc.
● Semi-Pucca house: A house that has fixed walls made of pucca material but the roof is made of materialother than those used for pucca house.
■ Electricity in the household:
● Mark yes or no by observing if the household has wires/electric meters and fittings or not.
● If there is an electricity connection, ask whether the household had electricity any time on the day ofyour visit, not necessarily when you are doing the survey.
■ Toilets: Mark yes or no by observing if there is a constructed toilet in the house. If you are not able toobserve, then ASK whether there is a constructed toilet or not.
■ Television: Mark yes or no by observing if the house has a television or not. If you don’t see one, ASK. Itdoes not matter if the television is in working condition or not.
■ Cable TV: If there is a TV in the household, ask whether there is cable TV. This includes any cable facilitywhich is paid for by the household (including Direct To Home (DTH) facility).
■ Mobile phone: Mark yes if any member of the household owns a mobile phone.
■ Reading material
● Newspaper: Mark yes if the household gets a newspaper every day.
● Other reading material: This includes story books, magazines, religious books, comics etc. but doesnot include calendars.
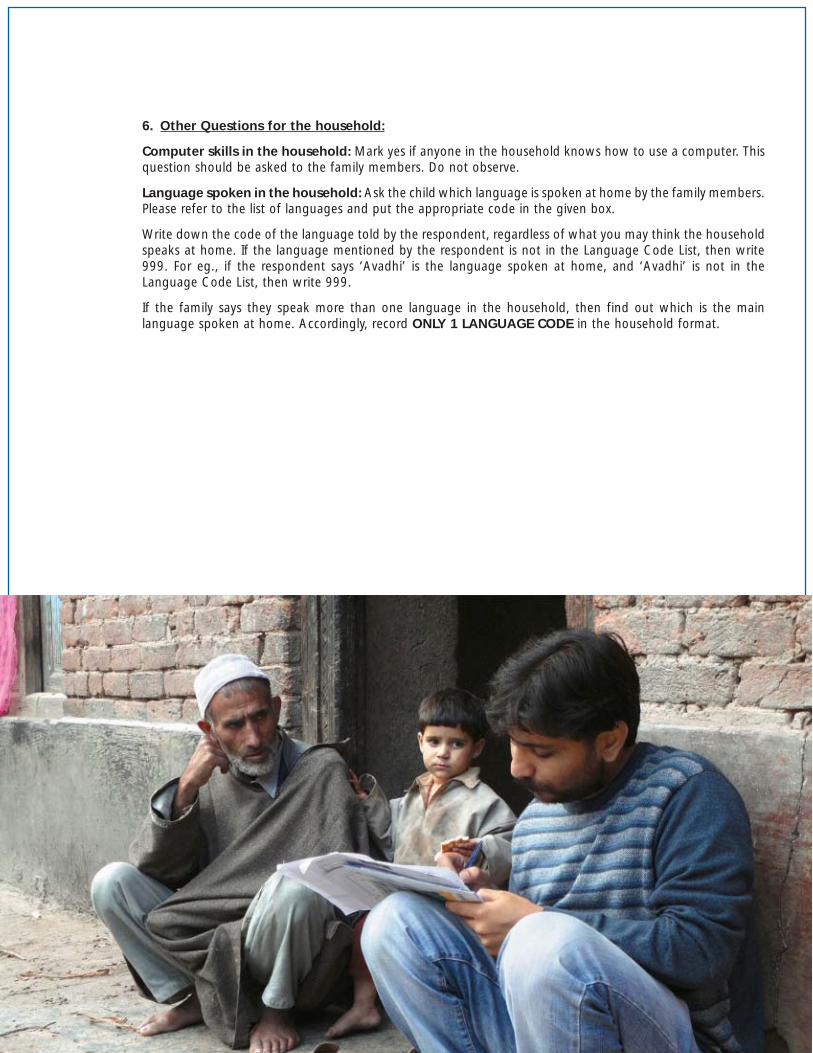
34 ASER 2011
6. Other Questions for the household:
Computer skills in the household: Mark yes if anyone in the household knows how to use a computer. Thisquestion should be asked to the family members. Do not observe.
Language spoken in the household: Ask the child which language is spoken at home by the family members.Please refer to the list of languages and put the appropriate code in the given box.
Write down the code of the language told by the respondent, regardless of what you may think the householdspeaks at home. If the language mentioned by the respondent is not in the Language Code List, then write999. For eg., if the respondent says ‘Avadhi’ is the language spoken at home, and ‘Avadhi’ is not in theLanguage Code List, then write 999.
If the family says they speak more than one language in the household, then find out which is the mainlanguage spoken at home. Accordingly, record ONLY 1 LANGUAGE CODE in the household format.

35ASER 2011
From 2005 to 2011: Evolution of ASER
ASER 2005Age group 6 – 14
Children were asked■ Enrollment status■ Type of school
Children also did:■ Reading tasks■ Arithmetic tasks
School visits
Sampling :Randomly selected20 ASER 2005 villages
.................................................................................................................................................................................................
......
......
......
......
......
......
......
......
......
......
......
......
......
......
......
......
......
......
......
......
......
......
......
......
......
......
......
......
......
......
......
......
......
......
......
......
......
......
......
..
......
......
......
......
......
......
......
......
......
......
......
......
......
......
......
......
......
......
......
......
......
......
......
......
......
......
......
......
......
......
......
......
......
......
......
......
......
......
......
...
......
......
......
......
......
......
......
......
......
......
......
......
......
......
......
......
......
......
......
......
......
......
......
......
......
......
......
......
......
......
......
......
......
......
......
......
......
......
......
...ASER 2006Age group 3 – 16
Children were asked■ Enrollment status■ Type of school
Children 5-16 also did:■ Reading tasks■ Arithmetic tasks
■ Comprehension tasks■ Writing tasks
Mother’s educationMothers were also asked toread a simple text
Sampling :Randomly selected20 ASER 2005 villages10 new ASER 2006 villages
ASER 2007Age group 3 – 16
Children were asked■ Enrollment status■ Type of school■ Tuition status
Children 5-16 also did:■ Reading tasks■ Arithmetic tasks
■ Comprehension tasks■ Problem solving tasks■ English tasks
Mother’s educationSchool visits
Sampling :Randomly selected10 ASER 2005 villages10 ASER 2006 villages10 new ASER 2007 villages
Age group 3-16
Children were asked■ Enrollment status■ Type of school
Children 5-16 also did:■ Reading tasks■ Arithmetic tasks
■ Telling time■ Currency tasks
Mother’s education
Household characteristicsVillage information
Sampling :Randomly selected10 ASER 2006 villages10 ASER 2007 villages10 new ASER 2008 villages
Age group 3-16
Children were asked■ Enrollment status■ Type of school■ Tuition status■ Pre-school status (Age 5-16)
Children 5-16 also did:■ Reading tasks■ Arithmetic tasks
■ English tasks
Mother’s educationFather’s educationMothers were also asked toread a simple text
Household characteristicsVillage informationSchool visits
Sampling :Randomly selected10 ASER 2007 villages10 ASER 2008 villages10 new ASER 2009 villages
Age group 3-16
Children were asked■ Enrollment status■ Type of school■ Tuition status
Children 5-16 also did:■ Reading tasks■ Arithmetic tasks
■ Everyday math tasks
Mother’s educationFather’s educationMothers were also asked todial a mobile number
Household characteristicsVillage informationSchool visits
Sampling :Randomly selected10 ASER 2008 villages10 ASER 2009 villages10 new ASER 2010 villages
Age group 3-16
Children were asked■ Enrollment status■ Type of school■ Tuition status
Children 5-16 also did:■ Reading tasks■ Arithmetic tasks
Mother’s educationFather’s education
Household characteristicsVillage informationSchool visits
Sampling :Randomly selected10 ASER 2009 villages10 ASER 2010 villages10 new ASER 2011 villages
ASER 2008 ASER 2009 ASER 2010 ASER 2011

36 ASER 2011
All children were assessed using a simple readingtool. The reading test has 4 categories:
■ Letters : Set of commonly used letters.
■ Words: Common familiar words with 2 letters and 1or 2 matras.
■ Level 1 (Std 1) text: Set of 4 simple linked sentences,each having no more than 4-5 words. These wordsor their equivalent are in the Std 1 textbook of thestate.
■ Level 2 (Std 2) text: “Short” story with 7-10 sentences.Sentence construction is straightforward, words arecommon and the context is familiar to children. Thesewords or their equivalent are in the Std 2 textbook ofthe state.
In developing these tools in each state language, care is taken to ENSURE
■ Comparability with the previous years’ tools with respect to word count, sentence count, type of word and conjoint letters inwords
■ Compatibility with the vocabulary and sentence construction used in Std 1 and Std 2 language textbooks of the state
■ Familiarity with words and context through extensive field piloting
Sample:Hindibasicreadingtest
Similartestsdevelopedin alllanguages
Childcan choosethelanguagein whichshe wantsto read.
ASER 2011 : Reading tasks

37ASER 2011
STARTHERE:
Ask the child to read either of the 2 paragraphs.Let the child choose the paragraph herself. If the child does not choose give her any one paragraph toread. Ask her to read it. Listen carefully to how she reads.
How to test reading?
The child is not at ‘Paragraph Level’ if she:■ Reads the text like a string of words, rather than
a sentence.■ Reads the text haltingly and stops very often.
OR■ Reads the text fluently but with more than 3
mistakes.
The child can read a paragraph, if she:■ Reads the text like she is reading a sentence, rather
than a string of words.■ Reads the text fluently and with ease, even if she
is reading slowly.■ Reads the text with not more than 3 mistakes.
If the child can read a paragraph, then ask the childto read the story.
If the child is not at ‘Paragraph Level’ then ask thechild to read words.
PARAGRAPH
WORDS STORYAsk the child to read any 5 words from the wordlist.Let the child choose the words herself. If she doesnot choose, then point out words to her.The child can read words, if she:■ Reads at least 4 out of the 5 words with ease.
Ask the child to read the story.The child is at ‘Story Level’ if she:■ Reads the text like she is reading a sentence,
rather than a string of words.■ Reads the text fluently and with ease. The child
may read slowly.■ Reads the text with not more than 3 mistakes.
If the child is at ‘Word Level’, then ask her to try toread the paragraph again and then follow theinstructions for paragraph level testing.If she can correctly and comfortably read words butis still struggling with the paragraph, then mark thechild at ‘Word Level’.If the child is not at word level (cannot correctlyread at least 4 out of the 5 words chosen), thenshow her the list of letters.
If the child is at ‘Story Level’ then mark the child atstory level.If the child is not at ‘Story Level’, then mark thechild at ‘Paragraph Level’.
LETTERS Ask the child to read any 5 letters from the letters list. Let the child choose the letters herself. If she does not choose, then point out letters to her. The child can read letters, if she:■ Correctly recognizes at least 4 out of 5 letters with ease.
If the child can read letters, then ask her to try reading the words again and then follow the instructions forword level testing.If she can read 4 out of 5 letters but cannot comfortably read words , then mark the child at ‘Letter Level’.If the child is not at letter level (cannot recognize 4 out of 5 letters chosen), then mark the child at ‘NothingLevel’.
IN THE SURVEY SHEET, MARK THE CHILD AT THE HIGHEST LEVEL SHE CAN REACH.

38 ASER 2011
All children were assessed using a simple arithmetictool. The arithmetic test has 4 categories:
■ Number recognition 1 to 9: randomly chosen numbersbetween 1 to 9
■ Number recognition 11 to 99: randomly chosennumbers between 11 to 99
■ Subtraction: 2 digit numerical problems withborrowing
■ Division: 3 digit by 1 digit numerical problems.
Sample:Arithmetictest
Similartestsdevelopedin alllanguages
ASER 2011 : Arithmetic tasks

39ASER 2011
How to test arithmetic?
STARTHERE:
Show the child the subtraction problems. She can choose a problem, if not you can point.
Ask the child what the numbers are and then ask her to identify the subtraction sign.
If the child is able to identify the numbers and the sign, ask her to write and solve the problem. Observeto see if the answer is correct.
Even if the first subtraction problem is answered wrong, still ask the child to solve the second questionwith the same method.
If the child makes a careless mistake, then give her another chance with the same question.
SUBTRACTION: 2 DIGIT WITH BORROWING
If she cannot do both subtraction problemscorrectly, then give her the number recognition (11-99) task. Even if the child can do one subtractionproblem correctly, give her the number recognition(11-99) task.
If she does both the subtraction problems correctly,ask her to do a division problem.
NUMBER RECOGNITION (11-99) DIVISION 3 digit by 1 digitPoint one by one to 5 numbers. Child can alsochoose.
Ask her to identify the numbers.
If she can correctly identify at least 4 out of 5numbers then mark her as a child who can“recognize numbers from 11-99.”
Show the child the division problems. She canchoose one to try. If not, then you pick one.
Ask her to write and solve the problem.
Observe what she does. If she is able to correctlysolve the problem, then mark her as a child whocan do ”division”. Note: The quotient and theremainder both have to be correct.
If the child makes a careless mistake, then give heranother chance with the same question.
If she cannot recognize numbers from 11-99, thengive her the number recognition (1-9) task.
If the child is unable to solve a division problemcorrectly, mark her as a child who can do“subtraction”.
Point one by one to 5 numbers. Child can alsochoose.
Ask her to identify numbers.
If she can correctly identify at least 4 out of 5numbers then mark her as a child who can“recognize numbers from 1-9.”
If not, mark her as a child who “cannot recognizenumbers” or “nothing”.
NUMBER RECOGNITION (1-9)
IN THE SURVEY SHEET, MARK THE CHILD AT THE HIGHEST LEVEL SHE CAN REACH.

40 ASER 2011
What to do in a school?
GENERAL INSTRUCTIONS
■ Visit any government school in the village with classes from Std 1 to 7/8. If there is no school in the villagewhich has classes from 1 to 7/8, then visit the government school with the highest enrollment in Std 1 to 4/5. If the village does not have a government school with primary classes, do not visit any school.
■ In the top box of the School Observation Sheet, put a tick according to the school type.
■ Note the time of entry, date and day of visit to the school.
■ Meet the Head Master(HM). If the HM is absent, then meet the senior most teacher of the school. Explainthe purpose and history of ASER and give the ‘Letter to the HM’. Be very polite. Assure the HM and teachersthat the name of the school will not be shared with anybody.
■ Ask the HM for the enrollment registers or any official document on the enrollment in that school.
Section 1: Children’s Enrollment & Attendance
■ Ask to see the registers of all the standards and fill in the enrollment. If a standard/class has many sections,then take total enrollment.
■ Then move around to the classes/areas where children are seated and take down their attendance class-wise by counting them yourself. You may need to seek help from the teachers to distinguish childrenclass-wise as they are normally found seated in mixed groups. In such a case, ask children from eachstandard to raise their hands. Count the number of raised hands and accordingly fill the same in the observationsheet, class – wise. Please note that only children who are physically present in the class while you arecounting should be included.
■ Attendance of class with many sections: Take headcount of the individual sections, add them up andthen write down the total attendance.
Section 2: Note the official language used as the medium of instruction
Section 3: Teachers
■ Ask the HM and note down the number of teachers appointed. The number of regular governmentteachers does not include the Head Master. Acting HM will be counted as a regular teacher. HM on deputationwill be counted under the regular HM category.
■ If the school has para-teachers, mark them separately. In many states para-teachers are called by differentnames such as Shiksha Mitra, education volunteer etc.
■ Observe and count how many HMs/teachers are present and note the information.
Section 4: Classroom Observations- ONLY FOR STD 2 and STD 4
■ This section is for Std. 2 and Std. 4 only. If there is more than one section for a class, then randomly chooseany one to observe. You may need to seek help from the teachers to distinguish children class-wise as theyare normally found seated in mixed groups.
■ Observe the seating arrangement of children. See whether children of each class are sitting alone or withchildren of other classes.
■ Observe where children are sitting (in classroom, in the verandah or outside) and fill accordingly.
■ Observe whether there is a blackboard where they are sitting and what is the condition of the blackboard(write on the blackboard) and fill accordingly.
■ Observe if there was any other teaching material available like charts on the wall, board games etc. wherethey are sitting. (Material painted on the walls of the classroom does not count as teaching material.)
Section 5: Mid Day Meal (MDM)
■ Ask the HM/any other teacher whether the MDM was served in the school on the day of the visit today.

41ASER 2011
■ Observe if there is a kitchen/shed for cooking the MDM.
■ Observe whether the MDM was served in the school on the day of the visit. (Look for the evidence of theMDM in the school like dirty utensils or meal bought from outside). Mark accordingly.
Section 6: Facilities in the school
■ Count the total number of pucca rooms in the school excluding toilets and kitchen shed. Then count thenumber of rooms being used for teaching purposes.
■ Observe if there is an office/store/office cum store. Mark yes if you observe any one of these.
■ Observe if there is a play ground (Definition of Playground: it should be within the school premises with alevel playing field and/or school playing equipment eg: slide, swings etc).
■ Observe if there are library books in the school (Even if kept in a cupboard).
■ Observe if library books are being used by children.
Observe if there is a hand pump/tap which can be used for drinking water and if so, whether you coulddrink the water. If not, check whether any other drinking water facility is available.
■ Observe if the school has a complete boundary wall or complete fencing.
■ Observe if there are computers in the school to be used by children and if yes, then did you see childrenusing computers.
Section 7: School Grant Information (SSA)
Assure the HM and others that the name of the school will not be shared with anybody. Ask the personanswering this section about the grants very politely. If the person refuses to answer or is hesitant to answer thissection, then do not force the person and move on to the next section.
■ For this section, note down information separately for financial year 2010-11 (1st Apr 2010 – 31st March2011) and financial year 2011-12 (1st Apr 2011 – until the date of the survey).
■ The HM should be asked this section (In the absence of the Head Master, ask the senior most teacherpresent). Tick the type of school/standard and the designation of the person being asked (Head Master/Regular teacher/ Para teacher).
■ In case of school with Std. 1-7/8 with 2 separate HMs, and with separate SSA bank accounts, please takethe grants information for the primary section (Std. 1-4/5) only.
Section 8: SSA Annual Grants
This section is divided into two parts – one for financial year 2010-11 (1st Apr 2010 – 31st Mar 2011) and onefor financial year 2011-12 (1st Apr 2011 – until the date of the survey).
For each time period, ask if the school got four grants viz. School Maintenance Grant (SMG), School grantor School Development Grant (SDG), Teachers Grant/ Teacher Learning Material (TLM) and newclassroom grant.
If yes, then put a tick under ‘Yes’ column
Otherwise:
■ If the HM/ the respondent says that he/she has not received the grant or says that he/she is going to receivethe grant in the future, then mark under ‘No’ column.
■ If the HM/ respondent has no knowledge of whether or not the school has received the grant, then markunder ‘Don’t know’ column.
If school has received the grant, then ask whether the entire amount was spent or not. Keep the following pointsin mind while marking this question:

42 ASER 2011
■ Did you spend the full amount: Mark ‘Yes’ only if the full amount was spent. Mark ‘No’ if nothing hasbeen spent or any amount less than full has been spent. Mark ‘Don’t know’, if the HM is not aware of whetherthe money has been spent or not.
Please Note: If there is a school with standards 1-7/8, and there are 2 HM’s and 2 SSA bank accounts for section1-4/5 and 5/6 -7/8, then note the grant information only for the primary section (Standard 1-4/5).
Section 9: Activities carried out in the school (Since April 2010)
This section has two parts. First we want to know whether the listed activities have taken place. Secondwe want to know which grant was used to undertake the activity.
Ask if the school has done white wash /plastering, painting blackboard/ display board, building repairs (roof,floor, wall) etc, since April 2010. Then tick the appropriate box and then mark the grant under which this activitywas undertaken.
Note: There can be 3 different answers to this question. First option is SDG and/or SMG. If either SDG or SMGwas used, then please tick ‘SDG/SMG or both’. If TLM was used, then please tick ‘TLM’. If its neither of these3 grants but some other grant/source, then please tick on ‘Any other grant’ and if the respondent says that theactivity has happened but he doesn’t remember the grant, then please tick on ‘Don’t know’.
Section 10: Meeting with officials
Take information for this section only from the HM. If the HM is not available, then skip this section.
How often does the HM meet the officials at the Block, Cluster and District level: Mark accordingly.
■ If the HM says once in 14-15 days or twice a month or fortnightly, please mark ‘2 times a month’.
■ If the HM says once in 29-30 days or once in a month, please mark under ‘monthly’.
■ If the HM says once in 2-3 months or 4 times a year or quarterly, please mark ‘Once in 2-3 months’.
■ If the HM says twice a year, or once in 6 months, please mark ‘Once in 6 months’.
■ If the HM does not meet the particular official at all, please mark ‘Never’.
Section 11: Toilet facility in the school
■ Observe whether the school has a common toilet, a separate toilet for girls, a separate toilet for boysand a separate toilet for teachers. Ask the HM/ any teacher/ any child if you cannot tell who the toilets arefor.
■ For each type of toilet facility that you find in the school, note whether it is locked or not. If it was not locked,note whether it was usable or not.
■ If 2 common toilets or other type of toilets are there in the school then take information about the toilet whichis in a better condition.
IMPORTANT:
After filling out the School Observation sheet, get the HM’s name and contact number. Write this information inthe relevant box given on the top right of pg 2 in the format. This is essential for recheck purposes.

43ASER 2011
School and home language information in ASER 2011
The Right to Education Act recommends that the child’s “medium of instruction shall, as far as practicable, bein the child’s mother tongue” (Chapter V, Section 29, Clause 2 (f)). Several studies have indicated that childrenwhose home language is different from the school language have lower attendance and learning levels.1
Given this background, for the first time in ASER, in 2011 we recorded the child’s home language. This enablesus to see how many children have a home language background that is different from the medium of instructionin school.
Given the multiplicity of Indian languages and dialects, finalising a list of languages that could be used for thesurvey was a mammoth task in itself. As a starting point, we took into consideration the list of 22 scheduledlanguages mentioned in Census 2001.2 We also consulted experts at the Central Institute of Indian Languages,Mysore. Their suggestion was that in addition to the list of scheduled languages list, we could also include a listof 100 non-scheduled languages. A further list of 234 mother-tongue languages was also suggested.3 (In theMother tongue list, Hindi is listed in 49 different ways!)
Including all three lists would have given us a list with over 350 languages. While this would have made thesurvey much more comprehensive, it posed quite a few problems for our volunteers and for data analysis. Allthese languages would have to be coded and extreme care would have to be taken in the field to fill in thecodes correctly, which would have proved to be a cumbersome and complicated process in the field. Hence,given that this was our first attempt to engage with the question of language, we decided to use the list of 22scheduled and 100 non-scheduled languages from Census 2001.
For data collection, ASER volunteers were given the following instructions:
■ Ask the child or any adult in the household which language is spoken at home, by the family members. Referto the list of languages and put in the appropriate code in the given box.
■ If the family says they speak more than one language in the household, then find out which is the mainlanguage spoken at home. Accordingly, write ONLY ONE LANGUAGE CODE in the household format.
■ Write down the code of the language mentioned by the respondent, regardless of what you may think thehousehold speaks at home. If this language is not in the ‘Language Code List’, then write 999. For eg., if therespondent says ‘Avadhi’ is the language spoken at home, and ‘Avadhi’ is not coded in the ‘Language CodeList’, then write 999.
1See for example: Mohanty et al (eds) 2009), Just Multilingual Education, New Delhi: Orient Longman; Heugh, Kathleen et al (2007), Study on Medium ofInstruction in Primary Schools in Ethiopia; Bhattacharjea, Wadhwa and Banerji (2011), Inside Primary schools, New Delhi: ASER Centre.2http://censusindia.gov.in/Census_Data_2001/Census_Data_Online/Language/parta.htm3http://censusindia.gov.in/Census_Data_2001/Census_Data_Online/Language/Statement1.htm?q=mother+tongue&drpQuick=&drpQuickSelect=

44 ASER 2011
Sample household survey sheet - English

45ASER 2011
Sample household survey sheet - Hindi

46 ASER 2011
Sample village information sheet - English

47ASER 2011
Sample village information sheet - Hindi

48 ASER 2011
Sample school observation sheet - English

49ASER 2011

50 ASER 2011
Sample school observation sheet - Hindi

51ASER 2011

52 ASER 2011
Village map

53ASER 2011
The National Picture

54 ASER 2011
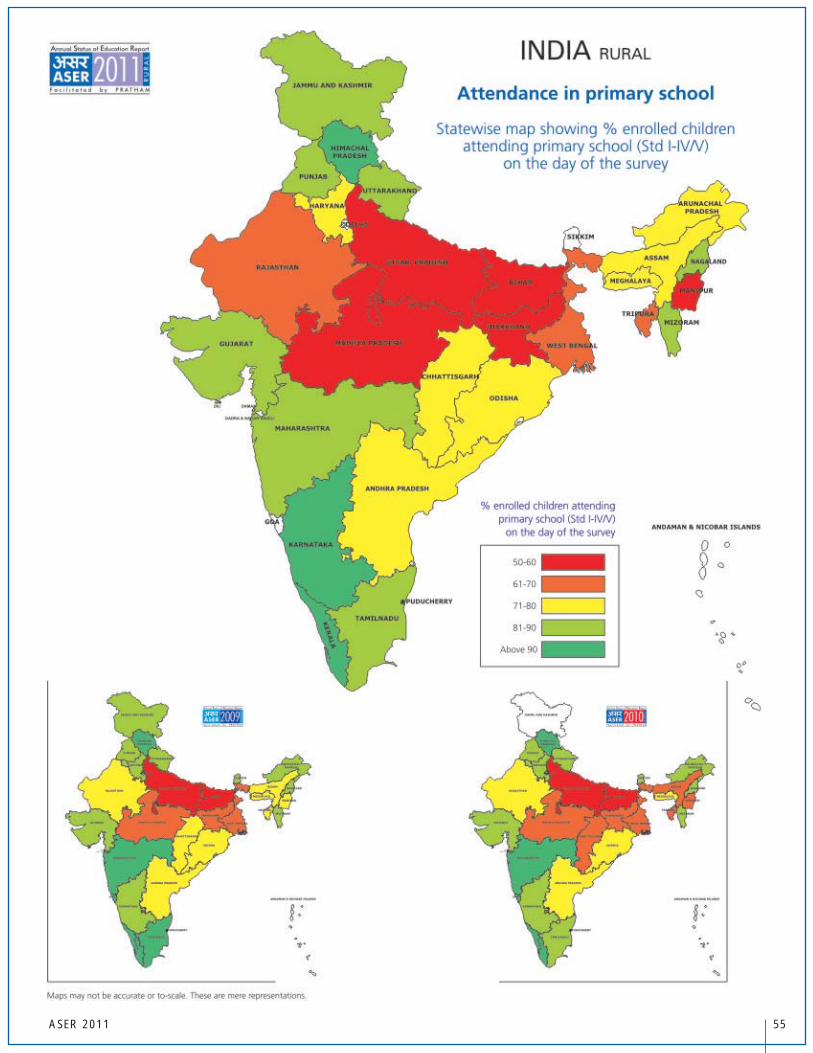
55ASER 2011

56 ASER 2011

57ASER 2011

58 ASER 2011

59ASER 2011

60 ASER 2011

ASER 2011 (Rural) Findings
The proportion of children currently not enrolled in school is declining
■ In ASER 2011, the proportion of children in the 6-14 age group not currently enrolled in school is 3.3%,down from 6.6% in 2006. In 2010, this number was 3.4%.
■ 11 to 14 year old girls are the hardest to keep in school. Rural India shows substantial progress on this front.The figure for out of school girls (11-14) was 10.3% in 2006. It has declined to 5.2% in 2011.
■ Many of the states that had a high proportion (over 10%) of 11-14 year old girls out of school in 2006 havemade significant progress. In 2011, this proportion was lower than the All India average of 5.2% in stateslike Bihar (4.5%), West Bengal (4.3%) and Chhattisgarh (4.3%). Uttar Pradesh has shown the least progresswith 11.1% girls in this age group out of school in 2006 and 9.7% in 2011.
■ Substantial numbers of five year old children are enrolled in school. The All India figure stands at 57.8% for2011. This proportion varies across states, ranging from 87.1% in Nagaland to 18.8% in Karnataka.
Private school enrollment is rising in most states
■ Nationally, private school enrollment has risen year after year for the 6-14 age group, increasing from 18.7%in 2006 to 25.6% in 2011.
■ Two states in the country, Kerala and Manipur, have more than 60% of children enrolled in private schools.In both these states the proportion of aided private schools is high. According to ASER 2011 data, between30 to 60% of children in rural areas of Haryana, Uttar Pradesh, Nagaland, Meghalaya, Punjab, Jammu &Kashmir, Rajasthan, Uttarakhand, Maharashtra and Andhra Pradesh are enrolled in private schools.
■ Tamil Nadu shows an increase of 11.6 percentage points in private school enrollment between 2007 and2011. In Uttar Pradesh, private school enrollment has increased from 39.3% in 2010 to 45.4% in 2011.
Reading levels showing decline in many states
■ Nationally, reading levels have declined in many states across North India. The All India figure for the proportionof children in Std V able to read a Std 2 level text has dropped from 53.7% in 2010 to 48.2% in 2011.However, in a few states there is good news. In Gujarat, Punjab and Tamil Nadu the numbers for 2011 arebetter than for 2010. Several states in the north-eastern region of India also show positive change. Karnatakaand Andhra Pradesh numbers remain unchanged from last year.
■ Similar trends are observed in the proportion of Std III children able to read at least a Std I level text. Inaddition to the states mentioned above, Himachal Pradesh does not show any decline in Std III reading levels.
Arithmetic levels also show a decline across most states
■ Basic arithmetic levels also show a decline. Nationally, the proportion of Std III children able to solve a 2 digitsubtraction problem with borrowing has dropped from 36.3% in 2010 to 29.9% in 2011. This decline isvisible in almost every state; only Andhra Pradesh, Karnataka and Tamil Nadu show improvements from 2010to 2011. Several states in the north-eastern region of India also show positive change. There is no change inarithmetic levels for Std III in Gujarat.
■ Among Std V children the ability to do the same task has dropped from 70.9% in 2010 to 61.0% in 2011.
61ASER 2011

A quarter of all rural children attend primary schools where the medium of instruction is differentfrom their home language1
■ ASER 2011 recorded children’s home and school language for the first time. The data indicates that children’shome language was different from the school’s medium of instruction for one out of four children surveyed.This figure does not include most states of the North East or Jammu & Kashmir.2
Incidence of tuition is higher in Eastern states
■ In both government and private schools, between 20 to 25% of all children attend paid tuition classesoutside school. This number varies considerably by state and by grade level. The proportion of children goingto paid tutors remains high in the Eastern states of Odisha, Bihar and West Bengal, where private schoolenrollment is very low. Kerala is another state with a high incidence of tuition.
School observationsThe school information reported in ASER is collected during a visit to one government school with primarysections in each sampled village.
Teachers’ attendance is high
■ In ASER 2011, an average of about 87% of all appointed teachers were observed to be in school on the dayof the visit. Gujarat stands out with 95.6% teachers attending in primary schools. Ten major states hadteacher attendance figures that were 90% or higher.
Children’s attendance of concern in some states
■ At the All India level, children’s attendance shows a decline from 73.4% in 2007 to 70.9% in 2011 in ruralprimary schools. The decline is slightly steeper in upper primary schools, where it decreased from 75.6% in2007 to 71.9% in 2011. In some states, children’s attendance shows a sharp decline over time: for examplein primary schools of Bihar, average attendance of children was 59.0% in 2007 and 50.0% in 2011. InMadhya Pradesh this figure has fallen from 67.0% in 2007 to 54.5% in 2011; in Uttar Pradesh from 64.4%(2007) to 57.3% (2011) and in Manipur from 76.7% in 2007 to 52.3% in 2011.
More than half of all Std 2 and Std 4 classes are multigrade
■ For Std 2 and Std 4, ASER observes whether children in these classes are sitting together with children fromother classes. Nationally, for rural primary schools, more than half of all classes visited were multigrade. Forexample Std 2 was sitting with one or more other classes in 58.3% of primary schools and 57.6% of schoolswith upper primary sections. In Jammu and Kashmir, Jharkhand and Meghalaya, more than 80% of observedStd 2 and 4 classrooms in primary schools were multigrade.
Computers increasingly available in upper primary schools
■ Almost a third of upper primary schools visited had computers (30.8%). In addition, in several states, theproportion of schools where children were observed using computers was high – for example Kerala (78.7%),Tamil Nadu (51.1%), Gujarat (31.0%) and Maharashtra (30.6%).
■ In contrast, only 7.9% of all government primary schools visited had computers. Kerala is a noteworthyexception, with 78.5% of primary schools having computers and 52.3% primary schools where childrenwere observed using them.
1 The Right to Education Act states that “medium of instructions shall, as far as practicable, be in child’s mother tongue” (Chapter V:29:f).2 Please consult the respective state pages for the language tables in these states.
62 ASER 2011

Schools get their grants, but not on time
■ Between FY 2008-9 and FY 2010-11 the flow of SSA grants to schools improved significantly. However, thisimprovement occurred largely between FY 2008-9 and 2009-10. In fact a marginal decrease in the proportionof schools receiving grants is observed between FY 2009-10 and 2010-11.
■ The data suggest that schools tend to get their grants during the second half of the fiscal year. There is aslight drop in the proportion of schools receiving grants in the first half of the fiscal year between 2010-11and 2011-12.
RTE IndicatorsNot much change in compliance on PTR and CTR
■ At the All India level, there has been a marginal improvement in the proportion of schools complying withRTE norms on pupil-teacher ratio, from 38.9% in 2010 to 40.7% in 2011. In 2011, Kerala stands out with94.1% of schools in compliance, and in Jammu & Kashmir, Nagaland and Manipur, more than 80% schoolsare in compliance with these norms.
■ At the All India level, there has been a marginal decline in the proportion of schools with at least oneclassroom per teacher, from 76.2% in 2010 to 74.3% in 2011. In Mizoram, 94.8% of schools comply withthe teacher-classroom norms and in Punjab, Uttarakhand, Rajasthan, Uttar Pradesh, Gujarat and Maharashtramore than 80% of schools are in compliance.
No major changes in building, playground and boundary wall provision
■ All India figures for 2011 show no significant improvement in the proportion of schools with an office cumstore. This figure remains at 74%. Similarly, for the country has a whole, about 62% of visited schools hada playground, both in 2010 and in 2011. However, there has been an increase in the proportion of allschools that have a boundary wall, from 50.9% in 2010 to 54.1% in 2011.
Drinking water provision unchanged
■ Nationally, the proportion of schools with no provision for drinking water remained almost the same –17.0% in 2010 and 16.6% in 2011. In the North East, the proportion of schools with no water provisionranged from 23.8% in Assam to 87.3% in Manipur in 2011.
■ The proportion of schools with a useable drinking water facility has remained steady at about 73%. Keralahas the best record with 93.8% schools that have a useable drinking water facility.
Better provision of girls’ toilets
■ The All India proportion of schools with working toilets has increased marginally from 47.2% in 2010 to49.1% in 2011.
■ The proportion of schools where there was no separate girls’ toilet has declined from 31.2% in 2010 to22.6% in 2011. Also, there has been a substantial improvement in the proportion of schools that haveseparate girls’ toilets that are useable. This figure has risen from 32.9% in 2010 to 43.8% in 2011.
More libraries in schools, and more children using them
■ The proportion of schools without libraries has declined from 37.5% in 2010 to 28.6% in 2011. Childrenwere seen using the library in more schools as well – up from 37.9% in 2010 to 42.3% in 2011.
63ASER 2011


India RURAL
Note: 'OTHER' includes children going to madarssa and EGS.‘NOT IN SCHOOL’ = dropped out + never enrolled.
How to read this table: If a child started school in Std I at age 6, she should be age 8 inStd 3. This table shows the age distribution for each class. For example, in Std III,41.8% children are 8 years old but there are also 12.0% who are 7, 23.6% who are 9,11.3% who are 10 years old, etc.
Table 3: % Children age 5-6 who are enrolled in different typesof pre-school & school 2011
Not
enr
olle
dan
ywhe
re
Tota
l
In SchoolIn balwadi
oranganwadi
In LKG/UKG
Age 5
Age 6
Govt Pvt Other
25.9 10.3 36.8 19.8 1.3 6.0 100
5.9 5.0 60.3 24.3 1.5 3.0 100
Chart 3: Trends over timeFive year olds in pre-school & school 2007, 2009 & 2011
Chart 1: Trends over time% Children out of school by age group and gender 2006-2011
How to read this chart: For example, the proportion of girls (age 11-14) not in schoolhas changed from 10.3% in 2006 to 7.3% in 2007 to 7.2% in 2008 to 6.8% in 2009to 5.7% in 2010 to 5.2% in 2011
ALL ANALYSIS BASED ON DATA FROM HOUSEHOLDS. 558 OUT OF 583 DISTRICTS
TotalAge group Govt. Pvt. Other Not inSchool
69.9 25.6 1.1 3.3 100
68.0 25.7 1.0 5.3 100
71.5 25.3 1.3 1.9 100
69.3 27.8 1.2 1.8 100
74.1 22.5 1.4 2.1 100
68.7 25.6 0.9 4.8 100
66.8 28.0 0.9 4.4 100
70.8 23.1 0.9 5.2 100
57.0 27.0 0.8 15.3 100
56.8 27.9 0.7 14.6 100
57.2 25.9 0.8 16.1 100
Age: 6-14 ALL
Age: 7-16 ALL
Age: 7-10 ALL
Age: 7-10 BOYS
Age: 7-10 GIRLS
Age: 11-14 ALL
Age: 11-14 BOYS
Age: 11-14 GIRLS
Age: 15-16 ALL
Age: 15-16 BOYS
Age: 15-16 GIRLS
Chart 2: Trends over time% Children enrolled in private school by class 2007, 2009 & 2011
I
II
III
IV
V
VI
VII
VIII
Table 2: Sample description% Children in each class by age 2011
5 6 7 8 9 10 11 12 13 14 15 16 Total
26.5 43.0 17.5 7.5 5.5
4.1 14.6 38.8 28.0 6.3 5.0 3.3
4.1 12.0 41.8 23.6 11.3 2.7 4.5
4.3 13.8 34.7 30.9 7.1 5.8 3.4
5.5 8.3 42.9 24.0 12.1 3.5 3.8
3.7 12.5 35.0 33.3 8.8 6.8
4.9 9.5 42.5 27.2 10.3 5.6
4.5 13.8 39.1 28.7 9.9 4.1
100
100
100
100
100
100
100
100
Std.
Table 1: % Children in different types of schools 2011
65ASER 2011
School enrollment and out of school children
Young children in pre-school and school
% C
hild
ren
% C
hild
ren
% C
hild
ren
65ASER 2011

Reading Tool
India RURAL
How to read this table: Each cell shows the highest level of reading achieved by a child.For example, in Std III, 8.5% children cannot even read letters, 22.9% can read lettersbut not more, 28.4% can read words but not Std 1 text or higher, 21.5% can read Std1 text but not Std 2 level text, and 18.8% can read Std 2 level text. In sum, for eachclass, the total of all these exclusive categories is 100%.
Std. NothingLevel 1
(Std 1 Text)Level 2
(Std 2 Text) Total
I
II
III
IV
V
VI
VII
VIII
Total
38.4 39.4 15.3 3.9 3.0 100
16.6 34.6 28.3 11.8 8.7 100
8.5 22.9 28.4 21.5 18.8 100
4.7 14.4 21.2 25.7 34.2 100
3.5 9.7 14.6 24.1 48.2 100
1.7 5.8 9.3 20.5 62.8 100
1.2 4.0 6.3 16.2 72.4 100
1.0 2.6 4.3 12.7 79.4 100
10.4 17.8 16.6 16.9 38.3 100
Chart 5: Trends over time% Children in Std V who CANNOT READ Std II LEVEL TEXTBy school type 2008-2011
Chart 4: Trends over time% Children in Std III who CANNOT READ Std I LEVEL TEXTBy school type 2008-2011
Letter Word
Table 4: % Children by class and READING levelAll schools 2011
Note : In ASER 2011 for every state, reading tools were provided in the main mediumof instruction in government schools. Children and their families were also askedabout the language they speak at home. For home languages, a list of 122 languageswas provided to all survey teams. This list includes 22 Scheduled languages and 100Non-Scheduled languages. The data in this table is for children for whom we haveinformation for both school language and home language.
Table 5: School language and home language*
% Children whose :
Home language is the same as school language
Home language is different from school language
Total
%
66 ASER 2011
74.7
25.4
100.0
Home language and school language
Reading
% C
hild
ren
% C
hild
ren
* This table does not include data for Jammu and Kashmir, Manipur, Assam,Nagaland, Tripura, Meghalaya, Mizoram & Arunachal Pradesh. Please consult therespective state pages for the language tables.

Math Tool
How to read this table: Each cell shows the highest level of arithmetic achieved by achild. For example, in Std III, 7.5% children cannot even recognize numbers 1-9, 26.9%can recognize numbers up to 9 but not more, 35.7 % can recognize numbers to 99but cannot do subtraction, 23.2% can do subtraction but not division, and 6.7% cando division. In sum, for each class, the total of all these exclusive categories is 100%.
Std. Nothing Subtract Divide Total
I
II
III
IV
V
VI
VII
VIII
Total
36.5 42.2 16.9 3.2 1.2 100
15.0 38.5 32.8 11.0 2.7 100
7.5 26.9 35.7 23.2 6.7 100
3.8 17.2 30.6 32.3 16.1 100
2.9 12.0 24.1 33.5 27.6 100
1.6 7.4 18.8 32.8 39.4 100
1.3 5.0 15.4 30.0 48.3 100
1.1 3.4 12.5 26.3 56.8 100
9.5 20.3 23.8 23.4 22.9 100
Recognize Numbers11-991-9
Chart 7: Trends over time% Children in Std V who CANNOT DO DIVISIONBy school type 2008-2011
Chart 6: Trends over time% Children in Std III who CANNOT RECOGNISE NUMBERS upto100. By school type 2008-2011
India RURAL
Table 7: Class-wise % children attending PAID TUITION CLASSESBy school type 2007, 2009, 2010 and 2011
Note: In 2007, 2009, 2010 and 2011 the ASER survey recorded information abouttuition. In all 4 years, the question asked was the following: “Does the child take anypaid additional class currently?” Therefore, these numbers do not include anysupplemental help in learning that children may have received from parents, siblingsor from anyone else who did not require payment.
Year School I II III IV V VI VII VIII Total
2007
2009
2010
2011
Govt
Pvt
Govt
Pvt
Govt
Pvt
Govt
Pvt
Table 6: % Children by class and ARITHMETIC levelAll schools 2011
67ASER 2011
12.0 15.7 19.1 21.3 23.3 23.5 24.3 26.1 20.0
19.5 23.0 25.0 25.9 26.2 24.1 25.0 24.8 23.9
17.1 20.3 22.3 23.4 25.4 27.6 28.1 30.7 23.9
23.3 26.5 28.6 29.8 28.2 26.1 26.4 27.4 26.9
15.0 18.2 20.7 22.2 25.2 26.0 26.6 29.0 22.5
18.1 20.9 23.4 25.3 23.7 24.0 23.9 22.4 22.5
15.8 19.5 21.2 24.0 25.4 25.8 27.7 28.4 23.3
18.9 21.1 23.2 23.3 23.1 21.6 22.2 22.4 21.8
Arithmetic
Tuition
% C
hild
ren
% C
hild
ren

India RURAL
% Children(Age: 6-14)
out of school
% Children(Age: 6-14)
in private school
% Children (Std I-II)who CAN READletters, words
or more
% Children (Std I-II)who CAN
RECOGNIZE numbers(1-9) or more
% Children (Std III-V)who CAN READLevel 1 (Std 1)text or more
% Children (Std III-V)who CAN DOSUBTRACTION
or more
Out of school Private school Std I-II : Learning levels Std III-V : Learning levels
State
Andhra Pradesh 2.8 34.7 87.3 89.7 70.9 64.5
Arunachal Pradesh 3.8 17.0 87.9 89.8 65.4 65.2
Assam 4.2 14.5 73.0 75.5 50.3 35.7
Bihar 3.0 5.5 59.7 62.5 52.1 48.4
Chhattisgarh 2.4 11.0 75.8 75.0 52.5 39.9
Daman & Diu 0.0 22.3 88.4 86.2 59.4 41.9
Gujarat 2.7 10.8 79.7 79.0 63.4 43.4
Haryana 1.4 43.4 81.3 83.8 69.8 64.5
Himachal Pradesh 0.6 26.6 92.3 95.4 82.1 75.5
Jammu & Kashmir 2.5 37.7 89.9 91.5 56.7 50.9
Jharkhand 4.7 12.8 63.5 64.0 48.4 41.0
Karnataka 2.8 20.0 85.3 85.8 59.7 47.5
Kerala 0.1 60.8 97.1 96.9 82.2 67.5
Madhya Pradesh 2.2 17.2 65.7 63.9 44.2 30.1
Maharashtra 1.1 30.3 91.2 91.6 77.9 56.0
Manipur 1.1 71.1 97.0 96.4 77.1 73.1
Meghalaya 5.8 54.3 86.2 89.6 61.6 43.5
Mizoram 0.6 13.7 96.2 97.1 85.6 85.1
Nagaland 2.0 40.9 96.6 97.7 70.7 70.8
Odisha 3.7 5.0 67.7 66.0 56.6 43.5
Puducherry 0.0 45.0 72.5 82.8 51.7 49.0
Punjab 1.6 39.6 87.2 90.5 74.9 73.6
Rajasthan 4.5 35.1 65.5 66.5 52.7 40.4
Tamil Nadu 0.9 27.0 62.8 69.3 50.0 41.9
Tripura 1.3 5.0 89.0 92.9 71.8 67.9
Uttar Pradesh 6.1 45.4 63.6 66.0 47.8 34.5
Uttarakhand 1.1 31.3 78.1 76.6 64.2 50.9
West Bengal 4.3 6.3 84.8 88.3 61.1 53.8
All India 3.3 25.6 72.1 73.8 57.5 46.5
Performance of states
Table 8: School enrollment and learning levels 2011
68 ASER 2011

As part of ASER 2007, 2009, 2010 and 2011, in each sampled village, one government school with primary sections was visited on the day of the survey.
Information about schools in this report is based on these visits.
India RURAL
2007 2009 2010 2011 2007 2009 2010 2011
Std I-IV/V Std I-VII/VIIIType of school
% Enrolledchildren present(average)
% Schools with lessthan 50% enrolledchildren present(average)
% Schools with75% or moreenrolled childrenpresent (average)
2007 2009 2010 2011 2007 2009 2010 2011
Std I-IV/V Std I-VII/VIIIType of school
% Teachers present(average)
% Schools withno teacherspresent(average)
% Schools withall teacherspresent(average)
Std I-IV/V Std I-VII/VIII2010 2011 2010 2011
% Schools with:
No Headteacher appointed
Headteacher appointed but not present attime of visitHeadteacher appointed & present at timeof visit
Total
Std I-IV/V Std I-VII/VIII2010 2011 2010 2011
% Schools with:
No computer
Computers but no children using them onday of visitComputers & children using them on dayof visit
Total
2007Type of school
Std I-IV/V: Primary
Std I-VII/VIII: Primary + Upper primary
Total schools visited
2009 2010 2011
Table 9: Total schools visited 2007, 2009, 2010 and 2011
Table 10: Student attendance 2007, 2009, 2010 and 2011
Table 12: Headteachers 2010 & 2011 Table 13: Computers 2010 and 2011
Table 11: Teacher attendance 2007, 2009, 2010 and 2011
69 ASER 2011
2.9 3.6 2.2 2.0
12.2 9.7 9.6 9.0
84.9 86.7 88.3 89.0
100 100 100 100
92.4 92.1 72.1 69.2
3.2 4.3 13.0 15.1
4.3 3.6 14.9 15.7
100 100 100 100
9230 9389 8419 8473
4836 5359 5821 5810
14066 14748 14240 14283
73.4 74.3 72.9 70.9 75.6 77.0 73.4 71.9
12.3 11.4 13.2 17.1 11.8 8.9 12.6 16.1
53.5 55.3 52.8 49.6 60.6 61.8 53.5 52.3
90.9 89.1 87.1 87.2 87.3 88.6 86.4 86.7
0.2 0.4 0.3 0.2 0.2 0.2 0.1 0.2
73.7 69.2 63.9 65.2 53.7 57.1 52.0 51.5
2007 2009 2010 2011
Std I-IV/V
2007 2009 2010 2011
Std I-VII/VIII% Schools with
Std II children sitting with one or more other classes
Table 14: Multigrade classes 2007, 2009, 2010 and 2011
54.0 55.8 55.2 58.3 50.4 53.1 54.0 57.6
47.6 51.0 49.0 53.1 42.0 43.9 41.6 45.6Std IV children sitting with one or more other classes
School observations
Other school information
Student and teacher attendance

India RURAL
The PAISA section of ASER tracks receipt and spending
of Sarva Shiksha Abhiyan (SSA) grants at the school level.
This information is collected from schools visited during
the survey. This page reports proportion of schools
receiving the grants and carrying out specified activities
in the schools. More detailed analysis of the PAISA data
will be available in the PAISA 2011 report which will be
released in March 2012.1
How much goes toeach school For what purposes
SCHOOL DEVELOPMENT GRANT / SCHOOL GRANT
Rs.5000 per year perprimary school
Rs.7000 per year per upperprimary school
Rs 5000 + Rs 7000 =Rs 12000 if the school isStd I-VII/VIII.
Note: Primary and UpperPrimary schools are treatedas separate schools even ifthey are in the same pre-mises.
This grant can be used forbuying school equipmentsuch as blackboard, sittingmats etc. Also for buyingchalk, duster, registers andother office equipment.
The grant amount varies bytype of school: whether it isa primary or upper primaryschool.
SCHOOL MAINTENANCE GRANT
This grant can be used formaintenance of schoolbuilding, includingwhitewashing;beautification; and repair oftoilets, hand pump,boundary wall, playgroundetc.
The grant amount dependson number of classrooms(excluding Headmasterroom and office room)
Rs.5000 - Rs 7500 perschool per year if the schoolhas upto 3 classrooms.
Rs 7500 - Rs.10000 per yearif the school has more than3 classrooms.
Primary and Upper Primaryschools are treated asseparate schools even ifthey are in the samebuilding.
TLM GRANT
This grant can be used byteachers to buy teachingaids, such as charts, globes,posters, models etc.
Rs.500 per teacher per yearin primary and upper pri-mary schools.
EVERY RURAL GOVERNMENT PRIMARY SCHOOL ISENTITLED TO EACH OF THESE SSA GRANTS EVERYYEAR.
1 For more information see www.accountabilityinitiative.in
70ASER 2011
School funds and activities (PAISA)
DID SCHOOLS GET THEIR MONEY ON TIME?
2008-2009 2009-2010 2010-2011SSA school
grants% Schools % Schools % SchoolsNo.
ofSch.
No.of
Sch.
No.of
Sch.Yes No Don’tknow
DID SCHOOLS GET THEIR MONEY ON TIME?
April 2009 toOctober 2009
April 2010 toOctober 2010
April 2011 toOctober 2011
% Schools % Schools % SchoolsNo.of
Sch.
No.of
Sch.
No.of
Sch.Yes No Don’tknow
Type of Activity
Yes No Don'tknow
New Classroom
Repair of building (roof, floor, wall etc.)
Repair of doors & windows
Repair of boundary wall
Repair of drinking water facility
Repair of toilet
White wash/plastering
Painting Blackboard/Display Board/Painting on wall
Painting of doors & walls
Purchase of furniture (cupboard etc.)
Purchase of electrical fittings
Purchase of chalk, duster, register etc.
Purchase of sitting Mats/Tat Patti
Purchase of charts, globes & other teaching material
Expenditure on school events
Payment of bills (electricity, water, cleaning etc.)
Const.
Repairs
Painting
& White
Wash
Purchase
Other
Table 16: % Schools who report receiving SSA grants - Half financial year
Table 17: % Schools carrying out different activities since April 2010
Table 15: % Schools who report receiving SSA grants - Full financial year
13169 77.0 13.7 9.3 12277 84.9 5.3 9.9 13764 83.7 9.3 7.0
12601 69.7 20.3 10.0 11763 80.5 8.7 10.8 13496 76.7 15.3 8.0
13172 83.4 10.2 6.5 11658 87.3 5.9 6.8 13649 85.2 9.7 5.2
11381 57.9 30.4 11.7 11563 59.3 26.5 14.2 13125 55.0 35.2 9.8
10941 53.5 34.2 12.3 11082 57.3 28.2 14.5 12856 50.8 38.7 10.5
11330 64.4 26.7 8.9 10879 60.5 27.6 12.0 12966 53.1 38.4 8.5
26.2 70.0 3.9
50.4 46.4 3.3
47.7 49.0 3.3
26.4 70.1 3.5
47.8 49.2 3.0
38.6 58.2 3.2
68.4 28.9 2.7
71.5 26.0 2.5
59.8 37.4 2.8
46.1 50.2 3.8
36.2 60.4 3.4
89.1 8.5 2.4
55.5 41.3 3.2
76.5 20.7 2.7
68.7 27.4 3.9
38.8 56.3 4.9
% schools
Ma intenancegrantDeve lopmentgrant
TLM grant
Yes No Don’tknow
Yes No Don’tknow
SSA school
grants
Ma intenancegrantDeve lopmentgrant
TLM grant
Yes No Don’tknow
Yes No Don’tknow

India RURAL
Note : For schools with enrollment above 200children the PTR shall not exceed 40 excludingthe Head Teacher
Extracts from the Schedule of The Right of Children toFree and Compulsory Education Act 2009 Norms andstandards for a School (Sections 19 and 25)
Number of teachers in Std 1-5:� Admitted children No. of teachers
<= 60 261-90 391-120 4121-200 5> 150 5 + 1 Headteacher> 200 Pupil-Teacher Ratio
(excluding Headteacher)shall not exceed 40
School facilities:All weather building with:
� At least one classroom for every teacher� Office cum store cum headteacher’s room� Separate toilets for boys and girls� Safe and adequate drinking water facility to
all children� A kitchen where mid-day meal is cooked in
the school� Playground� Arrangements for securing the school
building by boundary wall or fencing.
Teaching learning equipmentshall be provided to each class as required.
LibraryThere shall be a library in each school providingnewspaper, magazines and books on all subjects,including story-books.
As part of ASER 2010 and 2011, in each sampled village, onegovernment school with primary sections was visited on theday of the survey. During this school visit, RTE indicators wereobserved and are reported here.
Note: School observations for ASER 2011 looked at TLM for Std II and Std IV only.
2010 2011School
enrollment No. ofschools
No. ofschools
% ofschools
% ofschools
RTETeacherNorms
1-60
61-90
91-120
121-150
151-200
> 200
TOTAL
2011Schoolenrollment
2010
% Schools that donot meet PTR norms
2
3
4
5
5 + HMsee note
2010
1
2
3
4
5
6
>=7
TOTAL
2011
Numberof
teachersNo.of
schools
No.of
schools
%of
schools
%of
schools
RTE norm:At least one
classroom perteacher
1
2
3
4
5
6
>=7
TOTAL
20112010
% Schools that do notmeet classroom to teacher
normsNumber ofteachers
% of schools with 2011
Building
DrinkingWater
Toilet
Girls Toilet
TLM
Library
MDM
Table 18: Schools by totalenrollment 2010 and 2011
Table 19: RTE norms: Pupil-teacherratio 2010 and 2011
Table 20: Schools by number ofteachers 2010 and 2011
Table 21: RTE norms: Teacher -classroom ratio 2010 and 2011
Table 22: % Schools meeting selected RTE norms on facilities 2010 & 2011
2010
1-60
61-90
91-120
121-150
151-200
> 200
TOTAL
Office/Store/Office cum storePlaygroundBoundary WallNo facility for drinking waterFacility but no drinking water availableDrinking water availableNo toilet facilityFacility but toilet not useableToilet useable% Schools with no separate provisions for girls toiletsOf schools with separate girls toilets, % schools whereToilet lockedToilet not useableToilet useableTeaching learning material in Std 2Teaching learning material in Std 4No libraryLibrary but no books being used by children on day of visitLibrary being used by children on day of visitKitchen shed for cooking midday mealMidday meal served in school on the day of visit
71 ASER 2011
2412 17.3 2790 19.8
1759 12.6 1844 13.1
1689 12.1 1841 13.1
1511 10.8 1533 10.9
2045 14.6 1853 13.2
4557 32.6 4209 29.9
13973 100.0 14070 100.0
43.4 39.8
49.9 47.5
60.6 58.2
68.7 66.7
61.2 58.9
71.0 73.7
61.1 59.4
1478 11.9 1561 12.4
2198 17.6 2394 19.0
2008 16.1 2111 16.7
1678 13.5 1652 13.1
1295 10.4 1269 10.1
1005 8.1 937 7.4
2796 22.4 2704 21.4
12458 100.0 12628 100.0
1.3 2.2
7.4 11.8
19.7 22.8
30.7 32.2
37.2 35.8
43.6 48.0
34.8 38.8
23.8 25.8
74.0 74.162.0 62.650.9 54.117.0 16.610.3 9.972.7 73.510.9 12.241.8 38.847.2 49.131.2 22.6
18.7 15.017.2 18.732.9 43.880.7 82.176.4 78.237.5 28.624.6 29.137.9 42.382.1 83.784.4 87.4
Right to Education indicators

India RURAL
2010
2011
2010
2011
2010
2011
2010
2011
2010
2011
2010
2011
2010
2011
2010
2011
2010
2011
2010
2011
2010
2011
2010
2011
2010
2011
And
hra
Prad
esh
632
642
61.7
56.4
53.4
66.5
64.7
69.9
70.3
68.6
52.7
49.2
64.8
60.8
38.6
33.4
25.4
28.1
66.9
62.8
92.0
94.7
77.6
73.9
90.2
88.3
87.6
87.2
Aru
nach
al P
rade
sh25
920
778
.070
.479
.870
.777
.078
.359
.267
.325
.136
.753
.260
.725
.330
.312
.222
.064
.063
.713
.019
.76.
39.
139
.452
.134
.448
.8
Ass
am51
951
033
.629
.067
.764
.957
.354
.161
.556
.519
.323
.360
.964
.633
.137
.813
.727
.480
.081
.520
.828
.110
.513
.671
.471
.167
.172
.2
Biha
r96
710
228.
85.
348
.254
.268
.666
.148
.048
.947
.547
.078
.783
.833
.645
.718
.135
.463
.671
.452
.961
.228
.231
.870
.872
.164
.166
.3
Chh
atti
sgar
h42
539
239
.651
.364
.259
.678
.676
.344
.746
.048
.549
.177
.673
.329
.626
.820
.020
.786
.287
.072
.978
.736
.538
.488
.586
.183
.278
.9
Guj
arat
623
650
62.7
62.0
84.2
87.6
80.2
82.8
75.4
83.2
84.5
91.1
79.4
83.9
64.8
69.5
49.9
67.7
88.4
92.0
83.8
83.0
48.5
44.2
95.6
97.0
94.8
96.2
Har
yana
528
389
40.3
41.2
75.1
70.9
85.9
80.3
79.9
79.1
82.4
84.0
74.6
78.3
67.9
70.1
52.8
68.0
51.0
61.0
64.6
78.2
31.6
42.6
72.2
73.7
67.6
67.1
Him
acha
l Pra
desh
261
274
60.6
65.3
76.7
77.4
75.5
76.9
76.0
70.0
37.3
42.4
83.2
81.8
56.0
68.5
38.7
64.9
82.0
89.3
80.3
88.6
41.3
42.4
91.5
89.8
87.5
89.0
Jam
mu
& K
ashm
ir35
787
.549
.882
.052
.728
.746
.636
.322
.470
.950
.726
.871
.768
.8
Jhar
khan
d54
753
711
.215
.381
.277
.384
.184
.238
.533
.826
.824
.773
.880
.626
.837
.520
.936
.673
.475
.761
.673
.528
.438
.282
.978
.676
.174
.3
Kar
nata
ka76
978
169
.471
.282
.885
.071
.874
.366
.271
.159
.069
.175
.881
.938
.444
.231
.841
.192
.894
.092
.492
.664
.857
.897
.395
.892
.690
.4
Ker
ala
275
328
89.2
94.1
80.3
77.6
88.3
90.4
76.7
78.8
82.1
86.0
85.7
93.8
58.2
71.6
43.9
68.6
98.1
97.8
83.1
98.1
62.4
70.8
98.5
98.8
96.6
94.1
Mad
hya
Prad
esh
1219
1195
19.4
21.5
81.4
75.0
69.4
64.3
61.0
55.6
37.4
37.1
78.5
68.6
50.3
31.9
28.9
23.4
89.8
86.7
56.3
58.7
29.1
31.5
83.9
82.3
81.0
77.2
Mah
aras
htra
902
829
58.9
62.9
87.6
81.9
34.2
33.4
85.0
82.5
57.6
58.2
69.0
73.1
53.0
44.9
43.2
42.6
78.3
74.9
86.1
83.8
66.5
54.3
97.2
96.4
94.7
95.9
Man
ipur
125
133
74.3
88.1
62.5
41.4
68.1
66.4
72.3
41.7
11.1
6.4
5.1
6.4
40.2
35.2
8.4
15.3
59.2
43.9
9.2
7.1
5.9
1.6
48.7
23.0
38.4
20.6
Meg
hala
ya11
085
54.3
51.4
84.2
62.9
33.6
41.6
45.5
39.5
13.8
13.9
23.9
9.9
24.5
24.4
14.8
18.6
59.4
69.6
22.0
36.3
15.6
31.3
40.0
51.3
26.8
46.5
Miz
oram
174
148
89.1
75.2
57.6
94.8
80.1
92.1
40.7
70.7
35.5
47.8
48.5
71.0
55.6
52.1
30.8
33.1
96.5
98.6
6.4
27.1
1.7
12.1
40.2
53.3
36.0
51.0
Nag
alan
d22
321
791
.985
.578
.661
.183
.692
.663
.865
.643
.335
.937
.023
.453
.960
.030
.649
.781
.992
.113
.39.
09.
23.
348
.351
.743
.548
.9
Odi
sha
741
769
22.5
25.7
74.0
79.1
74.6
83.0
44.5
36.8
40.7
46.4
70.3
74.5
44.4
51.8
34.7
46.8
74.3
78.5
65.3
84.7
46.8
66.5
81.3
84.2
76.9
81.8
Punj
ab44
948
934
.930
.476
.982
.278
.979
.569
.171
.482
.884
.083
.182
.961
.258
.749
.456
.294
.693
.996
.094
.466
.070
.491
.895
.089
.290
.6
Raja
stha
n89
687
246
.447
.482
.083
.191
.289
.251
.957
.270
.172
.668
.069
.565
.469
.950
.366
.383
.884
.563
.767
.123
.331
.776
.180
.072
.174
.7
Tam
il N
adu
662
683
47.0
52.3
75.2
75.0
55.0
49.4
68.7
67.6
60.9
58.7
80.5
77.6
44.6
48.4
35.1
42.7
96.7
96.5
79.1
76.8
57.8
55.2
95.4
92.8
93.3
92.5
Trip
ura
9894
68.5
75.0
60.0
46.2
88.8
76.6
89.7
78.7
19.0
25.3
40.0
40.2
43.0
30.8
30.3
21.9
88.4
90.4
35.4
28.3
19.8
23.9
52.7
35.6
32.3
35.9
Utt
ar P
rade
sh18
9619
0016
.116
.581
.680
.388
.688
.160
.871
.144
.457
.982
.284
.447
.453
.933
.947
.489
.394
.748
.777
.122
.937
.273
.579
.069
.674
.2
Utt
arak
hand
337
297
13.7
16.3
87.4
84.7
87.9
83.0
67.4
67.8
67.0
61.1
68.3
68.2
53.4
59.7
24.0
53.3
96.3
94.2
47.7
82.3
20.4
40.5
82.4
87.3
79.1
82.1
Wes
t Be
ngal
408
401
26.2
34.4
64.8
64.5
79.3
81.3
42.0
50.6
34.1
42.3
67.2
63.4
52.1
49.5
23.7
41.2
86.0
87.0
49.5
60.8
31.8
42.0
71.7
78.0
65.3
71.6
All
Ind
ia14
240
1428
338
.940
.776
.274
.374
.074
.162
.062
.650
.954
.172
.773
.547
.249
.132
.943
.882
.183
.762
.571
.437
.942
.380
.782
.176
.478
.2
Number of schools visited2010
Number of schools visited2011
Stat
ePT
R &
Cla
ssro
oms
Scho
ol F
acili
ties
Libr
ary
& T
each
ing-
Lear
ning
Mat
eria
ls
% S
choo
lsco
mpl
ying
with
:%
Sch
ools
tha
t ha
ve:
% S
choo
ls t
hat
have
:
Nor
ms
for
pupi
lte
ache
rra
tio
Nor
ms
for
teac
her
clas
sroo
mra
tio
Off
ice/
Stor
e/O
ffic
e C
umSt
ore
Play
grou
ndBo
unda
ryw
all
Drin
king
wat
erpr
ovis
ion
&av
aila
ble
Toile
tav
aila
ble
and
usea
ble
Girl
s to
ilet
avai
labl
ean
dus
eabl
e
Kitc
hen
shed
for
cook
ing
mid
day
mea
l
Libr
ary
book
sav
aila
ble
Libr
ary
book
s in
use
by c
hild
ren
TLM
obse
rved
inSt
d 2
TLM
obse
rved
inSt
d 4
Tab
le 2
3: P
erfo
rman
ce o
f st
ates
on
Rig
ht
to E
du
cati
on
in
dic
ato
rs 2
010
and
201
1
72ASER 2011

Andhra Pradesh
Arunachal Pradesh
Assam
Bihar
Chhattisgarh
Gujarat


Andhra Pradesh RURAL
Note: 'OTHER' includes children going to madarssa and EGS.‘NOT IN SCHOOL’ = dropped out + never enrolled.
How to read this table: If a child started school in Std I at age 6, she should be age 8 inStd 3. This table shows the age distribution for each class. For example, in Std III,47.6% children are 8 years old but there are also 13.8% who are 7, 24.0% who are 9,9.0% who are 10 years old, etc.
Chart 1: Trends over time% Children out of school by age group and gender 2006-2011
How to read this chart: For example, the proportion of girls (age 11-14) not in schoolhas changed from 8.6% in 2006 to 8.1% in 2007 to 6.6% in 2008 to 10.8% in 2009to 6.6% in 2010 to 6.0% in 2011
ALL ANALYSIS BASED ON DATA FROM HOUSEHOLDS. 22 OUT OF 22 DISTRICTS
TotalAge group Govt. Pvt. Other Not inSchool
62.3 34.7 0.3 2.8 100
61.1 32.9 0.2 5.7 100
59.9 38.7 0.3 1.1 100
54.9 44.1 0.2 0.8 100
64.8 33.5 0.3 1.4 100
66.4 28.3 0.3 5.1 100
63.1 32.5 0.2 4.2 100
69.5 24.2 0.3 6.0 100
50.7 28.4 0.2 20.7 100
48.9 31.9 0.1 19.1 100
52.4 25.2 0.2 22.2 100
Age: 6-14 ALL
Age: 7-16 ALL
Age: 7-10 ALL
Age: 7-10 BOYS
Age: 7-10 GIRLS
Age: 11-14 ALL
Age: 11-14 BOYS
Age: 11-14 GIRLS
Age: 15-16 ALL
Age: 15-16 BOYS
Age: 15-16 GIRLS
I
II
III
IV
V
VI
VII
VIII
Table 2: Sample description% Children in each class by age 2011
5 6 7 8 9 10 11 12 13 14 15 16 Total
24.2 44.2 20.1 8.0 3.5
2.4 14.1 49.1 22.7 8.3 3.5
1.6 13.8 47.6 24.0 9.0 4.0
2.5 14.9 48.8 22.1 8.2 3.5
2.7 7.9 55.7 21.9 9.2 2.5
1.6 11.8 48.7 30.3 6.4 1.3
1.8 10.7 54.5 24.6 6.7 1.8
2.9 13.0 55.3 21.9 6.8
100
100
100
100
100
100
100
100
Std.
Table 1: % Children in different types of schools 2011
75ASER 2011
School enrollment and out of school children
Young children in pre-school and school
% C
hild
ren
% C
hild
ren
% C
hild
ren
Chart 2: Trends over time% Children enrolled in private school by class 2007, 2009 & 2011
Chart 3: Trends over timeFive year olds in pre-school & school 2007, 2009 & 2011
Table 3: % Children age 5-6 who are enrolled in differenttypes of pre-school & school 2011
Not
enr
olle
dan
ywh
ere
Tota
l
In SchoolIn balwadi
oranganwadi
In LKG/UKG
Age 5
Age 6
Govt Pvt Other
16.4 18.8 33.0 30.0 0.1 1.8 100
1.3 9.6 49.0 39.2 0.2 0.8 100

Reading Tool
Andhra Pradesh RURAL
How to read this table: Each cell shows the highest level of reading achieved by a child.For example, in Std III, 2.8% children cannot even read letters, 11.9% can read lettersbut not more, 31.1% can read words but not Std 1 text or higher, 29.9% can read Std1 text but not Std 2 level text, and 24.3% can read Std 2 level text. In sum, for eachclass, the total of all these exclusive categories is 100%.
Std. NothingLevel 1
(Std 1 Text)Level 2
(Std 2 Text) Total
I
II
III
IV
V
VI
VII
VIII
Total
19.6 48.7 25.1 4.2 2.4 100
5.7 27.7 40.4 15.5 10.8 100
2.8 11.9 31.1 29.9 24.3 100
1.7 5.9 18.0 31.1 43.3 100
1.3 3.9 11.1 23.7 60.1 100
0.5 1.8 6.8 20.0 70.9 100
0.3 1.9 4.4 13.4 80.0 100
0.4 0.8 2.5 10.2 86.1 100
4.4 13.8 18.5 18.9 44.5 100
Chart 5: Trends over time% Children in Std V who CANNOT READ Std II LEVEL TEXTBy school type 2008-2011
Chart 4: Trends over time% Children in Std III who CANNOT READ Std I LEVEL TEXTBy school type 2008-2011
Letter Word
Table 4: % Children by class and READING levelAll schools 2011
Note : In ASER 2011 for every state, reading tools were provided in the main mediumof instruction in government schools. Children and their families were also askedabout the language they speak at home. For home languages, a list of 122 languageswas provided to all survey teams. This list includes 22 Scheduled languages and 100Non-Scheduled languages. The data in this table is for children for whom we haveinformation for both school language and home language.
Table 5: School language and home language
% Children whose :
Home language is the same as school language
Home language is different from school language
Total
%
76 ASER 2011
69.2
30.8
100.0
Home language and school language
Reading
% C
hild
ren
% C
hild
ren

Math Tool
How to read this table: Each cell shows the highest level of arithmetic achieved by a child.For example, in Std III, 1.9% children cannot even recognize numbers 1-9, 7.6% childrencan recognize numbers up to 9 but not more, 44.5% can recognize numbers to 99 butcannot do subtraction, 39.9% can do subtraction but not division, and 6.1% can dodivision. In sum, for each class, the total of all these exclusive categories is 100%.
Std. Nothing Subtract Divide Total
I
II
III
IV
V
VI
VII
VIII
Total
16.5 42.1 37.3 3.4 0.7 100
4.0 21.1 54.9 17.5 2.4 100
1.9 7.6 44.5 39.9 6.1 100
1.0 2.8 27.6 44.7 23.9 100
1.0 2.3 18.3 40.1 38.2 100
0.6 0.6 11.5 35.2 52.2 100
0.4 0.9 10.9 29.0 58.8 100
0.4 0.4 9.2 24.6 65.4 100
3.5 10.5 28.0 29.4 28.7 100
Recognize Numbers11-991-9
Chart 7: Trends over time% Children in Std V who CANNOT DO DIVISIONBy school type 2008-2011
Chart 6: Trends over time% Children in Std III who CANNOT RECOGNISE NUMBERS upto100. By school type 2008-2011
Andhra Pradesh RURAL
Table 7: Class-wise % children attending PAID TUITION CLASSESBy school type 2007, 2009, 2010 and 2011
Note: In 2007, 2009, 2010 and 2011 the ASER survey recorded information abouttuition. In all 4 years, the question asked was the following: “Does the child take anypaid additional class currently?” Therefore, these numbers do not include anysupplemental help in learning that children may have received from parents, siblingsor from anyone else who did not require payment.
Year School I II III IV V VI VII VIII Total
2007
2009
2010
2011
Govt
Pvt
Govt
Pvt
Govt
Pvt
Govt
Pvt
Table 6: % Children by class and ARITHMETIC levelAll schools 2011
77ASER 2011
11.0 16.4 17.0 18.6 20.8 17.3 24.6 13.5 17.8
24.8 29.0 33.1 31.5 37.6 31.7 36.7 28.5 30.9
21.2 22.9 24.7 22.3 24.7 22.4 24.1 19.8 22.9
31.6 40.6 36.7 37.4 37.1 40.4 35.3 39.2 36.7
12.0 13.7 14.7 14.7 12.6 17.3 13.2 13.0 13.9
23.5 26.3 25.0 29.8 26.4 32.9 22.9 24.4 26.3
11.6 14.8 16.7 16.2 18.4 12.6 14.6 9.8 14.5
20.0 25.1 27.6 29.0 31.5 29.8 26.4 29.5 26.8
Arithmetic
Tuition
% C
hild
ren
% C
hild
ren

As part of ASER 2007, 2009, 2010 and 2011, in each sampled village, one government school with primary sections was visited on the day of the survey.
Information about schools in this report is based on these visits.
Andhra Pradesh RURAL
2007 2009 2010 2011 2007 2009 2010 2011
Std I-IV/V Std I-VII/VIIIType of school
% Enrolledchildren present(average)
% Schools with lessthan 50% enrolledchildren present(average)
% Schools with75% or moreenrolled childrenpresent (average)
2007 2009 2010 2011 2007 2009 2010 2011
Std I-IV/V Std I-VII/VIIIType of school
% Teachers present(average)
% Schools withno teacherspresent(average)
% Schools withall teacherspresent(average)
Std I-IV/V Std I-VII/VIII2010 2011 2010 2011
% Schools with:
No Headteacher appointed
Headteacher appointed but not present attime of visitHeadteacher appointed & present at timeof visit
Total
Std I-IV/V Std I-VII/VIII2010 2011 2010 2011
% Schools with:
No computer
Computers but no children using them onday of visitComputers & children using them on dayof visit
Total
2007Type of school
Std I-IV/V: Primary
Std I-VII/VIII: Primary + Upper primary
Total schools visited
2009 2010 2011
Table 8: Total schools visited 2007, 2009, 2010 and 2011
Table 9: Student attendance 2007, 2009, 2010 and 2011
Table 11: Headteachers 2010 & 2011 Table 12: Computers 2010 and 2011
Table 10: Teacher attendance 2007, 2009, 2010 and 2011
78 ASER 2011
1.1 0.3 0.0 0.0
15.5 9.8 13.7 10.3
83.4 90.0 86.3 89.7
100 100 100 100
92.3 95.2 85.8 84.5
2.1 2.2 5.8 4.7
5.5 2.6 8.4 10.9
100 100 100 100
379 477 475 510
229 156 157 132
608 633 632 642
75.9 76.1 72.4 75.2 77.4 76.9 72.6 74.4
4.5 5.3 8.5 4.8 2.6 3.2 9.0 3.1
58.0 59.3 50.0 55.5 62.7 61.9 49.4 50.4
86.4 80.1 83.0 85.5 84.0 81.2 82.7 77.0
0.0 0.5 0.0 0.0 0.0 0.0 0.0 0.0
59.9 43.6 49.7 56.1 33.5 30.4 30.4 24.4
2007 2009 2010 2011
Std I-IV/V
2007 2009 2010 2011
Std I-VII/VIII% Schools with
Std II children sitting with one or more other classes
Table 13: Multigrade classes 2007, 2009, 2010 and 2011
54.4 66.3 62.9 63.6 50.5 59.9 55.6 48.8
46.9 58.6 53.9 58.7 37.1 52.5 48.7 44.1Std IV children sitting with one or more other classes
School observations
Other school information
Student and teacher attendance

Andhra Pradesh RURAL
The PAISA section of ASER tracks receipt and spending
of Sarva Shiksha Abhiyan (SSA) grants at the school
level. This information is collected from schools visited
during the survey. This page reports proportion of
schools receiving the grants and carrying out specified
activities in the schools. More detailed analysis of the
PAISA data will be available in the PAISA 2011 report
which will be released in March 2012.1
How much goes toeach school For what purposes
SCHOOL DEVELOPMENT GRANT / SCHOOL GRANT
Rs.5000 per year perprimary school
Rs.7000 per year per upperprimary school
Rs 5000 + Rs 7000 =Rs 12000 if the school isStd I-VII/VIII.
Note: Primary and UpperPrimary schools are treatedas separate schools even ifthey are in the same pre-mises.
This grant can be used forbuying school equipmentsuch as blackboard, sittingmats etc. Also for buyingchalk, duster, registers andother office equipment.
The grant amount varies bytype of school: whether it isa primary or upper primaryschool.
SCHOOL MAINTENANCE GRANT
Rs.5000 - Rs 7500 perschool per year if the schoolhas upto 3 classrooms.
Rs 7500 - Rs.10000 per yearif the school has more than3 classrooms.
Primary and Upper Primaryschools are treated asseparate schools even ifthey are in the samebuilding.
TLM GRANT
This grant can be used byteachers to buy teachingaids, such as charts, globes,posters, models etc.
Rs.500 per teacher per yearin primary and upper pri-mary schools.
EVERY RURAL GOVERNMENT PRIMARY SCHOOLIS ENTITLED TO EACH OF THESE SSA GRANTSEVERY YEAR.
1 For more information see www.accountabilityinitiative.in
79ASER 2011
School funds and activities (PAISA)
This grant can be used formaintenance of schoolbuilding, includingwhitewashing;beautification; and repair oftoilets, hand pump,boundary wall, playgroundetc.
The grant amount dependson number of classrooms(excluding Headmasterroom and office room)
DID SCHOOLS GET THEIR MONEY ON TIME?
2008-2009 2009-2010 2010-2011SSA school
grants% Schools % Schools % SchoolsNo.
ofSch.
No.of
Sch.Yes No Don’tknow
DID SCHOOLS GET THEIR MONEY ON TIME?
April 2009 toOctober 2009
April 2010 toOctober 2010
April 2011 toOctober 2011
% Schools % Schools % SchoolsNo.of
Sch.
No.of
Sch.
No.of
Sch.Yes No Don’tknow
Type of Activity
Yes No Don'tknow
New Classroom
Repair of building (roof, floor, wall etc.)
Repair of doors & windows
Repair of boundary wall
Repair of drinking water facility
Repair of toilet
White wash/plastering
Painting Blackboard/Display Board/Painting on wall
Painting of doors & walls
Purchase of furniture (cupboard etc.)
Purchase of electrical fittings
Purchase of chalk, duster, register etc.
Purchase of sitting Mats/Tat Patti
Purchase of charts, globes & other teaching material
Expenditure on school events
Payment of bills (electricity, water, cleaning etc.)
Const.
Repairs
Painting
& White
Wash
Purchase
Other
Table 15: % Schools who report receiving SSA grants - Half financial year
Table 16: % Schools carrying out different activities since April 2010
Table 14: % Schools who report receiving SSA grants - Full financial year
23.6 73.9 2.5
37.9 59.3 2.8
44.8 51.9 3.3
15.4 81.0 3.6
41.1 55.8 3.2
37.7 58.8 3.5
61.8 36.0 2.2
73.9 23.2 2.9
39.8 57.2 3.0
43.0 53.7 3.3
72.3 24.7 3.1
93.8 4.0 2.2
40.3 56.4 3.3
87.5 10.4 2.0
69.2 26.4 4.4
72.3 24.9 2.8
% schools
Ma intenancegrantDeve lopmentgrant
TLM grant
Yes No Don’tknow
Yes No Don’tknow
SSA school
grants
Ma intenancegrantDeve lopmentgrant
TLM grant
Yes No Don’tknow
Yes No Don’tknow
604 86.8 6.5 6.8 601 91.4 2.7 6.0 631 92.4 4.0 3.7
586 77.5 15.2 7.3 589 87.8 5.6 6.6 623 88.4 7.5 4.0
600 89.3 5.7 5.0 595 92.1 3.7 4.2 623 91.0 5.8 3.2
466 18.7 74.0 7.3 576 62.2 21.7 16.2 606 64.9 26.6 8.6
455 15.4 76.7 7.9 552 58.2 26.3 15.6 598 62.7 28.3 9.0
454 18.7 74.5 6.8 545 54.3 31.0 14.7 600 58.3 33.0 8.7
No.of
Sch.

Andhra Pradesh RURAL
Note : For schools with enrollment above 200children the PTR shall not exceed 40 excludingthe Head Teacher
Extracts from the Schedule of The Right of Children toFree and Compulsory Education Act 2009 Norms andstandards for a School (Sections 19 and 25)
Number of teachers in Std 1-5:� Admitted children No. of teachers
<= 60 261-90 391-120 4121-200 5> 150 5 + 1 Headteacher> 200 Pupil-Teacher Ratio
(excluding Headteacher)shall not exceed 40
School facilities:All weather building with:
� At least one classroom for every teacher� Office cum store cum headteacher’s room� Separate toilets for boys and girls� Safe and adequate drinking water facility to
all children� A kitchen where mid-day meal is cooked in
the school� Playground� Arrangements for securing the school
building by boundary wall or fencing.
Teaching learning equipmentshall be provided to each class as required.
LibraryThere shall be a library in each school providingnewspaper, magazines and books on all subjects,including story-books.
As part of ASER 2010 and 2011, in each sampled village, onegovernment school with primary sections was visited on theday of the survey. During this school visit, RTE indicators wereobserved and are reported here.
Note: School observations for ASER 2011 looked at TLM for Std II and Std IV only.
2010 2011School
enrollment No. ofschools
No. ofschools
% ofschools
% ofschools
RTETeacherNorms
1-60
61-90
91-120
121-150
151-200
> 200
TOTAL
2011Schoolenrollment
2010
2
3
4
5
5 + HMsee note
2010
1
2
3
4
5
6
>=7
TOTAL
2011
Numberof
teachersNo.of
schools
No.of
schools
%of
schools
%of
schools
RTE norm:At least one
classroom perteacher
1
2
3
4
5
6
>=7
TOTAL
20112010
% Schools that do notmeet classroom to teacher
normsNumber ofteachers
% of schools with 2011
TLM
Library
MDM
Table 17: Schools by totalenrollment 2010 and 2011
Table 18: RTE norms: Pupil-teacherratio 2010 and 2011
Table 19: Schools by number ofteachers 2010 and 2011
Table 20: RTE norms: Teacher -classroom ratio 2010 and 2011
Table 21: % Schools meeting selected RTE norms on facilities 2010 & 2011
1-60
61-90
91-120
121-150
151-200
> 200
TOTAL
80 ASER 2011
161 25.6 186 29.3
122 19.4 131 20.7
115 18.3 106 16.7
97 15.5 91 14.4
77 12.3 68 10.7
56 8.9 52 8.2
628 100.0 634 100.0
82 14.2 97 16.8
88 15.3 97 16.8
65 11.3 88 15.2
89 15.4 83 14.3
88 15.3 84 14.5
63 10.9 49 8.5
102 17.7 81 14.0
577 100.0 579 100.0
0.0 1.4
18.0 11.5
34.3 32.1
66.7 42.6
63.0 49.0
76.2 64.3
73.2 68.1
46.7 33.5
Right to Education indicators
DrinkingWater
Toilet
Girls Toilet
Building
53.2 59.2
43.0 48.8
32.1 35.0
40.4 41.6
16.9 13.7
24.1 36.0
38.3 43.6
Office/Store/Office cum storePlaygroundBoundary WallNo facility for drinking waterFacility but no drinking water availableDrinking water availableNo toilet facilityFacility but toilet not useableToilet useable% Schools with no separate provisions for girls toiletsOf schools with separate girls toilets, % schools whereToilet lockedToilet not useableToilet useableTeaching learning material in Std 2Teaching learning material in Std 4No libraryLibrary but no books being used by children on day of visitLibrary being used by children on day of visitKitchen shed for cooking midday mealMidday meal served in school on the day of visit
64.7 69.970.3 68.652.7 49.222.8 23.112.4 16.264.8 60.823.4 24.638.1 42.038.6 33.453.1 39.9
9.2 10.212.3 21.825.4 28.190.2 88.387.6 87.28.0 5.4
14.4 20.877.6 73.966.9 62.899.1 99.1
% Schools that donot meet PTR norms
2010

Arunachal Pradesh RURAL
Note: 'OTHER' includes children going to madarssa and EGS.‘NOT IN SCHOOL’ = dropped out + never enrolled.
How to read this table: If a child started school in Std I at age 6, she should be age 8 inStd 3. This table shows the age distribution for each class. For example, in Std III,26.4% children are 8 years old but there are also 14.8% who are 7, 20.2 % who are9, 16.9% who are 10 years old, etc.
Chart 1: Trends over time% Children out of school by age group and gender 2006-2011
How to read this chart: For example, the proportion of girls (age 11-14) not in schoolhas changed from 8.7% in 2006 to 6.9% in 2007 to 5.6% in 2008 to 5.7% in 2009to 4% in 2010 to 5.3% in 2011
ALL ANALYSIS BASED ON DATA FROM HOUSEHOLDS. 11 OUT OF 13 DISTRICTS
TotalAge group Govt. Pvt. Other Not inSchool
78.9 17.0 0.3 3.8 100
79.3 15.3 0.4 5.0 100
78.3 18.2 0.3 3.2 100
77.9 19.3 0.4 2.4 100
79.0 16.7 0.2 4.2 100
81.9 13.6 0.2 4.3 100
81.3 14.8 0.4 3.5 100
82.6 12.1 0.0 5.3 100
77.2 10.3 0.7 11.8 100
76.2 11.3 0.9 11.6 100
78.4 9.0 0.6 12.1 100
Age: 6-14 ALL
Age: 7-16 ALL
Age: 7-10 ALL
Age: 7-10 BOYS
Age: 7-10 GIRLS
Age: 11-14 ALL
Age: 11-14 BOYS
Age: 11-14 GIRLS
Age: 15-16 ALL
Age: 15-16 BOYS
Age: 15-16 GIRLS
I
II
III
IV
V
VI
VII
VIII
Table 2: Sample description% Children in each class by age 2011
5 6 7 8 9 10 11 12 13 14 15 16 Total
34.1 32.4 15.8 8.7 9.0
10.1 16.0 34.0 18.3 9.5 6.6 5.5
2.6 9.2 14.8 26.4 20.2 16.9 9.9
2.7 6.5 14.2 22.6 23.2 10.4 11.1 9.2
8.7 10.0 32.4 12.8 16.1 8.2 5.8 5.9
6.8 13.5 15.2 27.9 17.4 8.9 5.2 5.1
8.1 6.4 23.3 22.5 17.5 13.3 9.1
4.0 12.6 18.4 26.5 22.4 16.1
100
100
100
100
100
100
100
100
Std.
Table 1: % Children in different types of schools 2011
81ASER 2011
School enrollment and out of school children
Young children in pre-school and school
% C
hild
ren
% C
hild
ren
% C
hild
ren
Chart 2: Trends over time% Children enrolled in private school by class 2007, 2009 & 2011
Chart 3: Trends over timeFive year olds in pre-school & school 2007, 2009 & 2011
Tota
l
In SchoolIn balwadi
oranganwadi
In LKG/UKG
Age 5
Age 6
Govt Pvt Other
7.6 8.3 52.1 21.8 0.3 10.0 100
4.0 3.8 66.7 20.8 0.2 4.6 100
Table 3: % Children age 5-6 who are enrolled in differenttypes of pre-school & school 2011
Not
enr
olle
dan
ywh
ere
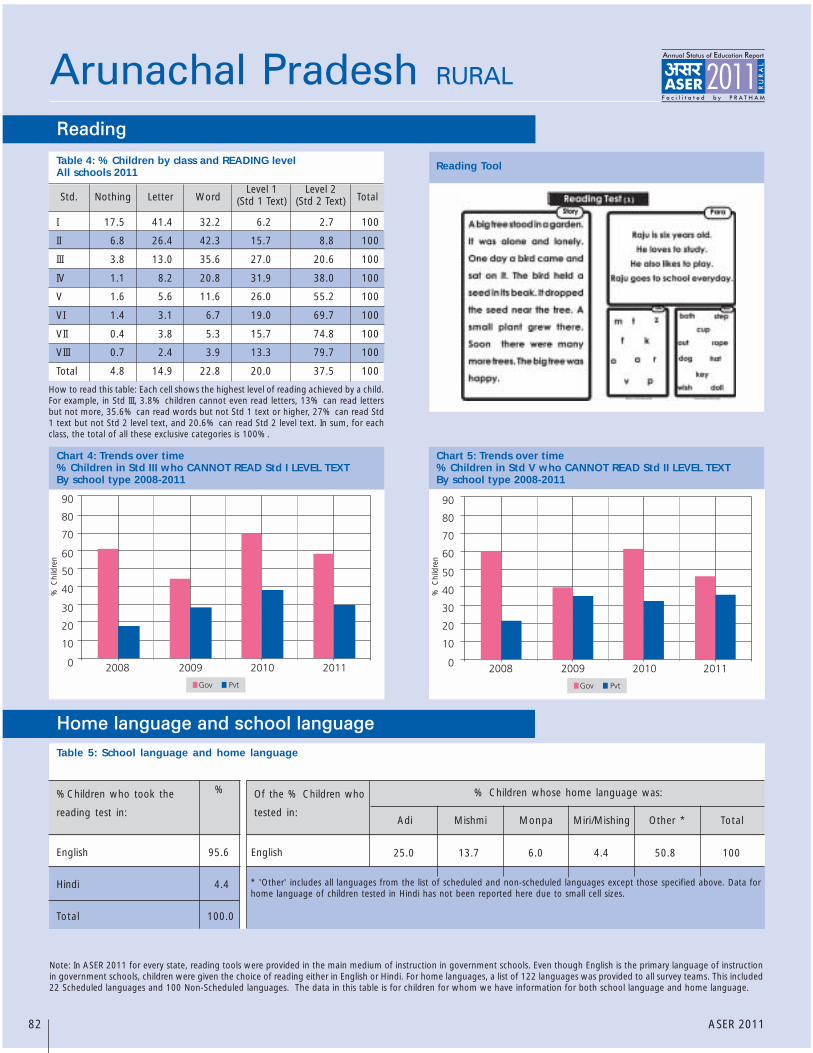
Reading Tool
Arunachal Pradesh RURAL
How to read this table: Each cell shows the highest level of reading achieved by a child.For example, in Std III, 3.8% children cannot even read letters, 13% can read lettersbut not more, 35.6% can read words but not Std 1 text or higher, 27% can read Std1 text but not Std 2 level text, and 20.6% can read Std 2 level text. In sum, for eachclass, the total of all these exclusive categories is 100%.
Std. NothingLevel 1
(Std 1 Text)Level 2
(Std 2 Text) Total
I
II
III
IV
V
VI
VII
VIII
Total
17.5 41.4 32.2 6.2 2.7 100
6.8 26.4 42.3 15.7 8.8 100
3.8 13.0 35.6 27.0 20.6 100
1.1 8.2 20.8 31.9 38.0 100
1.6 5.6 11.6 26.0 55.2 100
1.4 3.1 6.7 19.0 69.7 100
0.4 3.8 5.3 15.7 74.8 100
0.7 2.4 3.9 13.3 79.7 100
4.8 14.9 22.8 20.0 37.5 100
Chart 5: Trends over time% Children in Std V who CANNOT READ Std II LEVEL TEXTBy school type 2008-2011
Chart 4: Trends over time% Children in Std III who CANNOT READ Std I LEVEL TEXTBy school type 2008-2011
Letter Word
Table 4: % Children by class and READING levelAll schools 2011
82 ASER 2011
Home language and school language
Reading
% C
hild
ren
% C
hild
ren
Note: In ASER 2011 for every state, reading tools were provided in the main medium of instruction in government schools. Even though English is the primary language of instructionin government schools, children were given the choice of reading either in English or Hindi. For home languages, a list of 122 languages was provided to all survey teams. This included22 Scheduled languages and 100 Non-Scheduled languages. The data in this table is for children for whom we have information for both school language and home language.
Table 5: School language and home language
Of the % Children who
tested in:
% Children whose home language was:
* 'Other' includes all languages from the list of scheduled and non-scheduled languages except those specified above. Data forhome language of children tested in Hindi has not been reported here due to small cell sizes.
English95.6
4.4
100.0
English
Hindi
Total
%Children who took the
reading test in:
%
Adi Other * TotalMishmi Monpa Miri/Mishing
25.0 13.7 6.0 4.4 50.8 100
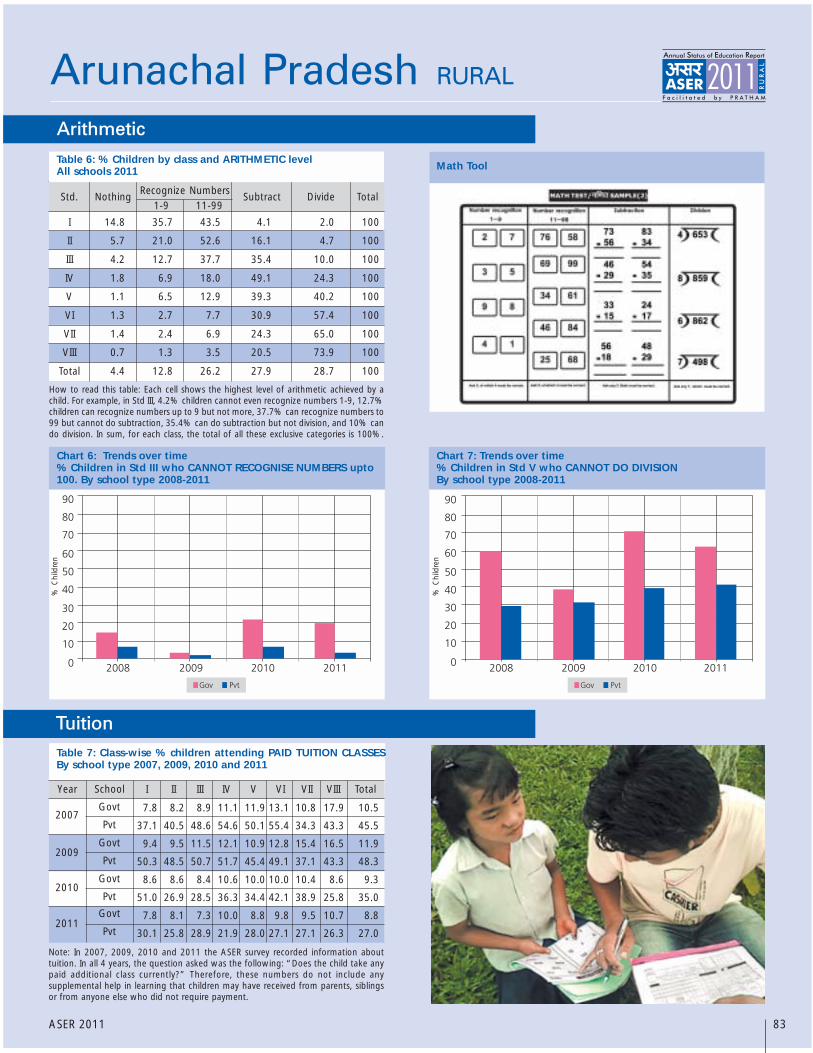
Math Tool
How to read this table: Each cell shows the highest level of arithmetic achieved by achild. For example, in Std III, 4.2% children cannot even recognize numbers 1-9, 12.7%children can recognize numbers up to 9 but not more, 37.7% can recognize numbers to99 but cannot do subtraction, 35.4% can do subtraction but not division, and 10% cando division. In sum, for each class, the total of all these exclusive categories is 100%.
Std. Nothing Subtract Divide Total
I
II
III
IV
V
VI
VII
VIII
Total
14.8 35.7 43.5 4.1 2.0 100
5.7 21.0 52.6 16.1 4.7 100
4.2 12.7 37.7 35.4 10.0 100
1.8 6.9 18.0 49.1 24.3 100
1.1 6.5 12.9 39.3 40.2 100
1.3 2.7 7.7 30.9 57.4 100
1.4 2.4 6.9 24.3 65.0 100
0.7 1.3 3.5 20.5 73.9 100
4.4 12.8 26.2 27.9 28.7 100
Recognize Numbers11-991-9
Chart 7: Trends over time% Children in Std V who CANNOT DO DIVISIONBy school type 2008-2011
Chart 6: Trends over time% Children in Std III who CANNOT RECOGNISE NUMBERS upto100. By school type 2008-2011
Arunachal Pradesh RURAL
Table 7: Class-wise % children attending PAID TUITION CLASSESBy school type 2007, 2009, 2010 and 2011
Note: In 2007, 2009, 2010 and 2011 the ASER survey recorded information abouttuition. In all 4 years, the question asked was the following: “Does the child take anypaid additional class currently?” Therefore, these numbers do not include anysupplemental help in learning that children may have received from parents, siblingsor from anyone else who did not require payment.
Year School I II III IV V VI VII VIII Total
2007
2009
2010
2011
Govt
Pvt
Govt
Pvt
Govt
Pvt
Govt
Pvt
Table 6: % Children by class and ARITHMETIC levelAll schools 2011
83ASER 2011
7.8 8.2 8.9 11.1 11.9 13.1 10.8 17.9 10.5
37.1 40.5 48.6 54.6 50.1 55.4 34.3 43.3 45.5
9.4 9.5 11.5 12.1 10.9 12.8 15.4 16.5 11.9
50.3 48.5 50.7 51.7 45.4 49.1 37.1 43.3 48.3
8.6 8.6 8.4 10.6 10.0 10.0 10.4 8.6 9.3
51.0 26.9 28.5 36.3 34.4 42.1 38.9 25.8 35.0
7.8 8.1 7.3 10.0 8.8 9.8 9.5 10.7 8.8
30.1 25.8 28.9 21.9 28.0 27.1 27.1 26.3 27.0
Arithmetic
Tuition
% C
hild
ren
% C
hild
ren

As part of ASER 2007, 2009, 2010 and 2011, in each sampled village, one government school with primary sections was visited on the day of the survey.
Information about schools in this report is based on these visits.
Arunachal Pradesh RURAL
2007 2009 2010 2011 2007 2009 2010 2011
Std I-IV/V Std I-VII/VIIIType of school
% Enrolledchildren present(average)
% Schools with lessthan 50% enrolledchildren present(average)
% Schools with75% or moreenrolled childrenpresent (average)
2007 2009 2010 2011 2007 2009 2010 2011
Std I-IV/V Std I-VII/VIIIType of school
% Teachers present(average)
% Schools withno teacherspresent(average)
% Schools withall teacherspresent(average)
Std I-IV/V Std I-VII/VIII2010 2011 2010 2011
% Schools with:
No Headteacher appointed
Headteacher appointed but not present attime of visitHeadteacher appointed & present at timeof visit
Total
Std I-IV/V Std I-VII/VIII2010 2011 2010 2011
% Schools with:
No computer
Computers but no children using them onday of visitComputers & children using them on dayof visit
Total
2007Type of school
Std I-IV/V: Primary
Std I-VII/VIII: Primary + Upper primary
Total schools visited
2009 2010 2011
Table 8: Total schools visited 2007, 2009, 2010 and 2011
Table 9: Student attendance 2007, 2009, 2010 and 2011
Table 11: Headteachers 2010 & 2011 Table 12: Computers 2010 and 2011
Table 10: Teacher attendance 2007, 2009, 2010 and 2011
84 ASER 2011
2.5 0.0 1.5 0.0
6.3 16.7 1.5 13.3
91.3 83.3 97.1 86.7
100 100 100 100
99.3 96.3 66.4 67.7
0.0 3.7 15.4 17.7
0.7 0.0 18.3 14.5
100 100 100 100
135 138 152 136
105 138 107 71
240 276 259 207
80.9 86.6 82.8 77.9 79.7 88.1 82.0 82.5
7.0 0.7 5.5 6.7 9.2 1.5 5.1 1.4
71.1 89.6 86.3 65.7 73.5 94.0 78.8 74.3
91.3 82.7 86.1 76.2 82.3 80.9 84.2 79.4
1.0 2.5 0.0 0.0 0.0 0.0 0.0 1.6
77.0 54.1 57.0 44.0 39.0 30.3 36.7 32.8
2007 2009 2010 2011
Std I-IV/V
2007 2009 2010 2011
Std I-VII/VIII% Schools with
Std II children sitting with one or more other classes
Table 13: Multigrade classes 2007, 2009, 2010 and 2011
40.0 54.1 35.4 27.1 32.0 44.7 23.7 18.5
41.5 46.1 28.6 24.8 23.7 38.5 23.9 21.9Std IV children sitting with one or more other classes
School observations
Other school information
Student and teacher attendance

Arunachal Pradesh RURAL
The PAISA section of ASER tracks receipt and spending
of Sarva Shiksha Abhiyan (SSA) grants at the school
level. This information is collected from schools visited
during the survey. This page reports proportion of
schools receiving the grants and carrying out specified
activities in the schools. More detailed analysis of the
PAISA data will be available in the PAISA 2011 report
which will be released in March 2012.1
How much goes toeach school For what purposes
SCHOOL DEVELOPMENT GRANT / SCHOOL GRANT
Rs.5000 per year perprimary school
Rs.7000 per year per upperprimary school
Rs 5000 + Rs 7000 =Rs 12000 if the school isStd I-VII/VIII.
Note: Primary and UpperPrimary schools are treatedas separate schools even ifthey are in the same pre-mises.
This grant can be used forbuying school equipmentsuch as blackboard, sittingmats etc. Also for buyingchalk, duster, registers andother office equipment.
The grant amount varies bytype of school: whether it isa primary or upper primaryschool.
SCHOOL MAINTENANCE GRANT
This grant can be used formaintenance of schoolbuilding, includingwhitewashing;beautification; and repair oftoilets, hand pump,boundary wall, playgroundetc.
The grant amount dependson number of classrooms(excluding Headmasterroom and office room)
Rs.5000 - Rs 7500 perschool per year if the schoolhas upto 3 classrooms.
Rs 7500 - Rs.10000 per yearif the school has more than3 classrooms.
Primary and Upper Primaryschools are treated asseparate schools even ifthey are in the samebuilding.
TLM GRANT
This grant can be used byteachers to buy teachingaids, such as charts, globes,posters, models etc.
Rs.500 per teacher per yearin primary and upper pri-mary schools.
EVERY RURAL GOVERNMENT PRIMARY SCHOOLIS ENTITLED TO EACH OF THESE SSA GRANTSEVERY YEAR.
1 For more information see www.accountabilityinitiative.in
85ASER 2011
School funds and activities (PAISA)
DID SCHOOLS GET THEIR MONEY ON TIME?
2008-2009 2009-2010 2010-2011SSA school
grants% Schools % Schools % SchoolsNo.
ofSch.
No.of
Sch.Yes No Don’tknow
DID SCHOOLS GET THEIR MONEY ON TIME?
April 2009 toOctober 2009
April 2010 toOctober 2010
April 2011 toOctober 2011
% Schools % Schools % SchoolsNo.of
Sch.
No.of
Sch.
No.of
Sch.Yes No Don’tknow
Table 15: % Schools who report receiving SSA grants - Half financial year
Table 14: % Schools who report receiving SSA grants - Full financial year
MaintenancegrantDeve lopmentgrant
TLM grant
Yes No Don’tknow
Yes No Don’tknow
SSA school
grants
Ma intenancegrantDeve lopmentgrant
TLM grant
Yes No Don’tknow
Yes No Don’tknow
256 55.1 32.4 12.5 225 80.4 8.0 11.6 199 63.8 17.6 18.6
253 49.8 36.0 14.2 215 67.0 12.6 20.5 194 60.3 18.6 21.1
255 69.0 20.0 11.0 223 82.5 11.2 6.3 194 65.5 18.0 16.5
226 34.5 41.2 24.3 185 30.8 49.7 19.5 188 34.0 42.0 23.9
222 30.2 42.8 27.0 184 29.9 50.0 20.1 185 30.3 44.3 25.4
218 46.8 31.7 21.6 184 31.0 50.0 19.0 183 27.9 48.6 23.5
No.of
Sch.

Arunachal Pradesh RURAL
Note : For schools with enrollment above 200children the PTR shall not exceed 40 excludingthe Head Teacher
Extracts from the Schedule of The Right of Children toFree and Compulsory Education Act 2009 Norms andstandards for a School (Sections 19 and 25)
Number of teachers in Std 1-5:� Admitted children No. of teachers
<= 60 261-90 391-120 4121-200 5> 150 5 + 1 Headteacher> 200 Pupil-Teacher Ratio
(excluding Headteacher)shall not exceed 40
School facilities:All weather building with:
� At least one classroom for every teacher� Office cum store cum headteacher’s room� Separate toilets for boys and girls� Safe and adequate drinking water facility to
all children� A kitchen where mid-day meal is cooked in
the school� Playground� Arrangements for securing the school
building by boundary wall or fencing.
Teaching learning equipmentshall be provided to each class as required.
LibraryThere shall be a library in each school providingnewspaper, magazines and books on all subjects,including story-books.
As part of ASER 2010 and 2011, in each sampled village, onegovernment school with primary sections was visited on theday of the survey. During this school visit, RTE indicators wereobserved and are reported here.
Note: School observations for ASER 2011 looked at TLM for Std II and Std IV only.
2010 2011School
enrollment No. ofschools
No. ofschools
% ofschools
% ofschools
RTETeacherNorms
1-60
61-90
91-120
121-150
151-200
> 200
TOTAL
2011Schoolenrollment
2010
2
3
4
5
5 + HMsee note
2010
1
2
3
4
5
6
>=7
TOTAL
2011
Numberof
teachersNo.of
schools
No.of
schools
%of
schools
%of
schools
RTE norm:At least one
classroom perteacher
1
2
3
4
5
6
>=7
TOTAL
20112010
% Schools that do notmeet classroom to teacher
normsNumber ofteachers
% of schools with 2011
Building
DrinkingWater
Toilet
Girls Toilet
TLM
Library
MDM
Table 17: Schools by totalenrollment 2010 and 2011
Table 18: RTE norms: Pupil-teacherratio 2010 and 2011
Table 19: Schools by number ofteachers 2010 and 2011
Table 20: RTE norms: Teacher -classroom ratio 2010 and 2011
Table 21: % Schools meeting selected RTE norms on facilities 2010 & 2011
2010
1-60
61-90
91-120
121-150
151-200
> 200
TOTAL
86 ASER 2011
83 33.9 66 32.4
48 19.6 41 20.1
27 11.0 36 17.7
20 8.2 20 9.8
32 13.1 17 8.3
35 14.3 24 11.8
245 100.0 204 100.0
15 6.9 11 6.4
29 13.4 34 19.9
24 11.1 27 15.8
29 13.4 22 12.9
24 11.1 12 7.0
18 8.3 4 2.3
78 35.9 61 35.7
217 100.0 171 100.0
0.0 0.0
0.0 9.1
0.0 25.0
0.0 0.0
50.0 0.0
71.4 0.0
33.3 56.3
20.3 29.3
Right to Education indicators
77.0 78.359.2 67.325.1 36.736.9 30.49.9 9.0
53.2 60.720.8 30.853.9 39.025.3 30.360.4 51.2
11.3 17.916.2 8.912.2 22.039.4 52.134.4 48.887.0 80.36.7 10.66.3 9.1
64.0 63.747.2 47.5
18.5 13.7
23.8 33.3
23.1 23.5
20.0 50.0
11.5 37.5
42.9 52.6
22.0 29.6
% Schools that donot meet PTR norms
Office/Store/Office cum storePlaygroundBoundary WallNo facility for drinking waterFacility but no drinking water availableDrinking water availableNo toilet facilityFacility but toilet not useableToilet useable% Schools with no separate provisions for girls toiletsOf schools with separate girls toilets, % schools whereToilet lockedToilet not useableToilet useableTeaching learning material in Std 2Teaching learning material in Std 4No libraryLibrary but no books being used by children on day of visitLibrary being used by children on day of visitKitchen shed for cooking midday mealMidday meal served in school on the day of visit

Assam RURAL
Note: 'OTHER' includes children going to madarssa and EGS.‘NOT IN SCHOOL’ = dropped out + never enrolled.
How to read this table: If a child started school in Std I at age 6, she should be age 8 inStd 3. This table shows the age distribution for each class. For example, in Std III,39.2% children are 8 years old but there are also 14.1% who are 7, 28.2% who are 9,9.9% who are 10 years old, etc.
Chart 1: Trends over time% Children out of school by age group and gender 2006-2011
How to read this chart: For example, the proportion of girls (age 11-14) not in schoolhas changed from 5% in 2006 to 9.9% in 2007 to 8.3% in 2008 to 6.4% in 2009 to7.4% in 2010 to 5.5% in 2011
ALL ANALYSIS BASED ON DATA FROM HOUSEHOLDS. 22 OUT OF 23 DISTRICTS
TotalAge group Govt. Pvt. Other Not inSchool
77.8 14.5 3.5 4.2 100
75.4 14.4 3.5 6.7 100
80.1 14.8 3.0 2.2 100
78.7 15.7 2.9 2.6 100
81.6 13.7 3.1 1.6 100
75.0 13.8 4.1 7.1 100
73.2 14.3 3.9 8.6 100
76.9 13.4 4.3 5.5 100
62.0 14.9 3.4 19.6 100
60.3 13.5 3.1 23.1 100
63.9 16.5 3.9 15.7 100
Age: 6-14 ALL
Age: 7-16 ALL
Age: 7-10 ALL
Age: 7-10 BOYS
Age: 7-10 GIRLS
Age: 11-14 ALL
Age: 11-14 BOYS
Age: 11-14 GIRLS
Age: 15-16 ALL
Age: 15-16 BOYS
Age: 15-16 GIRLS
I
II
III
IV
V
VI
VII
VIII
Table 2: Sample description% Children in each class by age 2011
5 6 7 8 9 10 11 12 13 14 15 16 Total
26.1 40.6 21.2 7.6 4.4
3.8 14.0 39.2 29.7 7.4 5.9
3.2 14.1 39.2 28.2 9.9 5.4
3.3 14.8 30.1 36.5 7.5 7.8
5.6 7.8 39.7 28.1 12.0 6.7
3.9 11.6 27.7 39.3 11.4 6.1
4.1 7.2 36.5 32.3 13.2 6.6
3.6 13.4 31.8 37.4 9.8 4.0
100
100
100
100
100
100
100
100
Std.
Table 1: % Children in different types of schools 2011
87ASER 2011
School enrollment and out of school children
Young children in pre-school and school
% C
hild
ren
% C
hild
ren
% C
hild
ren
Chart 2: Trends over time% Children enrolled in private school by class 2007, 2009 & 2011
Chart 3: Trends over timeFive year olds in pre-school & school 2007, 2009 & 2011
Tota
l
In SchoolIn balwadi
oranganwadi
In LKG/UKG
Age 5
Age 6
Govt Pvt Other
35.6 2.9 45.1 12.5 1.4 2.6 100
6.5 2.5 70.9 14.8 3.4 2.0 100
Table 3: % Children age 5-6 who are enrolled in differenttypes of pre-school & school 2011
Not
enr
olle
dan
ywh
ere

Reading Tool
Assam RURAL
How to read this table: Each cell shows the highest level of reading achieved by a child.For example, in Std III, 8.5% children cannot even read letters, 22.2% can read lettersbut not more, 33.7% can read words but not Std 1 text or higher, 20.6% can read Std1 text but not Std 2 level text, and 14.9% can read Std 2 level text. In sum, for eachclass, the total of all these exclusive categories is 100%.
Std. NothingLevel 1
(Std 1 Text)Level 2
(Std 2 Text) Total
I
II
III
IV
V
VI
VII
VIII
Total
36.2 40.0 17.3 4.2 2.3 100
16.0 34.8 30.3 13.2 5.8 100
8.5 22.2 33.7 20.6 14.9 100
4.3 15.0 28.6 26.7 25.4 100
3.7 12.6 20.8 26.7 36.2 100
2.6 7.0 15.9 25.4 49.2 100
1.9 4.2 12.7 23.0 58.1 100
2.0 2.8 8.0 18.2 69.0 100
11.0 19.4 21.7 19.1 28.9 100
Chart 5: Trends over time% Children in Std V who CANNOT READ Std II LEVEL TEXTBy school type 2008-2011
Chart 4: Trends over time% Children in Std III who CANNOT READ Std I LEVEL TEXTBy school type 2008-2011
Letter Word
Table 4: % Children by class and READING levelAll schools 2011
88 ASER 2011
Home language and school language
Reading
% C
hild
ren
% C
hild
ren
Note: In ASER 2011 for every state, reading tools were provided in the main medium of instruction of government schools. In Assam, children were given the choice of reading inAssamese, Bengali, Hindi, English or Bodo. Figures for Bodo have not been included as they are currently being processed. For home languages, a list of 122 languages was providedto all survey teams. This included 22 Scheduled languages and 100 Non-Scheduled languages. The data in this table is for children for whom we have information for both schoollanguage and home language.
Table 5: School language and home language
%Children who took thereading test in:**
Of the % Children whotested in:**
% Children whose home language was:
* 'Other' includes all languages from the list of scheduled and non-scheduled languages except those specified above. Data forhome language of children tested in Hindi and English has not been reported here due to small cell sizes.
** Data in this table does not include the following districts - Bongaigaon, Darrang, Kokrajhar and Nalbari. The data for these fourdistricts is being processed.
%
82.9
14.2
1.6
1.3
100.0
Assamese
Bengali
Hindi
English
Total
Assamese Other * TotalBengali Bodo Karbi/Mikir
44.5 17.2 2.5 3.1 32.8 100
1.1 89.7 5.7 0.2 3.2 100
Assamese
Bengali
Note: This tool was also available in Bodo, Bangla, English and Hindi.

Math Tool
How to read this table: Each cell shows the highest level of arithmetic achieved by achild. For example, in Std III, 6.6% children cannot even recognize numbers 1-9, 32.3%children can recognize numbers up to 9 but not more, 37.6% can recognize numbers to99 but cannot do subtraction, 20.4% can do subtraction but not division, and 3.1% cando division. In sum, for each class, the total of all these exclusive categories is 100%.
Std. Nothing Subtract Divide Total
I
II
III
IV
V
VI
VII
VIII
Total
32.9 48.9 14.7 2.9 0.7 100
14.5 42.9 33.6 8.0 1.0 100
6.6 32.3 37.6 20.4 3.1 100
4.3 21.6 37.1 28.3 8.7 100
3.3 17.4 33.0 32.4 14.0 100
2.7 8.6 28.6 36.5 23.7 100
2.2 7.0 22.3 37.6 31.0 100
1.9 4.4 18.7 36.2 38.8 100
9.9 25.4 28.4 23.4 12.9 100
Recognize Numbers11-991-9
Chart 7: Trends over time% Children in Std V who CANNOT DO DIVISIONBy school type 2008-2011
Chart 6: Trends over time% Children in Std III who CANNOT RECOGNISE NUMBERS upto100. By school type 2008-2011
Assam RURAL
Table 7: Class-wise % children attending PAID TUITION CLASSESBy school type 2007, 2009, 2010 and 2011
Note: In 2007, 2009, 2010 and 2011 the ASER survey recorded information abouttuition. In all 4 years, the question asked was the following: “Does the child take anypaid additional class currently?” Therefore, these numbers do not include anysupplemental help in learning that children may have received from parents, siblingsor from anyone else who did not require payment.
Year School I II III IV V VI VII VIII Total
2007
2009
2010
2011
Govt
Pvt
Govt
Pvt
Govt
Pvt
Govt
Pvt
Table 6: % Children by class and ARITHMETIC levelAll schools 2011
89ASER 2011
7.8 11.4 15.5 17.2 20.6 26.0 28.2 33.7 18.2
16.3 30.0 32.2 31.0 24.0 24.4 29.3 38.7 27.3
11.0 12.9 13.8 19.0 20.7 23.0 21.6 29.4 18.0
24.2 29.0 31.2 40.5 30.7 27.8 30.3 27.9 29.6
8.0 9.2 12.6 14.8 17.8 18.5 22.2 26.5 15.2
22.6 30.7 24.8 35.1 28.7 28.2 27.7 30.4 28.2
6.8 12.5 12.6 15.2 14.7 18.7 21.8 24.3 15.0
24.4 29.5 30.2 31.5 34.3 27.9 33.3 36.9 30.6
Arithmetic
Tuition
% C
hild
ren
% C
hild
ren

As part of ASER 2007, 2009, 2010 and 2011, in each sampled village, one government school with primary sections was visited on the day of the survey.
Information about schools in this report is based on these visits.
Assam RURAL
2007 2009 2010 2011 2007 2009 2010 2011
Std I-IV/V Std I-VII/VIIIType of school
% Enrolledchildren present(average)
% Schools with lessthan 50% enrolledchildren present(average)
% Schools with75% or moreenrolled childrenpresent (average)
2007 2009 2010 2011 2007 2009 2010 2011
Std I-IV/V Std I-VII/VIIIType of school
% Teachers present(average)
% Schools withno teacherspresent(average)
% Schools withall teacherspresent(average)
Std I-IV/V Std I-VII/VIII2010 2011 2010 2011
% Schools with:
No Headteacher appointed
Headteacher appointed but not present attime of visitHeadteacher appointed & present at timeof visit
Total
Std I-IV/V Std I-VII/VIII2010 2011 2010 2011
% Schools with:
No computer
Computers but no children using them onday of visitComputers & children using them on dayof visit
Total
2007Type of school
Std I-IV/V: Primary
Std I-VII/VIII: Primary + Upper primary
Total schools visited
2009 2010 2011
Table 8: Total schools visited 2007, 2009, 2010 and 2011
Table 9: Student attendance 2007, 2009, 2010 and 2011
Table 11: Headteachers 2010 & 2011 Table 12: Computers 2010 and 2011
Table 10: Teacher attendance 2007, 2009, 2010 and 2011
90 ASER 2011
0.0 0.0 0.0 0.0
5.9 3.7 12.5 14.3
94.1 96.3 87.5 85.7
100 100 100 100
99.0 98.5 75.0 80.8
1.0 0.4 18.8 7.7
0.0 1.1 6.3 11.5
100 100 100 100
513 527 503 483
35 26 16 27
548 553 519 510
71.2 70.8 69.0 71.1 72.6 65.3 69.6 69.4
13.8 12.4 15.3 11.8 8.8 16.0 12.5 7.4
48.1 49.3 45.6 48.1 47.1 36.0 31.3 33.3
88.3 88.1 90.8 92.8 85.4 81.6 67.7 84.6
0.6 1.1 0.2 0.5 0.0 0.0 0.0 4.2
70.5 70.6 74.4 79.0 53.9 36.4 20.0 58.3
2007 2009 2010 2011
Std I-IV/V
2007 2009 2010 2011
Std I-VII/VIII% Schools with:
Std II children sitting with one or more other classes
Table 13: Multigrade classes 2007, 2009, 2010 and 2011
39.0 55.9 44.1 53.4 36.7 52.0 33.3 41.7
33.3 49.0 41.5 50.6 37.5 43.5 26.7 38.1Std IV children sitting with one or more other classes
School observations
Other school information
Student and teacher attendance

Assam RURAL
How much goes toeach school For what purposes
SCHOOL DEVELOPMENT GRANT / SCHOOL GRANT
Rs.5000 per year perprimary school
Rs.7000 per year per upperprimary school
Rs 5000 + Rs 7000 =Rs 12000 if the school isStd I-VII/VIII.
Note: Primary and UpperPrimary schools are treatedas separate schools even ifthey are in the same pre-mises.
This grant can be used forbuying school equipmentsuch as blackboard, sittingmats etc. Also for buyingchalk, duster, registers andother office equipment.
The grant amount varies bytype of school: whether it isa primary or upper primaryschool.
SCHOOL MAINTENANCE GRANT
Rs.5000 - Rs 7500 perschool per year if the schoolhas upto 3 classrooms.
Rs 7500 - Rs.10000 per yearif the school has more than3 classrooms.
Primary and Upper Primaryschools are treated asseparate schools even ifthey are in the samebuilding.
TLM GRANT
This grant can be used byteachers to buy teachingaids, such as charts, globes,posters, models etc.
Rs.500 per teacher per yearin primary and upper pri-mary schools.
1 For more information see www.accountabilityinitiative.in
91ASER 2011
School funds and activities (PAISA)
This grant can be used formaintenance of schoolbuilding, includingwhitewashing;beautification; and repair oftoilets, hand pump,boundary wall, playgroundetc.
The grant amount dependson number of classrooms(excluding Headmasterroom and office room)
DID SCHOOLS GET THEIR MONEY ON TIME?
2008-2009 2009-2010 2010-2011SSA school
grants% Schools % Schools % SchoolsNo.
ofSch.
No.of
Sch.Yes No Don’tknow
DID SCHOOLS GET THEIR MONEY ON TIME?
April 2009 toOctober 2009
April 2010 toOctober 2010
April 2011 toOctober 2011
% Schools % Schools % SchoolsNo.of
Sch.
No.of
Sch.
No.of
Sch.Yes No Don’tknow
Type of Activity
Yes No Don'tknow
New Classroom
Repair of building (roof, floor, wall etc.)
Repair of doors & windows
Repair of boundary wall
Repair of drinking water facility
Repair of toilet
White wash/plastering
Painting Blackboard/Display Board/Painting on wall
Painting of doors & walls
Purchase of furniture (cupboard etc.)
Purchase of electrical fittings
Purchase of chalk, duster, register etc.
Purchase of sitting Mats/Tat Patti
Purchase of charts, globes & other teaching material
Expenditure on school events
Payment of bills (electricity, water, cleaning etc.)
Const.
Repairs
Painting
& White
Wash
Purchase
Other
Table 15: % Schools who report receiving SSA grants - Half financial year
Table 16: % Schools carrying out different activities since April 2010
Table 14: % Schools who report receiving SSA grants - Full financial year
19.0 74.9 6.1
38.4 58.1 3.6
39.0 56.4 4.6
18.5 77.4 4.1
32.8 63.7 3.5
27.5 68.6 4.0
36.2 59.1 4.7
41.6 54.3 4.1
32.1 64.2 3.7
45.1 50.2 4.6
15.0 80.1 4.9
82.6 14.4 3.0
30.3 65.6 4.1
61.7 35.1 3.2
39.2 55.9 5.0
16.2 79.3 4.5
% schools
Ma intenancegrantDeve lopmentgrant
TLM grant
Yes No Don’tknow
Yes No Don’tknow
SSA school
grants
Ma intenancegrantDeve lopmentgrant
TLM grant
Yes No Don’tknow
Yes No Don’tknow
489 82.0 14.1 3.9 487 87.7 5.8 6.6 484 78.7 14.1 7.2
469 68.4 27.1 4.5 442 81.9 10.6 7.5 474 70.9 21.3 7.8
504 89.3 8.1 2.6 466 90.3 4.5 5.2 484 87.0 8.5 4.6
429 74.4 21.5 4.2 413 46.0 40.0 14.0 452 42.0 46.5 11.5
404 63.1 31.9 5.0 367 43.9 42.8 13.4 440 40.0 47.3 12.7
438 82.2 15.3 2.5 379 50.1 39.3 10.6 449 55.0 36.3 8.7
No.of
Sch.
EVERY RURAL GOVERNMENT PRIMARY SCHOOLIS ENTITLED TO EACH OF THESE SSA GRANTSEVERY YEAR.
The PAISA section of ASER tracks receipt and spending
of Sarva Shiksha Abhiyan (SSA) grants at the school
level. This information is collected from schools visited
during the survey. This page reports proportion of
schools receiving the grants and carrying out specified
activities in the schools. More detailed analysis of the
PAISA data will be available in the PAISA 2011 report
which will be released in March 2012.1

Assam RURAL
Note : For schools with enrollment above 200children the PTR shall not exceed 40 excludingthe Head Teacher
Extracts from the Schedule of The Right of Children toFree and Compulsory Education Act 2009 Norms andstandards for a School (Sections 19 and 25)
Number of teachers in Std 1-5:� Admitted children No. of teachers
<= 60 261-90 391-120 4121-200 5> 150 5 + 1 Headteacher> 200 Pupil-Teacher Ratio
(excluding Headteacher)shall not exceed 40
School facilities:All weather building with:
� At least one classroom for every teacher� Office cum store cum headteacher’s room� Separate toilets for boys and girls� Safe and adequate drinking water facility to
all children� A kitchen where mid-day meal is cooked in
the school� Playground� Arrangements for securing the school
building by boundary wall or fencing.
Teaching learning equipmentshall be provided to each class as required.
LibraryThere shall be a library in each school providingnewspaper, magazines and books on all subjects,including story-books.
As part of ASER 2010 and 2011, in each sampled village, onegovernment school with primary sections was visited on theday of the survey. During this school visit, RTE indicators wereobserved and are reported here.
Note: School observations for ASER 2011 looked at TLM for Std II and Std IV only.
2010 2011School
enrollment No. ofschools
No. ofschools
% ofschools
% ofschools
RTETeacherNorms
1-60
61-90
91-120
121-150
151-200
> 200
TOTAL
2011Schoolenrollment
2010
2
3
4
5
5 + HMsee note
2010
1
2
3
4
5
6
>=7
TOTAL
2011
Numberof
teachersNo.of
schools
No.of
schools
%of
schools
%of
schools
RTE norm:At least one
classroom perteacher
1
2
3
4
5
6
>=7
TOTAL
20112010
% Schools that do notmeet classroom to teacher
normsNumber ofteachers
% of schools with 2011
Building
DrinkingWater
Toilet
Girls Toilet
TLM
Library
MDM
Table 17: Schools by totalenrollment 2010 and 2011
Table 18: RTE norms: Pupil-teacherratio 2010 and 2011
Table 19: Schools by number ofteachers 2010 and 2011
Table 20: RTE norms: Teacher -classroom ratio 2010 and 2011
Table 21: % Schools meeting selected RTE norms on facilities 2010 & 2011
2010
1-60
61-90
91-120
121-150
151-200
> 200
TOTAL
92 ASER 2011
210 40.9 160 31.9
91 17.7 94 18.7
66 12.8 79 15.7
50 9.7 45 9.0
52 10.1 49 9.8
45 8.8 75 14.9
514 100.0 502 100.0
137 35.9 119 33.9
98 25.7 99 28.2
64 16.8 63 18.0
33 8.6 30 8.6
15 3.9 10 2.9
3 0.8 7 2.0
32 8.4 23 6.6
382 100.0 351 100.0
0.0 0.0
19.1 25.9
42.9 53.7
75.0 83.3
91.7 60.0
100.0 66.7
83.3 88.2
32.3 35.2
Right to Education indicators
57.3 54.161.5 56.519.3 23.323.2 23.816.0 11.760.9 64.619.1 13.147.8 49.233.1 37.852.2 34.3
18.5 19.315.6 19.013.7 27.471.4 71.167.1 72.279.2 71.910.3 14.510.5 13.680.0 81.566.6 59.6
44.4 38.2
68.1 70.2
84.0 90.9
82.5 90.6
90.9 85.3
90.9 90.5
66.4 71.0
% Schools that donot meet PTR norms
Office/Store/Office cum storePlaygroundBoundary WallNo facility for drinking waterFacility but no drinking water availableDrinking water availableNo toilet facilityFacility but toilet not useableToilet useable% Schools with no separate provisions for girls toiletsOf schools with separate girls toilets, % schools whereToilet lockedToilet not useableToilet useableTeaching learning material in Std 2Teaching learning material in Std 4No libraryLibrary but no books being used by children on day of visitLibrary being used by children on day of visitKitchen shed for cooking midday mealMidday meal served in school on the day of visit
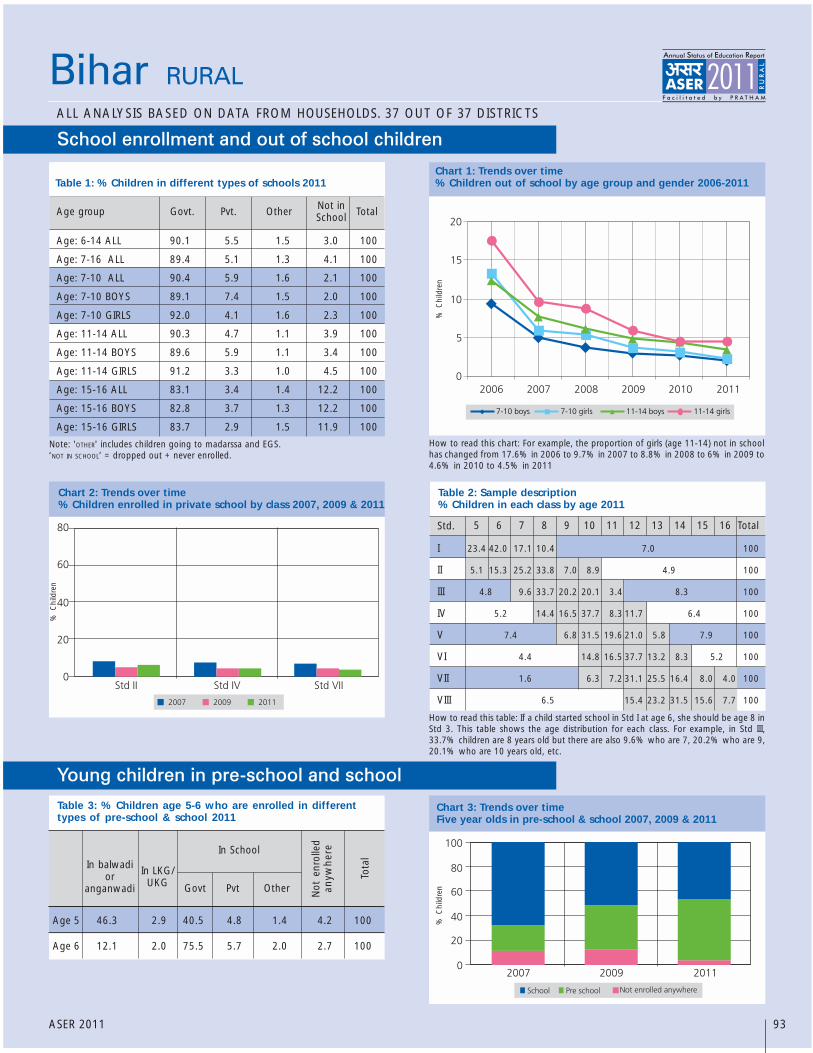
Bihar RURAL
Note: 'OTHER' includes children going to madarssa and EGS.‘NOT IN SCHOOL’ = dropped out + never enrolled.
How to read this table: If a child started school in Std I at age 6, she should be age 8 inStd 3. This table shows the age distribution for each class. For example, in Std III,33.7% children are 8 years old but there are also 9.6% who are 7, 20.2% who are 9,20.1% who are 10 years old, etc.
Chart 1: Trends over time% Children out of school by age group and gender 2006-2011
How to read this chart: For example, the proportion of girls (age 11-14) not in schoolhas changed from 17.6% in 2006 to 9.7% in 2007 to 8.8% in 2008 to 6% in 2009 to4.6% in 2010 to 4.5% in 2011
ALL ANALYSIS BASED ON DATA FROM HOUSEHOLDS. 37 OUT OF 37 DISTRICTS
TotalAge group Govt. Pvt. Other Not inSchool
90.1 5.5 1.5 3.0 100
89.4 5.1 1.3 4.1 100
90.4 5.9 1.6 2.1 100
89.1 7.4 1.5 2.0 100
92.0 4.1 1.6 2.3 100
90.3 4.7 1.1 3.9 100
89.6 5.9 1.1 3.4 100
91.2 3.3 1.0 4.5 100
83.1 3.4 1.4 12.2 100
82.8 3.7 1.3 12.2 100
83.7 2.9 1.5 11.9 100
Age: 6-14 ALL
Age: 7-16 ALL
Age: 7-10 ALL
Age: 7-10 BOYS
Age: 7-10 GIRLS
Age: 11-14 ALL
Age: 11-14 BOYS
Age: 11-14 GIRLS
Age: 15-16 ALL
Age: 15-16 BOYS
Age: 15-16 GIRLS
I
II
III
IV
V
VI
VII
VIII
Table 2: Sample description% Children in each class by age 2011
5 6 7 8 9 10 11 12 13 14 15 16 Total
23.4 42.0 17.1 10.4 7.0
5.1 15.3 25.2 33.8 7.0 8.9 4.9
4.8 9.6 33.7 20.2 20.1 3.4 8.3
5.2 14.4 16.5 37.7 8.3 11.7 6.4
7.4 6.8 31.5 19.6 21.0 5.8 7.9
4.4 14.8 16.5 37.7 13.2 8.3 5.2
1.6 6.3 7.2 31.1 25.5 16.4 8.0 4.0
6.5 15.4 23.2 31.5 15.6 7.7
100
100
100
100
100
100
100
100
Std.
Table 1: % Children in different types of schools 2011
93ASER 2011
School enrollment and out of school children
Young children in pre-school and school
% C
hild
ren
% C
hild
ren
% C
hild
ren
Chart 2: Trends over time% Children enrolled in private school by class 2007, 2009 & 2011
Chart 3: Trends over timeFive year olds in pre-school & school 2007, 2009 & 2011
Tota
l
In SchoolIn balwadi
oranganwadi
In LKG/UKG
Age 5
Age 6
Govt Pvt Other
46.3 2.9 40.5 4.8 1.4 4.2 100
12.1 2.0 75.5 5.7 2.0 2.7 100
Table 3: % Children age 5-6 who are enrolled in differenttypes of pre-school & school 2011
Not
enr
olle
dan
ywh
ere

Reading Tool
Bihar RURAL
How to read this table: Each cell shows the highest level of reading achieved by a child.For example, in Std III, 12.9% children cannot even read letters, 26.2% can readletters but not more, 29.1% can read words but not Std 1 text or higher, 16.5% canread Std 1 text but not Std 2 level text, and 15.4% can read Std 2 level text. In sum, foreach class, the total of all these exclusive categories is 100%.
Std. NothingLevel 1
(Std 1 Text)Level 2
(Std 2 Text) Total
I
II
III
IV
V
VI
VII
VIII
Total
53.9 30.6 9.4 3.1 3.1 100
25.9 35.1 23.1 8.5 7.5 100
12.9 26.2 29.1 16.5 15.4 100
7.1 17.0 21.1 24.2 30.7 100
4.7 10.3 13.9 21.6 49.5 100
2.1 5.9 8.3 16.6 67.0 100
1.6 3.2 4.8 12.4 78.0 100
1.6 1.8 3.2 9.3 84.2 100
16.4 18.7 15.5 14.0 35.5 100
Chart 5: Trends over time% Children in Std V who CANNOT READ Std II LEVEL TEXTBy school type 2008-2011
Chart 4: Trends over time% Children in Std III who CANNOT READ Std I LEVEL TEXTBy school type 2008-2011
Letter Word
Table 4: % Children by class and READING levelAll schools 2011
Note : In ASER 2011 for every state, reading tools were provided in the main mediumof instruction in government schools. Children and their families were also askedabout the language they speak at home. For home languages, a list of 122languages was provided to all survey teams. This list includes 22 Scheduledlanguages and 100 Non-Scheduled languages. The data in this table is for childrenfor whom we have information for both school language and home language.
Table 5: School language and home language
% Children whose :
Home language is the same as school language
Home language is different from school language
Total
%
94 ASER 2011
47.0
53.0
100.0
Home language and school language
Reading
% C
hild
ren
% C
hild
ren

Math Tool
How to read this table: Each cell shows the highest level of arithmetic achieved by achild. For example, in Std III, 11.2% children cannot even recognize numbers 1-9, 29.5%children can recognize numbers up to 9 but not more, 29.7% can recognize numbers to99 but cannot do subtraction, 20.7% can do subtraction but not division, and 8.9% cando division. In sum, for each class, the total of all these exclusive categories is 100%.
Std. Nothing Subtract Divide Total
I
II
III
IV
V
VI
VII
VIII
Total
51.0 35.0 9.1 3.3 1.6 100
23.2 40.5 22.7 9.3 4.4 100
11.2 29.5 29.7 20.7 8.9 100
5.5 18.1 26.7 30.6 19.1 100
3.7 11.7 17.5 30.2 36.9 100
2.2 6.2 11.3 26.8 53.5 100
1.4 3.5 8.7 21.6 64.8 100
1.7 2.1 5.6 16.2 74.3 100
14.9 21.0 17.6 19.3 27.3 100
Recognize Numbers11-991-9
Chart 7: Trends over time% Children in Std V who CANNOT DO DIVISIONBy school type 2008-2011
Chart 6: Trends over time% Children in Std III who CANNOT RECOGNISE NUMBERS upto100. By school type 2008-2011
Bihar RURAL
Table 7: Class-wise % children attending PAID TUITION CLASSESBy school type 2007, 2009, 2010 and 2011
Note: In 2007, 2009, 2010 and 2011 the ASER survey recorded information abouttuition. In all 4 years, the question asked was the following: “Does the child take anypaid additional class currently?” Therefore, these numbers do not include anysupplemental help in learning that children may have received from parents, siblingsor from anyone else who did not require payment.
Year School I II III IV V VI VII VIII Total
2007
2009
2010
2011
Govt
Pvt
Govt
Pvt
Govt
Pvt
Govt
Pvt
Table 6: % Children by class and ARITHMETIC levelAll schools 2011
95ASER 2011
23.9 31.5 37.9 39.9 42.3 44.2 51.6 54.8 37.7
53.3 56.5 64.1 65.1 66.6 67.2 70.3 65.8 61.6
32.9 38.5 43.4 47.4 51.2 56.5 55.9 61.0 46.1
53.2 62.9 68.7 65.8 68.5 73.4 73.3 66.4 64.0
31.8 38.8 42.3 46.9 55.5 55.9 59.8 63.6 47.7
41.5 37.6 62.7 66.5 63.7 66.9 67.7 65.0 54.8
31.5 38.3 41.8 48.2 50.9 55.4 58.9 63.0 46.7
53.0 60.9 66.7 60.5 66.6 61.9 64.5 63.0 60.8
Arithmetic
Tuition
% C
hild
ren
% C
hild
ren

As part of ASER 2007, 2009, 2010 and 2011, in each sampled village, one government school with primary sections was visited on the day of the survey.
Information about schools in this report is based on these visits.
Bihar RURAL
2007 2009 2010 2011 2007 2009 2010 2011
Std I-IV/V Std I-VII/VIIIType of school
% Enrolledchildren present(average)
% Schools with lessthan 50% enrolledchildren present(average)
% Schools with75% or moreenrolled childrenpresent (average)
2007 2009 2010 2011 2007 2009 2010 2011
Std I-IV/V Std I-VII/VIIIType of school
% Teachers present(average)
% Schools withno teacherspresent(average)
% Schools withall teacherspresent(average)
Std I-IV/V Std I-VII/VIII2010 2011 2010 2011
% Schools with:
No Headteacher appointed
Headteacher appointed but not present attime of visitHeadteacher appointed & present at timeof visit
Total
Std I-IV/V Std I-VII/VIII2010 2011 2010 2011
% Schools with:
No computer
Computers but no children using them onday of visitComputers & children using them on dayof visit
Total
2007Type of school
Std I-IV/V: Primary
Std I-VII/VIII: Primary + Upper primary
Total schools visited
2009 2010 2011
Table 8: Total schools visited 2007, 2009, 2010 and 2011
Table 9: Student attendance 2007, 2009, 2010 and 2011
Table 11: Headteachers 2010 & 2011 Table 12: Computers 2010 and 2011
Table 10: Teacher attendance 2007, 2009, 2010 and 2011
96 ASER 2011
14.5 3.9 5.7 1.5
9.9 8.7 10.8 10.1
75.6 87.4 83.5 88.4
100 100 100 100
96.8 98.0 91.7 93.4
1.2 1.6 3.6 5.1
2.0 0.4 4.7 1.5
100 100 100 100
481 353 265 252
491 607 702 770
972 960 967 1022
59.0 57.0 56.1 50.0 56.6 57.9 55.9 49.1
31.1 34.8 34.4 49.0 34.7 29.4 33.6 49.7
21.5 16.2 13.8 8.0 18.4 15.9 14.9 8.1
85.7 81.7 84.6 85.1 85.8 82.8 80.6 85.2
0.7 0.9 0.4 0.4 0.5 0.4 0.0 0.3
57.5 49.8 55.0 55.8 47.1 41.3 39.1 44.5
2007 2009 2010 2011
Std I-IV/V
2007 2009 2010 2011
Std I-VII/VIII% Schools with:
Std II children sitting with one or more other classes
Table 13: Multigrade classes 2007, 2009, 2010 and 2011
70.0 66.7 67.6 72.3 55.9 55.4 53.0 57.3
65.8 67.0 63.7 67.3 52.2 51.7 43.4 50.5Std IV children sitting with one or more other classes
School observations
Other school information
Student and teacher attendance

Bihar RURAL
How much goes toeach school For what purposes
SCHOOL DEVELOPMENT GRANT / SCHOOL GRANT
Rs.5000 per year perprimary school
Rs.7000 per year per upperprimary school
Rs 5000 + Rs 7000 =Rs 12000 if the school isStd I-VII/VIII.
Note: Primary and UpperPrimary schools are treatedas separate schools even ifthey are in the same pre-mises.
This grant can be used forbuying school equipmentsuch as blackboard, sittingmats etc. Also for buyingchalk, duster, registers andother office equipment.
The grant amount varies bytype of school: whether it isa primary or upper primaryschool.
SCHOOL MAINTENANCE GRANT
Rs.5000 - Rs 7500 perschool per year if the schoolhas upto 3 classrooms.
Rs 7500 - Rs.10000 per yearif the school has more than3 classrooms.
Primary and Upper Primaryschools are treated asseparate schools even ifthey are in the samebuilding.
TLM GRANT
This grant can be used byteachers to buy teachingaids, such as charts, globes,posters, models etc.
Rs.500 per teacher per yearin primary and upper pri-mary schools.
1 For more information see www.accountabilityinitiative.in
97ASER 2011
School funds and activities (PAISA)
This grant can be used formaintenance of schoolbuilding, includingwhitewashing;beautification; and repair oftoilets, hand pump,boundary wall, playgroundetc.
The grant amount dependson number of classrooms(excluding Headmasterroom and office room)
DID SCHOOLS GET THEIR MONEY ON TIME?
2008-2009 2009-2010 2010-2011SSA school
grants% Schools % Schools % SchoolsNo.
ofSch.
No.of
Sch.Yes No Don’tknow
DID SCHOOLS GET THEIR MONEY ON TIME?
April 2009 toOctober 2009
April 2010 toOctober 2010
April 2011 toOctober 2011
% Schools % Schools % SchoolsNo.of
Sch.
No.of
Sch.
No.of
Sch.Yes No Don’tknow
Type of Activity
Yes No Don'tknow
New Classroom
Repair of building (roof, floor, wall etc.)
Repair of doors & windows
Repair of boundary wall
Repair of drinking water facility
Repair of toilet
White wash/plastering
Painting Blackboard/Display Board/Painting on wall
Painting of doors & walls
Purchase of furniture (cupboard etc.)
Purchase of electrical fittings
Purchase of chalk, duster, register etc.
Purchase of sitting Mats/Tat Patti
Purchase of charts, globes & other teaching material
Expenditure on school events
Payment of bills (electricity, water, cleaning etc.)
Const.
Repairs
Painting
& White
Wash
Purchase
Other
Table 15: % Schools who report receiving SSA grants - Half financial year
Table 16: % Schools carrying out different activities since April 2010
Table 14: % Schools who report receiving SSA grants - Full financial year
32.9 63.9 3.2
38.1 58.9 3.0
40.9 56.4 2.7
18.5 79.3 2.2
58.4 39.7 2.0
31.9 66.2 1.9
63.1 34.3 2.6
59.7 38.0 2.3
53.6 44.2 2.2
41.5 54.9 3.7
7.1 90.1 2.8
86.7 11.7 1.7
33.1 64.4 2.5
72.8 25.4 1.8
74.6 23.1 2.4
15.7 81.0 3.3
% schools
Ma intenancegrantDeve lopmentgrant
TLM grant
Yes No Don’tknow
Yes No Don’tknow
SSA school
grants
Ma intenancegrantDeve lopmentgrant
TLM grant
Yes No Don’tknow
Yes No Don’tknow
857 71.5 14.4 14.1 686 86.7 5.1 8.2 990 79.2 14.8 6.1
842 72.9 13.2 13.9 690 85.9 6.2 7.8 986 82.7 11.6 5.8
863 75.2 13.1 11.7 698 88.7 5.6 5.7 988 85.2 10.8 4.0
710 43.4 37.5 19.2 634 59.5 28.6 12.0 963 28.4 63.6 8.1
692 46.0 35.0 19.1 631 59.6 29.6 10.8 966 29.3 62.7 8.0
695 46.9 35.8 17.3 638 61.0 29.2 9.9 966 32.4 61.2 6.4
No.of
Sch.
EVERY RURAL GOVERNMENT PRIMARY SCHOOLIS ENTITLED TO EACH OF THESE SSA GRANTSEVERY YEAR.
The PAISA section of ASER tracks receipt and spending
of Sarva Shiksha Abhiyan (SSA) grants at the school
level. This information is collected from schools visited
during the survey. This page reports proportion of
schools receiving the grants and carrying out specified
activities in the schools. More detailed analysis of the
PAISA data will be available in the PAISA 2011 report
which will be released in March 2012.1

Bihar RURAL
Note : For schools with enrollment above 200children the PTR shall not exceed 40 excludingthe Head Teacher
Extracts from the Schedule of The Right of Children toFree and Compulsory Education Act 2009 Norms andstandards for a School (Sections 19 and 25)
Number of teachers in Std 1-5:� Admitted children No. of teachers
<= 60 261-90 391-120 4121-200 5> 150 5 + 1 Headteacher> 200 Pupil-Teacher Ratio
(excluding Headteacher)shall not exceed 40
School facilities:All weather building with:
� At least one classroom for every teacher� Office cum store cum headteacher’s room� Separate toilets for boys and girls� Safe and adequate drinking water facility to
all children� A kitchen where mid-day meal is cooked in
the school� Playground� Arrangements for securing the school
building by boundary wall or fencing.
Teaching learning equipmentshall be provided to each class as required.
LibraryThere shall be a library in each school providingnewspaper, magazines and books on all subjects,including story-books.
As part of ASER 2010 and 2011, in each sampled village, onegovernment school with primary sections was visited on theday of the survey. During this school visit, RTE indicators wereobserved and are reported here.
Note: School observations for ASER 2011 looked at TLM for Std II and Std IV only.
2010 2011School
enrollment No. ofschools
No. ofschools
% ofschools
% ofschools
RTETeacherNorms
1-60
61-90
91-120
121-150
151-200
> 200
TOTAL
2011Schoolenrollment
2010
2
3
4
5
5 + HMsee note
2010
1
2
3
4
5
6
>=7
TOTAL
2011
Numberof
teachersNo.of
schools
No.of
schools
%of
schools
%of
schools
RTE norm:At least one
classroom perteacher
1
2
3
4
5
6
>=7
TOTAL
20112010
% Schools that do notmeet classroom to teacher
normsNumber ofteachers
% of schools with 2011
Building
DrinkingWater
Toilet
Girls Toilet
TLM
Library
MDM
Table 17: Schools by totalenrollment 2010 and 2011
Table 18: RTE norms: Pupil-teacherratio 2010 and 2011
Table 19: Schools by number ofteachers 2010 and 2011
Table 20: RTE norms: Teacher -classroom ratio 2010 and 2011
Table 21: % Schools meeting selected RTE norms on facilities 2010 & 2011
2010
1-60
61-90
91-120
121-150
151-200
> 200
TOTAL
98 ASER 2011
2 0.2 3 0.3
4 0.4 6 0.6
21 2.3 26 2.6
27 2.9 42 4.2
77 8.3 71 7.0
800 85.9 862 85.4
931 100.0 1010 100.0
26 3.1 43 4.5
56 6.7 81 8.5
71 8.5 95 10.0
110 13.2 124 13.1
106 12.7 98 10.3
77 9.3 96 10.1
386 46.4 412 43.4
832 100.0 949 100.0
5.6 8.3
10.3 17.2
35.7 34.2
55.0 42.6
65.4 52.1
68.9 67.5
55.3 52.3
51.8 45.8
Right to Education indicators
0.0 50.0
0.0 80.0
65.0 82.6
73.9 88.2
82.7 84.1
93.4 96.4
91.2 94.7
68.6 66.148.0 48.947.5 47.09.6 6.8
11.7 9.478.7 83.819.3 19.047.2 35.333.6 45.749.9 37.6
15.1 8.216.9 18.918.1 35.470.8 72.164.1 66.347.1 38.924.7 29.328.2 31.863.6 71.456.4 54.5
% Schools that donot meet PTR norms
Office/Store/Office cum storePlaygroundBoundary WallNo facility for drinking waterFacility but no drinking water availableDrinking water availableNo toilet facilityFacility but toilet not useableToilet useable% Schools with no separate provisions for girls toiletsOf schools with separate girls toilets, % schools whereToilet lockedToilet not useableToilet useableTeaching learning material in Std 2Teaching learning material in Std 4No libraryLibrary but no books being used by children on day of visitLibrary being used by children on day of visitKitchen shed for cooking midday mealMidday meal served in school on the day of visit

Chhattisgarh RURAL
Note: 'OTHER' includes children going to madarssa and EGS.‘NOT IN SCHOOL’ = dropped out + never enrolled.
How to read this table: If a child started school in Std I at age 6, she should be age 8 inStd 3. This table shows the age distribution for each class. For example, in Std III,40.8% children are 8 years old but there are also 7.8% who are 7, 40.2% who are 9years old, etc.
Chart 1: Trends over time% Children out of school by age group and gender 2006-2011
How to read this chart: For example, the proportion of girls (age 11-14) not in schoolhas changed from 13.6% in 2006 to 8.5% in 2007 to 8.7% in 2008 to 4.9% in 2009to 3.2% in 2010 to 4.3% in 2011
ALL ANALYSIS BASED ON DATA FROM HOUSEHOLDS. 15 OUT OF 16 DISTRICTS
TotalAge group Govt. Pvt. Other Not inSchool
86.4 11.0 0.2 2.4 100
84.8 10.3 0.2 4.8 100
86.4 12.3 0.2 1.1 100
86.2 12.8 0.1 0.9 100
86.7 11.7 0.3 1.4 100
87.1 8.7 0.2 4.0 100
87.4 8.6 0.3 3.8 100
86.9 8.8 0.1 4.3 100
75.9 9.4 0.1 14.6 100
75.1 9.6 0.1 15.3 100
76.8 9.3 0.2 13.7 100
Age: 6-14 ALL
Age: 7-16 ALL
Age: 7-10 ALL
Age: 7-10 BOYS
Age: 7-10 GIRLS
Age: 11-14 ALL
Age: 11-14 BOYS
Age: 11-14 GIRLS
Age: 15-16 ALL
Age: 15-16 BOYS
Age: 15-16 GIRLS
I
II
III
IV
V
VI
VII
VIII
Table 2: Sample description% Children in each class by age 2011
5 6 7 8 9 10 11 12 13 14 15 16 Total
17.4 62.2 16.6 3.8
2.2 10.0 44.6 36.7 6.4
2.7 7.8 40.8 40.2 8.6
3.1 8.6 33.1 43.8 6.3 5.1
8.4 34.0 41.4 10.6 5.7
1.9 7.5 29.9 45.7 10.2 4.9
3.1 6.2 30.1 43.1 12.6 4.9
3.8 8.6 25.7 44.7 13.0 4.2
100
100
100
100
100
100
100
100
Std.
Table 1: % Children in different types of schools 2011
99ASER 2011
School enrollment and out of school children
Young children in pre-school and school
% C
hild
ren
% C
hild
ren
% C
hild
ren
Chart 2: Trends over time% Children enrolled in private school by class 2007, 2009 & 2011
Chart 3: Trends over timeFive year olds in pre-school & school 2007, 2009 & 2011
Tota
l
In SchoolIn balwadi
oranganwadi
In LKG/UKG
Age 5
Age 6
Govt Pvt Other
45.1 10.9 30.9 10.8 0.7 1.7 100
4.2 3.5 76.2 14.9 0.6 0.7 100
Table 3: % Children age 5-6 who are enrolled in differenttypes of pre-school & school 2011
Not
enr
olle
dan
ywh
ere
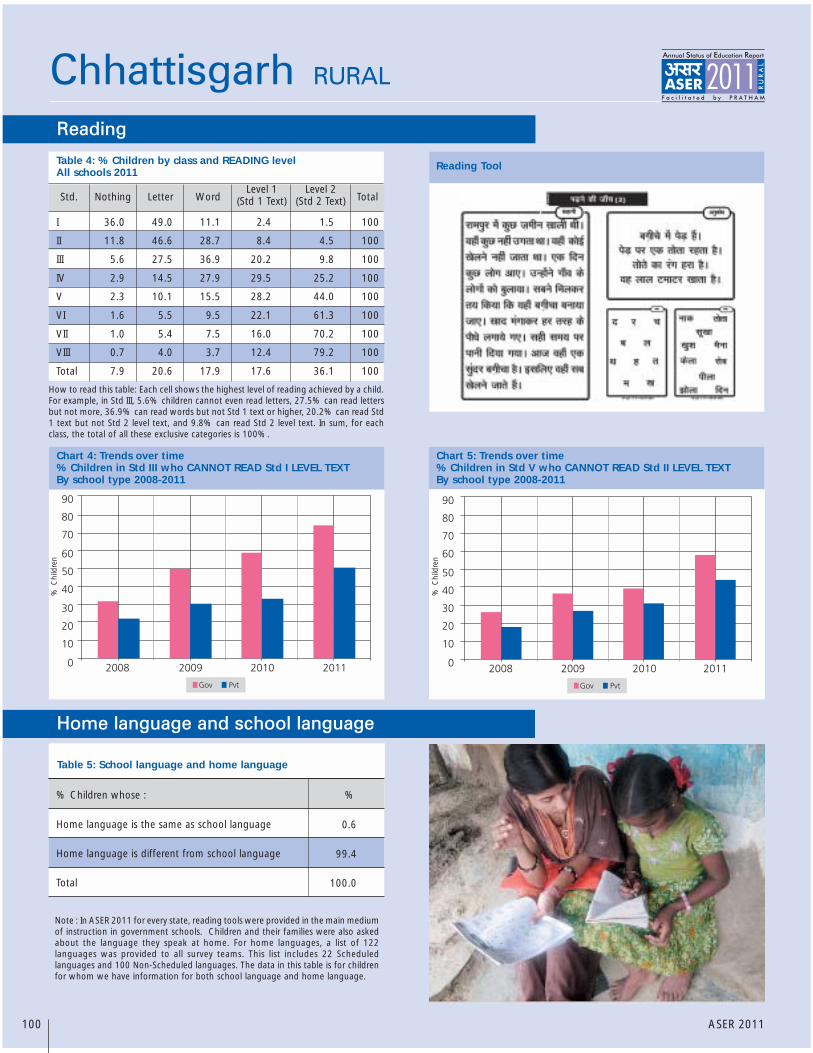
Reading Tool
Chhattisgarh RURAL
How to read this table: Each cell shows the highest level of reading achieved by a child.For example, in Std III, 5.6% children cannot even read letters, 27.5% can read lettersbut not more, 36.9% can read words but not Std 1 text or higher, 20.2% can read Std1 text but not Std 2 level text, and 9.8% can read Std 2 level text. In sum, for eachclass, the total of all these exclusive categories is 100%.
Std. NothingLevel 1
(Std 1 Text)Level 2
(Std 2 Text) Total
I
II
III
IV
V
VI
VII
VIII
Total
36.0 49.0 11.1 2.4 1.5 100
11.8 46.6 28.7 8.4 4.5 100
5.6 27.5 36.9 20.2 9.8 100
2.9 14.5 27.9 29.5 25.2 100
2.3 10.1 15.5 28.2 44.0 100
1.6 5.5 9.5 22.1 61.3 100
1.0 5.4 7.5 16.0 70.2 100
0.7 4.0 3.7 12.4 79.2 100
7.9 20.6 17.9 17.6 36.1 100
Chart 5: Trends over time% Children in Std V who CANNOT READ Std II LEVEL TEXTBy school type 2008-2011
Chart 4: Trends over time% Children in Std III who CANNOT READ Std I LEVEL TEXTBy school type 2008-2011
Letter Word
Table 4: % Children by class and READING levelAll schools 2011
Note : In ASER 2011 for every state, reading tools were provided in the main mediumof instruction in government schools. Children and their families were also askedabout the language they speak at home. For home languages, a list of 122languages was provided to all survey teams. This list includes 22 Scheduledlanguages and 100 Non-Scheduled languages. The data in this table is for childrenfor whom we have information for both school language and home language.
Table 5: School language and home language
% Children whose :
Home language is the same as school language
Home language is different from school language
Total
%
100 ASER 2011
0.6
99.4
100.0
Home language and school language
Reading
% C
hild
ren
% C
hild
ren

Math Tool
How to read this table: Each cell shows the highest level of arithmetic achieved by achild. For example, in Std III, 4.3% children cannot even recognize numbers 1-9, 37.4%children can recognize numbers up to 9 but not more, 38.9% can recognize numbers to99 but cannot do subtraction, 16.6% can do subtraction but not division, and 2.8% cando division. In sum, for each class, the total of all these exclusive categories is 100%.
Std. Nothing Subtract Divide Total
I
II
III
IV
V
VI
VII
VIII
Total
36.9 52.1 7.7 2.2 1.1 100
12.7 53.6 27.1 5.6 1.1 100
4.3 37.4 38.9 16.6 2.8 100
2.5 20.5 34.1 34.3 8.7 100
2.3 13.2 27.6 38.1 18.9 100
0.9 9.8 19.4 35.7 34.3 100
1.3 7.5 20.9 31.5 38.8 100
0.4 4.8 13.7 31.0 50.1 100
7.8 25.2 23.9 24.3 18.8 100
Recognize Numbers11-991-9
Chart 7: Trends over time% Children in Std V who CANNOT DO DIVISIONBy school type 2008-2011
Chart 6: Trends over time% Children in Std III who CANNOT RECOGNISE NUMBERS upto100. By school type 2008-2011
Chhattisgarh RURAL
Table 7: Class-wise % children attending PAID TUITION CLASSESBy school type 2007, 2009, 2010 and 2011
Note: In 2007, 2009, 2010 and 2011 the ASER survey recorded information abouttuition. In all 4 years, the question asked was the following: “Does the child take anypaid additional class currently?” Therefore, these numbers do not include anysupplemental help in learning that children may have received from parents, siblingsor from anyone else who did not require payment.
Year School I II III IV V VI VII VIII Total
2007
2009
2010
2011
Govt
Pvt
Govt
Pvt
Govt
Pvt
Govt
Pvt
Table 6: % Children by class and ARITHMETIC levelAll schools 2011
101ASER 2011
1.1 1.2 0.7 1.6 2.1 2.0 2.1 3.8 1.7
7.4 4.8 8.6 5.4 17.1 4.1 9.5 9.0 8.0
2.8 3.1 3.4 3.6 3.0 2.7 2.6 3.2 3.1
8.3 9.1 12.4 18.9 15.0 10.5 17.4 19.2 12.8
0.9 1.4 0.9 1.8 1.9 1.8 2.4 2.6 1.7
7.4 11.9 9.8 9.2 9.4 12.5 8.3 11.0 9.9
0.5 0.4 0.8 1.2 1.9 1.3 1.5 1.5 1.2
7.7 8.2 12.1 2.4 16.3 6.0 5.9 10.5 8.5
Arithmetic
Tuition
% C
hild
ren
% C
hild
ren

As part of ASER 2007, 2009, 2010 and 2011, in each sampled village, one government school with primary sections was visited on the day of the survey.
Information about schools in this report is based on these visits.
Chhattisgarh RURAL
2007 2009 2010 2011 2007 2009 2010 2011
Std I-IV/V Std I-VII/VIIIType of school
% Enrolledchildren present(average)
% Schools with lessthan 50% enrolledchildren present(average)
% Schools with75% or moreenrolled childrenpresent (average)
2007 2009 2010 2011 2007 2009 2010 2011
Std I-IV/V Std I-VII/VIIIType of school
% Teachers present(average)
% Schools withno teacherspresent(average)
% Schools withall teacherspresent(average)
Std I-IV/V Std I-VII/VIII2010 2011 2010 2011
% Schools with:
No Headteacher appointed
Headteacher appointed but not present attime of visitHeadteacher appointed & present at timeof visit
Total
Std I-IV/V Std I-VII/VIII2010 2011 2010 2011
% Schools with:
No computer
Computers but no children using them onday of visitComputers & children using them on dayof visit
Total
2007Type of school
Std I-IV/V: Primary
Std I-VII/VIII: Primary + Upper primary
Total schools visited
2009 2010 2011
Table 8: Total schools visited 2007, 2009, 2010 and 2011
Table 9: Student attendance 2007, 2009, 2010 and 2011
Table 11: Headteachers 2010 & 2011 Table 12: Computers 2010 and 2011
Table 10: Teacher attendance 2007, 2009, 2010 and 2011
102 ASER 2011
6.5 4.3 1.1 7.1
9.2 7.3 11.7 17.9
84.3 88.5 87.2 75.0
100 100 100 100
97.0 94.3 93.3 97.6
1.4 3.9 5.0 2.4
1.7 1.8 1.7 0.0
100 100 100 100
344 336 301 351
76 25 124 41
420 361 425 392
72.0 76.5 69.7 73.1 72.5 77.0 72.5 78.1
9.1 4.8 12.4 10.4 8.0 8.3 8.9 2.5
49.3 60.4 42.6 53.0 45.3 66.7 51.6 65.0
92.7 82.4 86.6 84.5 83.3 70.5 86.5 82.9
0.0 0.7 0.7 0.3 0.0 5.3 0.0 0.0
80.8 64.4 63.1 57.5 54.6 47.4 56.3 55.0
2007 2009 2010 2011
Std I-IV/V
2007 2009 2010 2011
Std I-VII/VIII% Schools with:
Std II children sitting with one or more other classes
Table 13: Multigrade classes 2007, 2009, 2010 and 2011
65.6 62.9 66.6 75.3 65.8 60.0 60.3 82.1
48.1 48.6 56.1 62.9 56.6 52.4 38.9 65.8Std IV children sitting with one or more other classes
School observations
Other school information
Student and teacher attendance

Chhattisgarh RURAL
How much goes toeach school For what purposes
SCHOOL DEVELOPMENT GRANT / SCHOOL GRANT
Rs.5000 per year perprimary school
Rs.7000 per year per upperprimary school
Rs 5000 + Rs 7000 =Rs 12000 if the school isStd I-VII/VIII.
Note: Primary and UpperPrimary schools are treatedas separate schools even ifthey are in the same pre-mises.
This grant can be used forbuying school equipmentsuch as blackboard, sittingmats etc. Also for buyingchalk, duster, registers andother office equipment.
The grant amount varies bytype of school: whether it isa primary or upper primaryschool.
SCHOOL MAINTENANCE GRANT
Rs.5000 - Rs 7500 perschool per year if the schoolhas upto 3 classrooms.
Rs 7500 - Rs.10000 per yearif the school has more than3 classrooms.
Primary and Upper Primaryschools are treated asseparate schools even ifthey are in the samebuilding.
TLM GRANT
This grant can be used byteachers to buy teachingaids, such as charts, globes,posters, models etc.
Rs.500 per teacher per yearin primary and upper pri-mary schools.
1 For more information see www.accountabilityinitiative.in
103ASER 2011
School funds and activities (PAISA)
This grant can be used formaintenance of schoolbuilding, includingwhitewashing;beautification; and repair oftoilets, hand pump,boundary wall, playgroundetc.
The grant amount dependson number of classrooms(excluding Headmasterroom and office room)
DID SCHOOLS GET THEIR MONEY ON TIME?
2008-2009 2009-2010 2010-2011SSA school
grants% Schools % Schools % SchoolsNo.
ofSch.
No.of
Sch.Yes No Don’tknow
DID SCHOOLS GET THEIR MONEY ON TIME?
April 2009 toOctober 2009
April 2010 toOctober 2010
April 2011 toOctober 2011
% Schools % Schools % SchoolsNo.of
Sch.
No.of
Sch.
No.of
Sch.Yes No Don’tknow
Type of Activity
Yes No Don'tknow
New Classroom
Repair of building (roof, floor, wall etc.)
Repair of doors & windows
Repair of boundary wall
Repair of drinking water facility
Repair of toilet
White wash/plastering
Painting Blackboard/Display Board/Painting on wall
Painting of doors & walls
Purchase of furniture (cupboard etc.)
Purchase of electrical fittings
Purchase of chalk, duster, register etc.
Purchase of sitting Mats/Tat Patti
Purchase of charts, globes & other teaching material
Expenditure on school events
Payment of bills (electricity, water, cleaning etc.)
Const.
Repairs
Painting
& White
Wash
Purchase
Other
Table 15: % Schools who report receiving SSA grants - Half financial year
Table 16: % Schools carrying out different activities since April 2010
Table 14: % Schools who report receiving SSA grants - Full financial year
22.7 70.2 7.1
58.1 37.6 4.3
45.8 50.0 4.2
24.9 69.9 5.2
38.7 56.3 5.0
22.7 73.3 4.0
85.5 10.8 3.7
78.2 18.3 3.5
76.1 20.4 3.5
45.3 49.4 5.3
25.4 70.2 4.4
91.3 5.3 3.4
69.2 27.6 3.2
80.9 15.6 3.5
72.9 22.2 4.9
24.2 67.2 8.7
% schools
Ma intenancegrantDeve lopmentgrant
TLM grant
Yes No Don’tknow
Yes No Don’tknow
SSA school
grants
Ma intenancegrantDeve lopmentgrant
TLM grant
Yes No Don’tknow
Yes No Don’tknow
315 76.5 8.6 14.9 373 85.5 6.7 7.8 379 85.5 7.1 7.4
309 74.1 13.6 12.3 360 83.3 8.1 8.6 379 81.8 10.6 7.7
317 85.5 4.4 10.1 355 88.2 6.2 5.6 380 90.5 4.7 4.7
285 62.1 20.0 17.9 323 31.0 55.7 13.3 364 34.9 54.1 11.0
283 59.7 24.0 16.3 313 29.4 57.2 13.4 364 40.4 47.8 11.8
287 69.0 17.4 13.6 311 32.8 55.6 11.6 364 39.0 51.7 9.3
No.of
Sch.
EVERY RURAL GOVERNMENT PRIMARY SCHOOLIS ENTITLED TO EACH OF THESE SSA GRANTSEVERY YEAR.
The PAISA section of ASER tracks receipt and spending
of Sarva Shiksha Abhiyan (SSA) grants at the school
level. This information is collected from schools visited
during the survey. This page reports proportion of
schools receiving the grants and carrying out specified
activities in the schools. More detailed analysis of the
PAISA data will be available in the PAISA 2011 report
which will be released in March 2012.1

Chhattisgarh RURAL
Note : For schools with enrollment above 200children the PTR shall not exceed 40 excludingthe Head Teacher
Extracts from the Schedule of The Right of Children toFree and Compulsory Education Act 2009 Norms andstandards for a School (Sections 19 and 25)
Number of teachers in Std 1-5:� Admitted children No. of teachers
<= 60 261-90 391-120 4121-200 5> 150 5 + 1 Headteacher> 200 Pupil-Teacher Ratio
(excluding Headteacher)shall not exceed 40
School facilities:All weather building with:
� At least one classroom for every teacher� Office cum store cum headteacher’s room� Separate toilets for boys and girls� Safe and adequate drinking water facility to
all children� A kitchen where mid-day meal is cooked in
the school� Playground� Arrangements for securing the school
building by boundary wall or fencing.
Teaching learning equipmentshall be provided to each class as required.
LibraryThere shall be a library in each school providingnewspaper, magazines and books on all subjects,including story-books.
As part of ASER 2010 and 2011, in each sampled village, onegovernment school with primary sections was visited on theday of the survey. During this school visit, RTE indicators wereobserved and are reported here.
Note: School observations for ASER 2011 looked at TLM for Std II and Std IV only.
2010 2011School
enrollment No. ofschools
No. ofschools
% ofschools
% ofschools
RTETeacherNorms
1-60
61-90
91-120
121-150
151-200
> 200
TOTAL
2011Schoolenrollment
2010
2
3
4
5
5 + HMsee note
2010
1
2
3
4
5
6
>=7
TOTAL
2011
Numberof
teachersNo.of
schools
No.of
schools
%of
schools
%of
schools
RTE norm:At least one
classroom perteacher
1
2
3
4
5
6
>=7
TOTAL
20112010
% Schools that do notmeet classroom to teacher
normsNumber ofteachers
% of schools with 2011
Building
DrinkingWater
Toilet
Girls Toilet
TLM
Library
MDM
Table 17: Schools by totalenrollment 2010 and 2011
Table 18: RTE norms: Pupil-teacherratio 2010 and 2011
Table 19: Schools by number ofteachers 2010 and 2011
Table 20: RTE norms: Teacher -classroom ratio 2010 and 2011
Table 21: % Schools meeting selected RTE norms on facilities 2010 & 2011
2010
1-60
61-90
91-120
121-150
151-200
> 200
TOTAL
104 ASER 2011
68 16.1 100 26.6
71 16.8 76 20.2
61 14.5 73 19.4
63 14.9 42 11.2
67 15.9 39 10.4
92 21.8 46 12.2
422 100.0 376 100.0
34 8.8 24 6.8
108 27.9 100 28.5
91 23.5 107 30.5
48 12.4 44 12.5
27 7.0 40 11.4
27 7.0 13 3.7
52 13.4 23 6.6
387 100.0 351 100.0
4.0 0.0
4.9 16.2
33.3 35.3
52.9 65.5
55.0 64.3
85.7 88.9
79.4 94.1
35.8 40.4
Right to Education indicators
23.8 18.3
56.1 35.2
70.6 69.1
82.5 70.7
61.3 64.7
69.0 70.5
60.4 48.7
78.6 76.344.7 46.048.5 49.112.9 13.09.6 13.8
77.6 73.328.9 34.741.5 38.529.6 26.846.2 51.8
16.3 11.517.5 16.020.0 20.788.5 86.183.2 78.927.1 21.336.5 40.336.5 38.486.2 87.094.7 93.8
% Schools that donot meet PTR norms
Office/Store/Office cum storePlaygroundBoundary WallNo facility for drinking waterFacility but no drinking water availableDrinking water availableNo toilet facilityFacility but toilet not useableToilet useable% Schools with no separate provisions for girls toiletsOf schools with separate girls toilets, % schools whereToilet lockedToilet not useableToilet useableTeaching learning material in Std 2Teaching learning material in Std 4No libraryLibrary but no books being used by children on day of visitLibrary being used by children on day of visitKitchen shed for cooking midday mealMidday meal served in school on the day of visit

Gujarat RURAL
Note: 'OTHER' includes children going to madarssa and EGS.‘NOT IN SCHOOL’ = dropped out + never enrolled.
How to read this table: If a child started school in Std I at age 6, she should be age 8 inStd 3. This table shows the age distribution for each class. For example, in Std III,73.8% children are 8 years old but there are also 7.7% who are 7, 12.3% who are 9years old, etc.
Chart 1: Trends over time% Children out of school by age group and gender 2006-2011
How to read this chart: For example, the proportion of girls (age 11-14) not in schoolhas changed from 11.7% in 2006 to 7.6% in 2007 to 10.9% in 2008 to 10.2% in2009 to 8% in 2010 to 6.1% in 2011
ALL ANALYSIS BASED ON DATA FROM HOUSEHOLDS. 25 OUT OF 26 DISTRICTS
TotalAge group Govt. Pvt. Other Not inSchool
86.1 10.8 0.4 2.7 100
82.1 12.4 0.4 5.1 100
89.3 9.1 0.3 1.3 100
88.6 9.8 0.4 1.1 100
90.2 8.2 0.3 1.4 100
82.5 12.7 0.4 4.4 100
82.8 13.7 0.5 2.9 100
82.1 11.5 0.3 6.1 100
58.4 21.5 0.7 19.4 100
60.4 23.3 0.9 15.4 100
55.8 19.2 0.4 24.5 100
Age: 6-14 ALL
Age: 7-16 ALL
Age: 7-10 ALL
Age: 7-10 BOYS
Age: 7-10 GIRLS
Age: 11-14 ALL
Age: 11-14 BOYS
Age: 11-14 GIRLS
Age: 15-16 ALL
Age: 15-16 BOYS
Age: 15-16 GIRLS
I
II
III
IV
V
VI
VII
VIII
Table 2: Sample description% Children in each class by age 2011
5 6 7 8 9 10 11 12 13 14 15 16 Total
26.0 62.0 7.8 4.2
1.1 9.2 75.7 10.5 3.6
2.0 7.7 73.8 12.3 4.2
3.1 8.3 69.9 14.3 4.4
2.4 5.6 71.4 14.6 6.0
1.6 6.3 66.0 21.0 5.1
3.1 7.6 63.5 18.8 7.0
1.6 7.5 67.2 17.4 6.3
100
100
100
100
100
100
100
100
Std.
Table 1: % Children in different types of schools 2011
105ASER 2011
School enrollment and out of school children
Young children in pre-school and school
% C
hild
ren
% C
hild
ren
% C
hild
ren
Chart 2: Trends over time% Children enrolled in private school by class 2007, 2009 & 2011
Chart 3: Trends over timeFive year olds in pre-school & school 2007, 2009 & 2011
Tota
l
In SchoolIn balwadi
oranganwadi
In LKG/UKG
Age 5
Age 6
Govt Pvt Other
34.2 5.5 49.7 7.5 0.5 2.7 100
2.4 0.9 85.5 9.8 0.5 1.0 100
Table 3: % Children age 5-6 who are enrolled in differenttypes of pre-school & school 2011
Not
enr
olle
dan
ywh
ere

Reading Tool
Gujarat RURAL
How to read this table: Each cell shows the highest level of reading achieved by a child.For example, in Std III, 4.2% children cannot even read letters, 16.3% can read lettersbut not more, 34.5% can read words but not Std 1 text or higher, 25% can read Std1 text but not Std 2 level text, and 20.1% can read Std 2 level text. In sum, for eachclass, the total of all these exclusive categories is 100%.
Std. NothingLevel 1
(Std 1 Text)Level 2
(Std 2 Text) Total
I
II
III
IV
V
VI
VII
VIII
Total
29.5 47.2 16.9 2.9 3.6 100
11.4 33.7 33.8 12.3 8.8 100
4.2 16.3 34.5 25.0 20.1 100
2.2 10.3 22.8 28.2 36.5 100
1.2 6.0 14.4 29.2 49.2 100
1.1 2.7 6.6 25.5 64.2 100
0.5 2.3 5.8 20.1 71.4 100
0.9 2.3 4.2 12.9 79.8 100
5.8 14.1 17.1 20.2 42.8 100
Chart 5: Trends over time% Children in Std V who CANNOT READ Std II LEVEL TEXTBy school type 2008-2011
Chart 4: Trends over time% Children in Std III who CANNOT READ Std I LEVEL TEXTBy school type 2008-2011
Letter Word
Table 4: % Children by class and READING levelAll schools 2011
Note : In ASER 2011 for every state, reading tools were provided in the main mediumof instruction in government schools. Children and their families were also askedabout the language they speak at home. For home languages, a list of 122 languageswas provided to all survey teams. This list includes 22 Scheduled languages and 100Non-Scheduled languages. The data in this table is for children for whom we haveinformation for both school language and home language.
Table 5: School language and home language
% Children whose :
Home language is the same as school language
Home language is different from school language
Total
%
106 ASER 2011
99.3
0.8
100.0
Home language and school language
Reading
% C
hild
ren
% C
hild
ren

Math Tool
How to read this table: Each cell shows the highest level of arithmetic achieved by achild. For example, in Std III, 5.3% children cannot even recognize numbers 1-9, 26.6%children can recognize numbers up to 9 but not more, 43.4% can recognize numbers to99 but cannot do subtraction, 19.4% can do subtraction but not division, and 5.3% cando division. In sum, for each class, the total of all these exclusive categories is 100%.
Std. Nothing Subtract Divide Total
I
II
III
IV
V
VI
VII
VIII
Total
30.0 53.6 12.8 2.3 1.3 100
12.4 45.8 33.0 6.4 2.4 100
5.3 26.6 43.4 19.4 5.3 100
2.9 15.7 36.8 30.6 14.1 100
1.8 9.9 29.5 36.0 22.7 100
1.4 6.0 20.6 40.9 31.3 100
1.1 4.7 15.7 36.4 42.1 100
1.1 3.8 12.9 29.3 53.0 100
6.4 19.5 25.8 26.2 22.1 100
Recognize Numbers11-991-9
Chart 7: Trends over time% Children in Std V who CANNOT DO DIVISIONBy school type 2008-2011
Chart 6: Trends over time% Children in Std III who CANNOT RECOGNISE NUMBERS upto100. By school type 2008-2011
Gujarat RURAL
Table 7: Class-wise % children attending PAID TUITION CLASSESBy school type 2007, 2009, 2010 and 2011
Note: In 2007, 2009, 2010 and 2011 the ASER survey recorded information abouttuition. In all 4 years, the question asked was the following: “Does the child take anypaid additional class currently?” Therefore, these numbers do not include anysupplemental help in learning that children may have received from parents, siblingsor from anyone else who did not require payment.
Year School I II III IV V VI VII VIII Total
2007
2009
2010
2011
Govt
Pvt
Govt
Pvt
Govt
Pvt
Govt
Pvt
Table 6: % Children by class and ARITHMETIC levelAll schools 2011
107ASER 2011
3.9 5.6 6.0 5.8 7.4 7.3 10.2 13.0 6.9
19.8 23.5 26.6 26.1 40.3 31.1 35.2 26.0 27.9
5.5 7.1 7.1 9.0 9.2 9.0 9.1 11.9 8.3
29.4 33.8 39.9 40.4 44.0 38.8 31.0 23.8 33.2
5.5 8.9 8.5 10.7 9.5 10.7 10.4 9.8 9.3
21.4 36.9 44.1 35.9 40.8 39.4 39.8 28.8 35.3
6.8 9.5 9.8 11.3 10.5 10.6 11.1 14.3 10.5
39.7 52.4 49.8 46.3 54.4 45.7 56.2 40.7 47.8
Arithmetic
Tuition
% C
hild
ren
% C
hild
ren

As part of ASER 2007, 2009, 2010 and 2011, in each sampled village, one government school with primary sections was visited on the day of the survey.
Information about schools in this report is based on these visits.
Gujarat RURAL
2007 2009 2010 2011 2007 2009 2010 2011
Std I-IV/V Std I-VII/VIIIType of school
% Enrolledchildren present(average)
% Schools with lessthan 50% enrolledchildren present(average)
% Schools with75% or moreenrolled childrenpresent (average)
2007 2009 2010 2011 2007 2009 2010 2011
Std I-IV/V Std I-VII/VIIIType of school
% Teachers present(average)
% Schools withno teacherspresent(average)
% Schools withall teacherspresent(average)
Std I-IV/V Std I-VII/VIII2010 2011 2010 2011
% Schools with:
No Headteacher appointed
Headteacher appointed but not present attime of visitHeadteacher appointed & present at timeof visit
Total
Std I-IV/V Std I-VII/VIII2010 2011 2010 2011
% Schools with:
No computer
Computers but no children using them onday of visitComputers & children using them on dayof visit
Total
2007Type of school
Std I-IV/V: Primary
Std I-VII/VIII: Primary + Upper primary
Total schools visited
2009 2010 2011
Table 8: Total schools visited 2007, 2009, 2010 and 2011
Table 9: Student attendance 2007, 2009, 2010 and 2011
Table 11: Headteachers 2010 & 2011 Table 12: Computers 2010 and 2011
Table 10: Teacher attendance 2007, 2009, 2010 and 2011
108 ASER 2011
0.0 0.0 0.0 0.2
18.2 8.0 5.6 4.3
81.8 92.0 94.4 95.5
100 100 100 100
85.9 81.3 43.4 39.1
4.7 17.2 26.6 29.9
9.4 1.6 30.1 31.0
100 100 100 100
76 73 66 67
558 591 557 583
634 664 623 650
81.0 83.9 87.4 85.0 85.5 83.1 84.4 84.9
5.6 0.0 0.0 1.5 2.4 3.9 3.2 1.4
68.1 77.8 85.0 87.9 85.9 76.8 81.3 86.4
94.7 95.4 94.7 95.6 93.0 94.8 95.9 94.4
0.0 0.0 0.0 0.0 0.0 0.0 0.0 0.0
85.7 84.1 78.7 88.1 69.9 76.5 77.2 71.3
2007 2009 2010 2011
Std I-IV/V
2007 2009 2010 2011
Std I-VII/VIII% Schools with:
Std II children sitting with one or more other classes
Table 13: Multigrade classes 2007, 2009, 2010 and 2011
59.2 76.8 56.1 64.2 28.4 38.2 33.6 32.8
58.6 69.0 51.7 62.7 27.6 36.6 30.7 28.6Std IV children sitting with one or more other classes
School observations
Other school information
Student and teacher attendance

Gujarat RURAL
How much goes toeach school For what purposes
SCHOOL DEVELOPMENT GRANT / SCHOOL GRANT
Rs.5000 per year perprimary school
Rs.7000 per year per upperprimary school
Rs 5000 + Rs 7000 =Rs 12000 if the school isStd I-VII/VIII.
Note: Primary and UpperPrimary schools are treatedas separate schools even ifthey are in the same pre-mises.
This grant can be used forbuying school equipmentsuch as blackboard, sittingmats etc. Also for buyingchalk, duster, registers andother office equipment.
The grant amount varies bytype of school: whether it isa primary or upper primaryschool.
SCHOOL MAINTENANCE GRANT
Rs.5000 - Rs 7500 perschool per year if the schoolhas upto 3 classrooms.
Rs 7500 - Rs.10000 per yearif the school has more than3 classrooms.
Primary and Upper Primaryschools are treated asseparate schools even ifthey are in the samebuilding.
TLM GRANT
This grant can be used byteachers to buy teachingaids, such as charts, globes,posters, models etc.
Rs.500 per teacher per yearin primary and upper pri-mary schools.
1 For more information see www.accountabilityinitiative.in
109ASER 2011
School funds and activities (PAISA)
This grant can be used formaintenance of schoolbuilding, includingwhitewashing;beautification; and repair oftoilets, hand pump,boundary wall, playgroundetc.
The grant amount dependson number of classrooms(excluding Headmasterroom and office room)
DID SCHOOLS GET THEIR MONEY ON TIME?
2008-2009 2009-2010 2010-2011SSA school
grants% Schools % Schools % SchoolsNo.
ofSch.
No.of
Sch.Yes No Don’tknow
DID SCHOOLS GET THEIR MONEY ON TIME?
April 2009 toOctober 2009
April 2010 toOctober 2010
April 2011 toOctober 2011
% Schools % Schools % SchoolsNo.of
Sch.
No.of
Sch.
No.of
Sch.Yes No Don’tknow
Type of Activity
Yes No Don'tknow
New Classroom
Repair of building (roof, floor, wall etc.)
Repair of doors & windows
Repair of boundary wall
Repair of drinking water facility
Repair of toilet
White wash/plastering
Painting Blackboard/Display Board/Painting on wall
Painting of doors & walls
Purchase of furniture (cupboard etc.)
Purchase of electrical fittings
Purchase of chalk, duster, register etc.
Purchase of sitting Mats/Tat Patti
Purchase of charts, globes & other teaching material
Expenditure on school events
Payment of bills (electricity, water, cleaning etc.)
Const.
Repairs
Painting
& White
Wash
Purchase
Other
Table 15: % Schools who report receiving SSA grants - Half financial year
Table 16: % Schools carrying out different activities since April 2010
Table 14: % Schools who report receiving SSA grants - Full financial year
40.7 57.6 1.7
54.9 43.6 1.5
48.8 49.3 1.9
34.5 63.6 1.9
57.0 41.4 1.7
48.9 49.1 2.0
59.5 39.5 1.0
66.7 32.5 0.8
51.8 47.0 1.2
46.3 50.9 2.8
63.9 34.3 1.8
89.3 9.9 0.8
36.6 61.6 1.8
75.4 23.4 1.2
73.8 24.5 1.7
54.6 42.1 3.3
% schools
Ma intenancegrantDeve lopmentgrant
TLM grant
Yes No Don’tknow
Yes No Don’tknow
SSA school
grants
Ma intenancegrantDeve lopmentgrant
TLM grant
Yes No Don’tknow
Yes No Don’tknow
541 82.4 14.6 3.0 440 87.5 5.7 6.8 609 79.3 17.1 3.6
545 88.3 8.6 3.1 443 87.6 5.0 7.5 604 82.6 14.6 2.8
567 96.3 1.9 1.8 453 94.5 1.6 4.0 613 91.2 8.0 0.8
498 74.7 20.1 5.2 415 81.9 9.2 8.9 544 65.3 30.2 4.6
495 83.4 11.9 4.7 421 85.5 7.4 7.1 540 67.0 29.1 3.9
518 88.6 8.3 3.1 423 89.1 5.0 5.9 542 70.1 26.8 3.1
No.of
Sch.
EVERY RURAL GOVERNMENT PRIMARY SCHOOLIS ENTITLED TO EACH OF THESE SSA GRANTSEVERY YEAR.
The PAISA section of ASER tracks receipt and spending
of Sarva Shiksha Abhiyan (SSA) grants at the school
level. This information is collected from schools visited
during the survey. This page reports proportion of
schools receiving the grants and carrying out specified
activities in the schools. More detailed analysis of the
PAISA data will be available in the PAISA 2011 report
which will be released in March 2012.1

Gujarat RURAL
Note : For schools with enrollment above 200children the PTR shall not exceed 40 excludingthe Head Teacher
Extracts from the Schedule of The Right of Children toFree and Compulsory Education Act 2009 Norms andstandards for a School (Sections 19 and 25)
Number of teachers in Std 1-5:� Admitted children No. of teachers
<= 60 261-90 391-120 4121-200 5> 150 5 + 1 Headteacher> 200 Pupil-Teacher Ratio
(excluding Headteacher)shall not exceed 40
School facilities:All weather building with:
� At least one classroom for every teacher� Office cum store cum headteacher’s room� Separate toilets for boys and girls� Safe and adequate drinking water facility to
all children� A kitchen where mid-day meal is cooked in
the school� Playground� Arrangements for securing the school
building by boundary wall or fencing.
Teaching learning equipmentshall be provided to each class as required.
LibraryThere shall be a library in each school providingnewspaper, magazines and books on all subjects,including story-books.
As part of ASER 2010 and 2011, in each sampled village, onegovernment school with primary sections was visited on theday of the survey. During this school visit, RTE indicators wereobserved and are reported here.
Note: School observations for ASER 2011 looked at TLM for Std II and Std IV only.
2010 2011School
enrollment No. ofschools
No. ofschools
% ofschools
% ofschools
RTETeacherNorms
1-60
61-90
91-120
121-150
151-200
> 200
TOTAL
2011Schoolenrollment
2010
2
3
4
5
5 + HMsee note
2010
1
2
3
4
5
6
>=7
TOTAL
2011
Numberof
teachersNo.of
schools
No.of
schools
%of
schools
%of
schools
RTE norm:At least one
classroom perteacher
1
2
3
4
5
6
>=7
TOTAL
20112010
% Schools that do notmeet classroom to teacher
normsNumber ofteachers
% of schools with 2011
Building
DrinkingWater
Toilet
Girls Toilet
TLM
Library
MDM
Table 17: Schools by totalenrollment 2010 and 2011
Table 18: RTE norms: Pupil-teacherratio 2010 and 2011
Table 19: Schools by number ofteachers 2010 and 2011
Table 20: RTE norms: Teacher -classroom ratio 2010 and 2011
Table 21: % Schools meeting selected RTE norms on facilities 2010 & 2011
2010
1-60
61-90
91-120
121-150
151-200
> 200
TOTAL
110 ASER 2011
27 4.6 37 5.9
25 4.2 37 5.9
34 5.8 33 5.2
46 7.8 47 7.5
74 12.5 85 13.5
384 65.1 391 62.1
590 100.0 630 100.0
20 3.6 22 4.1
31 5.6 33 6.2
25 4.5 27 5.1
32 5.8 29 5.4
39 7.1 35 6.5
46 8.3 54 10.1
360 65.1 335 62.6
553 100.0 535 100.0
0.0 0.0
0.0 10.0
5.6 18.2
14.3 22.2
30.3 25.0
26.1 21.4
16.0 10.4
15.9 12.4
Right to Education indicators
69.6 37.5
70.8 60.0
35.5 40.7
53.7 43.9
31.3 17.2
32.3 39.1
37.3 38.0
80.2 82.875.4 83.284.5 91.114.2 10.36.5 5.9
79.4 83.92.6 2.1
32.6 28.464.8 69.512.7 5.2
20.7 8.016.7 19.149.9 67.795.6 97.094.8 96.216.2 17.035.2 38.848.5 44.288.4 92.096.4 97.8
% Schools that donot meet PTR norms
Office/Store/Office cum storePlaygroundBoundary WallNo facility for drinking waterFacility but no drinking water availableDrinking water availableNo toilet facilityFacility but toilet not useableToilet useable% Schools with no separate provisions for girls toiletsOf schools with separate girls toilets, % schools whereToilet lockedToilet not useableToilet useableTeaching learning material in Std 2Teaching learning material in Std 4No libraryLibrary but no books being used by children on day of visitLibrary being used by children on day of visitKitchen shed for cooking midday mealMidday meal served in school on the day of visit

Haryana
Himachal Pradesh
Jammu and Kashmir
Jharkhand
Karnataka
Kerala


Haryana RURAL
Note: 'OTHER' includes children going to madarssa and EGS.‘NOT IN SCHOOL’ = dropped out + never enrolled.
How to read this table: If a child started school in Std I at age 6, she should be age 8 inStd 3. This table shows the age distribution for each class. For example, in Std III, 38.5% children are 8 years old but there are also 17.9% who are 7, 22.2% who are 9,11.1% who are 10 years old, etc.
Chart 1: Trends over time% Children out of school by age group and gender 2006-2011
How to read this chart: For example, the proportion of girls (age 11-14) not in schoolhas changed from 8.4% in 2006 to 7% in 2007 to 5.1% in 2008 to 4.3% in 2009 to1.8% in 2010 to 2.1% in 2011
ALL ANALYSIS BASED ON DATA FROM HOUSEHOLDS. 16 OUT OF 20 DISTRICTS
TotalAge group Govt. Pvt. Other Not inSchool
54.9 43.4 0.3 1.4 100
56.5 41.0 0.3 2.1 100
52.9 46.0 0.3 0.8 100
49.8 49.3 0.2 0.7 100
57.1 41.7 0.3 1.0 100
58.7 39.2 0.3 1.8 100
55.2 43.2 0.1 1.5 100
63.0 34.4 0.4 2.1 100
60.3 32.7 0.5 6.5 100
58.2 35.9 0.4 5.6 100
62.9 28.7 0.8 7.7 100
Age: 6-14 ALL
Age: 7-16 ALL
Age: 7-10 ALL
Age: 7-10 BOYS
Age: 7-10 GIRLS
Age: 11-14 ALL
Age: 11-14 BOYS
Age: 11-14 GIRLS
Age: 15-16 ALL
Age: 15-16 BOYS
Age: 15-16 GIRLS
I
II
III
IV
V
VI
VII
VIII
Table 2: Sample description% Children in each class by age 2011
5 6 7 8 9 10 11 12 13 14 15 16 Total
29.0 40.4 18.8 7.2 4.6
6.0 19.1 33.6 27.6 7.7 6.1
5.1 17.9 38.5 22.2 11.1 5.2
6.0 20.4 31.2 28.3 7.3 6.9
7.2 14.2 39.6 21.7 11.8 5.4
4.9 17.9 33.9 27.5 9.8 6.0
5.2 16.2 39.1 22.4 10.5 6.6
7.2 20.2 33.8 24.1 11.0 3.6
100
100
100
100
100
100
100
100
Std.
Table 1: % Children in different types of schools 2011
113ASER 2011
School enrollment and out of school children
Young children in pre-school and school
% C
hild
ren
% C
hild
ren
% C
hild
ren
Chart 2: Trends over time% Children enrolled in private school by class 2007, 2009 & 2011
Chart 3: Trends over timeFive year olds in pre-school & school 2007, 2009 & 2011
Tota
l
In SchoolIn balwadi
oranganwadi
In LKG/UKG
Age 5
Age 6
Govt Pvt Other
8.9 26.0 28.1 32.7 0.5 3.8 100
1.7 11.9 40.3 43.8 0.5 1.8 100
Table 3: % Children age 5-6 who are enrolled in differenttypes of pre-school & school 2011
Not
enr
olle
dan
ywh
ere

Reading Tool
Haryana RURAL
How to read this table: Each cell shows the highest level of reading achieved by a child.For example, in Std III, 5.1% children cannot even read letters, 16.5% can read lettersbut not more, 24.8% can read words but not Std 1 text or higher, 22.5% can read Std1 text but not Std 2 level text, and 31% can read Std 2 level text. In sum, for each class,the total of all these exclusive categories is 100%.
Std. NothingLevel 1
(Std 1 Text)Level 2
(Std 2 Text) Total
I
II
III
IV
V
VI
VII
VIII
Total
27.4 39.1 21.0 6.1 6.4 100
10.3 27.4 30.5 14.9 16.9 100
5.1 16.5 24.8 22.5 31.0 100
4.0 9.1 13.6 23.5 49.9 100
2.0 5.5 10.9 15.6 66.0 100
0.9 2.7 6.0 12.7 77.7 100
1.1 1.4 3.3 9.1 85.1 100
0.4 0.7 2.8 8.4 87.7 100
6.5 13.0 14.4 14.2 52.0 100
Chart 5: Trends over time% Children in Std V who CANNOT READ Std II LEVEL TEXTBy school type 2008-2011
Chart 4: Trends over time% Children in Std III who CANNOT READ Std I LEVEL TEXTBy school type 2008-2011
Letter Word
Table 4: % Children by class and READING levelAll schools 2011
Note : In ASER 2011 for every state, reading tools were provided in the main mediumof instruction in government schools. Children and their families were also askedabout the language they speak at home. For home languages, a list of 122languages was provided to all survey teams. This list includes 22 Scheduledlanguages and 100 Non-Scheduled languages. The data in this table is for childrenfor whom we have information for both school language and home language.
Table 5: School language and home language
% Children whose :
Home language is the same as school language
Home language is different from school language
Total
%
114 ASER 2011
78.5
21.5
100.0
Home language and school language
Reading
% C
hild
ren
% C
hild
ren

Math Tool
How to read this table: Each cell shows the highest level of arithmetic achieved by achild. For example, in Std III, 3.8% children cannot even recognize numbers 1-9, 18.6%children can recognize numbers up to 9 but not more, 27.2% can recognize numbers to99 but cannot do subtraction, 32.8% can do subtraction but not division, and 17.7% cando division. In sum, for each class, the total of all these exclusive categories is 100%.
Std. Nothing Subtract Divide Total
I
II
III
IV
V
VI
VII
VIII
Total
24.8 38.8 28.0 6.4 2.2 100
7.9 29.0 34.6 22.1 6.5 100
3.8 18.6 27.2 32.8 17.7 100
2.5 12.5 19.7 33.0 32.3 100
1.8 8.2 13.5 26.3 50.2 100
1.1 3.7 11.4 22.6 61.3 100
1.0 2.3 7.9 20.6 68.3 100
0.4 1.0 8.4 17.0 73.2 100
5.5 14.4 19.0 22.7 38.5 100
Recognize Numbers11-991-9
Chart 7: Trends over time% Children in Std V who CANNOT DO DIVISIONBy school type 2008-2011
Chart 6: Trends over time% Children in Std III who CANNOT RECOGNISE NUMBERSupto 100. By school type 2008-2011
Haryana RURAL
Table 7: Class-wise % children attending PAID TUITION CLASSESBy school type 2007, 2009, 2010 and 2011
Note: In 2007, 2009, 2010 and 2011 the ASER survey recorded information abouttuition. In all 4 years, the question asked was the following: “Does the child take anypaid additional class currently?” Therefore, these numbers do not include anysupplemental help in learning that children may have received from parents, siblingsor from anyone else who did not require payment.
Year School I II III IV V VI VII VIII Total
2007
2009
2010
2011
Govt
Pvt
Govt
Pvt
Govt
Pvt
Govt
Pvt
Table 6: % Children by class and ARITHMETIC levelAll schools 2011
115ASER 2011
5.1 5.2 7.2 7.3 9.6 7.6 6.3 10.6 7.3
11.0 11.2 14.5 14.0 17.1 16.8 16.3 19.7 14.7
9.6 11.1 13.7 12.5 15.1 12.4 15.3 19.1 13.6
17.8 20.6 23.6 27.1 30.3 29.7 24.5 32.4 25.3
8.0 9.9 8.8 10.3 12.8 12.2 11.9 13.0 11.0
17.9 17.6 23.3 22.1 25.0 21.7 21.9 25.1 21.6
4.9 7.7 6.5 10.1 9.7 8.3 7.9 7.9 8.0
16.2 18.1 23.4 23.3 21.5 20.7 19.3 19.1 20.1
Arithmetic
Tuition
% C
hild
ren
% C
hild
ren

As part of ASER 2007, 2009, 2010 and 2011, in each sampled village, one government school with primary sections was visited on the day of the survey.
Information about schools in this report is based on these visits.
Haryana RURAL
2007 2009 2010 2011 2007 2009 2010 2011
Std I-IV/V Std I-VII/VIIIType of school
% Enrolledchildren present(average)
% Schools with lessthan 50% enrolledchildren present(average)
% Schools with75% or moreenrolled childrenpresent (average)
2007 2009 2010 2011 2007 2009 2010 2011
Std I-IV/V Std I-VII/VIIIType of school
% Teachers present(average)
% Schools withno teacherspresent(average)
% Schools withall teacherspresent(average)
Std I-IV/V Std I-VII/VIII2010 2011 2010 2011
% Schools with:
No Headteacher appointed
Headteacher appointed but not present attime of visitHeadteacher appointed & present at timeof visit
Total
Std I-IV/V Std I-VII/VIII2010 2011 2010 2011
% Schools with:
No computer
Computers but no children using them onday of visitComputers & children using them on dayof visit
Total
2007Type of school
Std I-IV/V: Primary
Std I-VII/VIII: Primary + Upper primary
Total schools visited
2009 2010 2011
Table 8: Total schools visited 2007, 2009, 2010 and 2011
Table 9: Student attendance 2007, 2009, 2010 and 2011
Table 11: Headteachers 2010 & 2011 Table 12: Computers 2010 and 2011
Table 10: Teacher attendance 2007, 2009, 2010 and 2011
116 ASER 2011
4.8 0.7 4.4 4.2
5.7 10.1 12.0 15.8
89.6 89.2 83.5 80.0
100 100 100 100
89.9 92.3 73.1 66.4
6.9 7.2 15.1 25.9
3.1 0.4 11.9 7.7
100 100 100 100
335 361 302 244
95 167 226 145
430 528 528 389
82.1 83.6 82.9 76.4 84.4 85.0 81.7 78.8
2.3 1.4 0.3 7.1 1.2 0.6 1.4 0.7
80.7 81.4 79.7 65.8 84.9 87.3 77.6 67.6
91.8 86.4 89.8 84.9 90.6 84.7 87.8 85.9
0.0 1.5 0.0 0.4 0.0 0.6 0.0 0.0
72.6 56.8 63.5 50.7 62.7 32.3 44.9 45.0
2007 2009 2010 2011
Std I-IV/V
2007 2009 2010 2011
Std I-VII/VIII% Schools with:
Std II children sitting with one or more other classes
Table 13: Multigrade classes 2007, 2009, 2010 and 2011
37.8 36.6 33.0 46.1 25.8 29.4 31.3 35.7
30.0 25.7 30.1 35.7 22.2 25.2 28.9 26.9Std IV children sitting with one or more other classes
School observations
Other school information
Student and teacher attendance

Haryana RURAL
How much goes toeach school For what purposes
SCHOOL DEVELOPMENT GRANT / SCHOOL GRANT
Rs.5000 per year perprimary school
Rs.7000 per year per upperprimary school
Rs 5000 + Rs 7000 =Rs 12000 if the school isStd I-VII/VIII.
Note: Primary and UpperPrimary schools are treatedas separate schools even ifthey are in the same pre-mises.
This grant can be used forbuying school equipmentsuch as blackboard, sittingmats etc. Also for buyingchalk, duster, registers andother office equipment.
The grant amount varies bytype of school: whether it isa primary or upper primaryschool.
SCHOOL MAINTENANCE GRANT
Rs.5000 - Rs 7500 perschool per year if the schoolhas upto 3 classrooms.
Rs 7500 - Rs.10000 per yearif the school has more than3 classrooms.
Primary and Upper Primaryschools are treated asseparate schools even ifthey are in the samebuilding.
TLM GRANT
This grant can be used byteachers to buy teachingaids, such as charts, globes,posters, models etc.
Rs.500 per teacher per yearin primary and upper pri-mary schools.
1 For more information see www.accountabilityinitiative.in
117ASER 2011
School funds and activities (PAISA)
This grant can be used formaintenance of schoolbuilding, includingwhitewashing;beautification; and repair oftoilets, hand pump,boundary wall, playgroundetc.
The grant amount dependson number of classrooms(excluding Headmasterroom and office room)
DID SCHOOLS GET THEIR MONEY ON TIME?
2008-2009 2009-2010 2010-2011SSA school
grants% Schools % Schools % SchoolsNo.
ofSch.
No.of
Sch.Yes No Don’tknow
DID SCHOOLS GET THEIR MONEY ON TIME?
April 2009 toOctober 2009
April 2010 toOctober 2010
April 2011 toOctober 2011
% Schools % Schools % SchoolsNo.of
Sch.
No.of
Sch.
No.of
Sch.Yes No Don’tknow
Type of Activity
Yes No Don'tknow
New Classroom
Repair of building (roof, floor, wall etc.)
Repair of doors & windows
Repair of boundary wall
Repair of drinking water facility
Repair of toilet
White wash/plastering
Painting Blackboard/Display Board/Painting on wall
Painting of doors & walls
Purchase of furniture (cupboard etc.)
Purchase of electrical fittings
Purchase of chalk, duster, register etc.
Purchase of sitting Mats/Tat Patti
Purchase of charts, globes & other teaching material
Expenditure on school events
Payment of bills (electricity, water, cleaning etc.)
Const.
Repairs
Painting
& White
Wash
Purchase
Other
Table 15: % Schools who report receiving SSA grants - Half financial year
Table 16: % Schools carrying out different activities since April 2010
Table 14: % Schools who report receiving SSA grants - Full financial year
449 82.2 12.0 5.8 456 92.8 4.8 2.4 377 91.3 6.4 2.4
421 74.4 18.8 6.9 415 87.0 8.9 4.1 365 83.6 12.6 3.8
443 88.0 8.8 3.2 409 92.7 5.4 2.0 375 92.0 6.7 1.3
403 79.2 15.9 5.0 418 65.6 29.4 5.0 347 62.8 32.3 4.9
371 67.9 26.2 5.9 381 62.5 32.0 5.5 334 48.8 43.7 7.5
387 80.9 16.0 3.1 392 65.6 30.1 4.3 342 61.7 34.8 3.5
31.9 66.9 1.3
61.3 38.2 0.6
49.4 50.3 0.3
36.3 63.7 0.0
58.4 41.6 0.0
47.0 52.7 0.3
59.1 40.3 0.6
61.9 37.5 0.6
48.4 51.3 0.3
42.7 56.4 0.9
47.5 52.0 0.6
85.6 13.8 0.6
46.8 53.0 0.3
66.4 32.5 1.2
77.3 21.3 1.4
83.5 15.7 0.9
% schools
Ma intenancegrantDeve lopmentgrant
TLM grant
Yes No Don’tknow
Yes No Don’tknow
SSA school
grants
Ma intenancegrantDeve lopmentgrant
TLM grant
Yes No Don’tknow
Yes No Don’tknow
No.of
Sch.
EVERY RURAL GOVERNMENT PRIMARY SCHOOLIS ENTITLED TO EACH OF THESE SSA GRANTSEVERY YEAR.
The PAISA section of ASER tracks receipt and spending
of Sarva Shiksha Abhiyan (SSA) grants at the school
level. This information is collected from schools visited
during the survey. This page reports proportion of
schools receiving the grants and carrying out specified
activities in the schools. More detailed analysis of the
PAISA data will be available in the PAISA 2011 report
which will be released in March 2012.1

Haryana RURAL
Note : For schools with enrollment above 200children the PTR shall not exceed 40 excludingthe Head Teacher
Extracts from the Schedule of The Right of Children toFree and Compulsory Education Act 2009 Norms andstandards for a School (Sections 19 and 25)
Number of teachers in Std 1-5:� Admitted children No. of teachers
<= 60 261-90 391-120 4121-200 5> 150 5 + 1 Headteacher> 200 Pupil-Teacher Ratio
(excluding Headteacher)shall not exceed 40
School facilities:All weather building with:
� At least one classroom for every teacher� Office cum store cum headteacher’s room� Separate toilets for boys and girls� Safe and adequate drinking water facility to
all children� A kitchen where mid-day meal is cooked in
the school� Playground� Arrangements for securing the school
building by boundary wall or fencing.
Teaching learning equipmentshall be provided to each class as required.
LibraryThere shall be a library in each school providingnewspaper, magazines and books on all subjects,including story-books.
As part of ASER 2010 and 2011, in each sampled village, onegovernment school with primary sections was visited on theday of the survey. During this school visit, RTE indicators wereobserved and are reported here.
Note: School observations for ASER 2011 looked at TLM for Std II and Std IV only.
2010 2011School
enrollment No. ofschools
No. ofschools
% ofschools
% ofschools
RTETeacherNorms
1-60
61-90
91-120
121-150
151-200
> 200
TOTAL
2011Schoolenrollment
2010
2
3
4
5
5 + HMsee note
2010
1
2
3
4
5
6
>=7
TOTAL
2011
Numberof
teachersNo.of
schools
No.of
schools
%of
schools
%of
schools
RTE norm:At least one
classroom perteacher
1
2
3
4
5
6
>=7
TOTAL
20112010
% Schools that do notmeet classroom to teacher
normsNumber ofteachers
% of schools with 2011
Building
DrinkingWater
Toilet
Girls Toilet
TLM
Library
MDM
Table 17: Schools by totalenrollment 2010 and 2011
Table 18: RTE norms: Pupil-teacherratio 2010 and 2011
Table 19: Schools by number ofteachers 2010 and 2011
Table 20: RTE norms: Teacher -classroom ratio 2010 and 2011
Table 21: % Schools meeting selected RTE norms on facilities 2010 & 2011
2010
1-60
61-90
91-120
121-150
151-200
> 200
TOTAL
118 ASER 2011
34 6.5 25 6.5
36 6.9 31 8.1
45 8.6 49 12.7
52 9.9 42 10.9
86 16.4 60 15.6
271 51.7 178 46.2
524 100.0 385 100.0
34 7.0 15 4.2
56 11.5 37 10.5
50 10.3 38 10.7
54 11.1 39 11.0
56 11.5 50 14.1
35 7.2 24 6.8
203 41.6 151 42.7
488 100.0 354 100.0
0.0 0.0
8.7 22.9
23.1 37.0
30.8 22.2
29.3 26.7
39.1 68.8
30.6 28.9
24.9 29.1
Right to Education indicators
51.7 44.4
69.7 48.3
52.4 63.0
56.3 60.0
63.2 41.9
60.3 65.6
59.7 58.8
85.9 80.379.9 79.182.4 84.017.7 14.67.7 7.1
74.6 78.32.0 3.2
30.1 26.867.9 70.110.0 6.1
13.4 4.323.9 21.652.8 68.072.2 73.767.6 67.135.4 21.833.0 35.531.6 42.651.0 61.093.5 94.0
% Schools that donot meet PTR norms
Office/Store/Office cum storePlaygroundBoundary WallNo facility for drinking waterFacility but no drinking water availableDrinking water availableNo toilet facilityFacility but toilet not useableToilet useable% Schools with no separate provisions for girls toiletsOf schools with separate girls toilets, % schools whereToilet lockedToilet not useableToilet useableTeaching learning material in Std 2Teaching learning material in Std 4No libraryLibrary but no books being used by children on day of visitLibrary being used by children on day of visitKitchen shed for cooking midday mealMidday meal served in school on the day of visit

Himachal Pradesh RURAL
Note: 'OTHER' includes children going to madarssa and EGS.‘NOT IN SCHOOL’ = dropped out + never enrolled.
How to read this table: If a child started school in Std I at age 6, she should be age 8 inStd 3. This table shows the age distribution for each class. For example, in Std III,59.5% children are 8 years old but there are also 21.8% who are 7, 14.2% who are 9years old, etc.
Chart 1: Trends over time% Children out of school by age group and gender 2006-2011
How to read this chart: For example, the proportion of girls (age 11-14) not in schoolhas changed from 2.7% in 2006 to 2.2% in 2007 to 1% in 2008 to 1.1% in 2009 to0.4% in 2010 to 1.0% in 2011
ALL ANALYSIS BASED ON DATA FROM HOUSEHOLDS. 12 OUT OF 12 DISTRICTS
TotalAge group Govt. Pvt. Other Not inSchool
72.8 26.6 0.1 0.6 100
76.0 23.2 0.0 0.8 100
69.2 30.5 0.0 0.3 100
64.7 34.9 0.1 0.3 100
74.7 24.9 0.0 0.4 100
79.2 20.0 0.1 0.8 100
78.2 21.1 0.1 0.7 100
81.0 18.0 0.1 1.0 100
86.7 11.5 0.0 1.9 100
85.7 13.0 0.0 1.4 100
88.7 8.8 0.0 2.5 100
Age: 6-14 ALL
Age: 7-16 ALL
Age: 7-10 ALL
Age: 7-10 BOYS
Age: 7-10 GIRLS
Age: 11-14 ALL
Age: 11-14 BOYS
Age: 11-14 GIRLS
Age: 15-16 ALL
Age: 15-16 BOYS
Age: 15-16 GIRLS
I
II
III
IV
V
VI
VII
VIII
Table 2: Sample description% Children in each class by age 2011
5 6 7 8 9 10 11 12 13 14 15 16 Total
39.0 52.7 6.2 2.2
2.5 25.3 53.7 15.7 2.8
1.7 21.8 59.5 14.2 2.8
2.2 23.5 54.6 15.7 4.1
2.0 19.7 58.4 15.6 4.3
1.8 15.3 54.1 24.4 4.4
1.3 19.7 54.3 20.1 4.6
3.1 19.1 45.7 24.9 7.1
100
100
100
100
100
100
100
100
Std.
Table 1: % Children in different types of schools 2011
119ASER 2011
School enrollment and out of school children
Young children in pre-school and school
% C
hild
ren
% C
hild
ren
% C
hild
ren
Chart 2: Trends over time% Children enrolled in private school by class 2007, 2009 & 2011
Chart 3: Trends over timeFive year olds in pre-school & school 2007, 2009 & 2011
Tota
l
In SchoolIn balwadi
oranganwadi
In LKG/UKG
Age 5
Age 6
Govt Pvt Other
14.4 15.8 32.6 36.4 0.0 0.8 100
0.7 3.8 56.8 38.1 0.1 0.4 100
Table 3: % Children age 5-6 who are enrolled in differenttypes of pre-school & school 2011
Not
enr
olle
dan
ywh
ere

Reading Tool
Himachal Pradesh RURAL
How to read this table: Each cell shows the highest level of reading achieved by a child.For example, in Std III, 2.1% children cannot even read letters, 8.5% can read lettersbut not more, 22.6% can read words but not Std 1 text or higher, 35.5% can read Std1 text but not Std 2 level text, and 31.3% can read Std 2 level text. In sum, for eachclass, the total of all these exclusive categories is 100%.
Std. NothingLevel 1
(Std 1 Text)Level 2
(Std 2 Text) Total
I
II
III
IV
V
VI
VII
VIII
Total
12.1 51.0 27.1 5.6 4.2 100
3.6 19.4 43.5 20.4 13.2 100
2.1 8.5 22.6 35.5 31.3 100
1.1 4.7 8.0 30.2 56.0 100
0.2 2.0 5.7 18.2 73.9 100
0.0 1.4 1.5 10.8 86.3 100
0.5 0.4 1.2 6.5 91.5 100
0.1 0.4 0.4 3.4 95.8 100
2.4 10.5 13.6 16.5 57.0 100
Chart 5: Trends over time% Children in Std V who CANNOT READ Std II LEVEL TEXTBy school type 2008-2011
Chart 4: Trends over time% Children in Std III who CANNOT READ Std I LEVEL TEXTBy school type 2008-2011
Letter Word
Table 4: % Children by class and READING levelAll schools 2011
Note : In ASER 2011 for every state, reading tools were provided in the main mediumof instruction in government schools. Children and their families were also askedabout the language they speak at home. For home languages, a list of 122 languageswas provided to all survey teams. This list includes 22 Scheduled languages and 100Non-Scheduled languages. The data in this table is for children for whom we haveinformation for both school language and home language.
Table 5: School language and home language
% Children whose :
Home language is the same as school language
Home language is different from school language
Total
%
120 ASER 2011
11.4
88.7
100.0
Home language and school language
Reading
% C
hild
ren
% C
hild
ren
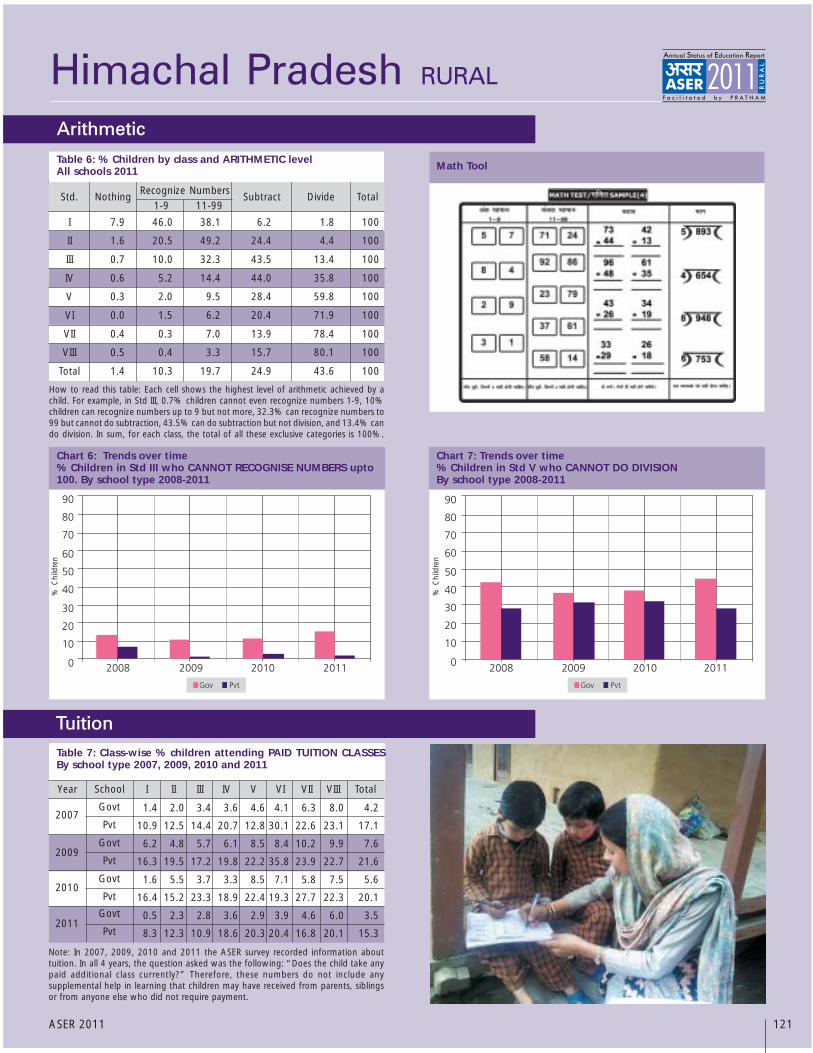
Math Tool
How to read this table: Each cell shows the highest level of arithmetic achieved by achild. For example, in Std III, 0.7% children cannot even recognize numbers 1-9, 10%children can recognize numbers up to 9 but not more, 32.3% can recognize numbers to99 but cannot do subtraction, 43.5% can do subtraction but not division, and 13.4% cando division. In sum, for each class, the total of all these exclusive categories is 100%.
Std. Nothing Subtract Divide Total
I
II
III
IV
V
VI
VII
VIII
Total
7.9 46.0 38.1 6.2 1.8 100
1.6 20.5 49.2 24.4 4.4 100
0.7 10.0 32.3 43.5 13.4 100
0.6 5.2 14.4 44.0 35.8 100
0.3 2.0 9.5 28.4 59.8 100
0.0 1.5 6.2 20.4 71.9 100
0.4 0.3 7.0 13.9 78.4 100
0.5 0.4 3.3 15.7 80.1 100
1.4 10.3 19.7 24.9 43.6 100
Recognize Numbers11-991-9
Chart 7: Trends over time% Children in Std V who CANNOT DO DIVISIONBy school type 2008-2011
Chart 6: Trends over time% Children in Std III who CANNOT RECOGNISE NUMBERS upto100. By school type 2008-2011
Himachal Pradesh RURAL
Table 7: Class-wise % children attending PAID TUITION CLASSESBy school type 2007, 2009, 2010 and 2011
Note: In 2007, 2009, 2010 and 2011 the ASER survey recorded information abouttuition. In all 4 years, the question asked was the following: “Does the child take anypaid additional class currently?” Therefore, these numbers do not include anysupplemental help in learning that children may have received from parents, siblingsor from anyone else who did not require payment.
Year School I II III IV V VI VII VIII Total
2007
2009
2010
2011
Govt
Pvt
Govt
Pvt
Govt
Pvt
Govt
Pvt
Table 6: % Children by class and ARITHMETIC levelAll schools 2011
121ASER 2011
1.4 2.0 3.4 3.6 4.6 4.1 6.3 8.0 4.2
10.9 12.5 14.4 20.7 12.8 30.1 22.6 23.1 17.1
6.2 4.8 5.7 6.1 8.5 8.4 10.2 9.9 7.6
16.3 19.5 17.2 19.8 22.2 35.8 23.9 22.7 21.6
1.6 5.5 3.7 3.3 8.5 7.1 5.8 7.5 5.6
16.4 15.2 23.3 18.9 22.4 19.3 27.7 22.3 20.1
0.5 2.3 2.8 3.6 2.9 3.9 4.6 6.0 3.5
8.3 12.3 10.9 18.6 20.3 20.4 16.8 20.1 15.3
Arithmetic
Tuition
% C
hild
ren
% C
hild
ren

As part of ASER 2007, 2009, 2010 and 2011, in each sampled village, one government school with primary sections was visited on the day of the survey.
Information about schools in this report is based on these visits.
Himachal Pradesh RURAL
2007 2009 2010 2011 2007 2009 2010 2011
Std I-IV/V Std I-VII/VIIIType of school
% Enrolledchildren present(average)
% Schools with lessthan 50% enrolledchildren present(average)
% Schools with75% or moreenrolled childrenpresent (average)
2007 2009 2010 2011 2007 2009 2010 2011
Std I-IV/V Std I-VII/VIIIType of school
% Teachers present(average)
% Schools withno teacherspresent(average)
% Schools withall teacherspresent(average)
Std I-IV/V Std I-VII/VIII2010 2011 2010 2011
% Schools with:
No Headteacher appointed
Headteacher appointed but not present attime of visitHeadteacher appointed & present at timeof visit
Total
Std I-IV/V Std I-VII/VIII2010 2011 2010 2011
% Schools with:
No computer
Computers but no children using them onday of visitComputers & children using them on dayof visit
Total
2007Type of school
Std I-IV/V: Primary
Std I-VII/VIII: Primary + Upper primary
Total schools visited
2009 2010 2011
Table 8: Total schools visited 2007, 2009, 2010 and 2011
Table 9: Student attendance 2007, 2009, 2010 and 2011
Table 11: Headteachers 2010 & 2011 Table 12: Computers 2010 and 2011
Table 10: Teacher attendance 2007, 2009, 2010 and 2011
122 ASER 2011
0.0 3.1 0.0 0.0
3.8 9.9 19.2 9.7
96.2 87.0 80.9 90.3
100 100 100 100
96.3 97.7 84.1 88.0
2.1 0.9 7.9 6.0
1.6 1.4 7.9 6.0
100 100 100 100
224 310 195 224
26 22 66 50
250 332 261 274
88.6 90.4 90.1 90.7 91.6 89.9 89.4 89.0
2.4 1.0 1.6 1.4 0.0 0.0 1.6 0.0
91.3 91.6 92.8 91.4 95.7 90.5 93.8 88.0
88.5 90.8 89.4 86.6 89.6 85.0 83.7 81.4
0.5 0.0 0.0 1.4 0.0 0.0 0.0 0.0
70.3 73.9 70.8 68.8 68.2 61.1 47.5 44.9
2007 2009 2010 2011
Std I-IV/V
2007 2009 2010 2011
Std I-VII/VIII% Schools with:
Std II children sitting with one or more other classes
Table 13: Multigrade classes 2007, 2009, 2010 and 2011
60.8 57.4 58.7 50.7 80.0 54.6 58.1 74.5
54.6 53.7 54.0 44.8 61.5 40.0 49.2 65.2Std IV children sitting with one or more other classes
School observations
Other school information
Student and teacher attendance

Himachal Pradesh RURAL
How much goes toeach school For what purposes
SCHOOL DEVELOPMENT GRANT / SCHOOL GRANT
Rs.5000 per year perprimary school
Rs.7000 per year per upperprimary school
Rs 5000 + Rs 7000 =Rs 12000 if the school isStd I-VII/VIII.
Note: Primary and UpperPrimary schools are treatedas separate schools even ifthey are in the same pre-mises.
This grant can be used forbuying school equipmentsuch as blackboard, sittingmats etc. Also for buyingchalk, duster, registers andother office equipment.
The grant amount varies bytype of school: whether it isa primary or upper primaryschool.
SCHOOL MAINTENANCE GRANT
Rs.5000 - Rs 7500 perschool per year if the schoolhas upto 3 classrooms.
Rs 7500 - Rs.10000 per yearif the school has more than3 classrooms.
Primary and Upper Primaryschools are treated asseparate schools even ifthey are in the samebuilding.
TLM GRANT
This grant can be used byteachers to buy teachingaids, such as charts, globes,posters, models etc.
Rs.500 per teacher per yearin primary and upper pri-mary schools.
1 For more information see www.accountabilityinitiative.in
123ASER 2011
School funds and activities (PAISA)
This grant can be used formaintenance of schoolbuilding, includingwhitewashing;beautification; and repair oftoilets, hand pump,boundary wall, playgroundetc.
The grant amount dependson number of classrooms(excluding Headmasterroom and office room)
DID SCHOOLS GET THEIR MONEY ON TIME?
2008-2009 2009-2010 2010-2011SSA school
grants% Schools % Schools % SchoolsNo.
ofSch.
No.of
Sch.Yes No Don’tknow
DID SCHOOLS GET THEIR MONEY ON TIME?
April 2009 toOctober 2009
April 2010 toOctober 2010
April 2011 toOctober 2011
% Schools % Schools % SchoolsNo.of
Sch.
No.of
Sch.
No.of
Sch.Yes No Don’tknow
Type of Activity
Yes No Don'tknow
New Classroom
Repair of building (roof, floor, wall etc.)
Repair of doors & windows
Repair of boundary wall
Repair of drinking water facility
Repair of toilet
White wash/plastering
Painting Blackboard/Display Board/Painting on wall
Painting of doors & walls
Purchase of furniture (cupboard etc.)
Purchase of electrical fittings
Purchase of chalk, duster, register etc.
Purchase of sitting Mats/Tat Patti
Purchase of charts, globes & other teaching material
Expenditure on school events
Payment of bills (electricity, water, cleaning etc.)
Const.
Repairs
Painting
& White
Wash
Purchase
Other
Table 15: % Schools who report receiving SSA grants - Half financial year
Table 16: % Schools carrying out different activities since April 2010
Table 14: % Schools who report receiving SSA grants - Full financial year
310 90.7 7.1 2.3 245 93.9 2.5 3.7 263 94.3 3.0 2.7
296 83.5 15.2 1.4 235 93.6 3.4 3.0 259 92.3 3.9 3.9
317 95.3 3.5 1.3 231 97.4 0.9 1.7 263 98.9 0.0 1.1
278 85.6 11.2 3.2 236 84.3 10.6 5.1 252 84.5 11.9 3.6
268 82.1 15.3 2.6 225 85.8 9.8 4.4 247 81.8 14.6 3.6
281 91.5 6.1 2.5 228 88.2 8.8 3.1 249 87.2 11.2 1.6
18.3 80.3 1.4
56.3 42.2 1.5
47.1 51.4 1.6
26.3 72.0 1.7
38.6 60.2 1.2
34.4 64.0 1.6
61.0 37.4 1.6
66.9 31.9 1.2
59.5 39.3 1.2
50.0 49.2 0.8
38.8 60.0 1.2
79.8 17.5 2.8
32.0 65.6 2.5
72.9 24.4 2.7
53.9 44.1 2.0
63.1 34.0 2.9
% schools
Ma intenancegrantDeve lopmentgrant
TLM grant
Yes No Don’tknow
Yes No Don’tknow
SSA school
grants
Ma intenancegrantDeve lopmentgrant
TLM grant
Yes No Don’tknow
Yes No Don’tknow
No.of
Sch.
EVERY RURAL GOVERNMENT PRIMARY SCHOOLIS ENTITLED TO EACH OF THESE SSA GRANTSEVERY YEAR.
The PAISA section of ASER tracks receipt and spending
of Sarva Shiksha Abhiyan (SSA) grants at the school
level. This information is collected from schools visited
during the survey. This page reports proportion of
schools receiving the grants and carrying out specified
activities in the schools. More detailed analysis of the
PAISA data will be available in the PAISA 2011 report
which will be released in March 2012.1

Himachal Pradesh RURAL
Note : For schools with enrollment above 200children the PTR shall not exceed 40 excludingthe Head Teacher
As part of ASER 2010 and 2011, in each sampled village, onegovernment school with primary sections was visited on theday of the survey. During this school visit, RTE indicators wereobserved and are reported here.
Note: School observations for ASER 2011 looked at TLM for Std II and Std IV only.
2010 2011School
enrollment No. ofschools
No. ofschools
% ofschools
% ofschools
RTETeacherNorms
1-60
61-90
91-120
121-150
151-200
> 200
TOTAL
2011Schoolenrollment
2010
2
3
4
5
5 + HMsee note
2010
1
2
3
4
5
6
>=7
TOTAL
2011
Numberof
teachersNo.of
schools
No.of
schools
%of
schools
%of
schools
RTE norm:At least one
classroom perteacher
1
2
3
4
5
6
>=7
TOTAL
20112010
% Schools that do notmeet classroom to teacher
normsNumber ofteachers
% of schools with 2011
Building
DrinkingWater
Toilet
Girls Toilet
TLM
Library
MDM
Table 17: Schools by totalenrollment 2010 and 2011
Table 18: RTE norms: Pupil-teacherratio 2010 and 2011
Table 19: Schools by number ofteachers 2010 and 2011
Table 20: RTE norms: Teacher -classroom ratio 2010 and 2011
Table 21: % Schools meeting selected RTE norms on facilities 2010 & 2011
2010
1-60
61-90
91-120
121-150
151-200
> 200
TOTAL
124 ASER 2011
125 48.6 160 59.0
54 21.0 61 22.5
45 17.5 18 6.6
14 5.5 21 7.8
11 4.3 6 2.2
8 3.1 5 1.9
257 100 271 100
37 16.7 45 18.7
80 36.0 98 40.7
39 17.6 46 19.1
24 10.8 20 8.3
17 7.7 18 7.5
11 5.0 5 2.1
14 6.3 9 3.7
222 100 241 100
0.0 0.0
11.3 15.9
37.0 29.0
30.4 23.5
50.0 53.3
62.5 100.0
50.0 71.4
23.4 22.6
Right to Education indicators
Extracts from the Schedule of The Right of Children toFree and Compulsory Education Act 2009 Norms andstandards for a School (Sections 19 and 25)
Number of teachers in Std 1-5:� Admitted children No. of teachers
<= 60 261-90 391-120 4121-200 5> 150 5 + 1 Headteacher> 200 Pupil-Teacher Ratio
(excluding Headteacher)shall not exceed 40
School facilities:All weather building with:
� At least one classroom for every teacher� Office cum store cum headteacher’s room� Separate toilets for boys and girls� Safe and adequate drinking water facility to
all children� A kitchen where mid-day meal is cooked in
the school� Playground� Arrangements for securing the school
building by boundary wall or fencing.
Teaching learning equipmentshall be provided to each class as required.
LibraryThere shall be a library in each school providingnewspaper, magazines and books on all subjects,including story-books.
32.4 30.2
42.6 32.1
47.6 38.9
61.5 55.0
20.0 40.0
57.1 100.0
39.4 34.7
75.5 76.976.0 70.037.3 42.412.5 11.54.3 6.7
83.2 81.810.8 7.933.2 23.656.0 68.531.1 12.5
10.6 2.419.6 20.238.7 64.991.5 89.887.5 89.019.7 11.439.0 46.141.3 42.482.0 89.398.0 99.3
% Schools that donot meet PTR norms
Office/Store/Office cum storePlaygroundBoundary WallNo facility for drinking waterFacility but no drinking water availableDrinking water availableNo toilet facilityFacility but toilet not useableToilet useable% Schools with no separate provisions for girls toiletsOf schools with separate girls toilets, % schools whereToilet lockedToilet not useableToilet useableTeaching learning material in Std 2Teaching learning material in Std 4No libraryLibrary but no books being used by children on day of visitLibrary being used by children on day of visitKitchen shed for cooking midday mealMidday meal served in school on the day of visit

Jammu and Kashmir RURAL
Note: 'OTHER' includes children going to madarssa and EGS.‘NOT IN SCHOOL’ = dropped out + never enrolled.
How to read this table: If a child started school in Std I at age 6, she should be age 8 inStd 3. This table shows the age distribution for each class. For example, in Std III,28.9% children are 8 years old but there are also 9.7% who are 7, 37.8% who are 9,14.7% who are 10 years old, etc.
Chart 1: Trends over time% Children out of school by age group and gender 2006-2011
How to read this chart: For example, the proportion of girls (age 11-14) not in schoolhas changed from 8.3% in 2006 to 5.8% in 2007 to 5% in 2008 to 3.1% in 2009 to3.7% in 2011
ALL ANALYSIS BASED ON DATA FROM HOUSEHOLDS. 14 OUT OF 14 DISTRICTS
TotalAge group Govt. Pvt. Other Not inSchool
59.4 37.7 0.4 2.5 100
61.6 34.1 0.4 4.0 100
55.6 42.2 0.4 1.8 100
52.7 45.5 0.4 1.3 100
58.9 38.4 0.5 2.3 100
63.7 32.9 0.4 3.0 100
60.1 37.0 0.5 2.4 100
67.7 28.4 0.2 3.7 100
68.5 20.9 0.4 10.1 100
68.4 23.5 0.5 7.7 100
68.9 18.2 0.3 12.5 100
Age: 6-14 ALL
Age: 7-16 ALL
Age: 7-10 ALL
Age: 7-10 BOYS
Age: 7-10 GIRLS
Age: 11-14 ALL
Age: 11-14 BOYS
Age: 11-14 GIRLS
Age: 15-16 ALL
Age: 15-16 BOYS
Age: 15-16 GIRLS
I
II
III
IV
V
VI
VII
VIII
Table 2: Sample description% Children in each class by age 2011
5 6 7 8 9 10 11 12 13 14 15 16 Total
19.8 36.9 27.1 10.0 6.2
4.0 12.3 29.8 38.4 8.1 7.4
3.4 9.7 28.9 37.8 14.7 5.4
3.2 13.8 24.2 42.4 8.9 7.4
4.0 10.9 30.3 37.5 11.3 5.9
2.3 11.6 25.5 44.2 10.7 5.7
4.7 8.8 30.7 42.5 10.3 3.0
2.7 11.1 26.0 45.9 10.6 3.7
100
100
100
100
100
100
100
100
Std.
Table 1: % Children in different types of schools 2011
125ASER 2011
School enrollment and out of school children
Young children in pre-school and school
% C
hild
ren
% C
hild
ren
% C
hild
ren
Chart 2: Trends over time% Children enrolled in private school by class 2007, 2009 & 2011
Chart 3: Trends over timeFive year olds in pre-school & school 2007, 2009 & 2011
Tota
l
In SchoolIn balwadi
oranganwadi
In LKG/UKG
Age 5
Age 6
Govt Pvt Other
14.0 24.0 27.7 24.4 0.7 9.3 100
3.1 14.2 45.5 34.1 0.4 2.7 100
Note: Jammu and Kashmir data for 2010 not available.
Table 3: % Children age 5-6 who are enrolled in differenttypes of pre-school & school 2011
Not
enr
olle
dan
ywh
ere

Reading Tool
Jammu and Kashmir RURAL
How to read this table: Each cell shows the highest level of reading achieved by a child.For example, in Std III, 2.9% children cannot even read letters, 23.5% can read lettersbut not more, 28.3% can read words but not Std 1 text or higher, 27.8% can read Std1 text but not Std 2 level text, and 17.5% can read Std 2 level text. In sum, for eachclass, the total of all these exclusive categories is 100%.
Std. NothingLevel 1
(Std 1 Text)Level 2
(Std 2 Text) Total
I
II
III
IV
V
VI
VII
VIII
Total
14.2 49.9 23.3 8.8 3.7 100
6.0 33.7 33.2 17.0 10.2 100
2.9 23.5 28.3 27.8 17.5 100
1.6 16.6 25.4 31.2 25.1 100
1.4 9.7 20.0 32.8 36.2 100
1.2 6.6 13.4 32.0 46.8 100
0.9 5.4 9.3 28.5 56.0 100
0.6 3.9 7.2 24.8 63.6 100
3.7 18.8 19.8 25.1 32.6 100
Chart 5: Trends over time% Children in Std V who CANNOT READ Std II LEVEL TEXTBy school type 2008-2011
Chart 4: Trends over time% Children in Std III who CANNOT READ Std I LEVEL TEXTBy school type 2008-2011
Letter Word
Table 4: % Children by class and READING levelAll schools 2011
126 ASER 2011
Home language and school language
Reading
% C
hild
ren
% C
hild
ren
Note: In ASER 2011 for every state, reading tools were provided in the main medium of instructionin government schools. In Jammu and Kashmir, where the medium of instruction in governmentschools is English, children were given the choice of reading in English, Urdu or Hindi. Hindi toolswere used in only in Jammu division. For home languages, a list of 122 languages was providedto all survey teams. This list includes 22 Scheduled languages and 100 Non-Scheduled languages.The data in this table is for children for whom we have information for both school language andhome language.
Table 5: School language and home language
%Childrenwho took thereading test in:
91.6
6.7
1.7
100
Of the %Childrentested in:
% Children whose home language was:
Kashmiri Dogri Ladakhi Other* Total
English
Urdu
Hindi
Total
English
Urdu
* 'Other' includes all languages from the list of scheduled and non-scheduled languages except those specified above. Data for homelanguage of children tested in Hindi has not been reported here dueto small cell sizes.
%
52.2 24.7 1.3 21.7 100
32.0 5.4 0.0 62.6 100

Math Tool
How to read this table: Each cell shows the highest level of arithmetic achieved by achild. For example, in Std III, 3% children cannot even recognize numbers 1-9, 17.5%children can recognize numbers up to 9 but not more, 40.7% can recognize numbers to99 but cannot do subtraction, 33.1% can do subtraction but not division, and 5.7% cando division. In sum, for each class, the total of all these exclusive categories is 100%.
Std. Nothing Subtract Divide Total
I
II
III
IV
V
VI
VII
VIII
Total
12.0 42.9 36.1 8.2 0.7 100
4.8 27.0 45.2 19.8 3.2 100
3.0 17.5 40.7 33.1 5.7 100
1.4 9.9 38.2 37.8 12.8 100
1.0 6.6 28.9 41.0 22.5 100
1.0 5.7 22.3 42.3 28.8 100
0.7 2.8 20.9 40.1 35.5 100
0.5 1.4 17.8 40.3 40.1 100
3.1 14.3 31.0 32.6 18.9 100
Recognize Numbers11-991-9
Chart 7: Trends over time% Children in Std V who CANNOT DO DIVISIONBy school type 2008-2011
Chart 6: Trends over time% Children in Std III who CANNOT RECOGNISE NUMBERS upto100. By school type 2008-2011
Jammu and Kashmir RURAL
Table 7: Class-wise % children attending PAID TUITION CLASSESBy school type 2007, 2009 and 2011
Table 6: % Children by class and ARITHMETIC levelAll schools 2011
127
Arithmetic
Tuition
% C
hild
ren
% C
hild
ren
Note: In 2007, 2009, 2010 and 2011 the ASER survey recorded information abouttuition. In all 4 years, the question asked was the following: “Does the child take anypaid additional class currently?” Therefore, these numbers do not include anysupplemental help in learning that children may have received from parents, siblingsor from anyone else who did not require payment.
Year School I II III IV V VI VII VIII Total
2007
2009
2010
2011
Govt
Pvt
Govt
Pvt
Govt
Pvt
Govt
Pvt
ASER 2011
6.0 5.4 6.5 5.9 8.0 11.8 12.6 17.9 9.2
13.0 22.4 21.0 19.2 32.5 30.3 28.1 33.9 23.7
3.6 8.5 11.2 14.7 19.3 14.9 20.5 22.0 14.5
12.5 13.7 18.4 25.7 33.8 25.0 32.8 27.9 23.1
0.0 0.0 0.0 0.0 0.0 0.0 0.0 0.0 0.0
0.0 0.0 0.0 0.0 0.0 0.0 0.0 0.0 0.0
4.1 3.8 7.1 6.9 6.4 7.5 7.2 9.6 6.7
19.3 20.5 19.2 22.7 19.1 18.8 23.6 29.8 21.4

As part of ASER 2007, 2009, 2010 and 2011, in each sampled village, one government school with primary sections was visited on the day of the survey.
Information about schools in this report is based on these visits.
Jammu and Kashmir RURAL
2007 2009 2010 2011 2007 2009 2010 2011
Std I-IV/V Std I-VII/VIIIType of school
% Enrolledchildren present(average)
% Schools with lessthan 50% enrolledchildren present(average)
% Schools with75% or moreenrolled childrenpresent (average)
2007 2009 2010 2011 2007 2009 2010 2011
Std I-IV/V Std I-VII/VIIIType of school
% Teachers present(average)
% Schools withno teacherspresent(average)
% Schools withall teacherspresent(average)
Std I-IV/V2010 2011 2010 2011
% Schools with:
No Headteacher appointed
Headteacher appointed but not present attime of visit
Total
Std I-IV/V Std I-VII/VIII2010 2011 2010 2011
% Schools with:
No computer
Computers but no children using them onday of visit
Total
2007Type of school
Std I-IV/V: Primary
Std I-VII/VIII: Primary + Upper primary
Total schools visited
2009 2010 2011
Table 8: Total schools visited 2007, 2009, 2010 and 2011
Table 9: Student attendance 2007, 2009, 2010 and 2011
Table 11: Headteachers 2010 and 2011 Table 12: Computers 2010 and 2011
Table 10: Teacher attendance 2007, 2009, 2010 and 2011
128 ASER 2011
1.8 1.3
7.3 10.7
90.9 88.0
100 100
96.1 84.5
4.0 9.7
0.0 5.8
100 100
115 81 0 76
176 276 0 281
291 357 0 357
81.4 86.4 0.0 80.3 83.5 89.8 0.0 76.5
3.4 0.0 0.0 5.5 2.8 0.4 0.0 7.7
68.2 84.8 0.0 71.2 72.5 85.7 0.0 62.3
92.6 92.1 0.0 90.1 87.0 91.2 0.0 83.4
0.0 0.0 0.0 0.0 0.0 0.0 0.0 0.0
80.4 73.1 0.0 74.0 51.3 61.3 0.0 38.8
2007 2009 2010 2011
Std I-IV/V
2007 2009 2010 2011
Std I-VII/VIII% Schools with:
Std II children sitting with one or more other classes
Table 13: Multigrade classes 2007, 2009, 2010 and 2011
60.2 77.5 84.7 49.4 46.9 63.8
53.0 72.2 79.7 37.0 42.2 55.6Std IV children sitting with one or more other classes
School observations
Other school information
Student and teacher attendance
Std I-VII/VIII
Headteacher appointed & present at timeof visit
Computers & children using them on dayof visit

Jammu and Kashmir RURAL
How much goes toeach school For what purposes
SCHOOL DEVELOPMENT GRANT / SCHOOL GRANT
Rs.5000 per year perprimary school
Rs.7000 per year per upperprimary school
Rs 5000 + Rs 7000 =Rs 12000 if the school isStd I-VII/VIII.
Note: Primary and UpperPrimary schools are treatedas separate schools even ifthey are in the same pre-mises.
This grant can be used forbuying school equipmentsuch as blackboard, sittingmats etc. Also for buyingchalk, duster, registers andother office equipment.
The grant amount varies bytype of school: whether it isa primary or upper primaryschool.
SCHOOL MAINTENANCE GRANT
Rs.5000 - Rs 7500 perschool per year if the schoolhas upto 3 classrooms.
Rs 7500 - Rs.10000 per yearif the school has more than3 classrooms.
Primary and Upper Primaryschools are treated asseparate schools even ifthey are in the samebuilding.
TLM GRANT
This grant can be used byteachers to buy teachingaids, such as charts, globes,posters, models etc.
Rs.500 per teacher per yearin primary and upper pri-mary schools.
1 For more information see www.accountabilityinitiative.in
129ASER 2011
School funds and activities (PAISA)
This grant can be used formaintenance of schoolbuilding, includingwhitewashing;beautification; and repair oftoilets, hand pump,boundary wall, playgroundetc.
The grant amount dependson number of classrooms(excluding Headmasterroom and office room)
2008-2009 2010-2011SSA school
grants% Schools % SchoolsNo.
ofSchools
No.of
SchoolsYes No Don’tknow
DID SCHOOLS GET THEIR MONEY ON TIME?
April 2009 toOctober 2009
April 2011 toOctober 2011
% Schools % SchoolsNo.of
SchoolsYes No Don’tknow
Type of Activity
Yes No Don'tknow
New Classroom
Repair of building (roof, floor, wall etc.)
Repair of doors & windows
Repair of boundary wall
Repair of drinking water facility
Repair of toilet
White wash/plastering
Painting Blackboard/Display Board/Painting on wall
Painting of doors & walls
Purchase of furniture (cupboard etc.)
Purchase of electrical fittings
Purchase of chalk, duster, register etc.
Purchase of sitting Mats/Tat Patti
Purchase of charts, globes & other teaching material
Expenditure on school events
Payment of bills (electricity, water, cleaning etc.)
Const.
Repairs
Painting
& White
Wash
Purchase
Other
Table 15: % Schools who report receiving SSA grants - Half financial year
Table 16: % Schools carrying out different activities since April 2010
Table 14: % Schools who report receiving SSA grants - Full financial year
351 77.8 8.8 13.4 351 86.0 12.3 1.7
348 74.7 11.8 13.5 346 77.2 19.9 2.9
350 83.1 8.0 8.9 354 91.5 7.3 1.1
329 75.1 12.8 12.2 334 61.1 35.0 3.9
329 74.8 11.9 13.4 329 56.5 39.5 4.0
329 81.8 9.7 8.5 336 67.0 31.0 2.1
18.4 81.6 0.0
48.1 51.9 0.0
43.6 56.4 0.0
15.0 85.0 0.0
27.3 72.8 0.0
17.4 82.7 0.0
60.6 39.1 0.3
54.4 45.6 0.0
42.8 57.2 0.0
69.3 30.4 0.3
12.2 87.5 0.3
90.2 9.8 0.0
75.7 24.3 0.0
85.7 14.3 0.0
49.9 49.2 0.9
13.9 85.0 1.2
% schools
Ma intenancegrantDeve lopmentgrant
TLM grant
Yes No Don’tknow
SSA school
grants
Ma intenancegrantDeve lopmentgrant
TLM grant
Yes No Don’tknow
No.of
Schools
EVERY RURAL GOVERNMENT PRIMARY SCHOOLIS ENTITLED TO EACH OF THESE SSA GRANTSEVERY YEAR.
The PAISA section of ASER tracks receipt and spending
of Sarva Shiksha Abhiyan (SSA) grants at the school
level. This information is collected from schools visited
during the survey. This page reports proportion of
schools receiving the grants and carrying out specified
activities in the schools. More detailed analysis of the
PAISA data will be available in the PAISA 2011 report
which will be released in March 2012.1

Jammu and Kashmir RURAL
Note : For schools with enrollment above 200children the PTR shall not exceed 40 excludingthe Head Teacher
As part of ASER 2010 and 2011, in each sampled village, onegovernment school with primary sections was visited on theday of the survey. During this school visit, RTE indicators wereobserved and are reported here.
Note: School observations for ASER 2011 looked at TLM for Std II and Std IV only.
2011School
enrollment No. of schools % of schoolsRTE
TeacherNorms
1-60
61-90
91-120
121-150
151-200
> 200
TOTAL
2011Schoolenrollment
2
3
4
5
5 + HMsee note
% of schools with 2011
Building
DrinkingWater
Toilet
Girls Toilet
TLM
Library
MDM
Table 17: Schools by totalenrollment 2011
Table 18: RTE norms: Pupil-teacherratio 2011
Table 21: % Schools meeting selected RTE norms on facilities 2011
1-60
61-90
91-120
121-150
151-200
> 200
TOTAL
130 ASER 2011
157 45.0
70 20.1
43 12.3
35 10.0
23 6.6
21 6.0
349 100.0
Right to Education indicators
Extracts from the Schedule of The Right of Children toFree and Compulsory Education Act 2009 Norms andstandards for a School (Sections 19 and 25)
Number of teachers in Std 1-5:� Admitted children No. of teachers
<= 60 261-90 391-120 4121-200 5> 150 5 + 1 Headteacher> 200 Pupil-Teacher Ratio
(excluding Headteacher)shall not exceed 40
School facilities:All weather building with:
� At least one classroom for every teacher� Office cum store cum headteacher’s room� Separate toilets for boys and girls� Safe and adequate drinking water facility to
all children� A kitchen where mid-day meal is cooked in
the school� Playground� Arrangements for securing the school
building by boundary wall or fencing.
Teaching learning equipmentshall be provided to each class as required.
LibraryThere shall be a library in each school providingnewspaper, magazines and books on all subjects,including story-books.
12.6
4.5
9.3
18.2
16.7
35.3
12.5
% Schools that donot meet PTR norms
82.052.728.747.2
6.246.633.430.336.361.0
6.99.8
22.471.768.849.323.926.870.976.4
1
2
3
4
5
6
>=7
TOTAL
2011
Numberof
teachersNo.
of schools%
of schools
RTE norm:At least one
classroom perteacher
1
2
3
4
5
6
>=7
TOTAL
2011
% Schools that do notmeet classroom to
teacher normsNumber ofteachers
Table 19: Schools by number ofteachers 2011
Table 20: RTE norms: Teacher -classroom ratio 2011
17 5.2
5 10.7
17 5.2
47 14.4
61 18.7
43 13.2
107 32.7
327 100.0
0.0
20.8
40.0
48.7
51.0
75.0
61.3
50.2
Office/Store/Office cum storePlaygroundBoundary WallNo facility for drinking waterFacility but no drinking water availableDrinking water availableNo toilet facilityFacility but toilet not useableToilet useable% Schools with no separate provisions for girls toiletsOf schools with separate girls toilets, % schools whereToilet lockedToilet not useableToilet useableTeaching learning material in Std 2Teaching learning material in Std 4No libraryLibrary but no books being used by children on day of visitLibrary being used by children on day of visitKitchen shed for cooking midday mealMidday meal served in school on the day of visit

Jharkhand RURAL
Note: 'OTHER' includes children going to madarssa and EGS.‘NOT IN SCHOOL’ = dropped out + never enrolled.
How to read this table: If a child started school in Std I at age 6, she should be age 8 inStd 3. This table shows the age distribution for each class. For example, in Std III,32.2% children are 8 years old but there are also 12.8% who are 7, 19.4% who are 9,17.0% who are 10 years old, etc.
Chart 1: Trends over time% Children out of school by age group and gender 2006-2011
How to read this chart: For example, the proportion of girls (age 11-14) not in schoolhas changed from 13% in 2006 to 8% in 2007 to 9.4% in 2008 to 7.5% in 2009 to4.9% in 2010 to 6.4% in 2011
ALL ANALYSIS BASED ON DATA FROM HOUSEHOLDS. 20 OUT OF 22 DISTRICTS
TotalAge group Govt. Pvt. Other Not inSchool
81.0 12.8 1.5 4.7 100
79.5 13.1 1.3 6.1 100
82.2 12.8 1.7 3.4 100
80.9 14.3 1.6 3.3 100
83.5 11.2 1.8 3.5 100
79.9 13.0 1.2 6.0 100
79.1 13.8 1.4 5.8 100
80.5 12.2 1.0 6.4 100
69.3 14.3 0.8 15.6 100
71.0 13.4 0.8 14.9 100
67.2 15.5 0.9 16.3 100
Age: 6-14 ALL
Age: 7-16 ALL
Age: 7-10 ALL
Age: 7-10 BOYS
Age: 7-10 GIRLS
Age: 11-14 ALL
Age: 11-14 BOYS
Age: 11-14 GIRLS
Age: 15-16 ALL
Age: 15-16 BOYS
Age: 15-16 GIRLS
I
II
III
IV
V
VI
VII
VIII
Table 2: Sample description% Children in each class by age 2011
5 6 7 8 9 10 11 12 13 14 15 16 Total
30.2 35.4 16.1 10.6 7.6
6.6 14.6 26.4 30.2 7.5 8.3 6.3
6.9 12.8 32.2 19.4 17.0 4.3 7.3
6.9 14.6 20.8 33.5 8.3 10.0 5.8
2.6 7.2 9.1 32.0 17.8 19.5 5.8 5.9
5.6 17.2 21.5 32.5 12.0 6.3 5.0
7.8 7.9 34.9 23.4 15.7 7.8 2.5
5.6 16.0 27.2 29.7 14.2 7.4
100
100
100
100
100
100
100
100
Std.
Table 1: % Children in different types of schools 2011
131ASER 2011
School enrollment and out of school children
Young children in pre-school and school
% C
hild
ren
% C
hild
ren
% C
hild
ren
Chart 2: Trends over time% Children enrolled in private school by class 2007, 2009 & 2011
Chart 3: Trends over timeFive year olds in pre-school & school 2007, 2009 & 2011
Tota
l
In SchoolIn balwadi
oranganwadi
In LKG/UKG
Age 5
Age 6
Govt Pvt Other
27.8 5.7 48.6 8.5 1.8 7.5 100
10.9 4.1 68.0 10.7 1.8 4.5 100
Table 3: % Children age 5-6 who are enrolled in differenttypes of pre-school & school 2011
Not
enr
olle
dan
ywh
ere

Reading Tool
Jharkhand RURAL
How to read this table: Each cell shows the highest level of reading achieved by a child.For example, in Std III, 10.3% children cannot even read letters, 29.3% can readletters but not more, 29.9% can read words but not Std 1 text or higher, 17.7% canread Std 1 text but not Std 2 level text, and 12.8% can read Std 2 level text. In sum, foreach class, the total of all these exclusive categories is 100%.
Std. NothingLevel 1
(Std 1 Text)Level 2
(Std 2 Text) Total
I
II
III
IV
V
VI
VII
VIII
Total
49.2 34.7 10.7 2.9 2.4 100
22.0 39.6 23.3 8.7 6.5 100
10.3 29.3 29.9 17.7 12.8 100
7.6 19.2 24.2 23.9 25.1 100
4.4 12.6 17.1 24.9 41.0 100
2.0 7.6 11.0 21.8 57.5 100
1.0 4.0 7.1 15.1 72.9 100
1.5 2.9 5.0 10.4 80.3 100
14.5 20.9 16.8 15.3 32.5 100
Chart 5: Trends over time% Children in Std V who CANNOT READ Std II LEVEL TEXTBy school type 2008-2011
Chart 4: Trends over time% Children in Std III who CANNOT READ Std I LEVEL TEXTBy school type 2008-2011
Letter Word
Table 4: % Children by class and READING levelAll schools 2011
Note : In ASER 2011 for every state, reading tools were provided in the main mediumof instruction in government schools. Children and their families were also askedabout the language they speak at home. For home languages, a list of 122 languageswas provided to all survey teams. This list includes 22 Scheduled languages and 100Non-Scheduled languages. The data in this table is for children for whom we haveinformation for both school language and home language.
Table 5: School language and home language
% Children whose :
Home language is the same as school language
Home language is different from school language
Total
%
132 ASER 2011
38.8
61.2
100.0
Home language and school language
Reading
% C
hild
ren
% C
hild
ren

Math Tool
How to read this table: Each cell shows the highest level of arithmetic achieved by achild. For example, in Std III, 9.1% children cannot even recognize numbers 1-9, 35.4%children can recognize numbers up to 9 but not more, 32.3% can recognize numbers to99 but cannot do subtraction, 17.5% can do subtraction but not division, and 5.8% cando division. In sum, for each class, the total of all these exclusive categories is 100%.
Std. Nothing Subtract Divide Total
I
II
III
IV
V
VI
VII
VIII
Total
49.7 37.5 9.7 2.1 1.1 100
20.6 45.6 22.5 8.7 2.6 100
9.1 35.4 32.3 17.5 5.8 100
5.1 23.8 29.0 30.0 12.0 100
2.5 16.0 23.4 34.1 24.0 100
1.7 9.0 19.4 32.0 37.8 100
1.3 4.9 14.4 28.8 50.7 100
1.3 4.8 11.1 24.1 58.7 100
13.6 24.5 20.5 20.8 20.6 100
Recognize Numbers11-991-9
Chart 7: Trends over time% Children in Std V who CANNOT DO DIVISIONBy school type 2008-2011
Chart 6: Trends over time% Children in Std III who CANNOT RECOGNISE NUMBERS upto100. By school type 2008-2011
Jharkhand RURAL
Table 7: Class-wise % children attending PAID TUITION CLASSESBy school type 2007, 2009, 2010 and 2011
Note: In 2007, 2009, 2010 and 2011 the ASER survey recorded information abouttuition. In all 4 years, the question asked was the following: “Does the child take anypaid additional class currently?” Therefore, these numbers do not include anysupplemental help in learning that children may have received from parents, siblingsor from anyone else who did not require payment.
Year School I II III IV V VI VII VIII Total
2007
2009
2010
2011
Govt
Pvt
Govt
Pvt
Govt
Pvt
Govt
Pvt
Table 6: % Children by class and ARITHMETIC levelAll schools 2011
133ASER 2011
13.4 14.5 17.3 19.6 19.8 24.6 23.3 29.7 18.9
39.9 38.7 39.5 49.4 44.9 45.8 38.9 46.7 42.5
15.3 20.4 22.1 25.3 26.7 32.3 33.2 38.7 25.1
38.9 39.8 35.9 40.3 38.3 32.2 30.7 42.1 37.7
16.6 21.1 22.4 27.0 30.2 33.3 37.3 39.0 27.5
31.8 31.7 42.4 37.7 45.3 33.6 51.0 51.0 40.1
13.9 19.2 22.9 23.8 27.4 30.1 32.8 37.9 25.1
36.5 41.0 36.6 42.1 36.4 42.6 36.0 39.1 38.6
Arithmetic
Tuition
% C
hild
ren
% C
hild
ren

As part of ASER 2007, 2009, 2010 and 2011, in each sampled village, one government school with primary sections was visited on the day of the survey.
Information about schools in this report is based on these visits.
Jharkhand RURAL
2007 2009 2010 2011 2007 2009 2010 2011
Std I-IV/V Std I-VII/VIIIType of school
% Enrolledchildren present(average)
% Schools with lessthan 50% enrolledchildren present(average)
% Schools with75% or moreenrolled childrenpresent (average)
2007 2009 2010 2011 2007 2009 2010 2011
Std I-IV/V Std I-VII/VIIIType of school
% Teachers present(average)
% Schools withno teacherspresent(average)
% Schools withall teacherspresent(average)
Std I-IV/V Std I-VII/VIII2010 2011 2010 2011
% Schools with:
No Headteacher appointed
Headteacher appointed but not present attime of visitHeadteacher appointed & present at timeof visit
Total
Std I-IV/V Std I-VII/VIII2010 2011 2010 2011
% Schools with:
No computer
Computers but no children using them onday of visitComputers & children using them on dayof visit
Total
2007Type of school
Std I-IV/V: Primary
Std I-VII/VIII: Primary + Upper primary
Total schools visited
2009 2010 2011
Table 8: Total schools visited 2007, 2009, 2010 and 2011
Table 9: Student attendance 2007, 2009, 2010 and 2011
Table 11: Headteachers 2010 & 2011 Table 12: Computers 2010 and 2011
Table 10: Teacher attendance 2007, 2009, 2010 and 2011
134 ASER 2011
0.0 13.5 2.3 1.6
12.3 6.7 3.7 13.0
87.7 79.8 94.1 85.4
100 100 100 100
96.6 97.6 91.1 93.5
1.7 1.2 3.6 6.0
1.7 1.2 5.3 0.5
100 100 100 100
246 190 188 164
300 336 359 373
546 526 547 537
62.3 62.7 62.3 59.1 62.0 63.6 58.7 55.1
24.1 18.1 22.3 28.5 22.3 18.0 28.5 34.8
24.1 28.7 26.6 19.6 24.5 26.4 19.0 12.9
92.3 90.8 89.4 91.1 85.0 86.3 81.8 85.1
0.0 0.0 1.2 0.0 0.4 0.0 0.0 0.3
79.5 74.9 77.4 79.1 44.8 55.2 56.7 51.0
2007 2009 2010 2011
Std I-IV/V
2007 2009 2010 2011
Std I-VII/VIII% Schools with:
Std II children sitting with one or more other classes
Table 13: Multigrade classes 2007, 2009, 2010 and 2011
82.3 78.1 76.9 84.8 62.8 65.3 59.7 65.0
74.9 76.3 75.3 82.5 51.7 58.3 52.4 61.8Std IV children sitting with one or more other classes
School observations
Other school information
Student and teacher attendance

JharkhandJharkhandJharkhandJharkhandJharkhand RURARURARURARURARURALLLLL
How much goes toeach school For what purposes
SCHOOL DEVELOPMENT GRANT / SCHOOL GRANT
Rs.5000 per year perprimary school
Rs.7000 per year per upperprimary school
Rs 5000 + Rs 7000 =Rs 12000 if the school isStd I-VII/VIII.
Note: Primary and UpperPrimary schools are treatedas separate schools even ifthey are in the same pre-mises.
This grant can be used forbuying school equipmentsuch as blackboard, sittingmats etc. Also for buyingchalk, duster, registers andother office equipment.
The grant amount varies bytype of school: whether it isa primary or upper primaryschool.
SCHOOL MAINTENANCE GRANT
Rs.5000 - Rs 7500 perschool per year if the schoolhas upto 3 classrooms.
Rs 7500 - Rs.10000 per yearif the school has more than3 classrooms.
Primary and Upper Primaryschools are treated asseparate schools even ifthey are in the samebuilding.
TLM GRANT
This grant can be used byteachers to buy teachingaids, such as charts, globes,posters, models etc.
Rs.500 per teacher per yearin primary and upper pri-mary schools.
1 For more information see www.accountabilityinitiative.in
135ASER 2011
School funds and activities (PAISA)
This grant can be used formaintenance of schoolbuilding, includingwhitewashing;beautification; and repair oftoilets, hand pump,boundary wall, playgroundetc.
The grant amount dependson number of classrooms(excluding Headmasterroom and office room)
DID SCHOOLS GET THEIR MONEY ON TIME?
2008-2009 2009-2010 2010-2011SSA school
grants% Schools % Schools % SchoolsNo.
ofSch.
No.of
Sch.Yes No Don’tknow
DID SCHOOLS GET THEIR MONEY ON TIME?
April 2009 toOctober 2009
April 2010 toOctober 2010
April 2011 toOctober 2011
% Schools % Schools % SchoolsNo.of
Sch.
No.of
Sch.
No.of
Sch.Yes No Don’tknow
Type of Activity
Yes No Don'tknow
New Classroom
Repair of building (roof, floor, wall etc.)
Repair of doors & windows
Repair of boundary wall
Repair of drinking water facility
Repair of toilet
White wash/plastering
Painting Blackboard/Display Board/Painting on wall
Painting of doors & walls
Purchase of furniture (cupboard etc.)
Purchase of electrical fittings
Purchase of chalk, duster, register etc.
Purchase of sitting Mats/Tat Patti
Purchase of charts, globes & other teaching material
Expenditure on school events
Payment of bills (electricity, water, cleaning etc.)
Const.
Repairs
Painting
& White
Wash
Purchase
Other
Table 15: % Schools who report receiving SSA grants - Half financial year
Table 16: % Schools carrying out different activities since April 2010
Table 14: % Schools who report receiving SSA grants - Full financial year
423 70.9 17.5 11.6 400 90.5 3.0 6.5 512 83.8 10.2 6.1
425 75.3 12.0 12.7 393 89.8 3.6 6.6 504 84.5 10.1 5.4
441 82.5 9.1 8.4 401 93.3 3.2 3.5 503 86.5 9.5 4.0
311 48.6 38.6 12.9 369 72.6 17.6 9.8 501 28.1 62.9 9.0
306 52.0 34.6 13.4 354 70.9 20.3 8.8 495 29.9 60.6 9.5
310 56.1 34.2 9.7 355 74.7 19.4 5.9 497 32.4 59.6 8.1
29.4 67.1 3.5
40.9 56.7 2.5
39.1 58.4 2.5
14.4 82.7 2.9
55.6 41.7 2.7
25.6 71.4 3.0
72.8 25.9 1.2
57.8 40.9 1.3
63.5 35.2 1.3
39.6 57.3 3.1
10.9 86.4 2.7
90.7 7.9 1.4
43.9 54.2 2.0
72.7 25.6 1.7
70.3 27.4 2.3
12.3 85.6 2.1
% schools
Ma intenancegrantDeve lopmentgrant
TLM grant
Yes No Don’tknow
Yes No Don’tknow
SSA school
grants
Ma intenancegrantDeve lopmentgrant
TLM grant
Yes No Don’tknow
Yes No Don’tknow
No.of
Sch.
EVERY RURAL GOVERNMENT PRIMARY SCHOOLIS ENTITLED TO EACH OF THESE SSA GRANTSEVERY YEAR.
The PAISA section of ASER tracks receipt and spending
of Sarva Shiksha Abhiyan (SSA) grants at the school
level. This information is collected from schools visited
during the survey. This page reports proportion of
schools receiving the grants and carrying out specified
activities in the schools. More detailed analysis of the
PAISA data will be available in the PAISA 2011 report
which will be released in March 2012.1

Jharkhand RURAL
Note : For schools with enrollment above 200children the PTR shall not exceed 40 excludingthe Head Teacher
As part of ASER 2010 and 2011, in each sampled village, onegovernment school with primary sections was visited on theday of the survey. During this school visit, RTE indicators wereobserved and are reported here.
Note: School observations for ASER 2011 looked at TLM for Std II and Std IV only.
2010 2011School
enrollment No. ofschools
No. ofschools
% ofschools
% ofschools
RTETeacherNorms
1-60
61-90
91-120
121-150
151-200
> 200
TOTAL
2011Schoolenrollment
2010
2
3
4
5
5 + HMsee note
2010
1
2
3
4
5
6
>=7
TOTAL
2011
Numberof
teachersNo.of
schools
No.of
schools
%of
schools
%of
schools
RTE norm:At least one
classroom perteacher
1
2
3
4
5
6
>=7
TOTAL
20112010
% Schools that do notmeet classroom to teacher
normsNumber ofteachers
% of schools with 2011
Building
DrinkingWater
Toilet
Girls Toilet
TLM
Library
MDM
Table 17: Schools by totalenrollment 2010 and 2011
Table 18: RTE norms: Pupil-teacherratio 2010 and 2011
Table 19: Schools by number ofteachers 2010 and 2011
Table 20: RTE norms: Teacher -classroom ratio 2010 and 2011
Table 21: % Schools meeting selected RTE norms on facilities 2010 & 2011
1-60
61-90
91-120
121-150
151-200
> 200
TOTAL
136 ASER 2011
41 7.7 55 10.4
55 10.3 62 11.7
51 9.6 49 9.3
48 9.0 45 8.5
68 12.8 57 10.8
270 50.7 262 49.4
533 100.0 530 100.0
69 16.6 51 10.6
74 17.8 110 22.9
60 14.5 66 13.8
62 14.9 61 12.7
44 10.6 61 12.7
25 6.0 38 7.9
81 19.5 93 19.4
415 100.0 480 100.0
0.0 0.0
3.9 10.9
18.4 19.2
30.4 30.8
35.3 25.5
13.3 62.1
26.5 29.3
18.8 22.7
Right to Education indicators
2010
Extracts from the Schedule of The Right of Children toFree and Compulsory Education Act 2009 Norms andstandards for a School (Sections 19 and 25)
Number of teachers in Std 1-5:� Admitted children No. of teachers
<= 60 261-90 391-120 4121-200 5> 150 5 + 1 Headteacher> 200 Pupil-Teacher Ratio
(excluding Headteacher)shall not exceed 40
School facilities:All weather building with:
� At least one classroom for every teacher� Office cum store cum headteacher’s room� Separate toilets for boys and girls� Safe and adequate drinking water facility to
all children� A kitchen where mid-day meal is cooked in
the school� Playground� Arrangements for securing the school
building by boundary wall or fencing.
Teaching learning equipmentshall be provided to each class as required.
LibraryThere shall be a library in each school providingnewspaper, magazines and books on all subjects,including story-books.
55.6 42.5
72.1 74.1
87.9 80.9
83.3 81.8
86.3 81.8
96.2 95.6
88.8 84.7
84.1 84.238.5 33.826.8 24.715.8 11.110.4 8.373.8 80.618.0 19.155.2 43.526.8 37.529.7 23.4
24.6 18.324.8 21.820.9 36.682.9 78.676.1 74.338.4 26.533.2 35.428.4 38.273.4 75.792.2 89.0
% Schools that donot meet PTR norms
Office/Store/Office cum storePlaygroundBoundary WallNo facility for drinking waterFacility but no drinking water availableDrinking water availableNo toilet facilityFacility but toilet not useableToilet useable% Schools with no separate provisions for girls toiletsOf schools with separate girls toilets, % schools whereToilet lockedToilet not useableToilet useableTeaching learning material in Std 2Teaching learning material in Std 4No libraryLibrary but no books being used by children on day of visitLibrary being used by children on day of visitKitchen shed for cooking midday mealMidday meal served in school on the day of visit

Karnataka RURAL
Note: 'OTHER' includes children going to madarssa and EGS.‘NOT IN SCHOOL’ = dropped out + never enrolled.
How to read this table: If a child started school in Std I at age 6, she should be age 8 inStd 3. This table shows the age distribution for each class. For example, in Std III,37.7% children are 8 years old but there are also 4.9% who are 7 years old or younger,51.6% who are 9 years old, etc.
Chart 1: Trends over time% Children out of school by age group and gender 2006-2011
How to read this chart: For example, the proportion of girls (age 11-14) not in schoolhas changed from 8% in 2006 to 6.2% in 2007 to 5.9% in 2008 to 6.1% in 2009 to5.9% in 2010 to 5.1% in 2011
ALL ANALYSIS BASED ON DATA FROM HOUSEHOLDS. 27 OUT OF 27 DISTRICTS
TotalAge group Govt. Pvt. Other Not inSchool
76.5 20.0 0.7 2.8 100
74.3 20.0 0.6 5.1 100
77.2 20.8 0.8 1.2 100
75.8 22.5 0.5 1.2 100
78.7 19.1 1.0 1.2 100
76.8 18.3 0.4 4.5 100
76.2 19.6 0.2 3.9 100
77.3 16.9 0.7 5.1 100
60.3 22.6 0.5 16.7 100
58.9 22.5 0.5 18.1 100
61.8 22.7 0.4 15.2 100
Age: 6-14 ALL
Age: 7-16 ALL
Age: 7-10 ALL
Age: 7-10 BOYS
Age: 7-10 GIRLS
Age: 11-14 ALL
Age: 11-14 BOYS
Age: 11-14 GIRLS
Age: 15-16 ALL
Age: 15-16 BOYS
Age: 15-16 GIRLS
I
II
III
IV
V
VI
VII
VIII
Table 2: Sample description% Children in each class by age 2011
5 6 7 8 9 10 11 12 13 14 15 16 Total
10.6 61.4 23.9 4.1
6.1 41.2 48.0 4.7
4.9 37.7 51.6 5.8
0.8 6.7 34.8 52.3 5.4
5.8 38.5 48.6 6.2 1.1
1.1 6.1 33.0 53.3 6.5
1.6 7.4 33.0 48.0 8.9 1.2
2.2 7.5 35.3 49.6 4.0 1.5
100
100
100
100
100
100
100
100
Std.
Table 1: % Children in different types of schools 2011
137ASER 2011
School enrollment and out of school children
Young children in pre-school and school
% C
hild
ren
% C
hild
ren
% C
hild
ren
Chart 2: Trends over time% Children enrolled in private school by class 2007, 2009 & 2011
Chart 3: Trends over timeFive year olds in pre-school & school 2007, 2009 & 2011
Tota
l
In SchoolIn balwadi
oranganwadi
In LKG/UKG
Age 5
Age 6
Govt Pvt Other
52.9 27.7 13.6 4.8 0.4 0.6 100
10.3 9.5 57.1 21.2 1.1 1.0 100
Table 3: % Children age 5-6 who are enrolled in differenttypes of pre-school & school 2011
Not
enr
olle
dan
ywh
ere
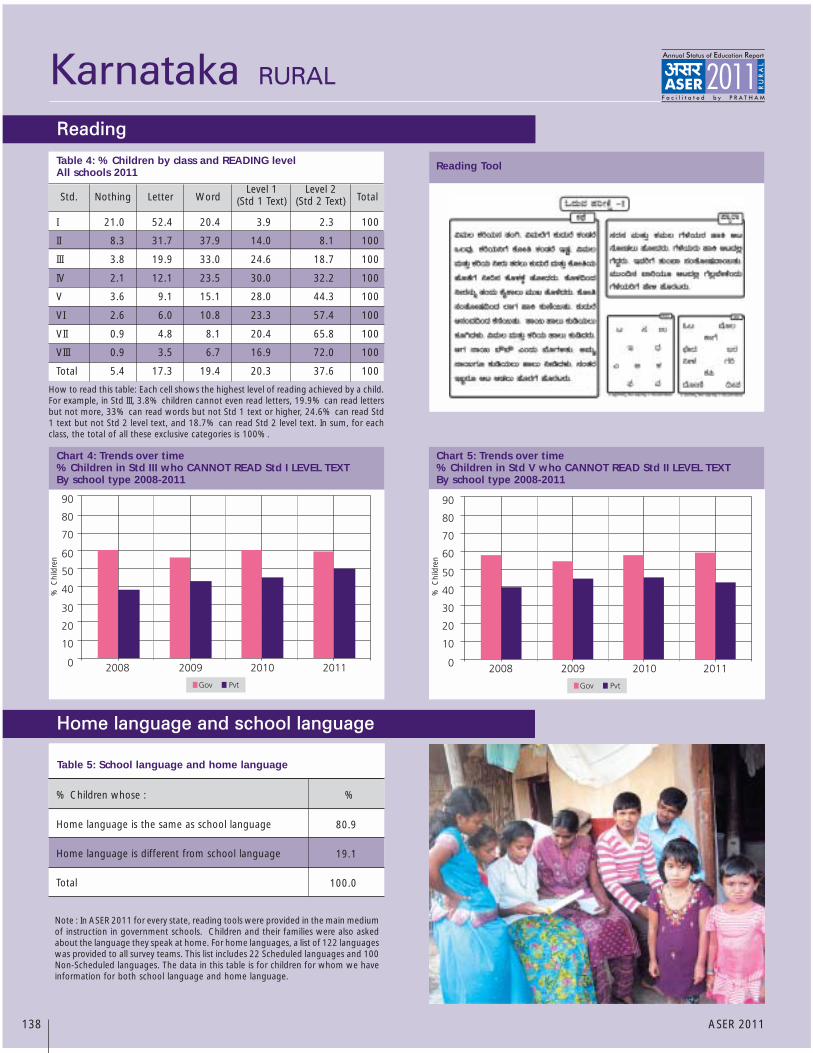
Reading Tool
Karnataka RURAL
How to read this table: Each cell shows the highest level of reading achieved by a child.For example, in Std III, 3.8% children cannot even read letters, 19.9% can read lettersbut not more, 33% can read words but not Std 1 text or higher, 24.6% can read Std1 text but not Std 2 level text, and 18.7% can read Std 2 level text. In sum, for eachclass, the total of all these exclusive categories is 100%.
Std. NothingLevel 1
(Std 1 Text)Level 2
(Std 2 Text) Total
I
II
III
IV
V
VI
VII
VIII
Total
21.0 52.4 20.4 3.9 2.3 100
8.3 31.7 37.9 14.0 8.1 100
3.8 19.9 33.0 24.6 18.7 100
2.1 12.1 23.5 30.0 32.2 100
3.6 9.1 15.1 28.0 44.3 100
2.6 6.0 10.8 23.3 57.4 100
0.9 4.8 8.1 20.4 65.8 100
0.9 3.5 6.7 16.9 72.0 100
5.4 17.3 19.4 20.3 37.6 100
Chart 5: Trends over time% Children in Std V who CANNOT READ Std II LEVEL TEXTBy school type 2008-2011
Chart 4: Trends over time% Children in Std III who CANNOT READ Std I LEVEL TEXTBy school type 2008-2011
Letter Word
Table 4: % Children by class and READING levelAll schools 2011
Note : In ASER 2011 for every state, reading tools were provided in the main mediumof instruction in government schools. Children and their families were also askedabout the language they speak at home. For home languages, a list of 122 languageswas provided to all survey teams. This list includes 22 Scheduled languages and 100Non-Scheduled languages. The data in this table is for children for whom we haveinformation for both school language and home language.
Table 5: School language and home language
% Children whose :
Home language is the same as school language
Home language is different from school language
Total
%
138 ASER 2011
80.9
19.1
100.0
Home language and school language
Reading
% C
hild
ren
% C
hild
ren

Math Tool
How to read this table: Each cell shows the highest level of arithmetic achieved by achild. For example, in Std III, 3.9% children cannot even recognize numbers 1-9, 17.4%children can recognize numbers up to 9 but not more, 46.2% can recognize numbers to99 but cannot do subtraction, 29.8% can do subtraction but not division, and 2.7% cando division. In sum, for each class, the total of all these exclusive categories is 100%.
Std. Nothing Subtract Divide Total
I
II
III
IV
V
VI
VII
VIII
Total
21.7 47.8 25.0 4.2 1.4 100
6.8 32.3 47.3 12.8 0.8 100
3.9 17.4 46.2 29.8 2.7 100
2.1 10.1 40.0 38.6 9.2 100
2.6 7.9 28.5 41.3 19.6 100
1.0 5.8 22.9 39.1 31.2 100
1.2 3.3 22.9 32.4 40.3 100
1.5 2.3 17.5 32.6 46.2 100
5.0 15.7 31.3 29.1 18.8 100
Recognize Numbers11-991-9
Chart 7: Trends over time% Children in Std V who CANNOT DO DIVISIONBy school type 2008-2011
Chart 6: Trends over time% Children in Std III who CANNOT RECOGNISE NUMBERS upto100. By school type 2008-2011
Karnataka RURAL
Table 7: Class-wise % children attending PAID TUITION CLASSESBy school type 2007, 2009, 2010 and 2011
Note: In 2007, 2009, 2010 and 2011 the ASER survey recorded information abouttuition. In all 4 years, the question asked was the following: “Does the child take anypaid additional class currently?” Therefore, these numbers do not include anysupplemental help in learning that children may have received from parents, siblingsor from anyone else who did not require payment.
Year School I II III IV V VI VII VIII Total
2007
2009
2010
2011
Govt
Pvt
Govt
Pvt
Govt
Pvt
Govt
Pvt
Table 6: % Children by class and ARITHMETIC levelAll schools 2011
139ASER 2011
7.1 7.0 9.5 8.3 9.9 9.1 8.4 6.7 8.4
15.6 16.7 18.7 13.4 24.2 16.5 13.7 8.8 15.5
5.0 7.5 7.4 9.2 9.1 7.6 8.5 6.2 7.7
20.4 21.6 26.5 20.3 20.7 26.4 21.9 14.2 21.1
4.8 7.0 7.2 7.6 6.9 6.4 7.0 5.8 6.7
16.0 17.5 23.7 16.8 22.6 14.7 18.9 12.2 17.7
4.6 5.8 7.7 6.7 9.6 10.5 8.6 6.6 7.7
17.5 17.6 20.5 27.0 21.0 17.3 17.2 14.6 18.9
Arithmetic
Tuition
% C
hild
ren
% C
hild
ren

As part of ASER 2007, 2009, 2010 and 2011, in each sampled village, one government school with primary sections was visited on the day of the survey.
Information about schools in this report is based on these visits.
Karnataka RURAL
2007 2009 2010 2011 2007 2009 2010 2011
Std I-IV/V Std I-VII/VIIIType of school
% Enrolledchildren present(average)
% Schools with lessthan 50% enrolledchildren present(average)
% Schools with75% or moreenrolled childrenpresent (average)
2007 2009 2010 2011 2007 2009 2010 2011
Std I-IV/V Std I-VII/VIIIType of school
% Teachers present(average)
% Schools withno teacherspresent(average)
% Schools withall teacherspresent(average)
Std I-IV/V Std I-VII/VIII2010 2011 2010 2011
% Schools with:
No Headteacher appointed
Headteacher appointed but not present attime of visitHeadteacher appointed & present at timeof visit
Total
Std I-IV/V Std I-VII/VIII2010 2011 2010 2011
% Schools with:
No computer
Computers but no children using them onday of visitComputers & children using them on dayof visit
Total
2007Type of school
Std I-IV/V: Primary
Std I-VII/VIII: Primary + Upper primary
Total schools visited
2009 2010 2011
Table 8: Total schools visited 2007, 2009, 2010 and 2011
Table 9: Student attendance 2007, 2009, 2010 and 2011
Table 11: Headteachers 2010 & 2011 Table 12: Computers 2010 and 2011
Table 10: Teacher attendance 2007, 2009, 2010 and 2011
140 ASER 2011
3.7 0.0 0.0 0.6
2.5 1.2 4.4 2.0
93.8 98.8 95.6 97.4
100 100 100 100
94.6 94.2 66.5 62.4
1.8 2.9 18.5 22.1
3.6 2.9 15.1 15.5
100 100 100 100
168 133 113 106
582 625 656 675
750 758 769 781
78.3 88.0 81.7 90.4 75.0 79.6 70.9 85.2
10.1 1.5 5.5 1.0 16.7 8.2 19.3 1.9
66.1 84.1 67.3 90.5 64.3 70.1 52.4 81.8
91.6 94.5 92.9 92.6 85.0 91.7 88.9 88.6
0.7 0.0 0.0 0.0 0.6 0.0 0.0 0.0
76.1 84.3 82.5 78.4 43.3 62.2 51.8 52.0
2007 2009 2010 2011
Std I-IV/V
2007 2009 2010 2011
Std I-VII/VIII% Schools with:
Std II children sitting with one or more other classes
Table 13: Multigrade classes 2007, 2009, 2010 and 2011
84.8 87.6 85.9 89.4 49.7 69.1 73.5 81.4
81.1 82.5 71.7 66.3 43.1 42.4 31.2 29.9Std IV children sitting with one or more other classes
School observations
Other school information
Student and teacher attendance
Note: In Karnataka, the official government school policy is to have mixed groups in Std. I-III.

Karnataka RURAL
How much goes toeach school For what purposes
SCHOOL DEVELOPMENT GRANT / SCHOOL GRANT
Rs.5000 per year perprimary school
Rs.7000 per year per upperprimary school
Rs 5000 + Rs 7000 =Rs 12000 if the school isStd I-VII/VIII.
Note: Primary and UpperPrimary schools are treatedas separate schools even ifthey are in the same pre-mises.
This grant can be used forbuying school equipmentsuch as blackboard, sittingmats etc. Also for buyingchalk, duster, registers andother office equipment.
The grant amount varies bytype of school: whether it isa primary or upper primaryschool.
SCHOOL MAINTENANCE GRANT
Rs.5000 - Rs 7500 perschool per year if the schoolhas upto 3 classrooms.
Rs 7500 - Rs.10000 per yearif the school has more than3 classrooms.
Primary and Upper Primaryschools are treated asseparate schools even ifthey are in the samebuilding.
TLM GRANT
This grant can be used byteachers to buy teachingaids, such as charts, globes,posters, models etc.
Rs.500 per teacher per yearin primary and upper pri-mary schools.
1 For more information see www.accountabilityinitiative.in
141ASER 2011
School funds and activities (PAISA)
This grant can be used formaintenance of schoolbuilding, includingwhitewashing;beautification; and repair oftoilets, hand pump,boundary wall, playgroundetc.
The grant amount dependson number of classrooms(excluding Headmasterroom and office room)
DID SCHOOLS GET THEIR MONEY ON TIME?
2008-2009 2009-2010 2010-2011SSA school
grants% Schools % Schools % SchoolsNo.
ofSch.
No.of
Sch.Yes No Don’tknow
DID SCHOOLS GET THEIR MONEY ON TIME?
April 2009 toOctober 2009
April 2010 toOctober 2010
April 2011 toOctober 2011
% Schools % Schools % SchoolsNo.of
Sch.
No.of
Sch.
No.of
Sch.Yes No Don’tknow
Type of Activity
Yes No Don'tknow
New Classroom
Repair of building (roof, floor, wall etc.)
Repair of doors & windows
Repair of boundary wall
Repair of drinking water facility
Repair of toilet
White wash/plastering
Painting Blackboard/Display Board/Painting on wall
Painting of doors & walls
Purchase of furniture (cupboard etc.)
Purchase of electrical fittings
Purchase of chalk, duster, register etc.
Purchase of sitting Mats/Tat Patti
Purchase of charts, globes & other teaching material
Expenditure on school events
Payment of bills (electricity, water, cleaning etc.)
Const.
Repairs
Painting
& White
Wash
Purchase
Other
Table 15: % Schools who report receiving SSA grants - Half financial year
Table 16: % Schools carrying out different activities since April 2010
Table 14: % Schools who report receiving SSA grants - Full financial year
728 92.7 4.3 3.0 669 91.2 1.1 7.8 771 95.1 2.2 2.7
700 83.0 13.4 3.6 654 89.9 2.5 7.7 764 89.9 7.1 3.0
723 94.7 3.0 2.2 664 94.3 1.4 4.4 765 95.0 3.0 2.0
658 85.1 10.2 4.7 654 84.4 6.6 9.0 761 75.6 21.0 3.4
631 75.4 19.2 5.4 637 83.7 6.3 10.1 752 70.0 26.2 3.9
651 82.2 13.7 4.2 648 87.4 5.1 7.6 753 74.2 22.6 3.2
30.2 67.5 2.3
54.0 44.0 2.0
53.1 45.0 1.9
22.4 75.9 1.7
47.6 50.6 1.8
46.8 51.3 1.9
71.1 27.3 1.6
80.3 18.4 1.3
62.3 36.3 1.5
37.5 60.3 2.1
35.7 62.6 1.7
94.2 4.3 1.4
33.8 64.7 1.5
65.2 33.6 1.2
81.1 16.9 2.0
35.3 62.1 2.6
% schools
Ma intenancegrantDeve lopmentgrant
TLM grant
Yes No Don’tknow
Yes No Don’tknow
SSA school
grants
Ma intenancegrantDeve lopmentgrant
TLM grant
Yes No Don’tknow
Yes No Don’tknow
No.of
Sch.
EVERY RURAL GOVERNMENT PRIMARY SCHOOLIS ENTITLED TO EACH OF THESE SSA GRANTSEVERY YEAR.
The PAISA section of ASER tracks receipt and spending
of Sarva Shiksha Abhiyan (SSA) grants at the school
level. This information is collected from schools visited
during the survey. This page reports proportion of
schools receiving the grants and carrying out specified
activities in the schools. More detailed analysis of the
PAISA data will be available in the PAISA 2011 report
which will be released in March 2012.1
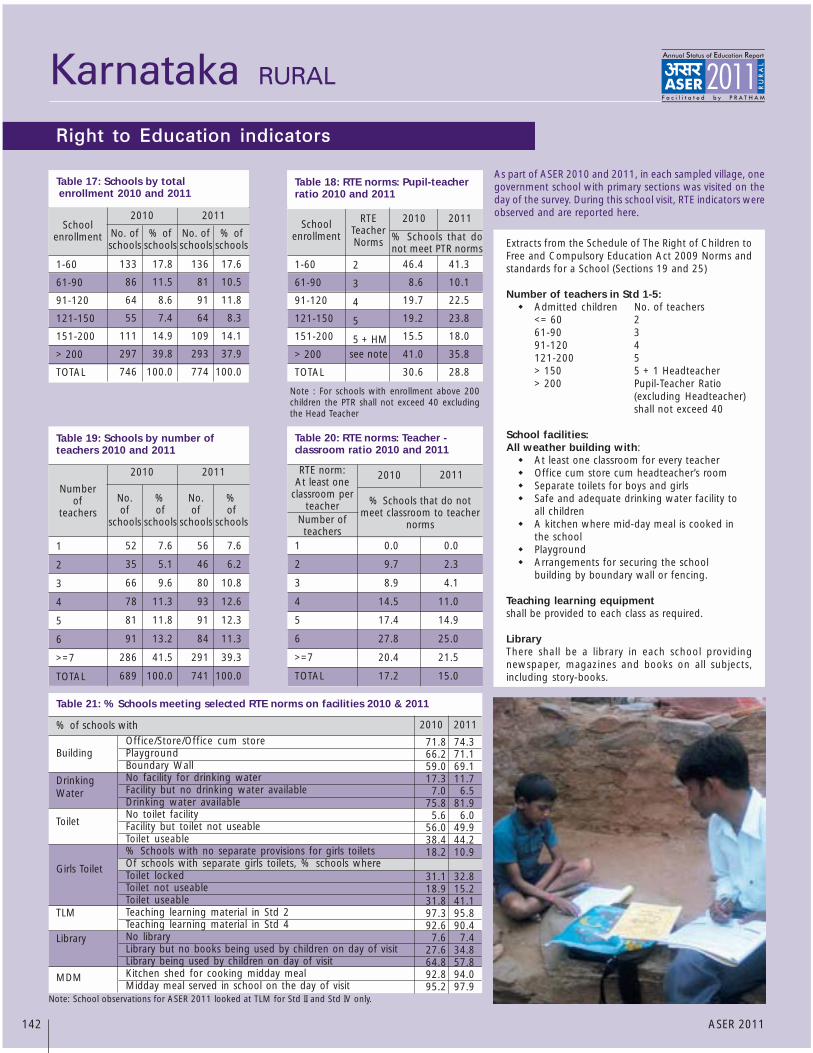
Karnataka RURAL
Note : For schools with enrollment above 200children the PTR shall not exceed 40 excludingthe Head Teacher
As part of ASER 2010 and 2011, in each sampled village, onegovernment school with primary sections was visited on theday of the survey. During this school visit, RTE indicators wereobserved and are reported here.
Note: School observations for ASER 2011 looked at TLM for Std II and Std IV only.
2010 2011School
enrollment No. ofschools
No. ofschools
% ofschools
% ofschools
RTETeacherNorms
1-60
61-90
91-120
121-150
151-200
> 200
TOTAL
2011Schoolenrollment
2010
2
3
4
5
5 + HMsee note
2010
1
2
3
4
5
6
>=7
TOTAL
2011
Numberof
teachersNo.of
schools
No.of
schools
%of
schools
%of
schools
RTE norm:At least one
classroom perteacher
1
2
3
4
5
6
>=7
TOTAL
20112010
% Schools that do notmeet classroom to teacher
normsNumber ofteachers
% of schools with 2011
Building
DrinkingWater
Toilet
Girls Toilet
TLM
Library
MDM
Table 17: Schools by totalenrollment 2010 and 2011
Table 18: RTE norms: Pupil-teacherratio 2010 and 2011
Table 19: Schools by number ofteachers 2010 and 2011
Table 20: RTE norms: Teacher -classroom ratio 2010 and 2011
Table 21: % Schools meeting selected RTE norms on facilities 2010 & 2011
2010
1-60
61-90
91-120
121-150
151-200
> 200
TOTAL
142 ASER 2011
133 17.8 136 17.6
86 11.5 81 10.5
64 8.6 91 11.8
55 7.4 64 8.3
111 14.9 109 14.1
297 39.8 293 37.9
746 100.0 774 100.0
52 7.6 56 7.6
35 5.1 46 6.2
66 9.6 80 10.8
78 11.3 93 12.6
81 11.8 91 12.3
91 13.2 84 11.3
286 41.5 291 39.3
689 100.0 741 100.0
0.0 0.0
9.7 2.3
8.9 4.1
14.5 11.0
17.4 14.9
27.8 25.0
20.4 21.5
17.2 15.0
Right to Education indicators
Extracts from the Schedule of The Right of Children toFree and Compulsory Education Act 2009 Norms andstandards for a School (Sections 19 and 25)
Number of teachers in Std 1-5:� Admitted children No. of teachers
<= 60 261-90 391-120 4121-200 5> 150 5 + 1 Headteacher> 200 Pupil-Teacher Ratio
(excluding Headteacher)shall not exceed 40
School facilities:All weather building with:
� At least one classroom for every teacher� Office cum store cum headteacher’s room� Separate toilets for boys and girls� Safe and adequate drinking water facility to
all children� A kitchen where mid-day meal is cooked in
the school� Playground� Arrangements for securing the school
building by boundary wall or fencing.
Teaching learning equipmentshall be provided to each class as required.
LibraryThere shall be a library in each school providingnewspaper, magazines and books on all subjects,including story-books.
46.4 41.3
8.6 10.1
19.7 22.5
19.2 23.8
15.5 18.0
41.0 35.8
30.6 28.8
71.8 74.366.2 71.159.0 69.117.3 11.77.0 6.5
75.8 81.95.6 6.0
56.0 49.938.4 44.218.2 10.9
31.1 32.818.9 15.231.8 41.197.3 95.892.6 90.47.6 7.4
27.6 34.864.8 57.892.8 94.095.2 97.9
% Schools that donot meet PTR norms
Office/Store/Office cum storePlaygroundBoundary WallNo facility for drinking waterFacility but no drinking water availableDrinking water availableNo toilet facilityFacility but toilet not useableToilet useable% Schools with no separate provisions for girls toiletsOf schools with separate girls toilets, % schools whereToilet lockedToilet not useableToilet useableTeaching learning material in Std 2Teaching learning material in Std 4No libraryLibrary but no books being used by children on day of visitLibrary being used by children on day of visitKitchen shed for cooking midday mealMidday meal served in school on the day of visit

Kerala RURAL
Note: 'OTHER' includes children going to madarssa and EGS.‘NOT IN SCHOOL’ = dropped out + never enrolled.
How to read this table: If a child started school in Std I at age 6, she should be age 8 inStd 3. This table shows the age distribution for each class. For example, in Std III,63.1% children are 8 years old but there are also 14.3% who are 7, 18.5% who are 9years old, etc.
Chart 1: Trends over time% Children out of school by age group and gender 2006-2011
How to read this chart: For example, the proportion of girls (age 11-14) not in schoolhas changed from 3.9% in 2006 to 0.4% in 2007 to 0.2% in 2008 to 0.2% in 2009to 0.1% in 2010 to 0.1% in 2011
ALL ANALYSIS BASED ON DATA FROM HOUSEHOLDS. 14 OUT OF 14 DISTRICTS
TotalAge group Govt. Pvt. Other Not inSchool
38.4 60.8 0.7 0.1 100
40.0 59.0 0.7 0.3 100
37.9 61.1 1.0 0.1 100
38.0 61.1 0.8 0.0 100
37.7 61.2 1.1 0.1 100
40.1 59.2 0.6 0.1 100
40.1 59.0 0.8 0.1 100
40.1 59.4 0.5 0.1 100
45.7 52.7 0.4 1.2 100
45.1 53.1 0.5 1.3 100
46.3 52.3 0.4 1.1 100
Age: 6-14 ALL
Age: 7-16 ALL
Age: 7-10 ALL
Age: 7-10 BOYS
Age: 7-10 GIRLS
Age: 11-14 ALL
Age: 11-14 BOYS
Age: 11-14 GIRLS
Age: 15-16 ALL
Age: 15-16 BOYS
Age: 15-16 GIRLS
I
II
III
IV
V
VI
VII
VIII
Table 2: Sample description% Children in each class by age 2011
5 6 7 8 9 10 11 12 13 14 15 16 Total
18.1 61.2 17.9 2.8
0.6 13.5 63.5 19.6 2.8
0.8 14.3 63.1 18.5 3.4
1.5 12.4 62.4 19.9 3.8
1.4 11.7 67.4 17.4 2.1
1.4 13.3 63.6 19.3 2.5
1.4 17.4 62.0 17.8 1.3
2.4 15.7 68.1 12.0 1.9
100
100
100
100
100
100
100
100
Std.
Table 1: % Children in different types of schools 2011
143ASER 2011
School enrollment and out of school children
Young children in pre-school and school
% C
hild
ren
% C
hild
ren
% C
hild
ren
Chart 2: Trends over time% Children enrolled in private school by class 2007, 2009 & 2011
Chart 3: Trends over timeFive year olds in pre-school & school 2007, 2009 & 2011
Tota
l
In SchoolIn balwadi
oranganwadi
In LKG/UKG
Age 5
Age 6
Govt Pvt Other
15.7 45.4 11.4 26.0 0.8 0.8 100
2.7 12.4 26.4 58.3 0.3 0.0 100
Table 3: % Children age 5-6 who are enrolled in differenttypes of pre-school & school 2011
Not
enr
olle
dan
ywh
ere

Reading Tool
Kerala RURAL
How to read this table: Each cell shows the highest level of reading achieved by a child.For example, in Std III, 0.7% children cannot even read letters, 8.7% can read lettersbut not more, 21.5% can read words but not Std 1 text or higher, 23.6% can read Std1 text but not Std 2 level text, and 45.5% can read Std 2 level text. In sum, for eachclass, the total of all these exclusive categories is 100%.
Std. NothingLevel 1
(Std 1 Text)Level 2
(Std 2 Text) Total
I
II
III
IV
V
VI
VII
VIII
Total
3.7 38.1 45.3 7.0 5.9 100
2.1 17.9 33.9 23.0 23.1 100
0.7 8.7 21.5 23.6 45.5 100
0.5 3.2 11.8 19.4 65.1 100
0.4 1.8 6.9 17.0 73.9 100
0.4 1.4 4.9 13.3 80.0 100
0.2 1.3 3.3 9.3 85.8 100
0.4 0.9 1.3 7.3 90.1 100
1.0 8.4 15.1 14.8 60.8 100
Chart 5: Trends over time% Children in Std V who CANNOT READ Std II LEVEL TEXTBy school type 2008-2011
Chart 4: Trends over time% Children in Std III who CANNOT READ Std I LEVEL TEXTBy school type 2008-2011
Letter Word
Table 4: % Children by class and READING levelAll schools 2011
Note : In ASER 2011 for every state, reading tools were provided in the main mediumof instruction in government schools. Children and their families were also askedabout the language they speak at home. For home languages, a list of 122 languageswas provided to all survey teams. This list includes 22 Scheduled languages and 100Non-Scheduled languages. The data in this table is for children for whom we haveinformation for both school language and home language.
Table 5: School language and home language
% Children whose :
Home language is the same as school language
Home language is different from school language
Total
%
144 ASER 2011
98.5
1.5
100.0
Home language and school language
Reading
% C
hild
ren
% C
hild
ren

Math Tool
How to read this table: Each cell shows the highest level of arithmetic achieved by achild. For example, in Std III, 1.9% children cannot even recognize numbers 1-9, 5.7%children can recognize numbers up to 9 but not more, 40.5% can recognize numbers to99 but cannot do subtraction, 44.3% can do subtraction but not division, and 7.7% cando division. In sum, for each class, the total of all these exclusive categories is 100%.
Std. Nothing Subtract Divide Total
I
II
III
IV
V
VI
VII
VIII
Total
4.6 33.1 54.6 6.5 1.3 100
1.6 11.8 58.9 24.6 3.1 100
1.9 5.7 40.5 44.3 7.7 100
0.8 2.9 25.9 48.6 21.9 100
0.7 2.0 19.4 44.6 33.2 100
1.1 1.5 14.7 33.4 49.3 100
0.5 0.8 11.9 24.7 62.2 100
0.8 1.2 6.9 17.8 73.3 100
1.4 6.8 27.6 30.8 33.5 100
Recognize Numbers11-991-9
Chart 7: Trends over time% Children in Std V who CANNOT DO DIVISIONBy school type 2008-2011
Chart 6: Trends over time% Children in Std III who CANNOT RECOGNISE NUMBERS upto100. By school type 2008-2011
Kerala RURAL
Table 7: Class-wise % children attending PAID TUITION CLASSESBy school type 2007, 2009, 2010 and 2011
Note: In 2007, 2009, 2010 and 2011 the ASER survey recorded information abouttuition. In all 4 years, the question asked was the following: “Does the child take anypaid additional class currently?” Therefore, these numbers do not include anysupplemental help in learning that children may have received from parents, siblingsor from anyone else who did not require payment.
Year School I II III IV V VI VII VIII Total
2007
2009
2010
2011
Govt
Pvt
Govt
Pvt
Govt
Pvt
Govt
Pvt
Table 6: % Children by class and ARITHMETIC levelAll schools 2011
145ASER 2011
28.2 32.7 30.3 39.0 36.8 39.6 42.0 42.4 36.7
20.1 28.3 29.6 35.6 39.2 38.8 35.8 41.9 33.4
21.4 33.1 31.2 34.4 41.8 34.2 35.1 41.5 35.0
28.7 32.4 37.6 43.3 43.0 43.1 42.6 47.8 39.9
26.3 23.7 36.2 35.0 44.3 40.7 45.2 46.1 39.0
29.4 32.1 40.2 40.7 44.1 44.5 43.3 39.9 39.5
18.6 23.6 31.7 32.2 40.8 33.8 42.1 36.9 33.6
24.6 26.7 32.9 31.6 36.4 35.2 35.3 41.3 33.1
Arithmetic
Tuition
% C
hild
ren
% C
hild
ren

As part of ASER 2007, 2009, 2010 and 2011, in each sampled village, one government school with primary sections was visited on the day of the survey.
Information about schools in this report is based on these visits.
Kerala RURAL
2007 2009 2010 2011 2007 2009 2010 2011
Std I-IV/V Std I-VII/VIIIType of school
% Enrolledchildren present(average)
% Schools with lessthan 50% enrolledchildren present(average)
% Schools with75% or moreenrolled childrenpresent (average)
2007 2009 2010 2011 2007 2009 2010 2011
Std I-IV/V Std I-VII/VIIIType of school
% Teachers present(average)
% Schools withno teacherspresent(average)
% Schools withall teacherspresent(average)
Std I-IV/V Std I-VII/VIII2010 2011 2010 2011
% Schools with:
No Headteacher appointed
Headteacher appointed but not present attime of visitHeadteacher appointed & present at timeof visit
Total
Std I-IV/V Std I-VII/VIII2010 2011 2010 2011
% Schools with:
No computer
Computers but no children using them onday of visitComputers & children using them on dayof visit
Total
2007Type of school
Std I-IV/V: Primary
Std I-VII/VIII: Primary + Upper primary
Total schools visited
2009 2010 2011
Table 8: Total schools visited 2007, 2009, 2010 and 2011
Table 9: Student attendance 2007, 2009, 2010 and 2011
Table 11: Headteachers 2010 & 2011 Table 12: Computers 2010 and 2011
Table 10: Teacher attendance 2007, 2009, 2010 and 2011
146 ASER 2011
0.0 0.0 0.0 0.0
5.4 5.0 2.8 1.9
94.6 95.0 97.2 98.1
100 100 100 100
24.7 21.5 4.1 6.0
18.8 26.2 11.3 15.3
56.5 52.3 84.5 78.7
100 100 100 100
127 178 176 177
64 78 99 151
191 256 275 328
90.0 91.9 93.1 91.9 91.5 91.8 91.2 90.8
3.6 0.6 0.0 0.0 3.6 1.3 1.0 1.3
93.7 96.5 97.6 97.7 92.9 96.1 94.9 97.3
90.2 87.1 94.0 92.8 87.7 92.6 90.2 92.7
0.0 0.0 0.0 0.0 0.0 0.0 0.0 0.0
58.4 54.6 71.2 68.8 39.0 50.0 47.4 46.9
2007 2009 2010 2011
Std I-IV/V
2007 2009 2010 2011
Std I-VII/VIII% Schools with:
Std II children sitting with one or more other classes
Table 13: Multigrade classes 2007, 2009, 2010 and 2011
4.5 4.6 7.9 6.7 3.9 3.9 6.3 9.4
2.9 3.6 7.1 6.3 2.1 1.3 2.2 8.7Std IV children sitting with one or more other classes
School observations
Other school information
Student and teacher attendance

Kerala RURAL
How much goes toeach school For what purposes
SCHOOL DEVELOPMENT GRANT / SCHOOL GRANT
Rs.5000 per year perprimary school
Rs.7000 per year per upperprimary school
Rs 5000 + Rs 7000 =Rs 12000 if the school isStd I-VII/VIII.
Note: Primary and UpperPrimary schools are treatedas separate schools even ifthey are in the same pre-mises.
This grant can be used forbuying school equipmentsuch as blackboard, sittingmats etc. Also for buyingchalk, duster, registers andother office equipment.
The grant amount varies bytype of school: whether it isa primary or upper primaryschool.
SCHOOL MAINTENANCE GRANT
Rs.5000 - Rs 7500 perschool per year if the schoolhas upto 3 classrooms.
Rs 7500 - Rs.10000 per yearif the school has more than3 classrooms.
Primary and Upper Primaryschools are treated asseparate schools even ifthey are in the samebuilding.
TLM GRANT
This grant can be used byteachers to buy teachingaids, such as charts, globes,posters, models etc.
Rs.500 per teacher per yearin primary and upper pri-mary schools.
1 For more information see www.accountabilityinitiative.in
147ASER 2011
School funds and activities (PAISA)
This grant can be used formaintenance of schoolbuilding, includingwhitewashing;beautification; and repair oftoilets, hand pump,boundary wall, playgroundetc.
The grant amount dependson number of classrooms(excluding Headmasterroom and office room)
DID SCHOOLS GET THEIR MONEY ON TIME?
2008-2009 2009-2010 2010-2011SSA school
grants% Schools % Schools % SchoolsNo.
ofSch.
No.of
Sch.Yes No Don’tknow
DID SCHOOLS GET THEIR MONEY ON TIME?
April 2009 toOctober 2009
April 2010 toOctober 2010
April 2011 toOctober 2011
% Schools % Schools % SchoolsNo.of
Sch.
No.of
Sch.
No.of
Sch.Yes No Don’tknow
Type of Activity
Yes No Don'tknow
New Classroom
Repair of building (roof, floor, wall etc.)
Repair of doors & windows
Repair of boundary wall
Repair of drinking water facility
Repair of toilet
White wash/plastering
Painting Blackboard/Display Board/Painting on wall
Painting of doors & walls
Purchase of furniture (cupboard etc.)
Purchase of electrical fittings
Purchase of chalk, duster, register etc.
Purchase of sitting Mats/Tat Patti
Purchase of charts, globes & other teaching material
Expenditure on school events
Payment of bills (electricity, water, cleaning etc.)
Const.
Repairs
Painting
& White
Wash
Purchase
Other
Table 15: % Schools who report receiving SSA grants - Half financial year
Table 16: % Schools carrying out different activities since April 2010
Table 14: % Schools who report receiving SSA grants - Full financial year
226 89.8 7.1 3.1 218 94.5 4.1 1.4 323 95.1 4.3 0.6
213 88.7 6.6 4.7 195 91.8 6.7 1.5 301 82.4 15.3 2.3
234 97.0 0.9 2.1 222 99.1 0.5 0.5 323 96.6 2.8 0.6
175 82.3 12.6 5.1 202 89.1 8.9 2.0 303 79.5 16.2 4.3
160 76.9 16.3 6.9 188 86.2 11.7 2.1 275 72.0 22.9 5.1
183 90.7 5.5 3.8 204 96.6 2.9 0.5 299 89.6 6.7 3.7
20.1 79.2 0.7
67.4 30.6 2.0
54.6 42.7 2.7
25.6 71.3 3.1
53.0 44.3 2.7
55.7 41.7 2.7
73.1 25.6 1.3
74.4 24.3 1.3
53.9 43.5 2.7
55.7 43.0 1.3
40.5 56.9 2.6
92.3 7.0 0.6
32.4 65.1 2.6
91.0 8.0 1.0
66.7 30.2 3.2
82.7 15.3 2.0
% schools
Ma intenancegrantDeve lopmentgrant
TLM grant
Yes No Don’tknow
Yes No Don’tknow
SSA school
grants
Ma intenancegrantDeve lopmentgrant
TLM grant
Yes No Don’tknow
Yes No Don’tknow
No.of
Sch.
EVERY RURAL GOVERNMENT PRIMARY SCHOOLIS ENTITLED TO EACH OF THESE SSA GRANTSEVERY YEAR.
The PAISA section of ASER tracks receipt and spending
of Sarva Shiksha Abhiyan (SSA) grants at the school
level. This information is collected from schools visited
during the survey. This page reports proportion of
schools receiving the grants and carrying out specified
activities in the schools. More detailed analysis of the
PAISA data will be available in the PAISA 2011 report
which will be released in March 2012.1

Kerala RURAL
Note : For schools with enrollment above 200children the PTR shall not exceed 40 excludingthe Head Teacher
As part of ASER 2010 and 2011, in each sampled village, onegovernment school with primary sections was visited on theday of the survey. During this school visit, RTE indicators wereobserved and are reported here.
Note: School observations for ASER 2011 looked at TLM for Std II and Std IV only.
2010 2011School
enrollment No. ofschools
No. ofschools
% ofschools
% ofschools
RTETeacherNorms
1-60
61-90
91-120
121-150
151-200
> 200
TOTAL
2011Schoolenrollment
2010
2
3
4
5
5 + HMsee note
2010
1
2
3
4
5
6
>=7
TOTAL
2011
Numberof
teachersNo.of
schools
No.of
schools
%of
schools
%of
schools
RTE norm:At least one
classroom perteacher
1
2
3
4
5
6
>=7
TOTAL
20112010
% Schools that do notmeet classroom to teacher
normsNumber ofteachers
% of schools with 2011
Building
DrinkingWater
Toilet
Girls Toilet
TLM
Library
MDM
Table 17: Schools by totalenrollment 2010 and 2011
Table 18: RTE norms: Pupil-teacherratio 2010 and 2011
Table 19: Schools by number ofteachers 2010 and 2011
Table 20: RTE norms: Teacher -classroom ratio 2010 and 2011
Table 21: % Schools meeting selected RTE norms on facilities 2010 & 2011
2010
1-60
61-90
91-120
121-150
151-200
> 200
TOTAL
148 ASER 2011
53 19.9 68 21.1
31 11.6 36 11.2
34 12.7 44 13.7
15 5.6 20 6.2
40 15.0 36 11.2
94 35.2 118 36.7
267 100.0 322 100.0
0 0.0 3 1.0
2 0.8 2 0.7
34 14.2 40 13.3
31 13.0 36 12.0
18 7.5 24 8.0
18 7.5 18 6.0
136 56.9 178 59.1
239 100.0 301 100.0
0.0 0.0
0.0 0.0
18.5 16.7
24.0 23.3
62.5 22.2
20.0 61.5
12.2 19.8
19.7 22.4
Right to Education indicators
Extracts from the Schedule of The Right of Children toFree and Compulsory Education Act 2009 Norms andstandards for a School (Sections 19 and 25)
Number of teachers in Std 1-5:� Admitted children No. of teachers
<= 60 261-90 391-120 4121-200 5> 150 5 + 1 Headteacher> 200 Pupil-Teacher Ratio
(excluding Headteacher)shall not exceed 40
School facilities:All weather building with:
� At least one classroom for every teacher� Office cum store cum headteacher’s room� Separate toilets for boys and girls� Safe and adequate drinking water facility to
all children� A kitchen where mid-day meal is cooked in
the school� Playground� Arrangements for securing the school
building by boundary wall or fencing.
Teaching learning equipmentshall be provided to each class as required.
LibraryThere shall be a library in each school providingnewspaper, magazines and books on all subjects,including story-books.
0.0 1.7
0.0 0.0
18.8 4.7
35.7 15.8
10.3 0.0
12.5 10.6
10.8 5.9
88.3 90.476.7 78.882.1 86.02.6 1.9
11.7 4.485.7 93.80.4 0.3
41.4 28.158.2 71.65.1 0.9
8.7 15.442.3 15.143.9 68.698.5 98.896.6 94.116.9 1.920.7 27.362.4 70.898.1 97.8
100.0 100.0
% Schools that donot meet PTR norms
Office/Store/Office cum storePlaygroundBoundary WallNo facility for drinking waterFacility but no drinking water availableDrinking water availableNo toilet facilityFacility but toilet not useableToilet useable% Schools with no separate provisions for girls toiletsOf schools with separate girls toilets, % schools whereToilet lockedToilet not useableToilet useableTeaching learning material in Std 2Teaching learning material in Std 4No libraryLibrary but no books being used by children on day of visitLibrary being used by children on day of visitKitchen shed for cooking midday mealMidday meal served in school on the day of visit

Madhya Pradesh
Maharashtra
Manipur
Meghalaya
Mizoram
Nagaland

ASER 2011

Madhya Pradesh RURAL
Note: 'OTHER' includes children going to madarssa and EGS.‘NOT IN SCHOOL’ = dropped out + never enrolled.
How to read this table: If a child started school in Std I at age 6, she should be age 8 inStd 3. This table shows the age distribution for each class. For example, in Std III,43.5% children are 8 years old but there are also 14.8% who are 7, 20.3% who are 9,9.7% who are 10 years old, etc.
Chart 1: Trends over time% Children out of school by age group and gender 2006-2011
How to read this chart: For example, the proportion of girls (age 11-14) not in schoolhas changed from 7.3% in 2006 to 5% in 2007 to 3.5% in 2008 to 3.9% in 2009 to3.3% in 2010 to 3.3% in 2011
ALL ANALYSIS BASED ON DATA FROM HOUSEHOLDS. 43 OUT OF 45 DISTRICTS
TotalAge group Govt. Pvt. Other Not inSchool
79.7 17.2 0.9 2.2 100
79.0 16.3 0.7 4.0 100
79.1 18.2 1.2 1.5 100
77.0 20.4 1.1 1.5 100
81.5 15.6 1.4 1.5 100
81.5 15.1 0.3 3.2 100
78.1 18.6 0.2 3.1 100
85.2 11.2 0.3 3.3 100
72.3 14.4 0.1 13.3 100
71.3 16.7 0.0 12.1 100
73.4 11.6 0.1 14.9 100
Age: 6-14 ALL
Age: 7-16 ALL
Age: 7-10 ALL
Age: 7-10 BOYS
Age: 7-10 GIRLS
Age: 11-14 ALL
Age: 11-14 BOYS
Age: 11-14 GIRLS
Age: 15-16 ALL
Age: 15-16 BOYS
Age: 15-16 GIRLS
I
II
III
IV
V
VI
VII
VIII
Table 2: Sample description% Children in each class by age 2011
5 6 7 8 9 10 11 12 13 14 15 16 Total
32.7 45.2 13.9 8.3
5.2 18.6 40.1 25.4 4.8 6.0
5.6 14.8 43.5 20.3 9.7 6.2
5.2 18.0 31.7 30.8 6.3 8.0
7.2 10.5 39.2 22.7 11.8 8.6
4.6 13.8 33.2 31.7 8.5 8.1
6.0 11.5 38.9 26.5 10.4 6.6
5.4 13.9 31.5 31.7 10.9 6.7
100
100
100
100
100
100
100
100
Std.
Table 1: % Children in different types of schools 2011
151ASER 2011
School enrollment and out of school children
Young children in pre-school and school
% C
hild
ren
% C
hild
ren
% C
hild
ren
Chart 2: Trends over time% Children enrolled in private school by class 2007, 2009 & 2011
Chart 3: Trends over timeFive year olds in pre-school & school 2007, 2009 & 2011
Tota
l
In SchoolIn balwadi
oranganwadi
In LKG/UKG
Age 5
Age 6
Govt Pvt Other
29.9 5.1 41.8 19.1 1.3 2.9 100
5.0 2.1 68.9 20.3 2.3 1.4 100
Table 3: % Children age 5-6 who are enrolled in differenttypes of pre-school & school 2011
Not
enr
olle
dan
ywh
ere

Reading Tool
Madhya Pradesh RURAL
How to read this table: Each cell shows the highest level of reading achieved by a child.For example, in Std III, 12.7% children cannot even read letters, 33.8% can readletters but not more, 26.3% can read words but not Std 1 text or higher, 15.7% canread Std 1 text but not Std 2 level text, and 11.4% can read Std 2 level text. In sum, foreach class, the total of all these exclusive categories is 100%.
Std. NothingLevel 1
(Std 1 Text)Level 2
(Std 2 Text) Total
I
II
III
IV
V
VI
VII
VIII
Total
45.3 39.3 10.1 2.9 2.4 100
23.6 41.7 21.6 7.7 5.4 100
12.7 33.8 26.3 15.7 11.4 100
7.0 24.3 24.6 19.7 24.4 100
5.7 17.0 17.5 21.8 38.0 100
2.8 11.0 13.4 19.7 53.2 100
2.3 8.5 9.9 17.5 61.8 100
1.6 5.3 6.4 15.3 71.3 100
12.8 23.1 16.6 15.1 32.4 100
Chart 5: Trends over time% Children in Std V who CANNOT READ Std II LEVEL TEXTBy school type 2008-2011
Chart 4: Trends over time% Children in Std III who CANNOT READ Std I LEVEL TEXTBy school type 2008-2011
Letter Word
Table 4: % Children by class and READING levelAll schools 2011
Note : In ASER 2011 for every state, reading tools were provided in the main mediumof instruction in government schools. Children and their families were also askedabout the language they speak at home. For home languages, a list of 122 languageswas provided to all survey teams. This list includes 22 Scheduled languages and 100Non-Scheduled languages. The data in this table is for children for whom we haveinformation for both school language and home language.
Table 5: School language and home language
% Children whose :
Home language is the same as school language
Home language is different from school language
Total
%
152 ASER 2011
96.7
3.3
100.0
Home language and school language
Reading
% C
hild
ren
% C
hild
ren

Math Tool
How to read this table: Each cell shows the highest level of arithmetic achieved by achild. For example, in Std III, 13.6% children cannot even recognize numbers 1-9, 40.9%children can recognize numbers up to 9 but not more, 30.5% can recognize numbers to99 but cannot do subtraction, 11.6% can do subtraction but not division, and 3.5% cando division. In sum, for each class, the total of all these exclusive categories is 100%.
Std. Nothing Subtract Divide Total
I
II
III
IV
V
VI
VII
VIII
Total
47.8 41.3 8.0 1.8 1.1 100
24.7 47.0 21.6 4.9 1.8 100
13.6 40.9 30.5 11.6 3.5 100
7.1 31.5 32.3 21.3 7.8 100
6.0 21.3 28.1 26.9 17.7 100
2.8 16.2 24.0 29.1 27.9 100
2.8 12.0 21.2 29.7 34.3 100
2.1 7.4 16.8 27.9 45.9 100
13.5 27.7 23.1 19.0 16.7 100
Recognize Numbers11-991-9
Chart 7: Trends over time% Children in Std V who CANNOT DO DIVISIONBy school type 2008-2011
Chart 6: Trends over time% Children in Std III who CANNOT RECOGNISE NUMBERS upto100. By school type 2008-2011
Madhya Pradesh RURAL
Table 7: Class-wise % children attending PAID TUITION CLASSESBy school type 2007, 2009, 2010 and 2011
Note: In 2007, 2009, 2010 and 2011 the ASER survey recorded information abouttuition. In all 4 years, the question asked was the following: “Does the child take anypaid additional class currently?” Therefore, these numbers do not include anysupplemental help in learning that children may have received from parents, siblingsor from anyone else who did not require payment.
Year School I II III IV V VI VII VIII Total
2007
2009
2010
2011
Govt
Pvt
Govt
Pvt
Govt
Pvt
Govt
Pvt
Table 6: % Children by class and ARITHMETIC levelAll schools 2011
153ASER 2011
3.0 4.7 5.2 5.6 8.0 7.6 9.3 11.4 6.5
12.8 13.5 17.0 19.5 20.8 23.7 23.7 30.6 19.2
4.6 6.4 8.8 9.2 10.8 11.8 13.4 16.5 10.0
15.7 21.0 25.1 27.6 26.9 29.5 33.3 35.4 26.1
3.1 3.4 4.1 5.6 6.8 8.9 10.0 14.7 6.9
10.7 11.9 16.1 16.0 20.2 25.3 25.6 33.7 19.0
4.1 4.9 5.6 5.8 7.2 6.9 8.1 8.6 6.5
12.0 12.3 14.8 11.9 17.8 21.1 19.1 17.7 15.4
Arithmetic
Tuition
% C
hild
ren
% C
hild
ren

As part of ASER 2007, 2009, 2010 and 2011, in each sampled village, one government school with primary sections was visited on the day of the survey.
Information about schools in this report is based on these visits.
Madhya Pradesh RURAL
2007 2009 2010 2011 2007 2009 2010 2011
Std I-IV/V Std I-VII/VIIIType of school
% Enrolledchildren present(average)
% Schools with lessthan 50% enrolledchildren present(average)
% Schools with75% or moreenrolled childrenpresent (average)
2007 2009 2010 2011 2007 2009 2010 2011
Std I-IV/V Std I-VII/VIIIType of school
% Teachers present(average)
% Schools withno teacherspresent(average)
% Schools withall teacherspresent(average)
Std I-IV/V Std I-VII/VIII2010 2011 2010 2011
% Schools with:
No Headteacher appointed
Headteacher appointed but not present attime of visitHeadteacher appointed & present at timeof visit
Total
Std I-IV/V Std I-VII/VIII2010 2011 2010 2011
% Schools with:
No computer
Computers but no children using them onday of visitComputers & children using them on dayof visit
Total
2007Type of school
Std I-IV/V: Primary
Std I-VII/VIII: Primary + Upper primary
Total schools visited
2009 2010 2011
Table 8: Total schools visited 2007, 2009, 2010 and 2011
Table 9: Student attendance 2007, 2009, 2010 and 2011
Table 11: Headteachers 2010 & 2011 Table 12: Computers 2010 and 2011
Table 10: Teacher attendance 2007, 2009, 2010 and 2011
154 ASER 2011
0.7 4.5 0.8 5.7
7.4 6.8 11.9 13.5
91.9 88.7 87.3 80.7
100 100 100 100
95.2 95.4 89.0 86.8
3.7 3.5 8.5 10.0
1.1 1.1 2.6 3.2
100 100 100 100
921 936 709 843
334 293 510 352
1255 1229 1219 1195
67.0 68.0 65.9 54.5 64.9 66.4 67.6 50.9
14.9 11.9 15.3 38.7 19.6 14.0 10.4 48.6
37.5 36.1 33.2 19.3 34.6 30.8 30.5 15.1
91.3 92.7 88.5 87.5 85.5 89.5 87.1 82.7
0.0 0.0 0.3 0.5 0.0 0.0 0.2 0.9
76.9 80.0 68.9 69.6 50.7 61.9 51.4 49.5
2007 2009 2010 2011
Std I-IV/V
2007 2009 2010 2011
Std I-VII/VIII% Schools with:
Std II children sitting with one or more other classes
Table 13: Multigrade classes 2007, 2009, 2010 and 2011
72.3 72.5 68.9 76.3 76.3 63.4 63.8 71.8
61.8 62.2 59.9 71.0 59.7 52.6 53.9 66.4Std IV children sitting with one or more other classes
School observations
Other school information
Student and teacher attendance

Madhya Pradesh RURAL
How much goes toeach school For what purposes
SCHOOL DEVELOPMENT GRANT / SCHOOL GRANT
Rs.5000 per year perprimary school
Rs.7000 per year per upperprimary school
Rs 5000 + Rs 7000 =Rs 12000 if the school isStd I-VII/VIII.
Note: Primary and UpperPrimary schools are treatedas separate schools even ifthey are in the same pre-mises.
This grant can be used forbuying school equipmentsuch as blackboard, sittingmats etc. Also for buyingchalk, duster, registers andother office equipment.
The grant amount varies bytype of school: whether it isa primary or upper primaryschool.
SCHOOL MAINTENANCE GRANT
Rs.5000 - Rs 7500 perschool per year if the schoolhas upto 3 classrooms.
Rs 7500 - Rs.10000 per yearif the school has more than3 classrooms.
Primary and Upper Primaryschools are treated asseparate schools even ifthey are in the samebuilding.
TLM GRANT
This grant can be used byteachers to buy teachingaids, such as charts, globes,posters, models etc.
Rs.500 per teacher per yearin primary and upper pri-mary schools.
1 For more information see www.accountabilityinitiative.in
155ASER 2011
School funds and activities (PAISA)
This grant can be used formaintenance of schoolbuilding, includingwhitewashing;beautification; and repair oftoilets, hand pump,boundary wall, playgroundetc.
The grant amount dependson number of classrooms(excluding Headmasterroom and office room)
DID SCHOOLS GET THEIR MONEY ON TIME?
2008-2009 2009-2010 2010-2011SSA school
grants% Schools % Schools % SchoolsNo.
ofSch.
No.of
Sch.Yes No Don’tknow
DID SCHOOLS GET THEIR MONEY ON TIME?
April 2009 toOctober 2009
April 2010 toOctober 2010
April 2011 toOctober 2011
% Schools % Schools % SchoolsNo.of
Sch.
No.of
Sch.
No.of
Sch.Yes No Don’tknow
Type of Activity
Yes No Don'tknow
New Classroom
Repair of building (roof, floor, wall etc.)
Repair of doors & windows
Repair of boundary wall
Repair of drinking water facility
Repair of toilet
White wash/plastering
Painting Blackboard/Display Board/Painting on wall
Painting of doors & walls
Purchase of furniture (cupboard etc.)
Purchase of electrical fittings
Purchase of chalk, duster, register etc.
Purchase of sitting Mats/Tat Patti
Purchase of charts, globes & other teaching material
Expenditure on school events
Payment of bills (electricity, water, cleaning etc.)
Const.
Repairs
Painting
& White
Wash
Purchase
Other
Table 15: % Schools who report receiving SSA grants - Half financial year
Table 16: % Schools carrying out different activities since April 2010
Table 14: % Schools who report receiving SSA grants - Full financial year
% schools
Ma intenancegrantDeve lopmentgrant
TLM grant
Yes No Don’tknow
Yes No Don’tknow
SSA school
grants
Ma intenancegrantDeve lopmentgrant
TLM grant
Yes No Don’tknow
Yes No Don’tknow
1111 67.2 22.1 10.7 1101 84.7 5.7 9.6 1118 77.7 14.0 8.2
1031 50.7 37.3 11.9 1049 77.5 12.5 10.0 1077 65.3 24.2 10.5
1126 82.2 10.7 7.2 1071 87.9 5.5 6.6 1104 77.1 16.3 6.6
919 39.1 48.0 13.0 1040 56.1 26.5 17.4 1044 46.7 41.7 11.6
862 30.1 56.4 13.6 998 51.9 29.2 18.9 1001 41.1 46.5 12.5
925 52.3 37.6 10.1 1012 60.9 24.0 15.1 1016 38.6 50.7 10.7
18.9 76.8 4.3
51.6 44.3 4.1
44.7 51.5 3.8
26.2 69.8 4.0
30.5 65.7 3.7
31.3 65.0 3.6
77.7 19.4 2.9
75.8 21.5 2.8
68.1 28.8 3.1
35.7 60.0 4.3
16.5 79.3 4.2
89.0 8.1 2.9
82.0 15.0 3.0
74.4 22.3 3.3
74.1 21.8 4.1
32.9 61.4 5.7
No.of
Sch.
EVERY RURAL GOVERNMENT PRIMARY SCHOOLIS ENTITLED TO EACH OF THESE SSA GRANTSEVERY YEAR.
The PAISA section of ASER tracks receipt and spending
of Sarva Shiksha Abhiyan (SSA) grants at the school
level. This information is collected from schools visited
during the survey. This page reports proportion of
schools receiving the grants and carrying out specified
activities in the schools. More detailed analysis of the
PAISA data will be available in the PAISA 2011 report
which will be released in March 2012.1

Madhya Pradesh RURAL
Note : For schools with enrollment above 200children the PTR shall not exceed 40 excludingthe Head Teacher
As part of ASER 2010 and 2011, in each sampled village, onegovernment school with primary sections was visited on theday of the survey. During this school visit, RTE indicators wereobserved and are reported here.
Note: School observations for ASER 2011 looked at TLM for Std II and Std IV only.
2010 2011School
enrollment No. ofschools
No. ofschools
% ofschools
% ofschools
RTETeacherNorms
1-60
61-90
91-120
121-150
151-200
> 200
TOTAL
2011Schoolenrollment
2010
2
3
4
5
5 + HMsee note
2010
1
2
3
4
5
6
>=7
TOTAL
2011
Numberof
teachersNo.of
schools
No.of
schools
%of
schools
%of
schools
RTE norm:At least one
classroom perteacher
1
2
3
4
5
6
>=7
TOTAL
20112010
% Schools that do notmeet classroom to teacher
normsNumber ofteachers
% of schools with 2011
Building
DrinkingWater
Toilet
Girls Toilet
TLM
Library
MDM
Table 17: Schools by totalenrollment 2010 and 2011
Table 18: RTE norms: Pupil-teacherratio 2010 and 2011
Table 19: Schools by number ofteachers 2010 and 2011
Table 20: RTE norms: Teacher -classroom ratio 2010 and 2011
Table 21: % Schools meeting selected RTE norms on facilities 2010 & 2011
2010
1-60
61-90
91-120
121-150
151-200
> 200
TOTAL
156 ASER 2011
126 10.4 176 15.0
144 11.9 190 16.2
161 13.3 192 16.4
154 12.7 155 13.2
218 18.0 168 14.3
406 33.6 291 24.8
1209 100.0 1172 100.0
185 16.7 220 20.9
258 23.3 261 24.8
190 17.2 210 20.0
130 11.7 134 12.8
113 10.2 89 8.5
101 9.1 53 5.0
130 11.7 84 8.0
1107 100.0 1051 100.0
0.0 1.1
5.0 15.2
18.9 28.7
30.3 35.2
29.2 46.0
28.1 48.9
46.4 54.6
18.6 25.0
Right to Education indicators
Extracts from the Schedule of The Right of Children toFree and Compulsory Education Act 2009 Norms andstandards for a School (Sections 19 and 25)
Number of teachers in Std 1-5:� Admitted children No. of teachers
<= 60 261-90 391-120 4121-200 5> 150 5 + 1 Headteacher> 200 Pupil-Teacher Ratio
(excluding Headteacher)shall not exceed 40
School facilities:All weather building with:
� At least one classroom for every teacher� Office cum store cum headteacher’s room� Separate toilets for boys and girls� Safe and adequate drinking water facility to
all children� A kitchen where mid-day meal is cooked in
the school� Playground� Arrangements for securing the school
building by boundary wall or fencing.
Teaching learning equipmentshall be provided to each class as required.
LibraryThere shall be a library in each school providingnewspaper, magazines and books on all subjects,including story-books.
59.1 60.7
83.0 71.8
87.0 78.4
86.8 82.9
73.9 84.3
84.2 87.5
80.6 78.5
69.4 64.361.0 55.637.4 37.113.4 19.38.1 12.1
78.5 68.620.0 24.329.8 43.950.3 31.950.8 43.8
8.5 6.211.8 26.628.9 23.483.9 82.381.0 77.243.7 41.327.3 27.229.1 31.589.8 86.794.7 92.1
% Schools that donot meet PTR norms
Office/Store/Office cum storePlaygroundBoundary WallNo facility for drinking waterFacility but no drinking water availableDrinking water availableNo toilet facilityFacility but toilet not useableToilet useable% Schools with no separate provisions for girls toiletsOf schools with separate girls toilets, % schools whereToilet lockedToilet not useableToilet useableTeaching learning material in Std 2Teaching learning material in Std 4No libraryLibrary but no books being used by children on day of visitLibrary being used by children on day of visitKitchen shed for cooking midday mealMidday meal served in school on the day of visit

Maharashtra RURAL
Note: 'OTHER' includes children going to madarssa and EGS.‘NOT IN SCHOOL’ = dropped out + never enrolled.
How to read this table: If a child started school in Std I at age 6, she should be age 8 inStd 3. This table shows the age distribution for each class. For example, in Std III,32.9% children are 8 years old but there are also 4.7% who are 7 years old or younger,54.4% who are 9, 6.2% who are 10 years old, etc.
Chart 1: Trends over time% Children out of school by age group and gender 2006-2011
How to read this chart: For example, the proportion of girls (age 11-14) not in schoolhas changed from 6.1% in 2006 to 3% in 2007 to 2.6% in 2008 to 2% in 2009 to1.7% in 2010 to 1.8% in 2011
ALL ANALYSIS BASED ON DATA FROM HOUSEHOLDS. 31 OUT OF 33 DISTRICTS
TotalAge group Govt. Pvt. Other Not inSchool
68.2 30.3 0.5 1.1 100
59.5 38.4 0.4 1.8 100
85.6 13.2 0.5 0.7 100
84.7 14.0 0.6 0.7 100
86.7 12.2 0.5 0.6 100
49.5 48.7 0.3 1.5 100
49.4 49.0 0.3 1.3 100
50.0 48.0 0.3 1.8 100
25.1 69.6 0.4 5.0 100
26.9 68.3 0.3 4.6 100
23.4 70.7 0.6 5.4 100
Age: 6-14 ALL
Age: 7-16 ALL
Age: 7-10 ALL
Age: 7-10 BOYS
Age: 7-10 GIRLS
Age: 11-14 ALL
Age: 11-14 BOYS
Age: 11-14 GIRLS
Age: 15-16 ALL
Age: 15-16 BOYS
Age: 15-16 GIRLS
I
II
III
IV
V
VI
VII
VIII
Table 2: Sample description% Children in each class by age 2011
5 6 7 8 9 10 11 12 13 14 15 16 Total
7.6 56.9 30.9 4.6
6.6 37.1 51.2 5.1
4.7 32.9 54.4 6.2 1.8
4.3 31.4 54.9 7.4 2.0
3.6 30.9 54.8 8.3 2.3
4.7 31.1 54.3 7.7 2.2
5.6 35.1 48.6 8.7 2.0
2.1 6.0 33.8 48.7 7.7 1.7
100
100
100
100
100
100
100
100
Std.
Table 1: % Children in different types of schools 2011
157ASER 2011
School enrollment and out of school children
Young children in pre-school and school
% C
hild
ren
% C
hild
ren
% C
hild
ren
Chart 2: Trends over time% Children enrolled in private school by class 2007, 2009 & 2011
Chart 3: Trends over timeFive year olds in pre-school & school 2007, 2009 & 2011
Tota
l
In SchoolIn balwadi
oranganwadi
In LKG/UKG
Age 5
Age 6
Govt Pvt Other
59.1 11.7 19.0 8.5 0.5 1.2 100
13.6 4.7 70.3 10.0 0.7 0.8 100
Not
enr
olle
dan
ywh
ere
Table 3: % Children age 5-6 who are enrolled in differenttypes of pre-school & school 2011

Reading Tool
Maharashtra RURAL
How to read this table: Each cell shows the highest level of reading achieved by a child.For example, in Std III, 2.7% children cannot even read letters, 10.8% can read lettersbut not more, 22.9% can read words but not Std 1 text or higher, 37.4% can read Std1 text but not Std 2 level text, and 26.2% can read Std 2 level text. In sum, for eachclass, the total of all these exclusive categories is 100%.
Std. NothingLevel 1
(Std 1 Text)Level 2
(Std 2 Text) Total
I
II
III
IV
V
VI
VII
VIII
Total
13.1 48.6 29.7 6.3 2.4 100
4.5 21.9 42.2 22.6 8.8 100
2.7 10.8 22.9 37.4 26.2 100
0.9 5.0 13.0 33.5 47.6 100
1.1 3.4 7.2 24.8 63.5 100
0.8 2.3 5.0 18.1 73.8 100
0.9 1.5 3.0 13.1 81.6 100
0.4 0.9 2.1 10.8 85.9 100
3.0 11.5 15.5 21.2 48.9 100
Chart 5: Trends over time% Children in Std V who CANNOT READ Std II LEVEL TEXTBy school type 2008-2011
Chart 4: Trends over time% Children in Std III who CANNOT READ Std I LEVEL TEXTBy school type 2008-2011
Letter Word
Table 4: % Children by class and READING levelAll schools 2011
Note : In ASER 2011 for every state, reading tools were provided in the main mediumof instruction in government schools. Children and their families were also askedabout the language they speak at home. For home languages, a list of 122 languageswas provided to all survey teams. This list includes 22 Scheduled languages and 100Non-Scheduled languages. The data in this table is for children for whom we haveinformation for both school language and home language.
Table 5: School language and home language
% Children whose :
Home language is the same as school language
Home language is different from school language
Total
%
158 ASER 2011
86.1
13.9
100.0
Home language and school language
Reading
% C
hild
ren
% C
hild
ren

Math Tool
How to read this table: Each cell shows the highest level of arithmetic achieved by achild. For example, in Std III, 2.2% children cannot even recognize numbers 1-9, 18.4%children can recognize numbers up to 9 but not more, 43.2% can recognize numbers to99 but cannot do subtraction, 32.2% can do subtraction but not division, and 4.0% cando division. In sum, for each class, the total of all these exclusive categories is 100%.
Std. Nothing Subtract Divide Total
I
II
III
IV
V
VI
VII
VIII
Total
12.5 65.2 18.5 2.7 1.1 100
4.4 37.2 45.6 11.6 1.1 100
2.2 18.4 43.2 32.2 4.0 100
0.9 9.1 31.3 43.2 15.5 100
1.3 6.0 20.7 39.2 32.9 100
1.0 4.0 15.9 35.1 44.0 100
0.9 3.3 11.1 32.3 52.3 100
0.6 2.0 9.9 26.3 61.2 100
2.9 17.7 24.7 28.5 26.3 100
Recognize Numbers11-991-9
Chart 7: Trends over time% Children in Std V who CANNOT DO DIVISIONBy school type 2008-2011
Chart 6: Trends over time% Children in Std III who CANNOT RECOGNISE NUMBERS upto100. By school type 2008-2011
Maharashtra RURAL
Table 7: Class-wise % children attending PAID TUITION CLASSESBy school type 2007, 2009, 2010 and 2011
Note: In 2007, 2009, 2010 and 2011 the ASER survey recorded information abouttuition. In all 4 years, the question asked was the following: “Does the child take anypaid additional class currently?” Therefore, these numbers do not include anysupplemental help in learning that children may have received from parents, siblingsor from anyone else who did not require payment.
Year School I II III IV V VI VII VIII Total
2007
2009
2010
2011
Govt
Pvt
Govt
Pvt
Govt
Pvt
Govt
Pvt
Table 6: % Children by class and ARITHMETIC levelAll schools 2011
159ASER 2011
3.3 4.0 4.9 5.6 7.3 7.2 7.9 10.6 5.5
23.1 22.4 21.4 19.8 13.2 12.2 11.8 12.0 13.7
7.5 7.1 9.0 10.1 10.9 11.2 11.7 15.3 9.6
24.8 30.6 27.4 28.7 17.2 12.7 15.3 13.5 16.2
3.3 4.6 5.7 5.4 8.0 7.8 7.8 11.2 6.0
15.2 24.6 24.3 30.4 12.9 15.7 14.5 12.9 15.3
3.9 5.3 6.7 5.5 7.3 7.7 8.9 14.2 6.7
23.3 22.8 25.1 23.7 17.2 13.6 17.9 13.6 16.8
Arithmetic
Tuition
% C
hild
ren
% C
hild
ren

As part of ASER 2007, 2009, 2010 and 2011, in each sampled village, one government school with primary sections was visited on the day of the survey.
Information about schools in this report is based on these visits.
Maharashtra RURAL
2007 2009 2010 2011 2007 2009 2010 2011
Std I-IV/V Std I-VII/VIIIType of school
% Enrolledchildren present(average)
% Schools with lessthan 50% enrolledchildren present(average)
% Schools with75% or moreenrolled childrenpresent (average)
2007 2009 2010 2011 2007 2009 2010 2011
Std I-IV/V Std I-VII/VIIIType of school
% Teachers present(average)
% Schools withno teacherspresent(average)
% Schools withall teacherspresent(average)
Std I-IV/V Std I-VII/VIII2010 2011 2010 2011
% Schools with:
No Headteacher appointed
Headteacher appointed but not present attime of visitHeadteacher appointed & present at timeof visit
Total
Std I-IV/V Std I-VII/VIII2010 2011 2010 2011
% Schools with:
No computer
Computers but no children using them onday of visitComputers & children using them on dayof visit
Total
2007Type of school
Std I-IV/V: Primary
Std I-VII/VIII: Primary + Upper primary
Total schools visited
2009 2010 2011
Table 8: Total schools visited 2007, 2009, 2010 and 2011
Table 9: Student attendance 2007, 2009, 2010 and 2011
Table 11: Headteachers 2010 & 2011 Table 12: Computers 2010 and 2011
Table 10: Teacher attendance 2007, 2009, 2010 and 2011
160 ASER 2011
4.5 5.0 1.8 1.6
2.7 5.9 6.9 5.8
92.8 89.1 91.3 92.6
100 100 100 100
81.8 80.3 52.5 41.9
6.3 10.7 20.4 27.5
11.9 9.0 27.1 30.6
100 100 100 100
488 485 435 408
411 450 467 421
899 935 902 829
91.7 90.7 91.5 89.6 92.8 90.6 92.4 90.0
0.8 0.2 1.4 1.0 0.0 1.2 0.2 1.0
93.7 93.7 94.4 90.3 97.7 94.3 96.7 91.5
94.1 94.9 93.8 89.8 89.8 92.8 91.7 89.0
0.0 0.5 0.0 0.0 0.0 1.2 0.0 0.3
83.1 84.7 80.6 73.9 63.6 71.7 66.3 61.8
2007 2009 2010 2011
Std I-IV/V
2007 2009 2010 2011
Std I-VII/VIII% Schools with:
Std II children sitting with one or more other classes
Table 13: Multigrade classes 2007, 2009, 2010 and 2011
49.5 46.7 47.5 47.6 27.7 26.7 34.3 41.3
46.2 42.9 46.8 45.6 22.8 22.7 26.9 36.0Std IV children sitting with one or more other classes
School observations
Other school information
Student and teacher attendance

Maharashtra RURAL
How much goes toeach school For what purposes
SCHOOL DEVELOPMENT GRANT / SCHOOL GRANT
Rs.5000 per year perprimary school
Rs.7000 per year per upperprimary school
Rs 5000 + Rs 7000 =Rs 12000 if the school isStd I-VII/VIII.
Note: Primary and UpperPrimary schools are treatedas separate schools even ifthey are in the same pre-mises.
This grant can be used forbuying school equipmentsuch as blackboard, sittingmats etc. Also for buyingchalk, duster, registers andother office equipment.
The grant amount varies bytype of school: whether it isa primary or upper primaryschool.
SCHOOL MAINTENANCE GRANT
Rs.5000 - Rs 7500 perschool per year if the schoolhas upto 3 classrooms.
Rs 7500 - Rs.10000 per yearif the school has more than3 classrooms.
Primary and Upper Primaryschools are treated asseparate schools even ifthey are in the samebuilding.
TLM GRANT
This grant can be used byteachers to buy teachingaids, such as charts, globes,posters, models etc.
Rs.500 per teacher per yearin primary and upper pri-mary schools.
1 For more information see www.accountabilityinitiative.in
161ASER 2011
School funds and activities (PAISA)
This grant can be used formaintenance of schoolbuilding, includingwhitewashing;beautification; and repair oftoilets, hand pump,boundary wall, playgroundetc.
The grant amount dependson number of classrooms(excluding Headmasterroom and office room)
DID SCHOOLS GET THEIR MONEY ON TIME?
2008-2009 2009-2010 2010-2011SSA school
grants% Schools % Schools % SchoolsNo.
ofSch.
No.of
Sch.Yes No Don’tknow
DID SCHOOLS GET THEIR MONEY ON TIME?
April 2009 toOctober 2009
April 2010 toOctober 2010
April 2011 toOctober 2011
% Schools % Schools % SchoolsNo.of
Sch.
No.of
Sch.
No.of
Sch.Yes No Don’tknow
Type of Activity
Yes No Don'tknow
New Classroom
Repair of building (roof, floor, wall etc.)
Repair of doors & windows
Repair of boundary wall
Repair of drinking water facility
Repair of toilet
White wash/plastering
Painting Blackboard/Display Board/Painting on wall
Painting of doors & walls
Purchase of furniture (cupboard etc.)
Purchase of electrical fittings
Purchase of chalk, duster, register etc.
Purchase of sitting Mats/Tat Patti
Purchase of charts, globes & other teaching material
Expenditure on school events
Payment of bills (electricity, water, cleaning etc.)
Const.
Repairs
Painting
& White
Wash
Purchase
Other
Table 15: % Schools who report receiving SSA grants - Half financial year
Table 16: % Schools carrying out different activities since April 2010
Table 14: % Schools who report receiving SSA grants - Full financial year
% schools
Ma intenancegrantDeve lopmentgrant
TLM grant
Yes No Don’tknow
Yes No Don’tknow
SSA school
grants
Ma intenancegrantDeve lopmentgrant
TLM grant
Yes No Don’tknow
Yes No Don’tknow
868 93.9 3.1 3.0 772 92.1 2.5 5.4 777 92.4 3.2 4.4
778 80.3 16.7 3.0 747 89.6 4.3 6.2 753 76.1 17.7 6.2
896 97.9 0.8 1.3 770 95.2 1.2 3.6 765 93.5 2.9 3.7
789 82.0 14.3 3.7 733 65.4 27.2 7.5 734 65.7 29.3 5.0
712 73.5 23.0 3.5 715 64.1 28.5 7.4 707 57.6 37.1 5.4
806 88.1 9.6 2.4 735 69.4 24.8 5.9 719 66.3 29.4 4.3
21.7 76.1 2.2
50.3 47.4 2.2
54.0 44.3 1.7
23.6 74.1 2.3
53.2 44.5 2.2
52.2 45.9 2.0
66.1 31.9 2.0
75.6 22.7 1.7
58.4 39.5 2.1
35.7 62.4 2.0
43.0 54.1 2.9
92.9 5.7 1.4
54.8 42.5 2.8
78.6 19.5 2.0
69.3 26.7 4.0
39.7 54.8 5.5
No.of
Sch.
EVERY RURAL GOVERNMENT PRIMARY SCHOOLIS ENTITLED TO EACH OF THESE SSA GRANTSEVERY YEAR.
The PAISA section of ASER tracks receipt and spending
of Sarva Shiksha Abhiyan (SSA) grants at the school
level. This information is collected from schools visited
during the survey. This page reports proportion of
schools receiving the grants and carrying out specified
activities in the schools. More detailed analysis of the
PAISA data will be available in the PAISA 2011 report
which will be released in March 2012.1

Maharashtra RURAL
Note : For schools with enrollment above 200children the PTR shall not exceed 40 excludingthe Head Teacher
As part of ASER 2010 and 2011, in each sampled village, onegovernment school with primary sections was visited on theday of the survey. During this school visit, RTE indicators wereobserved and are reported here.
Note: School observations for ASER 2011 looked at TLM for Std II and Std IV only.
2010 2011School
enrollment No. ofschools
No. ofschools
% ofschools
% ofschools
RTETeacherNorms
1-60
61-90
91-120
121-150
151-200
> 200
TOTAL
2011Schoolenrollment
2010
2
3
4
5
5 + HMsee note
2010
1
2
3
4
5
6
>=7
TOTAL
2011
Numberof
teachersNo.of
schools
No.of
schools
%of
schools
%of
schools
RTE norm:At least one
classroom perteacher
1
2
3
4
5
6
>=7
TOTAL
20112010
% Schools that do notmeet classroom to teacher
normsNumber ofteachers
% of schools with 2011
Building
DrinkingWater
Toilet
Girls Toilet
TLM
Library
MDM
Table 17: Schools by totalenrollment 2010 and 2011
Table 18: RTE norms: Pupil-teacherratio 2010 and 2011
Table 19: Schools by number ofteachers 2010 and 2011
Table 20: RTE norms: Teacher -classroom ratio 2010 and 2011
Table 21: % Schools meeting selected RTE norms on facilities 2010 & 2011
2010
1-60
61-90
91-120
121-150
151-200
> 200
TOTAL
162 ASER 2011
148 16.7 170 21.0
91 10.3 86 10.6
83 9.4 78 9.6
99 11.2 91 11.2
146 16.5 145 17.9
319 36.0 241 29.7
886 100.0 811 100.0
65 8.2 72 9.8
111 13.9 118 16.1
74 9.3 69 9.4
93 11.7 68 9.3
72 9.0 74 10.1
110 13.8 110 15.0
273 34.2 221 30.2
798 100.0 732 100.0
0.0 0.0
6.2 10.0
14.1 12.3
4.9 15.0
10.3 30.0
26.8 29.4
14.9 22.2
12.4 18.2
Right to Education indicators
Extracts from the Schedule of The Right of Children toFree and Compulsory Education Act 2009 Norms andstandards for a School (Sections 19 and 25)
Number of teachers in Std 1-5:� Admitted children No. of teachers
<= 60 261-90 391-120 4121-200 5> 150 5 + 1 Headteacher> 200 Pupil-Teacher Ratio
(excluding Headteacher)shall not exceed 40
School facilities:All weather building with:
� At least one classroom for every teacher� Office cum store cum headteacher’s room� Separate toilets for boys and girls� Safe and adequate drinking water facility to
all children� A kitchen where mid-day meal is cooked in
the school� Playground� Arrangements for securing the school
building by boundary wall or fencing.
Teaching learning equipmentshall be provided to each class as required.
LibraryThere shall be a library in each school providingnewspaper, magazines and books on all subjects,including story-books.
41.4 39.3
45.8 36.5
44.9 41.3
47.7 50.6
41.8 22.3
36.4 36.9
41.2 37.1
34.2 33.485.0 82.557.6 58.218.7 16.712.3 10.269.0 73.12.9 3.1
44.1 52.153.0 44.913.7 9.0
32.3 34.410.8 14.143.2 42.697.2 96.494.7 95.914.0 16.219.6 29.566.5 54.378.3 74.990.7 95.8
% Schools that donot meet PTR norms
Office/Store/Office cum storePlaygroundBoundary WallNo facility for drinking waterFacility but no drinking water availableDrinking water availableNo toilet facilityFacility but toilet not useableToilet useable% Schools with no separate provisions for girls toiletsOf schools with separate girls toilets, % schools whereToilet lockedToilet not useableToilet useableTeaching learning material in Std 2Teaching learning material in Std 4No libraryLibrary but no books being used by children on day of visitLibrary being used by children on day of visitKitchen shed for cooking midday mealMidday meal served in school on the day of visit

Manipur RURAL
Note: 'OTHER' includes children going to madarssa and EGS.‘NOT IN SCHOOL’ = dropped out + never enrolled.
How to read this table: If a child started school in Std I at age 6, she should be age 8 inStd 3. This table shows the age distribution for each class. For example, in Std III,31.1% children are 8 years old but there are also 11.0% who are 7, 19.0 % who are9, 19.3% who are 10 years old, etc.
Chart 1: Trends over time% Children out of school by age group and gender 2006-2011
How to read this chart: For example, the proportion of girls (age 11-14) not in schoolhas changed from 5.9% in 2006 to 7.1% in 2007 to 4.6% in 2008 to 2.3% in 2009to 3.3% in 2010 to 1.7% in 2011
ALL ANALYSIS BASED ON DATA FROM HOUSEHOLDS. 8 OUT OF 9 DISTRICTS
TotalAge group Govt. Pvt. Other Not inSchool
27.7 71.1 0.1 1.1 100
26.9 71.0 0.1 2.0 100
29.5 69.7 0.1 0.7 100
29.4 69.8 0.0 0.8 100
29.6 69.7 0.1 0.7 100
24.8 73.5 0.1 1.6 100
25.3 73.1 0.2 1.4 100
24.2 74.0 0.1 1.7 100
23.3 67.6 0.4 8.7 100
21.0 67.1 0.6 11.3 100
25.6 68.0 0.2 6.2 100
Age: 6-14 ALL
Age: 7-16 ALL
Age: 7-10 ALL
Age: 7-10 BOYS
Age: 7-10 GIRLS
Age: 11-14 ALL
Age: 11-14 BOYS
Age: 11-14 GIRLS
Age: 15-16 ALL
Age: 15-16 BOYS
Age: 15-16 GIRLS
I
II
III
IV
V
VI
VII
VIII
Table 2: Sample description% Children in each class by age 2011
5 6 7 8 9 10 11 12 13 14 15 16 Total
17.0 38.5 21.8 14.4 8.3
3.3 11.3 25.9 31.3 13.9 8.9 5.4
4.2 11.0 31.1 19.0 19.3 5.8 6.3 3.4
5.4 8.6 25.5 30.1 11.9 11.4 7.1
5.6 6.7 34.3 19.2 14.4 10.3 7.4 2.2
4.1 11.8 20.4 31.2 18.3 8.1 6.2
8.7 37.5 29.8 16.0 8.0
3.4 11.4 31.4 31.1 16.3 6.4
100
100
100
100
100
100
100
100
Std.
Table 1: % Children in different types of schools 2011
163ASER 2011
School enrollment and out of school children
Young children in pre-school and school
% C
hild
ren
% C
hild
ren
% C
hild
ren
Chart 2: Trends over time% Children enrolled in private school by class 2007, 2009 & 2011
Chart 3: Trends over timeFive year olds in pre-school & school 2007, 2009 & 2011
Tota
l
In SchoolIn balwadi
oranganwadi
In LKG/UKG
Age 5
Age 6
Govt Pvt Other
7.0 52.0 12.3 27.8 0.0 0.9 100
1.6 26.5 22.8 48.4 0.0 0.9 100
Not
enr
olle
dan
ywh
ere
Table 3: % Children age 5-6 who are enrolled in differenttypes of pre-school & school 2011

Reading Tool
Manipur RURAL
How to read this table: Each cell shows the highest level of reading achieved by a child.For example, in Std III, 0.8% children cannot even read letters, 8.1% can read lettersbut not more, 24.1% can read words but not Std 1 text or higher, 31.4% can read Std1 text but not Std 2 level text, and 35.6% can read Std 2 level text. In sum, for eachclass, the total of all these exclusive categories is 100%.
Std. NothingLevel 1
(Std 1 Text)Level 2
(Std 2 Text) Total
I
II
III
IV
V
VI
VII
VIII
Total
4.0 46.7 33.2 8.6 7.4 100
1.8 16.8 43.3 21.3 16.8 100
0.8 8.1 24.1 31.4 35.6 100
0.9 7.8 14.1 26.2 51.1 100
0.2 4.9 8.4 15.2 71.3 100
0.6 3.1 4.8 13.4 78.1 100
0.8 2.0 3.6 7.8 85.9 100
0.2 0.4 1.1 8.1 90.1 100
1.3 13.1 18.7 17.3 49.6 100
Chart 5: Trends over time% Children in Std V who CANNOT READ Std II LEVEL TEXTBy school type 2008-2011
Chart 4: Trends over time% Children in Std III who CANNOT READ Std I LEVEL TEXTBy school type 2008-2011
Letter Word
Table 4: % Children by class and READING levelAll schools 2011
164 ASER 2011
Home language and school language
Reading
% C
hild
ren
% C
hild
ren
Note: In ASER 2011 for every state, reading tools were provided in the main medium of instruction in government schools. In Manipur, where the medium of instruction in governmentschools is English or Manipuri, children were given the choice of reading in English, Manipuri or Meitei Mayek. Figures of Meitei Mayek have not been included due to insufficient data.For home languages, a list of 122 languages was provided to all survey teams. This includes 22 Scheduled languages and 100 Non-Scheduled languages. The data in this table is forchildren for whom we have information for both school language and home language.
Table 5: School language and home language
Of the % Children who
tested in:
% Children whose home language was:
* 'Other' includes all languages from the list of scheduled and non-scheduled languages except those specified above. Data forhome language of children tested in Manipuri has not been reported here due to small cell sizes.
Manipuri Tangkhul Kuki Hmar Kabui Paite Anal Other * Total
English 53.8 15.0 7.0 4.3 2.9 2.9 1.9 12.2 10098.0
2.0
100.0
English
Manipuri
Total
%Children who took the
reading test in:
%
Note: This tool was also available in Metei Mayek and Manipuri.

Math Tool
How to read this table: Each cell shows the highest level of arithmetic achieved by achild. For example, in Std III, 0.8% children cannot even recognize numbers 1-9, 4.6%children can recognize numbers up to 9 but not more, 38.8% can recognize numbers to99 but cannot do subtraction, 39.5% can do subtraction but not division, and 16.4% cando division. In sum, for each class, the total of all these exclusive categories is 100%.
Std. Nothing Subtract Divide Total
I
II
III
IV
V
VI
VII
VIII
Total
5.2 33.1 53.3 7.1 1.4 100
2.0 10.3 57.8 24.7 5.2 100
0.8 4.6 38.8 39.5 16.4 100
1.0 3.4 20.8 45.5 29.3 100
0.2 2.3 9.7 38.2 49.6 100
0.5 1.2 6.9 28.5 62.9 100
0.8 0.5 6.1 17.0 75.7 100
0.2 0.6 3.2 14.1 81.9 100
1.5 8.3 27.7 27.5 35.0 100
Recognize Numbers11-991-9
Chart 7: Trends over time% Children in Std V who CANNOT DO DIVISIONBy school type 2008-2011
Chart 6: Trends over time% Children in Std III who CANNOT RECOGNISE NUMBERS upto100. By school type 2008-2011
Manipur RURAL
Table 7: Class-wise % children attending PAID TUITION CLASSESBy school type 2007, 2009, 2010 and 2011
Note: In 2007, 2009, 2010 and 2011 the ASER survey recorded information abouttuition. In all 4 years, the question asked was the following: “Does the child take anypaid additional class currently?” Therefore, these numbers do not include anysupplemental help in learning that children may have received from parents, siblingsor from anyone else who did not require payment.
Year School I II III IV V VI VII VIII Total
2007
2009
2010
2011
Govt
Pvt
Govt
Pvt
Govt
Pvt
Govt
Pvt
Table 6: % Children by class and ARITHMETIC levelAll schools 2011
165ASER 2011
17.2 18.0 19.5 26.0 24.1 26.6 28.9 35.3 22.3
43.6 52.4 53.1 53.7 58.6 53.5 59.2 59.9 54.0
12.0 18.8 16.0 17.1 17.6 21.6 15.2 29.7 18.2
42.4 46.0 49.5 50.7 45.7 49.9 51.8 55.2 48.5
9.9 13.2 11.3 14.7 16.9 16.4 15.4 27.6 15.0
38.9 41.3 49.2 51.9 48.6 52.9 59.3 61.7 49.9
11.0 15.3 13.2 12.5 13.6 23.2 20.8 19.8 15.1
43.0 43.3 43.7 51.3 52.4 50.4 52.6 57.2 48.8
Arithmetic
Tuition
% C
hild
ren
% C
hild
ren

As part of ASER 2007, 2009, 2010 and 2011, in each sampled village, one government school with primary sections was visited on the day of the survey.
Information about schools in this report is based on these visits.
Manipur RURAL
2007 2009 2010 2011 2007 2009 2010 2011
Std I-IV/V Std I-VII/VIIIType of school
% Enrolledchildren present(average)
% Schools with lessthan 50% enrolledchildren present(average)
% Schools with75% or moreenrolled childrenpresent (average)
2007 2009 2010 2011 2007 2009 2010 2011
Std I-IV/V Std I-VII/VIIIType of school
% Teachers present(average)
% Schools withno teacherspresent(average)
% Schools withall teacherspresent(average)
Std I-IV/V Std I-VII/VIII2010 2011 2010 2011
% Schools with:
No Headteacher appointed
Headteacher appointed but not present attime of visitHeadteacher appointed & present at timeof visit
Total
Std I-IV/V Std I-VII/VIII2010 2011 2010 2011
% Schools with:
No computer
Computers but no children using them onday of visitComputers & children using them on dayof visit
Total
2007Type of school
Std I-IV/V: Primary
Std I-VII/VIII: Primary + Upper primary
Total schools visited
2009 2010 2011
Table 8: Total schools visited 2007, 2009, 2010 and 2011
Table 9: Student attendance 2007, 2009, 2010 and 2011
Table 11: Headteachers 2010 & 2011 Table 12: Computers 2010 and 2011
Table 10: Teacher attendance 2007, 2009, 2010 and 2011
166 ASER 2011
2.7 0.0 0.0 0.0
28.0 15.0 31.6 16.0
69.3 85.0 68.4 84.0
100 100 100 100
97.8 97.9 70.4 81.8
0.0 2.1 25.9 12.1
2.2 0.0 3.7 6.1
100 100 100 100
111 107 97 99
36 35 28 34
147 142 125 133
76.7 74.0 66.1 52.3 80.0 79.7 71.3 56.8
13.0 14.1 17.2 42.6 11.8 7.7 11.1 27.3
62.0 64.1 38.7 13.8 73.5 76.9 44.4 15.2
90.2 82.9 70.8 78.5 80.4 71.8 75.1 72.0
0.0 1.0 0.0 0.0 3.1 3.5 0.0 0.0
63.7 50.0 27.3 42.6 28.1 17.2 30.8 20.6
2007 2009 2010 2011
Std I-IV/V
2007 2009 2010 2011
Std I-VII/VIII% Schools with:
Std II children sitting with one or more other classes
Table 13: Multigrade classes 2007, 2009, 2010 and 2011
22.9 28.2 40.7 47.6 5.7 22.6 28.0 36.7
14.7 26.5 35.2 37.0 8.8 21.9 20.0 26.7Std IV children sitting with one or more other classes
School observations
Other school information
Student and teacher attendance

Manipur RURAL
How much goes toeach school For what purposes
SCHOOL DEVELOPMENT GRANT / SCHOOL GRANT
Rs.5000 per year perprimary school
Rs.7000 per year per upperprimary school
Rs 5000 + Rs 7000 =Rs 12000 if the school isStd I-VII/VIII.
Note: Primary and UpperPrimary schools are treatedas separate schools even ifthey are in the same pre-mises.
This grant can be used forbuying school equipmentsuch as blackboard, sittingmats etc. Also for buyingchalk, duster, registers andother office equipment.
The grant amount varies bytype of school: whether it isa primary or upper primaryschool.
SCHOOL MAINTENANCE GRANT
Rs.5000 - Rs 7500 perschool per year if the schoolhas upto 3 classrooms.
Rs 7500 - Rs.10000 per yearif the school has more than3 classrooms.
Primary and Upper Primaryschools are treated asseparate schools even ifthey are in the samebuilding.
TLM GRANT
This grant can be used byteachers to buy teachingaids, such as charts, globes,posters, models etc.
Rs.500 per teacher per yearin primary and upper pri-mary schools.
1 For more information see www.accountabilityinitiative.in
167ASER 2011
School funds and activities (PAISA)
This grant can be used formaintenance of schoolbuilding, includingwhitewashing;beautification; and repair oftoilets, hand pump,boundary wall, playgroundetc.
The grant amount dependson number of classrooms(excluding Headmasterroom and office room)
DID SCHOOLS GET THEIR MONEY ON TIME?
2008-2009 2009-2010 2010-2011SSA school
grants% Schools % Schools % SchoolsNo.
ofSch.
No.of
Sch.Yes No Don’tknow
DID SCHOOLS GET THEIR MONEY ON TIME?
April 2009 toOctober 2009
April 2010 toOctober 2010
April 2011 toOctober 2011
% Schools % Schools % SchoolsNo.of
Sch.
No.of
Sch.
No.of
Sch.Yes No Don’tknow
Type of Activity
Yes No Don'tknow
New Classroom
Repair of building (roof, floor, wall etc.)
Repair of doors & windows
Repair of boundary wall
Repair of drinking water facility
Repair of toilet
White wash/plastering
Painting Blackboard/Display Board/Painting on wall
Painting of doors & walls
Purchase of furniture (cupboard etc.)
Purchase of electrical fittings
Purchase of chalk, duster, register etc.
Purchase of sitting Mats/Tat Patti
Purchase of charts, globes & other teaching material
Expenditure on school events
Payment of bills (electricity, water, cleaning etc.)
Const.
Repairs
Painting
& White
Wash
Purchase
Other
Table 15: % Schools who report receiving SSA grants - Half financial year
Table 16: % Schools carrying out different activities since April 2010
Table 14: % Schools who report receiving SSA grants - Full financial year
% schools
Ma intenancegrantDeve lopmentgrant
TLM grant
Yes No Don’tknow
Yes No Don’tknow
SSA school
grants
Ma intenancegrantDeve lopmentgrant
TLM grant
Yes No Don’tknow
Yes No Don’tknow
123 65.0 34.2 0.8 107 66.4 10.3 23.4 120 66.7 10.8 22.5
112 49.1 50.0 0.9 107 56.1 15.9 28.0 117 55.6 19.7 24.8
125 74.4 25.6 0.0 106 73.6 7.6 18.9 123 68.3 9.8 22.0
106 34.0 49.1 17.0 98 24.5 50.0 25.5 97 11.3 54.6 34.0
99 23.2 55.6 21.2 97 21.7 51.6 26.8 94 9.6 55.3 35.1
105 37.1 48.6 14.3 95 24.2 53.7 22.1 96 9.4 57.3 33.3
96.8 1.6 1.6
96.9 1.6 1.6
98.4 0.0 1.6
98.0 0.0 2.0
98.2 0.0 1.9
96.8 1.6 1.6
97.9 2.1 0.0
98.3 1.7 0.0
97.7 2.3 0.0
94.5 4.1 1.4
98.0 0.0 2.0
100.0 0.0 0.0
100.0 0.0 0.0
100.0 0.0 0.0
100.0 0.0 0.0
100.0 0.0 0.0
No.of
Sch.
EVERY RURAL GOVERNMENT PRIMARY SCHOOLIS ENTITLED TO EACH OF THESE SSA GRANTSEVERY YEAR.
The PAISA section of ASER tracks receipt and spending
of Sarva Shiksha Abhiyan (SSA) grants at the school
level. This information is collected from schools visited
during the survey. This page reports proportion of
schools receiving the grants and carrying out specified
activities in the schools. More detailed analysis of the
PAISA data will be available in the PAISA 2011 report
which will be released in March 2012.1

Manipur RURAL
Note : For schools with enrollment above 200children the PTR shall not exceed 40 excludingthe Head Teacher
As part of ASER 2010 and 2011, in each sampled village, onegovernment school with primary sections was visited on theday of the survey. During this school visit, RTE indicators wereobserved and are reported here.
Note: School observations for ASER 2011 looked at TLM for Std II and Std IV only.
2010 2011School
enrollment No. ofschools
No. ofschools
% ofschools
% ofschools
RTETeacherNorms
1-60
61-90
91-120
121-150
151-200
> 200
TOTAL
2011Schoolenrollment
2010
2
3
4
5
5 + HMsee note
2010
1
2
3
4
5
6
>=7
TOTAL
2011
Numberof
teachersNo.of
schools
No.of
schools
%of
schools
%of
schools
RTE norm:At least one
classroom perteacher
1
2
3
4
5
6
>=7
TOTAL
20112010
% Schools that do notmeet classroom to teacher
normsNumber ofteachers
% of schools with 2011
Building
DrinkingWater
Toilet
Girls Toilet
TLM
Library
MDM
Table 17: Schools by totalenrollment 2010 and 2011
Table 18: RTE norms: Pupil-teacherratio 2010 and 2011
Table 19: Schools by number ofteachers 2010 and 2011
Table 20: RTE norms: Teacher -classroom ratio 2010 and 2011
Table 21: % Schools meeting selected RTE norms on facilities 2010 & 2011
1-60
61-90
91-120
121-150
151-200
> 200
TOTAL
168 ASER 2011
43 35.3 56 43.8
22 18.0 21 16.4
22 18.0 23 18.0
15 12.3 13 10.2
11 9.0 6 4.7
9 7.4 9 7.0
122 100.0 128 100.0
3 2.7 6 5.0
12 10.9 7 5.8
12 10.9 13 10.8
15 13.6 9 7.5
23 20.9 25 20.8
12 10.9 12 10.0
33 30.0 48 40.0
110 100.0 120 100.0
0.0 0.0
22.2 20.0
33.3 50.0
16.7 83.3
33.3 81.3
75.0 16.7
75.0 68.0
37.5 58.6
Right to Education indicators
2010
Extracts from the Schedule of The Right of Children toFree and Compulsory Education Act 2009 Norms andstandards for a School (Sections 19 and 25)
Number of teachers in Std 1-5:� Admitted children No. of teachers
<= 60 261-90 391-120 4121-200 5> 150 5 + 1 Headteacher> 200 Pupil-Teacher Ratio
(excluding Headteacher)shall not exceed 40
School facilities:All weather building with:
� At least one classroom for every teacher� Office cum store cum headteacher’s room� Separate toilets for boys and girls� Safe and adequate drinking water facility to
all children� A kitchen where mid-day meal is cooked in
the school� Playground� Arrangements for securing the school
building by boundary wall or fencing.
Teaching learning equipmentshall be provided to each class as required.
LibraryThere shall be a library in each school providingnewspaper, magazines and books on all subjects,including story-books.
0.0 9.1
20.0 5.9
42.1 21.7
64.3 9.1
37.5 0.0
44.4 25.0
25.7 11.9
68.1 66.472.3 41.711.1 6.484.6 87.310.3 6.45.1 6.4
21.4 31.338.5 33.640.2 35.278.5 64.7
4.7 5.98.4 14.18.4 15.3
48.7 23.038.4 20.690.8 92.93.4 5.55.9 1.6
59.2 43.947.8 29.8
% Schools that donot meet PTR norms
Office/Store/Office cum storePlaygroundBoundary WallNo facility for drinking waterFacility but no drinking water availableDrinking water availableNo toilet facilityFacility but toilet not useableToilet useable% Schools with no separate provisions for girls toiletsOf schools with separate girls toilets, % schools whereToilet lockedToilet not useableToilet useableTeaching learning material in Std 2Teaching learning material in Std 4No libraryLibrary but no books being used by children on day of visitLibrary being used by children on day of visitKitchen shed for cooking midday mealMidday meal served in school on the day of visit

Meghalaya RURAL
Note: 'OTHER' includes children going to madarssa and EGS.‘NOT IN SCHOOL’ = dropped out + never enrolled.
How to read this table: If a child started school in Std I at age 6, she should be age 8 inStd 3. This table shows the age distribution for each class. For example, in Std III,13.6% children are 8 years old but there are also 5.9% who are 7 years old or younger,19.1% who are 9, 18.0% who are 10 years old, etc.
Chart 1: Trends over time% Children out of school by age group and gender 2006-2011
How to read this chart: For example, the proportion of girls (age 11-14) not in schoolhas changed from 5.4% in 2006 to 6.4% in 2007 to 2.7% in 2008 to 4.4% in 2009to 6.8% in 2010 to 4.7% in 2011
ALL ANALYSIS BASED ON DATA FROM HOUSEHOLDS. 6 OUT OF 7 DISTRICTS
TotalAge group Govt. Pvt. Other Not inSchool
38.6 54.3 1.3 5.8 100
38.1 52.4 1.2 8.2 100
39.8 55.0 1.3 4.0 100
42.8 51.0 1.1 5.1 100
36.6 59.2 1.4 2.9 100
37.7 53.1 1.4 7.8 100
39.7 48.0 1.3 11.0 100
35.7 58.1 1.5 4.7 100
35.3 45.0 0.7 19.0 100
38.9 38.5 0.3 22.2 100
31.7 51.6 1.0 15.7 100
Age: 6-14 ALL
Age: 7-16 ALL
Age: 7-10 ALL
Age: 7-10 BOYS
Age: 7-10 GIRLS
Age: 11-14 ALL
Age: 11-14 BOYS
Age: 11-14 GIRLS
Age: 15-16 ALL
Age: 15-16 BOYS
Age: 15-16 GIRLS
I
II
III
IV
V
VI
VII
VIII
Table 2: Sample description% Children in each class by age 2011
5 6 7 8 9 10 11 12 13 14 15 16 Total
8.0 17.7 19.8 20.9 10.7 11.1 3.4 8.5
6.5 13.2 21.8 17.1 17.1 7.9 8.9 7.6
5.9 13.6 19.1 18.0 14.8 12.3 7.8 8.5
4.8 12.7 24.4 13.7 17.4 9.6 7.6 5.7 4.2
4.3 11.9 16.9 21.8 16.3 11.1 10.7 7.0
4.4 10.5 20.4 21.1 20.5 15.9 7.3
4.4 17.5 21.5 27.7 16.9 12.1
7.0 19.1 30.4 25.3 18.2
100
100
100
100
100
100
100
100
Std.
Table 1: % Children in different types of schools 2011
169ASER 2011
School enrollment and out of school children
Young children in pre-school and school
% C
hild
ren
% C
hild
ren
% C
hild
ren
Chart 2: Trends over time% Children enrolled in private school by class 2007, 2009 & 2011
Chart 3: Trends over timeFive year olds in pre-school & school 2007, 2009 & 2011
Tota
l
In SchoolIn balwadi
oranganwadi
In LKG/UKG
Age 5
Age 6
Govt Pvt Other
9.1 9.1 29.0 44.6 0.7 7.4 100
4.0 10.1 31.7 48.4 1.1 4.7 100
Not
enr
olle
dan
ywh
ere
Table 3: % Children age 5-6 who are enrolled in differenttypes of pre-school & school 2011

Reading Tool
Meghalaya RURAL
How to read this table: Each cell shows the highest level of reading achieved by a child.For example, in Std III, 6.2% children cannot even read letters, 7.2% can read lettersbut not more, 38.3% can read words but not Std 1 text or higher, 20.7% can read Std1 text but not Std 2 level text, and 27.5% can read Std 2 level text. In sum, for eachclass, the total of all these exclusive categories is 100%.
Std. NothingLevel 1
(Std 1 Text)Level 2
(Std 2 Text) Total
I
II
III
IV
V
VI
VII
VIII
Total
17.5 33.5 36.8 8.0 4.2 100
9.4 18.7 39.2 19.6 13.1 100
6.2 7.2 38.3 20.7 27.5 100
4.1 5.4 24.9 29.2 36.4 100
4.8 3.4 14.9 23.5 53.5 100
4.2 5.4 10.2 24.2 56.0 100
4.2 2.2 4.5 17.2 71.9 100
2.2 6.2 2.5 6.0 83.2 100
8.1 13.3 26.7 18.7 33.3 100
Chart 5: Trends over time% Children in Std V who CANNOT READ Std II LEVEL TEXTBy school type 2008-2011
Chart 4: Trends over time% Children in Std III who CANNOT READ Std I LEVEL TEXTBy school type 2008-2011
Letter Word
Table 4: % Children by class and READING levelAll schools 2011
170 ASER 2011
Home language and school language
Reading
% C
hild
ren
% C
hild
ren
Note: In ASER 2011 for every state, reading tools were provided in the main medium of instruction in government schools. In Meghalaya, where the medium of instruction ingovernment schools is Garo, Khasi or English, children were given the choice of reading in any one of these languages. Figures for Garo and Khasi have been combined. For homelanguages, a list of 122 languages was provided to all survey teams. This included 22 Scheduled languages and 100 Non-Scheduled languages. The data in this table is for children forwhom we have information for both school language and home language.
Table 5: School language and home language
% Children whose :
Home language is the same as school language
%
Garo / Khasi
English
TotalTotal
Home language is different from school
language
% Children
who took the
reading test in:
Of Children whose school language was Garo or Khasi: %
52.7
47.3
100
51.7
48.3
100
Garo / Khasi
English
Of the % Children
who tested in:
% Children whose
home language was:
Garo Khasi Maram Other * Total
31.5 21.6 9.8 37.2 100
16.3 51.4 4.9 27.4 100
* 'Other' includes all languages from the list of scheduled and non-scheduledlanguages except those specified above.
Note: This tool was also available in Garo and English.

Math Tool
How to read this table: Each cell shows the highest level of arithmetic achieved by achild. For example, in Std III, 6.5% children cannot even recognize numbers 1-9, 20.6%children can recognize numbers up to 9 but not more, 41.5% can recognize numbers to99 but cannot do subtraction, 28.4% can do subtraction but not division, and 3.1% cando division. In sum, for each class, the total of all these exclusive categories is 100%.
Std. Nothing Subtract Divide Total
I
II
III
IV
V
VI
VII
VIII
Total
13.5 43.4 39.0 3.8 0.4 100
6.7 32.9 47.7 11.1 1.6 100
6.5 20.6 41.5 28.4 3.1 100
5.1 14.3 38.3 32.7 9.6 100
4.8 10.9 20.5 42.5 21.3 100
4.7 12.1 18.0 36.6 28.7 100
4.4 4.7 16.4 27.5 47.1 100
2.2 8.4 6.4 19.1 64.0 100
7.0 22.8 33.4 22.8 14.1 100
Recognize Numbers11-991-9
Chart 7: Trends over time% Children in Std V who CANNOT DO DIVISIONBy school type 2008-2011
Chart 6: Trends over time% Children in Std III who CANNOT RECOGNISE NUMBERS upto100. By school type 2008-2011
Meghalaya RURAL
Table 7: Class-wise % children attending PAID TUITION CLASSESBy school type 2007, 2009, 2010 and 2011
Note: In 2007, 2009, 2010 and 2011 the ASER survey recorded information abouttuition. In all 4 years, the question asked was the following: “Does the child take anypaid additional class currently?” Therefore, these numbers do not include anysupplemental help in learning that children may have received from parents, siblingsor from anyone else who did not require payment.
Year School I II III IV V VI VII VIII Total
2007
2009
2010
2011
Govt
Pvt
Govt
Pvt
Govt
Pvt
Govt
Pvt
Table 6: % Children by class and ARITHMETIC levelAll schools 2011
171ASER 2011
2.7 5.7 4.3 3.9 8.4 14.9 15.7 11.0 5.8
23.7 28.0 25.8 29.9 24.7 29.9 37.3 34.6 28.3
4.8 7.5 10.9 7.6 9.2 13.8 22.6 27.4 9.8
22.8 17.2 16.0 23.4 20.4 20.7 19.3 35.5 21.2
4.7 5.7 7.9 10.4 13.9 13.1 21.8 14.7 9.8
21.1 20.6 20.6 19.2 14.8 14.7 18.8 22.3 18.9
7.0 7.3 8.6 10.9 10.9 31.4 22.2 26.7 11.8
19.0 21.0 25.0 23.3 20.2 22.8 23.7 26.6 22.3
Arithmetic
Tuition
% C
hild
ren
% C
hild
ren

As part of ASER 2007, 2009, 2010 and 2011, in each sampled village, one government school with primary sections was visited on the day of the survey.
Information about schools in this report is based on these visits.
Meghalaya RURAL
2007 2009 2010 2011
Std I-IV/VType of school
% Enrolledchildren present(average)
% Schools with lessthan 50% enrolledchildren present(average)
% Schools with75% or moreenrolled childrenpresent (average)
Std I-IV/V2010 2011
% Schools with:
No Headteacher appointed
Headteacher appointed but not present attime of visitHeadteacher appointed & present at timeof visit
Total
Std I-IV/V2010 2011
% Schools with:
No computer
Computers but no children using them onday of visitComputers & children using them on dayof visit
Total
2007Type of school
Std I-IV/V: Primary
Std I-VII/VIII: Primary + Upper primary
Total schools visited
2009 2010 2011
Table 8: Total schools visited 2007, 2009, 2010 and 2011
Table 9: Student attendance 2007, 2009, 2010 and 2011
Table 11: Headteachers 2010 & 2011 Table 12: Computers 2010 and 2011
172 ASER 2011
0.0 0.0
3.9 3.5
96.2 96.6
100 100
100.0 98.6
0.0 1.4
0.0 0.0
100 100
107 135 101 76
9 9 9 9
116 144 110 85
85.0 76.9 74.7 75.5
1.2 7.1 6.1 12.2
84.9 62.7 60.2 59.5
2007 2009 2010 2011
Std I-IV/V% Schools with:
Std II children sitting with one or more other classes
Table 13: Multigrade classes 2007, 2009, 2010 and 2011
56.2 67.4 68.8 82.9
47.2 63.4 66.7 81.2Std IV children sitting with one or more other classes
School observations
Other school information
Student and teacher attendance
2007 2009 2010 2011
Std I-IV/VType of school
% Teachers present(average)
% Schools withno teacherspresent(average)
% Schools withall teacherspresent(average)
Table 10: Teacher attendance 2007, 2009, 2010 and 2011
92.5 88.9 94.4 94.7
1.3 0.8 0.0 1.5
83.5 71.7 81.7 87.0

Meghalaya RURAL
How much goes toeach school For what purposes
SCHOOL DEVELOPMENT GRANT / SCHOOL GRANT
Rs.5000 per year perprimary school
Rs.7000 per year per upperprimary school
Rs 5000 + Rs 7000 =Rs 12000 if the school isStd I-VII/VIII.
Note: Primary and UpperPrimary schools are treatedas separate schools even ifthey are in the same pre-mises.
This grant can be used forbuying school equipmentsuch as blackboard, sittingmats etc. Also for buyingchalk, duster, registers andother office equipment.
The grant amount varies bytype of school: whether it isa primary or upper primaryschool.
SCHOOL MAINTENANCE GRANT
Rs.5000 - Rs 7500 perschool per year if the schoolhas upto 3 classrooms.
Rs 7500 - Rs.10000 per yearif the school has more than3 classrooms.
Primary and Upper Primaryschools are treated asseparate schools even ifthey are in the samebuilding.
TLM GRANT
This grant can be used byteachers to buy teachingaids, such as charts, globes,posters, models etc.
Rs.500 per teacher per yearin primary and upper pri-mary schools.
1 For more information see www.accountabilityinitiative.in
173ASER 2011
School funds and activities (PAISA)
This grant can be used formaintenance of schoolbuilding, includingwhitewashing;beautification; and repair oftoilets, hand pump,boundary wall, playgroundetc.
The grant amount dependson number of classrooms(excluding Headmasterroom and office room)
DID SCHOOLS GET THEIR MONEY ON TIME?
2008-2009 2009-2010 2010-2011SSA school
grants% Schools % Schools % SchoolsNo.
ofSch.
No.of
Sch.Yes No Don’tknow
DID SCHOOLS GET THEIR MONEY ON TIME?
April 2009 toOctober 2009
April 2010 toOctober 2010
April 2011 toOctober 2011
% Schools % Schools % SchoolsNo.of
Sch.
No.of
Sch.
No.of
Sch.Yes No Don’tknow
Table 15: % Schools who report receiving SSA grants - Half financial year
Table 14: % Schools who report receiving SSA grants - Full financial year
MaintenancegrantDeve lopmentgrant
TLM grant
Yes No Don’tknow
Yes No Don’tknow
SSA school
grants
Ma intenancegrantDeve lopmentgrant
TLM grant
Yes No Don’tknow
Yes No Don’tknow
123 65.9 26.0 8.1 95 69.5 21.1 9.5 77 62.3 32.5 5.2
116 38.8 52.6 8.6 92 37.0 47.8 15.2 76 46.1 46.1 7.9
122 83.6 8.2 8.2 96 78.1 17.7 4.2 78 83.3 10.3 6.4
98 45.9 39.8 14.3 94 37.2 53.2 9.6 73 38.4 50.7 11.0
95 20.0 65.3 14.7 87 21.8 69.0 9.2 69 24.6 62.3 13.0
98 65.3 19.4 15.3 93 37.6 58.1 4.3 72 47.2 43.1 9.7
No.of
Sch.
EVERY RURAL GOVERNMENT PRIMARY SCHOOLIS ENTITLED TO EACH OF THESE SSA GRANTSEVERY YEAR.
The PAISA section of ASER tracks receipt and spending
of Sarva Shiksha Abhiyan (SSA) grants at the school
level. This information is collected from schools visited
during the survey. This page reports proportion of
schools receiving the grants and carrying out specified
activities in the schools. More detailed analysis of the
PAISA data will be available in the PAISA 2011 report
which will be released in March 2012.1

Meghalaya RURAL
Note : For schools with enrollment above 200children the PTR shall not exceed 40 excludingthe Head Teacher
As part of ASER 2010 and 2011, in each sampled village, onegovernment school with primary sections was visited on theday of the survey. During this school visit, RTE indicators wereobserved and are reported here.
Note: School observations for ASER 2011 looked at TLM for Std II and Std IV only.
2010 2011School
enrollment No. ofschools
No. ofschools
% ofschools
% ofschools
RTETeacherNorms
1-60
61-90
91-120
121-150
151-200
> 200
TOTAL
2011Schoolenrollment
2010
2
3
4
5
5 + HMsee note
2010
1
2
3
4
5
6
>=7
TOTAL
2011
Numberof
teachersNo.of
schools
No.of
schools
%of
schools
%of
schools
RTE norm:At least one
classroom perteacher
1
2
3
4
5
6
>=7
TOTAL
20112010
% Schools that do notmeet classroom to teacher
normsNumber ofteachers
% of schools with 2011
Building
DrinkingWater
Toilet
Girls Toilet
TLM
Library
MDM
Table 17: Schools by totalenrollment 2010 and 2011
Table 18: RTE norms: Pupil-teacherratio 2010 and 2011
Table 19: Schools by number ofteachers 2010 and 2011
Table 20: RTE norms: Teacher -classroom ratio 2010 and 2011
Table 21: % Schools meeting selected RTE norms on facilities 2010 & 2011
2010
1-60
61-90
91-120
121-150
151-200
> 200
TOTAL
174 ASER 2011
76 71.0 55 66.3
18 16.8 19 22.9
6 5.6 2 2.4
2 1.9 2 2.4
3 2.8 2 2.4
2 1.9 3 3.6
107 100.0 83 100.0
39 41.1 29 39.7
18 19.0 14 19.2
12 12.6 12 16.4
9 9.5 7 9.6
7 7.4 5 6.9
3 3.2 1 1.4
7 7.4 5 6.9
95 100.0 73 100.0
0.0 36.4
25.0 42.9
14.3 20.0
0.0 50.0
0.0 25.0
100.0 100.0
50.0 33.3
15.8 37.1
Right to Education indicators
Extracts from the Schedule of The Right of Children toFree and Compulsory Education Act 2009 Norms andstandards for a School (Sections 19 and 25)
Number of teachers in Std 1-5:� Admitted children No. of teachers
<= 60 261-90 391-120 4121-200 5> 150 5 + 1 Headteacher> 200 Pupil-Teacher Ratio
(excluding Headteacher)shall not exceed 40
School facilities:All weather building with:
� At least one classroom for every teacher� Office cum store cum headteacher’s room� Separate toilets for boys and girls� Safe and adequate drinking water facility to
all children� A kitchen where mid-day meal is cooked in
the school� Playground� Arrangements for securing the school
building by boundary wall or fencing.
Teaching learning equipmentshall be provided to each class as required.
LibraryThere shall be a library in each school providingnewspaper, magazines and books on all subjects,including story-books.
52.9 52.1
33.3 35.3
33.3 50.0
0.0 50.0
0.0 0.0
0.0 100.0
45.7 48.6
33.6 41.645.5 39.513.8 13.970.6 77.85.5 12.4
23.9 9.934.9 23.140.6 52.624.5 24.464.8 44.1
9.1 33.911.4 3.414.8 18.640.0 51.326.8 46.578.0 63.86.4 5.0
15.6 31.359.4 69.650.9 35.4
% Schools that donot meet PTR norms
Office/Store/Office cum storePlaygroundBoundary WallNo facility for drinking waterFacility but no drinking water availableDrinking water availableNo toilet facilityFacility but toilet not useableToilet useable% Schools with no separate provisions for girls toiletsOf schools with separate girls toilets, % schools whereToilet lockedToilet not useableToilet useableTeaching learning material in Std 2Teaching learning material in Std 4No libraryLibrary but no books being used by children on day of visitLibrary being used by children on day of visitKitchen shed for cooking midday mealMidday meal served in school on the day of visit

Mizoram RURAL
Note: 'OTHER' includes children going to madarssa and EGS.‘NOT IN SCHOOL’ = dropped out + never enrolled.
How to read this table: If a child started school in Std I at age 6, she should be age 8 inStd 3. This table shows the age distribution for each class. For example, in Std III,28.2% children are 8 years old but there are also 10.2% who are 7, 39.9 % who are9, 13.1% who are 10 years old, etc.
Chart 1: Trends over time% Children out of school by age group and gender 2006-2011
How to read this chart: For example, the proportion of girls (age 11-14) not in schoolhas changed from 4.4% in 2006 to 5.4% in 2008 to1.8% in 2009 to 4.4% in 2010 to1.1% in 2011
ALL ANALYSIS BASED ON DATA FROM HOUSEHOLDS. 8 OUT OF 8 DISTRICTS
TotalAge group Govt. Pvt. Other Not inSchool
85.6 13.7 0.1 0.6 100
85.2 12.6 0.1 2.2 100
85.3 14.5 0.1 0.1 100
86.2 13.7 0.0 0.1 100
84.2 15.5 0.1 0.2 100
87.2 11.5 0.1 1.2 100
87.4 11.1 0.2 1.3 100
87.0 12.0 0.0 1.1 100
79.8 8.6 0.1 11.5 100
78.9 8.0 0.2 12.9 100
80.9 9.3 0.0 9.8 100
Age: 6-14 ALL
Age: 7-16 ALL
Age: 7-10 ALL
Age: 7-10 BOYS
Age: 7-10 GIRLS
Age: 11-14 ALL
Age: 11-14 BOYS
Age: 11-14 GIRLS
Age: 15-16 ALL
Age: 15-16 BOYS
Age: 15-16 GIRLS
I
II
III
IV
V
VI
VII
VIII
Table 2: Sample description% Children in each class by age 2011
5 6 7 8 9 10 11 12 13 14 15 16 Total
22.9 45.5 26.0 5.5
2.4 10.7 43.3 29.6 11.0 3.0
1.8 10.2 28.2 39.9 13.1 6.7
2.3 9.7 25.5 34.2 10.9 9.6 6.3 1.4
6.9 26.7 34.3 13.4 9.0 6.2 3.5
7.6 22.0 34.4 18.0 7.4 6.7 4.0
8.0 23.6 31.5 20.9 10.2 5.8
2.3 6.4 23.0 38.4 17.4 12.6
100
100
100
100
100
100
100
100
Std.
Table 1: % Children in different types of schools 2011
175ASER 2011
School enrollment and out of school children
Young children in pre-school and school
% C
hild
ren
% C
hild
ren
% C
hild
ren
Chart 2: Trends over time% Children enrolled in private school by class 2009 & 2011
Chart 3: Trends over timeFive year olds in pre-school & school 2009 & 2011
Tota
l
In SchoolIn balwadi
oranganwadi
In LKG/UKG
Age 5
Age 6
Govt Pvt Other
36.7 13.4 37.9 11.9 0.0 0.2 100
6.6 5.3 71.5 16.2 0.0 0.3 100
Note: Mizoram data for 2007 not available.
Not
enr
olle
dan
ywh
ere
Table 3: % Children age 5-6 who are enrolled in differenttypes of pre-school & school 2011

Reading Tool
Mizoram RURAL
How to read this table: Each cell shows the highest level of reading achieved by a child.For example, in Std III, 1.4% children cannot even read letters, 3.9% can read lettersbut not more, 14.7% can read words but not Std 1 text or higher, 40.4% can read Std1 text but not Std 2 level text, and 39.6% can read Std 2 level text. In sum, for eachclass, the total of all these exclusive categories is 100%.
Std. NothingLevel 1
(Std 1 Text)Level 2
(Std 2 Text) Total
I
II
III
IV
V
VI
VII
VIII
Total
5.3 46.4 39.6 5.9 2.8 100
2.3 11.3 38.6 35.0 12.8 100
1.4 3.9 14.7 40.4 39.6 100
1.0 2.7 11.0 18.9 66.4 100
0.0 2.8 4.8 14.1 78.4 100
0.2 1.9 2.8 7.2 87.9 100
0.0 1.7 1.7 3.3 93.3 100
0.4 2.4 1.1 6.2 89.9 100
1.6 10.8 17.1 18.6 52.0 100
Chart 5: Trends over time% Children in Std V who CANNOT READ Std II LEVEL TEXTBy school type 2008-2011
Chart 4: Trends over time% Children in Std III who CANNOT READ Std I LEVEL TEXTBy school type 2008-2011
Letter Word
Table 4: % Children by class and READING levelAll schools 2011
176 ASER 2011
Home language and school language
Reading
% C
hild
ren
% C
hild
ren
Note: In ASER 2011 for every state, reading tools were provided in the main medium in instruction in government schools. In Mizoram, where the medium of instruction in governmentschools is Mizo, Mara (only in Saiha district) or English, children were given the choice of reading in any one of these languages. Figures for Mizo and Mara have been combined. Forhome languages, a list of 122 languages was provided to all survey teams. This includes 22 Scheduled languages and 100 Non-Scheduled languages. The data in this table is forchildren for whom we have information for both school language and home language.
Note: This tool was also available in English and Mara.
Table 5: School language and home language
Of the % Children who
tested in:
% Children whose home language was:
* 'Other' includes all languages from the list of scheduled and non-scheduled languages except those specified above.
Lushai/Mizo Bengali Lakher Pawi Other * Total
Mizo or Mara
English
87.0 1.2 6.1 2.8 3.0 100
45.7 53.0 0.1 0.1 1.1 100
69.6
30.4
100.0
Mizo or Mara
English
Total
%Children who took the
reading test in:
%

Math Tool
How to read this table: Each cell shows the highest level of arithmetic achieved by achild. For example, in Std III, 0.3% children cannot even recognize numbers 1-9, 4.8%children can recognize numbers up to 9 but not more, 18.3% can recognize numbers to99 but cannot do subtraction, 50% can do subtraction but not division, and 26.7% cando division. In sum, for each class, the total of all these exclusive categories is 100%.
Std. Nothing Subtract Divide Total
I
II
III
IV
V
VI
VII
VIII
Total
4.7 44.2 45.8 3.4 2.0 100
1.2 12.0 50.8 28.0 8.0 100
0.3 4.8 18.3 50.0 26.7 100
0.7 2.6 10.2 30.3 56.3 100
0.2 1.9 4.7 25.6 67.7 100
0.1 1.5 2.7 15.3 80.4 100
0.0 2.2 1.5 7.8 88.5 100
0.7 2.1 2.0 6.0 89.3 100
1.1 10.5 20.4 22.8 45.1 100
Recognize Numbers11-991-9
Chart 7: Trends over time% Children in Std V who CANNOT DO DIVISIONBy school type 2008-2011
Chart 6: Trends over time% Children in Std III who CANNOT RECOGNISE NUMBERS upto100. By school type 2008-2011
Mizoram RURAL
Table 7: Class-wise % children attending PAID TUITION CLASSESBy school type 2009, 2010 and 2011
Note: In 2007, 2009, 2010 and 2011 the ASER survey recorded information abouttuition. In all 4 years, the question asked was the following: “Does the child take anypaid additional class currently?” Therefore, these numbers do not include anysupplemental help in learning that children may have received from parents, siblingsor from anyone else who did not require payment.
Year School I II III IV V VI VII VIII Total
2007
2009
2010
2011
Govt
Pvt
Govt
Pvt
Govt
Pvt
Govt
Pvt
Table 6: % Children by class and ARITHMETIC levelAll schools 2011
177ASER 2011
5.3 5.3 5.8 8.9 6.4 7.6 9.7 6.3 6.8
17.5 23.6 35.9 29.3 33.7 38.0 37.0 24.2 28.5
1.7 2.1 2.1 3.4 4.3 4.3 5.6 7.4 3.3
17.1 18.1 13.0 21.9 9.7 4.6 12.7 3.2 11.5
0.5 0.3 0.6 0.9 0.9 1.4 1.6 2.3 0.9
6.5 6.7 14.9 17.2 17.3 21.8 14.5 10.4 12.7
Arithmetic
Tuition
% C
hild
ren
% C
hild
ren
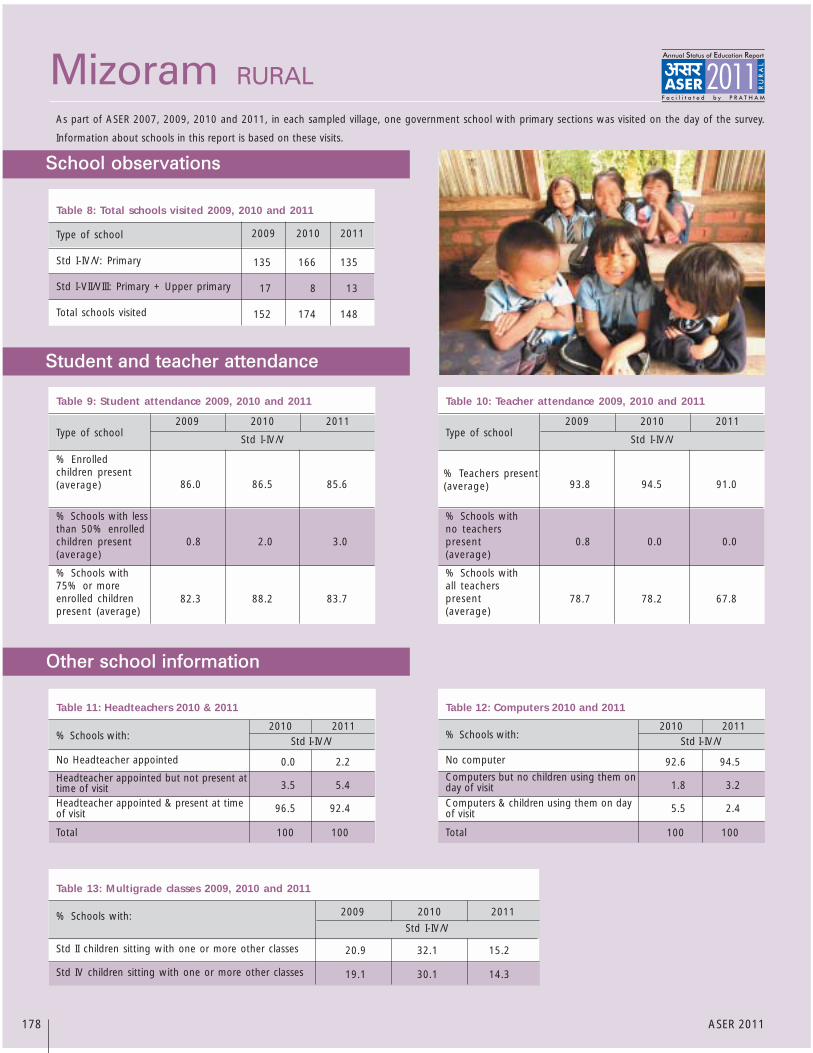
As part of ASER 2007, 2009, 2010 and 2011, in each sampled village, one government school with primary sections was visited on the day of the survey.
Information about schools in this report is based on these visits.
Mizoram RURAL
178 ASER 2011
Student and teacher attendance
School observations
Other school information
Student and teacher attendance
Std I-IV/V2010 2011
% Schools with:
No Headteacher appointed
Headteacher appointed but not present attime of visitHeadteacher appointed & present at timeof visit
Total
Std I-IV/V2010 2011
% Schools with:
No computer
Computers but no children using them onday of visitComputers & children using them on dayof visit
Total
Table 11: Headteachers 2010 & 2011 Table 12: Computers 2010 and 2011
0.0 2.2
3.5 5.4
96.5 92.4
100 100
92.6 94.5
1.8 3.2
5.5 2.4
100 100
Type of school
Std I-IV/V: Primary
Std I-VII/VIII: Primary + Upper primary
Total schools visited
2009 2010 2011
Table 8: Total schools visited 2009, 2010 and 2011
135 166 135
17 8 13
152 174 148
2009 2010 2011
Std I-IV/VType of school
% Enrolledchildren present(average)
% Schools with lessthan 50% enrolledchildren present(average)
% Schools with75% or moreenrolled childrenpresent (average)
Table 9: Student attendance 2009, 2010 and 2011
86.0 86.5 85.6
0.8 2.0 3.0
82.3 88.2 83.7
Type of school
% Teachers present(average)
% Schools withno teacherspresent(average)
% Schools withall teacherspresent(average)
Table 10: Teacher attendance 2009, 2010 and 2011
93.8 94.5 91.0
0.8 0.0 0.0
78.7 78.2 67.8
2009 2010 2011
Std I-IV/V% Schools with:
Std II children sitting with one or more other classes
Table 13: Multigrade classes 2009, 2010 and 2011
20.9 32.1 15.2
19.1 30.1 14.3Std IV children sitting with one or more other classes
2009 2010 2011
Std I-IV/V

Mizoram RURAL
How much goes toeach school For what purposes
SCHOOL DEVELOPMENT GRANT / SCHOOL GRANT
Rs.5000 per year perprimary school
Rs.7000 per year per upperprimary school
Rs 5000 + Rs 7000 =Rs 12000 if the school isStd I-VII/VIII.
Note: Primary and UpperPrimary schools are treatedas separate schools even ifthey are in the same pre-mises.
This grant can be used forbuying school equipmentsuch as blackboard, sittingmats etc. Also for buyingchalk, duster, registers andother office equipment.
The grant amount varies bytype of school: whether it isa primary or upper primaryschool.
SCHOOL MAINTENANCE GRANT
Rs.5000 - Rs 7500 perschool per year if the schoolhas upto 3 classrooms.
Rs 7500 - Rs.10000 per yearif the school has more than3 classrooms.
Primary and Upper Primaryschools are treated asseparate schools even ifthey are in the samebuilding.
TLM GRANT
This grant can be used byteachers to buy teachingaids, such as charts, globes,posters, models etc.
Rs.500 per teacher per yearin primary and upper pri-mary schools.
1 For more information see www.accountabilityinitiative.in
179ASER 2011
School funds and activities (PAISA)
This grant can be used formaintenance of schoolbuilding, includingwhitewashing;beautification; and repair oftoilets, hand pump,boundary wall, playgroundetc.
The grant amount dependson number of classrooms(excluding Headmasterroom and office room)
DID SCHOOLS GET THEIR MONEY ON TIME?
2008-2009 2009-2010 2010-2011SSA school
grants% Schools % Schools % SchoolsNo.
ofSch.
No.of
Sch.
No.of
Sch.Yes No Don’tknow
DID SCHOOLS GET THEIR MONEY ON TIME?
April 2009 toOctober 2009
April 2010 toOctober 2010
April 2011 toOctober 2011
% Schools % Schools % SchoolsNo.of
Sch.
No.of
Sch.
No.of
Sch.Yes No Don’tknow
Type of Activity
Yes No Don'tknow
New Classroom
Repair of building (roof, floor, wall etc.)
Repair of doors & windows
Repair of boundary wall
Repair of drinking water facility
Repair of toilet
White wash/plastering
Painting Blackboard/Display Board/Painting on wall
Painting of doors & walls
Purchase of furniture (cupboard etc.)
Purchase of electrical fittings
Purchase of chalk, duster, register etc.
Purchase of sitting Mats/Tat Patti
Purchase of charts, globes & other teaching material
Expenditure on school events
Payment of bills (electricity, water, cleaning etc.)
Const.
Repairs
Painting
& White
Wash
Purchase
Other
Table 15: % Schools who report receiving SSA grants - Half financial year
Table 16: % Schools carrying out different activities since April 2010
Table 14: % Schools who report receiving SSA grants - Full financial year
% schools
Ma intenancegrantDeve lopmentgrant
TLM grant
Yes No Don’tknow
Yes No Don’tknow
SSA school
grants
Ma intenancegrantDeve lopmentgrant
TLM grant
Yes No Don’tknow
Yes No Don’tknow
143 85.3 11.2 3.5 159 93.1 4.4 2.5 142 95.1 4.2 0.7
122 63.1 32.8 4.1 145 79.3 17.9 2.8 133 78.2 18.8 3.0
142 78.2 20.4 1.4 158 93.0 5.1 1.9 141 96.5 2.8 0.7
126 61.9 29.4 8.7 156 79.5 18.0 2.6 126 78.6 19.1 2.4
114 43.0 47.4 9.7 152 62.5 34.9 2.6 117 63.3 32.5 4.3
125 62.4 30.4 7.2 156 79.5 18.0 2.6 125 76.8 20.8 2.4
24.4 75.6 0.0
75.2 23.9 0.9
78.0 21.2 0.9
47.6 51.5 1.0
56.4 42.6 1.0
68.2 31.8 0.0
52.6 47.4 0.0
58.8 41.2 0.0
67.2 31.9 0.9
61.6 37.4 1.0
71.2 26.9 1.9
80.7 17.5 1.8
48.1 51.9 0.0
80.7 19.3 0.0
76.0 21.0 3.0
73.5 26.5 0.0
EVERY RURAL GOVERNMENT PRIMARY SCHOOLIS ENTITLED TO EACH OF THESE SSA GRANTSEVERY YEAR.
The PAISA section of ASER tracks receipt and spending
of Sarva Shiksha Abhiyan (SSA) grants at the school
level. This information is collected from schools visited
during the survey. This page reports proportion of
schools receiving the grants and carrying out specified
activities in the schools. More detailed analysis of the
PAISA data will be available in the PAISA 2011 report
which will be released in March 2012.1

Mizoram RURAL
Note : For schools with enrollment above 200children the PTR shall not exceed 40 excludingthe Head Teacher
As part of ASER 2010 and 2011, in each sampled village, onegovernment school with primary sections was visited on theday of the survey. During this school visit, RTE indicators wereobserved and are reported here.
Note: School observations for ASER 2011 looked at TLM for Std II and Std IV only.
2010 2011School
enrollment No. ofschools
No. ofschools
% ofschools
% ofschools
RTETeacherNorms
1-60
61-90
91-120
121-150
151-200
> 200
TOTAL
2011Schoolenrollment
2010
2
3
4
5
5 + HMsee note
2010
1
2
3
4
5
6
>=7
TOTAL
2011
Numberof
teachersNo.of
schools
No.of
schools
%of
schools
%of
schools
RTE norm:At least one
classroom perteacher
1
2
3
4
5
6
>=7
TOTAL
20112010
% Schools that do notmeet classroom to teacher
normsNumber ofteachers
% of schools with 2011
Building
DrinkingWater
Toilet
Girls Toilet
TLM
Library
MDM
Table 17: Schools by totalenrollment 2010 and 2011
Table 18: RTE norms: Pupil-teacherratio 2010 and 2011
Table 19: Schools by number ofteachers 2010 and 2011
Table 20: RTE norms: Teacher -classroom ratio 2010 and 2011
Table 21: % Schools meeting selected RTE norms on facilities 2010 & 2011
2010
1-60
61-90
91-120
121-150
151-200
> 200
TOTAL
180 ASER 2011
64 39.8 83 56.1
70 43.5 34 23.0
17 10.6 18 12.2
6 3.7 10 6.8
2 1.2 3 2.0
2 1.2 0 0.0
161 100.0 148 100.0
4 2.7 13 10.7
13 8.8 29 23.8
40 27.0 38 31.2
37 25.0 19 15.6
20 13.5 7 5.7
7 4.7 7 5.7
27 18.2 9 7.4
148 100.0 122 100.0
0.0 0.0
0.0 0.0
7.7 0.0
5.9 12.5
100.0 50.0
100.0 0.0
88.2 33.3
42.4 5.2
Right to Education indicators
Extracts from the Schedule of The Right of Children toFree and Compulsory Education Act 2009 Norms andstandards for a School (Sections 19 and 25)
Number of teachers in Std 1-5:� Admitted children No. of teachers
<= 60 261-90 391-120 4121-200 5> 150 5 + 1 Headteacher> 200 Pupil-Teacher Ratio
(excluding Headteacher)shall not exceed 40
School facilities:All weather building with:
� At least one classroom for every teacher� Office cum store cum headteacher’s room� Separate toilets for boys and girls� Safe and adequate drinking water facility to
all children� A kitchen where mid-day meal is cooked in
the school� Playground� Arrangements for securing the school
building by boundary wall or fencing.
Teaching learning equipmentshall be provided to each class as required.
LibraryThere shall be a library in each school providingnewspaper, magazines and books on all subjects,including story-books.
5.1 16.4
4.6 16.7
50.0 60.0
0.0 55.6
0.0 0.0
100.0 0.0
10.9 24.8
80.1 92.140.7 70.735.5 47.847.3 25.44.1 3.6
48.5 71.07.1 2.1
37.3 45.855.6 52.143.4 12.4
14.5 44.611.3 9.930.8 33.140.2 53.336.0 51.093.6 72.94.7 15.01.7 12.1
96.5 98.694.4 99.3
% Schools that donot meet PTR norms
Office/Store/Office cum storePlaygroundBoundary WallNo facility for drinking waterFacility but no drinking water availableDrinking water availableNo toilet facilityFacility but toilet not useableToilet useable% Schools with no separate provisions for girls toiletsOf schools with separate girls toilets, % schools whereToilet lockedToilet not useableToilet useableTeaching learning material in Std 2Teaching learning material in Std 4No libraryLibrary but no books being used by children on day of visitLibrary being used by children on day of visitKitchen shed for cooking midday mealMidday meal served in school on the day of visit

Nagaland RURAL
Note: 'OTHER' includes children going to madarssa and EGS.‘NOT IN SCHOOL’ = dropped out + never enrolled.
How to read this table: If a child started school in Std I at age 6, she should be age 8 inStd 3. This table shows the age distribution for each class. For example, in Std III,26.0% children are 8 years old but there are also 9.3% who are 7 years old or younger,29.5% who are 9, 16.9% who are 10 years old, etc.
Chart 1: Trends over time% Children out of school by age group and gender 2006-2011
How to read this chart: For example, the proportion of girls (age 11-14) not in schoolhas changed from 6.4% in 2006 to 4.5% in 2007 to 5.8% in 2008 to 3.7% in 2009to 3.2% in 2010 to 2.5% in 2011
ALL ANALYSIS BASED ON DATA FROM HOUSEHOLDS. 11 OUT OF 11 DISTRICTS
TotalAge group Govt. Pvt. Other Not inSchool
57.1 40.9 0.0 2.0 100
56.6 40.1 0.0 3.2 100
58.6 40.2 0.1 1.1 100
58.1 40.8 0.1 1.0 100
59.1 39.6 0.1 1.3 100
56.5 40.3 0.0 3.2 100
55.8 40.4 0.0 3.9 100
57.3 40.2 0.1 2.5 100
49.1 39.4 0.0 11.5 100
48.4 39.2 0.1 12.3 100
49.9 39.5 0.0 10.6 100
Age: 6-14 ALL
Age: 7-16 ALL
Age: 7-10 ALL
Age: 7-10 BOYS
Age: 7-10 GIRLS
Age: 11-14 ALL
Age: 11-14 BOYS
Age: 11-14 GIRLS
Age: 15-16 ALL
Age: 15-16 BOYS
Age: 15-16 GIRLS
I
II
III
IV
V
VI
VII
VIII
Table 2: Sample description% Children in each class by age 2011
5 6 7 8 9 10 11 12 13 14 15 16 Total
8.6 36.3 34.4 10.5 5.2 5.0
7.5 23.6 36.3 17.8 7.6 7.2
9.3 26.0 29.5 16.9 8.9 5.2 4.2
2.5 6.5 21.3 30.1 15.9 13.1 7.0 3.7
8.3 25.2 24.1 22.6 12.0 7.9
1.9 7.8 16.5 32.4 21.8 11.3 8.4
7.2 21.9 29.6 24.2 11.2 5.9
6.3 20.8 40.1 21.9 10.8
100
100
100
100
100
100
100
100
Std.
Table 1: % Children in different types of schools 2011
181ASER 2011
School enrollment and out of school children
Young children in pre-school and school
% C
hild
ren
% C
hild
ren
% C
hild
ren
Chart 2: Trends over time% Children enrolled in private school by class 2007, 2009 & 2011
Chart 3: Trends over timeFive year olds in pre-school & school 2007, 2009 & 2011
Tota
l
In SchoolIn balwadi
oranganwadi
In LKG/UKG
Age 5
Age 6
Govt Pvt Other
2.3 7.4 46.7 40.4 0.0 3.2 100
0.3 3.0 50.9 44.1 0.0 1.7 100
Not
enr
olle
dan
ywh
ere
Table 3: % Children age 5-6 who are enrolled in differenttypes of pre-school & school 2011

Reading Tool
Nagaland RURAL
How to read this table: Each cell shows the highest level of reading achieved by a child.For example, in Std III, 0.9% children cannot even read letters, 11.7% can read lettersbut not more, 29.8% can read words but not Std 1 text or higher, 38.1% can read Std1 text but not Std 2 level text, and 19.6% can read Std 2 level text. In sum, for eachclass, the total of all these exclusive categories is 100%.
Std. NothingLevel 1
(Std 1 Text)Level 2
(Std 2 Text) Total
I
II
III
IV
V
VI
VII
VIII
Total
5.1 42.9 42.4 6.8 2.8 100
1.7 20.3 49.8 22.5 5.7 100
0.9 11.7 29.8 38.1 19.6 100
0.3 7.7 17.9 36.4 37.7 100
0.4 3.0 10.7 27.0 59.0 100
0.2 2.5 5.1 20.6 71.6 100
0.0 2.9 2.5 11.3 83.3 100
0.5 1.4 2.5 5.6 90.0 100
1.5 14.9 25.3 22.4 35.9 100
Chart 5: Trends over time% Children in Std V who CANNOT READ Std II LEVEL TEXTBy school type 2008-2011
Chart 4: Trends over time% Children in Std III who CANNOT READ Std I LEVEL TEXTBy school type 2008-2011
Letter Word
Table 4: % Children by class and READING levelAll schools 2011
182 ASER 2011
Home language and school language
Reading
% C
hild
ren
% C
hild
ren
Note: In ASER 2011 for every state, reading tools were provided in the main medium of instruction ingovernment schools. In Nagaland, where the medium of instruction is English, children were given thereading tool only in English. For home languages, a list of 122 languages was provided to all survey teams.This included 22 Scheduled languages and 100 Non-Scheduled languages. The data in this table is forchildren for whom we have information for both school language and home language.
Table 5: School language and home language
* 'Other' includes all languages from the list of scheduled and non-scheduledlanguages except those specified above.
% %% children whose home
language was:% children whose home
language was:KonyakLothaAOAngamiChakru/ChokriPhomSangatamKhiemungan
RegmaChangZeliangKhezhaYimchungreyKukiOther *Total
16.911.410.18.16.35.65.44.1
3.43.32.82.51.91.5
16.8100.0
% children who tested in English:

Math Tool
How to read this table: Each cell shows the highest level of arithmetic achieved by achild. For example, in Std III, 0.7% children cannot even recognize numbers 1-9, 6.9%children can recognize numbers up to 9 but not more, 34.9% can recognize numbers to99 but cannot do subtraction, 49.9% can do subtraction but not division, and 7.6% cando division. In sum, for each class, the total of all these exclusive categories is 100%.
Std. Nothing Subtract Divide Total
I
II
III
IV
V
VI
VII
VIII
Total
3.4 32.4 54.7 8.6 1.0 100
1.1 13.4 54.4 28.3 2.9 100
0.7 6.9 34.9 49.9 7.6 100
0.0 4.7 20.7 53.8 20.8 100
0.3 2.8 11.3 45.1 40.5 100
0.4 1.5 5.9 36.8 55.5 100
0.0 1.4 4.2 24.5 69.9 100
0.4 0.7 2.3 13.4 83.3 100
1.0 10.3 29.7 33.1 25.9 100
Recognize Numbers11-991-9
Chart 7: Trends over time% Children in Std V who CANNOT DO DIVISIONBy school type 2008-2011
Chart 6: Trends over time% Children in Std III who CANNOT RECOGNISE NUMBERS upto100. By school type 2008-2011
Nagaland RURAL
Table 7: Class-wise % children attending PAID TUITION CLASSESBy school type 2007, 2009, 2010 and 2011
Note: In 2007, 2009, 2010 and 2011 the ASER survey recorded information abouttuition. In all 4 years, the question asked was the following: “Does the child take anypaid additional class currently?” Therefore, these numbers do not include anysupplemental help in learning that children may have received from parents, siblingsor from anyone else who did not require payment.
Year School I II III IV V VI VII VIII Total
2007
2009
2010
2011
Govt
Pvt
Govt
Pvt
Govt
Pvt
Govt
Pvt
Table 6: % Children by class and ARITHMETIC levelAll schools 2011
183ASER 2011
15.4 14.6 19.1 19.6 27.1 12.7 16.3 23.7 18.5
28.5 34.3 40.2 40.1 38.5 49.9 48.5 57.7 42.0
12.9 10.8 9.3 8.4 14.6 13.2 14.8 21.7 12.3
36.4 36.8 41.1 40.0 40.8 45.9 52.1 54.5 43.1
7.6 7.2 7.1 8.7 7.8 5.8 6.8 10.3 7.7
26.5 31.9 34.7 32.2 32.2 30.0 40.0 39.8 33.3
11.7 11.4 12.0 13.0 11.1 15.0 15.6 14.5 12.6
32.2 36.3 40.4 39.0 42.2 43.1 45.0 52.8 40.4
Arithmetic
Tuition
% C
hild
ren
% C
hild
ren

As part of ASER 2007, 2009, 2010 and 2011, in each sampled village, one government school with primary sections was visited on the day of the survey.
Information about schools in this report is based on these visits.
Nagaland RURAL
2007 2009 2010 2011 2007 2009 2010 2011
Std I-IV/V Std I-VII/VIIIType of school
% Enrolledchildren present(average)
% Schools with lessthan 50% enrolledchildren present(average)
% Schools with75% or moreenrolled childrenpresent (average)
2007 2009 2010 2011 2007 2009 2010 2011
Std I-IV/V Std I-VII/VIIIType of school
% Teachers present(average)
% Schools withno teacherspresent(average)
% Schools withall teacherspresent(average)
Std I-IV/V Std I-VII/VIII2010 2011 2010 2011
% Schools with:
No Headteacher appointed
Headteacher appointed but not present attime of visitHeadteacher appointed & present at timeof visit
Total
Std I-IV/V Std I-VII/VIII2010 2011 2010 2011
% Schools with:
No computer
Computers but no children using them onday of visitComputers & children using them on dayof visit
Total
2007Type of school
Std I-IV/V: Primary
Std I-VII/VIII: Primary + Upper primary
Total schools visited
2009 2010 2011
Table 8: Total schools visited 2007, 2009, 2010 and 2011
Table 9: Student attendance 2007, 2009, 2010 and 2011
Table 11: Headteachers 2010 & 2011 Table 12: Computers 2010 and 2011
Table 10: Teacher attendance 2007, 2009, 2010 and 2011
184 ASER 2011
0.0 0.0 0.0 0.0
10.3 2.5 0.0 0.0
89.7 97.5 100.0 100.0
100 100 100 100
90.4 92.3 35.0 43.2
8.6 4.2 35.0 27.3
1.0 3.6 30.0 29.6
100 100 100 100
213 215 202 173
23 27 21 44
236 242 223 217
85.0 84.4 81.9 82.3 79.9 87.3 83.0 81.6
3.0 1.9 3.1 3.0 13.6 0.0 0.0 4.8
83.5 80.2 74.4 72.8 81.8 85.2 68.4 78.6
91.6 89.2 87.2 90.8 93.0 80.0 86.3 85.8
0.5 0.0 0.0 0.0 0.0 0.0 0.0 0.0
64.7 56.1 49.7 63.2 45.5 51.9 27.8 47.5
2007 2009 2010 2011
Std I-IV/V
2007 2009 2010 2011
Std I-VII/VIII% Schools with:
Std II children sitting with one or more other classes
Table 13: Multigrade classes 2007, 2009, 2010 and 2011
3.4 16.0 18.7 13.0 4.8 11.1 28.6 15.0
2.9 13.6 17.5 13.3 4.6 12.0 28.6 16.7Std IV children sitting with one or more other classes
School observations
Other school information
Student and teacher attendance

Nagaland RURAL
How much goes toeach school For what purposes
SCHOOL DEVELOPMENT GRANT / SCHOOL GRANT
Rs.5000 per year perprimary school
Rs.7000 per year per upperprimary school
Rs 5000 + Rs 7000 =Rs 12000 if the school isStd I-VII/VIII.
Note: Primary and UpperPrimary schools are treatedas separate schools even ifthey are in the same pre-mises.
This grant can be used forbuying school equipmentsuch as blackboard, sittingmats etc. Also for buyingchalk, duster, registers andother office equipment.
The grant amount varies bytype of school: whether it isa primary or upper primaryschool.
SCHOOL MAINTENANCE GRANT
Rs.5000 - Rs 7500 perschool per year if the schoolhas upto 3 classrooms.
Rs 7500 - Rs.10000 per yearif the school has more than3 classrooms.
Primary and Upper Primaryschools are treated asseparate schools even ifthey are in the samebuilding.
TLM GRANT
This grant can be used byteachers to buy teachingaids, such as charts, globes,posters, models etc.
Rs.500 per teacher per yearin primary and upper pri-mary schools.
1 For more information see www.accountabilityinitiative.in
185ASER 2011
School funds and activities (PAISA)
This grant can be used formaintenance of schoolbuilding, includingwhitewashing;beautification; and repair oftoilets, hand pump,boundary wall, playgroundetc.
The grant amount dependson number of classrooms(excluding Headmasterroom and office room)
DID SCHOOLS GET THEIR MONEY ON TIME?
2008-2009 2009-2010 2010-2011SSA school
grants% Schools % Schools % SchoolsNo.
ofSch.
No.of
Sch.Yes No Don’tknow
DID SCHOOLS GET THEIR MONEY ON TIME?
April 2009 toOctober 2009
April 2010 toOctober 2010
April 2011 toOctober 2011
% Schools % Schools % SchoolsNo.of
Sch.
No.of
Sch.
No.of
Sch.Yes No Don’tknow
Table 15: % Schools who report receiving SSA grants - Half financial year
Table 14: % Schools who report receiving SSA grants - Full financial year
MaintenancegrantDeve lopmentgrant
TLM grant
Yes No Don’tknow
Yes No Don’tknow
SSA school
grants
Ma intenancegrantDeve lopmentgrant
TLM grant
Yes No Don’tknow
Yes No Don’tknow
217 98.2 1.8 0.0 204 94.6 0.5 4.9 214 95.8 1.9 2.3
207 89.4 10.6 0.0 200 92.5 2.0 5.5 213 89.2 5.6 5.2
217 98.6 1.4 0.0 201 93.0 2.5 4.5 214 94.9 3.3 1.9
221 78.7 18.6 2.7 197 83.3 8.1 8.6 181 76.2 18.8 5.0
208 75.5 21.6 2.9 193 82.9 7.8 9.3 181 70.7 21.6 7.7
214 84.1 15.4 0.5 194 85.1 6.2 8.8 178 78.1 18.0 3.9
No.of
Sch.
EVERY RURAL GOVERNMENT PRIMARY SCHOOLIS ENTITLED TO EACH OF THESE SSA GRANTSEVERY YEAR.
The PAISA section of ASER tracks receipt and spending
of Sarva Shiksha Abhiyan (SSA) grants at the school
level. This information is collected from schools visited
during the survey. This page reports proportion of
schools receiving the grants and carrying out specified
activities in the schools. More detailed analysis of the
PAISA data will be available in the PAISA 2011 report
which will be released in March 2012.1

Nagaland RURAL
Note : For schools with enrollment above 200children the PTR shall not exceed 40 excludingthe Head Teacher
As part of ASER 2010 and 2011, in each sampled village, onegovernment school with primary sections was visited on theday of the survey. During this school visit, RTE indicators wereobserved and are reported here.
Note: School observations for ASER 2011 looked at TLM for Std II and Std IV only.
2010 2011School
enrollment No. ofschools
No. ofschools
% ofschools
% ofschools
RTETeacherNorms
1-60
61-90
91-120
121-150
151-200
> 200
TOTAL
2011Schoolenrollment
2010
2
3
4
5
5 + HMsee note
2010
1
2
3
4
5
6
>=7
TOTAL
2011
Numberof
teachersNo.of
schools
No.of
schools
%of
schools
%of
schools
RTE norm:At least one
classroom perteacher
1
2
3
4
5
6
>=7
TOTAL
20112010
% Schools that do notmeet classroom to teacher
normsNumber ofteachers
% of schools with 2011
Building
DrinkingWater
Toilet
Girls Toilet
TLM
Library
MDM
Table 17: Schools by totalenrollment 2010 and 2011
Table 18: RTE norms: Pupil-teacherratio 2010 and 2011
Table 19: Schools by number ofteachers 2010 and 2011
Table 20: RTE norms: Teacher -classroom ratio 2010 and 2011
Table 21: % Schools meeting selected RTE norms on facilities 2010 & 2011
2010
1-60
61-90
91-120
121-150
151-200
> 200
TOTAL
186 ASER 2011
98 45.8 87 41.2
51 23.8 51 24.2
25 11.7 34 16.1
9 4.2 10 4.7
15 7.0 11 5.2
16 7.5 18 8.5
214 100.0 211 100.0
2 1.0 8 4.2
13 6.6 11 5.8
11 5.6 19 10.1
42 21.2 22 11.6
54 27.3 30 15.9
30 15.2 26 13.8
46 23.2 73 38.6
198 100.0 189 100.0
0.0 0.0
0.0 0.0
14.3 0.0
0.0 7.7
19.1 15.4
37.5 42.9
42.3 65.0
21.4 38.9
Right to Education indicators
Extracts from the Schedule of The Right of Children toFree and Compulsory Education Act 2009 Norms andstandards for a School (Sections 19 and 25)
Number of teachers in Std 1-5:� Admitted children No. of teachers
<= 60 261-90 391-120 4121-200 5> 150 5 + 1 Headteacher> 200 Pupil-Teacher Ratio
(excluding Headteacher)shall not exceed 40
School facilities:All weather building with:
� At least one classroom for every teacher� Office cum store cum headteacher’s room� Separate toilets for boys and girls� Safe and adequate drinking water facility to
all children� A kitchen where mid-day meal is cooked in
the school� Playground� Arrangements for securing the school
building by boundary wall or fencing.
Teaching learning equipmentshall be provided to each class as required.
LibraryThere shall be a library in each school providingnewspaper, magazines and books on all subjects,including story-books.
1.1 5.2
6.3 18.6
9.1 12.9
22.2 20.0
30.8 18.2
28.6 50.0
8.1 14.5
83.6 92.663.8 65.643.3 35.956.9 70.36.0 6.2
37.0 23.413.8 6.232.3 33.853.9 60.047.8 22.0
9.4 18.412.2 9.930.6 49.748.3 51.743.5 48.986.7 91.04.1 5.79.2 3.3
81.9 92.130.7 43.8
% Schools that donot meet PTR norms
Office/Store/Office cum storePlaygroundBoundary WallNo facility for drinking waterFacility but no drinking water availableDrinking water availableNo toilet facilityFacility but toilet not useableToilet useable% Schools with no separate provisions for girls toiletsOf schools with separate girls toilets, % schools whereToilet lockedToilet not useableToilet useableTeaching learning material in Std 2Teaching learning material in Std 4No libraryLibrary but no books being used by children on day of visitLibrary being used by children on day of visitKitchen shed for cooking midday mealMidday meal served in school on the day of visit

Odisha
Punjab
Rajasthan
Tamil Nadu
Tripura
Uttarakhand


Odisha RURAL
Note: 'OTHER' includes children going to madarssa and EGS.‘NOT IN SCHOOL’ = dropped out + never enrolled.
How to read this table: If a child started school in Std I at age 6, she should be age 8 inStd 3. This table shows the age distribution for each class. For example, in Std III,65.6% children are 8 years old but there are also 11.7% who are 7, 12.8% who are 9years old, etc.
Chart 1: Trends over time% Children out of school by age group and gender 2006-2011
How to read this chart: For example, the proportion of girls (age 11-14) not in schoolhas changed from 13.7% in 2006 to 12.4% in 2007 to 12% in 2008 to 9.9% in 2009to 7.2% in 2010 to 6.4% in 2011
ALL ANALYSIS BASED ON DATA FROM HOUSEHOLDS. 30 OUT OF 30 DISTRICTS
TotalAge group Govt. Pvt. Other Not inSchool
91.2 5.0 0.1 3.7 100
86.8 5.5 0.1 7.6 100
93.3 4.5 0.1 2.1 100
93.8 4.4 0.1 1.7 100
92.8 4.6 0.1 2.5 100
89.2 4.9 0.1 5.8 100
89.1 5.5 0.1 5.4 100
89.2 4.3 0.1 6.4 100
66.8 9.1 0.0 24.1 100
68.7 9.4 0.0 22.0 100
64.7 8.8 0.0 26.4 100
Age: 6-14 ALL
Age: 7-16 ALL
Age: 7-10 ALL
Age: 7-10 BOYS
Age: 7-10 GIRLS
Age: 11-14 ALL
Age: 11-14 BOYS
Age: 11-14 GIRLS
Age: 15-16 ALL
Age: 15-16 BOYS
Age: 15-16 GIRLS
I
II
III
IV
V
VI
VII
VIII
Table 2: Sample description% Children in each class by age 2011
5 6 7 8 9 10 11 12 13 14 15 16 Total
40.5 46.8 7.7 5.1
3.1 15.9 61.3 14.4 5.4
3.7 11.7 65.6 12.8 6.3
3.4 13.2 60.5 16.3 6.6
2.6 7.0 69.0 12.6 8.9
2.4 11.3 57.6 21.7 7.1
4.5 8.2 66.7 13.5 7.1
4.0 14.2 59.5 16.2 6.1
100
100
100
100
100
100
100
100
Std.
Table 1: % Children in different types of schools 2011
189ASER 2011
School enrollment and out of school children
Young children in pre-school and school
% C
hild
ren
% C
hild
ren
% C
hild
ren
Chart 2: Trends over time% Children enrolled in private school by class 2007, 2009 & 2011
Chart 3: Trends over timeFive year olds in pre-school & school 2007, 2009 & 2011
Tota
l
In SchoolIn balwadi
oranganwadi
In LKG/UKG
Age 5
Age 6
Govt Pvt Other
28.5 2.6 61.1 6.0 0.2 1.6 100
4.5 1.8 84.6 7.6 0.3 1.3 100
Not
enr
olle
dan
ywh
ere
Table 3: % Children age 5-6 who are enrolled in differenttypes of pre-school & school 2011

Reading Tool
Odisha RURAL
How to read this table: Each cell shows the highest level of reading achieved by a child.For example, in Std III, 8% children cannot even read letters, 22.6% can read lettersbut not more, 29.1% can read words but not Std 1 text or higher, 23.4% can read Std1 text but not Std 2 level text, and 16.9% can read Std 2 level text. In sum, for eachclass, the total of all these exclusive categories is 100%.
Std. NothingLevel 1
(Std 1 Text)Level 2
(Std 2 Text) Total
I
II
III
IV
V
VI
VII
VIII
Total
44.9 34.5 13.2 3.5 3.8 100
16.9 34.8 29.0 11.2 8.1 100
8.0 22.6 29.1 23.4 16.9 100
4.5 13.3 24.2 29.6 28.5 100
3.1 8.3 19.3 30.3 39.1 100
0.9 4.8 12.8 26.3 55.2 100
1.3 3.9 9.2 21.5 64.1 100
0.9 2.1 5.6 15.5 75.9 100
11.1 16.3 18.0 19.9 34.7 100
Chart 5: Trends over time% Children in Std V who CANNOT READ Std II LEVEL TEXTBy school type 2008-2011
Chart 4: Trends over time% Children in Std III who CANNOT READ Std I LEVEL TEXTBy school type 2008-2011
Letter Word
Table 4: % Children by class and READING levelAll schools 2011
Note : In ASER 2011 for every state, reading tools were provided in the main mediumof instruction in government schools. Children and their families were also askedabout the language they speak at home. For home languages, a list of 122 languageswas provided to all survey teams. This list includes 22 Scheduled languages and 100Non-Scheduled languages. The data in this table is for children for whom we haveinformation for both school language and home language
Table 5: School language and home language
% Children whose :
Home language is the same as school language
Home language is different from school language
Total
%
190 ASER 2011
91.9
8.1
100.0
Home language and school language
Reading
% C
hild
ren
% C
hild
ren

Math Tool
How to read this table: Each cell shows the highest level of arithmetic achieved by achild. For example, in Std III, 8.2% children cannot even recognize numbers 1-9, 28.9%children can recognize numbers up to 9 but not more, 34.9% can recognize numbers to99 but cannot do subtraction, 21.2% can do subtraction but not division, and 6.8% cando division. In sum, for each class, the total of all these exclusive categories is 100%.
Std. Nothing Subtract Divide Total
I
II
III
IV
V
VI
VII
VIII
Total
47.0 35.8 12.8 3.2 1.3 100
18.1 39.5 29.1 10.8 2.4 100
8.2 28.9 34.9 21.2 6.8 100
4.3 18.7 32.5 29.5 15.1 100
3.0 14.4 26.7 33.7 22.2 100
1.4 8.9 20.9 33.7 35.1 100
1.7 6.8 18.0 31.4 42.1 100
1.3 5.3 11.3 29.3 52.9 100
11.6 20.4 23.3 23.6 21.1 100
Recognize Numbers11-991-9
Chart 7: Trends over time% Children in Std V who CANNOT DO DIVISIONBy school type 2008-2011
Chart 6: Trends over time% Children in Std III who CANNOT RECOGNISE NUMBERSupto 100. By school type 2008-2011
Odisha RURAL
Table 7: Class-wise % children attending PAID TUITION CLASSESBy school type 2007, 2009, 2010 and 2011
Note: In 2007, 2009, 2010 and 2011 the ASER survey recorded information abouttuition. In all 4 years, the question asked was the following: “Does the child take anypaid additional class currently?” Therefore, these numbers do not include anysupplemental help in learning that children may have received from parents, siblingsor from anyone else who did not require payment.
Year School I II III IV V VI VII VIII Total
2007
2009
2010
2011
Govt
Pvt
Govt
Pvt
Govt
Pvt
Govt
Pvt
Table 6: % Children by class and ARITHMETIC levelAll schools 2011
191ASER 2011
32.9 45.5 43.7 50.3 50.8 51.5 51.0 52.1 46.7
57.0 60.8 40.1 52.6 62.3 42.3 55.3 36.8 50.5
35.6 44.5 51.6 50.2 52.2 55.3 55.8 56.0 49.7
64.9 68.7 81.9 67.9 81.2 66.1 68.1 60.9 69.1
36.2 41.2 49.1 48.8 49.9 54.7 52.0 55.2 48.1
54.4 65.7 81.1 68.7 78.3 72.9 67.5 48.4 64.9
29.6 39.9 43.6 48.6 45.9 50.4 51.8 50.8 44.8
62.0 55.5 63.7 61.2 75.2 75.0 69.5 55.4 63.2
Arithmetic
Tuition
% C
hild
ren
% C
hild
ren

As part of ASER 2007, 2009, 2010 and 2011, in each sampled village, one government school with primary sections was visited on the day of the survey.
Information about schools in this report is based on these visits.
Odisha RURAL
2007 2009 2010 2011 2007 2009 2010 2011
Std I-IV/V Std I-VII/VIIIType of school
% Enrolledchildren present(average)
% Schools with lessthan 50% enrolledchildren present(average)
% Schools with75% or moreenrolled childrenpresent (average)
2007 2009 2010 2011 2007 2009 2010 2011
Std I-IV/V Std I-VII/VIIIType of school
% Teachers present(average)
% Schools withno teacherspresent(average)
% Schools withall teacherspresent(average)
Std I-IV/V Std I-VII/VIII2010 2011 2010 2011
% Schools with:
No Headteacher appointed
Headteacher appointed but not present attime of visitHeadteacher appointed & present at timeof visit
Total
Std I-IV/V Std I-VII/VIII2010 2011 2010 2011
% Schools with:
No computer
Computers but no children using them onday of visitComputers & children using them on dayof visit
Total
2007Type of school
Std I-IV/V: Primary
Std I-VII/VIII: Primary + Upper primary
Total schools visited
2009 2010 2011
Table 8: Total schools visited 2007, 2009, 2010 and 2011
Table 9: Student attendance 2007, 2009, 2010 and 2011
Table 11: Headteachers 2010 & 2011 Table 12: Computers 2010 and 2011
Table 10: Teacher attendance 2007, 2009, 2010 and 2011
192 ASER 2011
5.8 3.9 8.1 4.9
6.2 8.5 10.8 9.3
88.0 87.6 81.2 85.8
100 100 100 100
97.5 95.1 88.1 87.8
1.7 3.5 3.8 5.5
0.8 1.4 8.2 6.7
100 100 100 100
406 403 383 390
306 344 358 379
712 747 741 769
72.4 74.1 71.9 77.7 70.1 73.0 72.3 72.8
12.9 8.3 11.9 4.7 13.2 9.1 9.6 8.1
51.6 54.8 51.5 61.9 44.7 50.5 51.4 47.0
91.1 92.3 89.1 91.5 87.2 90.4 83.8 87.9
0.4 0.0 1.3 0.3 0.0 0.4 0.7 0.7
77.9 80.1 74.3 77.7 62.3 71.1 56.0 61.9
2007 2009 2010 2011
Std I-IV/V
2007 2009 2010 2011
Std I-VII/VIII% Schools with:
Std II children sitting with one or more other classes
Table 13: Multigrade classes 2007, 2009, 2010 and 2011
72.1 70.8 77.0 80.0 65.1 71.9 69.4 73.5
59.1 64.9 66.8 69.9 48.8 62.4 58.1 61.7Std IV children sitting with one or more other classes
School observations
Other school information
Student and teacher attendance

Odisha RURAL
How much goes toeach school For what purposes
SCHOOL DEVELOPMENT GRANT / SCHOOL GRANT
Rs.5000 per year perprimary school
Rs.7000 per year per upperprimary school
Rs 5000 + Rs 7000 =Rs 12000 if the school isStd I-VII/VIII.
Note: Primary and UpperPrimary schools are treatedas separate schools even ifthey are in the same pre-mises.
This grant can be used forbuying school equipmentsuch as blackboard, sittingmats etc. Also for buyingchalk, duster, registers andother office equipment.
The grant amount varies bytype of school: whether it isa primary or upper primaryschool.
SCHOOL MAINTENANCE GRANT
Rs.5000 - Rs 7500 perschool per year if the schoolhas upto 3 classrooms.
Rs 7500 - Rs.10000 per yearif the school has more than3 classrooms.
Primary and Upper Primaryschools are treated asseparate schools even ifthey are in the samebuilding.
TLM GRANT
This grant can be used byteachers to buy teachingaids, such as charts, globes,posters, models etc.
Rs.500 per teacher per yearin primary and upper pri-mary schools.
1 For more information see www.accountabilityinitiative.in
193ASER 2011
School funds and activities (PAISA)
This grant can be used formaintenance of schoolbuilding, includingwhitewashing;beautification; and repair oftoilets, hand pump,boundary wall, playgroundetc.
The grant amount dependson number of classrooms(excluding Headmasterroom and office room)
DID SCHOOLS GET THEIR MONEY ON TIME?
2008-2009 2009-2010 2010-2011SSA school
grants% Schools % Schools % SchoolsNo.
ofSch.
No.of
Sch.Yes No Don’tknow
DID SCHOOLS GET THEIR MONEY ON TIME?
April 2009 toOctober 2009
April 2010 toOctober 2010
April 2011 toOctober 2011
% Schools % Schools % SchoolsNo.of
Sch.
No.of
Sch.
No.of
Sch.Yes No Don’tknow
Type of Activity
Yes No Don'tknow
New Classroom
Repair of building (roof, floor, wall etc.)
Repair of doors & windows
Repair of boundary wall
Repair of drinking water facility
Repair of toilet
White wash/plastering
Painting Blackboard/Display Board/Painting on wall
Painting of doors & walls
Purchase of furniture (cupboard etc.)
Purchase of electrical fittings
Purchase of chalk, duster, register etc.
Purchase of sitting Mats/Tat Patti
Purchase of charts, globes & other teaching material
Expenditure on school events
Payment of bills (electricity, water, cleaning etc.)
Const.
Repairs
Painting
& White
Wash
Purchase
Other
Table 15: % Schools who report receiving SSA grants - Half financial year
Table 16: % Schools carrying out different activities since April 2010
Table 14: % Schools who report receiving SSA grants - Full financial year
606 65.2 20.6 14.2 572 85.7 4.6 9.8 730 82.5 5.8 11.8
598 72.1 14.1 13.9 540 86.7 4.1 9.3 719 82.2 6.3 11.5
610 86.6 5.3 8.2 555 92.3 2.3 5.4 718 84.5 6.3 9.2
529 52.2 31.0 16.8 530 71.7 14.9 13.4 720 76.5 13.2 10.3
518 59.3 24.9 15.8 495 72.9 15.0 12.1 710 76.2 13.4 10.4
523 76.5 13.2 10.3 505 76.6 13.1 10.3 693 60.6 30.3 9.1
35.5 59.5 5.0
65.8 29.0 5.2
54.6 40.6 4.8
33.8 61.7 4.6
47.7 47.9 4.4
36.5 58.7 4.7
79.0 16.7 4.3
76.5 20.2 3.3
67.3 29.3 3.5
49.4 44.7 6.0
25.3 69.6 5.1
85.9 10.8 3.3
32.9 62.9 4.3
78.2 17.7 4.1
76.7 17.7 5.6
26.8 67.7 5.5
% schools
Ma intenancegrantDeve lopmentgrant
TLM grant
Yes No Don’tknow
Yes No Don’tknow
SSA school
grants
Ma intenancegrantDeve lopmentgrant
TLM grant
Yes No Don’tknow
Yes No Don’tknow
No.of
Sch.
EVERY RURAL GOVERNMENT PRIMARY SCHOOLIS ENTITLED TO EACH OF THESE SSA GRANTSEVERY YEAR.
The PAISA section of ASER tracks receipt and spending
of Sarva Shiksha Abhiyan (SSA) grants at the school
level. This information is collected from schools visited
during the survey. This page reports proportion of
schools receiving the grants and carrying out specified
activities in the schools. More detailed analysis of the
PAISA data will be available in the PAISA 2011 report
which will be released in March 2012.1

Odisha RURAL
Note : For schools with enrollment above 200children the PTR shall not exceed 40 excludingthe Head Teacher
As part of ASER 2010 and 2011, in each sampled village, onegovernment school with primary sections was visited on theday of the survey. During this school visit, RTE indicators wereobserved and are reported here.
Note: School observations for ASER 2011 looked at TLM for Std II and Std IV only.
2010 2011School
enrollment No. ofschools
No. ofschools
% ofschools
% ofschools
RTETeacherNorms
1-60
61-90
91-120
121-150
151-200
> 200
TOTAL
2011Schoolenrollment
2010
2
3
4
5
5 + HMsee note
2010
1
2
3
4
5
6
>=7
TOTAL
2011
Numberof
teachersNo.of
schools
No.of
schools
%of
schools
%of
schools
RTE norm:At least one
classroom perteacher
1
2
3
4
5
6
>=7
TOTAL
20112010
% Schools that do notmeet classroom to teacher
normsNumber ofteachers
% of schools with 2011
Building
DrinkingWater
Toilet
Girls Toilet
TLM
Library
MDM
Table 17: Schools by totalenrollment 2010 and 2011
Table 18: RTE norms: Pupil-teacherratio 2010 and 2011
Table 19: Schools by number ofteachers 2010 and 2011
Table 20: RTE norms: Teacher -classroom ratio 2010 and 2011
Table 21: % Schools meeting selected RTE norms on facilities 2010 & 2011
2010
1-60
61-90
91-120
121-150
151-200
> 200
TOTAL
194 ASER 2011
155 21.4 187 24.9
120 16.6 113 15.1
111 15.3 91 12.1
78 10.8 94 12.5
103 14.2 110 14.7
158 21.8 156 20.8
725 100.0 751 100.0
121 22.6 132 22.9
131 24.4 141 24.4
93 17.4 92 15.9
75 14.0 88 15.3
45 8.4 46 8.0
37 6.9 32 5.6
34 6.3 46 8.0
536 100.0 577 100.0
9.2 8.7
25.0 17.7
32.0 20.8
29.4 31.0
38.9 35.3
40.0 35.7
38.9 38.9
26.0 20.9
Right to Education indicators
Extracts from the Schedule of The Right of Children toFree and Compulsory Education Act 2009 Norms andstandards for a School (Sections 19 and 25)
Number of teachers in Std 1-5:� Admitted children No. of teachers
<= 60 261-90 391-120 4121-200 5> 150 5 + 1 Headteacher> 200 Pupil-Teacher Ratio
(excluding Headteacher)shall not exceed 40
School facilities:All weather building with:
� At least one classroom for every teacher� Office cum store cum headteacher’s room� Separate toilets for boys and girls� Safe and adequate drinking water facility to
all children� A kitchen where mid-day meal is cooked in
the school� Playground� Arrangements for securing the school
building by boundary wall or fencing.
Teaching learning equipmentshall be provided to each class as required.
LibraryThere shall be a library in each school providingnewspaper, magazines and books on all subjects,including story-books.
60.4 58.0
73.3 73.0
79.8 74.7
91.5 78.6
78.2 79.8
84.6 84.0
77.5 74.3
74.6 83.044.5 36.840.7 46.415.2 11.214.5 14.370.3 74.515.5 14.940.1 33.344.4 51.830.3 25.2
19.5 10.215.5 17.834.7 46.881.3 84.276.9 81.834.7 15.318.5 18.246.8 66.574.3 78.588.6 93.5
% Schools that donot meet PTR norms
Office/Store/Office cum storePlaygroundBoundary WallNo facility for drinking waterFacility but no drinking water availableDrinking water availableNo toilet facilityFacility but toilet not useableToilet useable% Schools with no separate provisions for girls toiletsOf schools with separate girls toilets, % schools whereToilet lockedToilet not useableToilet useableTeaching learning material in Std 2Teaching learning material in Std 4No libraryLibrary but no books being used by children on day of visitLibrary being used by children on day of visitKitchen shed for cooking midday mealMidday meal served in school on the day of visit

Punjab RURAL
Note: 'OTHER' includes children going to madarssa and EGS.‘NOT IN SCHOOL’ = dropped out + never enrolled.
How to read this table: If a child started school in Std I at age 6, she should be age 8 inStd 3. This table shows the age distribution for each class. For example, in Std III,35.9% children are 8 years old but there are also 15.8% who are 7, 25.7% who are 9,12.9% who are 10 years old, etc.
Chart 1: Trends over time% Children out of school by age group and gender 2006-2011
How to read this chart: For example, the proportion of girls (age 11-14) not in schoolhas changed from 5% in 2006 to 4.9% in 2007 to 4.9% in 2008 to 6.2% in 2009 to2.7% in 2010 to 2.6% in 2011
ALL ANALYSIS BASED ON DATA FROM HOUSEHOLDS 19 OUT OF 19 DISTRICTS
TotalAge group Govt. Pvt. Other Not inSchool
58.4 39.6 0.4 1.6 100
59.7 37.0 0.4 2.9 100
56.8 42.4 0.3 0.5 100
52.9 46.1 0.4 0.6 100
61.6 37.8 0.2 0.4 100
62.4 34.3 0.5 2.8 100
60.7 36.1 0.3 2.9 100
64.6 32.0 0.8 2.6 100
60.7 28.6 0.4 10.3 100
61.1 28.9 0.4 9.6 100
60.2 28.2 0.5 11.2 100
Age: 6-14 ALL
Age: 7-16 ALL
Age: 7-10 ALL
Age: 7-10 BOYS
Age: 7-10 GIRLS
Age: 11-14 ALL
Age: 11-14 BOYS
Age: 11-14 GIRLS
Age: 15-16 ALL
Age: 15-16 BOYS
Age: 15-16 GIRLS
I
II
III
IV
V
VI
VII
VIII
Table 2: Sample description% Children in each class by age 2011
5 6 7 8 9 10 11 12 13 14 15 16 Total
29.0 37.6 20.5 8.8 4.0
4.6 15.6 34.6 30.9 9.2 5.0
4.0 15.8 35.9 25.7 12.9 5.7
2.9 13.7 30.0 33.1 13.4 6.9
3.6 11.3 38.9 27.2 13.1 5.9
3.4 12.5 29.9 36.4 12.2 5.4
3.3 10.5 31.5 34.8 14.4 5.6
2.6 11.4 31.3 34.0 16.4 4.3
100
100
100
100
100
100
100
100
Std.
Table 1: % Children in different types of schools 2011
195ASER 2011
School enrollment and out of school children
Young children in pre-school and school
% C
hild
ren
% C
hild
ren
% C
hild
ren
Chart 2: Trends over time% Children enrolled in private school by class 2007, 2009 & 2011
Chart 3: Trends over timeFive year olds in pre-school & school 2007, 2009 & 2011
Tota
l
In SchoolIn balwadi
oranganwadi
In LKG/UKG
Age 5
Age 6
Govt Pvt Other
10.0 10.8 30.1 47.2 0.2 1.7 100
2.0 5.8 44.8 45.8 0.5 1.2 100
Not
enr
olle
dan
ywh
ere
Table 3: % Children age 5-6 who are enrolled in differenttypes of pre-school & school 2011

Reading Tool
Punjab RURAL
How to read this table: Each cell shows the highest level of reading achieved by a child.For example, in Std III, 1.7% children cannot even read letters, 12.3% can read lettersbut not more, 27.5% can read words but not Std 1 text or higher, 30.0% can read Std1 text but not Std 2 level text, and 28.7% can read Std 2 level text. In sum, for eachclass, the total of all these exclusive categories is 100%.
Std. NothingLevel 1
(Std 1 Text)Level 2
(Std 2 Text) Total
I
II
III
IV
V
VI
VII
VIII
Total
21.9 50.6 19.9 3.8 3.9 100
4.8 29.1 39.8 15.4 10.9 100
1.7 12.3 27.5 29.9 28.7 100
1.0 6.7 11.8 26.1 54.4 100
0.8 4.7 7.6 15.1 71.9 100
0.9 2.9 5.4 11.5 79.3 100
0.8 2.0 2.7 8.8 85.7 100
0.8 1.8 2.6 6.1 88.7 100
4.2 14.6 15.8 15.2 50.2 100
Chart 5: Trends over time% Children in Std V who CANNOT READ Std II LEVEL TEXTBy school type 2008-2011
Chart 4: Trends over time% Children in Std III who CANNOT READ Std I LEVEL TEXTBy school type 2008-2011
Letter Word
Table 4: % Children by class and READING levelAll schools 2011
Note : In ASER 2011 for every state, reading tools were provided in the main mediumof instruction in government schools. Children and their families were also askedabout the language they speak at home. For home languages, a list of 122 languageswas provided to all survey teams. This list includes 22 Scheduled languages and 100Non-Scheduled languages. The data in this table is for children for whom we haveinformation for both school language and home language.
Table 5: School language and home language
% Children whose :
Home language is the same as school language
Home language is different from school language
Total
%
196 ASER 2011
81.4
18.6
100.0
Home language and school language
Reading
% C
hild
ren
% C
hild
ren

Math Tool
How to read this table: Each cell shows the highest level of arithmetic achieved by achild. For example, in Std III, 1.8% children cannot even recognize numbers 1-9, 11.3%children can recognize numbers up to 9 but not more, 25.4% can recognize numbers to99 but cannot do subtraction, 45.1% can do subtraction but not division, and 16.4% cando division. In sum, for each class, the total of all these exclusive categories is 100%.
Std. Nothing Subtract Divide Total
I
II
III
IV
V
VI
VII
VIII
Total
17.2 41.4 31.0 7.3 3.1 100
2.8 22.0 41.0 30.9 3.3 100
1.8 11.3 25.4 45.1 16.4 100
1.1 5.9 16.4 33.1 43.5 100
0.7 5.1 10.4 22.5 61.3 100
0.6 2.6 10.4 20.3 66.1 100
0.6 1.2 8.9 19.7 69.6 100
0.9 1.2 8.8 15.6 73.5 100
3.3 12.0 20.0 25.1 39.7 100
Recognize Numbers11-991-9
Chart 7: Trends over time% Children in Std V who CANNOT DO DIVISIONBy school type 2008-2011
Chart 6: Trends over time% Children in Std III who CANNOT RECOGNISE NUMBERSupto 100. By school type 2008-2011
Punjab RURAL
Table 7: Class-wise % children attending PAID TUITION CLASSESBy school type 2007, 2009, 2010 and 2011
Note: In 2007, 2009, 2010 and 2011 the ASER survey recorded information abouttuition. In all 4 years, the question asked was the following: “Does the child take anypaid additional class currently?” Therefore, these numbers do not include anysupplemental help in learning that children may have received from parents, siblingsor from anyone else who did not require payment.
Year School I II III IV V VI VII VIII Total
2007
2009
2010
2011
Govt
Pvt
Govt
Pvt
Govt
Pvt
Govt
Pvt
Table 6: % Children by class and ARITHMETIC levelAll schools 2011
197ASER 2011
9.1 11.7 13.8 13.6 16.2 14.6 12.6 20.4 14.4
22.8 20.9 23.0 30.9 28.7 20.7 26.2 29.6 25.1
13.3 15.1 23.8 19.7 23.1 17.6 21.4 28.1 20.8
29.3 30.4 37.6 30.8 41.5 31.5 35.6 43.9 35.0
8.5 9.1 11.5 9.4 10.5 10.8 9.2 11.6 10.1
25.4 26.5 29.4 32.0 31.0 32.9 29.8 24.3 28.7
6.2 8.5 8.7 9.0 9.9 10.4 7.3 7.0 8.5
19.4 23.8 25.7 26.4 22.5 25.7 23.5 23.5 23.7
Arithmetic
Tuition
% C
hild
ren
% C
hild
ren

As part of ASER 2007, 2009, 2010 and 2011, in each sampled village, one government school with primary sections was visited on the day of the survey.
Information about schools in this report is based on these visits.
Punjab RURAL
2007 2009 2010 2011 2007 2009 2010 2011
Std I-IV/V Std I-VII/VIIIType of school
% Enrolledchildren present(average)
% Schools with lessthan 50% enrolledchildren present(average)
% Schools with75% or moreenrolled childrenpresent (average)
2007 2009 2010 2011 2007 2009 2010 2011
Std I-IV/V Std I-VII/VIIIType of school
% Teachers present(average)
% Schools withno teacherspresent(average)
% Schools withall teacherspresent(average)
Std I-IV/V Std I-VII/VIII2010 2011 2010 2011
% Schools with:
No Headteacher appointed
Headteacher appointed but not present attime of visitHeadteacher appointed & present at timeof visit
Total
Std I-IV/V Std I-VII/VIII2010 2011 2010 2011
% Schools with:
No computer
Computers but no children using them onday of visitComputers & children using them on dayof visit
Total
2007Type of school
Std I-IV/V: Primary
Std I-VII/VIII: Primary + Upper primary
Total schools visited
2009 2010 2011
Table 8: Total schools visited 2007, 2009, 2010 and 2011
Table 9: Student attendance 2007, 2009, 2010 and 2011
Table 11: Headteachers 2010 & 2011 Table 12: Computers 2010 and 2011
Table 10: Teacher attendance 2007, 2009, 2010 and 2011
198 ASER 2011
3.5 1.2 0.0 0.0
3.5 3.6 7.1 11.8
92.9 95.2 92.9 88.2
100 100 100 100
94.0 93.1 57.9 56.3
3.7 4.9 17.5 21.9
2.4 2.0 24.6 21.9
100 100 100 100
383 431 391 457
61 38 58 32
444 469 449 489
80.6 84.4 82.5 81.7 82.6 85.6 84.4 79.6
3.8 1.7 0.0 2.2 1.8 0.0 0.0 0.0
72.3 82.5 78.1 77.7 82.1 86.5 87.9 75.0
85.6 84.8 89.1 87.1 87.3 82.2 84.6 84.1
0.0 0.3 0.3 0.2 0.0 0.0 0.0 0.0
57.9 54.7 64.2 60.2 46.2 41.9 54.0 48.3
2007 2009 2010 2011
Std I-IV/V
2007 2009 2010 2011
Std I-VII/VIII% Schools with:
Std II children sitting with one or more other classes
Table 13: Multigrade classes 2007, 2009, 2010 and 2011
47.4 45.6 53.3 44.2 35.0 41.7 47.4 36.7
37.4 46.5 39.1 41.5 33.9 40.6 26.5 36.7Std IV children sitting with one or more other classes
School observations
Other school information
Student and teacher attendance
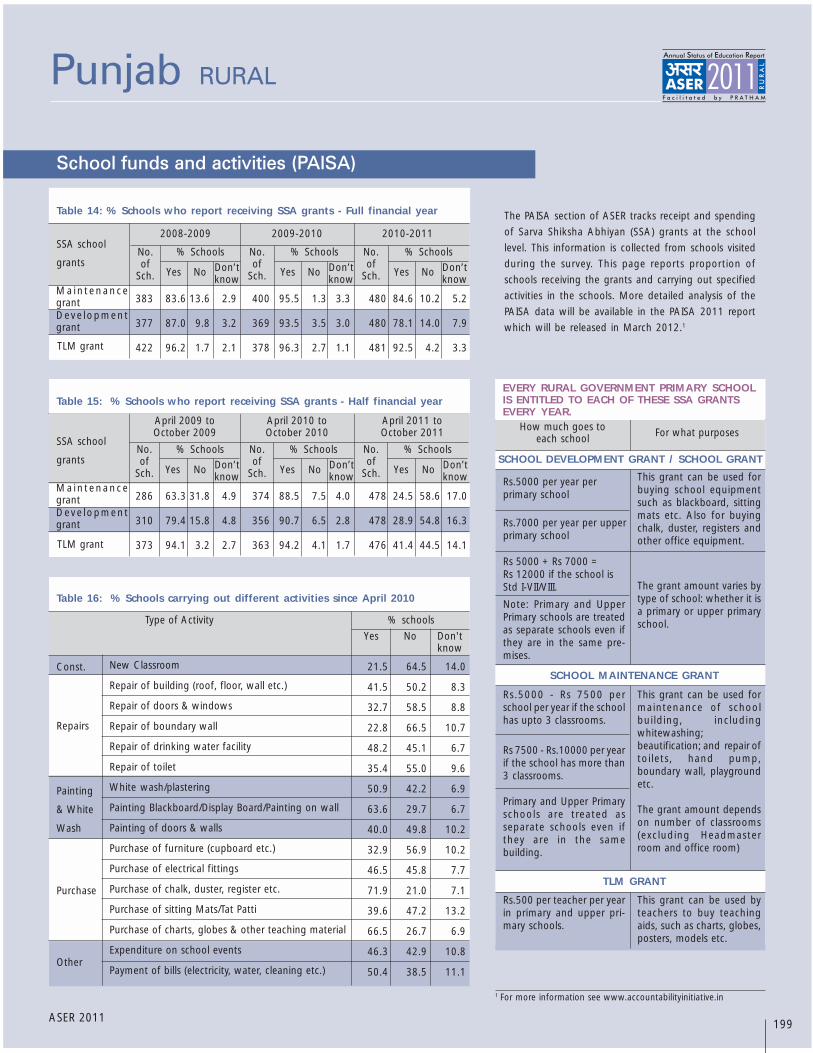
Punjab RURAL
How much goes toeach school For what purposes
SCHOOL DEVELOPMENT GRANT / SCHOOL GRANT
Rs.5000 per year perprimary school
Rs.7000 per year per upperprimary school
Rs 5000 + Rs 7000 =Rs 12000 if the school isStd I-VII/VIII.
Note: Primary and UpperPrimary schools are treatedas separate schools even ifthey are in the same pre-mises.
This grant can be used forbuying school equipmentsuch as blackboard, sittingmats etc. Also for buyingchalk, duster, registers andother office equipment.
The grant amount varies bytype of school: whether it isa primary or upper primaryschool.
SCHOOL MAINTENANCE GRANT
Rs.5000 - Rs 7500 perschool per year if the schoolhas upto 3 classrooms.
Rs 7500 - Rs.10000 per yearif the school has more than3 classrooms.
Primary and Upper Primaryschools are treated asseparate schools even ifthey are in the samebuilding.
TLM GRANT
This grant can be used byteachers to buy teachingaids, such as charts, globes,posters, models etc.
Rs.500 per teacher per yearin primary and upper pri-mary schools.
1 For more information see www.accountabilityinitiative.in
199ASER 2011
School funds and activities (PAISA)
This grant can be used formaintenance of schoolbuilding, includingwhitewashing;beautification; and repair oftoilets, hand pump,boundary wall, playgroundetc.
The grant amount dependson number of classrooms(excluding Headmasterroom and office room)
DID SCHOOLS GET THEIR MONEY ON TIME?
2008-2009 2009-2010 2010-2011SSA school
grants% Schools % Schools % SchoolsNo.
ofSch.
No.of
Sch.Yes No Don’tknow
DID SCHOOLS GET THEIR MONEY ON TIME?
April 2009 toOctober 2009
April 2010 toOctober 2010
April 2011 toOctober 2011
% Schools % Schools % SchoolsNo.of
Sch.
No.of
Sch.
No.of
Sch.Yes No Don’tknow
Type of Activity
Yes No Don'tknow
New Classroom
Repair of building (roof, floor, wall etc.)
Repair of doors & windows
Repair of boundary wall
Repair of drinking water facility
Repair of toilet
White wash/plastering
Painting Blackboard/Display Board/Painting on wall
Painting of doors & walls
Purchase of furniture (cupboard etc.)
Purchase of electrical fittings
Purchase of chalk, duster, register etc.
Purchase of sitting Mats/Tat Patti
Purchase of charts, globes & other teaching material
Expenditure on school events
Payment of bills (electricity, water, cleaning etc.)
Const.
Repairs
Painting
& White
Wash
Purchase
Other
Table 15: % Schools who report receiving SSA grants - Half financial year
Table 16: % Schools carrying out different activities since April 2010
Table 14: % Schools who report receiving SSA grants - Full financial year
383 83.6 13.6 2.9 400 95.5 1.3 3.3 480 84.6 10.2 5.2
377 87.0 9.8 3.2 369 93.5 3.5 3.0 480 78.1 14.0 7.9
422 96.2 1.7 2.1 378 96.3 2.7 1.1 481 92.5 4.2 3.3
286 63.3 31.8 4.9 374 88.5 7.5 4.0 478 24.5 58.6 17.0
310 79.4 15.8 4.8 356 90.7 6.5 2.8 478 28.9 54.8 16.3
373 94.1 3.2 2.7 363 94.2 4.1 1.7 476 41.4 44.5 14.1
21.5 64.5 14.0
41.5 50.2 8.3
32.7 58.5 8.8
22.8 66.5 10.7
48.2 45.1 6.7
35.4 55.0 9.6
50.9 42.2 6.9
63.6 29.7 6.7
40.0 49.8 10.2
32.9 56.9 10.2
46.5 45.8 7.7
71.9 21.0 7.1
39.6 47.2 13.2
66.5 26.7 6.9
46.3 42.9 10.8
50.4 38.5 11.1
% schools
Ma intenancegrantDeve lopmentgrant
TLM grant
Yes No Don’tknow
Yes No Don’tknow
SSA school
grants
Ma intenancegrantDeve lopmentgrant
TLM grant
Yes No Don’tknow
Yes No Don’tknow
No.of
Sch.
EVERY RURAL GOVERNMENT PRIMARY SCHOOLIS ENTITLED TO EACH OF THESE SSA GRANTSEVERY YEAR.
The PAISA section of ASER tracks receipt and spending
of Sarva Shiksha Abhiyan (SSA) grants at the school
level. This information is collected from schools visited
during the survey. This page reports proportion of
schools receiving the grants and carrying out specified
activities in the schools. More detailed analysis of the
PAISA data will be available in the PAISA 2011 report
which will be released in March 2012.1

Punjab RURAL
Note : For schools with enrollment above 200children the PTR shall not exceed 40 excludingthe Head Teacher
As part of ASER 2010 and 2011, in each sampled village, onegovernment school with primary sections was visited on theday of the survey. During this school visit, RTE indicators wereobserved and are reported here.
Note: School observations for ASER 2011 looked at TLM for Std II and Std IV only.
2010 2011School
enrollment No. ofschools
No. ofschools
% ofschools
% ofschools
RTETeacherNorms
1-60
61-90
91-120
121-150
151-200
> 200
TOTAL
2011Schoolenrollment
2010
2
3
4
5
5 + HMsee note
2010
1
2
3
4
5
6
>=7
TOTAL
2011
Numberof
teachersNo.of
schools
No.of
schools
%of
schools
%of
schools
RTE norm:At least one
classroom perteacher
1
2
3
4
5
6
>=7
TOTAL
20112010
% Schools that do notmeet classroom to teacher
normsNumber ofteachers
% of schools with 2011
Building
DrinkingWater
Toilet
Girls Toilet
TLM
Library
MDM
Table 17: Schools by totalenrollment 2010 and 2011
Table 18: RTE norms: Pupil-teacherratio 2010 and 2011
Table 19: Schools by number ofteachers 2010 and 2011
Table 20: RTE norms: Teacher -classroom ratio 2010 and 2011
Table 21: % Schools meeting selected RTE norms on facilities 2010 & 2011
2010
1-60
61-90
91-120
121-150
151-200
> 200
TOTAL
200 ASER 2011
76 17.2 95 19.6
86 19.5 71 14.6
61 13.8 71 14.6
45 10.2 51 10.5
62 14.0 69 14.2
112 25.3 128 26.4
442 100.0 485 100.0
42 10.8 51 12.2
94 24.1 96 22.9
65 16.7 70 16.7
66 16.9 65 15.5
38 9.7 60 14.3
25 6.4 31 7.4
60 15.4 46 11.0
390 100.0 419 100.0
4.2 0.0
5.2 10.9
19.5 10.6
33.3 26.2
29.6 20.5
61.5 35.0
45.2 33.3
23.1 17.8
Right to Education indicators
Extracts from the Schedule of The Right of Children toFree and Compulsory Education Act 2009 Norms andstandards for a School (Sections 19 and 25)
Number of teachers in Std 1-5:� Admitted children No. of teachers
<= 60 261-90 391-120 4121-200 5> 150 5 + 1 Headteacher> 200 Pupil-Teacher Ratio
(excluding Headteacher)shall not exceed 40
School facilities:All weather building with:
� At least one classroom for every teacher� Office cum store cum headteacher’s room� Separate toilets for boys and girls� Safe and adequate drinking water facility to
all children� A kitchen where mid-day meal is cooked in
the school� Playground� Arrangements for securing the school
building by boundary wall or fencing.
Teaching learning equipmentshall be provided to each class as required.
LibraryThere shall be a library in each school providingnewspaper, magazines and books on all subjects,including story-books.
41.9 46.1
66.2 64.4
57.1 75.0
71.8 68.2
74.0 70.0
76.6 85.7
65.1 69.6
78.9 79.569.1 71.482.8 84.08.9 8.48.0 8.8
83.1 82.90.9 1.9
37.9 39.561.2 58.77.3 4.9
16.9 4.026.5 34.849.4 56.291.8 95.089.2 90.64.1 5.6
30.0 24.066.0 70.494.6 93.998.0 96.4
% Schools that donot meet PTR norms
Office/Store/Office cum storePlaygroundBoundary WallNo facility for drinking waterFacility but no drinking water availableDrinking water availableNo toilet facilityFacility but toilet not useableToilet useable% Schools with no separate provisions for girls toiletsOf schools with separate girls toilets, % schools whereToilet lockedToilet not useableToilet useableTeaching learning material in Std 2Teaching learning material in Std 4No libraryLibrary but no books being used by children on day of visitLibrary being used by children on day of visitKitchen shed for cooking midday mealMidday meal served in school on the day of visit

Rajasthan RURAL
Note: 'OTHER' includes children going to madarssa and EGS.‘NOT IN SCHOOL’ = dropped out + never enrolled.
How to read this table: If a child started school in Std I at age 6, she should be age 8 inStd 3. This table shows the age distribution for each class. For example, in Std III,36.5% children are 8 years old but there are also 18.2% who are 7, 16.6 % who are9, 11.2 % who are 10 years old, etc.
Chart 1: Trends over time% Children out of school by age group and gender 2006-2011
How to read this chart: For example, the proportion of girls (age 11-14) not in schoolhas changed from 19.6% in 2006 to 14.4% in 2007 to 14.8% in 2008 to 12.2% in2009 to 12.1% in 2010 to 8.9% in 2011
ALL ANALYSIS BASED ON DATA FROM HOUSEHOLDS. 31 OUT OF 32 DISTRICTS
TotalAge group Govt. Pvt. Other Not inSchool
60.2 35.1 0.2 4.5 100
59.7 33.4 0.2 6.7 100
59.8 36.9 0.3 3.0 100
56.7 41.0 0.3 2.0 100
63.9 31.5 0.3 4.3 100
61.6 32.0 0.1 6.3 100
59.6 36.2 0.1 4.2 100
64.3 26.7 0.1 8.9 100
55.4 27.6 0.1 16.8 100
56.4 30.3 0.1 13.2 100
54.1 23.5 0.1 22.3 100
Age: 6-14 ALL
Age: 7-16 ALL
Age: 7-10 ALL
Age: 7-10 BOYS
Age: 7-10 GIRLS
Age: 11-14 ALL
Age: 11-14 BOYS
Age: 11-14 GIRLS
Age: 15-16 ALL
Age: 15-16 BOYS
Age: 15-16 GIRLS
I
II
III
IV
V
VI
VII
VIII
Table 2: Sample description% Children in each class by age 2011
5 6 7 8 9 10 11 12 13 14 15 16 Total
38.6 34.8 15.1 6.8 4.8
11.3 22.7 30.7 23.2 5.3 6.9
2.7 7.7 18.2 36.5 16.6 11.2 7.1
2.7 8.1 22.2 24.9 26.6 6.1 6.2 3.2
3.0 9.4 12.9 38.8 17.0 11.9 7.1
9.1 22.0 24.7 27.2 10.0 7.0
2.8 8.7 13.5 37.2 22.4 9.4 6.2
9.4 22.2 29.4 22.4 10.9 5.7
100
100
100
100
100
100
100
100
Std.
Table 1: % Children in different types of schools 2011
201ASER 2011
School enrollment and out of school children
Young children in pre-school and school
% C
hild
ren
% C
hild
ren
% C
hild
ren
Chart 2: Trends over time% Children enrolled in private school by class 2007, 2009 & 2011
Chart 3: Trends over timeFive year olds in pre-school & school 2007, 2009 & 2011
Tota
l
In SchoolIn balwadi
oranganwadi
In LKG/UKG
Age 5
Age 6
Govt Pvt Other
12.3 4.6 42.5 34.4 0.3 6.0 100
2.6 2.8 52.9 37.9 0.2 3.5 100
Not
enr
olle
dan
ywh
ere
Table 3: % Children age 5-6 who are enrolled in differenttypes of pre-school & school 2011

Reading Tool
Rajasthan RURAL
How to read this table: Each cell shows the highest level of reading achieved by a child.For example, in Std III, 8.1% children cannot even read letters, 28.7% can read lettersbut not more, 31.5% can read words but not Std 1 text or higher, 18% can read Std1 text but not Std 2 level text, and 13.8% can read Std 2 level text. In sum, for eachclass, the total of all these exclusive categories is 100%.
Std. NothingLevel 1
(Std 1 Text)Level 2
(Std 2 Text) Total
I
II
III
IV
V
VI
VII
VIII
Total
51.3 34.8 9.1 2.2 2.7 100
19.6 41.6 24.1 8.7 6.0 100
8.1 28.7 31.5 18.0 13.8 100
3.8 15.5 24.4 26.3 30.1 100
2.4 9.7 18.2 27.0 42.7 100
1.0 4.1 8.8 22.3 63.9 100
0.5 2.9 4.7 16.0 75.9 100
0.8 1.9 3.1 11.9 82.3 100
11.3 18.3 16.1 16.5 37.9 100
Chart 5: Trends over time% Children in Std V who CANNOT READ Std II LEVEL TEXTBy school type 2008-2011
Chart 4: Trends over time% Children in Std III who CANNOT READ Std I LEVEL TEXTBy school type 2008-2011
Letter Word
Table 4: % Children by class and READING levelAll schools 2011
Note : In ASER 2011 for every state, reading tools were provided in the main mediumof instruction in government schools. Children and their families were also askedabout the language they speak at home. For home languages, a list of 122 languageswas provided to all survey teams. This list includes 22 Scheduled languages and 100Non-Scheduled languages. The data in this table is for children for whom we haveinformation for both school language and home language.
Table 5: School language and home language
% Children whose :
Home language is the same as school language
Home language is different from school language
Total
%
202 ASER 2011
23.1
76.9
100.0
Home language and school language
Reading
% C
hild
ren
% C
hild
ren

Math Tool
How to read this table: Each cell shows the highest level of arithmetic achieved by achild. For example, in Std III, 7.7% children cannot even recognize numbers 1-9, 35.8%children can recognize numbers up to 9 but not more, 34.9% can recognize numbers to99 but cannot do subtraction, 16.1% can do subtraction but not division, and 5.5% cando division. In sum, for each class, the total of all these exclusive categories is 100%.
Std. Nothing Subtract Divide Total
I
II
III
IV
V
VI
VII
VIII
Total
50.3 37.3 9.3 1.9 1.1 100
18.7 46.9 25.6 6.6 2.2 100
7.7 35.8 34.9 16.1 5.5 100
3.0 21.3 33.3 28.3 14.2 100
2.3 13.2 27.7 33.2 23.7 100
1.0 6.5 18.5 31.9 42.2 100
0.5 4.0 12.3 31.0 52.3 100
0.8 2.7 8.7 25.2 62.7 100
10.8 21.9 21.8 21.4 24.1 100
Recognize Numbers11-991-9
Chart 7: Trends over time% Children in Std V who CANNOT DO DIVISIONBy school type 2008-2011
Chart 6: Trends over time% Children in Std III who CANNOT RECOGNISE NUMBERS upto100. By school type 2008-2011
Rajasthan RURAL
Table 7: Class-wise % children attending PAID TUITION CLASSESBy school type 2007, 2009, 2010 and 2011
Note: In 2007, 2009, 2010 and 2011 the ASER survey recorded information abouttuition. In all 4 years, the question asked was the following: “Does the child take anypaid additional class currently?” Therefore, these numbers do not include anysupplemental help in learning that children may have received from parents, siblingsor from anyone else who did not require payment.
Year School I II III IV V VI VII VIII Total
2007
2009
2010
2011
Govt
Pvt
Govt
Pvt
Govt
Pvt
Govt
Pvt
Table 6: % Children by class and ARITHMETIC levelAll schools 2011
203ASER 2011
1.5 2.1 2.5 3.0 3.6 3.9 5.8 8.9 3.8
6.8 8.8 9.2 11.2 11.1 13.6 13.1 19.6 11.2
3.3 3.6 4.7 4.8 5.8 7.4 7.5 12.0 6.1
12.0 11.4 13.1 11.5 16.1 14.0 13.8 26.5 14.7
1.5 2.6 3.3 4.0 4.6 4.8 5.3 7.9 4.3
7.6 9.3 10.5 12.4 12.9 15.9 15.3 18.9 12.6
0.9 1.4 1.1 1.5 1.7 2.4 2.9 3.1 1.9
7.1 6.9 9.1 8.6 8.9 8.7 9.8 9.7 8.5
Arithmetic
Tuition
% C
hild
ren
% C
hild
ren

As part of ASER 2007, 2009, 2010 and 2011, in each sampled village, one government school with primary sections was visited on the day of the survey.
Information about schools in this report is based on these visits.
Rajasthan RURAL
2007 2009 2010 2011 2007 2009 2010 2011
Std I-IV/V Std I-VII/VIIIType of school
% Enrolledchildren present(average)
% Schools with lessthan 50% enrolledchildren present(average)
% Schools with75% or moreenrolled childrenpresent (average)
2007 2009 2010 2011 2007 2009 2010 2011
Std I-IV/V Std I-VII/VIIIType of school
% Teachers present(average)
% Schools withno teacherspresent(average)
% Schools withall teacherspresent(average)
Std I-IV/V Std I-VII/VIII2010 2011 2010 2011
% Schools with:
No Headteacher appointed
Headteacher appointed but not present attime of visitHeadteacher appointed & present at timeof visit
Total
Std I-IV/V Std I-VII/VIII2010 2011 2010 2011
% Schools with:
No computer
Computers but no children using them onday of visitComputers & children using them on dayof visit
Total
2007Type of school
Std I-IV/V: Primary
Std I-VII/VIII: Primary + Upper primary
Total schools visited
2009 2010 2011
Table 8: Total schools visited 2007, 2009, 2010 and 2011
Table 9: Student attendance 2007, 2009, 2010 and 2011
Table 11: Headteachers 2010 & 2011 Table 12: Computers 2010 and 2011
Table 10: Teacher attendance 2007, 2009, 2010 and 2011
204 ASER 2011
0.9 3.2 2.8 1.7
8.0 7.8 8.3 11.3
91.1 89.0 88.9 87.1
100 100 100 100
96.5 97.4 78.5 66.5
1.8 1.9 14.5 16.9
1.8 0.7 7.0 16.6
100 100 100 100
393 276 290 273
488 594 606 599
881 870 896 872
67.8 72.0 71.2 69.8 72.6 74.2 73.6 70.8
14.4 9.8 9.1 11.6 8.8 6.9 5.8 8.5
41.0 48.4 46.3 45.7 53.4 56.6 50.2 41.3
91.3 92.8 90.1 90.9 85.3 88.9 88.0 86.4
0.3 0.0 0.4 0.4 0.5 0.0 0.2 0.2
74.9 79.5 73.9 75.9 50.7 58.2 53.5 50.3
2007 2009 2010 2011
Std I-IV/V
2007 2009 2010 2011
Std I-VII/VIII% Schools with:
Std II children sitting with one or more other classes
Table 13: Multigrade classes 2007, 2009, 2010 and 2011
67.9 60.5 65.6 77.2 63.9 65.1 66.0 67.0
52.6 52.7 53.6 63.0 46.3 51.5 52.3 53.6Std IV children sitting with one or more other classes
School observations
Other school information
Student and teacher attendance

Rajasthan RURAL
How much goes toeach school For what purposes
SCHOOL DEVELOPMENT GRANT / SCHOOL GRANT
Rs.5000 per year perprimary school
Rs.7000 per year per upperprimary school
Rs 5000 + Rs 7000 =Rs 12000 if the school isStd I-VII/VIII.
Note: Primary and UpperPrimary schools are treatedas separate schools even ifthey are in the same pre-mises.
This grant can be used forbuying school equipmentsuch as blackboard, sittingmats etc. Also for buyingchalk, duster, registers andother office equipment.
The grant amount varies bytype of school: whether it isa primary or upper primaryschool.
SCHOOL MAINTENANCE GRANT
Rs.5000 - Rs 7500 perschool per year if the schoolhas upto 3 classrooms.
Rs 7500 - Rs.10000 per yearif the school has more than3 classrooms.
Primary and Upper Primaryschools are treated asseparate schools even ifthey are in the samebuilding.
TLM GRANT
This grant can be used byteachers to buy teachingaids, such as charts, globes,posters, models etc.
Rs.500 per teacher per yearin primary and upper pri-mary schools.
1 For more information see www.accountabilityinitiative.in
205ASER 2011
School funds and activities (PAISA)
This grant can be used formaintenance of schoolbuilding, includingwhitewashing;beautification; and repair oftoilets, hand pump,boundary wall, playgroundetc.
The grant amount dependson number of classrooms(excluding Headmasterroom and office room)
DID SCHOOLS GET THEIR MONEY ON TIME?
2008-2009 2009-2010 2010-2011SSA school
grants% Schools % Schools % SchoolsNo.
ofSch.
No.of
Sch.Yes No Don’tknow
DID SCHOOLS GET THEIR MONEY ON TIME?
April 2009 toOctober 2009
April 2010 toOctober 2010
April 2011 toOctober 2011
% Schools % Schools % SchoolsNo.of
Sch.
No.of
Sch.
No.of
Sch.Yes No Don’tknow
Type of Activity
Yes No Don'tknow
New Classroom
Repair of building (roof, floor, wall etc.)
Repair of doors & windows
Repair of boundary wall
Repair of drinking water facility
Repair of toilet
White wash/plastering
Painting Blackboard/Display Board/Painting on wall
Painting of doors & walls
Purchase of furniture (cupboard etc.)
Purchase of electrical fittings
Purchase of chalk, duster, register etc.
Purchase of sitting Mats/Tat Patti
Purchase of charts, globes & other teaching material
Expenditure on school events
Payment of bills (electricity, water, cleaning etc.)
Const.
Repairs
Painting
& White
Wash
Purchase
Other
Table 15: % Schools who report receiving SSA grants - Half financial year
Table 16: % Schools carrying out different activities since April 2010
Table 14: % Schools who report receiving SSA grants - Full financial year
771 70.7 23.7 5.6 809 79.1 13.7 7.2 843 81.4 12.3 6.3
720 57.6 36.7 5.7 759 73.4 18.2 8.4 803 62.5 30.6 6.9
781 87.5 8.6 4.0 809 88.8 6.8 4.5 847 86.9 8.2 5.0
645 39.4 53.6 7.0 761 47.7 40.9 11.4 782 50.5 39.9 9.6
619 39.9 53.5 6.6 714 47.5 40.3 12.2 755 41.9 47.8 10.3
650 55.4 39.1 5.5 744 55.9 34.1 10.0 791 57.1 35.0 7.8
16.4 79.7 3.9
46.7 50.1 3.3
38.9 58.0 3.0
20.7 75.8 3.5
37.1 59.9 3.1
28.7 67.8 3.5
49.5 46.9 3.6
63.5 33.5 3.0
43.1 53.9 3.1
42.3 54.0 3.7
34.5 62.6 2.9
88.7 9.3 2.1
44.5 52.9 2.6
76.9 20.8 2.4
55.8 41.3 2.9
49.4 47.1 3.5
% schools
Ma intenancegrantDeve lopmentgrant
TLM grant
Yes No Don’tknow
Yes No Don’tknow
SSA school
grants
Ma intenancegrantDeve lopmentgrant
TLM grant
Yes No Don’tknow
Yes No Don’tknow
No.of
Sch.
EVERY RURAL GOVERNMENT PRIMARY SCHOOLIS ENTITLED TO EACH OF THESE SSA GRANTSEVERY YEAR.
The PAISA section of ASER tracks receipt and spending
of Sarva Shiksha Abhiyan (SSA) grants at the school
level. This information is collected from schools visited
during the survey. This page reports proportion of
schools receiving the grants and carrying out specified
activities in the schools. More detailed analysis of the
PAISA data will be available in the PAISA 2011 report
which will be released in March 2012.1

Rajasthan RURAL
Note : For schools with enrollment above 200children the PTR shall not exceed 40 excludingthe Head Teacher
As part of ASER 2010 and 2011, in each sampled village, onegovernment school with primary sections was visited on theday of the survey. During this school visit, RTE indicators wereobserved and are reported here.
Note: School observations for ASER 2011 looked at TLM for Std II and Std IV only.
2010 2011School
enrollment No. ofschools
No. ofschools
% ofschools
% ofschools
RTETeacherNorms
1-60
61-90
91-120
121-150
151-200
> 200
TOTAL
2011Schoolenrollment
2010
2
3
4
5
5 + HMsee note
2010
1
2
3
4
5
6
>=7
TOTAL
2011
Numberof
teachersNo.of
schools
No.of
schools
%of
schools
%of
schools
RTE norm:At least one
classroom perteacher
1
2
3
4
5
6
>=7
TOTAL
20112010
% Schools that do notmeet classroom to teacher
normsNumber ofteachers
% of schools with 2011
Building
DrinkingWater
Toilet
Girls Toilet
TLM
Library
MDM
Table 17: Schools by totalenrollment 2010 and 2011
Table 18: RTE norms: Pupil-teacherratio 2010 and 2011
Table 19: Schools by number ofteachers 2010 and 2011
Table 20: RTE norms: Teacher -classroom ratio 2010 and 2011
Table 21: % Schools meeting selected RTE norms on facilities 2010 & 2011
2010
1-60
61-90
91-120
121-150
151-200
> 200
TOTAL
206 ASER 2011
115 13.0 113 13.1
110 12.4 109 12.6
150 16.9 148 17.1
112 12.6 115 13.3
163 18.4 168 19.4
237 26.7 213 24.6
887 100.0 866 100.0
81 10.4 105 13.3
97 12.4 89 11.3
101 13.0 90 11.4
114 14.6 116 14.7
163 20.9 147 18.7
94 12.1 92 11.7
130 16.7 149 18.9
780 100.0 788 100.0
3.0 2.4
3.8 4.4
9.9 18.2
13.5 15.1
22.5 18.8
32.4 32.0
32.7 24.3
18.0 16.9
Right to Education indicators
Extracts from the Schedule of The Right of Children toFree and Compulsory Education Act 2009 Norms andstandards for a School (Sections 19 and 25)
Number of teachers in Std 1-5:� Admitted children No. of teachers
<= 60 261-90 391-120 4121-200 5> 150 5 + 1 Headteacher> 200 Pupil-Teacher Ratio
(excluding Headteacher)shall not exceed 40
School facilities:All weather building with:
� At least one classroom for every teacher� Office cum store cum headteacher’s room� Separate toilets for boys and girls� Safe and adequate drinking water facility to
all children� A kitchen where mid-day meal is cooked in
the school� Playground� Arrangements for securing the school
building by boundary wall or fencing.
Teaching learning equipmentshall be provided to each class as required.
LibraryThere shall be a library in each school providingnewspaper, magazines and books on all subjects,including story-books.
46.3 58.1
44.0 45.8
48.2 44.6
59.2 55.1
49.3 42.9
63.9 64.5
53.7 52.7
91.2 89.251.9 57.270.1 72.620.9 21.911.1 8.568.0 69.53.5 3.3
31.1 26.965.4 69.919.6 9.3
13.3 5.516.8 19.050.3 66.376.1 80.072.1 74.736.3 33.040.4 35.423.3 31.783.8 84.594.8 97.0
% Schools that donot meet PTR norms
Office/Store/Office cum storePlaygroundBoundary WallNo facility for drinking waterFacility but no drinking water availableDrinking water availableNo toilet facilityFacility but toilet not useableToilet useable% Schools with no separate provisions for girls toiletsOf schools with separate girls toilets, % schools whereToilet lockedToilet not useableToilet useableTeaching learning material in Std 2Teaching learning material in Std 4No libraryLibrary but no books being used by children on day of visitLibrary being used by children on day of visitKitchen shed for cooking midday mealMidday meal served in school on the day of visit

Tamil Nadu RURAL
Note: 'OTHER' includes children going to madarssa and EGS.‘NOT IN SCHOOL’ = dropped out + never enrolled.
How to read this table: If a child started school in Std I at age 6, she should be age 8 inStd 3. This table shows the age distribution for each class. For example, in Std III,71.0% children are 8 years old but there are also 17.8% who are 7, 8.3% who are 9years old, etc.
Chart 1: Trends over time% Children out of school by age group and gender 2006-2011
How to read this chart: For example, the proportion of girls (age 11-14) not in schoolhas changed from 3.9% in 2006 to 2.3% in 2007 to 1.2% in 2008 to 1.1% in 2009to 1.8% in 2010 to 1.3% in 2011
ALL ANALYSIS BASED ON DATA FROM HOUSEHOLDS. 29 OUT OF 29 DISTRICTS
TotalAge group Govt. Pvt. Other Not inSchool
71.5 27.0 0.6 0.9 100
72.7 24.8 0.6 2.0 100
68.6 30.6 0.6 0.2 100
66.3 32.9 0.6 0.2 100
71.0 28.2 0.6 0.2 100
76.1 21.8 0.6 1.6 100
73.8 23.8 0.6 1.9 100
78.3 19.9 0.5 1.3 100
73.8 19.2 0.6 6.4 100
73.0 19.5 0.9 6.7 100
74.5 18.9 0.4 6.2 100
Age: 6-14 ALL
Age: 7-16 ALL
Age: 7-10 ALL
Age: 7-10 BOYS
Age: 7-10 GIRLS
Age: 11-14 ALL
Age: 11-14 BOYS
Age: 11-14 GIRLS
Age: 15-16 ALL
Age: 15-16 BOYS
Age: 15-16 GIRLS
I
II
III
IV
V
VI
VII
VIII
Table 2: Sample description% Children in each class by age 2011
5 6 7 8 9 10 11 12 13 14 15 16 Total
44.4 49.7 5.9
1.1 21.6 67.0 8.3 2.0
1.9 17.8 71.0 8.3 1.0
2.5 18.2 67.4 10.3 1.7
2.8 8.0 78.0 9.0 2.4
2.2 10.4 68.8 16.7 1.9
2.2 10.7 69.0 14.3 3.8
3.1 14.2 67.9 11.7 3.1
100
100
100
100
100
100
100
100
Std.
Table 1: % Children in different types of schools 2011
207ASER 2011
School enrollment and out of school children
Young children in pre-school and school
% C
hild
ren
% C
hild
ren
% C
hild
ren
Chart 2: Trends over time% Children enrolled in private school by class 2007, 2009 & 2011
Chart 3: Trends over timeFive year olds in pre-school & school 2007, 2009 & 2011
Tota
l
In SchoolIn balwadi
oranganwadi
In LKG/UKG
Age 5
Age 6
Govt Pvt Other
8.2 14.3 42.1 34.6 0.7 0.1 100
0.9 2.0 59.5 36.7 0.6 0.3 100
Not
enr
olle
dan
ywh
ere
Table 3: % Children age 5-6 who are enrolled in differenttypes of pre-school & school 2011

Reading Tool
Tamil Nadu RURAL
How to read this table: Each cell shows the highest level of reading achieved by a child.For example, in Std III, 9.7% children cannot even read letters, 21.9% can read lettersbut not more, 40.9% can read words but not Std 1 text or higher, 20.5% can read Std1 text but not Std 2 level text, and 7.1% can read Std 2 level text. In sum, for eachclass, the total of all these exclusive categories is 100%.
Std. NothingLevel 1
(Std 1 Text)Level 2
(Std 2 Text) Total
I
II
III
IV
V
VI
VII
VIII
Total
54.2 31.3 10.5 3.0 1.1 100
20.3 35.6 30.4 9.4 4.3 100
9.7 21.9 40.9 20.5 7.1 100
5.3 11.9 32.2 31.5 19.0 100
3.5 7.7 20.8 35.7 32.3 100
1.4 3.8 14.8 31.3 48.8 100
1.2 2.5 9.5 26.0 60.8 100
0.6 1.5 8.5 22.7 66.8 100
11.0 13.6 20.7 23.3 31.4 100
Chart 5: Trends over time% Children in Std V who CANNOT READ Std II LEVEL TEXTBy school type 2008-2011
Chart 4: Trends over time% Children in Std III who CANNOT READ Std I LEVEL TEXTBy school type 2008-2011
Letter Word
Table 4: % Children by class and READING levelAll schools 2011
Note : In ASER 2011 for every state, reading tools were provided in the main mediumof instruction in government schools. Children and their families were also askedabout the language they speak at home. For home languages, a list of 122 languageswas provided to all survey teams. This list includes 22 Scheduled languages and 100Non-Scheduled languages. The data in this table is for children for whom we haveinformation for both school language and home language.
Table 5: School language and home language
% Children whose :
Home language is the same as school language
Home language is different from school language
Total
%
208 ASER 2011
92.2
7.8
100.0
Home language and school language
Reading
% C
hild
ren
% C
hild
ren

Math Tool
How to read this table: Each cell shows the highest level of arithmetic achieved by achild. For example, in Std III, 7.8% children cannot even recognize numbers 1-9, 18.5%children can recognize numbers up to 9 but not more, 51.7% can recognize numbers to99 but cannot do subtraction, 20.2% can do subtraction but not division, and 1.8% cando division. In sum, for each class, the total of all these exclusive categories is 100%.
Std. Nothing Subtract Divide Total
I
II
III
IV
V
VI
VII
VIII
Total
45.9 33.8 17.1 2.5 0.8 100
15.7 28.6 46.2 7.6 1.9 100
7.8 18.5 51.7 20.2 1.8 100
4.9 9.6 45.0 34.2 6.4 100
3.7 5.5 31.6 44.9 14.2 100
1.7 3.1 24.0 46.4 24.8 100
1.1 1.8 16.8 45.4 34.9 100
0.5 0.9 14.6 38.8 45.1 100
9.3 11.8 30.5 31.3 17.0 100
Recognize Numbers11-991-9
Chart 7: Trends over time% Children in Std V who CANNOT DO DIVISIONBy school type 2008-2011
Chart 6: Trends over time% Children in Std III who CANNOT RECOGNISE NUMBERS upto100. By school type 2008-2011
Tamil Nadu RURAL
Table 7: Class-wise % children attending PAID TUITION CLASSESBy school type 2007, 2009, 2010 and 2011
Note: In 2007, 2009, 2010 and 2011 the ASER survey recorded information abouttuition. In all 4 years, the question asked was the following: “Does the child take anypaid additional class currently?” Therefore, these numbers do not include anysupplemental help in learning that children may have received from parents, siblingsor from anyone else who did not require payment.
Year School I II III IV V VI VII VIII Total
2007
2009
2010
2011
Govt
Pvt
Govt
Pvt
Govt
Pvt
Govt
Pvt
Table 6: % Children by class and ARITHMETIC levelAll schools 2011
209ASER 2011
10.8 12.9 13.8 16.0 16.7 18.3 17.5 17.1 15.7
26.5 29.5 33.5 37.5 39.9 30.9 29.5 30.8 32.1
16.3 20.9 19.5 22.3 24.1 22.5 19.6 20.0 20.9
28.6 31.9 37.2 41.4 36.1 29.4 33.1 35.2 33.9
12.7 13.6 16.0 14.8 19.8 17.6 16.7 17.1 16.4
22.4 26.4 29.9 31.3 30.3 29.4 25.9 28.0 27.8
11.6 12.8 14.6 16.3 17.5 15.2 16.4 14.5 15.1
19.4 24.6 30.7 24.4 25.3 29.5 20.5 24.7 24.9
Arithmetic
Tuition
% C
hild
ren
% C
hild
ren

As part of ASER 2007, 2009, 2010 and 2011, in each sampled village, one government school with primary sections was visited on the day of the survey.
Information about schools in this report is based on these visits.
Tamil Nadu RURAL
2007 2009 2010 2011 2007 2009 2010 2011
Std I-IV/V Std I-VII/VIIIType of school
% Enrolledchildren present(average)
% Schools with lessthan 50% enrolledchildren present(average)
% Schools with75% or moreenrolled childrenpresent (average)
2007 2009 2010 2011 2007 2009 2010 2011
Std I-IV/V Std I-VII/VIIIType of school
% Teachers present(average)
% Schools withno teacherspresent(average)
% Schools withall teacherspresent(average)
Std I-IV/V Std I-VII/VIII2010 2011 2010 2011
% Schools with:
No Headteacher appointed
Headteacher appointed but not present attime of visitHeadteacher appointed & present at timeof visit
Total
Std I-IV/V Std I-VII/VIII2010 2011 2010 2011
% Schools with:
No computer
Computers but no children using them onday of visitComputers & children using them on dayof visit
Total
2007Type of school
Std I-IV/V: Primary
Std I-VII/VIII: Primary + Upper primary
Total schools visited
2009 2010 2011
Table 8: Total schools visited 2007, 2009, 2010 and 2011
Table 9: Student attendance 2007, 2009, 2010 and 2011
Table 11: Headteachers 2010 & 2011 Table 12: Computers 2010 and 2011
Table 10: Teacher attendance 2007, 2009, 2010 and 2011
210 ASER 2011
0.0 0.6 0.0 0.6
10.5 5.6 13.4 5.6
89.6 93.9 86.6 93.9
100 100 100 100
70.3 66.9 27.5 21.8
11.9 14.3 26.0 27.1
17.8 18.9 46.6 51.1
100 100 100 100
388 385 395 448
213 260 267 235
601 645 662 683
91.2 91.7 89.9 89.7 90.2 90.1 90.7 89.2
0.5 0.0 1.0 1.4 0.5 0.0 0.0 0.0
94.2 94.5 93.9 91.4 93.2 93.3 97.7 92.7
96.3 90.6 86.5 91.6 91.3 87.4 79.9 89.0
0.0 0.3 0.3 0.3 0.0 0.0 0.0 0.0
88.8 70.0 61.6 75.1 74.0 48.5 34.0 54.9
2007 2009 2010 2011
Std I-IV/V
2007 2009 2010 2011
Std I-VII/VIII% Schools with:
Std II children sitting with one or more other classes
Table 13: Multigrade classes 2007, 2009, 2010 and 2011
76.1 77.8 81.8 71.2 77.8 71.5 76.2 67.4
69.3 74.1 78.3 68.2 70.1 63.3 69.5 61.9Std IV children sitting with one or more other classes
School observations
Other school information
Student and teacher attendance
Note: In Tamil Nadu, the official government school policy is to have mixed groups in Std. I-IV.

Tamil Nadu RURAL
How much goes toeach school For what purposes
SCHOOL DEVELOPMENT GRANT / SCHOOL GRANT
Rs.5000 per year perprimary school
Rs.7000 per year per upperprimary school
Rs 5000 + Rs 7000 =Rs 12000 if the school isStd I-VII/VIII.
Note: Primary and UpperPrimary schools are treatedas separate schools even ifthey are in the same pre-mises.
This grant can be used forbuying school equipmentsuch as blackboard, sittingmats etc. Also for buyingchalk, duster, registers andother office equipment.
The grant amount varies bytype of school: whether it isa primary or upper primaryschool.
SCHOOL MAINTENANCE GRANT
Rs.5000 - Rs 7500 perschool per year if the schoolhas upto 3 classrooms.
Rs 7500 - Rs.10000 per yearif the school has more than3 classrooms.
Primary and Upper Primaryschools are treated asseparate schools even ifthey are in the samebuilding.
TLM GRANT
This grant can be used byteachers to buy teachingaids, such as charts, globes,posters, models etc.
Rs.500 per teacher per yearin primary and upper pri-mary schools.
1 For more information see www.accountabilityinitiative.in
211ASER 2011
School funds and activities (PAISA)
This grant can be used formaintenance of schoolbuilding, includingwhitewashing;beautification; and repair oftoilets, hand pump,boundary wall, playgroundetc.
The grant amount dependson number of classrooms(excluding Headmasterroom and office room)
DID SCHOOLS GET THEIR MONEY ON TIME?
2008-2009 2009-2010 2010-2011SSA school
grants% Schools % Schools % SchoolsNo.
ofSch.
No.of
Sch.Yes No Don’tknow
DID SCHOOLS GET THEIR MONEY ON TIME?
April 2009 toOctober 2009
April 2010 toOctober 2010
April 2011 toOctober 2011
% Schools % Schools % SchoolsNo.of
Sch.
No.of
Sch.
No.of
Sch.Yes No Don’tknow
Type of Activity
Yes No Don'tknow
New Classroom
Repair of building (roof, floor, wall etc.)
Repair of doors & windows
Repair of boundary wall
Repair of drinking water facility
Repair of toilet
White wash/plastering
Painting Blackboard/Display Board/Painting on wall
Painting of doors & walls
Purchase of furniture (cupboard etc.)
Purchase of electrical fittings
Purchase of chalk, duster, register etc.
Purchase of sitting Mats/Tat Patti
Purchase of charts, globes & other teaching material
Expenditure on school events
Payment of bills (electricity, water, cleaning etc.)
Const.
Repairs
Painting
& White
Wash
Purchase
Other
Table 15: % Schools who report receiving SSA grants - Half financial year
Table 16: % Schools carrying out different activities since April 2010
Table 14: % Schools who report receiving SSA grants - Full financial year
555 82.5 12.1 5.4 546 94.1 1.8 4.0 657 91.0 4.6 4.4
499 62.7 30.5 6.8 498 90.6 4.6 4.8 631 82.9 11.3 5.9
394 12.2 83.0 4.8 180 16.1 76.1 7.8 601 53.6 42.1 4.3
504 80.2 12.7 7.1 551 91.1 3.6 5.3 623 85.1 10.4 4.5
450 62.2 29.8 8.0 491 91.7 5.3 3.1 601 78.4 16.0 5.7
350 10.0 82.6 7.4 161 18.0 72.1 9.9 586 72.2 23.7 4.1
19.3 79.3 1.3
53.3 44.8 1.9
51.0 47.0 2.1
29.1 68.8 2.1
60.5 37.6 1.9
51.0 46.9 2.1
57.8 40.8 1.4
85.1 13.8 1.1
50.0 48.7 1.3
52.4 45.7 1.9
63.0 34.5 2.6
92.7 6.2 1.1
82.8 16.1 1.1
83.9 14.4 1.7
58.7 38.7 2.6
53.5 43.6 2.9
% schools
Ma intenancegrantDeve lopmentgrant
TLM grant
Yes No Don’tknow
Yes No Don’tknow
SSA school
grants
Ma intenancegrantDeve lopmentgrant
TLM grant
Yes No Don’tknow
Yes No Don’tknow
No.of
Sch.
EVERY RURAL GOVERNMENT PRIMARY SCHOOLIS ENTITLED TO EACH OF THESE SSA GRANTSEVERY YEAR.
The PAISA section of ASER tracks receipt and spending
of Sarva Shiksha Abhiyan (SSA) grants at the school
level. This information is collected from schools visited
during the survey. This page reports proportion of
schools receiving the grants and carrying out specified
activities in the schools. More detailed analysis of the
PAISA data will be available in the PAISA 2011 report
which will be released in March 2012.1

Tamil Nadu RURAL
Note : For schools with enrollment above 200children the PTR shall not exceed 40 excludingthe Head Teacher
As part of ASER 2010 and 2011, in each sampled village, onegovernment school with primary sections was visited on theday of the survey. During this school visit, RTE indicators wereobserved and are reported here.
Note: School observations for ASER 2011 looked at TLM for Std II and Std IV only.
2010 2011School
enrollment No. ofschools
No. ofschools
% ofschools
% ofschools
RTETeacherNorms
1-60
61-90
91-120
121-150
151-200
> 200
TOTAL
2011Schoolenrollment
2010
2
3
4
5
5 + HMsee note
2010
1
2
3
4
5
6
>=7
TOTAL
2011
Numberof
teachersNo.of
schools
No.of
schools
%of
schools
%of
schools
RTE norm:At least one
classroom perteacher
1
2
3
4
5
6
>=7
TOTAL
20112010
% Schools that do notmeet classroom to teacher
normsNumber ofteachers
% of schools with 2011
Building
DrinkingWater
Toilet
Girls Toilet
TLM
Library
MDM
Table 17: Schools by totalenrollment 2010 and 2011
Table 18: RTE norms: Pupil-teacherratio 2010 and 2011
Table 19: Schools by number ofteachers 2010 and 2011
Table 20: RTE norms: Teacher -classroom ratio 2010 and 2011
Table 21: % Schools meeting selected RTE norms on facilities 2010 & 2011
2010
1-60
61-90
91-120
121-150
151-200
> 200
TOTAL
212 ASER 2011
160 24.4 213 31.5
95 14.5 97 14.4
76 11.6 90 13.3
73 11.1 75 11.1
101 15.4 95 14.1
151 23.0 106 15.7
656 100.0 676 100.0
107 18.6 126 21.1
86 14.9 88 14.7
72 12.5 77 12.9
61 10.6 78 13.0
61 10.6 55 9.2
55 9.6 60 10.0
134 23.3 114 19.1
576 100.0 598 100.0
0.0 1.0
8.5 14.3
22.7 31.8
44.9 33.9
37.0 30.6
31.9 36.0
35.9 39.8
24.8 25.1
Right to Education indicators
Extracts from the Schedule of The Right of Children toFree and Compulsory Education Act 2009 Norms andstandards for a School (Sections 19 and 25)
Number of teachers in Std 1-5:� Admitted children No. of teachers
<= 60 261-90 391-120 4121-200 5> 150 5 + 1 Headteacher> 200 Pupil-Teacher Ratio
(excluding Headteacher)shall not exceed 40
School facilities:All weather building with:
� At least one classroom for every teacher� Office cum store cum headteacher’s room� Separate toilets for boys and girls� Safe and adequate drinking water facility to
all children� A kitchen where mid-day meal is cooked in
the school� Playground� Arrangements for securing the school
building by boundary wall or fencing.
Teaching learning equipmentshall be provided to each class as required.
LibraryThere shall be a library in each school providingnewspaper, magazines and books on all subjects,including story-books.
69.6 63.4
58.0 55.6
67.1 47.6
52.9 42.4
32.1 25.6
39.1 33.3
53.0 47.8
55.0 49.468.7 67.660.9 58.712.8 13.66.7 8.9
80.5 77.67.0 9.6
48.5 42.044.6 48.420.8 21.2
23.0 15.021.0 21.235.1 42.795.4 92.893.3 92.520.9 23.221.3 21.657.8 55.296.7 96.599.4 99.4
% Schools that donot meet PTR norms
Office/Store/Office cum storePlaygroundBoundary WallNo facility for drinking waterFacility but no drinking water availableDrinking water availableNo toilet facilityFacility but toilet not useableToilet useable% Schools with no separate provisions for girls toiletsOf schools with separate girls toilets, % schools whereToilet lockedToilet not useableToilet useableTeaching learning material in Std 2Teaching learning material in Std 4No libraryLibrary but no books being used by children on day of visitLibrary being used by children on day of visitKitchen shed for cooking midday mealMidday meal served in school on the day of visit

Tripura RURAL
Note: 'OTHER' includes children going to madarssa and EGS.‘NOT IN SCHOOL’ = dropped out + never enrolled.
How to read this table: If a child started school in Std I at age 6, she should be age 8 inStd 3. This table shows the age distribution for each class. For example, in Std III,15.4% children are 8 years old but there are also 7.3% who are 7, 54.2% who are 9,14.1% who are 10 years old, etc.
Chart 1: Trends over time% Children out of school by age group and gender 2006-2011
How to read this chart: For example, the proportion of girls (age 11-14) not in schoolhas changed from 7.3% in 2006 to 5.8% in 2007 to 3.8% in 2008 to 3.4% in 2009to 3.4% in 2010 to 2.0% in 2011
ALL ANALYSIS BASED ON DATA FROM HOUSEHOLDS. 4 OUT OF 4 DISTRICTS
TotalAge group Govt. Pvt. Other Not inSchool
92.9 5.0 0.9 1.3 100
93.1 4.1 0.9 1.9 100
92.7 6.0 0.9 0.4 100
92.6 6.0 1.1 0.3 100
92.7 6.0 0.7 0.6 100
94.0 3.1 0.9 2.0 100
93.9 3.2 0.8 2.1 100
94.0 3.0 1.0 2.0 100
92.1 2.6 0.6 4.7 100
91.5 3.3 0.5 4.7 100
93.0 1.7 0.7 4.7 100
Age: 6-14 ALL
Age: 7-16 ALL
Age: 7-10 ALL
Age: 7-10 BOYS
Age: 7-10 GIRLS
Age: 11-14 ALL
Age: 11-14 BOYS
Age: 11-14 GIRLS
Age: 15-16 ALL
Age: 15-16 BOYS
Age: 15-16 GIRLS
I
II
III
IV
V
VI
VII
VIII
Table 2: Sample description% Children in each class by age 2011
5 6 7 8 9 10 11 12 13 14 15 16 Total
8.3 34.1 43.8 7.9 5.9
5.3 22.3 55.9 8.4 8.1
1.3 7.3 15.4 54.2 14.1 7.8
3.4 12.0 58.9 14.2 8.2 3.4
4.9 21.0 45.8 21.5 6.8
6.4 12.0 64.8 9.0 7.8
4.8 17.5 47.0 21.4 9.3
6.4 15.9 48.2 22.7 6.7
100
100
100
100
100
100
100
100
Std.
Table 1: % Children in different types of schools 2011
213ASER 2011
School enrollment and out of school children
Young children in pre-school and school
% C
hild
ren
% C
hild
ren
% C
hild
ren
Chart 2: Trends over time% Children enrolled in private school by class 2007, 2009 & 2011
Chart 3: Trends over timeFive year olds in pre-school & school 2007, 2009 & 2011
Tota
l
In SchoolIn balwadi
oranganwadi
In LKG/UKG
Age 5
Age 6
Govt Pvt Other
56.6 14.8 21.9 5.1 0.3 1.3 100
26.5 7.3 55.8 8.7 0.4 1.3 100
Not
enr
olle
dan
ywh
ere
Table 3: % Children age 5-6 who are enrolled in differenttypes of pre-school & school 2011

Reading Tool
Tripura RURAL
How to read this table: Each cell shows the highest level of reading achieved by a child.For example, in Std III, 3.5% children cannot even read letters, 12.3% can read lettersbut not more, 27% can read words but not Std 1 text or higher, 35.6% can read Std1 text but not Std 2 level text, and 21.6% can read Std 2 level text. In sum, for eachclass, the total of all these exclusive categories is 100%.
Std. NothingLevel 1
(Std 1 Text)Level 2
(Std 2 Text) Total
I
II
III
IV
V
VI
VII
VIII
Total
16.0 39.3 25.5 11.3 7.9 100
7.0 27.8 36.2 18.2 10.8 100
3.5 12.3 27.0 35.6 21.6 100
1.8 4.3 18.0 38.4 37.5 100
2.4 5.3 10.9 26.2 55.3 100
1.9 4.2 8.2 13.1 72.7 100
0.6 2.2 5.9 6.6 84.8 100
0.0 1.4 4.9 9.9 83.8 100
4.0 11.9 17.5 20.8 45.9 100
Chart 5: Trends over time% Children in Std V who CANNOT READ Std II LEVEL TEXTBy school type 2008-2011
Chart 4: Trends over time% Children in Std III who CANNOT READ Std I LEVEL TEXTBy school type 2008-2011
Letter Word
Table 4: % Children by class and READING levelAll schools 2011
* 'Other' includes all languages from the list of scheduled and non-scheduledlanguages except those specified above.
Table 5: School language and home language
Bengali
Other *
Total
%
214 ASER 2011
66.1
33.9
100.0
Home language and school language
Reading
% C
hild
ren
% C
hild
ren
Of children who tested in Bengali
% Children whose home language was:
Note: In ASER 2011 for every state, reading tools were provided in the main mediumof instruction in government schools. In Tripura, where the medium of instruction ingovernment schools is Bengali or Kok Borok, children were given the choice of readingin Bengali, Kok Borok or English. Figures for Kok Borok and English have not beenincluded due to insufficient data. For home languages, a list of 122 languages wasprovided to all survey teams. This included 22 Scheduled languages and 100 Non-Scheduled languages. The data in this table is for children for whom we have informationfor both school language and home language.
Note: This tool was also available in Kok Borok and English.

Math Tool
How to read this table: Each cell shows the highest level of arithmetic achieved by achild. For example, in Std III, 3.2% children cannot even recognize numbers 1-9, 10.9%children can recognize numbers up to 9 but not more, 31.2% can recognize numbers to99 but cannot do subtraction, 40.9% can do subtraction but not division, and 13.8% cando division. In sum, for each class, the total of all these exclusive categories is 100%.
Std. Nothing Subtract Divide Total
I
II
III
IV
V
VI
VII
VIII
Total
9.0 39.5 33.5 16.1 2.0 100
5.7 25.7 39.0 25.7 4.0 100
3.2 10.9 31.2 40.9 13.8 100
0.4 6.9 19.3 47.1 26.3 100
2.5 5.2 17.3 37.2 37.7 100
2.3 4.2 13.0 33.9 46.6 100
1.0 3.1 8.2 33.4 54.4 100
0.8 0.8 7.2 24.8 66.5 100
3.0 11.7 21.3 33.1 30.8 100
Recognize Numbers11-991-9
Chart 7: Trends over time% Children in Std V who CANNOT DO DIVISIONBy school type 2008-2011
Chart 6: Trends over time% Children in Std III who CANNOT RECOGNISE NUMBERS upto100. By school type 2008-2011
Tripura RURAL
Note: In 2007, 2009, 2010 and 2011 the ASER survey recorded information abouttuition. In all 4 years, the question asked was the following: “Does the child take anypaid additional class currently?” Therefore, these numbers do not include anysupplemental help in learning that children may have received from parents, siblingsor from anyone else who did not require payment.
Table 6: % Children by class and ARITHMETIC levelAll schools 2011
215ASER 2011
Arithmetic
Tuition
% C
hild
ren
% C
hild
ren
Table 7: Class-wise % children attending PAID TUITION CLASSESBy school type 2007, 2009, 2010 and 2011
Year School I II III IV V VI VII VIII Total
2007
2009
2010
2011
Govt
Pvt
Govt
Pvt
Govt
Pvt
Govt
Pvt
57.4 62.8 64.8 67.2 73.7 75.0 73.2 80.0 69.3
45.8 31.4 48.9 13.7 33.3100.0100.0 0.0 45.6
65.3 64.2 71.2 74.1 65.0 72.7 83.2 85.6 72.5
96.0 42.6 65.3100.0 74.1100.0100.0100.0 77.5
56.9 67.7 70.2 69.8 73.4 77.9 80.2 84.2 72.7
75.2100.0100.0100.0 88.7100.0100.0100.0 93.6
61.0 62.7 69.2 73.9 72.0 75.0 79.7 82.5 72.1
79.5 89.4 66.3 45.5100.0100.0 73.8 58.5 78.6

As part of ASER 2007, 2009, 2010 and 2011, in each sampled village, one government school with primary sections was visited on the day of the survey.
Information about schools in this report is based on these visits.
Tripura RURAL
2007 2009 2010 2011 2007 2009 2010 2011
Std I-IV/V Std I-VII/VIIIType of school
% Enrolledchildren present(average)
% Schools with lessthan 50% enrolledchildren present(average)
% Schools with75% or moreenrolled childrenpresent (average)
2007 2009 2010 2011 2007 2009 2010 2011
Std I-IV/V Std I-VII/VIIIType of school
% Teachers present(average)
% Schools withno teacherspresent(average)
% Schools withall teacherspresent(average)
Std I-IV/V Std I-VII/VIII2010 2011 2010 2011
% Schools with:
No Headteacher appointed
Headteacher appointed but not present attime of visitHeadteacher appointed & present at timeof visit
Total
Std I-IV/V Std I-VII/VIII2010 2011 2010 2011
% Schools with:
No computer
Computers but no children using them onday of visitComputers & children using them on dayof visit
Total
2007Type of school
Std I-IV/V: Primary
Std I-VII/VIII: Primary + Upper primary
Total schools visited
2009 2010 2011
Table 8: Total schools visited 2007, 2009, 2010 and 2011
Table 9: Student attendance 2007, 2009, 2010 and 2011
Table 11: Headteachers 2010 & 2011 Table 12: Computers 2010 and 2011
Table 10: Teacher attendance 2007, 2009, 2010 and 2011
216 ASER 2011
3.7 14.3 2.4 2.8
3.7 8.6 12.2 16.7
92.6 77.1 85.4 80.6
100 100 100 100
95.2 93.3 88.5 89.6
2.4 6.7 3.9 6.3
2.4 0.0 7.7 4.2
100 100 100 100
36 58 44 46
26 44 54 48
62 102 98 94
75.9 75.3 67.8 67.2 84.5 73.8 62.4 63.3
4.8 7.1 17.1 17.4 0.0 7.5 25.9 27.1
52.4 51.8 36.6 41.3 86.7 47.5 24.1 27.1
85.1 88.8 88.3 86.9 79.5 84.3 81.5 79.0
0.0 0.0 0.0 0.0 4.4 0.0 0.0 0.0
53.6 48.2 52.4 57.8 47.8 41.9 25.5 29.8
2007 2009 2010 2011
Std I-IV/V
2007 2009 2010 2011
Std I-VII/VIII% Schools with:
Std II children sitting with one or more other classes
Table 13: Multigrade classes 2007, 2009, 2010 and 2011
33.3 30.2 34.2 35.7 30.8 62.5 44.0 54.6
32.1 28.6 23.5 33.3 28.6 35.1 21.3 50.0Std IV children sitting with one or more other classes
School observations
Other school information
Student and teacher attendance

Tripura RURAL
How much goes toeach school For what purposes
SCHOOL DEVELOPMENT GRANT / SCHOOL GRANT
Rs.5000 per year perprimary school
Rs.7000 per year per upperprimary school
Rs 5000 + Rs 7000 =Rs 12000 if the school isStd I-VII/VIII.
Note: Primary and UpperPrimary schools are treatedas separate schools even ifthey are in the same pre-mises.
This grant can be used forbuying school equipmentsuch as blackboard, sittingmats etc. Also for buyingchalk, duster, registers andother office equipment.
The grant amount varies bytype of school: whether it isa primary or upper primaryschool.
SCHOOL MAINTENANCE GRANT
Rs.5000 - Rs 7500 perschool per year if the schoolhas upto 3 classrooms.
Rs 7500 - Rs.10000 per yearif the school has more than3 classrooms.
Primary and Upper Primaryschools are treated asseparate schools even ifthey are in the samebuilding.
TLM GRANT
This grant can be used byteachers to buy teachingaids, such as charts, globes,posters, models etc.
Rs.500 per teacher per yearin primary and upper pri-mary schools.
1 For more information see www.accountabilityinitiative.in
217ASER 2011
School funds and activities (PAISA)
This grant can be used formaintenance of schoolbuilding, includingwhitewashing;beautification; and repair oftoilets, hand pump,boundary wall, playgroundetc.
The grant amount dependson number of classrooms(excluding Headmasterroom and office room)
DID SCHOOLS GET THEIR MONEY ON TIME?
2008-2009 2009-2010 2010-2011SSA school
grants% Schools % Schools % SchoolsNo.
ofSch.
No.of
Sch.Yes No Don’tknow
DID SCHOOLS GET THEIR MONEY ON TIME?
April 2009 toOctober 2009
April 2010 toOctober 2010
April 2011 toOctober 2011
% Schools % Schools % SchoolsNo.of
Sch.
No.of
Sch.
No.of
Sch.Yes No Don’tknow
Table 15: % Schools who report receiving SSA grants - Half financial year
Table 14: % Schools who report receiving SSA grants - Full financial year
79 55.7 34.2 10.1 72 76.4 16.7 6.9 91 61.5 28.6 9.9
78 66.7 24.4 9.0 68 63.2 25.0 11.8 88 56.8 31.8 11.4
79 69.6 21.5 8.9 74 82.4 8.1 9.5 91 79.1 11.0 9.9
57 35.1 45.6 19.3 74 37.8 50.0 12.2 80 18.8 67.5 13.8
52 38.5 38.5 23.1 68 36.8 51.5 11.8 78 23.1 61.5 15.4
54 42.6 37.0 20.4 74 48.7 41.9 9.5 79 29.1 57.0 13.9
MaintenancegrantDeve lopmentgrant
TLM grant
Yes No Don’tknow
Yes No Don’tknow
SSA school
grants
Ma intenancegrantDeve lopmentgrant
TLM grant
Yes No Don’tknow
Yes No Don’tknow
No.of
Sch.
EVERY RURAL GOVERNMENT PRIMARY SCHOOLIS ENTITLED TO EACH OF THESE SSA GRANTSEVERY YEAR.
The PAISA section of ASER tracks receipt and spending
of Sarva Shiksha Abhiyan (SSA) grants at the school
level. This information is collected from schools visited
during the survey. This page reports proportion of
schools receiving the grants and carrying out specified
activities in the schools. More detailed analysis of the
PAISA data will be available in the PAISA 2011 report
which will be released in March 2012.1
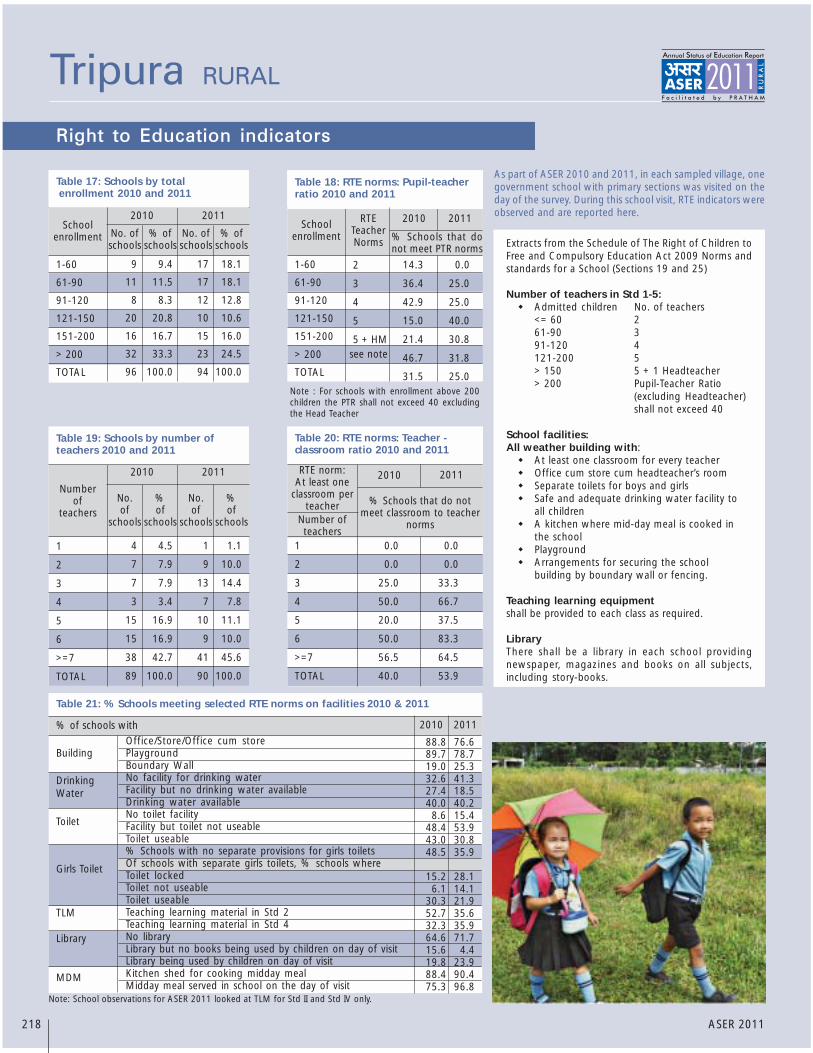
Tripura RURAL
Note : For schools with enrollment above 200children the PTR shall not exceed 40 excludingthe Head Teacher
As part of ASER 2010 and 2011, in each sampled village, onegovernment school with primary sections was visited on theday of the survey. During this school visit, RTE indicators wereobserved and are reported here.
Note: School observations for ASER 2011 looked at TLM for Std II and Std IV only.
2010 2011School
enrollment No. ofschools
No. ofschools
% ofschools
% ofschools
RTETeacherNorms
1-60
61-90
91-120
121-150
151-200
> 200
TOTAL
2011Schoolenrollment
2010
2
3
4
5
5 + HMsee note
2010
1
2
3
4
5
6
>=7
TOTAL
2011
Numberof
teachersNo.of
schools
No.of
schools
%of
schools
%of
schools
RTE norm:At least one
classroom perteacher
1
2
3
4
5
6
>=7
TOTAL
20112010
% Schools that do notmeet classroom to teacher
normsNumber ofteachers
% of schools with 2011
Building
DrinkingWater
Toilet
Girls Toilet
TLM
Library
MDM
Table 17: Schools by totalenrollment 2010 and 2011
Table 18: RTE norms: Pupil-teacherratio 2010 and 2011
Table 19: Schools by number ofteachers 2010 and 2011
Table 20: RTE norms: Teacher -classroom ratio 2010 and 2011
Table 21: % Schools meeting selected RTE norms on facilities 2010 & 2011
2010
1-60
61-90
91-120
121-150
151-200
> 200
TOTAL
218 ASER 2011
9 9.4 17 18.1
11 11.5 17 18.1
8 8.3 12 12.8
20 20.8 10 10.6
16 16.7 15 16.0
32 33.3 23 24.5
96 100.0 94 100.0
4 4.5 1 1.1
7 7.9 9 10.0
7 7.9 13 14.4
3 3.4 7 7.8
15 16.9 10 11.1
15 16.9 9 10.0
38 42.7 41 45.6
89 100.0 90 100.0
0.0 0.0
0.0 0.0
25.0 33.3
50.0 66.7
20.0 37.5
50.0 83.3
56.5 64.5
40.0 53.9
Right to Education indicators
Extracts from the Schedule of The Right of Children toFree and Compulsory Education Act 2009 Norms andstandards for a School (Sections 19 and 25)
Number of teachers in Std 1-5:� Admitted children No. of teachers
<= 60 261-90 391-120 4121-200 5> 150 5 + 1 Headteacher> 200 Pupil-Teacher Ratio
(excluding Headteacher)shall not exceed 40
School facilities:All weather building with:
� At least one classroom for every teacher� Office cum store cum headteacher’s room� Separate toilets for boys and girls� Safe and adequate drinking water facility to
all children� A kitchen where mid-day meal is cooked in
the school� Playground� Arrangements for securing the school
building by boundary wall or fencing.
Teaching learning equipmentshall be provided to each class as required.
LibraryThere shall be a library in each school providingnewspaper, magazines and books on all subjects,including story-books.
14.3 0.0
36.4 25.0
42.9 25.0
15.0 40.0
21.4 30.8
46.7 31.8
31.5 25.0
88.8 76.689.7 78.719.0 25.332.6 41.327.4 18.540.0 40.28.6 15.4
48.4 53.943.0 30.848.5 35.9
15.2 28.16.1 14.1
30.3 21.952.7 35.632.3 35.964.6 71.715.6 4.419.8 23.988.4 90.475.3 96.8
% Schools that donot meet PTR norms
Office/Store/Office cum storePlaygroundBoundary WallNo facility for drinking waterFacility but no drinking water availableDrinking water availableNo toilet facilityFacility but toilet not useableToilet useable% Schools with no separate provisions for girls toiletsOf schools with separate girls toilets, % schools whereToilet lockedToilet not useableToilet useableTeaching learning material in Std 2Teaching learning material in Std 4No libraryLibrary but no books being used by children on day of visitLibrary being used by children on day of visitKitchen shed for cooking midday mealMidday meal served in school on the day of visit

Uttarakhand RURAL
Note: 'OTHER' includes children going to madarssa and EGS.‘NOT IN SCHOOL’ = dropped out + never enrolled.
How to read this table: If a child started school in Std I at age 6, she should be age 8 inStd 3. This table shows the age distribution for each class. For example, in Std III,37.2% children are 8 years old but there are also 15.3% who are 7, 23.0 % who are9, 10.6 % who are 10 years old, etc.
Chart 1: Trends over time% Children out of school by age group and gender 2006-2011
How to read this chart: For example, the proportion of girls (age 11-14) not in schoolhas changed from 3.4% in 2006 to 4.1% in 2007 to 2.7% in 2008 to 3% in 2009 to4% in 2010 to 1.2% in 2011
ALL ANALYSIS BASED ON DATA FROM HOUSEHOLDS. 12 OUT OF 13 DISTRICTS
TotalAge group Govt. Pvt. Other Not inSchool
66.5 31.3 1.1 1.1 100
68.6 28.5 1.1 1.8 100
62.9 35.2 1.2 0.7 100
58.5 39.5 1.1 0.8 100
67.9 30.2 1.3 0.6 100
71.3 26.2 1.0 1.5 100
66.1 31.2 1.0 1.8 100
77.0 20.7 1.1 1.2 100
76.9 16.8 0.9 5.4 100
74.2 20.5 0.6 4.7 100
79.8 12.9 1.2 6.2 100
Age: 6-14 ALL
Age: 7-16 ALL
Age: 7-10 ALL
Age: 7-10 BOYS
Age: 7-10 GIRLS
Age: 11-14 ALL
Age: 11-14 BOYS
Age: 11-14 GIRLS
Age: 15-16 ALL
Age: 15-16 BOYS
Age: 15-16 GIRLS
I
II
III
IV
V
VI
VII
VIII
Table 2: Sample description% Children in each class by age 2011
5 6 7 8 9 10 11 12 13 14 15 16 Total
31.2 37.8 19.5 7.6 3.9
5.6 19.2 36.8 24.2 8.4 5.8
6.7 15.3 37.2 23.0 10.6 7.1
5.2 18.6 33.7 26.3 8.7 7.4
7.3 9.5 37.4 25.7 11.9 8.2
6.8 13.0 34.4 30.9 8.6 6.3
5.3 12.0 37.1 27.7 12.0 5.8
4.4 14.6 36.0 25.6 12.6 6.9
100
100
100
100
100
100
100
100
Std.
Table 1: % Children in different types of schools 2011
219ASER 2011
School enrollment and out of school children
Young children in pre-school and school
% C
hild
ren
% C
hild
ren
% C
hild
ren
Chart 2: Trends over time% Children enrolled in private school by class 2007, 2009 & 2011
Chart 3: Trends over timeFive year olds in pre-school & school 2007, 2009 & 2011
Tota
l
In SchoolIn balwadi
oranganwadi
In LKG/UKG
Age 5
Age 6
Govt Pvt Other
17.9 13.5 36.0 29.1 1.2 2.3 100
3.2 7.3 55.9 31.9 0.7 1.1 100
Not
enr
olle
dan
ywh
ere
Table 3: % Children age 5-6 who are enrolled in differenttypes of pre-school & school 2011

Reading Tool
Uttarakhand RURAL
How to read this table: Each cell shows the highest level of reading achieved by a child.For example, in Std III, 5.7% children cannot even read letters, 18% can read lettersbut not more, 28.9% can read words but not Std 1 text or higher, 21.4% can read Std1 text but not Std 2 level text, and 26.1% can read Std 2 level text. In sum, for eachclass, the total of all these exclusive categories is 100%.
Std. NothingLevel 1
(Std 1 Text)Level 2
(Std 2 Text) Total
I
II
III
IV
V
VI
VII
VIII
Total
29.7 40.8 19.0 4.9 5.6 100
12.5 34.5 28.6 10.7 13.6 100
5.7 18.0 28.9 21.4 26.1 100
3.5 12.0 18.8 23.1 42.7 100
2.4 5.9 11.5 22.2 58.0 100
1.0 3.4 4.6 17.7 73.3 100
0.2 3.2 2.9 10.6 83.1 100
0.3 0.8 2.7 8.3 87.9 100
7.4 15.7 15.4 15.1 46.4 100
Chart 5: Trends over time% Children in Std V who CANNOT READ Std II LEVEL TEXTBy school type 2008-2011
Chart 4: Trends over time% Children in Std III who CANNOT READ Std I LEVEL TEXTBy school type 2008-2011
Letter Word
Table 4: % Children by class and READING levelAll schools 2011
Note : In ASER 2011 for every state, reading tools were provided in the main mediumof instruction in government schools. Children and their families were also askedabout the language they speak at home. For home languages, a list of 122 languageswas provided to all survey teams. This list includes 22 Scheduled languages and 100Non-Scheduled languages. The data in this table is for children for whom we haveinformation for both school language and home language.
Table 5: School language and home language
% Children whose :
Home language is the same as school language
Home language is different from school language
Total
%
220 ASER 2011
33.5
66.6
100.0
Home language and school language
Reading
% C
hild
ren
% C
hild
ren

Math Tool
How to read this table: Each cell shows the highest level of arithmetic achieved by achild. For example, in Std III, 5.3% children cannot even recognize numbers 1-9, 23.7%children can recognize numbers up to 9 but not more, 40% can recognize numbers to99 but cannot do subtraction, 21.6% can do subtraction but not division, and 9.4% cando division. In sum, for each class, the total of all these exclusive categories is 100%.
Std. Nothing Subtract Divide Total
I
II
III
IV
V
VI
VII
VIII
Total
31.6 40.3 22.4 4.8 1.0 100
12.6 37.7 33.8 12.4 3.7 100
5.3 23.7 40.0 21.6 9.4 100
2.6 15.7 28.6 32.5 20.6 100
2.0 8.3 20.6 35.4 33.9 100
1.1 5.0 16.7 32.0 45.2 100
0.4 3.3 14.1 21.5 60.7 100
0.4 1.7 9.7 22.5 65.7 100
7.5 17.8 23.9 22.7 28.1 100
Recognize Numbers11-991-9
Chart 7: Trends over time% Children in Std V who CANNOT DO DIVISIONBy school type 2008-2011
Chart 6: Trends over time% Children in Std III who CANNOT RECOGNISE NUMBERS upto100. By school type 2008-2011
Uttarakhand RURAL
Table 7: Class-wise % children attending PAID TUITION CLASSESBy school type 2007, 2009, 2010 and 2011
Note: In 2007, 2009, 2010 and 2011 the ASER survey recorded information abouttuition. In all 4 years, the question asked was the following: “Does the child take anypaid additional class currently?” Therefore, these numbers do not include anysupplemental help in learning that children may have received from parents, siblingsor from anyone else who did not require payment.
Year School I II III IV V VI VII VIII Total
2007
2009
2010
2011
Govt
Pvt
Govt
Pvt
Govt
Pvt
Govt
Pvt
Table 6: % Children by class and ARITHMETIC levelAll schools 2011
221ASER 2011
3.6 4.8 3.7 4.8 4.2 5.1 3.5 8.8 4.6
13.2 17.9 21.3 18.5 19.3 20.7 26.4 24.6 18.9
4.8 2.8 5.5 5.2 6.5 7.3 7.5 8.4 6.0
17.5 22.4 28.0 36.4 35.0 41.5 28.4 42.7 29.5
3.9 6.1 5.7 6.9 7.5 5.3 8.2 8.8 6.6
19.1 24.8 26.0 27.7 26.1 35.0 26.5 30.9 26.2
4.8 4.8 5.3 5.9 6.7 7.5 6.9 10.5 6.6
25.5 22.4 31.1 36.3 37.9 31.0 44.7 38.4 32.3
Arithmetic
Tuition
% C
hild
ren
% C
hild
ren

As part of ASER 2007, 2009, 2010 and 2011, in each sampled village, one government school with primary sections was visited on the day of the survey.
Information about schools in this report is based on these visits.
Uttarakhand RURAL
2007Type of school
Std I-IV/V: Primary
Std I-VII/VIII: Primary + Upper primary
Total schools visited
2009 2010 2011
Table 8: Total schools visited 2007, 2009, 2010 and 2011
222 ASER 2011
316 347 321 285
16 7 16 12
332 354 337 297
School observations
Other school information
Student and teacher attendance
2007 2009 2010 2011
Std I-IV/VType of school
% Enrolledchildren present(average)
% Schools with lessthan 50% enrolledchildren present(average)
% Schools with75% or moreenrolled childrenpresent (average)
Std I-IV/V2010 2011
% Schools with:
No Headteacher appointed
Headteacher appointed but not present attime of visitHeadteacher appointed & present at timeof visit
Total
Std I-IV/V2010 2011
% Schools with:
No computer
Computers but no children using them onday of visitComputers & children using them on dayof visit
Total
Table 9: Student attendance 2007, 2009, 2010 and 2011
Table 11: Headteachers 2010 & 2011 Table 12: Computers 2010 and 2011
2.3 0.5
12.6 10.0
85.1 89.5
100 100
93.6 94.2
5.1 4.4
1.3 1.5
100 100
85.6 84.3 89.5 82.5
4.8 0.9 1.6 5.4
78.8 79.4 89.3 76.0
2007 2009 2010 2011
Std I-IV/VType of school
% Teachers present(average)
% Schools withno teacherspresent(average)
% Schools withall teacherspresent(average)
Table 10: Teacher attendance 2007, 2009, 2010 and 2011
91.6 94.5 91.2 92.0
0.4 0.3 0.0 0.0
81.3 84.8 77.9 82.0
2007 2009 2010 2011
Std I-IV/V% Schools with:
Std II children sitting with one or more other classes
Table 13: Multigrade classes 2007, 2009, 2010 and 2011
67.7 60.9 60.5 71.4
60.9 55.8 55.6 64.2Std IV children sitting with one or more other classes

Uttarakhand RURAL
How much goes toeach school For what purposes
SCHOOL DEVELOPMENT GRANT / SCHOOL GRANT
Rs.5000 per year perprimary school
Rs.7000 per year per upperprimary school
Rs 5000 + Rs 7000 =Rs 12000 if the school isStd I-VII/VIII.
Note: Primary and UpperPrimary schools are treatedas separate schools even ifthey are in the same pre-mises.
This grant can be used forbuying school equipmentsuch as blackboard, sittingmats etc. Also for buyingchalk, duster, registers andother office equipment.
The grant amount varies bytype of school: whether it isa primary or upper primaryschool.
SCHOOL MAINTENANCE GRANT
Rs.5000 - Rs 7500 perschool per year if the schoolhas upto 3 classrooms.
Rs 7500 - Rs.10000 per yearif the school has more than3 classrooms.
Primary and Upper Primaryschools are treated asseparate schools even ifthey are in the samebuilding.
TLM GRANT
This grant can be used byteachers to buy teachingaids, such as charts, globes,posters, models etc.
Rs.500 per teacher per yearin primary and upper pri-mary schools.
1 For more information see www.accountabilityinitiative.in
223ASER 2011
School funds and activities (PAISA)
This grant can be used formaintenance of schoolbuilding, includingwhitewashing;beautification; and repair oftoilets, hand pump,boundary wall, playgroundetc.
The grant amount dependson number of classrooms(excluding Headmasterroom and office room)
DID SCHOOLS GET THEIR MONEY ON TIME?
2008-2009 2009-2010 2010-2011SSA school
grants% Schools % Schools % SchoolsNo.
ofSch.
No.of
Sch.Yes No Don’tknow
DID SCHOOLS GET THEIR MONEY ON TIME?
April 2009 toOctober 2009
April 2010 toOctober 2010
April 2011 toOctober 2011
% Schools % Schools % SchoolsNo.of
Sch.
No.of
Sch.
No.of
Sch.Yes No Don’tknow
Type of Activity
Yes No Don'tknow
New Classroom
Repair of building (roof, floor, wall etc.)
Repair of doors & windows
Repair of boundary wall
Repair of drinking water facility
Repair of toilet
White wash/plastering
Painting Blackboard/Display Board/Painting on wall
Painting of doors & walls
Purchase of furniture (cupboard etc.)
Purchase of electrical fittings
Purchase of chalk, duster, register etc.
Purchase of sitting Mats/Tat Patti
Purchase of charts, globes & other teaching material
Expenditure on school events
Payment of bills (electricity, water, cleaning etc.)
Const.
Repairs
Painting
& White
Wash
Purchase
Other
Table 15: % Schools who report receiving SSA grants - Half financial year
Table 16: % Schools carrying out different activities since April 2010
Table 14: % Schools who report receiving SSA grants - Full financial year
316 84.5 10.4 5.1 315 85.1 6.7 8.3 287 76.0 15.7 8.4
314 83.8 12.1 4.1 291 82.5 8.9 8.6 278 67.3 21.2 11.5
333 94.3 2.7 3.0 294 87.1 6.1 6.8 284 86.6 8.8 4.6
275 69.8 22.9 7.3 287 33.1 52.3 14.6 267 59.9 28.1 12.0
275 72.7 20.7 6.6 277 31.4 54.2 14.4 258 55.8 30.6 13.6
294 86.4 8.5 5.1 278 50.0 38.5 11.5 260 60.8 29.6 9.6
17.5 79.4 3.2
41.9 55.9 2.2
42.1 55.8 2.1
24.6 73.2 2.2
37.3 60.5 2.2
36.2 61.6 2.2
55.0 41.6 3.4
54.5 42.7 2.9
49.8 46.5 3.7
46.5 50.4 3.2
24.6 73.6 1.8
82.1 14.3 3.6
63.1 33.2 3.7
68.0 28.4 3.6
58.5 36.0 5.5
24.1 69.7 6.1
% schools
Ma intenancegrantDeve lopmentgrant
TLM grant
Yes No Don’tknow
Yes No Don’tknow
SSA school
grants
Ma intenancegrantDeve lopmentgrant
TLM grant
Yes No Don’tknow
Yes No Don’tknow
No.of
Sch.
EVERY RURAL GOVERNMENT PRIMARY SCHOOLIS ENTITLED TO EACH OF THESE SSA GRANTSEVERY YEAR.
The PAISA section of ASER tracks receipt and spending
of Sarva Shiksha Abhiyan (SSA) grants at the school
level. This information is collected from schools visited
during the survey. This page reports proportion of
schools receiving the grants and carrying out specified
activities in the schools. More detailed analysis of the
PAISA data will be available in the PAISA 2011 report
which will be released in March 2012.1

Uttarakhand RURAL
Note : For schools with enrollment above 200children the PTR shall not exceed 40 excludingthe Head Teacher
As part of ASER 2010 and 2011, in each sampled village, onegovernment school with primary sections was visited on theday of the survey. During this school visit, RTE indicators wereobserved and are reported here.
Note: School observations for ASER 2011 looked at TLM for Std II and Std IV only.
2010 2011School
enrollment No. ofschools
No. ofschools
% ofschools
% ofschools
RTETeacherNorms
1-60
61-90
91-120
121-150
151-200
> 200
TOTAL
2011Schoolenrollment
2010
2
3
4
5
5 + HMsee note
2010
1
2
3
4
5
6
>=7
TOTAL
2011
Numberof
teachersNo.of
schools
No.of
schools
%of
schools
%of
schools
RTE norm:At least one
classroom perteacher
1
2
3
4
5
6
>=7
TOTAL
20112010
% Schools that do notmeet classroom to teacher
normsNumber ofteachers
% of schools with 2011
Building
DrinkingWater
Toilet
Girls Toilet
TLM
Library
MDM
Table 17: Schools by totalenrollment 2010 and 2011
Table 18: RTE norms: Pupil-teacherratio 2010 and 2011
Table 19: Schools by number ofteachers 2010 and 2011
Table 20: RTE norms: Teacher -classroom ratio 2010 and 2011
Table 21: % Schools meeting selected RTE norms on facilities 2010 & 2011
2010
1-60
61-90
91-120
121-150
151-200
> 200
TOTAL
224 ASER 2011
229 69.0 202 69.4
41 12.4 28 9.6
15 4.5 15 5.2
14 4.2 13 4.5
12 3.6 14 4.8
21 6.3 19 6.5
332 100.0 291 100.0
155 62.5 120 60.6
47 19.0 42 21.2
18 7.3 10 5.1
9 3.6 12 6.1
5 2.0 2 1.0
5 2.0 3 1.5
9 3.6 9 4.6
248 100.0 198 100.0
2.9 3.4
9.1 12.0
28.6 50.0
37.5 55.6
100.0 0.0
100.0 0.0
66.7 100.0
12.6 15.3
Right to Education indicators
Extracts from the Schedule of The Right of Children toFree and Compulsory Education Act 2009 Norms andstandards for a School (Sections 19 and 25)
Number of teachers in Std 1-5:� Admitted children No. of teachers
<= 60 261-90 391-120 4121-200 5> 150 5 + 1 Headteacher> 200 Pupil-Teacher Ratio
(excluding Headteacher)shall not exceed 40
School facilities:All weather building with:
� At least one classroom for every teacher� Office cum store cum headteacher’s room� Separate toilets for boys and girls� Safe and adequate drinking water facility to
all children� A kitchen where mid-day meal is cooked in
the school� Playground� Arrangements for securing the school
building by boundary wall or fencing.
Teaching learning equipmentshall be provided to each class as required.
LibraryThere shall be a library in each school providingnewspaper, magazines and books on all subjects,including story-books.
84.3 78.8
90.9 94.7
84.6 100.0
92.3 83.3
100.0 100.0
84.2 88.9
86.3 83.7
87.9 83.067.4 67.867.0 61.122.1 19.39.7 12.5
68.3 68.25.8 4.9
40.9 35.453.4 59.747.7 14.1
11.5 13.216.9 19.424.0 53.382.4 87.379.1 82.152.3 17.727.2 41.820.4 40.596.3 94.295.1 93.2
% Schools that donot meet PTR norms
Office/Store/Office cum storePlaygroundBoundary WallNo facility for drinking waterFacility but no drinking water availableDrinking water availableNo toilet facilityFacility but toilet not useableToilet useable% Schools with no separate provisions for girls toiletsOf schools with separate girls toilets, % schools whereToilet lockedToilet not useableToilet useableTeaching learning material in Std 2Teaching learning material in Std 4No libraryLibrary but no books being used by children on day of visitLibrary being used by children on day of visitKitchen shed for cooking midday mealMidday meal served in school on the day of visit

Uttar Pradesh
West Bengal
Daman and Diu
Puducherry


Uttar Pradesh RURAL
Note: 'OTHER' includes children going to madarssa and EGS.‘NOT IN SCHOOL’ = dropped out + never enrolled.
How to read this table: If a child started school in Std I at age 6, she should be age 8 inStd 3. This table shows the age distribution for each class. For example, in Std III, 35%children are 8 years old but there are also 11.6% who are 7, 18.7 % who are 9, 16.0%who are 10 years old, etc.
Chart 1: Trends over time% Children out of school by age group and gender 2006-2011
How to read this chart: For example, the proportion of girls (age 11-14) not in schoolhas changed from 11.1% in 2006 to 8.4% in 2007 to 10.2% in 2008 to 9.5% in 2009to 9.7% in 2010 to 9.7% in 2011
ALL ANALYSIS BASED ON DATA FROM HOUSEHOLDS. 68 OUT OF 69 DISTRICTS
TotalAge group Govt. Pvt. Other Not inSchool
46.0 45.4 2.5 6.1 100
43.2 45.9 2.2 8.6 100
48.9 44.7 2.9 3.5 100
44.8 49.5 2.3 3.4 100
53.8 38.9 3.6 3.7 100
42.1 47.5 1.9 8.5 100
39.0 51.9 1.7 7.4 100
45.7 42.4 2.2 9.7 100
31.3 45.7 1.1 21.9 100
31.4 47.4 0.9 20.3 100
31.2 43.7 1.4 23.7 100
Age: 6-14 ALL
Age: 7-16 ALL
Age: 7-10 ALL
Age: 7-10 BOYS
Age: 7-10 GIRLS
Age: 11-14 ALL
Age: 11-14 BOYS
Age: 11-14 GIRLS
Age: 15-16 ALL
Age: 15-16 BOYS
Age: 15-16 GIRLS
I
II
III
IV
V
VI
VII
VIII
Table 2: Sample description% Children in each class by age 2011
5 6 7 8 9 10 11 12 13 14 15 16 Total
27.0 35.0 17.7 11.1 9.2
4.3 13.7 30.9 26.4 9.2 9.6 6.0
5.4 11.6 35.0 18.7 16.0 5.0 5.5 2.9
6.0 15.0 26.7 27.4 9.8 9.7 5.5
1.7 6.2 9.3 35.1 19.7 16.6 5.3 6.1
5.6 15.7 27.9 30.4 10.3 6.3 3.9
1.8 6.5 10.3 38.5 22.2 13.4 5.4 1.8
6.1 17.3 33.3 25.5 13.0 4.9
100
100
100
100
100
100
100
100
Std.
Table 1: % Children in different types of schools 2011
227ASER 2011
School enrollment and out of school children
Young children in pre-school and school
% C
hild
ren
% C
hild
ren
% C
hild
ren
Chart 2: Trends over time% Children enrolled in private school by class 2007, 2009 & 2011
Chart 3: Trends over timeFive year olds in pre-school & school 2007, 2009 & 2011
Tota
l
In SchoolIn balwadi
oranganwadi
In LKG/UKG
Age 5
Age 6
Govt Pvt Other
7.9 8.2 33.9 31.1 2.7 16.2 100
2.4 5.9 44.4 37.0 2.8 7.7 100
Not
enr
olle
dan
ywh
ere
Table 3: % Children age 5-6 who are enrolled in differenttypes of pre-school & school 2011

Reading Tool
Uttar Pradesh RURAL
How to read this table: Each cell shows the highest level of reading achieved by a child.For example, in Std III, 13.7% children cannot even read letters, 30.6% can readletters but not more, 22.4% can read words but not Std 1 text or higher, 15.1% canread Std 1 text but not Std 2 level text, and 18.3% can read Std 2 level text. In sum, foreach class, the total of all these exclusive categories is 100%.
Std. NothingLevel 1
(Std 1 Text)Level 2
(Std 2 Text) Total
I
II
III
IV
V
VI
VII
VIII
Total
47.4 37.3 9.4 3.3 2.7 100
22.5 39.7 20.0 8.7 9.1 100
13.7 30.6 22.4 15.1 18.3 100
8.3 22.7 19.9 17.9 31.2 100
6.3 16.1 15.2 19.2 43.3 100
2.8 11.1 10.1 17.5 58.5 100
2.3 8.2 7.2 15.2 67.1 100
1.8 5.6 5.0 11.3 76.4 100
16.5 24.1 14.1 12.7 32.6 100
Chart 5: Trends over time% Children in Std V who CANNOT READ Std II LEVEL TEXTBy school type 2008-2011
Chart 4: Trends over time% Children in Std III who CANNOT READ Std I LEVEL TEXTBy school type 2008-2011
Letter Word
Table 4: % Children by class and READING levelAll schools 2011
Note : In ASER 2011 for every state, reading tools were provided in the main mediumof instruction in government schools. Children and their families were also askedabout the language they speak at home. For home languages, a list of 122 languageswas provided to all survey teams. This list includes 22 Scheduled languages and 100Non-Scheduled languages. The data in this table is for children for whom we haveinformation for both school language and home language.
Table 5: School language and home language
% Children whose :
Home language is the same as school language
Home language is different from school language
Total
%
228 ASER 2011
93.9
6.1
100.0
Home language and school language
Reading
% C
hild
ren
% C
hild
ren

Math Tool
How to read this table: Each cell shows the highest level of arithmetic achieved by achild. For example, in Std III, 11.5% children cannot even recognize numbers 1-9, 36.8%children can recognize numbers up to 9 but not more, 29.8% can recognize numbers to99 but cannot do subtraction, 15.5% can do subtraction but not division, and 6.4% cando division. In sum, for each class, the total of all these exclusive categories is 100%.
Std. Nothing Subtract Divide Total
I
II
III
IV
V
VI
VII
VIII
Total
45.0 40.9 11.1 2.3 0.7 100
20.1 45.2 24.2 8.5 2.0 100
11.5 36.8 29.8 15.5 6.4 100
6.5 28.5 30.1 21.8 13.2 100
4.3 21.1 27.0 26.3 21.4 100
2.3 14.2 24.1 29.6 29.8 100
1.9 10.3 21.2 29.7 36.8 100
1.4 7.1 19.0 27.5 45.0 100
14.8 28.4 22.8 17.9 16.1 100
Recognize Numbers11-991-9
Chart 7: Trends over time% Children in Std V who CANNOT DO DIVISIONBy school type 2008-2011
Chart 6: Trends over time% Children in Std III who CANNOT RECOGNISE NUMBERSupto 100. By school type 2008-2011
Uttar Pradesh RURAL
Table 7: Class-wise % children attending PAID TUITION CLASSESBy school type 2007, 2009, 2010 and 2011
Note: In 2007, 2009, 2010 and 2011 the ASER survey recorded information abouttuition. In all 4 years, the question asked was the following: “Does the child take anypaid additional class currently?” Therefore, these numbers do not include anysupplemental help in learning that children may have received from parents, siblingsor from anyone else who did not require payment.
Year School I II III IV V VI VII VIII Total
2007
2009
2010
2011
Govt
Pvt
Govt
Pvt
Govt
Pvt
Govt
Pvt
Table 6: % Children by class and ARITHMETIC levelAll schools 2011
229ASER 2011
3.8 4.1 4.6 5.8 6.4 7.3 9.0 11.5 5.8
11.6 15.1 17.0 17.3 19.5 20.1 21.9 24.5 18.0
5.2 5.9 5.9 6.4 7.3 8.4 9.4 11.8 7.0
12.8 15.4 18.6 19.6 21.0 19.2 20.7 24.8 18.5
3.8 4.5 5.1 5.0 7.6 7.3 8.4 9.0 5.9
10.1 12.4 14.5 16.2 16.8 16.4 17.9 18.9 15.0
3.7 4.6 4.8 5.8 6.2 8.1 9.2 10.1 6.1
11.5 13.0 13.5 14.8 16.1 15.4 15.6 19.2 14.5
Arithmetic
Tuition
% C
hild
ren
% C
hild
ren
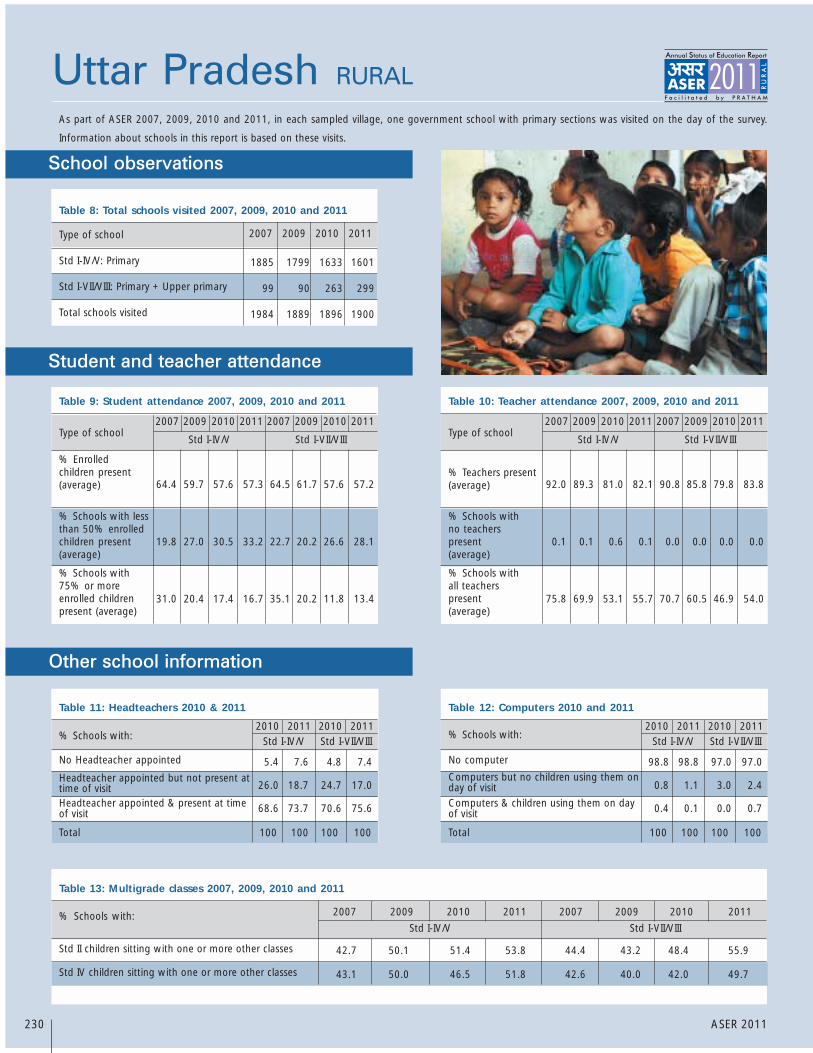
As part of ASER 2007, 2009, 2010 and 2011, in each sampled village, one government school with primary sections was visited on the day of the survey.
Information about schools in this report is based on these visits.
Uttar Pradesh RURAL
2007 2009 2010 2011 2007 2009 2010 2011
Std I-IV/V Std I-VII/VIIIType of school
% Enrolledchildren present(average)
% Schools with lessthan 50% enrolledchildren present(average)
% Schools with75% or moreenrolled childrenpresent (average)
2007 2009 2010 2011 2007 2009 2010 2011
Std I-IV/V Std I-VII/VIIIType of school
% Teachers present(average)
% Schools withno teacherspresent(average)
% Schools withall teacherspresent(average)
Std I-IV/V Std I-VII/VIII2010 2011 2010 2011
% Schools with:
No Headteacher appointed
Headteacher appointed but not present attime of visitHeadteacher appointed & present at timeof visit
Total
Std I-IV/V Std I-VII/VIII2010 2011 2010 2011
% Schools with:
No computer
Computers but no children using them onday of visitComputers & children using them on dayof visit
Total
2007Type of school
Std I-IV/V: Primary
Std I-VII/VIII: Primary + Upper primary
Total schools visited
2009 2010 2011
Table 8: Total schools visited 2007, 2009, 2010 and 2011
Table 9: Student attendance 2007, 2009, 2010 and 2011
Table 11: Headteachers 2010 & 2011 Table 12: Computers 2010 and 2011
Table 10: Teacher attendance 2007, 2009, 2010 and 2011
230 ASER 2011
5.4 7.6 4.8 7.4
26.0 18.7 24.7 17.0
68.6 73.7 70.6 75.6
100 100 100 100
98.8 98.8 97.0 97.0
0.8 1.1 3.0 2.4
0.4 0.1 0.0 0.7
100 100 100 100
1885 1799 1633 1601
99 90 263 299
1984 1889 1896 1900
64.4 59.7 57.6 57.3 64.5 61.7 57.6 57.2
19.8 27.0 30.5 33.2 22.7 20.2 26.6 28.1
31.0 20.4 17.4 16.7 35.1 20.2 11.8 13.4
92.0 89.3 81.0 82.1 90.8 85.8 79.8 83.8
0.1 0.1 0.6 0.1 0.0 0.0 0.0 0.0
75.8 69.9 53.1 55.7 70.7 60.5 46.9 54.0
2007 2009 2010 2011
Std I-IV/V
2007 2009 2010 2011
Std I-VII/VIII% Schools with:
Std II children sitting with one or more other classes
Table 13: Multigrade classes 2007, 2009, 2010 and 2011
42.7 50.1 51.4 53.8 44.4 43.2 48.4 55.9
43.1 50.0 46.5 51.8 42.6 40.0 42.0 49.7Std IV children sitting with one or more other classes
School observations
Other school information
Student and teacher attendance

Uttar Pradesh RURAL
How much goes toeach school For what purposes
SCHOOL DEVELOPMENT GRANT / SCHOOL GRANT
Rs.5000 per year perprimary school
Rs.7000 per year per upperprimary school
Rs 5000 + Rs 7000 =Rs 12000 if the school isStd I-VII/VIII.
Note: Primary and UpperPrimary schools are treatedas separate schools even ifthey are in the same pre-mises.
This grant can be used forbuying school equipmentsuch as blackboard, sittingmats etc. Also for buyingchalk, duster, registers andother office equipment.
The grant amount varies bytype of school: whether it isa primary or upper primaryschool.
SCHOOL MAINTENANCE GRANT
Rs.5000 - Rs 7500 perschool per year if the schoolhas upto 3 classrooms.
Rs 7500 - Rs.10000 per yearif the school has more than3 classrooms.
Primary and Upper Primaryschools are treated asseparate schools even ifthey are in the samebuilding.
TLM GRANT
This grant can be used byteachers to buy teachingaids, such as charts, globes,posters, models etc.
Rs.500 per teacher per yearin primary and upper pri-mary schools.
1 For more information see www.accountabilityinitiative.in
231ASER 2011
School funds and activities (PAISA)
This grant can be used formaintenance of schoolbuilding, includingwhitewashing;beautification; and repair oftoilets, hand pump,boundary wall, playgroundetc.
The grant amount dependson number of classrooms(excluding Headmasterroom and office room)
DID SCHOOLS GET THEIR MONEY ON TIME?
2008-2009 2009-2010 2010-2011SSA school
grants% Schools % Schools % SchoolsNo.
ofSch.
No.of
Sch.Yes No Don’tknow
DID SCHOOLS GET THEIR MONEY ON TIME?
April 2009 toOctober 2009
April 2010 toOctober 2010
April 2011 toOctober 2011
% Schools % Schools % SchoolsNo.of
Sch.
No.of
Sch.
No.of
Sch.Yes No Don’tknow
Type of Activity
Yes No Don'tknow
New Classroom
Repair of building (roof, floor, wall etc.)
Repair of doors & windows
Repair of boundary wall
Repair of drinking water facility
Repair of toilet
White wash/plastering
Painting Blackboard/Display Board/Painting on wall
Painting of doors & walls
Purchase of furniture (cupboard etc.)
Purchase of electrical fittings
Purchase of chalk, duster, register etc.
Purchase of sitting Mats/Tat Patti
Purchase of charts, globes & other teaching material
Expenditure on school events
Payment of bills (electricity, water, cleaning etc.)
Const.
Repairs
Painting
& White
Wash
Purchase
Other
Table 15: % Schools who report receiving SSA grants - Half financial year
Table 16: % Schools carrying out different activities since April 2010
Table 14: % Schools who report receiving SSA grants - Full financial year
1750 66.0 11.6 22.4 1799 68.0 5.2 26.8 1884 80.2 6.2 13.7
1715 59.1 16.2 24.7 1763 62.3 9.5 28.2 1880 72.3 12.8 14.9
1759 75.0 10.0 15.0 1733 74.6 7.0 18.4 1883 80.5 9.9 9.6
1592 42.6 31.0 26.4 1759 37.0 30.2 32.8 1870 54.1 28.8 17.1
1567 37.1 34.8 28.1 1736 32.8 32.5 34.7 1861 46.2 35.1 18.7
1608 51.6 29.4 19.0 1705 38.1 34.7 27.2 1862 39.3 45.8 15.0
15.5 78.2 6.3
38.4 55.7 5.9
41.1 53.1 5.8
26.3 67.9 5.8
43.1 51.7 5.2
28.0 66.5 5.5
83.7 11.8 4.5
78.2 17.2 4.6
79.7 15.8 4.5
44.8 48.8 6.4
34.5 59.7 5.8
88.4 7.0 4.6
80.2 15.0 4.8
73.7 21.0 5.4
65.8 27.3 6.9
16.9 72.9 10.2
% schools
Ma intenancegrantDeve lopmentgrant
TLM grant
Yes No Don’tknow
Yes No Don’tknow
SSA school
grants
Ma intenancegrantDeve lopmentgrant
TLM grant
Yes No Don’tknow
Yes No Don’tknow
No.of
Sch.
EVERY RURAL GOVERNMENT PRIMARY SCHOOLIS ENTITLED TO EACH OF THESE SSA GRANTSEVERY YEAR.
The PAISA section of ASER tracks receipt and spending
of Sarva Shiksha Abhiyan (SSA) grants at the school
level. This information is collected from schools visited
during the survey. This page reports proportion of
schools receiving the grants and carrying out specified
activities in the schools. More detailed analysis of the
PAISA data will be available in the PAISA 2011 report
which will be released in March 2012.1

Uttar Pradesh RURAL
Note : For schools with enrollment above 200children the PTR shall not exceed 40 excludingthe Head Teacher
As part of ASER 2010 and 2011, in each sampled village, onegovernment school with primary sections was visited on theday of the survey. During this school visit, RTE indicators wereobserved and are reported here.
Note: School observations for ASER 2011 looked at TLM for Std II and Std IV only.
2010 2011School
enrollment No. ofschools
No. ofschools
% ofschools
% ofschools
RTETeacherNorms
1-60
61-90
91-120
121-150
151-200
> 200
TOTAL
2011Schoolenrollment
2010
2
3
4
5
5 + HMsee note
2010
1
2
3
4
5
6
>=7
TOTAL
2011
Numberof
teachersNo.of
schools
No.of
schools
%of
schools
%of
schools
RTE norm:At least one
classroom perteacher
1
2
3
4
5
6
>=7
TOTAL
20112010
% Schools that do notmeet classroom to teacher
normsNumber ofteachers
% of schools with 2011
Building
DrinkingWater
Toilet
Girls Toilet
TLM
Library
MDM
Table 17: Schools by totalenrollment 2010 and 2011
Table 18: RTE norms: Pupil-teacherratio 2010 and 2011
Table 19: Schools by number ofteachers 2010 and 2011
Table 20: RTE norms: Teacher -classroom ratio 2010 and 2011
Table 21: % Schools meeting selected RTE norms on facilities 2010 & 2011
2010
1-60
61-90
91-120
121-150
151-200
> 200
TOTAL
232 ASER 2011
87 4.6 108 5.7
188 9.9 215 11.3
300 15.9 334 17.6
306 16.2 316 16.6
404 21.4 346 18.2
606 32.1 580 30.5
1891 100.0 1899 100.0
132 7.1 130 7.0
556 29.9 625 33.6
620 33.4 603 32.4
345 18.6 324 17.4
112 6.0 93 5.0
50 2.7 44 2.4
44 2.4 40 2.2
1859 100.0 1859 100.0
0.0 2.5
5.0 6.7
15.4 18.1
33.4 35.0
37.6 37.2
60.5 76.9
65.9 72.2
18.4 19.7
Right to Education indicators
Extracts from the Schedule of The Right of Children toFree and Compulsory Education Act 2009 Norms andstandards for a School (Sections 19 and 25)
Number of teachers in Std 1-5:� Admitted children No. of teachers
<= 60 261-90 391-120 4121-200 5> 150 5 + 1 Headteacher> 200 Pupil-Teacher Ratio
(excluding Headteacher)shall not exceed 40
School facilities:All weather building with:
� At least one classroom for every teacher� Office cum store cum headteacher’s room� Separate toilets for boys and girls� Safe and adequate drinking water facility to
all children� A kitchen where mid-day meal is cooked in
the school� Playground� Arrangements for securing the school
building by boundary wall or fencing.
Teaching learning equipmentshall be provided to each class as required.
LibraryThere shall be a library in each school providingnewspaper, magazines and books on all subjects,including story-books.
19.8 19.6
50.3 51.9
77.6 81.4
93.8 95.5
89.9 91.5
97.7 96.7
83.9 83.5
88.6 88.160.8 71.144.4 57.96.9 5.4
10.9 10.282.2 84.46.7 7.4
45.9 38.847.4 53.924.9 16.6
25.3 19.115.9 16.933.9 47.473.5 79.069.6 74.251.4 22.925.8 39.922.9 37.289.3 94.771.2 95.0
% Schools that donot meet PTR norms
Office/Store/Office cum storePlaygroundBoundary WallNo facility for drinking waterFacility but no drinking water availableDrinking water availableNo toilet facilityFacility but toilet not useableToilet useable% Schools with no separate provisions for girls toiletsOf schools with separate girls toilets, % schools whereToilet lockedToilet not useableToilet useableTeaching learning material in Std 2Teaching learning material in Std 4No libraryLibrary but no books being used by children on day of visitLibrary being used by children on day of visitKitchen shed for cooking midday mealMidday meal served in school on the day of visit

West Bengal RURAL
Note: 'OTHER' includes children going to madarssa and EGS.‘NOT IN SCHOOL’ = dropped out + never enrolled.
How to read this table: If a child started school in Std I at age 6, she should be age 8 inStd 3. This table shows the age distribution for each class. For example, in Std III,39.3% children are 8 years old but there are also 15.6% who are 7, 24.6% who are 9,10.9% who are 10 years old, etc.
Chart 1: Trends over time% Children out of school by age group and gender 2006-2011
How to read this chart: For example, the proportion of girls (age 11-14) not in schoolhas changed from 12.1% in 2006 to 8.3% in 2007 to 7.7% in 2008 to 8.5% in 2009to 5.5% in 2010 to 4.3% in 2011
ALL ANALYSIS BASED ON DATA FROM HOUSEHOLDS. 17 OUT OF 17 DISTRICTS
TotalAge group Govt. Pvt. Other Not inSchool
87.8 6.3 1.6 4.3 100
86.8 5.0 1.6 6.6 100
87.3 9.0 1.5 2.2 100
86.3 9.8 1.6 2.4 100
88.3 8.3 1.4 2.0 100
89.6 2.4 1.7 6.3 100
87.3 2.4 1.9 8.4 100
91.9 2.4 1.5 4.3 100
79.4 2.0 1.6 17.0 100
76.5 2.0 1.8 19.7 100
82.6 2.0 1.3 14.2 100
Age: 6-14 ALL
Age: 7-16 ALL
Age: 7-10 ALL
Age: 7-10 BOYS
Age: 7-10 GIRLS
Age: 11-14 ALL
Age: 11-14 BOYS
Age: 11-14 GIRLS
Age: 15-16 ALL
Age: 15-16 BOYS
Age: 15-16 GIRLS
I
II
III
IV
V
VI
VII
VIII
Table 2: Sample description% Children in each class by age 2011
5 6 7 8 9 10 11 12 13 14 15 16 Total
30.0 37.4 19.0 7.4 6.3
4.2 17.2 40.5 24.2 6.1 7.9
3.9 15.6 39.3 24.6 10.9 5.7
3.8 13.6 32.6 29.7 8.3 6.8 5.2
14.2 35.7 27.7 13.8 8.6
3.8 11.4 27.7 31.9 13.9 6.8 4.5
2.6 9.8 32.0 31.3 15.1 9.2
2.6 11.8 33.4 32.5 14.6 5.1
100
100
100
100
100
100
100
100
Std.
Table 1: % Children in different types of schools 2011
233ASER 2011
School enrollment and out of school children
Young children in pre-school and school
% C
hild
ren
% C
hild
ren
% C
hild
ren
Chart 2: Trends over time% Children enrolled in private school by class 2007, 2009 & 2011
Chart 3: Trends over timeFive year olds in pre-school & school 2007, 2009 & 2011
Tota
l
In SchoolIn balwadi
oranganwadi
In LKG/UKG
Age 5
Age 6
Govt Pvt Other
30.4 11.1 41.6 7.6 2.1 7.1 100
10.7 6.5 66.7 11.1 1.3 3.7 100
Not
enr
olle
dan
ywh
ere
Table 3: % Children age 5-6 who are enrolled in differenttypes of pre-school & school 2011

Reading Tool
West Bengal RURAL
How to read this table: Each cell shows the highest level of reading achieved by a child.For example, in Std III, 5.2% children cannot even read letters, 19.9% can read lettersbut not more, 26.9% can read words but not Std 1 text or higher, 23.9% can read Std1 text but not Std 2 level text, and 24.1% can read Std 2 level text. In sum, for eachclass, the total of all these exclusive categories is 100%.
Std. NothingLevel 1
(Std 1 Text)Level 2
(Std 2 Text) Total
I
II
III
IV
V
VI
VII
VIII
Total
20.2 45.3 21.8 8.1 4.6 100
9.7 33.6 29.5 14.8 12.4 100
5.2 19.9 26.9 23.9 24.1 100
3.4 13.9 22.2 26.6 33.9 100
2.4 8.4 15.3 25.2 48.8 100
1.9 5.3 9.4 25.5 57.9 100
0.9 3.3 5.5 17.1 73.2 100
0.4 1.1 3.4 14.8 80.3 100
5.7 16.8 17.0 19.5 40.9 100
Chart 5: Trends over time% Children in Std V who CANNOT READ Std II LEVEL TEXTBy school type 2008-2011
Chart 4: Trends over time% Children in Std III who CANNOT READ Std I LEVEL TEXTBy school type 2008-2011
Letter Word
Table 4: % Children by class and READING levelAll schools 2011
Note : In ASER 2011 for every state, reading tools were provided in the main mediumof instruction in government schools. Children and their families were also askedabout the language they speak at home. For home languages, a list of 122 languageswas provided to all survey teams. This list includes 22 Scheduled languages and 100Non-Scheduled languages. The data in this table is for children for whom we haveinformation for both school language and home language.
Table 5: School language and home language
% Children whose :
Home language is the same as school language
Home language is different from school language
Total
%
234 ASER 2011
91.9
8.1
100.0
Home language and school language
Reading
% C
hild
ren
% C
hild
ren
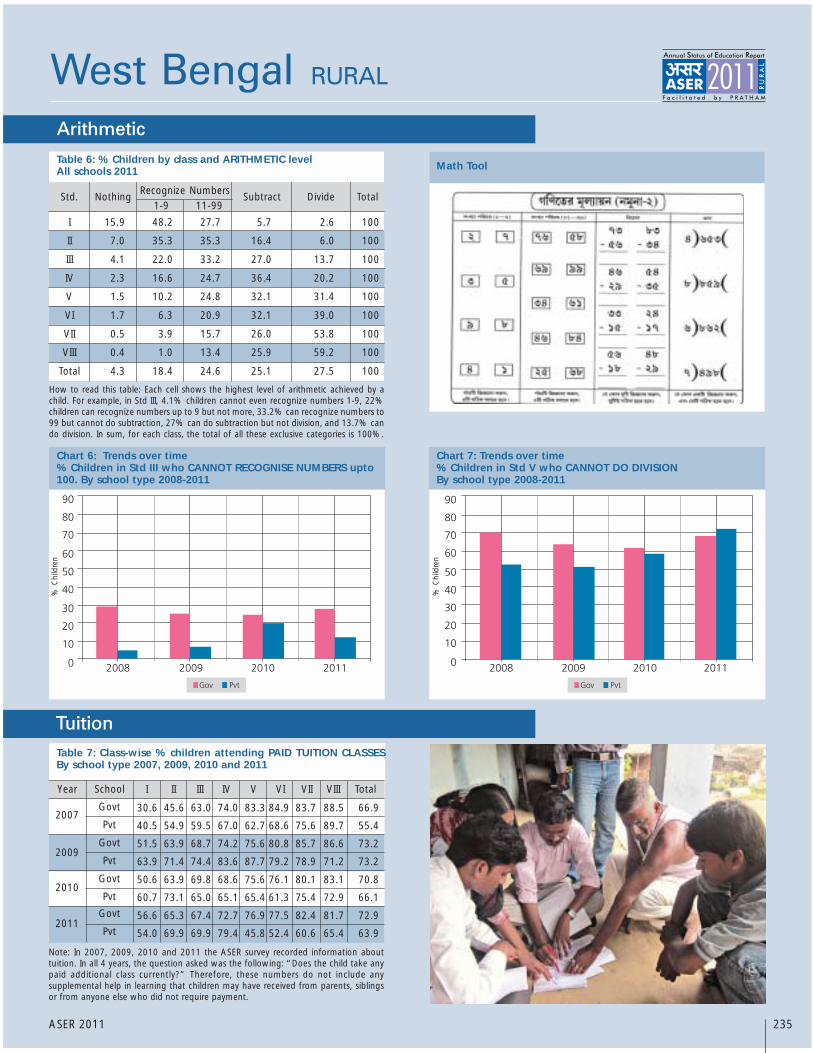
Math Tool
How to read this table: Each cell shows the highest level of arithmetic achieved by achild. For example, in Std III, 4.1% children cannot even recognize numbers 1-9, 22%children can recognize numbers up to 9 but not more, 33.2% can recognize numbers to99 but cannot do subtraction, 27% can do subtraction but not division, and 13.7% cando division. In sum, for each class, the total of all these exclusive categories is 100%.
Std. Nothing Subtract Divide Total
I
II
III
IV
V
VI
VII
VIII
Total
15.9 48.2 27.7 5.7 2.6 100
7.0 35.3 35.3 16.4 6.0 100
4.1 22.0 33.2 27.0 13.7 100
2.3 16.6 24.7 36.4 20.2 100
1.5 10.2 24.8 32.1 31.4 100
1.7 6.3 20.9 32.1 39.0 100
0.5 3.9 15.7 26.0 53.8 100
0.4 1.0 13.4 25.9 59.2 100
4.3 18.4 24.6 25.1 27.5 100
Recognize Numbers11-991-9
Chart 7: Trends over time% Children in Std V who CANNOT DO DIVISIONBy school type 2008-2011
Chart 6: Trends over time% Children in Std III who CANNOT RECOGNISE NUMBERS upto100. By school type 2008-2011
West Bengal RURAL
Table 7: Class-wise % children attending PAID TUITION CLASSESBy school type 2007, 2009, 2010 and 2011
Note: In 2007, 2009, 2010 and 2011 the ASER survey recorded information abouttuition. In all 4 years, the question asked was the following: “Does the child take anypaid additional class currently?” Therefore, these numbers do not include anysupplemental help in learning that children may have received from parents, siblingsor from anyone else who did not require payment.
Year School I II III IV V VI VII VIII Total
2007
2009
2010
2011
Govt
Pvt
Govt
Pvt
Govt
Pvt
Govt
Pvt
Table 6: % Children by class and ARITHMETIC levelAll schools 2011
235ASER 2011
30.6 45.6 63.0 74.0 83.3 84.9 83.7 88.5 66.9
40.5 54.9 59.5 67.0 62.7 68.6 75.6 89.7 55.4
51.5 63.9 68.7 74.2 75.6 80.8 85.7 86.6 73.2
63.9 71.4 74.4 83.6 87.7 79.2 78.9 71.2 73.2
50.6 63.9 69.8 68.6 75.6 76.1 80.1 83.1 70.8
60.7 73.1 65.0 65.1 65.4 61.3 75.4 72.9 66.1
56.6 65.3 67.4 72.7 76.9 77.5 82.4 81.7 72.9
54.0 69.9 69.9 79.4 45.8 52.4 60.6 65.4 63.9
Arithmetic
Tuition
% C
hild
ren
% C
hild
ren

As part of ASER 2007, 2009, 2010 and 2011, in each sampled village, one government school with primary sections was visited on the day of the survey.
Information about schools in this report is based on these visits.
West Bengal RURAL
2007Type of school
Std I-IV/V: Primary
Std I-VII/VIII: Primary + Upper primary
Total schools visited
2009 2010 2011
Table 8: Total schools visited 2007, 2009, 2010 and 2011
236 ASER 2011
395 417 406 400
9 7 2 1
404 424 408 401
School observations
Other school information
Student and teacher attendance
2007 2009 2010 2011
Std I-IV/VType of school
% Enrolledchildren present(average)
% Schools with lessthan 50% enrolledchildren present(average)
% Schools with75% or moreenrolled childrenpresent (average)
Std I-IV/V2010 2011
% Schools with:
No Headteacher appointed
Headteacher appointed but not present attime of visitHeadteacher appointed & present at timeof visit
Total
Std I-IV/V2010 2011
% Schools with:
No computer
Computers but no children using them onday of visitComputers & children using them on dayof visit
Total
Table 9: Student attendance 2007, 2009, 2010 and 2011
Table 11: Headteachers 2010 & 2011 Table 12: Computers 2010 and 2011
1.1 0.8
4.7 4.5
94.2 94.8
100 100
99.0 96.4
0.5 2.3
0.5 1.3
100 100
69.7 65.9 68.5 60.7
14.7 20.9 15.8 27.9
50.7 39.8 45.7 26.9
2007 2009 2010 2011
Std I-IV/VType of school
% Teachers present(average)
% Schools withno teacherspresent(average)
% Schools withall teacherspresent(average)
Table 10: Teacher attendance 2007, 2009, 2010 and 2011
90.6 87.7 85.6 86.3
0.0 0.3 0.0 0.0
71.4 68.4 58.4 59.6
2007 2009 2010 2011
Std I-IV/V% Schools with:
Std II children sitting with one or more other classes
Table 13: Multigrade classes 2007, 2009, 2010 and 2011
36.7 46.6 42.6 38.7
24.6 38.7 33.8 30.9Std IV children sitting with one or more other classes

West Bengal RURAL
How much goes toeach school For what purposes
SCHOOL DEVELOPMENT GRANT / SCHOOL GRANT
Rs.5000 per year perprimary school
Rs.7000 per year per upperprimary school
Rs 5000 + Rs 7000 =Rs 12000 if the school isStd I-VII/VIII.
Note: Primary and UpperPrimary schools are treatedas separate schools even ifthey are in the same pre-mises.
This grant can be used forbuying school equipmentsuch as blackboard, sittingmats etc. Also for buyingchalk, duster, registers andother office equipment.
The grant amount varies bytype of school: whether it isa primary or upper primaryschool.
SCHOOL MAINTENANCE GRANT
Rs.5000 - Rs 7500 perschool per year if the schoolhas upto 3 classrooms.
Rs 7500 - Rs.10000 per yearif the school has more than3 classrooms.
Primary and Upper Primaryschools are treated asseparate schools even ifthey are in the samebuilding.
TLM GRANT
This grant can be used byteachers to buy teachingaids, such as charts, globes,posters, models etc.
Rs.500 per teacher per yearin primary and upper pri-mary schools.
1 For more information see www.accountabilityinitiative.in
237ASER 2011
School funds and activities (PAISA)
This grant can be used formaintenance of schoolbuilding, includingwhitewashing;beautification; and repair oftoilets, hand pump,boundary wall, playgroundetc.
The grant amount dependson number of classrooms(excluding Headmasterroom and office room)
DID SCHOOLS GET THEIR MONEY ON TIME?
2008-2009 2009-2010 2010-2011SSA school
grants% Schools % Schools % SchoolsNo.
ofSch.
No.of
Sch.Yes No Don’tknow
DID SCHOOLS GET THEIR MONEY ON TIME?
April 2009 toOctober 2009
April 2010 toOctober 2010
April 2011 toOctober 2011
% Schools % Schools % SchoolsNo.of
Sch.
No.of
Sch.
No.of
Sch.Yes No Don’tknow
Table 15: % Schools who report receiving SSA grants - Half financial year
Table 14: % Schools who report receiving SSA grants - Full financial year
390 70.5 23.6 5.9 377 80.4 10.6 9.0 380 72.1 17.9 10.0
371 59.6 34.5 5.9 363 73.6 17.4 9.1 375 62.4 28.0 9.6
381 74.8 21.0 4.2 374 85.3 8.6 6.2 379 77.8 14.0 8.2
331 39.3 54.1 6.7 346 31.2 59.5 9.3 364 39.6 51.1 9.3
329 30.4 62.3 7.3 320 28.1 62.2 9.7 353 33.7 56.1 10.2
327 45.0 50.5 4.6 322 32.3 59.0 8.7 363 42.2 48.8 9.1
MaintenancegrantDeve lopmentgrant
TLM grant
Yes No Don’tknow
Yes No Don’tknow
SSA school
grants
Ma intenancegrantDeve lopmentgrant
TLM grant
Yes No Don’tknow
Yes No Don’tknow
No.of
Sch.
EVERY RURAL GOVERNMENT PRIMARY SCHOOLIS ENTITLED TO EACH OF THESE SSA GRANTSEVERY YEAR.
The PAISA section of ASER tracks receipt and spending
of Sarva Shiksha Abhiyan (SSA) grants at the school
level. This information is collected from schools visited
during the survey. This page reports proportion of
schools receiving the grants and carrying out specified
activities in the schools. More detailed analysis of the
PAISA data will be available in the PAISA 2011 report
which will be released in March 2012.1

West Bengal RURAL
Note : For schools with enrollment above 200children the PTR shall not exceed 40 excludingthe Head Teacher
Extracts from the Schedule of The Right of Children toFree and Compulsory Education Act 2009 Norms andstandards for a School (Sections 19 and 25)
Number of teachers in Std 1-5:� Admitted children No. of teachers
<= 60 261-90 391-120 4121-200 5> 150 5 + 1 Headteacher> 200 Pupil-Teacher Ratio
(excluding Headteacher)shall not exceed 40
School facilities:All weather building with:
� At least one classroom for every teacher� Office cum store cum headteacher’s room� Separate toilets for boys and girls� Safe and adequate drinking water facility to
all children� A kitchen where mid-day meal is cooked in
the school� Playground� Arrangements for securing the school
building by boundary wall or fencing.
Teaching learning equipmentshall be provided to each class as required.
LibraryThere shall be a library in each school providingnewspaper, magazines and books on all subjects,including story-books.
As part of ASER 2010 and 2011, in each sampled village, onegovernment school with primary sections was visited on theday of the survey. During this school visit, RTE indicators wereobserved and are reported here.
Note: School observations for ASER 2011 looked at TLM for Std II and Std IV only.
2010 2011School
enrollment No. ofschools
No. ofschools
% ofschools
% ofschools
RTETeacherNorms
1-60
61-90
91-120
121-150
151-200
> 200
TOTAL
2011Schoolenrollment
2010
2
3
4
5
5 + HMsee note
2010
1
2
3
4
5
6
>=7
TOTAL
2011
Numberof
teachersNo.of
schools
No.of
schools
%of
schools
%of
schools
RTE norm:At least one
classroom perteacher
1
2
3
4
5
6
>=7
TOTAL
20112010
% Schools that do notmeet classroom to teacher
normsNumber ofteachers
% of schools with 2011
Building
DrinkingWater
Toilet
Girls Toilet
TLM
Library
MDM
Table 17: Schools by totalenrollment 2010 and 2011
Table 18: RTE norms: Pupil-teacherratio 2010 and 2011
Table 19: Schools by number ofteachers 2010 and 2011
Table 20: RTE norms: Teacher -classroom ratio 2010 and 2011
Table 21: % Schools meeting selected RTE norms on facilities 2010 & 2011
2010
1-60
61-90
91-120
121-150
151-200
> 200
TOTAL
238 ASER 2011
40 10.1 51 13.1
68 17.2 61 15.7
74 18.7 81 20.9
65 16.5 55 14.2
76 19.2 69 17.8
72 18.2 71 18.3
395 100.0 388 100.0
20 5.7 41 11.3
83 23.7 84 23.1
92 26.3 91 25.0
79 22.6 70 19.2
36 10.3 37 10.2
25 7.1 20 5.5
15 4.3 21 5.8
350 100.0 364 100.0
0.0 0.0
6.9 19.7
25.6 22.5
37.1 35.1
86.7 75.9
95.0 94.1
75.0 93.8
35.2 35.5
Right to Education indicators
25.8 25.0
69.6 57.1
77.5 66.7
87.7 73.6
66.7 74.6
90.0 85.5
73.9 65.7
79.3 81.342.0 50.634.1 42.319.3 21.113.5 15.567.2 63.47.6 8.6
40.3 42.052.1 49.544.5 26.1
14.5 19.217.4 13.423.7 41.271.7 78.065.3 71.650.5 39.217.8 18.831.8 42.086.0 87.063.0 55.6
% Schools that donot meet PTR norms
Office/Store/Office cum storePlaygroundBoundary WallNo facility for drinking waterFacility but no drinking water availableDrinking water availableNo toilet facilityFacility but toilet not useableToilet useable% Schools with no separate provisions for girls toiletsOf schools with separate girls toilets, % schools whereToilet lockedToilet not useableToilet useableTeaching learning material in Std 2Teaching learning material in Std 4No libraryLibrary but no books being used by children on day of visitLibrary being used by children on day of visitKitchen shed for cooking midday mealMidday meal served in school on the day of visit

Daman and Diu RURAL
Note: 'OTHER' includes children going to madarssa and EGS.‘NOT IN SCHOOL’ = dropped out + never enrolled.
How to read this table: If a child started school in Std I at age 6, she should be age 8 inStd 3. This table shows the age distribution for each class. For example, in Std III,58.9% children are 8 years old but there are also 11.9% who are 7, 22.7% who are 9years old, etc.
Chart 1: Trends over time% Children out of school by age group and gender 2006-2011
How to read this chart: For example, the proportion of girls (age 11-14) not in schoolhas changed from 1.7% in 2006 to 1.6% in 2007 to 0.9% in 2008 to 1% in 2009 to0.4% in 2010 to 0.0% in 2011
ALL ANALYSIS BASED ON DATA FROM HOUSEHOLDS. 2 OUT OF 2 DISTRICTS
TotalAge group Govt. Pvt. Other Not inSchool
77.2 22.3 0.5 0.0 100
79.4 19.6 0.5 0.4 100
77.2 22.5 0.3 0.0 100
73.4 26.0 0.6 0.0 100
81.9 18.2 0.0 0.0 100
78.9 20.3 0.7 0.0 100
74.8 23.8 1.4 0.0 100
83.4 16.6 0.0 0.0 100
85.3 11.9 0.5 2.3 100
86.4 11.9 0.0 1.7 100
84.2 11.8 1.1 2.9 100
Age: 6-14 ALL
Age: 7-16 ALL
Age: 7-10 ALL
Age: 7-10 BOYS
Age: 7-10 GIRLS
Age: 11-14 ALL
Age: 11-14 BOYS
Age: 11-14 GIRLS
Age: 15-16 ALL
Age: 15-16 BOYS
Age: 15-16 GIRLS
I
II
III
IV
V
VI
VII
VIII
Table 2: Sample description% Children in each class by age 2011
5 6 7 8 9 10 11 12 13 14 15 16 Total
32.6 53.8 13.5 0.2
1.3 8.1 72.7 11.1 6.8
0.2 11.9 58.9 22.7 6.3
2.7 11.0 46.4 32.0 6.9 1.1
4.5 5.8 51.6 28.7 7.7 1.6
1.2 7.3 55.9 28.1 7.7
2.1 8.3 52.3 26.4 7.8 3.2
4.3 13.8 53.9 22.4 5.6
100
100
100
100
100
100
100
100
Std.
Table 1: % Children in different types of schools 2011
239ASER 2011
School enrollment and out of school children
Young children in pre-school and school
% C
hild
ren
% C
hild
ren
% C
hild
ren
Chart 2: Trends over time% Children enrolled in private school by class 2007, 2009 & 2011
Chart 3: Trends over timeFive year olds in pre-school & school 2007, 2009 & 2011
Tota
l
In SchoolIn balwadi
oranganwadi
In LKG/UKG
Age 5
Age 6
Govt Pvt Other
16.3 18.0 47.5 18.2 0.0 0.0 100
0.3 10.0 60.7 29.0 0.0 0.0 100
Not
enr
olle
dan
ywh
ere
Table 3: % Children age 5-6 who are enrolled in differenttypes of pre-school & school 2011

Reading Tool
Daman and Diu RURAL
How to read this table: Each cell shows the highest level of reading achieved by a child.For example, in Std III, 1.5% children cannot even read letters, 18% can read lettersbut not more, 41.1% can read words but not Std 1 text or higher, 34.7% can read Std1 text but not Std 2 level text, and 4.8% can read Std 2 level text. In sum, for eachclass, the total of all these exclusive categories is 100%.
Std. NothingLevel 1
(Std 1 Text)Level 2
(Std 2 Text) Total
I
II
III
IV
V
VI
VII
VIII
Total
15.6 54.6 20.6 6.1 3.1 100
6.8 36.3 41.4 8.9 6.6 100
1.5 18.0 41.1 34.7 4.8 100
1.1 4.6 30.0 39.3 25.1 100
0.2 7.1 20.7 26.9 45.1 100
0.3 3.8 10.6 36.2 49.0 100
0.3 2.6 8.7 32.6 55.8 100
0.0 1.8 4.5 20.7 73.0 100
2.9 14.8 21.8 26.4 34.1 100
Chart 5: Trends over time% Children in Std V who CANNOT READ Std II LEVEL TEXTBy school type 2008-2011
Chart 4: Trends over time% Children in Std III who CANNOT READ Std I LEVEL TEXTBy school type 2008-2011
Letter Word
Table 4: % Children by class and READING levelAll schools 2011
Note : In ASER 2011 for every state, reading tools were provided in the main mediumof instruction in government schools. Children and their families were also askedabout the language they speak at home. For home languages, a list of 122 languageswas provided to all survey teams. This list includes 22 Scheduled languages and 100Non-Scheduled languages. The data in this table is for children for whom we haveinformation for both school language and home language.
Table 5: School language and home language
% Children whose :
Home language is the same as school language
Home language is different from school language
Total
%
240 ASER 2011
100.0
0.0
100.0
Home language and school language
Reading
% C
hild
ren
% C
hild
ren

Math Tool
How to read this table: Each cell shows the highest level of arithmetic achieved by achild. For example, in Std III, 4.0% children cannot even recognize numbers 1-9, 28.0%children can recognize numbers up to 9 but not more, 43.2% can recognize numbers to99 but cannot do subtraction, 22.3% can do subtraction but not division, and 2.6% cando division. In sum, for each class, the total of all these exclusive categories is 100%.
Std. Nothing Subtract Divide Total
I
II
III
IV
V
VI
VII
VIII
Total
16.9 56.9 20.5 4.1 1.7 100
10.1 30.1 41.7 15.9 2.3 100
4.0 28.0 43.2 22.3 2.6 100
2.5 22.9 39.1 31.5 4.0 100
1.2 15.2 21.6 40.9 21.1 100
1.6 10.5 21.2 44.9 21.8 100
1.9 7.5 20.1 34.8 35.8 100
0.0 4.8 8.3 34.6 52.3 100
4.3 20.9 26.4 29.6 18.8 100
Recognize Numbers11-991-9
Chart 7: Trends over time% Children in Std V who CANNOT DO DIVISIONBy school type 2008-2011
Chart 6: Trends over time% Children in Std III who CANNOT RECOGNISE NUMBERS upto100. By school type 2008-2011
Daman and Diu RURAL
Table 7: Class-wise % children attending PAID TUITION CLASSESBy school type 2007, 2009, 2010 and 2011
Note: In 2007, 2009, 2010 and 2011 the ASER survey recorded information abouttuition. In all 4 years, the question asked was the following: “Does the child take anypaid additional class currently?” Therefore, these numbers do not include anysupplemental help in learning that children may have received from parents, siblingsor from anyone else who did not require payment.
Year School I II III IV V VI VII VIII Total
2007
2009
2010
2011
Govt
Pvt
Govt
Pvt
Govt
Pvt
Govt
Pvt
Table 6: % Children by class and ARITHMETIC levelAll schools 2011
241ASER 2011
25.2 20.8 35.8 28.1 34.7 38.4 25.6 35.7 30.8
75.9 82.0 79.0 77.2 87.2 81.6 59.7 80.6 79.3
12.9 21.2 30.7 21.4 36.8 28.7 27.6 27.2 26.6
61.0 76.9 71.5 70.6 65.3 79.7 61.4 57.7 68.7
35.4 32.8 26.9 41.0 41.1 37.5 29.1 41.4 35.9
71.7 62.5 80.2 81.4 86.2 85.3 84.6 86.9 79.7
28.0 26.4 35.6 33.4 30.0 34.1 28.8 24.6 30.4
78.8 90.8 87.3 85.3 89.6 78.0 75.0 75.0 82.8
Arithmetic
Tuition
% C
hild
ren
% C
hild
ren

Puducherry RURAL
Note: 'OTHER' includes children going to madarssa and EGS.‘NOT IN SCHOOL’ = dropped out + never enrolled.
How to read this table: If a child started school in Std I at age 6, she should be age 8 inStd 3. This table shows the age distribution for each class. For example, in Std III,67.0% children are 8 years old but there are also 23.0% who are 7, 8.8% who are 9years old, etc.
Chart 1: Trends over time% Children out of school by age group and gender 2006-2011
How to read this chart: For example, the proportion of girls (age 11-14) not in schoolhas changed from 2.3% in 2006 to 0.0% in 2007 to 1.2% in 2008 to 0.7% in 2009to 0.2% in 2010 to 0.0% in 2011
ALL ANALYSIS BASED ON DATA FROM HOUSEHOLDS. 2 OUT OF 2 DISTRICTS
TotalAge group Govt. Pvt. Other Not inSchool
54.9 45.0 0.1 0.0 100
59.2 39.7 0.6 0.5 100
44.1 55.9 0.0 0.0 100
39.2 60.8 0.0 0.0 100
48.7 51.3 0.0 0.0 100
65.9 33.9 0.3 0.0 100
63.4 36.1 0.5 0.0 100
68.5 31.6 0.0 0.0 100
68.7 27.0 2.1 2.3 100
62.5 32.4 2.3 2.8 100
73.8 22.5 1.9 1.9 100
Age: 6-14 ALL
Age: 7-16 ALL
Age: 7-10 ALL
Age: 7-10 BOYS
Age: 7-10 GIRLS
Age: 11-14 ALL
Age: 11-14 BOYS
Age: 11-14 GIRLS
Age: 15-16 ALL
Age: 15-16 BOYS
Age: 15-16 GIRLS
I
II
III
IV
V
VI
VII
VIII
Table 2: Sample description% Children in each class by age 2011
5 6 7 8 9 10 11 12 13 14 15 16 Total
54.6 37.1 6.1 2.3
0.0 22.9 66.4 7.6 3.1
1.2 23.0 67.0 8.8 0.0
0.6 14.2 67.8 11.0 6.5
0.6 10.0 77.2 10.6 1.7
7.1 69.2 18.4 5.4
0.0 15.7 66.7 14.8 2.9
1.0 10.1 72.6 14.2 2.0
100
100
100
100
100
100
100
100
Std.
Table 1: % Children in different types of schools 2011
242ASER 2011
School enrollment and out of school children
Young children in pre-school and school
% C
hild
ren
% C
hild
ren
% C
hild
ren
Chart 2: Trends over time% Children enrolled in private school by class 2007, 2009 & 2011
Chart 3: Trends over timeFive year olds in pre-school & school 2007, 2009 & 2011
Table 3: % Children age 5-6 who are enrolled in differenttypes of pre-school & school 2011
Not
enr
olle
dan
ywh
ere
Tota
l
In SchoolIn balwadi
oranganwadi
In LKG/UKG
Age 5
Age 6
Govt Pvt Other
0.9 27.4 28.1 43.6 0.0 0.0 100
0.0 0.0 27.0 73.0 0.0 0.0 100

Reading Tool
Puducherry RURAL
How to read this table: Each cell shows the highest level of reading achieved by a child.For example, in Std III, 11.7% children cannot even read letters, 27.9% can readletters but not more, 29.8% can read words but not Std 1 text or higher, 19.5% canread Std 1 text but not Std 2 level text, and 11.1 % can read Std 2 level text. In sum, foreach class, the total of all these exclusive categories is 100%.
Std. NothingLevel 1
(Std 1 Text)Level 2
(Std 2 Text) Total
I
II
III
IV
V
VI
VII
VIII
Total
35.7 37.3 23.1 4.0 0.0 100
19.2 25.6 30.4 16.0 8.8 100
11.7 27.9 29.8 19.5 11.1 100
6.1 7.5 28.6 33.3 24.5 100
4.3 8.5 21.2 35.8 30.3 100
1.7 4.9 16.5 36.2 40.7 100
1.0 4.5 11.5 34.0 49.0 100
0.0 5.6 6.2 28.5 59.8 100
8.4 13.7 19.9 27.2 30.8 100
Chart 5: Trends over time% Children in Std V who CANNOT READ Std II LEVEL TEXTBy school type 2008-2011
Chart 4: Trends over time% Children in Std III who CANNOT READ Std I LEVEL TEXTBy school type 2008-2011
Letter Word
Table 4: % Children by class and READING levelAll schools 2011
Note : In ASER 2011 for every state, reading tools were provided in the main mediumof instruction in government schools. Children and their families were also askedabout the language they speak at home. For home languages, a list of 122 languageswas provided to all survey teams. This list includes 22 Scheduled languages and 100Non-Scheduled languages. The data in this table is for children for whom we haveinformation for both school language and home language.
Table 5: School language and home language
% Children whose :
Home language is the same as school language
Home language is different from school language
Total
%
243 ASER 2011
100.0
0.0
100.0
Home language and school language
Reading
% C
hild
ren
% C
hild
ren

Math Tool
How to read this table: Each cell shows the highest level of arithmetic achieved by achild. For example, in Std III, 3.3% children cannot even recognize numbers 1-9, 8.5%children can recognize numbers up to 9 but not more, 52.6% can recognize numbers to99 but cannot do subtraction, 31.6% can do subtraction but not division, and 4.0% cando division. In sum, for each class, the total of all these exclusive categories is 100%.
Std. Nothing Subtract Divide Total
I
II
III
IV
V
VI
VII
VIII
Total
23.7 27.8 39.8 8.0 0.8 100
10.5 21.8 50.7 12.1 4.9 100
3.3 8.5 52.6 31.6 4.0 100
0.0 7.5 43.2 35.6 13.7 100
3.6 6.6 28.9 33.1 27.7 100
1.1 4.4 28.7 41.4 24.3 100
0.5 2.5 18.5 43.0 35.5 100
0.0 1.1 13.5 35.4 50.0 100
4.5 8.8 32.8 31.8 22.2 100
Recognize Numbers11-991-9
Chart 7: Trends over time% Children in Std V who CANNOT DO DIVISIONBy school type 2008-2011
Chart 6: Trends over time% Children in Std III who CANNOT RECOGNISE NUMBERS upto100. By school type 2008-2011
Puducherry RURAL
Table 7: Class-wise % children attending PAID TUITION CLASSESBy school type 2007, 2009, 2010 and 2011
Note: In 2007, 2009, 2010 and 2011 the ASER survey recorded information abouttuition. In all 4 years, the question asked was the following: “Does the child take anypaid additional class currently?” Therefore, these numbers do not include anysupplemental help in learning that children may have received from parents, siblingsor from anyone else who did not require payment.
Year School I II III IV V VI VII VIII Total
2007
2009
2010
2011
Govt
Pvt
Govt
Pvt
Govt
Pvt
Govt
Pvt
Table 6: % Children by class and ARITHMETIC levelAll schools 2011
244ASER 2011
33.3 50.9 56.1 46.9 55.2 54.7 55.7 62.2 52.6
40.0 48.8 71.3 69.9 58.7 42.4 75.5 55.0 55.6
36.5 38.3 46.5 47.1 41.9 49.0 52.2 37.2 44.1
28.1 42.6 45.4 43.2 32.7 58.4 49.2 18.1 38.5
21.1 20.5 29.5 30.2 28.9 25.2 28.6 26.5 27.0
33.6 41.8 38.4 45.5 49.7 59.9 51.5 59.4 45.4
22.2 25.6 29.7 37.4 33.4 36.5 31.8 31.6 32.2
36.4 41.6 44.6 56.0 32.6 50.9 60.3 45.3 45.4
Arithmetic
Tuition
% C
hild
ren
% C
hild
ren

Divisional Estimates

Divisional estimates of learning outcomes andschooling status: Precision of ASER estimates
Every year since 2005, ASER has presented estimates of learning and of schooling status at the state and districtlevel. The survey design of ASER is based on the premise of generating estimates at the district level. Havingestimates of learning levels at this level is desirable since education plans are made at the district level. As aresult, ASER is one of the largest surveys undertaken by a non-government organization with a sample size ofapproximately 700,000 children in the age group of 3 – 16 years.
ASER is a household survey, undertaken in all rural districts of India. Within each district, 30 villages arerandomly chosen2 and in each village 20 households are randomly selected, for a total of 600 households perdistrict. This translates into around 900 – 1200 children per district.
The statistical precision of district level estimates is an issue because of the ASER sample design – namelyclustering and absence of stratification at the village level. In a design without clustering, children in therelevant age group would be directly sampled. Not only is this expensive (in terms of survey time), but it is alsodifficult to have a reliable population frame that could be used for sampling. Instead ASER employs a two-stageclustering design. The first stage clustering happens when villages are randomly picked. The second stageclustering is when households within a village are randomly picked and the children belonging to that householdare tested.
While this is an inexpensive and practical way of sampling children, it is well known that clustering increases thevariability of estimates. One way of increasing precision at the district level would have been to stratify thevillage sample according to age of children or school type. However, this would require a prior household listing,which is expensive in terms of both time and resources.
The ASER sample is stratified, however, at the district level. Insofar as outcomes within a district are morehomogenous than across districts, stratification within the district leads to more precise estimates at the statelevel.
Ramaswami and Wadhwa (2009)3 studied the precision of ASER state and district level estimates for a selectionof states and variables for the year 2008. They find that state level averages are estimated precisely – with amargin of error of 5% or less. However, district-level estimates are less precisely estimated. The precision variesboth across states and districts and according to the learning outcome. In both cases, learning outcomes ofchildren in class 3-5 are relatively less precisely estimated.
Two commonly used measures of precision are the margin of error and the 95% confidence interval.
The margin of error is the % interval around the point estimate that almost certainly contains the populationestimate (i.e., with 95% probability). For instance, if x is the margin of error then the population proportion lieswithin + x% of the sample proportion with 95% probability.
Suppose p̂ is the estimated sample proportion and is the associated standard error. From statistical theory,
it is known that the interval [ ] contains the population proportion with 95% probability – 95% confidence
interval. The margin of error expresses the confidence interval in terms of the sample estimate. It is thusdefined as
A margin of error of 10% is regarded as an acceptable degree of precision in many studies.4 Estimates with amargin of error in excess of 20% are regarded as estimates with low precision.
Wilima Wadhwa 1
1 Director (Statistics), ASER Centre2 Villages are chosen from the 2001 Census Directory using PPS (Probability Proportional to Size) sampling.3 Ramaswami, Bharat and Wadhwa, Wilima (2009), “Survey Design and Precision of ASER Estimates”, mimeo.4 United Nations (2005), Designing Household Survey Samples: Practical Guidelines, Studies in Methods, Series F No. 98, Department of Economic andSocial Affairs, Statistics Division.
pme
ˆˆ2σ=
246 ASER 2011

Note that the margin of error depends on the standard error and the estimated proportion, and the standarderror itself depends on the estimated proportion. For a given sample size, therefore, a lower precision will beassociated with a variable which has a lower incidence in the population and/or a higher standard error. Further,in the case of proportions, for a given sample size, the standard error is the largest for a population proportionclose to 0.5. On the other hand, for a given incidence, one way to reduce the standard error and thereforeincrease precision is to increase the sample size.
In the case of ASER, as shown by Ramaswami and Wadhwa (2009), precision is not an issue at the state level.At the district level, however, since sample sizes in sub-populations of interest are often much smaller than thetotal sample size, precision can be an issue. Increasing the sample size at the district level, for a national survey,however, is extremely costly. In the past, ASER has clubbed classes while presenting district level estimates, inan attempt to increase the sample size. However, precision gains from this strategy were limited, especially forvariables whose estimated proportions were in the vicinity of 0.5.
One way to provide sub-state estimates with acceptable levels of precision is to club districts within a state.5
Many states have administrative divisions, comprised of two or more districts that can be used as units ofanalysis. These divisions are at a level of aggregation between the state and district level. This year, we providedivisional estimates from 2007 to 2011 for those states that have administrative divisions.6 These are Bihar,Chhattisgarh, Haryana, Jammu & Kashmir, Jharkhand, Karnataka, Kerala, Madhya Pradesh, Maharashtra,Rajasthan, Uttar Pradesh and Uttarakhand.7 In addition, in Andhra Pradesh, Gujarat, Himachal Pradesh, Punjab,Odisha and Tamil Nadu, divisions were created using geographical regions commonly used in the states.8
Divisional estimates are provided for the following 6 variables:
% children in the age group 6-14 years who are out of school
% children in the age group 6-14 years who are in private school
% children in class 1-2 who can read letters, words or more
% children in class 1-2 who can recognize numbers (1-9) or more
% children in class 3-5 who can read level 1 (Std 1) text or more
% children in class 3-5 who can do subtraction or more.
In addition to the point estimates for 2007 – 2011, the 95%
confidence interval [ σ̂2ˆ ±p ] is also presented. The point estimate
as well as the confidence interval is presented for each division andalso for the state as a whole.
Figure 1 presents the margin of error for the four learning outcomesin selected states in 2011. As is clear from the figure, most of theseare below 5%. Also, note that learning outcomes in class 3-5 areless precisely estimated as compared to those in class 1-2. Similarnumbers are obtained for previous years.
At the division level too, among the four learning outcomes thevariability is highest for learning levels in class 3-5. As a result, themargin of error is the highest for these variables. In discussing thedivision level estimates we will concentrate on these variables sincethey give us the worst case scenario.
5 For instance, NSS surveys are not representative at the district level. However, they are representative for NSS regions, which are formed using agro-climatic criteria.6 We decided to go with the state administrative divisions, rather than the NSS regions, since these are more commonly used within the state.7 The composition of each division was obtained from the state websites, and is reported alongside the divisional estimates presented in this report.8 See the section on Divisional Estimates in this report for the exact composition.
247ASER 2011

We can look at division level estimates in two ways. First, for a particular year and state, one can examine theprecision of estimates across divisions; and second, for a particular state and division, we can look at the marginof error across years. Figures 2.1 and 2.2 present the margins of error for language and math in class 3-5 in 2011across divisions of selected states. Language learning outcomes at division level in most states are estimated
Figures 3.1 and 3.2 present the margins of error, for language and math in class 3-5, for one division in theselected states, from 2007 to 2011. Margins of error are fairly robust over time, except in MP when they spike in2011. Again, across the board precision levels are lower for math learning outcomes.
Why are margins of error consistently higher for math in class 3-5? Similarly, compared to learning outcomes inclass 1-2, why are learning outcomes in class 3-5 less precisely estimated? First, for a given sample size, themargin of error is inversely proportional to the incidence of the variable concerned. What this implies is that anyvariable that has a low incidence in the population will be estimated with a high margin of error. Intuitively thismakes sense because if something is not observed very frequently, one would need a much larger sample size tomeasure it accurately. However, this is not that much of a problem if the standard error is small. To see why,
248 ASER 2011
with margins of under or close to 10%. The exceptions are Madhya Pradesh and Tamil Nadu. Across the board,precision levels are lower for math learning outcomes. Rajasthan and Tamil Nadu have margins of error that arecloser to 15% and those for Madhya Pradesh are close to 20-25%.

consider the case of out of school children– say the point estimate is 0.04 (i.e., 4%) with a standard error of 0.01(i.e. 1% point). The margin of error would be 50% (=((2 * 0.01)/0.04)*100) which is very high. However, notethat this translates into confidence bounds of +2 percentage points, i.e., with 95% probability the true proportionof out of school children lie between 2% and 6%. In other words, given a low incidence, a high margin of errormay still translate into tight confidence bands. Another way of looking at this is by focusing on in-school childreninstead of out of school children. If out of school children are 0.04 then in-school children will be 0.96 or 96%with the same standard error of 0.01 giving a margin of error of only 2.1% and confidence bounds of +2percentage points.
Second, the margin of error is directly proportional to the standard error. For a given sample size, a largestandard error, implying imprecise estimation, will not surprisingly result in a high margin of error. In the case ofproportions, the standard error itself depends on the value of the proportion, and is larger the closer the value isto 0.5. Intuitively, the reason behind this is that the greatest uncertainty is associated with a proportion of 0.5,requiring larger sample sizes to measure it accurately.
By and large, class 1-2 learning outcomes (i.e. the % of children in Class 1-2 who can read letters or more/recognize numbers 1-9 or more) are higher as compared to class 3-5 outcomes (i.e. % of children in class 3-5who can read Std 1 level text or more/do subtraction or more), resulting in lower margins of error.9 Similarly, inclass 3-5, language outcomes are better than math outcomes and often math outcomes are close to 0.5 resultingin higher margins of error for math.10
Overall, the divisional estimates are more precisely estimated as compared to district level estimates. Clubbingdistricts increases the sample size and lowers the standard errors. It also smoothes the jumpiness in pointestimates often observed at the district level. One of the problems associated with large standard errors andtherefore with wide confidence intervals is that it is difficult to identify significant changes across districts andtime. The use of divisional estimates resolves this problem to a large extent.
9 Often sample sizes are also larger for class 1-2, which would result in lower margins of error.10 This also explains the large margins of error for Madhya Pradesh in both language and math learning outcomes in 2011. Both these learning levelsfell in 2011 and the point estimates are close to 0.5.
249ASER 2011
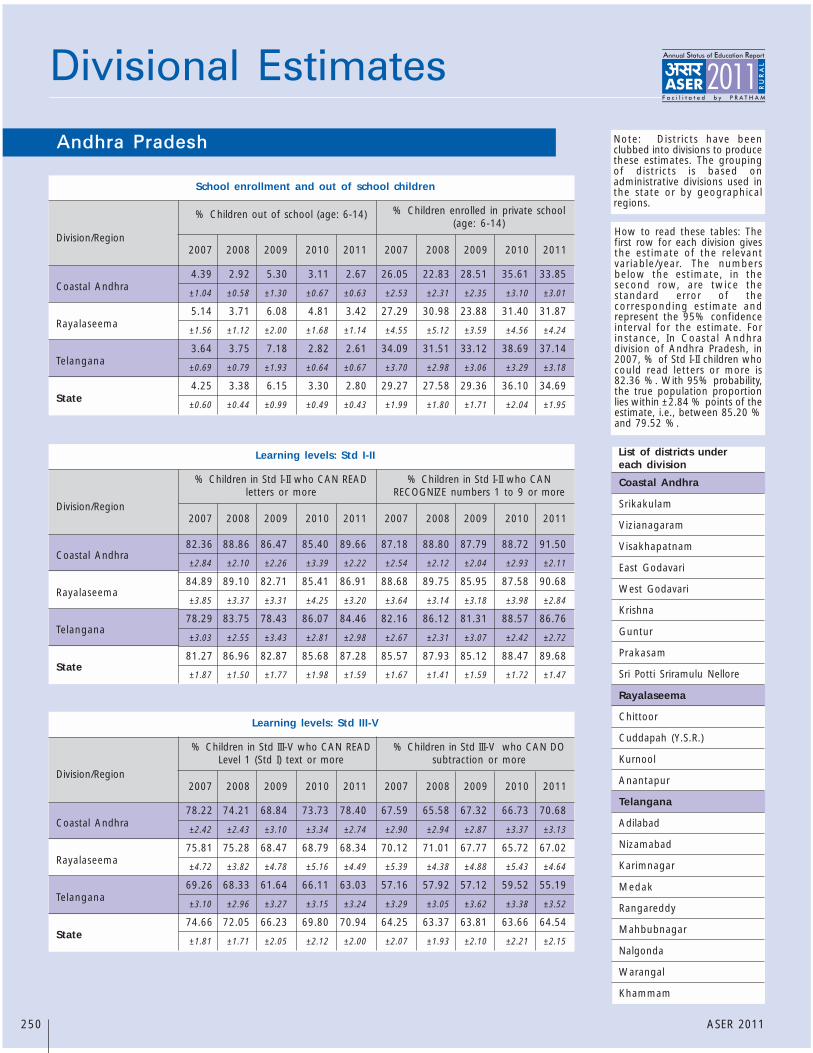
Divisional Estimates
Note: Districts have beenclubbed into divisions to producethese estimates. The groupingof districts is based onadministrative divisions used inthe state or by geographicalregions.
How to read these tables: Thefirst row for each division givesthe estimate of the relevantvariable/year. The numbersbelow the estimate, in thesecond row, are twice thestandard error of thecorresponding estimate andrepresent the 95% confidenceinterval for the estimate. Forinstance, In Coastal Andhradivision of Andhra Pradesh, in2007, % of Std I-II children whocould read letters or more is82.36 %. With 95% probability,the true population proportionlies within ±2.84 % points of theestimate, i.e., between 85.20 %and 79.52 %.
Andhra Pradesh
School enrollment and out of school children
% Children out of school (age: 6-14) % Children enrolled in private school(age: 6-14)
Division/Region
4.39 2.92 5.30 3.11 2.67 26.05 22.83 28.51 35.61 33.85
±1.04 ±0.58 ±1.30 ±0.67 ±0.63 ±2.53 ±2.31 ±2.35 ±3.10 ±3.01
5.14 3.71 6.08 4.81 3.42 27.29 30.98 23.88 31.40 31.87
±1.56 ±1.12 ±2.00 ±1.68 ±1.14 ±4.55 ±5.12 ±3.59 ±4.56 ±4.24
3.64 3.75 7.18 2.82 2.61 34.09 31.51 33.12 38.69 37.14
±0.69 ±0.79 ±1.93 ±0.64 ±0.67 ±3.70 ±2.98 ±3.06 ±3.29 ±3.18
4.25 3.38 6.15 3.30 2.80 29.27 27.58 29.36 36.10 34.69
±0.60 ±0.44 ±0.99 ±0.49 ±0.43 ±1.99 ±1.80 ±1.71 ±2.04 ±1.95
Coastal Andhra
Rayalaseema
Telangana
State
Learning levels: Std I-II
% Children in Std I-II who CAN READletters or more
% Children in Std I-II who CANRECOGNIZE numbers 1 to 9 or more
Division/Region
82.36 88.86 86.47 85.40 89.66 87.18 88.80 87.79 88.72 91.50
±2.84 ±2.10 ±2.26 ±3.39 ±2.22 ±2.54 ±2.12 ±2.04 ±2.93 ±2.11
84.89 89.10 82.71 85.41 86.91 88.68 89.75 85.95 87.58 90.68
±3.85 ±3.37 ±3.31 ±4.25 ±3.20 ±3.64 ±3.14 ±3.18 ±3.98 ±2.84
78.29 83.75 78.43 86.07 84.46 82.16 86.12 81.31 88.57 86.76
±3.03 ±2.55 ±3.43 ±2.81 ±2.98 ±2.67 ±2.31 ±3.07 ±2.42 ±2.72
81.27 86.96 82.87 85.68 87.28 85.57 87.93 85.12 88.47 89.68
±1.87 ±1.50 ±1.77 ±1.98 ±1.59 ±1.67 ±1.41 ±1.59 ±1.72 ±1.47
Coastal Andhra
Rayalaseema
Telangana
State
Learning levels: Std III-V
% Children in Std III-V who CAN READLevel 1 (Std I) text or more
% Children in Std III-V who CAN DOsubtraction or more
Division/Region2007 2008 2009 2010 2011 2007 2008 2009 2010 2011
78.22 74.21 68.84 73.73 78.40 67.59 65.58 67.32 66.73 70.68
±2.42 ±2.43 ±3.10 ±3.34 ±2.74 ±2.90 ±2.94 ±2.87 ±3.37 ±3.13
75.81 75.28 68.47 68.79 68.34 70.12 71.01 67.77 65.72 67.02
±4.72 ±3.82 ±4.78 ±5.16 ±4.49 ±5.39 ±4.38 ±4.88 ±5.43 ±4.64
69.26 68.33 61.64 66.11 63.03 57.16 57.92 57.12 59.52 55.19
±3.10 ±2.96 ±3.27 ±3.15 ±3.24 ±3.29 ±3.05 ±3.62 ±3.38 ±3.52
74.66 72.05 66.23 69.80 70.94 64.25 63.37 63.81 63.66 64.54
±1.81 ±1.71 ±2.05 ±2.12 ±2.00 ±2.07 ±1.93 ±2.10 ±2.21 ±2.15
Coastal Andhra
Rayalaseema
Telangana
State
Coastal Andhra
Srikakulam
Vizianagaram
Visakhapatnam
East Godavari
West Godavari
Krishna
Guntur
Prakasam
Sri Potti Sriramulu Nellore
Rayalaseema
Chittoor
Cuddapah (Y.S.R.)
Kurnool
Anantapur
Telangana
Adilabad
Nizamabad
Karimnagar
Medak
Rangareddy
Mahbubnagar
Nalgonda
Warangal
Khammam
List of districts undereach division
2007 2008 2009 2010 2011 2007 2008 2009 2010 2011
2007 2008 2009 2010 2011 2007 2008 2009 2010 2011
250 ASER 2011

Divisional Estimates
Bihar
School enrollment and out of school children
% Children out of school (age: 6-14) % Children enrolled in private school(age: 6-14)
Division/Region
4.74 6.32 4.75 5.94 5.90 3.97 5.85 3.46 4.26 2.98±2.43 ±2.96 ±1.82 ±3.71 ±2.23 ±1.72 ±2.83 ±1.82 ±2.69 ±1.95
4.78 5.49 5.46 3.25 2.63 5.69 6.34 3.79 3.23 5.26±1.74 ±1.47 ±2.98 ±1.12 ±0.97 ±1.62 ±1.65 ±1.65 ±1.27 ±1.49
9.80 6.45 5.13 5.39 2.36 4.62 6.61 1.74 2.92 1.68±2.80 ±4.35 ±1.21 ±1.73 ±0.85 ±1.79 ±5.22 ±0.78 ±1.49 ±0.72
6.15 4.18 5.01 4.79 2.98 6.69 11.91 5.47 8.83 7.63±1.87 ±1.37 ±1.45 ±2.34 ±1.07 ±2.06 ±3.44 ±1.69 ±2.31 ±1.62
6.19 5.03 3.46 3.64 3.40 7.53 7.05 4.82 3.19 4.82±1.82 ±1.09 ±0.93 ±1.00 ±0.99 ±1.79 ±1.90 ±1.55 ±1.05 ±1.26
4.34 2.97 2.82 1.43 3.00 12.64 11.15 8.85 5.28 9.58±1.05 ±0.81 ±0.90 ±0.54 ±0.84 ±2.33 ±2.79 ±2.12 ±1.35 ±1.90
9.88 7.50 5.86 3.08 4.37 3.19 3.92 2.47 4.63 1.46±3.96 ±1.86 ±1.34 ±1.22 ±1.60 ±1.22 ±1.25 ±0.87 ±2.60 ±0.59
6.17 4.14 1.72 3.21 2.47 11.70 15.03 8.35 9.44 10.04±2.50 ±1.55 ±0.71 ±1.08 ±1.13 ±3.01 ±3.10 ±2.92 ±2.22 ±2.58
6.75 7.71 2.95 3.40 1.87 7.22 7.06 4.48 5.25 4.65±1.61 ±1.54 ±0.76 ±0.91 ±0.63 ±1.80 ±1.70 ±1.32 ±1.39 ±1.19
6.45 5.65 4.03 3.48 2.95 7.36 8.26 4.96 5.16 5.50±0.77 ±0.58 ±0.54 ±0.45 ±0.37 ±0.73 ±0.84 ±0.61 ±0.62 ±0.56
Bhagalpur
Darbhanga
Kosi
Magadh
Munger
Patna
Purnia
Saran
Tirhut
State
2007 2008 2009 2010 2011 2007 2008 2009 2010 2011
Division/Region
67.73 69.38 67.54 75.01 55.34 64.00 68.98 64.01 76.32 56.93±8.74 ±5.95 ±8.00 ±5.90 ±6.10 ±8.39 ±6.20 ±9.43 ±5.57 ±6.17
74.28 58.52 71.91 56.28 55.90 67.04 61.90 70.88 56.69 58.35±6.10 ±5.60 ±6.58 ±6.76 ±5.79 ±6.70 ±5.29 ±6.37 ±6.62 ±5.81
69.47 75.15 65.90 55.61 53.85 68.54 75.70 66.78 52.94 55.28±6.94 ±6.18 ±5.87 ±7.38 ±5.94 ±7.37 ±7.01 ±5.06 ±7.53 ±5.22
68.47 76.60 73.27 72.13 54.12 70.69 77.48 75.21 72.94 61.23±6.20 ±4.48 ±4.25 ±4.91 ±5.33 ±7.20 ±4.68 ±4.39 ±4.75 ±4.82
76.21 71.30 70.06 67.88 59.99 75.71 71.04 73.43 70.30 69.41±3.61 ±4.82 ±4.71 ±4.55 ±4.60 ±4.04 ±4.78 ±4.46 ±4.35 ±4.26
75.39 79.49 80.45 78.66 66.69 75.39 79.25 81.46 77.80 71.37±3.41 ±4.61 ±4.23 ±4.12 ±4.56 ±3.84 ±5.09 ±4.41 ±4.25 ±4.35
79.14 70.96 74.13 79.89 62.55 74.11 70.05 74.23 80.45 66.65±4.39 ±4.90 ±4.44 ±3.90 ±4.69 ±5.13 ±4.47 ±4.43 ±3.89 ±4.76
77.47 68.48 67.18 68.78 64.50 73.15 69.49 70.80 67.81 65.38±5.65 ±5.61 ±8.47 ±7.29 ±6.85 ±6.11 ±5.47 ±8.33 ±7.36 ±6.34
76.58 62.69 66.04 66.59 59.97 73.43 67.68 68.14 65.28 58.28±4.42 ±3.77 ±4.01 ±3.90 ±4.50 ±4.42 ±3.25 ±4.17 ±4.03 ±4.51
74.67 68.22 71.00 68.45 59.66 72.05 69.96 72.17 68.21 62.49±1.84 ±1.84 ±1.86 ±1.96 ±1.87 ±1.96 ±1.72 ±1.85 ±1.98 ±1.84
Bhagalpur
Darbhanga
Kosi
Magadh
Munger
Patna
Purnia
Saran
Tirhut
State
2007 2008 2009 2010 2011 2007 2008 2009 2010 2011
Learning levels: Std I-II
% Children in Std I-II who CAN READletters or more
% Children in Std I-II who CANRECOGNIZE numbers 1 to 9 or more
List of districts undereach division
Bhagalpur
Bhagalpur
Banka
Darbhanga
Madhubani
Darbhanga
Samastipur
Kosi
Supaul
Madhepura
Saharsa
Magadh
Jehanabad
Aurangabad
Gaya
Nawada
Munger
Begusarai
Khagaria
Munger
Lakhisarai
Sheikhpura
Jamui
Note: Districts have beenclubbed into divisions to producethese estimates. The groupingof districts is based onadministrative divisions used inthe state or by geographicalregions.
How to read these tables: Thefirst row for each division givesthe estimate of the relevantvariable/year. The numbersbelow the estimate, in thesecond row, are twice thestandard error of thecorresponding estimate andrepresent the 95% confidenceinterval for the estimate. Forinstance, In Bhagalpur division ofBihar, in 2007, % of Std I-IIchildren who could read lettersor more is 67.73 %. With 95%probability, the true populationproportion lies within ±8.74 %points of the estimate, i.e.,between 76.47 % and 58.99 %.
251ASER 2011

Divisional Estimates
Bihar
Division/Region
63.34 63.26 53.24 60.88 52.82 68.54 62.41 57.02 66.29 47.81±6.03 ±6.03 ±8.75 ±6.54 ±5.85 ±6.34 ±6.30 ±8.72 ±6.32 ±5.42
69.04 62.11 64.96 59.43 47.25 70.12 58.14 65.88 57.01 39.74±5.58 ±4.36 ±5.19 ±5.56 ±4.57 ±5.90 ±4.84 ±5.51 ±5.60 ±3.90
71.42 68.32 60.05 57.81 52.70 70.41 64.36 69.28 59.14 50.62±6.31 ±6.60 ±5.71 ±6.31 ±5.75 ±6.29 ±8.03 ±5.24 ±5.83 ±5.74
76.79 73.84 68.57 75.45 50.00 75.21 65.54 67.30 77.24 46.26±4.63 ±3.86 ±4.41 ±4.42 ±4.72 ±4.94 ±4.54 ±4.33 ±4.20 ±4.70
74.50 72.36 66.53 62.27 57.01 79.09 67.49 70.55 62.36 59.31±3.52 ±3.98 ±4.08 ±4.09 ±4.74 ±4.00 ±4.44 ±4.16 ±4.43 ±5.06
67.88 72.93 70.32 64.73 58.47 67.97 69.80 68.56 66.13 56.12±3.56 ±4.09 ±4.22 ±4.42 ±4.11 ±3.50 ±4.44 ±4.75 ±4.55 ±4.19
63.08 62.22 55.98 70.56 43.90 67.46 55.90 57.68 72.29 41.72±5.73 ±6.02 ±4.14 ±4.89 ±4.77 ±5.46 ±6.15 ±4.30 ±4.49 ±5.35
63.02 72.27 68.63 67.83 60.91 66.23 67.57 71.11 64.96 56.33±6.14 ±4.95 ±5.79 ±6.00 ±6.10 ±6.41 ±5.82 ±6.17 ±6.06 ±5.99
69.27 65.84 53.81 59.45 51.87 67.39 57.46 54.99 54.90 46.64±4.59 ±3.37 ±4.13 ±3.80 ±3.76 ±5.16 ±3.77 ±4.23 ±3.79 ±3.90
68.79 67.69 62.11 63.81 52.06 69.81 62.21 63.73 63.14 48.38±1.78 ±1.64 ±1.74 ±1.74 ±1.67 ±1.88 ±1.80 ±1.80 ±1.78 ±1.73
Bhagalpur
Darbhanga
Kosi
Magadh
Munger
Patna
Purnia
Saran
Tirhut
State
2007 2008 2009 2010 2011 2007 2008 2009 2010 2011
Learning levels: Std III-V
% Children in Std III-V who CAN READLevel 1 (Std I) text or more
% Children in Std III-V who CAN DOsubtraction or more
List of districts undereach division
252 ASER 2011
Patna
Nalanda
Patna
Bhojpur
Buxar
Kaimur (Bhabua)
Rohtas
Purnia
Araria
Kishanganj
Purnia
Katihar
Saran
Gopalganj
Siwan
Saran
Tirhut
Pashchim Champaran
Purba Champaran
Sheohar
Sitamarhi
Muzaffarpur
Vaishali

Divisional Estimates
Chhattisgarh
School enrollment and out of school children
% Children out of school (age: 6-14) % Children enrolled in private school(age: 6-14)
Division/Region
7.89 4.31 5.61 1.83 1.72 3.17 6.27 2.11 3.37 4.45
±2.65 ±1.66 ±2.25 ±1.06 ±1.21 ±1.71 ±3.77 ±1.30 ±2.03 ±2.41
4.56 3.95 3.01 2.59 2.86 11.56 13.06 10.33 11.46 10.79
±1.07 ±0.94 ±1.01 ±1.01 ±0.85 ±2.95 ±3.63 ±3.02 ±3.14 ±2.79
4.39 4.73 2.59 1.73 2.63 7.78 9.35 9.48 8.74 10.96
±0.88 ±1.08 ±1.06 ±0.72 ±0.76 ±2.11 ±2.12 ±2.26 ±2.03 ±2.74
3.27 5.70 4.08 1.01 1.60 8.72 10.84 12.30 14.98 15.59
±1.52 ±1.72 ±1.34 ±0.64 ±0.89 ±3.21 ±3.27 ±3.99 ±4.35 ±4.73
4.61 4.64 3.34 1.86 2.40 8.54 10.33 9.41 10.09 11.01
±0.64 ±0.65 ±0.64 ±0.46 ±0.45 ±1.40 ±1.56 ±1.51 ±1.52 ±1.68
Bastar
Bilaspur
Raipur
Surguja
State
2007 2008 2009 2010 2011 2007 2008 2009 2010 2011
List of districts undereach division
Bastar
Uttar Bastar Kanker
Bastar
Dakshin Bastar Dantewada
Bilaspur
Raigarh
Korba
Janjgir-Champa
Bilaspur
Raipur
Kawardha (Kabeerdham)
Rajnandgaon
Durg
Raipur
Mahasamund
Dhamtari
Surguja
Koriya
Surguja
Jashpur
Division/Region
74.90 94.09 92.33 83.16 75.01 70.61 94.40 93.44 83.47 70.00
±6.53 ±3.63 ±5.07 ±6.56 ±10.26 ±7.01 ±2.85 ±4.12 ±6.96 ±10.35
77.20 92.97 90.46 88.96 75.81 78.15 92.69 90.00 90.02 73.53
±4.62 ±2.98 ±3.04 ±3.66 ±5.36 ±4.48 ±3.04 ±3.40 ±2.89 ±5.72
82.68 94.38 89.12 89.32 76.90 83.97 94.97 88.81 89.23 78.59
±3.47 ±1.79 ±2.70 ±2.74 ±4.61 ±2.97 ±1.59 ±2.56 ±2.74 ±4.12
76.21 93.62 89.67 83.95 74.17 77.75 95.40 90.45 81.75 72.90
±5.58 ±2.54 ±3.97 ±4.61 ±6.67 ±5.97 ±2.26 ±3.62 ±4.87 ±7.00
78.93 93.82 89.97 87.56 75.82 79.58 94.36 90.03 87.43 74.97
±2.36 ±1.28 ±1.70 ±1.91 ±2.98 ±2.31 ±1.20 ±1.65 ±1.86 ±3.00
Bastar
Bilaspur
Raipur
Surguja
State
2007 2008 2009 2010 2011 2007 2008 2009 2010 2011
Division/Region
60.53 89.63 82.23 74.96 63.68 56.80 81.21 72.25 58.47 49.62
±8.11 ±3.51 ±5.66 ±8.16 ±6.91 ±6.69 ±6.18 ±7.11 ±7.95 ±6.78
54.04 84.01 71.14 66.14 44.72 42.20 80.28 70.02 53.39 33.73
±4.03 ±3.52 ±4.91 ±5.30 ±5.12 ±4.39 ±4.00 ±4.80 ±6.76 ±4.91
67.66 85.51 71.19 70.60 52.91 53.12 78.56 64.26 58.23 39.44
±3.70 ±2.62 ±4.08 ±3.90 ±5.40 ±4.32 ±3.91 ±4.30 ±5.17 ±5.17
50.89 83.46 75.57 69.70 55.18 45.56 81.66 62.94 59.82 42.81
±4.98 ±4.65 ±5.15 ±5.65 ±8.50 ±4.99 ±4.41 ±5.68 ±6.76 ±9.08
59.65 85.15 73.37 69.63 52.54 48.92 79.94 66.79 57.14 39.89
±2.45 ±1.78 ±2.52 ±2.64 ±3.21 ±2.52 ±2.26 ±2.61 ±3.30 ±3.19
Bastar
Bilaspur
Raipur
Surguja
State
2007 2008 2009 2010 2011 2007 2008 2009 2010 2011
Learning levels: Std I-II
% Children in Std I-II who CAN READletters or more
% Children in Std I-II who CANRECOGNIZE numbers 1 to 9 or more
Learning levels: Std III-V
% Children in Std III-V who CAN READLevel 1 (Std I) text or more
% Children in Std III-V who CAN DOsubtraction or more
Note: Districts have beenclubbed into divisions to producethese estimates. The groupingof districts is based onadministrative divisions used inthe state or by geographicalregions.
How to read these tables: Thefirst row for each division givesthe estimate of the relevantvariable/year. The numbersbelow the estimate, in thesecond row, are twice thestandard error of thecorresponding estimate andrepresent the 95% confidenceinterval for the estimate. Forinstance, In Bastar division ofChhattisgarh, in 2007, % of StdI-II children who could readletters or more is 74.90 %. With95% probability, the truepopulation proportion lies within±6.53 % points of the estimate,i.e., between 81.43 % and68.37%.
253ASER 2011

Divisional Estimates
Gujarat
School enrollment and out of school children
% Children out of school (age: 6-14) % Children enrolled in private school(age: 6-14)
Division/Region
3.11 5.21 4.17 3.53 2.73 5.35 10.22 9.93 9.90 11.22
±0.80 ±1.54 ±0.74 ±0.84 ±0.73 ±1.33 ±2.76 ±2.07 ±2.15 ±2.50
4.35 3.81 5.23 3.78 3.51 4.41 5.49 11.74 8.25 8.79
±1.45 ±1.26 ±1.17 ±1.12 ±1.05 ±1.20 ±1.44 ±2.44 ±2.35 ±2.11
3.87 3.94 3.74 5.35 1.91 7.70 10.37 8.23 15.02 12.81
±0.86 ±0.96 ±0.81 ±1.13 ±0.57 ±2.41 ±2.51 ±1.62 ±2.37 ±2.91
2.70 3.42 4.00 2.71 2.88 4.10 5.17 12.65 7.52 8.20
±1.12 ±0.93 ±1.15 ±0.81 ±0.93 ±2.13 ±1.41 ±2.99 ±2.16 ±2.94
3.63 4.22 4.26 4.00 2.66 5.76 8.28 10.22 10.71 10.84
±0.54 ±0.65 ±0.47 ±0.52 ±0.41 ±0.98 ±1.22 ±1.09 ±1.19 ±1.40
Central
North
Saurashtra
South
State
2007 2008 2009 2010 2011 2007 2008 2009 2010 2011
List of districts undereach division
Central
Ahmadabad
Anand
Kheda
Panch Mahals
Dohad
Vadodara
Narmada
North
Banas Kantha
Patan
Mahesana
Sabar Kantha
Gandhinagar
Saurashtra
Kachchh
Surendranagar
Rajkot
Jamnagar
Porbandar
Junagadh
Amreli
Bhavnagar
South
Bharuch
The Dangs
Navsari
Valsad
Tapi
Surat
Division/Region
77.51 69.26 73.82 78.52 80.55 79.60 69.31 72.13 77.91 78.71
±4.06 ±4.58 ±4.18 ±3.45 ±4.20 ±3.71 ±4.77 ±4.54 ±3.49 ±4.25
82.19 69.21 72.01 83.59 76.03 83.80 71.09 75.39 83.08 73.93
±4.40 ±6.07 ±4.85 ±3.74 ±5.03 ±4.51 ±5.79 ±4.95 ±3.73 ±5.06
83.44 72.91 78.11 83.55 85.52 86.19 71.58 76.43 77.98 85.19
±2.97 ±4.06 ±3.54 ±3.76 ±3.16 ±2.93 ±4.02 ±3.90 ±4.01 ±3.44
84.17 82.38 81.25 81.78 71.11 85.82 81.75 79.80 81.15 75.29
±5.36 ±4.91 ±4.15 ±3.97 ±5.75 ±4.55 ±5.45 ±4.93 ±4.24 ±5.00
81.29 72.53 75.77 81.64 79.71 83.44 72.59 75.39 79.60 78.95
±2.06 ±2.58 ±2.16 ±1.89 ±2.26 ±1.98 ±2.56 ±2.32 ±1.96 ±2.30
Central
North
Saurashtra
South
State
2007 2008 2009 2010 2011 2007 2008 2009 2010 2011
Division/Region
56.20 56.04 52.73 57.48 59.26 44.07 37.94 34.97 43.14 35.03
±3.84 ±4.49 ±4.07 ±3.78 ±4.51 ±3.99 ±4.46 ±4.45 ±4.04 ±4.48
71.65 62.88 60.95 65.73 63.92 67.73 52.45 42.96 50.83 44.15
±4.74 ±5.26 ±5.24 ±4.91 ±4.75 ±5.50 ±5.61 ±5.60 ±5.07 ±4.58
68.52 58.05 58.50 68.94 68.22 60.61 38.67 43.53 45.94 52.33
±3.79 ±4.14 ±3.90 ±3.35 ±3.93 ±4.16 ±4.23 ±4.05 ±3.78 ±4.56
64.96 65.06 58.56 59.70 60.46 55.76 48.67 45.87 49.40 40.66
±5.09 ±4.92 ±4.69 ±4.60 ±5.24 ±5.87 ±4.56 ±5.67 ±5.36 ±5.42
64.90 59.83 57.29 63.00 63.34 56.52 43.62 41.05 46.61 43.36
±2.26 ±2.37 ±2.26 ±2.05 ±2.32 ±2.60 ±2.43 ±2.45 ±2.23 ±2.48
Central
North
Saurashtra
South
State
2007 2008 2009 2010 2011 2007 2008 2009 2010 2011
Learning levels: Std I-II
% Children in Std I-II who CAN READletters or more
% Children in Std I-II who CANRECOGNIZE numbers 1 to 9 or more
Learning levels: Std III-V
% Children in Std III-V who CAN READLevel 1 (Std I) text or more
% Children in Std III-V who CAN DOsubtraction or more
Note: Districts have beenclubbed into divisions to producethese estimates. The groupingof districts is based onadministrative divisions used inthe state or by geographicalregions.
How to read these tables: Thefirst row for each division givesthe estimate of the relevantvariable/year. The numbersbelow the estimate, in thesecond row, are twice thestandard error of thecorresponding estimate andrepresent the 95% confidenceinterval for the estimate. Forinstance, In Central division ofGujarat, in 2007, % of Std I-IIchildren who could read lettersor more is 77.51 %. With 95%probability, the true populationproportion lies within ±4.06 %points of the estimate, i.e.,between 81.57 % and 73.45 %.
254 ASER 2011

Divisional Estimates
Haryana
School enrollment and out of school children
% Children out of school (age: 6-14) % Children enrolled in private school(age: 6-14)
Division/Region
2.44 1.72 1.44 0.71 1.07 36.33 35.34 38.07 30.19 37.38
±0.74 ±0.51 ±0.48 ±0.29 ±0.72 ±4.15 ±3.97 ±4.36 ±3.97 ±4.16
6.73 6.53 5.70 2.17 2.46 32.39 38.19 34.87 37.18 38.33
±1.90 ±2.05 ±2.22 ±0.85 ±1.03 ±4.81 ±4.28 ±5.00 ±5.16 ±5.26
3.09 2.00 2.06 0.49 0.77 34.86 43.24 38.40 46.13 43.14
±0.78 ±0.85 ±1.02 ±0.24 ±0.39 ±3.94 ±3.95 ±4.20 ±4.02 ±5.20
2.24 1.24 3.46 1.05 0.62 40.78 42.59 52.90 49.90 58.36
±0.70 ±0.56 ±2.69 ±0.65 ±0.38 ±4.11 ±4.08 ±4.03 ±4.62 ±4.61
3.61 2.90 3.14 1.10 1.37 36.10 40.34 40.78 41.84 43.39
±0.60 ±0.65 ±0.91 ±0.30 ±0.41 ±2.16 ±2.08 ±2.31 ±2.35 ±2.63
Ambala
Gurgaon
Hisar
Rohtak
State
2007 2008 2009 2010 2011 2007 2008 2009 2010 2011
List of districts undereach division
Ambala
Ambala
Kaithal
Kurukshetra
Panchkula
Yamunanagar
Gurgaon
Mahendragarh
Rewari
Mewat
Faridabad
Gurgaon
Hisar
Bhiwani
Fatehabad
Hisar
Jind
Sirsa
Rohtak
Jhajjar
Karnal
Panipat
Rohtak
Sonipat
Division/Region
79.05 77.29 86.31 83.98 77.95 82.53 80.23 86.99 84.21 83.33
±4.31 ±4.55 ±3.73 ±4.26 ±4.56 ±3.97 ±4.14 ±3.35 ±4.20 ±4.06
69.84 70.73 83.58 88.33 77.45 71.67 73.06 84.01 89.55 81.04
±5.39 ±3.99 ±3.91 ±2.94 ±6.02 ±4.98 ±3.82 ±3.87 ±2.90 ±5.79
77.98 78.79 84.09 89.20 84.28 76.69 79.03 84.21 90.44 84.83
±5.03 ±3.78 ±4.05 ±2.90 ±5.30 ±5.70 ±4.06 ±3.68 ±2.67 ±5.45
84.85 83.69 88.05 88.79 87.90 85.91 83.50 89.39 89.18 87.72
±3.44 ±3.24 ±4.00 ±3.26 ±5.11 ±3.38 ±3.10 ±4.11 ±3.39 ±6.00
77.74 77.24 85.26 87.95 81.27 78.80 78.45 85.81 88.81 83.77
±2.48 ±2.04 ±2.01 ±1.62 ±2.88 ±2.49 ±1.99 ±1.91 ±1.60 ±2.83
Ambala
Gurgaon
Hisar
Rohtak
State
2007 2008 2009 2010 2011 2007 2008 2009 2010 2011
Division/Region
68.09 67.79 63.69 61.74 62.35 70.32 58.30 60.11 56.59 53.10
±4.00 ±4.32 ±5.35 ±4.92 ±4.75 ±4.41 ±4.53 ±5.15 ±5.57 ±4.22
73.58 71.82 70.11 75.92 71.89 69.54 60.68 67.81 71.61 65.66
±4.30 ±3.37 ±4.95 ±3.99 ±5.00 ±5.05 ±4.31 ±5.31 ±4.05 ±5.71
70.55 76.18 71.68 75.08 69.41 69.57 70.42 68.81 72.48 67.54
±5.00 ±3.72 ±4.37 ±3.72 ±5.72 ±4.70 ±4.24 ±4.51 ±3.71 ±4.79
75.71 75.64 73.59 74.06 75.30 73.79 70.64 73.21 73.34 71.96
±4.03 ±4.53 ±4.75 ±4.62 ±5.28 ±4.04 ±4.84 ±5.00 ±4.75 ±5.02
72.23 73.33 70.17 72.37 69.79 70.86 65.69 67.85 69.29 64.46
±2.25 ±2.01 ±2.43 ±2.19 ±2.66 ±2.32 ±2.31 ±2.54 ±2.30 ±2.67
Ambala
Gurgaon
Hisar
Rohtak
State
2007 2008 2009 2010 2011 2007 2008 2009 2010 2011
Learning levels: Std I-II
% Children in Std I-II who CAN READletters or more
% Children in Std I-II who CANRECOGNIZE numbers 1 to 9 or more
Learning levels: Std III-V
% Children in Std III-V who CAN READLevel 1 (Std I) text or more
% Children in Std III-V who CAN DOsubtraction or more
Note: Districts have beenclubbed into divisions to producethese estimates. The groupingof districts is based onadministrative divisions used inthe state or by geographicalregions.
How to read these tables: Thefirst row for each division givesthe estimate of the relevantvariable/year. The numbersbelow the estimate, in thesecond row, are twice thestandard error of thecorresponding estimate andrepresent the 95% confidenceinterval for the estimate. Forinstance, In Ambala division ofHaryana, in 2007, % of Std I-IIchildren who could read lettersor more is 79.05 %. With 95%probability, the true populationproportion lies within ±4.31 %points of the estimate, i.e.,between 83.36 % and 74.74 %.
255ASER 2011

Divisional Estimates
Himachal Pradesh
School enrollment and out of school children
% Children out of school (age: 6-14) % Children enrolled in private school(age: 6-14)
Division/Region
1.12 0.81 0.83 0.33 0.85 26.70 28.53 23.62 27.37 26.59
±0.86 ±0.53 ±0.65 ±0.27 ±1.22 ±5.29 ±6.79 ±5.29 ±5.86 ±5.80
0.75 0.40 0.38 0.09 0.42 22.27 23.44 22.81 26.40 28.37
±0.64 ±0.27 ±0.28 ±0.10 ±0.27 ±4.75 ±4.86 ±4.69 ±4.97 ±5.41
1.01 0.61 0.83 0.64 0.30 17.02 19.23 18.33 20.54 24.45
±0.49 ±0.33 ±0.43 ±0.45 ±0.22 ±4.24 ±3.91 ±4.32 ±4.29 ±5.26
0.96 0.62 0.67 0.33 0.55 22.56 24.26 21.97 25.30 26.63
±0.42 ±0.24 ±0.30 ±0.16 ±0.47 ±2.97 ±3.36 ±2.88 ±3.13 ±3.22
Kangra
Mandi
Shimla
State
Learning levels: Std I-II
% Children in Std I-II who CAN READletters or more
% Children in Std I-II who CANRECOGNIZE numbers 1 to 9 or more
Division/Region
90.08 86.88 87.23 92.91 91.67 92.67 89.72 87.15 93.15 95.42
±3.30 ±4.42 ±4.78 ±2.72 ±4.29 ±2.72 ±3.33 ±4.54 ±3.10 ±2.29
93.44 92.96 95.44 90.18 94.25 94.50 94.83 97.68 90.24 96.24
±2.22 ±3.03 ±3.09 ±4.30 ±3.60 ±2.35 ±2.87 ±1.12 ±4.40 ±2.43
92.97 89.59 92.08 92.85 90.80 93.80 90.37 91.31 94.57 94.19
±2.67 ±3.83 ±3.75 ±3.06 ±3.80 ±2.38 ±3.32 ±3.73 ±2.76 ±2.83
92.05 89.71 91.52 92.05 92.33 93.61 91.61 92.10 92.64 95.38
±1.63 ±2.25 ±2.33 ±1.95 ±2.31 ±1.45 ±1.87 ±2.08 ±2.04 ±1.43
Kangra
Mandi
Shimla
State
Learning levels: Std III-V
% Children in Std III-V who CAN READLevel 1 (Std I) text or more
% Children in Std III-V who CAN DOsubtraction or more
Division/Region2007 2008 2009 2010 2011 2007 2008 2009 2010 2011
80.34 84.59 78.19 83.08 80.33 71.25 75.97 79.62 79.24 76.30
±4.09 ±4.78 ±6.02 ±3.70 ±4.36 ±5.49 ±5.48 ±6.65 ±4.77 ±4.73
89.02 85.14 84.39 76.77 82.02 87.68 83.18 84.17 71.65 73.26
±2.55 ±3.19 ±3.99 ±5.28 ±6.81 ±2.96 ±3.98 ±3.83 ±5.85 ±7.75
85.51 83.02 85.95 84.79 84.95 82.68 73.34 82.06 81.37 77.26
±3.78 ±3.96 ±3.76 ±3.90 ±3.50 ±3.93 ±5.24 ±5.28 ±4.16 ±4.45
84.73 84.33 82.36 81.63 82.13 79.98 77.60 81.80 77.51 75.51
±2.10 ±2.41 ±2.87 ±2.55 ±3.03 ±2.79 ±2.95 ±3.21 ±3.06 ±3.48
Kangra
Mandi
Shimla
State
Kangra
Chamba
Kangra
Una
Mandi
Bilaspur
Hamirpur
Kullu
Lahul & Spiti
Mandi
Shimla
Kinnaur
Shimla
Sirmaur
Solan
List of districts undereach division
2007 2008 2009 2010 2011 2007 2008 2009 2010 2011
2007 2008 2009 2010 2011 2007 2008 2009 2010 2011
Note: Districts have beenclubbed into divisions to producethese estimates. The groupingof districts is based onadministrative divisions used inthe state or by geographicalregions.
How to read these tables: Thefirst row for each division givesthe estimate of the relevantvariable/year. The numbersbelow the estimate, in thesecond row, are twice thestandard error of thecorresponding estimate andrepresent the 95% confidenceinterval for the estimate. Forinstance, In Kangra division ofHimachal Pradesh, in 2007, %of Std I-II children who could readletters or more is 90.08 %. With95% probability, the truepopulation proportion lies within±3.30 % points of the estimate,i.e., between 93.38 % and86.78%.
256 ASER 2011

Divisional Estimates
Jharkhand
School enrollment and out of school children
% Children out of school (age: 6-14) % Children enrolled in private school(age: 6-14)
Division/Region
9.42 12.98 7.64 7.18 8.53 6.11 3.54 6.44 6.62 9.10±2.05 ±3.91 ±2.14 ±2.28 ±2.18 ±2.23 ±1.40 ±2.22 ±2.29 ±3.212.91 3.28 3.33 1.55 1.81 14.99 13.83 14.13 11.28 17.20±0.80 ±0.98 ±1.20 ±0.48 ±0.70 ±3.19 ±2.78 ±2.51 ±2.08 ±3.614.01 3.73 2.86 3.13 3.69 6.44 3.30 3.05 2.44 7.31±1.74 ±1.44 ±1.73 ±1.54 ±1.01 ±2.75 ±1.36 ±2.15 ±1.20 ±2.696.20 7.89 8.72 5.86 6.61 5.61 7.67 3.96 4.29 5.84±1.45 ±1.84 ±2.13 ±1.78 ±1.25 ±2.57 ±2.68 ±1.31 ±1.54 ±2.044.98 3.15 4.66 3.61 5.15 13.50 17.12 17.51 15.97 21.79±1.35 ±0.89 ±1.52 ±1.01 ±1.50 ±4.22 ±4.08 ±4.48 ±3.99 ±4.004.97 5.61 5.40 3.77 4.65 10.32 9.94 9.98 8.80 12.83±0.63 ±0.84 ±0.82 ±0.61 ±0.60 ±1.57 ±1.39 ±1.34 ±1.18 ±1.64
2007 2008 2009 2010 2011 2007 2008 2009 2010 2011
List of districts undereach division
Division/Region
94.61 84.99 72.94 65.46 64.79 88.05 82.70 78.71 69.20 68.13±2.47 ±4.66 ±7.77 ±8.52 ±7.83 ±3.44 ±4.41 ±6.67 ±8.10 ±6.63
75.04 71.54 77.38 70.99 69.17 74.00 72.87 77.88 72.66 68.21±5.17 ±3.58 ±4.17 ±4.71 ±5.41 ±5.05 ±3.31 ±4.30 ±4.83 ±5.64
67.88 50.89 69.55 56.76 55.42 65.81 47.89 65.61 56.33 51.69±5.75 ±7.24 ±7.88 ±8.34 ±6.02 ±5.86 ±7.25 ±7.77 ±8.36 ±6.00
79.10 70.02 82.64 81.46 60.22 78.14 68.45 81.48 82.05 61.59±5.13 ±4.29 ±3.54 ±3.60 ±5.80 ±5.14 ±4.23 ±3.56 ±3.75 ±5.48
71.60 67.15 76.98 72.28 64.08 71.14 68.99 76.97 73.03 67.46±5.17 ±5.85 ±4.46 ±6.77 ±5.03 ±4.86 ±5.79 ±4.20 ±7.19 ±5.11
76.90 68.85 77.08 71.45 63.50 75.09 68.43 77.21 72.62 63.97±2.56 ±2.40 ±2.30 ±2.72 ±2.74 ±2.48 ±2.40 ±2.25 ±2.78 ±2.74
2007 2008 2009 2010 2011 2007 2008 2009 2010 2011
Division/Region
55.67 58.29 55.19 45.30 41.87 48.48 51.24 52.81 44.90 30.45±6.03 ±7.02 ±7.50 ±8.05 ±6.43 ±6.74 ±6.96 ±7.52 ±7.72 ±5.59
69.51 66.35 65.66 64.53 58.68 66.03 55.22 58.13 58.06 52.59±4.12 ±3.91 ±4.38 ±3.92 ±4.98 ±4.75 ±4.67 ±4.87 ±4.77 ±4.73
64.22 58.77 58.30 57.68 40.17 58.13 45.16 45.95 50.04 36.86±6.64 ±6.48 ±10.49 ±6.56 ±5.87 ±7.68 ±6.09 ±7.34 ±6.54 ±5.67
63.44 59.24 48.60 56.78 45.18 63.63 50.06 48.99 58.55 41.75±4.11 ±4.60 ±4.80 ±5.12 ±4.46 ±4.12 ±5.29 ±4.85 ±4.75 ±4.73
60.25 63.06 55.96 59.76 45.71 47.82 44.44 44.25 47.58 29.62±5.13 ±5.06 ±4.99 ±6.42 ±6.82 ±6.96 ±5.66 ±5.28 ±6.46 ±6.56
64.10 62.05 57.58 58.93 48.40 58.94 50.11 51.41 53.81 41.03±2.33 ±2.30 ±2.68 ±2.51 ±2.68 ±2.79 ±2.57 ±2.64 ±2.67 ±2.74
2007 2008 2009 2010 2011 2007 2008 2009 2010 2011
Learning levels: Std I-II
% Children in Std I-II who CAN READletters or more
% Children in Std I-II who CANRECOGNIZE numbers 1 to 9 or more
Learning levels: Std III-V
% Children in Std III-V who CAN READLevel 1 (Std I) text or more
% Children in Std III-V who CAN DOsubtraction or more
Kolhan
North Chotanagpur
Palamu
Santhal Pargana
South Chotanagpur
State
Kolhan
North Chotanagpur
Palamu
Santhal Pargana
South Chotanagpur
State
Kolhan
North Chotanagpur
Palamu
Santhal Pargana
South Chotanagpur
State
Kolhan
Pashchimi Singhbhum
Purbi Singhbhum
Saraikela-Kharswan
North Chotanagpur
Chatra
Hazaribagh
Kodarma
Giridih
Dhanbad
Bokaro
Palamu
Garhwa
Palamu
Latehar
Santhal Pargana
Deoghar
Godda
Sahibganj
Pakur
Dumka
Jamtara
South Chotanagpur
Ranchi
Lohardaga
Gumla
Simdega
Note: Districts have beenclubbed into divisions to producethese estimates. The groupingof districts is based onadministrative divisions used inthe state or by geographicalregions.
How to read these tables: Thefirst row for each division givesthe estimate of the relevantvariable/year. The numbersbelow the estimate, in thesecond row, are twice thestandard error of thecorresponding estimate andrepresent the 95% confidenceinterval for the estimate. Forinstance, In Kolhan division ofJharkhand, in 2007, % of Std I-II children who could read lettersor more is 94.61 %. With 95%probability, the true populationproportion lies within ±2.47 %points of the estimate, i.e.,between 97.08 % and 92.14 %.
257ASER 2011

Divisional Estimates
Karnataka
School enrollment and out of school children
% Children out of school (age: 6-14) % Children enrolled in private school(age: 6-14)
Division/Region
1.57 1.11 1.51 1.57 1.03 13.34 20.50 17.78 21.62 24.38
±0.46 ±0.35 ±0.41 ±0.43 ±0.41 ±2.01 ±2.66 ±2.57 ±2.93 ±2.98
2.25 2.69 2.21 2.40 2.70 10.62 13.51 14.21 16.72 15.74
±0.61 ±0.54 ±0.57 ±0.78 ±0.76 ±2.51 ±2.75 ±2.70 ±3.11 ±2.43
9.17 10.24 8.52 7.70 6.35 10.14 12.82 13.70 13.82 13.30
±1.87 ±2.74 ±1.89 ±1.52 ±1.67 ±2.73 ±2.61 ±3.09 ±2.69 ±2.95
1.73 1.16 1.33 1.69 1.20 11.92 25.08 21.08 26.60 26.51
±0.55 ±0.35 ±0.40 ±0.47 ±0.39 ±2.32 ±3.11 ±2.95 ±3.08 ±3.33
3.46 3.57 3.17 3.13 2.79 11.58 18.10 16.77 19.98 20.04
±0.55 ±0.73 ±0.52 ±0.47 ±0.51 ±1.19 ±1.45 ±1.41 ±1.52 ±1.53
Bangalore
Belgaum
Gulbarga
Mysore
State
2007 2008 2009 2010 2011 2007 2008 2009 2010 2011
List of districts undereach divisionBangalore
Chitradurga
Davanagere
Shimoga
Tumkur
Kolar
Bangalore
Bangalore Rural
Belgaum
Belgaum
Bagalkot
Bijapur
Gadag
Dharwad
Uttara Kannada
Haveri
Gulbarga
Gulbarga
Bidar
Raichur
Koppal
Bellary
Mysore
Udupi
Chikmagalur
Mandya
Hassan
Dakshina Kannada
Kodagu
Mysore
Chamarajanagar
Division/Region
87.27 88.68 91.46 89.08 91.21 84.39 87.17 87.49 88.16 91.49
±2.67 ±2.69 ±2.09 ±2.91 ±2.58 ±3.07 ±3.05 ±2.81 ±3.22 ±2.66
80.43 80.00 85.09 83.72 83.96 81.40 81.23 82.87 82.93 84.91
±3.48 ±3.15 ±3.26 ±3.90 ±3.42 ±3.32 ±3.51 ±3.73 ±3.92 ±3.13
73.00 75.88 75.30 73.69 75.52 69.98 77.87 73.61 77.45 76.26
±3.78 ±3.78 ±3.83 ±4.50 ±4.63 ±3.72 ±3.58 ±4.17 ±4.50 ±4.76
93.46 89.99 91.53 93.99 91.03 93.03 85.94 89.46 90.99 90.56
±2.17 ±2.30 ±2.19 ±1.87 ±2.78 ±1.92 ±2.72 ±2.68 ±2.40 ±2.60
83.46 83.39 85.74 85.59 85.34 82.07 82.96 83.29 85.20 85.75
±1.65 ±1.62 ±1.66 ±1.82 ±1.84 ±1.70 ±1.68 ±1.83 ±1.79 ±1.81
Bangalore
Belgaum
Gulbarga
Mysore
State
2007 2008 2009 2010 2011 2007 2008 2009 2010 2011
Division/Region
58.99 64.28 66.37 59.39 65.24 49.00 49.76 54.25 54.57 53.60
±3.86 ±3.79 ±3.62 ±4.23 ±4.16 ±4.30 ±4.37 ±4.36 ±4.36 ±4.48
57.64 58.78 66.82 60.42 57.09 39.35 40.57 45.36 47.40 45.33
±3.58 ±3.93 ±3.71 ±4.86 ±4.95 ±3.99 ±4.37 ±4.19 ±4.94 ±5.42
43.50 48.41 43.84 42.12 44.87 30.44 24.51 26.29 22.48 33.29
±4.19 ±3.93 ±4.54 ±4.64 ±4.84 ±4.01 ±3.40 ±4.20 ±3.86 ±4.26
65.37 68.74 75.32 72.50 71.15 55.58 46.12 54.19 47.70 57.39
±3.86 ±3.12 ±3.38 ±3.43 ±3.64 ±3.83 ±3.59 ±4.11 ±4.20 ±4.19
57.20 60.59 63.99 59.56 59.66 44.53 41.09 46.02 44.53 47.49
±2.03 ±1.95 ±2.08 ±2.35 ±2.39 ±2.14 ±2.17 ±2.34 ±2.46 ±2.48
Bangalore
Belgaum
Gulbarga
Mysore
State
2007 2008 2009 2010 2011 2007 2008 2009 2010 2011
Learning levels: Std I-II
% Children in Std I-II who CAN READletters or more
% Children in Std I-II who CANRECOGNIZE numbers 1 to 9 or more
Learning levels: Std III-V
% Children in Std III-V who CAN READLevel 1 (Std I) text or more
% Children in Std III-V who CAN DOsubtraction or more
Note: Districts have beenclubbed into divisions to producethese estimates. The groupingof districts is based onadministrative divisions used inthe state or by geographicalregions.
How to read these tables: Thefirst row for each division givesthe estimate of the relevantvariable/year. The numbersbelow the estimate, in thesecond row, are twice thestandard error of thecorresponding estimate andrepresent the 95% confidenceinterval for the estimate. Forinstance, In Bangalore division ofKarnataka, in 2007, % of Std I-II children who could read lettersor more is 87.27 %. With 95%probability, the true populationproportion lies within ±2.67 %points of the estimate, i.e.,between 89.94 % and 84.60 %.
258 ASER 2011

Divisional Estimates
Kerala
School enrollment and out of school children
% Children out of school (age: 6-14) % Children enrolled in private school(age: 6-14)
Division/Region
0.30 0.27 0.12 0.03 0.00 58.67 55.19 51.19 61.26 68.70
±0.23 ±0.20 ±0.14 ±0.05 ±0.00 ±7.02 ±6.78 ±7.36 ±5.88 ±4.97
0.67 0.15 0.05 0.12 0.00 56.48 46.53 44.28 44.50 52.20
±0.36 ±0.11 ±0.06 ±0.12 ±0.00 ±5.90 ±6.54 ±5.85 ±6.14 ±5.67
0.22 0.17 0.11 0.11 0.00 51.06 49.97 57.74 57.39 62.67
±0.20 ±0.14 ±0.11 ±0.13 ±0.00 ±6.23 ±5.02 ±4.94 ±4.83 ±5.04
0.39 0.20 0.10 0.09 0.08 55.18 50.48 51.46 54.21 60.79
±0.15 ±0.09 ±0.06 ±0.06 ±0.06 ±3.72 ±3.54 ±3.49 ±3.34 ±3.10
Central Kerala
North Kerala
South Kerala
State
Learning levels: Std I-II
% Children in Std I-II who CAN READletters or more
% Children in Std I-II who CANRECOGNIZE numbers 1 to 9 or more
Division/Region
96.87 98.88 94.44 97.22 93.92 96.69 97.21 93.04 98.92 94.96
±1.54 ±1.02 ±2.41 ±2.47 ±2.80 ±1.71 ±1.62 ±3.40 ±1.13 ±2.54
96.36 97.60 96.64 98.37 97.67 95.14 97.06 96.85 97.93 96.40
±1.41 ±1.45 ±2.00 ±1.13 ±1.39 ±2.20 ±1.54 ±1.66 ±1.54 ±1.73
96.78 99.04 98.53 98.65 98.72 96.65 98.77 97.55 97.62 98.50
±1.91 ±0.78 ±1.18 ±1.19 ±0.95 ±2.08 ±0.97 ±1.58 ±1.82 ±1.24
96.66 98.49 96.73 98.15 97.10 96.13 97.67 96.01 98.09 96.88
±0.95 ±0.65 ±1.07 ±0.92 ±0.99 ±1.18 ±0.82 ±1.28 ±0.92 ±1.03
Central Kerala
North Kerala
South Kerala
State
Learning levels: Std III-V
% Children in Std III-V who CAN READLevel 1 (Std I) text or more
% Children in Std III-V who CAN DOsubtraction or more
Division/Region2007 2008 2009 2010 2011 2007 2008 2009 2010 2011
81.05 85.70 78.76 83.29 82.96 69.48 77.51 74.48 79.69 67.68
±4.00 ±2.89 ±4.83 ±3.72 ±3.59 ±5.54 ±4.80 ±5.30 ±4.26 ±4.71
79.45 82.22 84.80 83.99 83.85 65.69 68.88 69.46 73.99 62.70
±4.48 ±3.23 ±2.83 ±3.30 ±3.59 ±6.67 ±3.88 ±4.58 ±4.19 ±5.15
85.42 88.53 84.65 91.98 80.28 79.33 79.65 81.42 83.41 71.07
±3.29 ±2.42 ±3.70 ±2.11 ±2.97 ±4.45 ±3.39 ±3.22 ±3.17 ±3.75
82.15 85.50 82.99 86.86 82.15 71.89 75.31 75.54 79.23 67.46
±2.27 ±1.72 ±2.23 ±1.80 ±1.93 ±3.24 ±2.43 ±2.56 ±2.27 ±2.63
Central Kerala
North Kerala
South Kerala
State
Central Kerala
Palakkad
Thrissur
Ernakulam
Idukki
North Kerala
Kasaragod
Kannur
Wayanad
Kozhikode
Malappuram
South Kerala
Kottayam
Alappuzha
Pathanamthitta
Kollam
Thiruvananthapuram
List of districts undereach division
2007 2008 2009 2010 2011 2007 2008 2009 2010 2011
2007 2008 2009 2010 2011 2007 2008 2009 2010 2011
Note: Districts have beenclubbed into divisions to producethese estimates. The groupingof districts is based onadministrative divisions used inthe state or by geographicalregions.
How to read these tables: Thefirst row for each division givesthe estimate of the relevantvariable/year. The numbersbelow the estimate, in thesecond row, are twice thestandard error of thecorresponding estimate andrepresent the 95% confidenceinterval for the estimate. Forinstance, In Central Keraladivision of Kerala, in 2007, % ofStd I-II children who could readletters or more is 96.87 %. With95% probability, the truepopulation proportion lies within±1.54 % points of the estimate,i.e., between 98.41 % and95.33%.
259ASER 2011
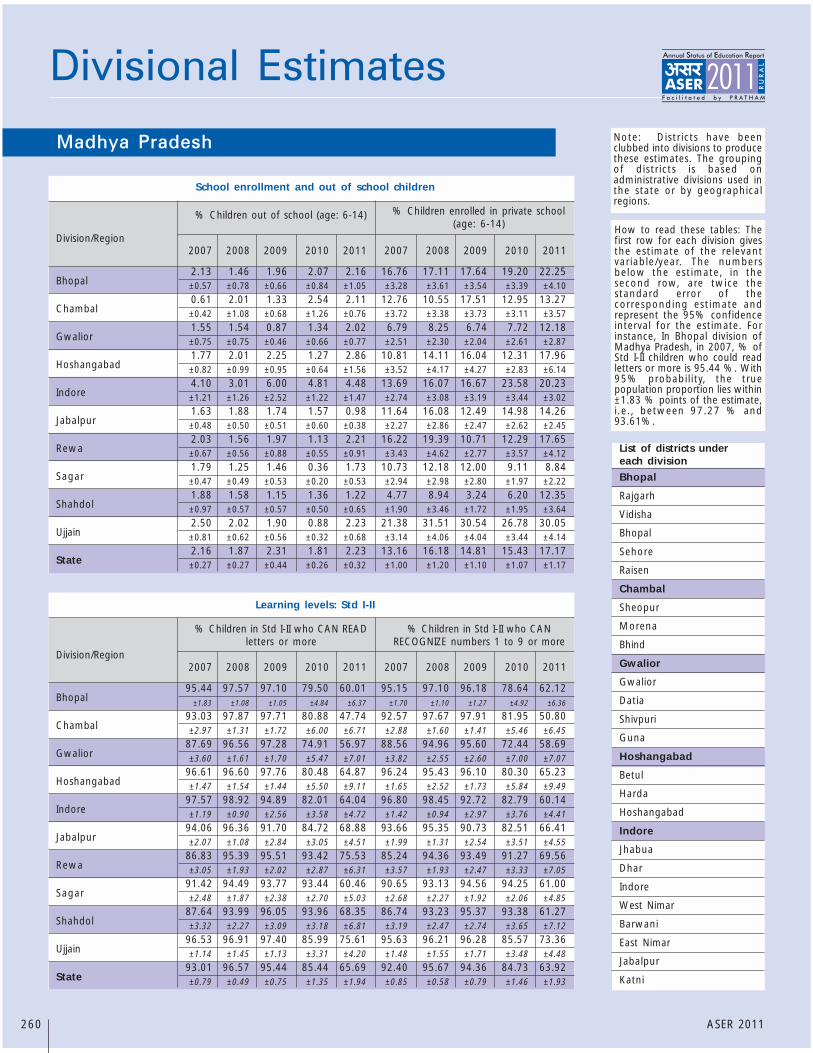
Divisional Estimates
Madhya Pradesh
School enrollment and out of school children
% Children out of school (age: 6-14) % Children enrolled in private school(age: 6-14)
Division/Region
2.13 1.46 1.96 2.07 2.16 16.76 17.11 17.64 19.20 22.25±0.57 ±0.78 ±0.66 ±0.84 ±1.05 ±3.28 ±3.61 ±3.54 ±3.39 ±4.10
0.61 2.01 1.33 2.54 2.11 12.76 10.55 17.51 12.95 13.27±0.42 ±1.08 ±0.68 ±1.26 ±0.76 ±3.72 ±3.38 ±3.73 ±3.11 ±3.57
1.55 1.54 0.87 1.34 2.02 6.79 8.25 6.74 7.72 12.18±0.75 ±0.75 ±0.46 ±0.66 ±0.77 ±2.51 ±2.30 ±2.04 ±2.61 ±2.87
1.77 2.01 2.25 1.27 2.86 10.81 14.11 16.04 12.31 17.96±0.82 ±0.99 ±0.95 ±0.64 ±1.56 ±3.52 ±4.17 ±4.27 ±2.83 ±6.14
4.10 3.01 6.00 4.81 4.48 13.69 16.07 16.67 23.58 20.23±1.21 ±1.26 ±2.52 ±1.22 ±1.47 ±2.74 ±3.08 ±3.19 ±3.44 ±3.02
1.63 1.88 1.74 1.57 0.98 11.64 16.08 12.49 14.98 14.26±0.48 ±0.50 ±0.51 ±0.60 ±0.38 ±2.27 ±2.86 ±2.47 ±2.62 ±2.45
2.03 1.56 1.97 1.13 2.21 16.22 19.39 10.71 12.29 17.65±0.67 ±0.56 ±0.88 ±0.55 ±0.91 ±3.43 ±4.62 ±2.77 ±3.57 ±4.12
1.79 1.25 1.46 0.36 1.73 10.73 12.18 12.00 9.11 8.84±0.47 ±0.49 ±0.53 ±0.20 ±0.53 ±2.94 ±2.98 ±2.80 ±1.97 ±2.22
1.88 1.58 1.15 1.36 1.22 4.77 8.94 3.24 6.20 12.35±0.97 ±0.57 ±0.57 ±0.50 ±0.65 ±1.90 ±3.46 ±1.72 ±1.95 ±3.64
2.50 2.02 1.90 0.88 2.23 21.38 31.51 30.54 26.78 30.05±0.81 ±0.62 ±0.56 ±0.32 ±0.68 ±3.14 ±4.06 ±4.04 ±3.44 ±4.14
2.16 1.87 2.31 1.81 2.23 13.16 16.18 14.81 15.43 17.17±0.27 ±0.27 ±0.44 ±0.26 ±0.32 ±1.00 ±1.20 ±1.10 ±1.07 ±1.17
Bhopal
Chambal
Gwalior
Hoshangabad
Indore
Jabalpur
Rewa
Sagar
Shahdol
Ujjain
State
2007 2008 2009 2010 2011 2007 2008 2009 2010 2011
List of districts undereach division
Division/Region
95.44 97.57 97.10 79.50 60.01 95.15 97.10 96.18 78.64 62.12±1.83 ±1.08 ±1.05 ±4.84 ±6.37 ±1.70 ±1.10 ±1.27 ±4.92 ±6.36
93.03 97.87 97.71 80.88 47.74 92.57 97.67 97.91 81.95 50.80±2.97 ±1.31 ±1.72 ±6.00 ±6.71 ±2.88 ±1.60 ±1.41 ±5.46 ±6.45
87.69 96.56 97.28 74.91 56.97 88.56 94.96 95.60 72.44 58.69±3.60 ±1.61 ±1.70 ±5.47 ±7.01 ±3.82 ±2.55 ±2.60 ±7.00 ±7.07
96.61 96.60 97.76 80.48 64.87 96.24 95.43 96.10 80.30 65.23±1.47 ±1.54 ±1.44 ±5.50 ±9.11 ±1.65 ±2.52 ±1.73 ±5.84 ±9.49
97.57 98.92 94.89 82.01 64.04 96.80 98.45 92.72 82.79 60.14±1.19 ±0.90 ±2.56 ±3.58 ±4.72 ±1.42 ±0.94 ±2.97 ±3.76 ±4.41
94.06 96.36 91.70 84.72 68.88 93.66 95.35 90.73 82.51 66.41±2.07 ±1.08 ±2.84 ±3.05 ±4.51 ±1.99 ±1.31 ±2.54 ±3.51 ±4.55
86.83 95.39 95.51 93.42 75.53 85.24 94.36 93.49 91.27 69.56±3.05 ±1.93 ±2.02 ±2.87 ±6.31 ±3.57 ±1.93 ±2.47 ±3.33 ±7.05
91.42 94.49 93.77 93.44 60.46 90.65 93.13 94.56 94.25 61.00±2.48 ±1.87 ±2.38 ±2.70 ±5.03 ±2.68 ±2.27 ±1.92 ±2.06 ±4.85
87.64 93.99 96.05 93.96 68.35 86.74 93.23 95.37 93.38 61.27±3.32 ±2.27 ±3.09 ±3.18 ±6.81 ±3.19 ±2.47 ±2.74 ±3.65 ±7.12
96.53 96.91 97.40 85.99 75.61 95.63 96.21 96.28 85.57 73.36±1.14 ±1.45 ±1.13 ±3.31 ±4.20 ±1.48 ±1.55 ±1.71 ±3.48 ±4.48
93.01 96.57 95.44 85.44 65.69 92.40 95.67 94.36 84.73 63.92±0.79 ±0.49 ±0.75 ±1.35 ±1.94 ±0.85 ±0.58 ±0.79 ±1.46 ±1.93
Bhopal
Chambal
Gwalior
Hoshangabad
Indore
Jabalpur
Rewa
Sagar
Shahdol
Ujjain
State
2007 2008 2009 2010 2011 2007 2008 2009 2010 2011
Learning levels: Std I-II
% Children in Std I-II who CAN READletters or more
% Children in Std I-II who CANRECOGNIZE numbers 1 to 9 or more
Bhopal
Rajgarh
Vidisha
Bhopal
Sehore
Raisen
Chambal
Sheopur
Morena
Bhind
Gwalior
Gwalior
Datia
Shivpuri
Guna
Hoshangabad
Betul
Harda
Hoshangabad
Indore
Jhabua
Dhar
Indore
West Nimar
Barwani
East Nimar
Jabalpur
Katni
Note: Districts have beenclubbed into divisions to producethese estimates. The groupingof districts is based onadministrative divisions used inthe state or by geographicalregions.
How to read these tables: Thefirst row for each division givesthe estimate of the relevantvariable/year. The numbersbelow the estimate, in thesecond row, are twice thestandard error of thecorresponding estimate andrepresent the 95% confidenceinterval for the estimate. Forinstance, In Bhopal division ofMadhya Pradesh, in 2007, % ofStd I-II children who could readletters or more is 95.44 %. With95% probability, the truepopulation proportion lies within±1.83 % points of the estimate,i.e., between 97.27 % and93.61%.
260 ASER 2011

Divisional Estimates
Madhya Pradesh
Learning levels: Std III-V
% Children in Std III-V who CAN READLevel 1 (Std I) text or more
% Children in Std III-V who CAN DOsubtraction or more
Division/Region
89.69 94.57 93.14 55.08 35.38 87.78 88.62 88.71 44.96 22.73±2.94 ±2.21 ±1.63 ±4.97 ±4.99 ±3.28 ±3.05 ±2.51 ±5.11 ±4.61
72.45 88.62 88.75 54.43 30.66 68.42 85.38 83.94 52.51 25.98±4.79 ±3.43 ±3.51 ±7.18 ±5.20 ±4.88 ±3.92 ±3.93 ±6.32 ±4.94
75.02 90.08 86.08 55.73 36.34 68.16 83.72 81.72 35.26 26.38±4.39 ±2.84 ±3.67 ±4.28 ±4.86 ±4.84 ±4.23 ±4.20 ±4.72 ±4.41
93.30 94.10 95.36 55.00 48.52 87.56 89.16 92.89 49.60 31.38±2.63 ±2.74 ±1.67 ±5.95 ±8.81 ±3.86 ±3.68 ±2.28 ±4.90 ±8.36
94.04 97.48 90.06 58.70 41.36 92.66 95.91 86.32 50.49 31.71±1.66 ±1.05 ±3.51 ±4.59 ±4.39 ±1.79 ±1.36 ±4.51 ±4.31 ±4.00
78.60 84.76 77.36 65.97 45.19 69.75 74.58 68.85 54.29 29.16±3.09 ±2.79 ±3.52 ±4.13 ±4.00 ±3.58 ±3.60 ±3.91 ±4.36 ±3.64
73.34 94.68 91.30 85.47 51.83 64.54 89.46 83.51 73.88 30.07±4.16 ±1.99 ±3.10 ±4.08 ±6.58 ±4.69 ±2.82 ±4.38 ±5.43 ±5.59
83.94 91.57 83.16 74.84 35.57 79.48 83.88 76.70 71.10 23.20±2.88 ±2.03 ±3.39 ±5.29 ±4.35 ±3.63 ±2.80 ±4.38 ±5.76 ±3.51
77.65 82.94 80.96 75.96 35.65 68.71 75.40 73.96 66.03 21.13±3.80 ±4.45 ±4.48 ±5.19 ±6.00 ±5.27 ±4.35 ±5.55 ±6.47 ±5.13
85.93 95.38 94.10 78.23 64.95 82.90 91.34 90.06 66.60 47.85±2.93 ±1.75 ±1.63 ±3.73 ±4.49 ±3.40 ±2.47 ±2.54 ±4.39 ±5.26
82.99 91.72 87.49 67.21 44.20 77.71 85.93 81.88 57.63 30.12±1.14 ±0.83 ±1.13 ±1.73 ±1.81 ±1.37 ±1.10 ±1.42 ±1.88 ±1.63
Bhopal
Chambal
Gwalior
Hoshangabad
Indore
Jabalpur
Rewa
Sagar
Shahdol
Ujjain
State
2007 2008 2009 2010 2011 2007 2008 2009 2010 2011
List of districts undereach division
Jabalpur
Narsimhapur
Mandla
Chhindwara
Seoni
Balaghat
Rewa
Satna
Rewa
Sidhi
Sagar
Tikamgarh
Chhatarpur
Panna
Sagar
Damoh
Shahdol
Umaria
Shahdol
Dindori
Ujjain
Neemuch
Mandsaur
Ratlam
Ujjain
Shajapur
Dewas
261ASER 2011
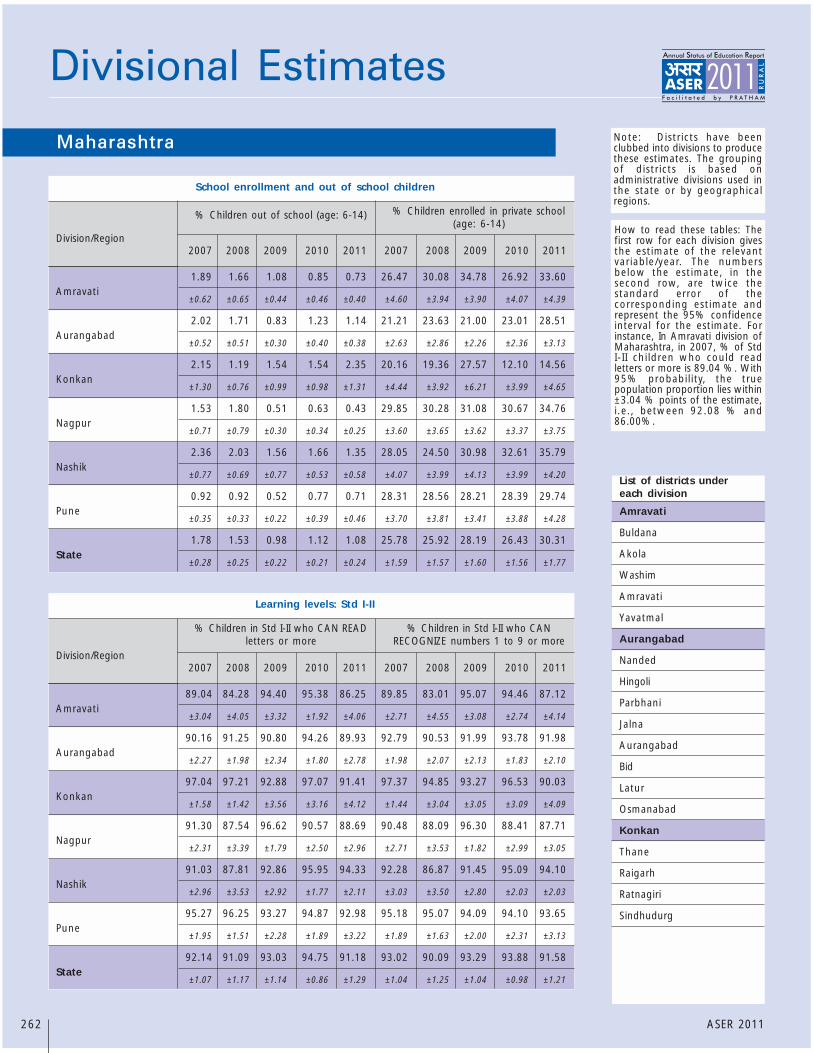
Divisional Estimates
Maharashtra
School enrollment and out of school children
% Children out of school (age: 6-14) % Children enrolled in private school(age: 6-14)
Division/Region
1.89 1.66 1.08 0.85 0.73 26.47 30.08 34.78 26.92 33.60
±0.62 ±0.65 ±0.44 ±0.46 ±0.40 ±4.60 ±3.94 ±3.90 ±4.07 ±4.39
2.02 1.71 0.83 1.23 1.14 21.21 23.63 21.00 23.01 28.51
±0.52 ±0.51 ±0.30 ±0.40 ±0.38 ±2.63 ±2.86 ±2.26 ±2.36 ±3.13
2.15 1.19 1.54 1.54 2.35 20.16 19.36 27.57 12.10 14.56
±1.30 ±0.76 ±0.99 ±0.98 ±1.31 ±4.44 ±3.92 ±6.21 ±3.99 ±4.65
1.53 1.80 0.51 0.63 0.43 29.85 30.28 31.08 30.67 34.76
±0.71 ±0.79 ±0.30 ±0.34 ±0.25 ±3.60 ±3.65 ±3.62 ±3.37 ±3.75
2.36 2.03 1.56 1.66 1.35 28.05 24.50 30.98 32.61 35.79
±0.77 ±0.69 ±0.77 ±0.53 ±0.58 ±4.07 ±3.99 ±4.13 ±3.99 ±4.20
0.92 0.92 0.52 0.77 0.71 28.31 28.56 28.21 28.39 29.74
±0.35 ±0.33 ±0.22 ±0.39 ±0.46 ±3.70 ±3.81 ±3.41 ±3.88 ±4.28
1.78 1.53 0.98 1.12 1.08 25.78 25.92 28.19 26.43 30.31
±0.28 ±0.25 ±0.22 ±0.21 ±0.24 ±1.59 ±1.57 ±1.60 ±1.56 ±1.77
2007 2008 2009 2010 2011 2007 2008 2009 2010 2011
List of districts undereach division
Amravati
Buldana
Akola
Washim
Amravati
Yavatmal
Aurangabad
Nanded
Hingoli
Parbhani
Jalna
Aurangabad
Bid
Latur
Osmanabad
Konkan
Thane
Raigarh
Ratnagiri
Sindhudurg
Amravati
Aurangabad
Konkan
Nagpur
Nashik
Pune
State
Learning levels: Std I-II
% Children in Std I-II who CAN READletters or more
% Children in Std I-II who CANRECOGNIZE numbers 1 to 9 or more
Division/Region
89.04 84.28 94.40 95.38 86.25 89.85 83.01 95.07 94.46 87.12
±3.04 ±4.05 ±3.32 ±1.92 ±4.06 ±2.71 ±4.55 ±3.08 ±2.74 ±4.14
90.16 91.25 90.80 94.26 89.93 92.79 90.53 91.99 93.78 91.98
±2.27 ±1.98 ±2.34 ±1.80 ±2.78 ±1.98 ±2.07 ±2.13 ±1.83 ±2.10
97.04 97.21 92.88 97.07 91.41 97.37 94.85 93.27 96.53 90.03
±1.58 ±1.42 ±3.56 ±3.16 ±4.12 ±1.44 ±3.04 ±3.05 ±3.09 ±4.09
91.30 87.54 96.62 90.57 88.69 90.48 88.09 96.30 88.41 87.71
±2.31 ±3.39 ±1.79 ±2.50 ±2.96 ±2.71 ±3.53 ±1.82 ±2.99 ±3.05
91.03 87.81 92.86 95.95 94.33 92.28 86.87 91.45 95.09 94.10
±2.96 ±3.53 ±2.92 ±1.77 ±2.11 ±3.03 ±3.50 ±2.80 ±2.03 ±2.03
95.27 96.25 93.27 94.87 92.98 95.18 95.07 94.09 94.10 93.65
±1.95 ±1.51 ±2.28 ±1.89 ±3.22 ±1.89 ±1.63 ±2.00 ±2.31 ±3.13
92.14 91.09 93.03 94.75 91.18 93.02 90.09 93.29 93.88 91.58
±1.07 ±1.17 ±1.14 ±0.86 ±1.29 ±1.04 ±1.25 ±1.04 ±0.98 ±1.21
2007 2008 2009 2010 2011 2007 2008 2009 2010 2011
Amravati
Aurangabad
Konkan
Nagpur
Nashik
Pune
State
Note: Districts have beenclubbed into divisions to producethese estimates. The groupingof districts is based onadministrative divisions used inthe state or by geographicalregions.
How to read these tables: Thefirst row for each division givesthe estimate of the relevantvariable/year. The numbersbelow the estimate, in thesecond row, are twice thestandard error of thecorresponding estimate andrepresent the 95% confidenceinterval for the estimate. Forinstance, In Amravati division ofMaharashtra, in 2007, % of StdI-II children who could readletters or more is 89.04 %. With95% probability, the truepopulation proportion lies within±3.04 % points of the estimate,i.e., between 92.08 % and86.00%.
262 ASER 2011

Divisional Estimates
Maharashtra
List of districts undereach division
Learning levels: Std III-V
% Children in Std III-V who CAN READLevel 1 (Std I) text or more
% Children in Std III-V who CAN DOsubtraction or more
Division/Region
80.81 79.09 86.90 80.70 65.79 65.96 58.32 69.19 60.70 40.51
±3.82 ±3.85 ±3.58 ±4.80 ±5.43 ±5.06 ±5.88 ±4.99 ±5.46 ±5.37
83.55 84.34 84.28 83.15 76.43 64.49 67.09 70.31 67.44 56.11
±2.50 ±2.35 ±2.76 ±2.55 ±3.33 ±3.66 ±4.09 ±3.93 ±3.48 ±4.49
90.51 91.70 90.09 85.40 82.35 77.94 89.03 78.96 69.28 67.93
±2.80 ±3.30 ±3.37 ±4.31 ±5.16 ±4.63 ±3.51 ±5.11 ±5.60 ±6.57
82.11 79.27 86.02 79.91 73.42 62.79 53.65 68.54 47.16 45.01
±2.89 ±4.46 ±2.76 ±3.44 ±3.27 ±4.30 ±4.93 ±4.16 ±4.11 ±4.54
85.30 84.21 84.94 88.55 81.39 56.94 57.81 73.31 74.89 52.66
±3.36 ±3.12 ±3.59 ±3.14 ±3.94 ±5.94 ±4.84 ±5.10 ±4.82 ±5.72
86.88 89.54 89.65 90.39 82.19 77.12 70.13 79.90 74.66 67.73
±3.48 ±2.39 ±2.37 ±2.05 ±3.86 ±3.75 ±4.33 ±3.90 ±3.77 ±5.01
84.97 85.31 86.75 85.48 77.84 67.42 66.37 73.70 67.56 56.03
±1.36 ±1.29 ±1.30 ±1.34 ±1.75 ±2.01 ±2.04 ±1.92 ±1.96 ±2.35
2007 2008 2009 2010 2011 2007 2008 2009 2010 2011
Amravati
Aurangabad
Konkan
Nagpur
Nashik
Pune
State
Nagpur
Wardha
Nagpur
Bhandara
Gondiya
Gadchiroli
Chandrapur
Nashik
Nandurbar
Dhule
Jalgaon
Nashik
Ahmadnagar
Pune
Pune
Solapur
Satara
Kolhapur
Sangli
263ASER 2011

Divisional Estimates
Odisha
School enrollment and out of school children
% Children out of school (age: 6-14) % Children enrolled in private school(age: 6-14)
Division/Region
4.22 4.72 3.78 2.45 2.55 3.13 4.70 5.49 5.66 6.00
±1.07 ±1.45 ±1.09 ±0.73 ±0.72 ±0.88 ±1.17 ±1.18 ±1.35 ±1.03
6.42 7.34 5.29 2.04 3.21 4.23 5.19 4.14 6.87 5.27
±0.95 ±1.49 ±1.24 ±0.58 ±0.92 ±1.04 ±1.07 ±0.96 ±1.75 ±1.30
14.48 10.53 10.43 9.55 5.64 2.69 3.54 3.11 3.49 3.60
±2.70 ±1.56 ±1.70 ±2.28 ±1.16 ±0.80 ±1.01 ±0.93 ±0.90 ±0.78
7.99 7.16 6.27 4.45 3.71 3.31 4.48 4.36 5.35 5.04
±1.02 ±0.88 ±0.78 ±0.80 ±0.53 ±0.53 ±0.66 ±0.62 ±0.80 ±0.61
Central
North
South
State
Learning levels: Std I-II
% Children in Std I-II who CAN READletters or more
% Children in Std I-II who CANRECOGNIZE numbers 1 to 9 or more
Division/Region
86.18 85.22 92.38 85.28 77.83 82.37 82.80 90.07 80.33 75.08
±2.69 ±2.54 ±2.22 ±3.56 ±3.80 ±2.86 ±2.59 ±2.63 ±3.81 ±3.96
72.92 73.64 90.20 72.30 71.47 70.75 72.16 91.08 70.62 69.76
±3.29 ±3.95 ±2.98 ±4.50 ±4.32 ±3.46 ±4.11 ±2.29 ±4.43 ±4.16
60.54 71.83 84.27 66.76 54.20 57.38 69.67 81.08 61.53 53.58
±4.80 ±3.73 ±3.04 ±3.53 ±4.26 ±4.97 ±3.72 ±3.52 ±3.67 ±4.19
73.59 78.13 88.85 76.05 67.68 70.33 76.02 87.08 71.94 66.02
±2.31 ±1.95 ±1.61 ±2.26 ±2.59 ±2.38 ±1.97 ±1.75 ±2.34 ±2.56
Central
North
South
State
Learning levels: Std III-V
% Children in Std III-V who CAN READLevel 1 (Std I) text or more
% Children in Std III-V who CAN DOsubtraction or more
Division/Region2007 2008 2009 2010 2011 2007 2008 2009 2010 2011
76.42 77.64 76.95 71.75 69.23 67.50 67.23 73.62 64.13 56.60
±2.64 ±2.60 ±3.41 ±3.49 ±3.72 ±3.17 ±3.10 ±3.54 ±3.67 ±3.95
57.58 63.10 68.59 57.96 55.13 42.65 47.14 62.87 44.70 38.29
±3.27 ±3.27 ±3.48 ±3.47 ±4.00 ±3.67 ±3.52 ±3.74 ±3.92 ±3.86
51.13 63.04 61.86 50.26 42.97 39.10 51.70 55.22 42.17 32.12
±4.45 ±3.74 ±3.98 ±3.38 ±3.75 ±4.86 ±4.29 ±4.78 ±3.98 ±4.01
63.58 69.43 69.53 61.39 56.59 52.08 57.39 64.40 52.11 43.52
±2.16 ±1.89 ±2.15 ±2.13 ±2.36 ±2.52 ±2.19 ±2.43 ±2.37 ±2.45
Central
North
South
State
List of districts undereach division
2007 2008 2009 2010 2011 2007 2008 2009 2010 2011
2007 2008 2009 2010 2011 2007 2008 2009 2010 2011
Central
Mayurbhanj
Baleshwar
Bhadrak
Kendrapara
Jagatsinghapur
Cuttack
Jajapur
Nayagarh
Khordha
Puri
North
Bargarh
Jharsuguda
Sambalpur
Debagarh
Sundargarh
Kendujhar
Dhenkanal
Anugul
Subarnapur
Balangir
South
Ganjam
Gajapati
Kandhamal
Baudh
Nuapada
Kalahandi
Rayagada
Nabarangapur
Koraput
Malkangiri
Note: Districts have beenclubbed into divisions to producethese estimates. The groupingof districts is based onadministrative divisions used inthe state or by geographicalregions.
How to read these tables: Thefirst row for each division givesthe estimate of the relevantvariable/year. The numbersbelow the estimate, in thesecond row, are twice thestandard error of thecorresponding estimate andrepresent the 95% confidenceinterval for the estimate. Forinstance, In Central division ofOdisha, in 2007, % of Std I-IIchildren who could read lettersor more is 86.18 %. With 95%probability, the true populationproportion lies within ±2.69 %points of the estimate, i.e.,between 88.87 % and 83.49 %.
264 ASER 2011

Divisional Estimates
Punjab
School enrollment and out of school children
% Children out of school (age: 6-14) % Children enrolled in private school(age: 6-14)
Division/Region
2.52 2.37 4.41 0.76 0.50 22.84 38.31 28.58 32.85 37.73
±1.75 ±1.00 ±2.42 ±0.38 ±0.35 ±4.77 ±4.53 ±5.15 ±5.18 ±5.38
1.71 2.39 3.75 1.93 2.04 38.38 49.14 39.96 40.78 40.96
±0.89 ±1.10 ±1.94 ±1.05 ±0.86 ±6.05 ±6.67 ±6.36 ±4.74 ±4.95
3.59 2.90 6.05 1.88 1.75 32.42 40.14 27.65 38.87 39.83
±0.83 ±0.54 ±2.41 ±0.45 ±0.50 ±2.83 ±2.71 ±3.31 ±3.11 ±2.85
2.94 2.69 5.23 1.66 1.56 31.83 41.65 30.50 38.03 39.64
±0.63 ±0.44 ±1.55 ±0.36 ±0.36 ±2.39 ±2.34 ±2.64 ±2.33 ±2.25
Doaba
Majha
Malwa
State
Learning levels: Std I-II
% Children in Std I-II who CAN READletters or more
% Children in Std I-II who CANRECOGNIZE numbers 1 to 9 or more
Division/Region
91.86 81.49 88.81 90.74 86.51 87.76 82.83 85.09 92.69 89.34
±3.19 ±4.91 ±5.76 ±3.01 ±3.19 ±4.56 ±4.92 ±6.71 ±2.98 ±3.40
82.92 92.63 92.91 83.73 87.58 80.23 90.23 91.31 85.85 90.40
±6.19 ±3.04 ±3.47 ±3.99 ±3.34 ±7.59 ±3.58 ±4.18 ±4.01 ±3.53
87.23 85.83 90.24 88.26 87.42 84.84 83.47 86.91 87.82 91.06
±2.50 ±2.08 ±2.12 ±2.16 ±2.57 ±2.98 ±2.23 ±2.35 ±2.22 ±2.17
87.23 86.24 90.48 87.69 87.22 84.48 84.55 87.40 88.35 90.45
±2.06 ±1.73 ±1.87 ±1.67 ±1.73 ±2.52 ±1.81 ±2.16 ±1.70 ±1.64
Doaba
Majha
Malwa
State
Learning levels: Std III-V
% Children in Std III-V who CAN READLevel 1 (Std I) text or more
% Children in Std III-V who CAN DOsubtraction or more
Division/Region2007 2008 2009 2010 2011 2007 2008 2009 2010 2011
70.22 73.25 75.11 77.97 80.27 66.45 66.37 77.77 83.17 80.30
±5.49 ±4.33 ±4.77 ±4.69 ±3.75 ±5.53 ±5.71 ±4.69 ±3.83 ±4.48
61.48 68.11 70.97 72.83 71.74 59.75 65.80 66.00 75.89 71.86
±9.58 ±6.76 ±6.02 ±4.38 ±4.37 ±9.88 ±6.85 ±6.52 ±4.39 ±5.11
75.48 69.07 70.79 72.51 73.74 73.26 63.02 68.97 78.13 71.19
±3.35 ±2.82 ±3.04 ±2.80 ±2.84 ±3.69 ±2.95 ±3.45 ±2.70 ±3.26
71.35 69.70 71.67 73.80 74.94 68.93 64.20 70.12 78.79 73.61
±3.04 ±2.33 ±2.39 ±2.14 ±2.06 ±3.22 ±2.51 ±2.65 ±2.00 ±2.41
Doaba
Majha
Malwa
State
Doaba
Hoshiarpur
Jalandhar
Kapurthala
SBS Nagar (Nawanshahr)
Majha
Gurdaspur
Amritsar
Tarn Taran
Malwa
Bathinda
Faridkot
Fatehgarh Sahib
Firozpur
Ludhiana
Mansa
Moga
Muktsar
Sangrur
SAS Nagar
Patiala
Rupnagar
List of districts undereach division
2007 2008 2009 2010 2011 2007 2008 2009 2010 2011
2007 2008 2009 2010 2011 2007 2008 2009 2010 2011
Note: Districts have beenclubbed into divisions to producethese estimates. The groupingof districts is based onadministrative divisions used inthe state or by geographicalregions.
How to read these tables: Thefirst row for each division givesthe estimate of the relevantvariable/year. The numbersbelow the estimate, in thesecond row, are twice thestandard error of thecorresponding estimate andrepresent the 95% confidenceinterval for the estimate. Forinstance, In Doaba division ofPunjab, in 2007, % of Std I-IIchildren who could read lettersor more is 91.86 %. With 95%probability, the true populationproportion lies within ±3.19 %points of the estimate, i.e.,between 95.05 % and 88.67 %.
265ASER 2011

Divisional Estimates
Rajasthan
School enrollment and out of school children
% Children out of school (age: 6-14) % Children enrolled in private school(age: 6-14)
Division/Region
6.31 5.70 5.81 7.12 6.54 25.20 35.47 31.69 36.39 33.56
±1.51 ±1.61 ±1.61 ±1.54 ±1.77 ±4.78 ±5.23 ±4.63 ±5.26 ±5.43
5.91 8.39 7.00 6.33 3.47 35.74 42.40 40.33 40.49 41.83
±1.53 ±2.01 ±3.14 ±1.79 ±0.87 ±5.02 ±5.34 ±5.45 ±5.18 ±5.58
7.53 5.89 5.95 4.00 2.40 34.93 42.60 36.77 40.00 45.57
±1.56 ±1.64 ±1.59 ±1.16 ±0.79 ±4.29 ±4.75 ±4.78 ±4.83 ±5.04
2.99 2.81 2.54 1.78 1.24 40.28 50.98 44.75 47.45 49.42
±0.81 ±0.76 ±0.95 ±0.58 ±0.52 ±4.52 ±4.32 ±4.33 ±3.99 ±4.29
9.49 11.39 11.50 9.52 7.74 14.87 17.59 20.23 21.85 24.48
±1.77 ±2.16 ±2.00 ±2.10 ±1.83 ±3.15 ±3.52 ±3.84 ±3.59 ±3.98
6.61 7.64 6.52 5.63 2.99 25.98 31.22 30.58 33.59 34.47
±1.70 ±1.67 ±2.10 ±1.50 ±1.18 ±4.85 ±5.35 ±5.21 ±4.62 ±5.27
8.19 9.14 6.78 6.67 5.98 10.76 12.35 12.62 16.66 19.43
±2.06 ±2.50 ±1.54 ±1.58 ±1.58 ±2.73 ±2.95 ±2.98 ±3.75 ±2.98
6.53 7.14 6.56 5.81 4.49 26.72 32.68 30.38 33.42 35.09
±0.62 ±0.75 ±0.71 ±0.61 ±0.58 ±1.82 ±2.05 ±1.86 ±1.87 ±1.95
Ajmer
Bharatpur
Bikaner
Jaipur
Jodhpur
Kota
Udaipur
State
2007 2008 2009 2010 2011 2007 2008 2009 2010 2011
List of districts undereach division
Ajmer
Ajmer
Bhilwara
Nagaur
Tonk
Bharatpur
Bharatpur
Dhaulpur
Karauli
Sawai Madhopur
Bikaner
Bikaner
Churu
Ganganagar
Hanumangarh
Jaipur
Alwar
Dausa
Jaipur
Jhunjhunun
Sikar
Learning levels: Std I-II
% Children in Std I-II who CAN READletters or more
% Children in Std I-II who CANRECOGNIZE numbers 1 to 9 or more
Division/Region
71.50 71.52 74.23 71.67 61.26 72.07 71.69 74.29 70.91 63.46
±5.19 ±4.80 ±4.81 ±5.28 ±5.83 ±4.75 ±4.66 ±4.57 ±5.10 ±6.10
67.12 65.67 75.75 70.06 69.81 70.25 65.15 74.80 67.88 72.37
±5.27 ±5.27 ±4.94 ±5.30 ±6.20 ±5.66 ±4.81 ±5.46 ±5.26 ±6.00
71.06 70.51 74.14 77.24 71.60 69.29 69.24 74.48 78.29 72.54
±5.16 ±5.01 ±5.33 ±4.73 ±4.75 ±5.14 ±5.17 ±5.29 ±4.65 ±4.56
75.26 68.51 76.82 74.37 72.62 77.20 70.68 73.64 75.83 73.66
±4.50 ±5.43 ±6.31 ±3.76 ±5.38 ±4.60 ±4.58 ±5.94 ±3.91 ±5.42
63.92 64.45 67.06 60.66 54.26 65.07 67.27 68.46 61.22 54.57
±5.02 ±4.76 ±5.49 ±4.98 ±4.79 ±5.17 ±4.36 ±5.69 ±5.12 ±4.77
67.74 64.86 71.31 76.21 70.08 70.04 68.64 73.03 77.30 71.56
±4.77 ±4.79 ±4.79 ±5.22 ±6.04 ±4.77 ±4.57 ±4.67 ±4.71 ±5.82
67.06 59.17 64.16 68.09 67.83 68.65 57.32 65.01 71.20 68.02
±4.87 ±5.04 ±5.24 ±4.72 ±5.15 ±4.91 ±5.41 ±5.35 ±4.67 ±4.88
69.60 65.98 71.29 70.03 65.51 70.91 66.77 71.26 70.81 66.48
±1.94 ±2.03 ±2.19 ±1.94 ±2.21 ±1.96 ±1.94 ±2.18 ±1.95 ±2.22
Ajmer
Bharatpur
Bikaner
Jaipur
Jodhpur
Kota
Udaipur
State
2007 2008 2009 2010 2011 2007 2008 2009 2010 2011
Note: Districts have beenclubbed into divisions to producethese estimates. The groupingof districts is based onadministrative divisions used inthe state or by geographicalregions.
How to read these tables: Thefirst row for each division givesthe estimate of the relevantvariable/year. The numbersbelow the estimate, in thesecond row, are twice thestandard error of thecorresponding estimate andrepresent the 95% confidenceinterval for the estimate. Forinstance, In Ajmer division ofRajasthan, in 2007, % of Std I-IIchildren who could read lettersor more is 71.5 %. With 95%probability, the true populationproportion lies within ±5.19 %points of the estimate, i.e.,between 76.69 % and 66.31 %.
266 ASER 2011

Divisional Estimates
Rajasthan
Learning levels: Std III-V
% Children in Std III-V who CAN READLevel 1 (Std I) text or more
% Children in Std III-V who CAN DOsubtraction or more
Division/Region
58.04 60.42 58.10 52.33 48.87 48.96 43.52 47.32 41.47 36.50
±5.44 ±5.09 ±4.94 ±5.56 ±5.24 ±5.49 ±5.35 ±5.74 ±5.36 ±5.65
54.22 62.68 58.13 52.66 56.41 53.63 54.49 56.19 47.50 49.23
±4.95 ±5.05 ±5.50 ±5.33 ±5.14 ±5.14 ±5.56 ±5.38 ±5.83 ±5.75
65.51 75.76 65.48 68.18 63.14 56.59 63.67 59.40 64.72 55.29
±4.45 ±4.17 ±5.00 ±4.68 ±4.12 ±5.49 ±4.91 ±5.22 ±4.95 ±4.61
67.35 66.85 62.77 63.23 60.03 63.95 53.37 52.81 54.45 48.71
±4.14 ±4.29 ±4.47 ±4.60 ±5.48 ±4.72 ±4.45 ±4.81 ±5.23 ±5.17
55.99 57.92 55.34 52.14 42.20 49.19 46.20 46.53 45.80 28.90
±4.63 ±4.67 ±5.24 ±4.77 ±4.46 ±4.78 ±4.81 ±4.91 ±5.25 ±4.39
50.13 58.91 50.96 59.05 49.44 46.03 45.21 42.54 52.70 36.76
±4.66 ±5.27 ±5.36 ±6.20 ±6.13 ±5.41 ±5.80 ±5.97 ±6.08 ±5.70
48.27 55.45 41.72 55.83 49.25 35.29 34.20 32.11 44.27 31.74
±4.83 ±5.26 ±5.69 ±4.92 ±4.27 ±4.58 ±4.99 ±6.15 ±4.93 ±4.11
57.88 62.00 55.88 57.40 52.66 51.13 47.63 47.45 49.48 40.39
±1.91 ±1.92 ±2.12 ±1.98 ±2.06 ±2.08 ±2.06 ±2.20 ±2.11 ±2.09
Ajmer
Bharatpur
Bikaner
Jaipur
Jodhpur
Kota
Udaipur
State
2007 2008 2009 2010 2011 2007 2008 2009 2010 2011
List of districts undereach division
Jodhpur
Barmer
Jaisalmer
Jalor
Jodhpur
Pali
Sirohi
Kota
Baran
Bundi
Jhalawar
Kota
Udaipur
Banswara
Chittaurgarh
Dungarpur
Rajsamand
Udaipur
267ASER 2011

Divisional Estimates
Tamil Nadu
School enrollment and out of school children
% Children out of school (age: 6-14) % Children enrolled in private school(age: 6-14)
Division/Region
1.08 0.86 0.89 0.79 0.63 14.38 22.16 19.44 19.35 25.18±0.52 ±0.46 ±0.44 ±0.36 ±0.29 ±3.52 ±4.46 ±3.06 ±3.72 ±3.280.97 0.48 0.80 1.38 0.86 15.69 18.88 14.95 20.67 23.91±0.32 ±0.21 ±0.31 ±0.60 ±0.41 ±2.46 ±3.13 ±2.37 ±3.38 ±2.921.94 0.33 0.69 0.90 1.06 13.50 17.59 21.09 26.11 26.42±0.59 ±0.21 ±0.36 ±0.46 ±0.68 ±2.52 ±3.08 ±2.73 ±3.85 ±3.680.81 0.89 1.14 0.94 0.67 15.56 26.62 26.25 34.84 32.30±0.33 ±0.36 ±0.37 ±0.38 ±0.28 ±3.64 ±4.01 ±4.16 ±5.74 ±4.950.88 0.82 1.25 0.71 1.00 19.76 18.17 17.54 22.90 26.93±0.44 ±0.42 ±0.49 ±0.33 ±0.74 ±4.74 ±3.59 ±3.96 ±5.30 ±4.131.18 0.63 0.93 0.98 0.85 15.49 20.55 19.69 25.07 27.04±0.21 ±0.14 ±0.17 ±0.22 ±0.23 ±1.45 ±1.65 ±1.47 ±2.06 ±1.79
2007 2008 2009 2010 2011 2007 2008 2009 2010 2011
List of districts undereach division
Division/Region
49.57 60.82 59.55 51.81 55.49 55.02 63.20 65.90 54.70 59.60±6.23 ±5.79 ±5.86 ±7.03 ±5.51 ±6.72 ±7.21 ±5.80 ±7.29 ±5.76
55.76 51.03 55.34 60.34 60.67 63.18 61.53 64.50 65.89 69.60±5.16 ±4.56 ±4.97 ±5.26 ±4.96 ±4.92 ±5.19 ±4.51 ±5.09 ±5.19
60.21 52.18 67.10 67.30 62.97 71.04 63.12 75.79 73.44 70.07±5.61 ±4.74 ±5.53 ±5.15 ±5.43 ±5.92 ±5.28 ±5.06 ±5.61 ±5.55
67.97 60.51 65.08 73.52 68.19 70.53 64.44 72.67 76.40 72.06±4.37 ±5.29 ±5.15 ±4.48 ±5.06 ±4.61 ±5.04 ±4.82 ±4.89 ±4.85
69.81 50.62 68.68 58.18 66.73 74.08 60.59 72.63 60.85 75.55±6.43 ±6.56 ±6.07 ±7.05 ±5.12 ±6.01 ±7.24 ±6.27 ±7.51 ±5.27
60.25 54.74 62.42 63.03 62.75 66.63 62.63 69.95 67.47 69.25±2.57 ±2.38 ±2.49 ±2.62 ±2.41 ±2.60 ±2.62 ±2.36 ±2.73 ±2.47
2007 2008 2009 2010 2011 2007 2008 2009 2010 2011
Division/Region
48.15 50.63 54.56 44.74 39.45 39.42 45.03 38.30 37.09 31.19±5.29 ±6.02 ±6.29 ±4.90 ±5.10 ±5.40 ±5.54 ±5.67 ±5.31 ±5.21
43.59 34.25 42.99 46.24 48.59 41.15 25.02 29.89 38.11 34.95±4.54 ±3.63 ±4.09 ±4.48 ±4.50 ±4.60 ±3.64 ±3.84 ±4.74 ±4.39
44.65 48.42 54.14 52.70 44.88 34.98 35.78 34.00 41.37 40.53±4.92 ±4.31 ±4.56 ±5.04 ±5.93 ±4.56 ±4.75 ±4.33 ±3.89 ±5.42
56.87 55.13 59.66 62.86 62.62 51.56 44.75 48.40 49.38 55.11±5.04 ±4.81 ±4.47 ±3.88 ±4.09 ±4.39 ±4.56 ±4.43 ±3.94 ±4.48
56.44 41.16 59.09 57.71 52.33 50.11 34.17 55.20 53.97 46.47±5.94 ±5.64 ±6.14 ±6.10 ±4.45 ±6.47 ±4.57 ±5.74 ±6.39 ±4.43
49.24 45.68 53.04 52.50 50.00 42.92 36.27 39.66 43.18 41.88±2.34 ±2.22 ±2.30 ±2.30 ±2.33 ±2.31 ±2.15 ±2.23 ±2.20 ±2.33
2007 2008 2009 2010 2011 2007 2008 2009 2010 2011
Learning levels: Std I-II
% Children in Std I-II who CAN READletters or more
% Children in Std I-II who CANRECOGNIZE numbers 1 to 9 or more
Learning levels: Std III-V
% Children in Std III-V who CAN READLevel 1 (Std I) text or more
% Children in Std III-V who CAN DOsubtraction or more
Central
East
North
South
West
State
Central
East
North
South
West
State
Central
East
North
South
West
State
CentralSalem
Namakkal
Karur
Tiruchirappalli
Pudukkottai
EastViluppuram
Perambalur
Ariyalur
Cuddalore
Nagapattinam
Thiruvarur
Thanjavur
North
Thiruvallur
Kancheepuram
Vellore
Dharmapuri
Tiruvannamalai
South
Sivaganga
Madurai
Virudhunagar
Ramanathapuram
Thoothukkudi
Tirunelveli
Kanniyakumari
WestErode
The Nilgiris
Coimbatore
Dindigul
Theni
Note: Districts have beenclubbed into divisions to producethese estimates. The groupingof districts is based onadministrative divisions used inthe state or by geographicalregions.
How to read these tables: Thefirst row for each division givesthe estimate of the relevantvariable/year. The numbersbelow the estimate, in thesecond row, are twice thestandard error of thecorresponding estimate andrepresent the 95% confidenceinterval for the estimate. Forinstance, In Central division ofTamil Nadu, in 2007, % of Std I-II children who could read lettersor more is 49.57 %. With 95%probability, the true populationproportion lies within ±6.23 %points of the estimate, i.e.,between 55.80 % and 43.34 %.
268 ASER 2011

Divisional Estimates
Uttar Pradesh
School enrollment and out of school children
% Children out of school (age: 6-14) % Children enrolled in private school(age: 6-14)
Division/Region
2.65 5.86 3.84 3.85 5.16 37.54 45.12 40.81 51.47 57.38
±0.94 ±1.12 ±0.88 ±0.97 ±0.91 ±4.22 ±4.00 ±3.96 ±4.10 ±3.70
1.82 5.31 6.58 6.15 6.27 24.67 38.70 42.67 35.80 44.55
±0.61 ±1.23 ±1.51 ±1.76 ±1.63 ±4.33 ±4.91 ±4.70 ±5.37 ±5.09
3.90 5.04 3.26 4.16 5.19 35.05 39.12 36.76 42.84 47.77
±1.02 ±1.13 ±0.90 ±1.02 ±1.11 ±3.99 ±4.59 ±5.00 ±4.42 ±4.05
2.39 3.71 3.99 1.68 1.87 33.30 39.36 42.73 51.20 53.13
±1.14 ±1.41 ±1.70 ±0.67 ±0.79 ±4.10 ±5.26 ±5.09 ±5.61 ±4.86
8.53 7.80 9.99 10.91 13.03 20.55 26.22 30.11 33.87 39.58
±2.14 ±1.95 ±2.16 ±2.92 ±1.97 ±3.63 ±3.87 ±3.72 ±4.13 ±3.96
3.93 7.25 5.62 5.16 6.79 26.50 26.86 38.84 40.16 45.36
±1.19 ±1.95 ±1.79 ±1.39 ±1.64 ±4.55 ±3.58 ±4.46 ±4.48 ±4.61
3.86 4.29 3.86 5.29 6.22 18.21 19.26 22.32 23.64 22.78
±0.89 ±0.99 ±0.85 ±1.20 ±1.36 ±3.68 ±4.08 ±4.65 ±4.14 ±4.35
3.72 8.47 7.96 10.11 15.18 15.62 24.36 20.72 20.89 25.98
±1.31 ±1.90 ±1.84 ±2.05 ±2.56 ±3.42 ±4.04 ±3.62 ±4.08 ±3.89
4.17 4.99 4.29 5.86 4.47 33.45 41.57 35.76 39.34 46.03
±1.13 ±1.26 ±1.19 ±1.60 ±1.34 ±3.49 ±4.06 ±4.04 ±3.76 ±4.13
2.96 4.93 3.01 1.76 2.63 37.49 42.83 46.69 50.75 52.94
±0.71 ±1.19 ±0.77 ±0.48 ±0.73 ±4.00 ±3.78 ±4.36 ±4.01 ±3.54
1.90 2.85 1.88 2.54 4.18 14.32 23.53 14.82 19.56 25.58
±0.57 ±0.83 ±0.83 ±0.89 ±1.27 ±3.54 ±5.09 ±3.94 ±5.28 ±5.53
2.05 4.60 3.71 3.40 4.52 18.22 33.03 34.36 40.68 39.50
±0.67 ±1.03 ±0.79 ±0.83 ±1.28 ±3.27 ±3.50 ±3.65 ±3.66 ±3.84
5.88 9.05 7.20 6.58 7.00 26.03 30.62 32.12 34.24 38.61
±1.02 ±1.34 ±1.31 ±1.14 ±1.45 ±2.85 ±3.16 ±3.22 ±3.23 ±3.88
3.17 3.06 3.16 2.95 3.61 37.75 46.79 39.70 52.09 57.55
±0.93 ±0.80 ±0.94 ±0.80 ±1.06 ±4.40 ±4.61 ±4.52 ±4.22 ±3.60
3.60 3.76 2.57 3.65 2.03 23.74 27.77 27.52 28.09 32.70
±1.09 ±1.13 ±1.01 ±1.15 ±0.76 ±4.15 ±4.95 ±4.85 ±4.73 ±4.91
2.98 6.47 6.96 7.80 9.22 28.12 43.71 46.67 43.85 55.56
±1.03 ±1.59 ±1.74 ±1.75 ±1.62 ±4.34 ±4.07 ±4.42 ±4.77 ±3.87
6.43 6.31 3.78 7.34 8.51 36.91 42.13 35.04 35.99 53.17
±3.01 ±2.21 ±1.53 ±2.53 ±2.56 ±6.33 ±6.23 ±6.14 ±5.32 ±6.22
2.96 2.42 1.79 1.85 2.56 36.09 39.36 38.66 42.21 54.88
±0.78 ±0.70 ±0.60 ±0.66 ±0.69 ±3.87 ±4.05 ±4.40 ±3.95 ±4.29
3.93 5.63 4.92 5.22 6.13 29.05 35.86 35.83 39.33 45.36
±0.31 ±0.36 ±0.36 ±0.39 ±0.40 ±1.02 ±1.09 ±1.12 ±1.14 ±1.13
Agra
Aligarh
Allahabad
Azamgarh
Bareilly
Basti
Chitrakoot
Devipatan
Faizabad
Gorakhpur
Jhansi
Kanpur
Lucknow
Meerut
Mirzapur
Moradabad
Saharanpur
Varanasi
State
2007 2008 2009 2010 2011 2007 2008 2009 2010 2011
List of districts undereach division
Agra
Mathura
Agra
Firozabad
Mainpuri
Aligarh
Aligarh
Mahamaya Nagar (Hathras)
Etah
Allahabad
Fatehpur
Pratapgarh
Kaushambi
Allahabad
Azamgarh
Azamgarh
Mau
Ballia
Bareilly
Budaun
Bareilly
Pilibhit
Shahjahanpur
Basti
Siddharthnagar
Basti
Sant Kabir Nagar
Note: Districts have beenclubbed into divisions to producethese estimates. The groupingof districts is based onadministrative divisions used inthe state or by geographicalregions.
How to read these tables: Thefirst row for each division givesthe estimate of the relevantvariable/year. The numbersbelow the estimate, in thesecond row, are twice thestandard error of thecorresponding estimate andrepresent the 95% confidenceinterval for the estimate. Forinstance, In Agra division of UttarPradesh, in 2007, % of Std I-IIchildren who could read lettersor more is 64.67 %. With 95%probability, the true populationproportion lies within ±4.56 %points of the estimate, i.e.,between 69.23 % and 60.11 %.
269ASER 2011

Divisional Estimates
Uttar Pradesh
Division/Region
64.67 61.40 68.04 67.76 65.30 66.17 60.41 66.55 68.07 67.50
±4.56 ±4.29 ±4.20 ±3.94 ±3.93 ±5.06 ±4.27 ±4.23 ±3.77 ±3.66
68.32 51.95 66.93 62.07 54.68 67.58 50.77 67.50 59.84 57.10
±7.74 ±5.44 ±5.29 ±5.74 ±6.52 ±7.11 ±5.04 ±4.88 ±5.95 ±6.33
71.89 61.79 71.04 62.23 66.93 66.63 59.69 67.68 59.85 67.20
±3.57 ±4.63 ±3.77 ±4.63 ±4.00 ±4.54 ±4.37 ±4.26 ±4.41 ±4.02
59.81 67.12 70.08 73.12 72.37 63.60 64.79 68.09 72.63 71.18
±6.45 ±4.61 ±4.96 ±6.62 ±4.23 ±6.81 ±4.89 ±5.20 ±6.05 ±4.85
67.93 61.38 58.21 64.47 56.12 67.47 60.90 58.19 62.74 59.49
±6.32 ±4.74 ±5.39 ±5.04 ±5.38 ±6.30 ±4.69 ±5.38 ±5.33 ±5.49
67.63 54.08 66.48 64.68 57.83 62.00 52.88 64.02 62.07 62.11
±4.47 ±4.81 ±5.79 ±6.12 ±5.35 ±4.42 ±5.41 ±5.48 ±5.93 ±5.18
65.47 67.65 73.92 62.27 64.24 61.54 65.40 71.51 61.28 64.33
±5.12 ±4.65 ±4.80 ±5.43 ±4.52 ±5.66 ±4.71 ±5.13 ±4.81 ±4.61
69.85 56.05 57.68 54.44 45.67 66.20 56.04 55.90 56.60 56.43
±5.31 ±4.66 ±5.39 ±5.34 ±4.64 ±5.27 ±4.74 ±5.39 ±5.23 ±4.97
68.57 51.96 65.66 62.22 61.11 70.83 57.99 62.82 65.58 63.95
±4.34 ±4.39 ±5.01 ±5.43 ±4.26 ±3.98 ±4.18 ±5.21 ±5.57 ±4.35
64.49 66.31 75.87 72.96 71.63 59.85 61.69 72.82 71.95 71.88
±4.67 ±4.24 ±3.96 ±4.35 ±3.88 ±4.69 ±4.06 ±4.26 ±4.31 ±3.58
72.14 60.65 71.59 73.90 68.99 66.68 57.81 69.35 72.50 64.99
±5.07 ±5.78 ±5.20 ±5.18 ±5.25 ±4.93 ±5.88 ±5.37 ±5.42 ±5.50
64.56 60.15 63.20 70.41 66.92 64.48 57.78 60.69 67.70 67.72
±5.46 ±3.84 ±4.65 ±3.90 ±3.98 ±5.66 ±3.60 ±4.86 ±4.05 ±4.10
59.95 53.58 57.86 60.57 55.35 61.72 54.32 56.57 60.81 58.47
±4.17 ±3.73 ±4.23 ±4.46 ±5.09 ±3.86 ±3.56 ±4.01 ±4.09 ±4.55
76.35 77.61 76.40 79.87 72.06 77.20 76.29 75.01 77.65 77.37
±4.62 ±3.72 ±4.55 ±4.30 ±4.52 ±3.89 ±3.90 ±4.69 ±4.58 ±4.17
74.74 57.72 70.06 68.08 75.42 66.14 55.86 65.40 65.45 74.97
±5.51 ±5.49 ±4.85 ±6.82 ±4.43 ±5.68 ±5.60 ±4.69 ±6.19 ±4.23
69.55 71.13 69.35 65.21 62.14 70.48 71.60 70.87 66.66 66.60
±6.55 ±4.25 ±5.28 ±5.21 ±5.18 ±6.68 ±3.99 ±5.09 ±4.69 ±4.59
68.51 75.66 82.00 77.64 69.58 63.87 77.48 83.28 77.68 70.74
±6.59 ±5.86 ±5.03 ±6.26 ±5.56 ±7.38 ±5.10 ±4.98 ±6.79 ±4.71
69.43 69.30 75.73 82.90 69.47 65.47 64.86 72.65 78.73 71.25
±4.20 ±3.69 ±4.08 ±4.02 ±4.34 ±4.13 ±4.23 ±3.90 ±4.29 ±4.36
67.22 62.08 68.00 67.31 63.56 65.70 61.07 66.29 66.59 65.99
±1.30 ±1.18 ±1.25 ±1.35 ±1.24 ±1.30 ±1.15 ±1.25 ±1.30 ±1.18
Agra
Aligarh
Allahabad
Azamgarh
Bareilly
Basti
Chitrakoot
Devipatan
Faizabad
Gorakhpur
Jhansi
Kanpur
Lucknow
Meerut
Mirzapur
Moradabad
Saharanpur
Varanasi
State
2007 2008 2009 2010 2011 2007 2008 2009 2010 2011
List of districts undereach division
Chitrakoot
Hamirpur
Mahoba
Banda
Chitrakoot
Devipatan
Bahraich
Shrawasti
Balrampur
Gonda
Faizabad
Bara Banki
Faizabad
Ambedkar Nagar
Sultanpur
Gorakhpur
Mahrajganj
Gorakhpur
Kushinagar
Deoria
Jhansi
Jalaun
Jhansi
Lalitpur
Kanpur
Farrukhabad
Kannauj
Etawah
Auraiya
Kanpur Dehat
Learning levels: Std I-II
% Children in Std I-II who CAN READletters or more
% Children in Std I-II who CANRECOGNIZE numbers 1 to 9 or more
270 ASER 2011

Divisional Estimates
Uttar Pradesh
Learning levels: Std III-V
% Children in Std III-V who CAN READLevel 1 (Std I) text or more
% Children in Std III-V who CAN DOsubtraction or more
Division/Region
54.36 48.80 48.74 51.40 46.76 46.77 35.38 35.07 42.28 38.85
±4.30 ±4.00 ±5.55 ±4.96 ±4.77 ±5.24 ±4.21 ±4.13 ±4.99 ±3.99
46.87 53.56 46.81 46.67 42.70 44.95 39.16 37.67 38.37 32.86
±6.51 ±5.33 ±6.21 ±5.78 ±5.43 ±5.97 ±5.17 ±6.60 ±5.66 ±4.43
51.29 50.25 48.06 47.16 44.35 39.27 33.66 38.06 34.08 33.82
±4.96 ±4.57 ±5.19 ±5.11 ±4.22 ±5.13 ±4.60 ±5.76 ±4.21 ±4.74
55.64 57.47 45.95 57.08 59.32 37.39 45.02 32.01 49.51 49.50
±5.27 ±6.14 ±4.39 ±6.97 ±4.37 ±5.84 ±7.43 ±4.69 ±7.39 ±4.15
45.00 45.00 31.46 38.63 35.86 39.92 30.21 21.39 26.16 24.80
±5.23 ±4.93 ±5.77 ±4.85 ±4.40 ±5.66 ±4.46 ±4.44 ±4.44 ±4.01
49.18 45.92 47.27 52.01 44.07 36.49 29.77 35.10 38.42 26.29
±5.62 ±4.90 ±6.07 ±6.00 ±5.35 ±5.60 ±4.11 ±5.41 ±5.61 ±4.07
49.84 47.71 43.75 42.98 40.20 45.37 33.81 34.79 33.28 30.52
±6.11 ±5.41 ±5.55 ±4.50 ±4.41 ±6.12 ±5.61 ±5.60 ±4.42 ±4.04
58.28 42.89 38.78 48.85 38.29 52.15 28.10 26.37 31.84 25.31
±6.25 ±6.09 ±5.28 ±5.40 ±4.87 ±6.32 ±5.66 ±4.85 ±5.00 ±4.46
53.08 45.90 49.32 49.86 43.76 40.03 29.02 32.99 35.96 29.37
±4.62 ±4.06 ±5.26 ±5.72 ±4.26 ±4.47 ±3.62 ±5.49 ±5.01 ±3.94
54.70 51.22 60.21 66.85 58.57 40.24 34.99 46.23 52.41 36.48
±5.01 ±4.83 ±5.03 ±4.36 ±4.00 ±5.33 ±5.21 ±5.84 ±4.70 ±4.20
46.52 47.49 48.55 52.46 48.03 46.62 37.78 42.66 42.86 41.10
±4.79 ±6.07 ±6.27 ±6.45 ±5.14 ±4.73 ±5.96 ±6.08 ±5.28 ±4.68
47.80 42.59 41.32 51.73 45.78 45.70 29.46 29.08 39.20 37.79
±4.68 ±3.85 ±4.12 ±4.80 ±4.98 ±4.54 ±3.55 ±4.02 ±5.26 ±4.85
40.39 38.01 36.20 41.39 40.20 30.76 22.56 22.02 30.79 28.85
±3.74 ±3.93 ±3.64 ±4.27 ±4.52 ±3.80 ±3.83 ±3.12 ±4.00 ±4.18
71.03 71.17 69.28 71.87 67.21 57.25 54.04 55.86 61.43 48.06
±5.06 ±3.99 ±5.66 ±3.74 ±4.38 ±5.74 ±5.38 ±6.19 ±4.13 ±4.90
50.91 51.47 46.38 50.50 55.06 38.25 32.03 31.13 32.79 37.77
±7.03 ±4.94 ±6.04 ±5.58 ±5.27 ±7.47 ±4.94 ±5.28 ±5.34 ±5.44
54.00 56.94 51.63 50.23 43.09 48.08 37.87 38.47 37.16 29.10
±6.41 ±4.98 ±5.52 ±5.54 ±4.47 ±6.58 ±5.03 ±5.46 ±5.10 ±3.79
56.81 73.12 67.30 64.83 59.04 53.02 59.56 56.55 55.17 39.64
±8.13 ±6.04 ±6.20 ±6.74 ±6.08 ±8.67 ±7.95 ±7.60 ±8.58 ±6.13
59.77 58.32 61.18 68.40 55.81 45.21 42.75 43.79 51.06 41.15
±4.60 ±4.07 ±4.68 ±4.85 ±4.39 ±4.76 ±4.75 ±4.75 ±5.37 ±4.04
52.16 50.66 48.55 52.67 47.83 42.85 35.22 35.69 40.17 34.45
±1.35 ±1.26 ±1.42 ±1.40 ±1.21 ±1.40 ±1.31 ±1.42 ±1.37 ±1.14
Agra
Aligarh
Allahabad
Azamgarh
Bareilly
Basti
Chitrakoot
Devipatan
Faizabad
Gorakhpur
Jhansi
Kanpur
Lucknow
Meerut
Mirzapur
Moradabad
Saharanpur
Varanasi
State
2007 2008 2009 2010 2011 2007 2008 2009 2010 2011
List of districts undereach division
Lucknow
Kheri
Sitapur
Hardoi
Unnao
Lucknow
Rae Bareli
Meerut
Meerut
Baghpat
Ghaziabad
Gautam Buddha Nagar
Bulandshahar
Mirzapur
Sant Ravidas Nagar (Bhadohi)
Mirzapur
Sonbhadra
Moradabad
Bijnor
Moradabad
Rampur
Jyotiba Phule Nagar
Saharanpur
Saharanpur
Muzaffarnagar
Varanasi
Jaunpur
Ghazipur
Chandauli
Varanasi
271ASER 2011

Divisional Estimates
Uttarakhand
School enrollment and out of school children
% Children out of school (age: 6-14) % Children enrolled in private school(age: 6-14)
Division/Region
1.75 0.65 1.11 1.25 0.80 27.75 30.38 25.69 28.81 31.12
±0.75 ±0.34 ±0.43 ±0.58 ±0.47 ±4.42 ±4.78 ±4.69 ±4.95 ±4.86
2.91 1.42 1.64 2.36 1.58 21.24 24.51 23.55 29.32 31.69
±1.31 ±0.79 ±0.82 ±1.28 ±0.97 ±3.79 ±4.53 ±4.21 ±5.34 ±5.07
2.24 0.98 1.35 1.73 1.09 25.00 27.86 24.72 29.03 31.33
±0.71 ±0.39 ±0.44 ±0.65 ±0.47 ±3.07 ±3.36 ±3.20 ±3.64 ±3.59
Garhwal
Kumaon
State
Garhwal
Uttarkashi
Chamoli
Rudraprayag
Tehri Garhwal
Dehradun
Garhwal
Hardwar
Kumaon
Pithoragarh
Bageshwar
Almora
Champawat
Nainital
Udham Singh Nagar
List of districts undereach division
2007 2008 2009 2010 2011 2007 2008 2009 2010 2011
Learning levels: Std I-II
% Children in Std I-II who CAN READletters or more
% Children in Std I-II who CANRECOGNIZE numbers 1 to 9 or more
Division/Region
78.35 79.85 80.49 80.52 76.53 78.75 79.67 79.63 78.26 74.79
±3.74 ±4.02 ±4.10 ±4.01 ±4.23 ±4.08 ±3.87 ±3.98 ±4.20 ±5.23
80.37 79.76 87.88 80.47 80.83 80.29 78.89 86.30 79.61 79.87
±3.82 ±5.63 ±3.78 ±3.98 ±4.18 ±4.06 ±5.22 ±3.77 ±4.37 ±3.74
79.23 79.82 83.88 80.50 78.09 79.42 79.36 82.70 78.85 76.65
±2.69 ±3.30 ±2.80 ±2.85 ±3.13 ±2.90 ±3.12 ±2.73 ±3.04 ±3.64
Garhwal
Kumaon
State
2007 2008 2009 2010 2011 2007 2008 2009 2010 2011
Learning levels: Std III-V
% Children in Std III-V who CAN READLevel 1 (Std I) text or more
% Children in Std III-V who CAN DOsubtraction or more
Division/Region
70.70 73.54 70.69 69.94 61.06 63.42 59.14 57.19 61.36 48.97
±3.68 ±4.31 ±4.00 ±4.42 ±4.80 ±4.22 ±4.88 ±5.03 ±4.97 ±4.47
73.27 77.62 77.58 72.46 70.66 67.55 60.82 68.22 65.01 55.07
±4.54 ±4.97 ±4.87 ±3.90 ±4.50 ±5.31 ±6.00 ±6.20 ±4.64 ±4.61
71.76 75.21 73.79 71.01 64.17 65.12 59.83 62.20 62.91 50.95
±2.86 ±3.27 ±3.08 ±3.04 ±3.68 ±3.32 ±3.78 ±3.91 ±3.47 ±3.43
Garhwal
Kumaon
State
2007 2008 2009 2010 2011 2007 2008 2009 2010 2011
Note: Districts have beenclubbed into divisions to producethese estimates. The groupingof districts is based onadministrative divisions used inthe state or by geographicalregions.
How to read these tables: Thefirst row for each division givesthe estimate of the relevantvariable/year. The numbersbelow the estimate, in thesecond row, are twice thestandard error of thecorresponding estimate andrepresent the 95% confidenceinterval for the estimate. Forinstance, In Garhwal division ofUttarakhand, in 2007, % of StdI-II children who could readletters or more is 78.35 %. With95% probability, the truepopulation proportion lies within±3.74 % points of the estimate,i.e., between 82.09 % and74.61%.
272 ASER 2011

Divisional Estimates
West Bengal
School enrollment and out of school children
% Children out of school (age: 6-14) % Children enrolled in private school(age: 6-14)
Division/Region
5.39 6.12 5.38 3.68 3.44 1.59 3.47 4.93 3.68 4.30
±1.07 ±1.55 ±1.53 ±0.92 ±1.02 ±0.66 ±1.28 ±1.44 ±1.13 ±1.56
3.58 5.17 5.71 5.96 5.31 9.19 10.25 11.01 10.65 10.89
±0.88 ±1.17 ±1.50 ±1.58 ±1.26 ±2.94 ±2.10 ±1.88 ±2.40 ±2.29
4.92 5.60 6.04 4.61 4.60 4.45 3.79 5.13 4.80 5.33
±1.11 ±2.03 ±1.51 ±1.11 ±1.39 ±1.24 ±1.12 ±1.27 ±1.39 ±1.42
4.81 5.70 5.68 4.58 4.32 4.31 5.29 6.54 5.86 6.29
±0.62 ±0.98 ±0.90 ±0.69 ±0.72 ±0.88 ±0.86 ±0.90 ±0.94 ±1.01
Burdwan
Jalpaiguri
Presidency
State
Learning levels: Std I-II
% Children in Std I-II who CAN READletters or more
% Children in Std I-II who CANRECOGNIZE numbers 1 to 9 or more
Division/Region
92.74 84.39 86.09 90.06 89.18 91.84 84.74 88.13 90.70 92.07
±2.31 ±4.57 ±4.01 ±3.19 ±3.31 ±2.28 ±4.18 ±3.56 ±2.74 ±2.66
76.68 78.39 76.95 78.49 74.67 80.19 80.33 82.30 79.75 79.80
±5.46 ±4.38 ±4.18 ±5.50 ±4.97 ±4.02 ±4.37 ±3.27 ±5.62 ±4.47
90.12 88.53 87.69 88.91 87.15 92.46 89.04 90.37 87.21 90.31
±2.57 ±3.44 ±3.18 ±3.81 ±3.90 ±2.24 ±3.65 ±3.30 ±4.37 ±3.36
87.85 83.96 84.02 86.62 84.77 89.13 84.83 87.20 86.76 88.33
±2.05 ±2.46 ±2.31 ±2.50 ±2.42 ±1.69 ±2.37 ±2.04 ±2.47 ±2.08
Burdwan
Jalpaiguri
Presidency
State
Learning levels: Std III-V
% Children in Std III-V who CAN READLevel 1 (Std I) text or more
% Children in Std III-V who CAN DOsubtraction or more
Division/Region2007 2008 2009 2010 2011 2007 2008 2009 2010 2011
88.26 73.04 70.02 76.82 65.01 87.38 63.64 65.09 71.20 60.46
±2.70 ±3.94 ±5.40 ±4.39 ±4.53 ±2.81 ±4.89 ±5.51 ±5.28 ±5.13
66.44 61.53 66.06 55.05 52.92 68.38 49.36 57.51 47.16 45.19
±4.86 ±3.86 ±4.65 ±5.09 ±5.36 ±4.41 ±3.97 ±4.86 ±5.00 ±5.93
67.70 66.66 65.54 67.08 62.14 64.18 51.49 55.24 55.29 52.54
±5.31 ±3.90 ±5.03 ±6.53 ±5.02 ±4.79 ±4.17 ±4.58 ±6.89 ±4.91
76.95 67.69 67.59 68.44 61.06 75.87 55.52 60.03 60.40 53.83
±2.96 ±2.38 ±3.06 ±3.40 ±2.92 ±2.86 ±2.79 ±3.09 ±3.85 ±3.12
Burdwan
Jalpaiguri
Presidency
State
Burdwan
Birbhum
Barddhaman
Hugli
Bankura
Puruliya
Medinipur
Jalpaiguri
Darjiling
Jalpaiguri
Koch Bihar
Uttar Dinajpur
Dakshin Dinajpur
Maldah
Presidency
Murshidabad
Nadia
North Twenty Four Parganas
Haora
South Twenty Four Parganas
List of districts undereach division
2007 2008 2009 2010 2011 2007 2008 2009 2010 2011
2007 2008 2009 2010 2011 2007 2008 2009 2010 2011
Note: Districts have beenclubbed into divisions to producethese estimates. The groupingof districts is based onadministrative divisions used inthe state or by geographicalregions.
How to read these tables: Thefirst row for each division givesthe estimate of the relevantvariable/year. The numbersbelow the estimate, in thesecond row, are twice thestandard error of thecorresponding estimate andrepresent the 95% confidenceinterval for the estimate. Forinstance, In Burdwan division ofWest Bengal, in 2007, % of StdI-II children who could readletters or more is 92.74 %. With95% probability, the truepopulation proportion lies within±2.31 % points of the estimate,i.e., between 95.05 % and90.43%.
273ASER 2011

Annexures
274 ASER 2011

Sample description
Not
e: G
irls
and
boys
may
not
add
to
all c
hild
ren
sinc
e ge
nder
has
not
bee
n re
cord
ed f
or 2
683
child
ren.
* Th
ese
stat
es a
re c
ompl
ete.
Som
e di
stric
ts w
ere
split
in
subs
eque
nt y
ears
.**
Dat
a fo
r 6
dist
ricts
is in
com
plet
e.
Stat
e
2011
Sur-
veye
dvi
llage
s
Surv
eyed
hous
e-ho
lds
Age
3-16
Age
3-5
Age
6-1
4A
ge 1
5-16
All
Boys
Girl
sA
llBo
ysG
irls
All
Boys
Girl
s
Sur-
veye
ddi
stric
ts
And
hra
Prad
esh
2222
2222
2222
2264
913
179
2131
736
3018
7017
6015
212
7503
7709
2475
1197
1278
Aru
nach
al P
rade
sh13
813
1013
1311
285
5586
1024
224
8813
2611
6266
6237
0629
5610
9263
845
4
Ass
am23
1623
2322
2322
630
1273
123
251
4658
2380
2278
1601
283
6276
5025
8113
7412
07
Biha
r37
3737
3537
3737
1068
2177
557
504
1142
559
5553
4740
718
2165
018
785
5361
2974
2359
Chh
atti
sgar
h16
1615
1515
1515
446
8871
1626
130
0815
3614
6111
076
5610
5456
2177
1115
1057
Dad
ra &
Nag
ar H
avel
i1
11
11
11
1836
161
499
4752
423
249
173
9260
32
Dam
an &
Diu
22
22
22
224
1191
2287
320
156
164
1650
897
753
317
165
152
Go
a2
22
22
21
2654
080
720
289
113
530
290
240
7535
40
Gu
jara
t26
25*
25*
25*
2626
2572
314
747
2757
841
3622
2119
1520
409
1123
291
7730
3316
9213
41
Har
yan
a20
2020
2020
2016
424
8687
1851
333
1818
7114
1312
931
7261
5566
2264
1243
999
Him
acha
l Pr
ades
h12
1212
1212
1212
348
6933
1058
419
7710
5788
974
0938
4234
7311
9858
359
3
Jam
mu
& K
ashm
ir14
1314
1414
1437
580
8816
909
2849
1521
1283
1146
859
9653
2625
9212
8012
88
Jhar
khan
d22
2222
2221
2220
583
1174
227
030
5458
2777
2556
1875
797
8286
8128
1515
3212
46
Kar
nat
aka
2727
2727
2727
2780
516
165
2456
644
3222
5321
7917
204
8727
8477
2930
1476
1454
Ker
ala
1414
1414
1414
1438
984
0011
564
1756
894
862
8457
4222
4235
1351
675
676
Mad
hya
Prad
esh
4545
4545
4545
4312
6625
368
5195
294
6951
1242
5636
433
1920
016
916
6050
3262
2740
Mah
aras
htr
a33
3333
3333
3331
925
1850
430
438
4939
2589
2315
2138
111
415
9842
4118
2106
1986
Man
ipur
98
99
98
821
446
7488
4316
4384
579
864
2133
4030
8177
939
638
3
Meg
hal
aya
75
67
77
615
530
6670
7015
2677
075
646
6523
3923
2687
944
343
6
Miz
ora
m8
78
88
817
543
8410
375
2030
1063
967
7257
3864
3393
1088
598
490
Nag
alan
d11
1011
1111
1111
260
6305
1300
125
1012
9612
1492
8448
4944
3512
0765
155
6
Odi
sha
3030
3030
3030
3089
317
781
2872
454
4429
2225
2219
440
1035
690
8438
4020
2318
17
Pud
uch
erry
22
22
22
251
1121
1383
235
118
117
913
456
457
235
107
128
Punj
ab19
18*
1919
1919
1955
011
291
1662
629
4816
2713
2111
753
6482
5271
1925
1033
892
Raja
stha
n32
3132
3232
3231
925
1854
742
258
7129
3855
3209
2943
516
442
1270
556
9433
5522
91
Sikk
im4
14
44
Sikk
im w
as s
urve
yed
late
and
dat
a co
uld
not
be i
ncor
pora
ted
in t
he P
rovi
sion
al R
epor
t
Tam
il N
adu
2929
2929
2929
2984
017
320
2635
041
1621
1020
0018
318
9144
9170
3916
1965
1950
Trip
ura
42
34
44
410
923
0834
7465
034
530
523
0712
4510
6251
729
522
2
Utt
ar P
rade
sh69
6969
6969
6968
2019
4074
096
215
1798
896
7482
2466
100
3551
530
389
1212
764
8656
13
Utt
arak
han
d13
1313
1313
1312
346
6966
1322
325
2613
1912
0790
5347
9542
5816
4487
377
1
Wes
t Be
ngal
1716
1717
1717
1749
610
001
1450
627
9614
3813
5897
4950
3847
1119
6199
197
0
Tota
l58
355
556
855
158
056
755
8**
1601
732
7372
6334
6511
5705
6103
654
003
4414
2723
3809
2057
5776
333
4062
335
421
Surv
eyed
dis
tric
ts
Actualcistricts
2006
2007
2008
2009
2010
All
275ASER 2011

Village infrastructure and household characteristics
And
hra
Prad
esh
85.1
99.8
70.7
72.5
32.8
90.2
46.6
56.6
17.9
7.6
99.5
68.2
47.5
39.8
97.2
16.4
29.3
54.3
97.2
74.2
54.8
77.2
73.4
80.7
10.2
7.6
10.0
Aru
nach
al P
rade
sh60
.883
.820
.524
.212
.257
.241
.610
.57.
225
.691
.049
.220
.125
.680
.663
.529
.66.
982
.772
.873
.763
.354
.567
.79.
326
.515
.0
Ass
am47
.682
.430
.018
.96.
673
.832
.314
.58.
414
.590
.030
.912
.635
.393
.164
.620
.115
.355
.950
.548
.735
.327
.765
.99.
113
.68.
5
Biha
r63
.379
.041
.733
.417
.365
.333
.833
.68.
961
.598
.276
.416
.130
.793
.242
.629
.727
.740
.431
.323
.116
.210
.566
.85.
917
.74.
7
Chh
atis
garh
79.4
95.9
32.7
17.9
15.0
68.7
38.6
29.0
11.0
9.2
98.1
41.7
16.2
27.0
97.3
70.4
16.5
13.1
83.7
78.0
24.2
45.6
30.9
48.8
6.3
14.8
4.9
Dad
ra &
Nag
ar H
avel
i94
.110
0.0
55.6
44.4
33.3
88.9
44.4
38.9
22.2
0.0
100.
088
.241
.212
.510
0.0
49.4
36.8
13.8
95.2
92.4
27.5
55.9
36.6
64.2
12.3
13.7
9.2
Dam
an &
Diu
100.
010
0.0
11.8
68.8
6.7
41.2
82.4
18.8
5.9
5.9
100.
058
.831
.329
.410
0.0
6.1
40.6
53.3
99.5
99.0
82.9
91.2
88.7
93.6
28.0
37.8
28.1
Goa
96.0
100.
084
.072
.080
.084
.075
.054
.252
.236
.410
0.0
65.0
60.0
70.8
100.
010
.218
.871
.098
.597
.684
.292
.580
.193
.558
.843
.155
.1
Guj
arat
88.7
99.3
66.7
43.2
29.7
78.0
52.6
44.4
17.9
21.9
99.7
91.6
34.7
24.3
97.2
26.1
34.6
39.3
95.4
92.0
48.5
61.0
51.0
80.4
14.0
25.6
17.7
Har
yana
92.8
98.8
50.5
61.4
35.9
84.8
51.5
57.7
13.9
23.4
98.4
80.2
59.8
67.7
98.1
8.5
27.6
63.9
92.7
67.9
77.5
76.8
64.6
86.9
17.8
22.0
23.1
Him
acha
l Pr
ades
h53
.099
.745
.032
.720
.652
.144
.723
.214
.723
.781
.446
.427
.029
.690
.421
.725
.453
.098
.995
.777
.987
.458
.990
.215
.132
.625
.0
Jam
mu
& K
ashm
ir60
.995
.134
.741
.917
.776
.061
.630
.111
.115
.398
.988
.340
.358
.195
.926
.526
.846
.790
.369
.244
.057
.140
.082
.111
.061
.517
.9
Jhar
khan
d55
.579
.626
.316
.811
.763
.529
.520
.76.
112
.896
.569
.012
.023
.793
.968
.817
.214
.064
.349
.810
.120
.916
.855
.97.
511
.94.
2
Kar
nata
ka90
.699
.662
.577
.142
.576
.440
.943
.116
.549
.998
.084
.032
.739
.198
.413
.049
.237
.995
.882
.837
.571
.468
.782
.48.
34.
512
.7
Ker
ala
92.8
99.2
98.4
98.4
97.9
99.5
95.5
83.5
87.0
51.4
93.9
83.8
75.4
94.9
99.5
8.7
29.3
62.1
97.6
95.8
96.5
89.6
80.5
92.2
52.4
21.6
61.6
Mad
hya
Prad
esh
69.2
92.8
35.5
20.7
16.7
58.7
36.2
31.3
7.7
8.5
99.4
59.0
23.2
38.1
96.4
62.6
21.7
15.6
74.8
50.0
23.9
36.0
24.4
59.8
6.4
16.7
4.7
Mah
aras
htra
85.3
98.8
49.0
52.2
31.2
88.2
50.8
51.3
22.4
34.7
99.2
65.2
22.7
46.1
98.5
24.0
38.5
37.5
88.8
64.0
49.7
63.1
47.1
74.2
15.5
22.0
18.9
Man
ipur
59.2
91.0
16.3
12.3
3.3
16.6
31.9
14.3
12.4
60.6
79.6
34.7
18.7
63.2
80.8
36.9
55.1
8.0
92.1
46.4
95.8
65.5
35.5
82.2
27.4
47.3
19.4
Meg
hala
ya52
.688
.324
.813
.811
.361
.335
.315
.710
.617
.779
.327
.78.
266
.079
.950
.036
.513
.568
.161
.958
.437
.330
.859
.717
.951
.110
.0
Miz
oram
77.3
100.
051
.519
.818
.995
.881
.41.
81.
226
.510
0.0
93.4
48.8
54.2
98.8
27.7
62.5
9.8
98.2
84.1
81.7
64.7
64.0
83.7
30.5
72.9
20.5
Nag
alan
d43
.699
.220
.414
.27.
738
.957
.615
.810
.211
.697
.659
.318
.453
.078
.742
.447
.110
.596
.481
.284
.752
.745
.177
.420
.371
.818
.5
Odi
sha
73.9
93.3
35.9
16.2
12.0
45.3
23.6
14.3
8.9
6.5
94.1
55.8
24.0
18.4
93.8
53.3
25.0
21.7
63.4
55.4
20.4
35.1
26.0
48.8
7.1
17.9
8.2
Pudu
cher
ry85
.410
0.0
56.3
70.8
64.6
83.3
66.0
54.2
31.3
27.1
85.4
63.8
46.8
58.3
87.2
12.2
20.7
67.2
98.4
97.1
48.2
93.1
91.2
84.6
17.2
9.5
28.6
Punj
ab95
.298
.753
.166
.235
.178
.553
.953
.413
.313
.299
.455
.036
.951
.897
.28.
335
.656
.197
.490
.882
.989
.860
.985
.219
.814
.625
.7
Raja
stha
n85
.096
.852
.742
.928
.866
.062
.933
.816
.715
.498
.883
.849
.861
.194
.225
.625
.449
.077
.056
.134
.346
.131
.581
.914
.518
.410
.4
Tam
il N
adu
85.0
99.5
67.3
62.5
38.4
91.3
46.2
22.9
15.0
11.0
93.4
55.4
24.4
27.4
92.7
9.3
13.7
77.0
96.7
87.7
37.5
94.2
88.9
87.3
10.1
5.6
16.2
Trip
ura
82.2
94.4
49.1
23.4
16.5
71.0
46.7
15.9
15.9
13.5
99.0
85.6
51.9
19.1
99.1
76.9
20.6
2.5
84.8
80.4
88.6
63.9
42.1
68.3
13.2
24.8
8.7
Utt
ar P
rade
sh85
.794
.633
.422
.815
.077
.033
.335
.47.
814
.294
.842
.57.
255
.691
.428
.244
.027
.745
.948
.028
.031
.226
.778
.55.
725
.97.
2
Utt
arak
hand
52.5
97.7
33.2
27.6
17.8
66.2
26.8
22.7
10.3
27.0
89.8
31.8
14.5
43.5
89.5
17.7
25.4
56.9
89.7
81.3
66.7
69.6
48.0
77.2
12.4
31.6
17.0
Wes
t Be
ngal
54.2
90.0
38.0
35.6
23.6
57.0
42.6
21.0
12.8
6.1
94.2
32.4
27.7
33.2
92.1
52.4
23.1
24.5
68.6
66.9
54.8
40.8
39.0
60.3
9.4
17.8
8.8
All
Ind
ia75
.693
.945
.038
.524
.171
.143
.333
.713
.921
.795
.961
.326
.742
.394
.033
.130
.336
.674
.565
.741
.851
.746
.973
.411
.317
.912
.6
STA
TES
% o
f vi
llage
s w
ith t
he f
ollo
win
g ch
arac
teris
tics
% o
f ho
useh
olds
with
the
fol
low
ing
char
acte
ristic
s
Pukka Road
Post Office
STD Booth
Bank
P.D.S
Primary HealthCentre
Private HealthClinic
Internet cafe
Solar Energy
Govt Prim School
Govt Middle School
Govt Sec. School
Private School
Aanganwadi/PreSchool
Kutcha
Semi Pukka
Pukka
Electricity
Electricity today
Toilet
T.V.
Cable TV
Mobile
Newspaper
Other readingmaterial
Computer Usage
Electricity
276 ASER 2011

All India
Bihar
Arunachal Pradesh
Andhra Pradesh
Chhattisgarh
Assam
Class-wise distribution of children in sample 2007-2011
277ASER 2011
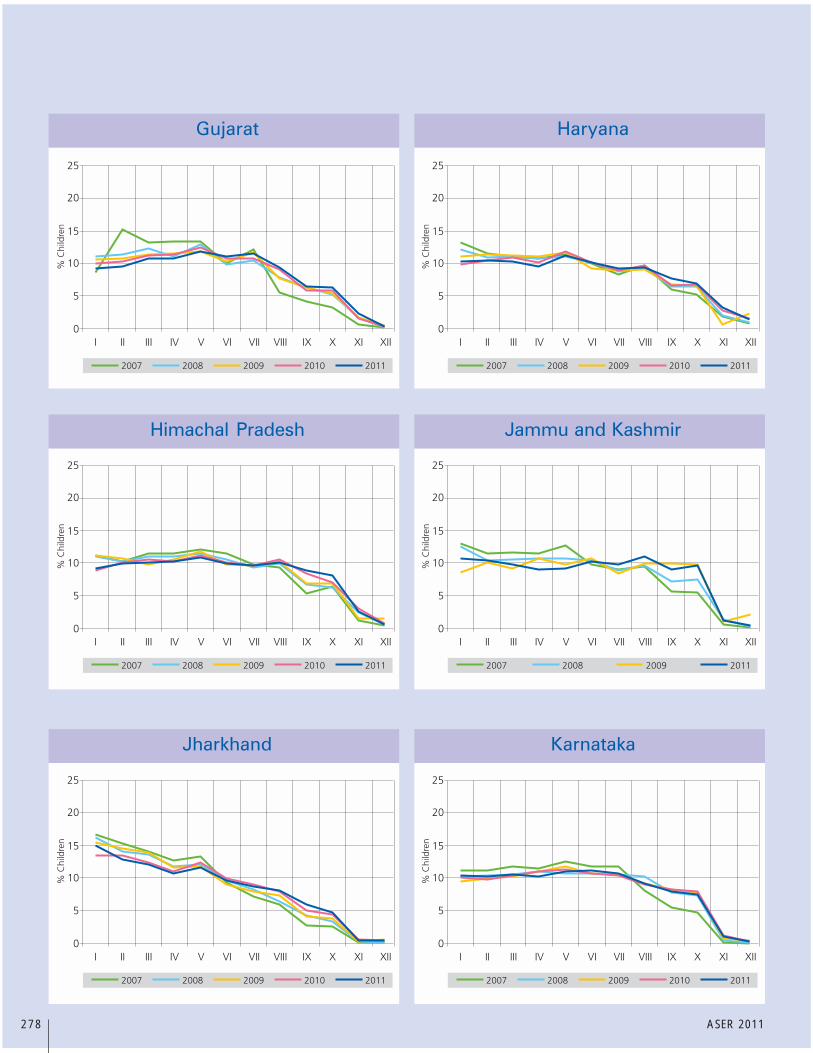
Gujarat
Jharkhand
Himachal Pradesh
Haryana
Karnataka
Jammu and Kashmir
278 ASER 2011

Kerala
Meghalaya
Maharashtra
Madhya Pradesh
Mizoram
Manipur
279ASER 2011

Nagaland
Tamil Nadu
Punjab
Odisha
Tripura
Rajasthan
280 ASER 2011

Uttarakhand
West Bengal
Uttar Pradesh
281ASER 2011

Age - Class composition in sample 2011
282 ASER 2011

283ASER 2011
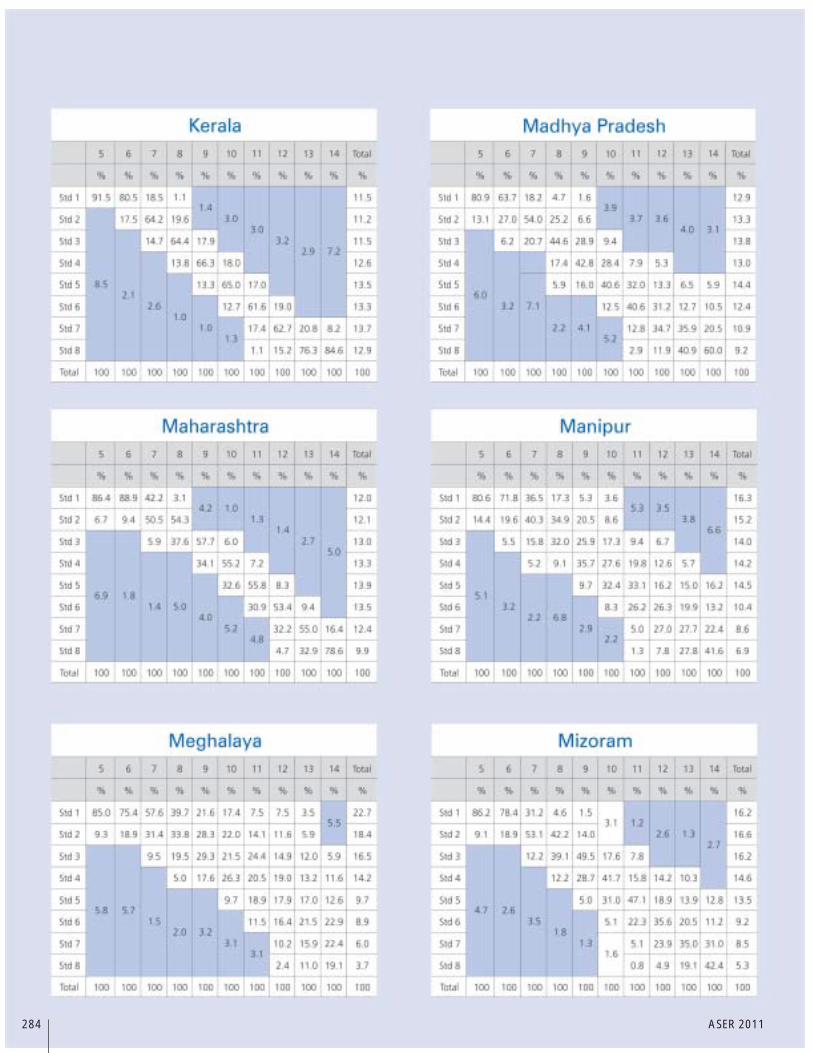
284 ASER 2011

285ASER 2011

286 ASER 2011

Sample design of rural ASER 2011
The purpose of rural ASER 2011 is twofold: (i) to get reliable estimates of the status of children’s schooling and basic learning(reading, writing and math ability) at the district level; and (ii) to measure the change in these basic learning and school statisticsfrom last year. Every year a core set of questions regarding schooling status and basic learning levels remains the same. Howevera set of new questions are added for exploring different dimensions of schooling and learning in the elementary stage. Thelatter set of questions is different each year.
ASER 2006 and 2007 tested reading comprehension for different kinds of readers. ASER 2007 introduced testing in English andasked questions on paid tuition, which were repeated in 2009. ASER 2008 for the first time had questions on telling time andoral math problems using currency. In addition, ASER 2008 incorporated questions on village infrastructure and householdassets. Investigators were asked to record whether the village visited had a pukka road leading to it, whether it had a bank,ration shop, etc. In the sampled households information on assets like type of house, phone, television, etc was recorded. Thesequestions were repeated in 2009 and in addition father’s education was also recorded. ASER 2010, while retaining the corequestions and questions on parents’ education, household and village characteristics introduced for the first time higher leveltesting tools. Questions on critical thinking were introduced – these were based on simple mathematical operations that appearin Standard 5 textbooks.
ASER 2011 brings together elements from various previous ASERs. The core questions on school status and basic reading andarithmetic remain. In addition, parents’ education, household and village characteristics continue to be surveyed.
Every alternate year, ASER surveyors visit a government primary or upper primary school in each sampled village. The schoolinformation is recorded either based on observations (such as attendance or usability of the facilities) or with informationprovided by the school (such as grants information). School observations have been reported in 2005, 2007, 2009 and 2010and are also reported in ASER 2011. Beginning in 2010, school information is also collected on RTE indicators.
Finally, ASER 2011 continues the process of strengthening and streamlining started in 2008. Re-check of 4 or more villages ineach district was introduced in 2008. This process was further strengthened in 2009. In ASER 2010, special attention wasfocused on improving training. In ASER 2011, in addition to the above, master trainers monitored the survey process in thefield.
Since one of the goals of ASER is to generate estimates of change in learning, a panel survey design would provide moreefficient estimates of the change. However, given the large sample size of the ASER surveys and cost considerations, weadopted a rotating panel of villages rather than children. In ASER 2010, we retained the 10 villages from 2008 and 2009 andadded 10 new villages. In ASER 2011 we dropped the 10 villages from ASER 2008, kept the 10 villages from 2009 and 2010and added 10 more villages from the census village directory.
The sampling strategy used generates a representative picture of each district. All rural districts are surveyed. The estimatesobtained are then aggregated to the state and all-India levels.
Since estimates were to be generated at the district level, the minimum sample size calculations had to start at the district level.The sample size is determined by the following considerations:
■ Incidence of what is being measured in the population. Since a survey of learning has never been done in India, theincidence of what we are trying to measure is unknown in the population.1
■ Confidence level of estimates. The standard used is 95%.
■ Precision required on either side of the true value. The standard degree of accuracy most surveys employ is between 5 and10 per cent. An absolute precision of 5% along with a 95% confidence level implies that the estimates generated by thesurvey will be within 5 percentage points of the true values with a 95% probability. The precision can also be specified inrelative terms — a relative precision of 5% means that the estimates will be within 5% of the true value. Relative precisionrequires higher sample sizes.
Sample size calculations can be done in various ways, depending on what assumptions are made about the underlying population.With a 50% incidence, 95% confidence level and 5% absolute precision, the minimum sample size required in each strata2 is384.3 This derivation assumes that the population proportion is normally distributed. On the other hand, a sample size of 384would imply a relative precision of 10%. If we were to require a 5% relative precision, the sample size would increase to 1600.4
Note that all the sample size calculations require estimating the incidence in the population. In our case, we can get an estimate
1 For the rural sector we can use the estimates from ASER 2010 to get an idea of the incidence in the population.2 Stratification is discussed below.
3 The sample size with absolute precision is given by where z is the standard normal deviate corresponding to 95% probability (=1.96),
p is the incidence in the population (0.5), q = (1-p) and d is the degree of precision required (0.05).
4 The sample size with relative precision is given by where z is the standard normal deviate corresponding to 95% probability (=1.96), p is the incidence in the population
(0.5), q = (1-p) and r is the degree of relative precision required (0.1).
Wilima Wadhwa
287ASER 2011
z2pq
d2
z2q
r2p

5 Sample size calculations assume simple random sampling. However, simple random sampling is unlikely to be the method of choice in an actual field survey. Therefore, often a“design effect” is added to the sample size. A design effect of 2 would double the sample size. At the district level a 7% precision along with a 95% confidence level would implya sample size of 196, giving us a design effect of approximately three. However, note that a sample size of 600 households gives us approximately 1000 – 1200 children per district.6 Of these 30 villages, 10 are from ASER 2009, 10 from ASER 2010 and 10 are newly selected in 2011. They were selected randomly from the same sample frame. The 10 newvillages are picked as an independent sample.7 Probability proportional to size (PPS) is a sampling technique in which the probability of selecting a sampling unit (village, in our case) is proportional to the size of its population.The method works as follows: First, the cumulative population by village calculated. Second, the total household population of the district is divided by the number of samplingunits (villages) to get the sampling interval (SI). Third, a random number between 1 and the SI is chosen. This is referred to as the random start (RS). The RS denotes the site of thefirst village to be selected from the cumulated population. Fourth, the following series of numbers is formed: RS; RS+SI; RS+2SI; RS+3SI; …. The villages selected are those forwhich the cumulative population contains the numbers in the series.
8 Most large household surveys in India, like the National Sample Survey and the National Family Health Survey also use this two stage design and use PPS to select villages in thefirst stage.9 In larger villages, the investigators increased the interval according to a rough estimate of the number of households in each part. For instance, if a village had 2000 households,each part in the village would have roughly 500 households. Selecting every 5th household would leave out a large chunk of the village un-surveyed. In such situations,investigators were asked to increase the interval between selected households.
288 ASER 2011
of the incidence from previous ASER surveys. However, incidence varies across different indicators — so incidence of readingability is different from incidence of dropouts. In addition, we often want to measure things that are not binary for which weneed more observations.
Given these considerations, the sample size was decided to be 600 households in each district.5 Note that at the state level andat the all-India level the survey has many more observations lending estimates at those levels much higher levels of precision.
ASER has a two-stage sample design. In the first stage, 30 villages are randomly selected using the village directory of the 2001census as the sample frame.6 In the second stage 20 households were randomly selected in each of the 30 selected villages inthe first stage.
Villages are selected using the probability proportional to size (PPS) sampling method. This method allows villages with largerpopulations to have a higher chance of being selected in the sample. It is most useful when the sampling units vary considerablyin size because it assures that those in larger sites have the same probability of getting into the sample as those in smaller sites,and vice verse.7, 8
In the selected villages, 20 households are surveyed. Ideally, a complete houselist of the selected village should have been madeand 20 households selected randomly from it. However, given time and resource constraints a procedure for selecting householdswas adopted that preserved randomness as much as possible. The field investigators were asked to divide the village into fourparts. This was done because villages often consist of hamlets and a procedure that randomly selects households from somecentral location may miss out households on the periphery of the village. In each of the four parts, investigators were asked tostart at a central location and pick every 5th household in a circular fashion till 5 households were selected. In each selectedhousehold, all children in the age group of 5-16 were tested.9
The survey provides estimates at the district, state and national levels. In order to aggregate estimates up from the district levelhouseholds had to assigned weights — also called inflation factors. The inflation factor corresponding to particular householddenotes the number of households that the sampled household represents in the population. Given that 600 households aresampled in each district regardless of the size of the district, a household in a larger district will represent many more householdsand, therefore, have a larger weight associated with it than one in a sparsely populated district.
The advantage of using PPS sampling is that the sample is self weighting at the district level. In other words, in each district theweight assigned to each of the sampled household turns out to be the same. This is because the inflation factor associated witha household is simply the inverse of the probability of it being selected into the sample times the number of households in thesample. Since PPS sampling ensures that all households have an equal chance of being selected at the district level, the weightsassociated with households in the same district are the same. Therefore, weighted estimates are exactly the same as the un-weighted estimates at the district level. However, to get estimates at the state and national levels, weighted estimates areneeded since states have a different number of districts and districts vary by population.
Even though the purpose of the survey is to estimate learning levels among children, the household was chosen as the secondstage sampling unit. This has a number of advantages. First, children are tested at home rather than in school, allowing allchildren to be tested rather than just those in school. Further, testing children in school might create bias a since teachers mayencourage testing the brighter children in class. Second, a household sample will generate an age distribution of children whichcan be cross-checked with other data sources, like the census and the NSS. Third, a household sample makes calculation of theinflation factors easier since the population of children is no longer needed.
Often household surveys are stratified on various parameters of interest. The reason for stratification is to get enough observationson entities that have the characteristic that is being studied. The ASER survey stratifies the sample by population in the firststage. No stratification was done at the second stage. Finally, if we were to stratify on households with children in the 3-16 agegroup, we would need the population of such households in the village, which is not possible without a complete houselist ofthe village.