Embed Size (px)
Citation preview

ASEE 2019 Edition
Engineering & Engineering Technology
Founded in 1893, the American Society for Engineering Education (ASEE) is a global society of individual, institutional, and
corporate members. ASEE’s vision is excellent and broadly accessible education empowering students and engineering pro-
fessionals to create a better world. We work toward achieving that vision by advancing innovation, excellence, and access
at all levels of education for the engineering profession. We engage with engineering faculty, business leaders, college and
high school students, parents, and teachers to enhance the engineering workforce of the nation. We are the only profes-
sional society addressing opportunities and challenges spanning all engineering disciplines, working across the breadth of
academic education including teaching, research, and public service.
• We support education at the institutional level by linking faculty and staff across disciplines to create enhanced
student learning and discovery.
• We support education across institutions by identifying opportunities to share proven and promising practices.
• We support education locally, regionally, and nationally by forging and reinforcing connections between academia,
business, industry, and government.
• We support discovery and scholarship among education researchers by providing opportunities to share and build
upon findings.
• We support innovation by fostering the translation of research into improved practices.
• We support disciplinary technical researchers by disseminating best research management practices.
www.asee.org
Engineering and Engineering Technology by the Numbers, 2019©2020 by the American Society for Engineering Education. All rights reserved.
American Society for Engineering Education
1818 N Street NW, Suite 600
Washington, DC 20036
This report is available for download at www.asee.org.
Suggested Citation[only for reference] American Society for Engineering Education. (2020). Engineering and Engineering Technology by the Numbers 2019. Washington, DC.
ASEE Profiles Survey TeamJoseph Roy, Ph.D. Director, Institutional Research & AnalyticsCarolyn Wilson, Senior Research AssociateAngela Erdiaw-Kwasie, Data Analyst IICharles Stuppard, Data Analyst I

11 January 2021
ASEE Staff Removed “Arizona State University Polytechnic” from the data. ASU reports ASU-Polytechnic as part of their submission. ASEE imports IPEDs data for degrees awarded and had identified ASU-Polytechnic as a non-participating institution because it has a different IPEDS ID from ASU. This has been corrected and noted for future years.
16 October 2020
Changes from original publication:
(1) Several institutions contacted us about their classification of dual discipline programs (e.g. Civil/Environmental Engineering and Electrical/Computer Engineering). After internal discussions and identifying what may have created confusion in the original submission, we decided to reclassify institutions who reported last year as “Civil/Environmental Engineering” or “Electrical/Computer Engineering”, if the following conditions held:
(a) They did not report the program in 2018 as a dual discipline.
(b) The name of the program (e.g. “Environmental Engineering (B.Sc.)”) indicated a single discipline.
Only programs that met conditions (a) and (b) were reclassified to single discipline programs. We have modified how we are collecting disciplinary information for 2020 to avoid confusion.
(2) The University of California, Santa Cruz updated the degrees awarded from their original submission.
(3) There was an error in reading in the data submitted by North Carolina State University that has been corrected.

Engineering by the Numbers 2019
Contents1 ENGINEERING IN 2019 4
1.1 Gender in ASEE Data Collections . . . . . . . . . . . . . . . . . . . . . . . . . . . . . . . . . . . . . . . . . . . . . . . . . . . . . . . . 41.2 Representation in Engineering of Underrepresented Minorities . . . . . . . . . . . . . . . . . . . . . . . . . . . . . . . . . . . . . . . . . 41.3 International Students in Engineering . . . . . . . . . . . . . . . . . . . . . . . . . . . . . . . . . . . . . . . . . . . . . . . . . . . . . . 41.4 Faculty to Student Ratios . . . . . . . . . . . . . . . . . . . . . . . . . . . . . . . . . . . . . . . . . . . . . . . . . . . . . . . . . . . . . 5
2 ENGINEERING BACHELORS 62.1 ENGINEERING BACHELOR’S DEGREES . . . . . . . . . . . . . . . . . . . . . . . . . . . . . . . . . . . . . . . . . . . . . . . . . . . 6
2.1.1 Total Bachelor’s Degrees Awarded by Engineering Discipline . . . . . . . . . . . . . . . . . . . . . . . . . . . . . . . . . . . . . 62.1.2 Total Bachelor’s Degrees Awarded to Underrepresented Minorities by Engineering Discipline . . . . . . . . . . . . . . . . . . . 72.1.3 Percentage of Bachelors Degrees Awarded to Underrepresented Minorities by Discipline . . . . . . . . . . . . . . . . . . . . . . 72.1.4 Percentage of Bachelors Degrees Awarded to Women by Discipline . . . . . . . . . . . . . . . . . . . . . . . . . . . . . . . . . . 72.1.5 Institutions Awarding the Highest Number of Engineering Bachelor’s Degrees . . . . . . . . . . . . . . . . . . . . . . . . . . . . 82.1.6 Bachelor’s Degrees Awarded by Gender . . . . . . . . . . . . . . . . . . . . . . . . . . . . . . . . . . . . . . . . . . . . . . . . . 92.1.7 Bachelor’s Degrees Awarded by Race and Ethnicity . . . . . . . . . . . . . . . . . . . . . . . . . . . . . . . . . . . . . . . . . . . 92.1.8 Bachelor’s Degrees Awarded by Residency . . . . . . . . . . . . . . . . . . . . . . . . . . . . . . . . . . . . . . . . . . . . . . . . 102.1.9 Bachelor’s Degrees Awarded by Race, Ethnicity, and Gender . . . . . . . . . . . . . . . . . . . . . . . . . . . . . . . . . . . . . 112.1.10 Top 50 Institutions by Total Bachelor’s Degrees awarded to Underrepresented Minorities . . . . . . . . . . . . . . . . . . . . . . 112.1.11 Top 50 Institutions by Total Bachelor’s Degrees awarded to Women . . . . . . . . . . . . . . . . . . . . . . . . . . . . . . . . . 122.1.12 Top 50 Institutions by Percentage of Bachelor’s Degrees awarded to Underrepresented Minorities . . . . . . . . . . . . . . . . . 132.1.13 Top 20 Institutions by Percentage of Bachelor’s Degrees awarded to Women . . . . . . . . . . . . . . . . . . . . . . . . . . . . . 132.1.14 Top 20 Institutions by Total Bachelor’s Degrees awarded to African Americans . . . . . . . . . . . . . . . . . . . . . . . . . . . 142.1.15 Top 20 Institutions by Total Bachelor’s Degrees awarded to Asian Americans . . . . . . . . . . . . . . . . . . . . . . . . . . . . 142.1.16 Top 20 Institutions by Total Bachelor’s Degrees awarded to Hispanics . . . . . . . . . . . . . . . . . . . . . . . . . . . . . . . . 152.1.17 Top 20 Institutions by Total Bachelor’s Degrees awarded in Aerospace Engineering . . . . . . . . . . . . . . . . . . . . . . . . . 152.1.18 Top 20 Institutions by Total Bachelor’s Degrees awarded in Biomedical Engineering . . . . . . . . . . . . . . . . . . . . . . . . 152.1.19 Top 50 Institutions by Total Bachelor’s Degrees awarded in Chemical Engineering . . . . . . . . . . . . . . . . . . . . . . . . . 162.1.20 Top 50 Institutions by Total Bachelor’s Degrees awarded in Civil Engineering . . . . . . . . . . . . . . . . . . . . . . . . . . . . 162.1.21 Top 50 Institutions by Total Bachelor’s Degrees awarded in Industrial/Manufacturing Engineering . . . . . . . . . . . . . . . . 172.1.22 Top 50 Institutions by Total Bachelor’s Degrees awarded in Mechanical Engineering . . . . . . . . . . . . . . . . . . . . . . . . 182.1.23 Top 50 Institutions by Total Bachelor’s Degrees awarded in Electrical Engineering . . . . . . . . . . . . . . . . . . . . . . . . . 182.1.24 Top 50 Institutions by Total Bachelor’s Degrees awarded in Computer Engineering . . . . . . . . . . . . . . . . . . . . . . . . . 192.1.25 Top 20 Institutions by Total Bachelor’s Degrees awarded in Electrical/Computer Engineering . . . . . . . . . . . . . . . . . . . 202.1.26 Top 20 Institutions by Total Bachelor’s Degrees awarded in Computer Science (outside engineering) . . . . . . . . . . . . . . . 202.1.27 Top 50 Institutions by Total Bachelor’s Degrees awarded in Computer Science (inside engineering) . . . . . . . . . . . . . . . . 212.1.28 Top 50 Institutions by Total Bachelor’s Degrees awarded in Engineering (General) . . . . . . . . . . . . . . . . . . . . . . . . . 22
2.2 ENGINEERING UNDERGRADUATE ENROLLMENT, FALL 2019 . . . . . . . . . . . . . . . . . . . . . . . . . . . . . . . . . . . . . 232.2.1 Undergraduate Enrollment by Race, Ethnicity, and Gender . . . . . . . . . . . . . . . . . . . . . . . . . . . . . . . . . . . . . . 232.2.2 Engineering Undergraduate Enrollment by Institutions . . . . . . . . . . . . . . . . . . . . . . . . . . . . . . . . . . . . . . . . . 232.2.3 Undergraduate Enrollment by Engineering Discipline . . . . . . . . . . . . . . . . . . . . . . . . . . . . . . . . . . . . . . . . . . 242.2.4 Undergraduate Enrollment by Engineering Discipline:(Full time and Part time) . . . . . . . . . . . . . . . . . . . . . . . . . . . 252.2.5 Undergraduate Enrollment by Gender . . . . . . . . . . . . . . . . . . . . . . . . . . . . . . . . . . . . . . . . . . . . . . . . . . 252.2.6 Undergraduate Enrollment by Race and Ethnicity . . . . . . . . . . . . . . . . . . . . . . . . . . . . . . . . . . . . . . . . . . . 262.2.7 Undergraduate Enrollment by Residency . . . . . . . . . . . . . . . . . . . . . . . . . . . . . . . . . . . . . . . . . . . . . . . . . 26
3 ENGINEERING MASTERS 283.1 ENGINEERING MASTER’S DEGREE . . . . . . . . . . . . . . . . . . . . . . . . . . . . . . . . . . . . . . . . . . . . . . . . . . . . . 28
3.1.1 Masters Degrees Awarded by Engineering Discipline . . . . . . . . . . . . . . . . . . . . . . . . . . . . . . . . . . . . . . . . . . 283.1.2 Total Master’s Degrees Awarded to Underrepresented Minorities by Engineering Discipline . . . . . . . . . . . . . . . . . . . . 293.1.3 Percentage of Master’s Degrees Awarded to Underrepresented Minorities by Discipline . . . . . . . . . . . . . . . . . . . . . . . 293.1.4 Percentage of Master’s Degrees Awarded to Women by Discipline . . . . . . . . . . . . . . . . . . . . . . . . . . . . . . . . . . . 293.1.5 Master’s Degrees Awarded by Gender . . . . . . . . . . . . . . . . . . . . . . . . . . . . . . . . . . . . . . . . . . . . . . . . . . 303.1.6 Master’s Degrees Awarded by Race and Ethnicity . . . . . . . . . . . . . . . . . . . . . . . . . . . . . . . . . . . . . . . . . . . . 313.1.7 Masters Degrees Awarded by Residency . . . . . . . . . . . . . . . . . . . . . . . . . . . . . . . . . . . . . . . . . . . . . . . . . 313.1.8 Master’s Degrees Awarded by Race, Ethnicity, and Gender . . . . . . . . . . . . . . . . . . . . . . . . . . . . . . . . . . . . . . 323.1.9 Top 50 Institutions Awarding Engineering Masters Degrees . . . . . . . . . . . . . . . . . . . . . . . . . . . . . . . . . . . . . . 333.1.10 Top 20 Institutions by Total Master’s Degrees awarded to Underrepresented Minorities . . . . . . . . . . . . . . . . . . . . . . 343.1.11 Top 50 Institutions by Percentage of Master’s Degrees awarded to Underrepresented Minorities . . . . . . . . . . . . . . . . . . 343.1.12 Top 20 Institutions Awarding Highest Percentage of Master’s Degrees to Women . . . . . . . . . . . . . . . . . . . . . . . . . . 353.1.13 Top 20 Institutions by Total Masters’s Degrees awarded in Engineering (General) . . . . . . . . . . . . . . . . . . . . . . . . . . 35
3.2 ENGINEERING MASTER’S ENROLLMENT . . . . . . . . . . . . . . . . . . . . . . . . . . . . . . . . . . . . . . . . . . . . . . . . . 363.2.1 Masters Enrollment by Race, Ethnicity, and Gender . . . . . . . . . . . . . . . . . . . . . . . . . . . . . . . . . . . . . . . . . . 363.2.2 Top 50 Institutions with Highest Graduate Enrollment . . . . . . . . . . . . . . . . . . . . . . . . . . . . . . . . . . . . . . . . . 363.2.3 Masters Enrollment by Engineering Discipline:(Full time and Part time) . . . . . . . . . . . . . . . . . . . . . . . . . . . . . . . 373.2.4 Masters Enrollment by Gender . . . . . . . . . . . . . . . . . . . . . . . . . . . . . . . . . . . . . . . . . . . . . . . . . . . . . . 373.2.5 Masters Enrollment by Race and Ethnicity . . . . . . . . . . . . . . . . . . . . . . . . . . . . . . . . . . . . . . . . . . . . . . . 383.2.6 Masters Enrollment by Residency . . . . . . . . . . . . . . . . . . . . . . . . . . . . . . . . . . . . . . . . . . . . . . . . . . . . . 38
4 ENGINEERING DOCTORAL 404.1 ENGINEERING DOCTORAL DEGREES . . . . . . . . . . . . . . . . . . . . . . . . . . . . . . . . . . . . . . . . . . . . . . . . . . . . 40
4.1.1 Doctoral Degrees Awarded by Engineering Discipline . . . . . . . . . . . . . . . . . . . . . . . . . . . . . . . . . . . . . . . . . . 404.1.2 Total Doctoral Degrees Awarded to Underrepresented Minorities by Engineering Discipline . . . . . . . . . . . . . . . . . . . . 414.1.3 Percentage of Doctoral Degrees Awarded to Underrepresented Minorities by Discipline . . . . . . . . . . . . . . . . . . . . . . . 414.1.4 Percentage of Doctoral Degrees Awarded to Women by Discipline . . . . . . . . . . . . . . . . . . . . . . . . . . . . . . . . . . . 414.1.5 Doctoral Degrees Awarded by Gender . . . . . . . . . . . . . . . . . . . . . . . . . . . . . . . . . . . . . . . . . . . . . . . . . . 42
1

4.1.6 Doctoral Degrees Awarded by Race and Ethnicity . . . . . . . . . . . . . . . . . . . . . . . . . . . . . . . . . . . . . . . . . . . 434.1.7 Doctoral Degrees Awarded by Residency . . . . . . . . . . . . . . . . . . . . . . . . . . . . . . . . . . . . . . . . . . . . . . . . . 434.1.8 Doctoral Degrees Awarded by Race, Ethnicity, and Gender . . . . . . . . . . . . . . . . . . . . . . . . . . . . . . . . . . . . . . 444.1.9 Top 50 Institutions Awarding Engineering Doctoral Degrees . . . . . . . . . . . . . . . . . . . . . . . . . . . . . . . . . . . . . . 454.1.10 Top 20 Institutions by Total Doctoral Degrees awarded to Underrepresented Minorities . . . . . . . . . . . . . . . . . . . . . . 464.1.11 Top 50 Institutions by Percentage of Doctoral Degrees awarded to Underrepresented Minorities . . . . . . . . . . . . . . . . . . 464.1.12 Top 20 Institutions Awarding Highest Percentage of Doctoral Degrees to Women . . . . . . . . . . . . . . . . . . . . . . . . . . 474.1.13 Top 50 Institutions Awarding Doctoral Degrees to Foreign Nationals . . . . . . . . . . . . . . . . . . . . . . . . . . . . . . . . . 474.1.14 Top 50 Institutions Awarding Bachelor’s Degrees (excluding computer science both inside and outside Engineering) . . . . . . . 484.1.15 Top 50 Institutions Awarding Master’s Degrees (excluding computer science both inside and outside Engineering) . . . . . . . 484.1.16 Top 50 Institutions Awarding Doctoral Degrees (excluding computer science both inside and outside Engineering ) . . . . . . . 494.1.17 Institutions with the Highest Percentage of Doctoral Degrees to Foreign Nationals . . . . . . . . . . . . . . . . . . . . . . . . . 504.1.18 Institutions with the Lowest Percentage of Doctoral Degrees to Foreign Nationals . . . . . . . . . . . . . . . . . . . . . . . . . . 514.1.19 Top 10 Institutions by Total Doctoral Degrees awarded in Engineering (General) . . . . . . . . . . . . . . . . . . . . . . . . . . 51
4.2 ENGINEERING DOCTORAL ENROLLMENT . . . . . . . . . . . . . . . . . . . . . . . . . . . . . . . . . . . . . . . . . . . . . . . . 524.2.1 Doctoral Enrollment by Race, Ethnicity, and Gender . . . . . . . . . . . . . . . . . . . . . . . . . . . . . . . . . . . . . . . . . . 524.2.2 Doctoral Enrollment by Engineering Discipline:(Full time and Part time) . . . . . . . . . . . . . . . . . . . . . . . . . . . . . . 534.2.3 Doctoral Enrollment by Gender . . . . . . . . . . . . . . . . . . . . . . . . . . . . . . . . . . . . . . . . . . . . . . . . . . . . . . 534.2.4 Doctoral Enrollment by Race and Ethnicity . . . . . . . . . . . . . . . . . . . . . . . . . . . . . . . . . . . . . . . . . . . . . . . 534.2.5 Doctoral Enrollment by Residency . . . . . . . . . . . . . . . . . . . . . . . . . . . . . . . . . . . . . . . . . . . . . . . . . . . . 54
5 ENGINEERING FACULTY , FALL 2019 555.1 Number of Tenured/Tenure-Track Faculty by Engineering Discipline . . . . . . . . . . . . . . . . . . . . . . . . . . . . . . . . . . . . . 555.2 Percentage of Female Tenured/Tenure-Track Faculty by Discipline . . . . . . . . . . . . . . . . . . . . . . . . . . . . . . . . . . . . . . 555.3 Top 50 Institutions by Number of Tenured/Tenure-Track Faculty . . . . . . . . . . . . . . . . . . . . . . . . . . . . . . . . . . . . . . . 565.4 Top 20 Institutions by Number of Underrepresented Minorities Tenured/Tenure-Track Faculty . . . . . . . . . . . . . . . . . . . . . . 575.5 Top 20 Institutions by Percentage of Underrepresented Minorities Tenured/Tenure-Track Faculty . . . . . . . . . . . . . . . . . . . . . 575.6 Number of Engineering Teaching Personnel by Rank . . . . . . . . . . . . . . . . . . . . . . . . . . . . . . . . . . . . . . . . . . . . . . 585.7 Percentage of Female Tenured/Tenure-Track Faculty by Rank . . . . . . . . . . . . . . . . . . . . . . . . . . . . . . . . . . . . . . . . . 585.8 Top 50 Institutions with Highest Percentage of Female Tenured Tenure Track Faculty . . . . . . . . . . . . . . . . . . . . . . . . . . . 585.9 Top 20 Institutions with Highest Number of Female Tenured/Tenure-Track Faculty . . . . . . . . . . . . . . . . . . . . . . . . . . . . . 595.10 Percentage of Women and Minority Faculty Members . . . . . . . . . . . . . . . . . . . . . . . . . . . . . . . . . . . . . . . . . . . . . 605.11 Number of Full Professors by Race/Ethnicity . . . . . . . . . . . . . . . . . . . . . . . . . . . . . . . . . . . . . . . . . . . . . . . . . . 605.12 Number of Assistant Professors by Race/Ethnicity . . . . . . . . . . . . . . . . . . . . . . . . . . . . . . . . . . . . . . . . . . . . . . . 615.13 Number of Associate Professors by Race/Ethnicity . . . . . . . . . . . . . . . . . . . . . . . . . . . . . . . . . . . . . . . . . . . . . . . 625.14 Percentage of Black/African American Tenured/Tenure-Track Faculty by Rank . . . . . . . . . . . . . . . . . . . . . . . . . . . . . . . 625.15 Percentage of Asian Tenured/Tenure-Track Faculty by Rank . . . . . . . . . . . . . . . . . . . . . . . . . . . . . . . . . . . . . . . . . . 635.16 Percentage of Hispanic Tenured/Tenure-Track Faculty by Rank . . . . . . . . . . . . . . . . . . . . . . . . . . . . . . . . . . . . . . . . 635.17 African American Tenured/ Tenure Track Faculty by Institutions . . . . . . . . . . . . . . . . . . . . . . . . . . . . . . . . . . . . . . . 645.18 Asian Tenured/ Tenure Track Faculty by Institutions . . . . . . . . . . . . . . . . . . . . . . . . . . . . . . . . . . . . . . . . . . . . . . 645.19 Hispanic Tenured/ Tenure Track Faculty by Institutions . . . . . . . . . . . . . . . . . . . . . . . . . . . . . . . . . . . . . . . . . . . . 655.20 Percentage of African American Tenured/Tenure-Track Faculty by Discipline . . . . . . . . . . . . . . . . . . . . . . . . . . . . . . . . 655.21 Percentage of Hispanic Tenured/Tenure-Track Faculty by Discipline . . . . . . . . . . . . . . . . . . . . . . . . . . . . . . . . . . . . . 665.22 Percentage of Asian Tenured/Tenure-Track Faculty by Discipline . . . . . . . . . . . . . . . . . . . . . . . . . . . . . . . . . . . . . . . 67
6 ENGINEERING RESEARCH EXPENDITURES, FISCAL 2019 696.1 Top 50 Research Expenditure By Institutions . . . . . . . . . . . . . . . . . . . . . . . . . . . . . . . . . . . . . . . . . . . . . . . . . . 696.2 Research Expenditures By Source in Millions of Dollars . . . . . . . . . . . . . . . . . . . . . . . . . . . . . . . . . . . . . . . . . . . . 696.3 Computer Science Research Expenditures Located Outside of Engineering By Institutions . . . . . . . . . . . . . . . . . . . . . . . . . 70
7 CANADIAN ENGINEERING 717.1 Engineering Bachelor’s Degree by Canadian Institutions . . . . . . . . . . . . . . . . . . . . . . . . . . . . . . . . . . . . . . . . . . . . 717.2 Engineering Master’s Degree by Canadian Institutions . . . . . . . . . . . . . . . . . . . . . . . . . . . . . . . . . . . . . . . . . . . . . 717.3 Engineering Doctoral Degree by Canadian Institutions . . . . . . . . . . . . . . . . . . . . . . . . . . . . . . . . . . . . . . . . . . . . . 717.4 Bachelor’s Degrees Awarded by Gender- Canadian Institutions . . . . . . . . . . . . . . . . . . . . . . . . . . . . . . . . . . . . . . . . 717.5 Master’s Degrees Awarded by Gender- Canadian . . . . . . . . . . . . . . . . . . . . . . . . . . . . . . . . . . . . . . . . . . . . . . . . 727.6 Doctoral Degrees Awarded by Gender- Canadian Institutions . . . . . . . . . . . . . . . . . . . . . . . . . . . . . . . . . . . . . . . . . 727.7 Tenured/Tenure-Track Faculty Members by Institutions . . . . . . . . . . . . . . . . . . . . . . . . . . . . . . . . . . . . . . . . . . . . 727.8 Percentage of Female Tenured/Tenure-Track Faculty by Rank- Canadian Institutions . . . . . . . . . . . . . . . . . . . . . . . . . . . . 73
8 ENGINEERING TECHNOLOGY IN 2019 748.1 Representation in Engineering Technology of Underrepresented Minorities . . . . . . . . . . . . . . . . . . . . . . . . . . . . . . . . . . 748.2 International Students in Engineering Technology . . . . . . . . . . . . . . . . . . . . . . . . . . . . . . . . . . . . . . . . . . . . . . . . 748.3 Engineering Technology Programs at 2-year Institutions . . . . . . . . . . . . . . . . . . . . . . . . . . . . . . . . . . . . . . . . . . . . 74
9 ENGINEERING TECHNOLOGY 769.1 ENGINEERING TECHNOLOGY DEGREES . . . . . . . . . . . . . . . . . . . . . . . . . . . . . . . . . . . . . . . . . . . . . . . . . . 76
9.1.1 Engineering Technology Degrees Awarded by Discipline . . . . . . . . . . . . . . . . . . . . . . . . . . . . . . . . . . . . . . . . 769.1.2 Engineering Technology Degrees Awarded to Underrepresented Minorities by Discipline . . . . . . . . . . . . . . . . . . . . . . 769.1.3 Percentage of Engineering Technology Degrees Awarded to Underrepresented Minorities by Discipline . . . . . . . . . . . . . . 769.1.4 Engineering Technology Bachelor’s Degrees Awarded by Gender . . . . . . . . . . . . . . . . . . . . . . . . . . . . . . . . . . . . 779.1.5 Engineering Technology Bachelor’s Degrees Awarded by Race and Ethnicity . . . . . . . . . . . . . . . . . . . . . . . . . . . . . 779.1.6 Engineering Technology Bachelor’s Degrees Awarded by Residency . . . . . . . . . . . . . . . . . . . . . . . . . . . . . . . . . . 789.1.7 Top 50 Institutions Awarding Highest Number of ET Degrees . . . . . . . . . . . . . . . . . . . . . . . . . . . . . . . . . . . . . 789.1.8 Top 50 Institutions by Engineering Technology Degrees awarded to Underrepresented Minorities . . . . . . . . . . . . . . . . . 799.1.9 Top 50 Institutions by Percentage of Engineering Technology Degrees awarded to Underrepresented Minorities . . . . . . . . . 809.1.10 Top 50 Institutions Awarding Engineering Technology Degrees to Women . . . . . . . . . . . . . . . . . . . . . . . . . . . . . . 80
9.2 ENGINEERING TECHNOLOGY ENROLLMENT, FALL 2019 . . . . . . . . . . . . . . . . . . . . . . . . . . . . . . . . . . . . . . . . 819.2.1 Full-Time Engineering Technology Enrollment by Discipline . . . . . . . . . . . . . . . . . . . . . . . . . . . . . . . . . . . . . . 819.2.2 Top 50 Institutions by Engineering Technology Enrollment . . . . . . . . . . . . . . . . . . . . . . . . . . . . . . . . . . . . . . 829.2.3 Engineering Technology Enrollment by Gender . . . . . . . . . . . . . . . . . . . . . . . . . . . . . . . . . . . . . . . . . . . . . 839.2.4 Engineering Technology Enrollment by Race and Ethnicity . . . . . . . . . . . . . . . . . . . . . . . . . . . . . . . . . . . . . . 839.2.5 Engineering Technology Enrollment by Residency . . . . . . . . . . . . . . . . . . . . . . . . . . . . . . . . . . . . . . . . . . . . 84
2

10 SURVEY DEFINITIONS 8510.1 Race/Ethnicity . . . . . . . . . . . . . . . . . . . . . . . . . . . . . . . . . . . . . . . . . . . . . . . . . . . . . . . . . . . . . . . . . . . 8510.2 Gender . . . . . . . . . . . . . . . . . . . . . . . . . . . . . . . . . . . . . . . . . . . . . . . . . . . . . . . . . . . . . . . . . . . . . . . . 85
10.2.1 Reporting Period . . . . . . . . . . . . . . . . . . . . . . . . . . . . . . . . . . . . . . . . . . . . . . . . . . . . . . . . . . . . . . 8510.3 Other Definitions . . . . . . . . . . . . . . . . . . . . . . . . . . . . . . . . . . . . . . . . . . . . . . . . . . . . . . . . . . . . . . . . . . 85
3

1 ENGINEERING IN 2019Joseph R. Roy, Ph.D.
In the fall of 2019 the ASEE began replacement of the Profiles data collection system and the Engineering Data Management System (EDMS).All aspects of the data collection process are being upgraded, including our production of the descriptive statistics of engineering and engineeringtechnology programs. The Engineering by the Numbers has been expanded this year to a dynamically linked document meant to be easier to navigate.There is also a separate section on engineering technology included as well.
For engineering disciplines there has been a 7.5% increase in 2019 for the number of engineering bachelors degrees awarded while there was a 0.4%decrease in undergraduate enrollment. For masters programs, both degrees awarded and enrollment decreased, 4.9% and 7.0% respectively. Doctoralprograms mirrored undergraduate program changes from 2018 by increasing the number of graduates (5.3%) with a small increase in enrollment (-3.0%)for 2019. The remainder of this report highlights changes this year along and some noticeable trends in the data that may be of interest to the reader.
1.1 Gender in ASEE Data CollectionsAfter consultation with the Data Task Force appointed by the Board of Directors in 2018 and 2017 as well as consultation with the Engineering DeansCouncil Data Committee, the gender categories ASEE Profiles collects were expanded to include non-binary gendered individuals and individualswith another or unknown (along with the established male and female categories). Previously, we had followed the federal government guidelines forreporting individuals who are not male or female in the headcounts collected. The guidelines require institutions report these individuals, but in thecategory of male or female, at the institutions discretion. This year, only 11 institutions reported any individuals who were non-binary gendered orother gendered. Those graduates are included in the total counts for institutions reported in the the following tables. The numbers collected this yearare too small to draw many conclusions from (for example, only 4 individuals were reported to identify as non-binary gendered in the Engineeringbachelors degrees awarded).
1.2 Representation in Engineering of Underrepresented MinoritiesThe ASEE Profiles data collection is in alignment with how the federal government collects race/ethnicity characteristics from institutions. The fulldefinition of each race/ethnicity category is included in the methodology section. The term underrepresented minority(URM) refers to three groupswhich have representation in the science and engineering workforce far below their representation in the adult US population. This includes individualswho are Hispanic, Black/African American and American Indian/Alaskan Native.
The figure below represents the percent of bachelor degrees in engineering awarded to URM graduates over the last 8 years. The percent of Hispanicgraduates has increased from 8.5% in 2011 to 11.9% in 2019 with a steady increase in the intervening years. The percent of Black graduates, however,has not increased over the same time span with 4.2% in 2011 and 4.3 % in 2019 and no growth upward in the data. There has been a steady decline inthe percent of American Indian/Alaskan Natives from 0.5% in 2011 to 0.3 % in 2019.
0.0%
2.5%
5.0%
7.5%
10.0%
12.5%
2011 2012 2013 2014 2015 2016 2017 2018 2019Year
Per
cent
Race/Ethnicity African American/Black American Indian/Alaskan Native Hispanic
Percent of Total Bachelor's Degrees Awarded
1.3 International Students in EngineeringThe data below represent the percent of international graduates within engineering since 2011. There is a slight trend upward in the Masters graduatesfor engineering, but generally the last 8 years have looked remarkably similar with the respect of the amount of international students graduatingfrom US Engineering programs. The gap, however, between undergraduate and graduate engineering talent production is very large. The majority ofMasters students and Doctoral students graduating with degrees in engineering have been international students.
We expanded the race/ethnicity category for faculty to include non-resident aliens this year. In 2019, 1.9 % of engineering tenure-track faculty werecomprised of non-resident aliens. The most recent recent year we have data for all faculty at 4-year institutions, 2018, showed that non-residentaliens comprised 4.4 % of all tenure-track faculty. This may be surprising given the large number of international doctorates in engineering. However,this could be an artifact of the difference between students and faculty: Most international students are on some type of temporary visa in the USwhich means they would appear in institutional data collections, such as this one, that asks to separate out the temporary residents from the otherrace/ethnicity categories. Most tenure-track positions are not temporary and, in fact, the expectation generally would be an institution would sponsora more permanent residency (i.e. green card) for such faculty members. Therefore, those individuals would be reported under the race/ethnicitycategory they selected upon initial hire and not as a temporary resident.
4

0%
10%
20%
30%
40%
50%
60%
2011 2012 2013 2014 2015 2016 2017 2018 2019Year
Per
cent
of T
otal
US
Eng
. Gra
duat
es
Degree Type Doctoral Masters Bachelors
Percentage of Degrees Awarded to International Graduates
1.4 Faculty to Student RatiosThe listing of the institutions with the highest and lowest bachelor degree recipients to tenured/tenure track faculty ratios has been removed from thetables that follow. While this is an important measure for building peer group analysis for institutions, the measure itself becomes complicated by theincrease of the amount of teaching professional track faculty which are not included in this measure, but in some instances make up a majority ofinstructional faculty at an institution. As of 2018, the most recent year for which there is data, there are currently 681,848 full-time instructionalfaculty at four-year institutions, and professional (non-tenure) track faculty make up 261,307 of those positions.
0
10
20
30
40
Small Medium LargeProgram Size
Rat
io
Program Size Small Medium Large
Ratio of Bachelor's Degrees to Tenured/Tenure Track Faculty
In the figure above, we remove institutions awarding less than 50 bachelors degrees, which leaves a total of 257 institutions. We categorize institutionsas small programs with 400 or less graduates, medium programs with between 400 and 1000 graduates and then over 1000 graduates as a large program.We can see the distribution in the violin plot with a traditional box-plot situated within each violin of the data. The violins represent the mass of thedata (we can see the widest part occurs at the median for each program size). The trend is that larger programs have larger ratios, unsurprisingly, butthere are some institutional exceptions seen in the black dots, at the high and low end of the distribution.
Joseph Roy is Director, Institutional Research & Analytics at the American Society for Engineering Education. He can be reached at [email protected]
5

2 ENGINEERING BACHELORS2.1 ENGINEERING BACHELOR’S DEGREES2.1.1 Total Bachelor’s Degrees Awarded by Engineering Discipline
Table 1: Bachelors Degrees by Discipline: 144,818*
Discipline Name Degrees AwardedMechanical 35,094Computer Sci. (inside Eng.) 19,963Electrical 14,221Civil 13,774Chemical 11,148Other 9,472Computer Sci. (outside Engr.) 9,394Computer 7,493Biomedical 7,328Industrial/Manufacturing/Systems 6,800Aerospace 4,533Electrical/Computer 2,939Engineering (General) 2,252Metallurgical and Matrls. 2,083Petroleum 1,563Biological and Agricultural 1,406Envr. Eng 1,231Civil/Environmental 935Engr. Science and Engr. Physics 831Architectural 658Nuclear 489Engineering Management 438Mining 167* Total does not include computer science (outsideengineering).
35,094
19,963
14,22113,774
11,1489,472 9,394
7,493 7,328 6,800
4,5332,939 2,252 2,083 1,563 1,406 1,231 935 831 658 489 438 167
0
10,000
20,000
30,000
Mec
hani
cal
Com
pute
r Sci
. (in
side
Eng
.)E
lect
rical
Civ
ilC
hem
ical
Oth
er
Com
pute
r Sci
. (ou
tsid
e E
ngr.)
Com
pute
rB
iom
edic
al
Indu
stria
l/Man
ufac
turin
g/S
yste
ms
Aer
ospa
ceE
lect
rical
/Com
pute
rE
ngin
eerin
g (G
ener
al)
Met
allu
rgic
al a
nd M
atrls
.P
etro
leum
Bio
logi
cal a
nd A
gric
ultu
ral
Env
r. E
ngC
ivil/
Env
ironm
enta
l
Eng
r. S
cien
ce a
nd E
ngr.
Phy
sics
Arc
hite
ctur
alN
ucle
ar
Eng
inee
ring
Man
agem
ent
Min
ing
Bachelor's Degrees Awarded by Engineering Discipline
6
2.1.2 Total Bachelor’s Degrees Awarded to Underrepresented Minorities by Engineering Discipline
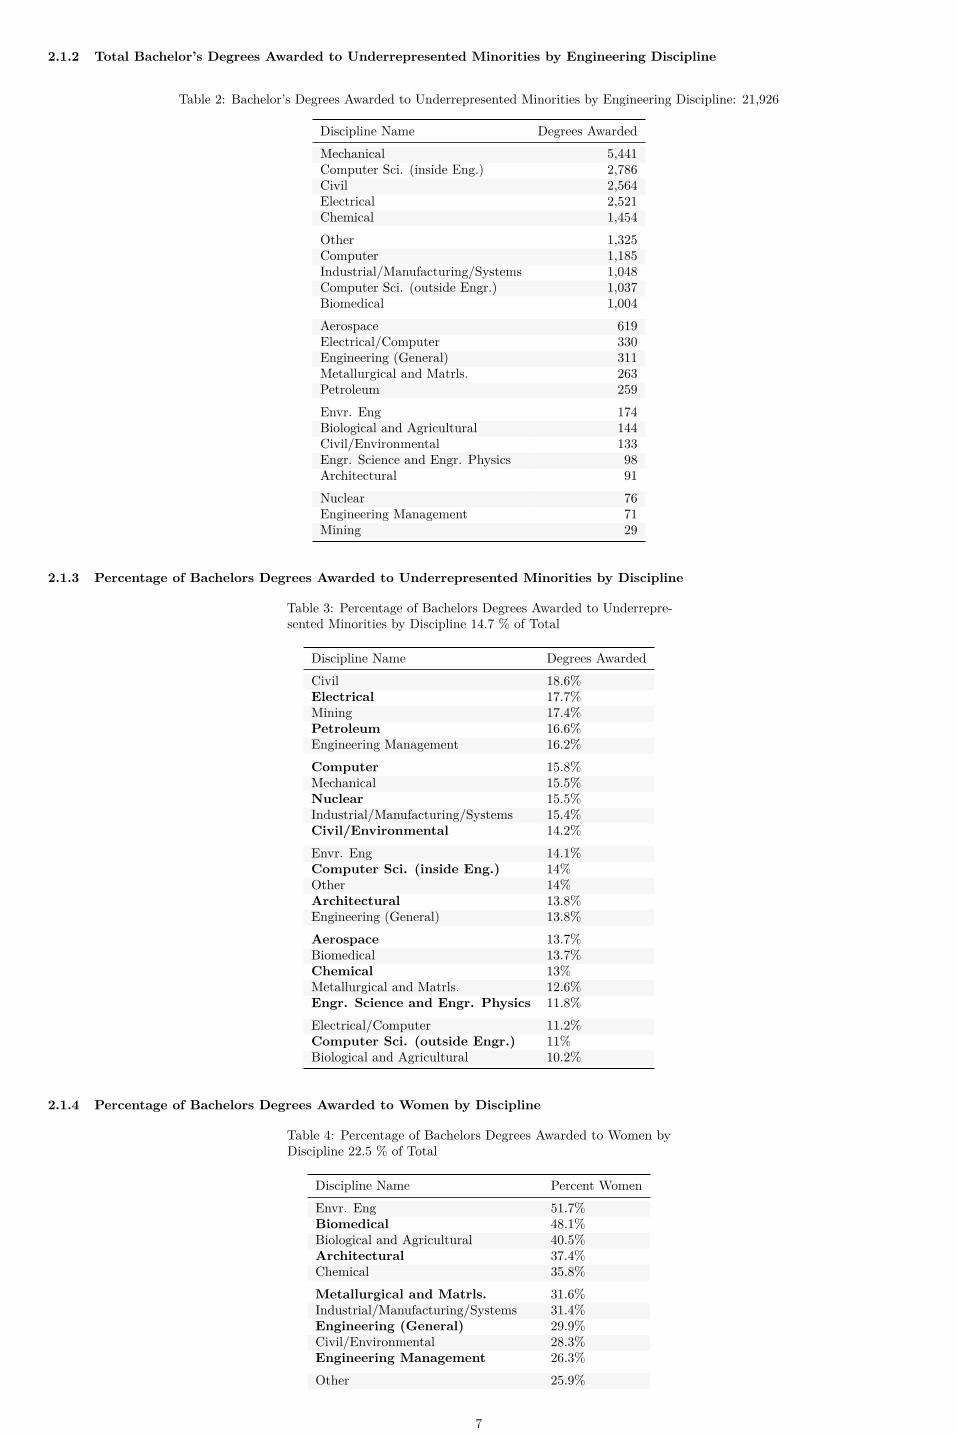
Table 2: Bachelor’s Degrees Awarded to Underrepresented Minorities by Engineering Discipline: 21,926
Discipline Name Degrees AwardedMechanical 5,441Computer Sci. (inside Eng.) 2,786Civil 2,564Electrical 2,521Chemical 1,454Other 1,325Computer 1,185Industrial/Manufacturing/Systems 1,048Computer Sci. (outside Engr.) 1,037Biomedical 1,004Aerospace 619Electrical/Computer 330Engineering (General) 311Metallurgical and Matrls. 263Petroleum 259Envr. Eng 174Biological and Agricultural 144Civil/Environmental 133Engr. Science and Engr. Physics 98Architectural 91Nuclear 76Engineering Management 71Mining 29
2.1.3 Percentage of Bachelors Degrees Awarded to Underrepresented Minorities by Discipline
Table 3: Percentage of Bachelors Degrees Awarded to Underrepre-sented Minorities by Discipline 14.7 % of Total
Discipline Name Degrees AwardedCivil 18.6%Electrical 17.7%Mining 17.4%Petroleum 16.6%Engineering Management 16.2%Computer 15.8%Mechanical 15.5%Nuclear 15.5%Industrial/Manufacturing/Systems 15.4%Civil/Environmental 14.2%Envr. Eng 14.1%Computer Sci. (inside Eng.) 14%Other 14%Architectural 13.8%Engineering (General) 13.8%Aerospace 13.7%Biomedical 13.7%Chemical 13%Metallurgical and Matrls. 12.6%Engr. Science and Engr. Physics 11.8%Electrical/Computer 11.2%Computer Sci. (outside Engr.) 11%Biological and Agricultural 10.2%
2.1.4 Percentage of Bachelors Degrees Awarded to Women by Discipline
Table 4: Percentage of Bachelors Degrees Awarded to Women byDiscipline 22.5 % of Total
Discipline Name Percent WomenEnvr. Eng 51.7%Biomedical 48.1%Biological and Agricultural 40.5%Architectural 37.4%Chemical 35.8%Metallurgical and Matrls. 31.6%Industrial/Manufacturing/Systems 31.4%Engineering (General) 29.9%Civil/Environmental 28.3%Engineering Management 26.3%Other 25.9%
7
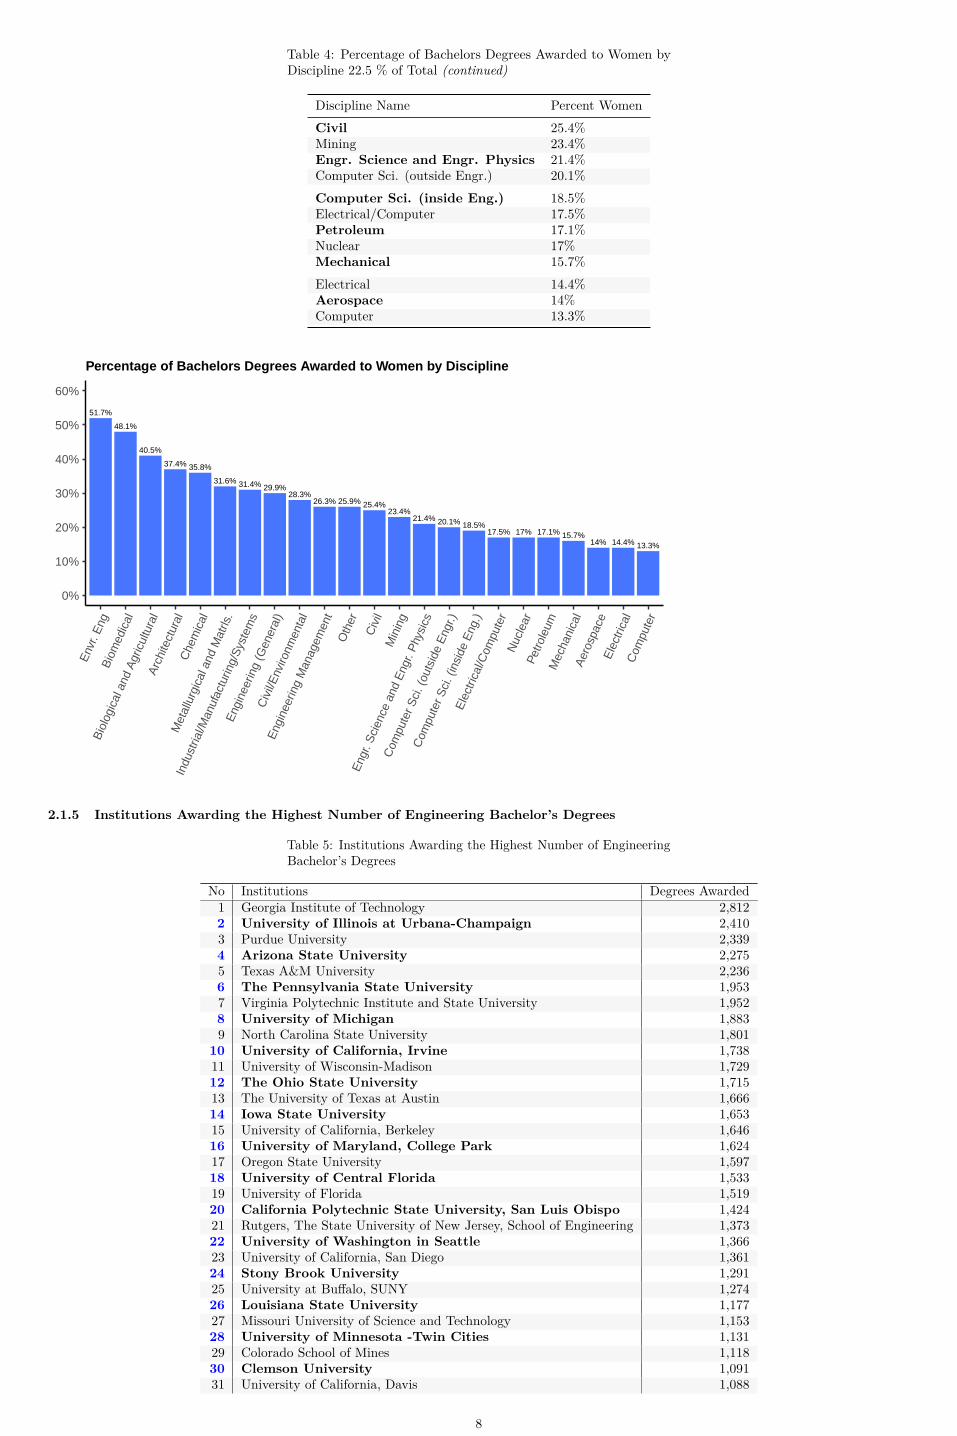
Table 4: Percentage of Bachelors Degrees Awarded to Women byDiscipline 22.5 % of Total (continued)
Discipline Name Percent WomenCivil 25.4%Mining 23.4%Engr. Science and Engr. Physics 21.4%Computer Sci. (outside Engr.) 20.1%Computer Sci. (inside Eng.) 18.5%Electrical/Computer 17.5%Petroleum 17.1%Nuclear 17%Mechanical 15.7%Electrical 14.4%Aerospace 14%Computer 13.3%
51.7%
48.1%
40.5%
37.4% 35.8%
31.6% 31.4% 29.9%28.3%
26.3% 25.9% 25.4%23.4%
21.4% 20.1% 18.5%17.5% 17.1%17% 15.7%
14.4%14% 13.3%
0%
10%
20%
30%
40%
50%
60%
Env
r. E
ngB
iom
edic
al
Bio
logi
cal a
nd A
gric
ultu
ral
Arc
hite
ctur
alC
hem
ical
Met
allu
rgic
al a
nd M
atrls
.
Indu
stria
l/Man
ufac
turin
g/S
yste
ms
Eng
inee
ring
(Gen
eral
)C
ivil/
Env
ironm
enta
l
Eng
inee
ring
Man
agem
ent
Oth
erC
ivil
Min
ing
Eng
r. S
cien
ce a
nd E
ngr.
Phy
sics
Com
pute
r Sci
. (ou
tsid
e E
ngr.)
Com
pute
r Sci
. (in
side
Eng
.)
Ele
ctric
al/C
ompu
ter
Nuc
lear
Petro
leum
Mec
hani
cal
Aer
ospa
ceE
lect
rical
Com
pute
r
Percentage of Bachelors Degrees Awarded to Women by Discipline
2.1.5 Institutions Awarding the Highest Number of Engineering Bachelor’s Degrees
Table 5: Institutions Awarding the Highest Number of EngineeringBachelor’s Degrees
No Institutions Degrees Awarded1 Georgia Institute of Technology 2,8122 University of Illinois at Urbana-Champaign 2,4103 Purdue University 2,3394 Arizona State University 2,2755 Texas A&M University 2,2366 The Pennsylvania State University 1,9537 Virginia Polytechnic Institute and State University 1,9528 University of Michigan 1,8839 North Carolina State University 1,801
10 University of California, Irvine 1,73811 University of Wisconsin-Madison 1,72912 The Ohio State University 1,71513 The University of Texas at Austin 1,66614 Iowa State University 1,65315 University of California, Berkeley 1,64616 University of Maryland, College Park 1,62417 Oregon State University 1,59718 University of Central Florida 1,53319 University of Florida 1,51920 California Polytechnic State University, San Luis Obispo 1,42421 Rutgers, The State University of New Jersey, School of Engineering 1,37322 University of Washington in Seattle 1,36623 University of California, San Diego 1,36124 Stony Brook University 1,29125 University at Buffalo, SUNY 1,27426 Louisiana State University 1,17727 Missouri University of Science and Technology 1,15328 University of Minnesota -Twin Cities 1,13129 Colorado School of Mines 1,11830 Clemson University 1,09131 University of California, Davis 1,088
8

Table 5: Institutions Awarding the Highest Number of EngineeringBachelor’s Degrees (continued)
No Institutions Degrees Awarded32 Florida International University 1,08433 Michigan State University 1,07234 Northeastern University 1,07135 New Jersey Institute of Technology 1,06236 University of Colorado Boulder 1,04737 Texas Tech University 1,02638 George Mason University 99338 The University of Texas at Dallas 99340 The University of Alabama 98841 San Jose State University 98042 California State University, Long Beach 97043 Rensselaer Polytechnic Institute 96644 University of Houston 94945 Auburn University 94446 University of Pittsburgh 93547 University of South Florida 92948 Brigham Young University 90249 Drexel University 89150 University of California, Los Angeles 888* 422 Institutions included
2.1.6 Bachelor’s Degrees Awarded by Gender
Table 6: Bachelor’s Degrees Awarded by Gender
Gender 2010 2011 2012 2013 2014 2015 2016 2017 2018 2019Female 17.80% 18.10% 18.40% 18.90% 19.10% 19.90% 20.90% 21.30% 21.90% 22.50%Male 82.20% 81.90% 81.60% 81.10% 80.90% 80.10% 79.10% 78.70% 78.10% 77.50%
77.5%
22.5%
0%
10%
20%
30%
40%
50%
60%
70%
80%
90%
100%
Mal
e
Fem
ale
Bachelor's Degrees Awarded by Gender
2.1.7 Bachelor’s Degrees Awarded by Race and Ethnicity
Table 7: Bachelor’s Degrees Awarded by Ethnicity
Ethnicity 2011 2012 2013 2014 2015 2016 2017 2018 2019Black or Afr. American 4.2% 4.2% 4.3% 3.5% 4.0% 3.9% 4.1% 4.2% 4.4%Hispanic 8.5% 9.0% 9.3% 10.1% 10.7% 10.7% 11.1% 11.4% 12.1%Other 1.6% 2.0% 2.3% 2.9% 3.1% 3.6% 3.8% 3.5% 4.3%Asian American 12.2% 12.2% 12.9% 13.1% 13.4% 14.2% 14.6% 14.7% 14.7%White 66.6% 66.2% 65.7% 65.9% 64.9% 63.4% 62.3% 61.5% 60.7%Unknown 6.9% 6.5% 5.6% 4.5% 3.9% 4.2% 4.1% 4.2% 3.8%
*Data on ethnicity does not include foreign nationals. American Indian/Alaska Native (0.4%), Native Hawaiian/Other Pacfic Islander(0.2%) andMultiracial (3.7%) are combined under Other.
9

4.4%
12.1%
4.3%
14.7%
60.7%
3.8%
0%
10%
20%
30%
40%
50%
60%
70%
80%
90%
100%B
lack
or A
fr. A
mer
ican
His
pani
c
Oth
er
Asi
an A
mer
ican
Whi
te
Unk
now
n
Bachelors Degrees Awarded by Race and Ethnicity
2.1.8 Bachelor’s Degrees Awarded by Residency
Table 8: Bachelor’s Degrees Awarded by Residency
Nationality 2010 2011 2012 2013 2014 2015 2016 2017 2018 2019Foreign 6.2% 6.2% 6.7% 7.5% 7.8% 8.5% 9.1% 9.6% 10.1% 11.1%Domestic 94.0% 93.8% 93.3% 92.5% 92.2% 91.5% 90.9% 90.4% 89.9% 88.9%
11.1%
88.9%
0%
10%
20%
30%
40%
50%
60%
70%
80%
90%
100%
Dom
estic
Fore
ign
Bachelor's Degrees Awarded by Residency
10
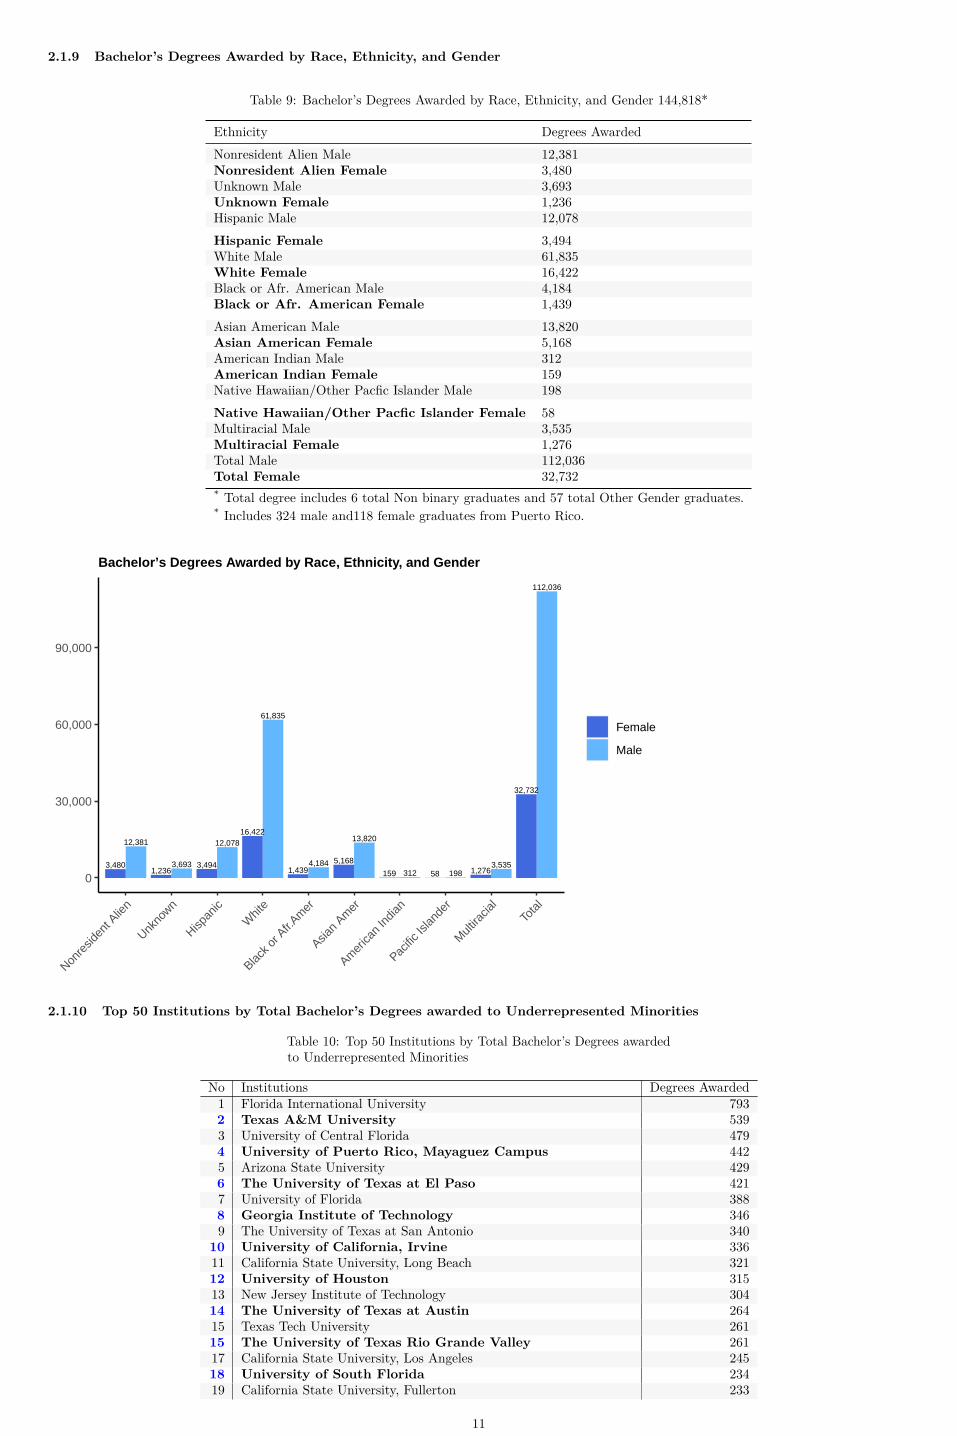
2.1.9 Bachelor’s Degrees Awarded by Race, Ethnicity, and Gender
Table 9: Bachelor’s Degrees Awarded by Race, Ethnicity, and Gender 144,818*
Ethnicity Degrees AwardedNonresident Alien Male 12,381Nonresident Alien Female 3,480Unknown Male 3,693Unknown Female 1,236Hispanic Male 12,078Hispanic Female 3,494White Male 61,835White Female 16,422Black or Afr. American Male 4,184Black or Afr. American Female 1,439Asian American Male 13,820Asian American Female 5,168American Indian Male 312American Indian Female 159Native Hawaiian/Other Pacfic Islander Male 198Native Hawaiian/Other Pacfic Islander Female 58Multiracial Male 3,535Multiracial Female 1,276Total Male 112,036Total Female 32,732* Total degree includes 6 total Non binary graduates and 57 total Other Gender graduates.* Includes 324 male and118 female graduates from Puerto Rico.
12,381
3,480 3,6931,236
12,078
3,494
61,835
16,422
4,1841,439
13,820
5,168
312159 198583,535
1,276
112,036
32,732
0
30,000
60,000
90,000
Nonre
siden
t Alie
n
Unkno
wn
Hispan
ic
Whit
e
Black o
r Afr.
Amer
Asian
Amer
Amer
ican
India
n
Pacific
Islan
der
Mult
iracia
lTo
tal
Female
Male
Bachelor’s Degrees Awarded by Race, Ethnicity, and Gender
2.1.10 Top 50 Institutions by Total Bachelor’s Degrees awarded to Underrepresented Minorities
Table 10: Top 50 Institutions by Total Bachelor’s Degrees awardedto Underrepresented Minorities
No Institutions Degrees Awarded1 Florida International University 7932 Texas A&M University 5393 University of Central Florida 4794 University of Puerto Rico, Mayaguez Campus 4425 Arizona State University 4296 The University of Texas at El Paso 4217 University of Florida 3888 Georgia Institute of Technology 3469 The University of Texas at San Antonio 340
10 University of California, Irvine 33611 California State University, Long Beach 32112 University of Houston 31513 New Jersey Institute of Technology 30414 The University of Texas at Austin 26415 Texas Tech University 26115 The University of Texas Rio Grande Valley 26117 California State University, Los Angeles 24518 University of South Florida 23419 California State University, Fullerton 233
11

Table 10: Top 50 Institutions by Total Bachelor’s Degrees awardedto Underrepresented Minorities (continued)
No Institutions Degrees Awarded20 California State University, Northridge 21620 University of Maryland, College Park 21622 California Polytechnic State University, San Luis Obispo 21523 University of Wisconsin-Madison 21324 San Jose State University 20925 San Diego State University 19826 The University of Texas at Arlington 19427 George Mason University 19327 Texas A&M University - Kingsville 19327 The University of Texas at Dallas 19330 University of Illinois at Chicago 19231 University of Arizona 19032 Florida Atlantic University 17933 California State University, Sacramento 17533 North Carolina State University 17535 Rutgers, The State University of New Jersey, School of Engineering 17436 City College of the City University of New York 16737 FAMU-FSU College of Engineering 16538 Stanford University 16439 University of Illinois at Urbana-Champaign 16140 Massachusetts Institute of Technology 16040 North Carolina A&T State University 16040 University of California, Davis 16043 University of Maryland, Baltimore County 15744 Kennesaw State University 15345 The University of New Mexico 14746 University of California-Santa Cruz 14646 Virginia Polytechnic Institute and State University 14648 Stony Brook University 14349 Prairie View A & M University 14050 University at Buffalo, SUNY 139* 422 Institutions included
2.1.11 Top 50 Institutions by Total Bachelor’s Degrees awarded to Women
Table 11: Top 50 Institutions by Total Bachelor’s Degrees awardedto Women
No Institutions Degrees Awarded1 Georgia Institute of Technology 8312 Purdue University 5693 Texas A&M University 5234 University of Michigan 4945 University of Illinois at Urbana-Champaign 4826 North Carolina State University 4687 University of California, Irvine 4428 Virginia Polytechnic Institute and State University 4329 University of California, Berkeley 431
10 The Pennsylvania State University 43011 The University of Texas at Austin 42112 Arizona State University 41913 University of Washington in Seattle 41314 The Ohio State University 40615 University of Florida 39816 Massachusetts Institute of Technology 38817 Cornell University 37018 California Polytechnic State University, San Luis Obispo 36619 University of Wisconsin-Madison 35920 University at Buffalo, SUNY 34721 Colorado School of Mines 33221 Stony Brook University 33223 Rutgers, The State University of New Jersey, School of Engineering 33024 University of California, San Diego 32125 University of California, Davis 31825 University of Maryland, College Park 31827 Oregon State University 31328 Stanford University 31029 Northeastern University 29330 University of Virginia 29231 Worcester Polytechnic Institute 28232 Rensselaer Polytechnic Institute 28133 Iowa State University 27133 University of Minnesota -Twin Cities 27135 Louisiana State University 25636 Michigan State University 25337 The University of Alabama 25238 Clemson University 25139 University of Colorado Boulder 24740 University of Pittsburgh 24641 University of Central Florida 245
12

Table 11: Top 50 Institutions by Total Bachelor’s Degrees awardedto Women (continued)
No Institutions Degrees Awarded42 George Mason University 23443 Carnegie Mellon University 23344 University of Southern California 22845 University of Houston 22646 Missouri University of Science and Technology 21847 University of Oklahoma, Gallogly College of Engineering 21548 Florida International University 21349 Boston University 21149 New Jersey Institute of Technology 211* 422 Institutions included
2.1.12 Top 50 Institutions by Percentage of Bachelor’s Degrees awarded to Underrepresented Minorities
Table 12: Top 50 Institutions by Percentage of Bachelor’s Degreesawarded to Underrepresented Minorities
No Institutions Percent Underrepresented Minorities1 Bethune-Cookman University 100%1 Central State University 100%1 Hampton University 100%1 Navajo Technical University 100%1 Texas A & M International University 100%1 University of Puerto Rico, Mayaguez Campus 100%7 Southern University and A & M College 96.2%8 Virginia State University 95.2%9 Alabama A & M University 94%
10 Norfolk State University 89.5%11 The University of Texas Rio Grande Valley 83.4%12 Prairie View A & M University 81.4%13 Jackson State University 80%14 Florida International University 73.2%15 The University of Texas at El Paso 71.6%16 North Carolina A&T State University 66.4%17 California State University-San Bernardino 62.5%18 Texas A&M University - Kingsville 61.3%19 The University of Texas of the Permian Basin 56%20 Tuskegee University 55.8%21 California State University, Los Angeles 55.2%22 The University of Texas at San Antonio 53%23 Morgan State University 51.2%24 Andrews University 50%25 Howard University 47.2%26 Fort Lewis College 46.7%27 Texas A & M University-Corpus Christi 46.3%28 California State University-Bakersfield 45%29 The University of New Mexico 44.3%30 Texas State University 43.9%31 Florida Atlantic University 43.3%32 University of California, Merced 41.6%33 West Texas A & M University 41.5%34 University of Maryland Eastern Shore 40.9%35 St. Mary’s University 39.6%36 Texas A & M University-Commerce 39.4%37 Pennsylvania State University-Penn State Hazleton 37.5%38 Frostburg State University 37.2%39 The University of Texas at Tyler 36.9%40 Tennessee State University 36.4%41 Lamar University 35.6%42 Colorado State University-Pueblo 33.3%42 Muskingum University 33.3%44 University of Houston 33.2%45 California State University, Long Beach 33.1%46 New Mexico Institute of Mining and Technology 31.9%47 California State University, Northridge 31.9%48 University of Massachusetts-Boston 31.8%49 College of Staten Island CUNY 31.7%50 University of Central Florida 31.2%* 422 Institutions included
2.1.13 Top 20 Institutions by Percentage of Bachelor’s Degrees awarded to Women
Table 13: Top 20 Institutions by Percentage of Bachelor’s Degreesawarded to Women
No Institutions Percent Women1 Smith College 100%1 Sweet Briar College 100%3 Hampton University 57.1%4 The George Washington University 52.6%
13

Table 13: Top 20 Institutions by Percentage of Bachelor’s Degreesawarded to Women (continued)
No Institutions Percent Women5 Loras College 50%5 Navajo Technical University 50%7 Brown University 46.6%8 Massachusetts Institute of Technology 46.2%9 Tulane University 45%
10 University of North Carolina at Chapel Hill 44.2%11 Harvey Mudd College 43.4%12 California Institute of Technology 43.2%13 Cornell University 42.9%14 SUNY College of Environmental Science and Forestry 41.6%15 Columbia University 39.9%16 Stanford University 39.6%17 Southern Methodist University 38.4%18 Dartmouth College 37.6%19 Trinity College 37.5%20 Princeton University 36.9%* 422 Institutions included
2.1.14 Top 20 Institutions by Total Bachelor’s Degrees awarded to African Americans
Table 14: Top 20 Institutions by Total Bachelor’s Degrees awardedto African Americans
No Institutions Degrees Awarded1 Georgia Institute of Technology 1532 North Carolina A&T State University 1503 University of Maryland, Baltimore County 1174 Prairie View A & M University 1165 University of Maryland, College Park 1096 Florida International University 977 Morgan State University 948 University of Central Florida 939 New Jersey Institute of Technology 90
10 Kennesaw State University 8711 George Mason University 8412 Florida Atlantic University 6613 City College of the City University of New York 6414 Jackson State University 6315 Alabama A & M University 6215 Georgia Southern University 6215 Mississippi State University 6218 Texas Tech University 6119 Howard University 6019 University of South Carolina 60* 422 Institutions included
2.1.15 Top 20 Institutions by Total Bachelor’s Degrees awarded to Asian Americans
Table 15: Top 20 Institutions by Total Bachelor’s Degrees awardedto Asian Americans
No Institutions Degrees Awarded1 University of California, Berkeley 9022 University of California, Irvine 7503 Georgia Institute of Technology 6654 The University of Texas at Austin 5915 University of Illinois at Urbana-Champaign 5906 University of California, San Diego 5207 Rutgers, The State University of New Jersey, School of Engineering 4808 San Jose State University 4279 Stony Brook University 4129 University of Maryland, College Park 41211 University of California, Davis 39612 University of Washington in Seattle 37613 University of California, Los Angeles 37514 University of Michigan 35815 University of California-Santa Cruz 32016 George Mason University 31117 Purdue University 29518 The University of Texas at Dallas 29419 California State University, Long Beach 28820 Texas A&M University 267* 422 Institutions included
14
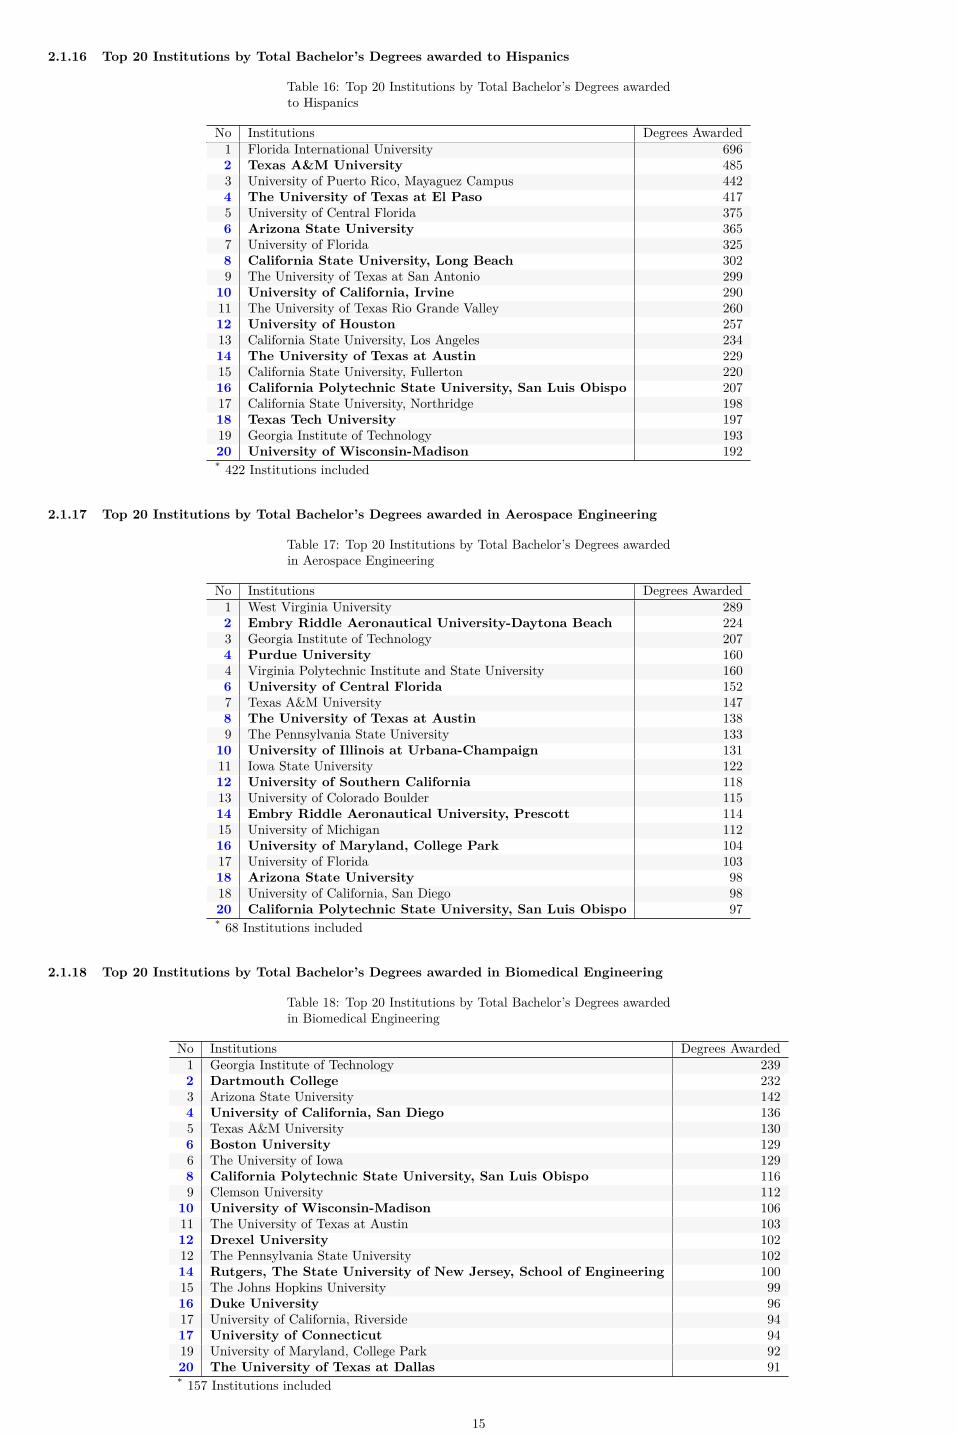
2.1.16 Top 20 Institutions by Total Bachelor’s Degrees awarded to Hispanics
Table 16: Top 20 Institutions by Total Bachelor’s Degrees awardedto Hispanics
No Institutions Degrees Awarded1 Florida International University 6962 Texas A&M University 4853 University of Puerto Rico, Mayaguez Campus 4424 The University of Texas at El Paso 4175 University of Central Florida 3756 Arizona State University 3657 University of Florida 3258 California State University, Long Beach 3029 The University of Texas at San Antonio 299
10 University of California, Irvine 29011 The University of Texas Rio Grande Valley 26012 University of Houston 25713 California State University, Los Angeles 23414 The University of Texas at Austin 22915 California State University, Fullerton 22016 California Polytechnic State University, San Luis Obispo 20717 California State University, Northridge 19818 Texas Tech University 19719 Georgia Institute of Technology 19320 University of Wisconsin-Madison 192* 422 Institutions included
2.1.17 Top 20 Institutions by Total Bachelor’s Degrees awarded in Aerospace Engineering
Table 17: Top 20 Institutions by Total Bachelor’s Degrees awardedin Aerospace Engineering
No Institutions Degrees Awarded1 West Virginia University 2892 Embry Riddle Aeronautical University-Daytona Beach 2243 Georgia Institute of Technology 2074 Purdue University 1604 Virginia Polytechnic Institute and State University 1606 University of Central Florida 1527 Texas A&M University 1478 The University of Texas at Austin 1389 The Pennsylvania State University 133
10 University of Illinois at Urbana-Champaign 13111 Iowa State University 12212 University of Southern California 11813 University of Colorado Boulder 11514 Embry Riddle Aeronautical University, Prescott 11415 University of Michigan 11216 University of Maryland, College Park 10417 University of Florida 10318 Arizona State University 9818 University of California, San Diego 9820 California Polytechnic State University, San Luis Obispo 97* 68 Institutions included
2.1.18 Top 20 Institutions by Total Bachelor’s Degrees awarded in Biomedical Engineering
Table 18: Top 20 Institutions by Total Bachelor’s Degrees awardedin Biomedical Engineering
No Institutions Degrees Awarded1 Georgia Institute of Technology 2392 Dartmouth College 2323 Arizona State University 1424 University of California, San Diego 1365 Texas A&M University 1306 Boston University 1296 The University of Iowa 1298 California Polytechnic State University, San Luis Obispo 1169 Clemson University 112
10 University of Wisconsin-Madison 10611 The University of Texas at Austin 10312 Drexel University 10212 The Pennsylvania State University 10214 Rutgers, The State University of New Jersey, School of Engineering 10015 The Johns Hopkins University 9916 Duke University 9617 University of California, Riverside 9417 University of Connecticut 9419 University of Maryland, College Park 9220 The University of Texas at Dallas 91* 157 Institutions included
15
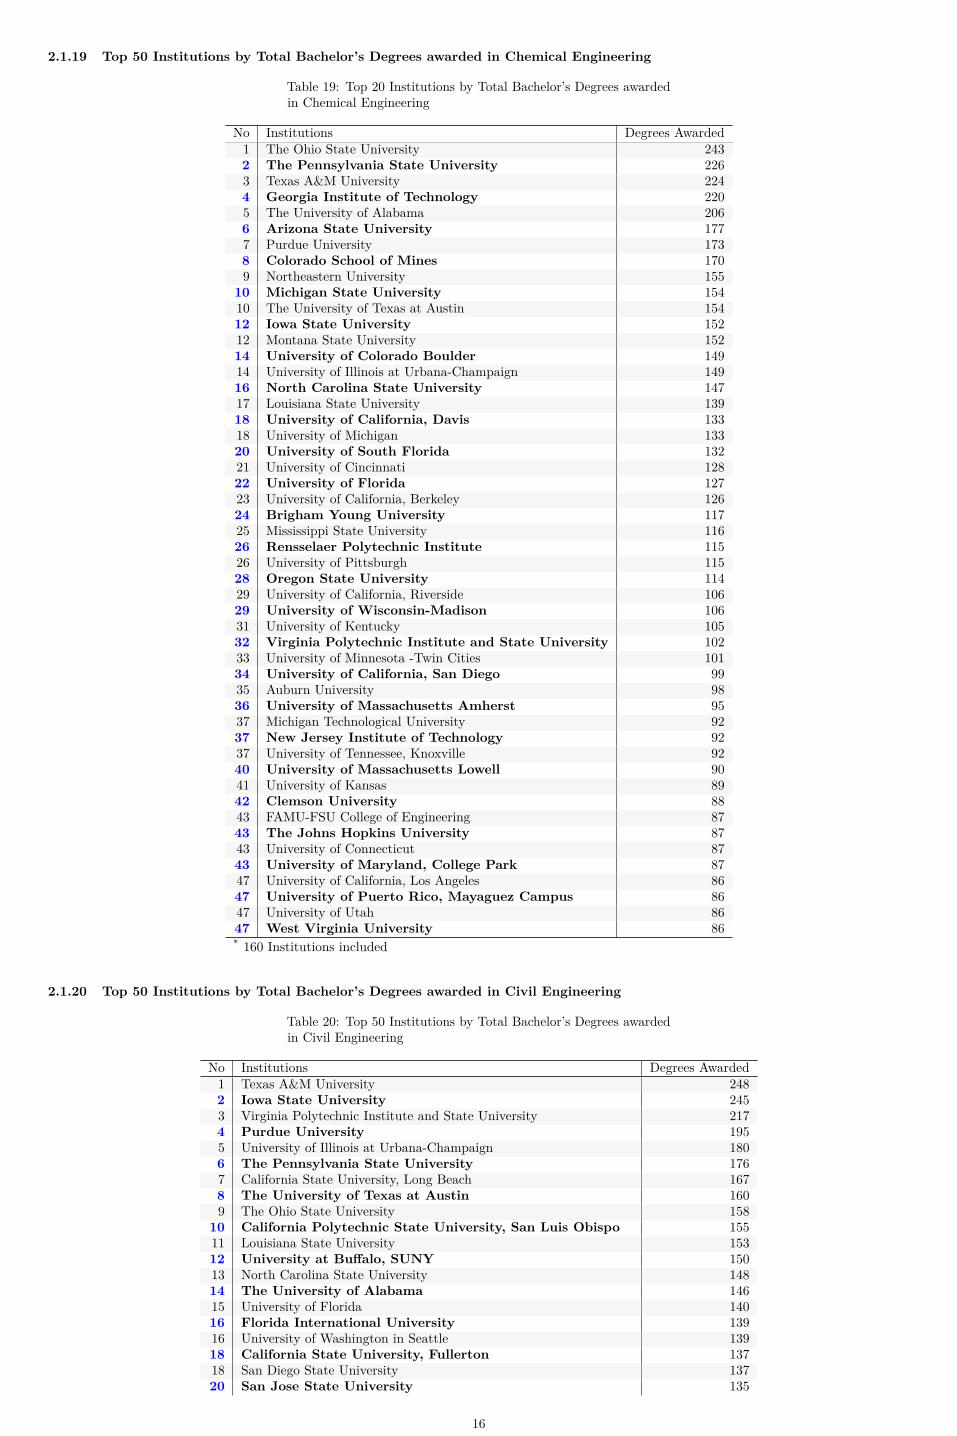
2.1.19 Top 50 Institutions by Total Bachelor’s Degrees awarded in Chemical Engineering
Table 19: Top 20 Institutions by Total Bachelor’s Degrees awardedin Chemical Engineering
No Institutions Degrees Awarded1 The Ohio State University 2432 The Pennsylvania State University 2263 Texas A&M University 2244 Georgia Institute of Technology 2205 The University of Alabama 2066 Arizona State University 1777 Purdue University 1738 Colorado School of Mines 1709 Northeastern University 155
10 Michigan State University 15410 The University of Texas at Austin 15412 Iowa State University 15212 Montana State University 15214 University of Colorado Boulder 14914 University of Illinois at Urbana-Champaign 14916 North Carolina State University 14717 Louisiana State University 13918 University of California, Davis 13318 University of Michigan 13320 University of South Florida 13221 University of Cincinnati 12822 University of Florida 12723 University of California, Berkeley 12624 Brigham Young University 11725 Mississippi State University 11626 Rensselaer Polytechnic Institute 11526 University of Pittsburgh 11528 Oregon State University 11429 University of California, Riverside 10629 University of Wisconsin-Madison 10631 University of Kentucky 10532 Virginia Polytechnic Institute and State University 10233 University of Minnesota -Twin Cities 10134 University of California, San Diego 9935 Auburn University 9836 University of Massachusetts Amherst 9537 Michigan Technological University 9237 New Jersey Institute of Technology 9237 University of Tennessee, Knoxville 9240 University of Massachusetts Lowell 9041 University of Kansas 8942 Clemson University 8843 FAMU-FSU College of Engineering 8743 The Johns Hopkins University 8743 University of Connecticut 8743 University of Maryland, College Park 8747 University of California, Los Angeles 8647 University of Puerto Rico, Mayaguez Campus 8647 University of Utah 8647 West Virginia University 86* 160 Institutions included
2.1.20 Top 50 Institutions by Total Bachelor’s Degrees awarded in Civil Engineering
Table 20: Top 50 Institutions by Total Bachelor’s Degrees awardedin Civil Engineering
No Institutions Degrees Awarded1 Texas A&M University 2482 Iowa State University 2453 Virginia Polytechnic Institute and State University 2174 Purdue University 1955 University of Illinois at Urbana-Champaign 1806 The Pennsylvania State University 1767 California State University, Long Beach 1678 The University of Texas at Austin 1609 The Ohio State University 158
10 California Polytechnic State University, San Luis Obispo 15511 Louisiana State University 15312 University at Buffalo, SUNY 15013 North Carolina State University 14814 The University of Alabama 14615 University of Florida 14016 Florida International University 13916 University of Washington in Seattle 13918 California State University, Fullerton 13718 San Diego State University 13720 San Jose State University 135
16
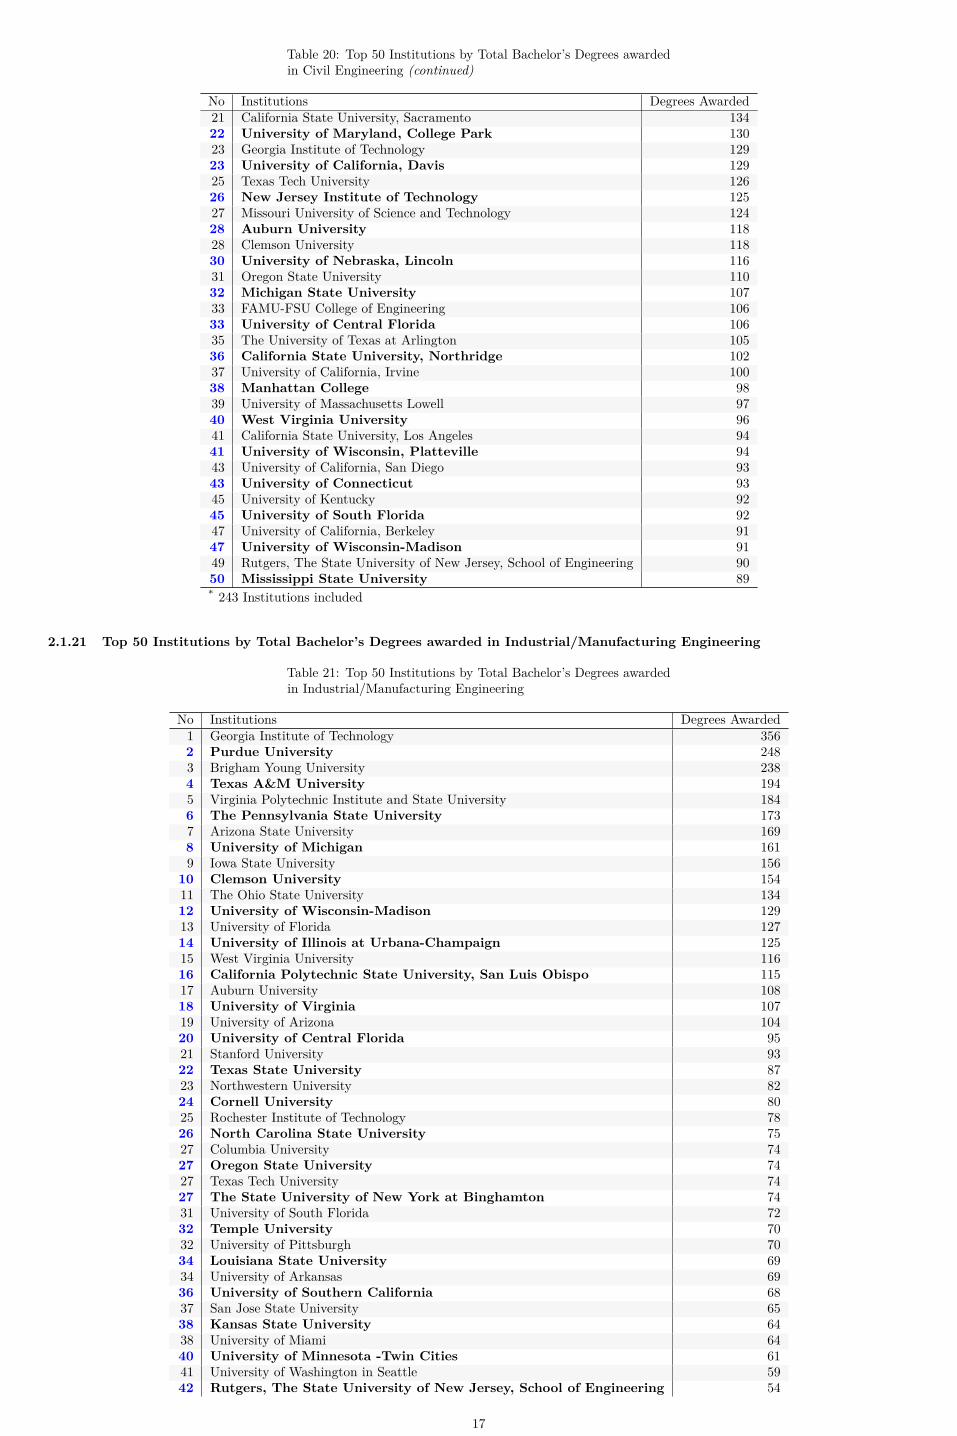
Table 20: Top 50 Institutions by Total Bachelor’s Degrees awardedin Civil Engineering (continued)
No Institutions Degrees Awarded21 California State University, Sacramento 13422 University of Maryland, College Park 13023 Georgia Institute of Technology 12923 University of California, Davis 12925 Texas Tech University 12626 New Jersey Institute of Technology 12527 Missouri University of Science and Technology 12428 Auburn University 11828 Clemson University 11830 University of Nebraska, Lincoln 11631 Oregon State University 11032 Michigan State University 10733 FAMU-FSU College of Engineering 10633 University of Central Florida 10635 The University of Texas at Arlington 10536 California State University, Northridge 10237 University of California, Irvine 10038 Manhattan College 9839 University of Massachusetts Lowell 9740 West Virginia University 9641 California State University, Los Angeles 9441 University of Wisconsin, Platteville 9443 University of California, San Diego 9343 University of Connecticut 9345 University of Kentucky 9245 University of South Florida 9247 University of California, Berkeley 9147 University of Wisconsin-Madison 9149 Rutgers, The State University of New Jersey, School of Engineering 9050 Mississippi State University 89* 243 Institutions included
2.1.21 Top 50 Institutions by Total Bachelor’s Degrees awarded in Industrial/Manufacturing Engineering
Table 21: Top 50 Institutions by Total Bachelor’s Degrees awardedin Industrial/Manufacturing Engineering
No Institutions Degrees Awarded1 Georgia Institute of Technology 3562 Purdue University 2483 Brigham Young University 2384 Texas A&M University 1945 Virginia Polytechnic Institute and State University 1846 The Pennsylvania State University 1737 Arizona State University 1698 University of Michigan 1619 Iowa State University 156
10 Clemson University 15411 The Ohio State University 13412 University of Wisconsin-Madison 12913 University of Florida 12714 University of Illinois at Urbana-Champaign 12515 West Virginia University 11616 California Polytechnic State University, San Luis Obispo 11517 Auburn University 10818 University of Virginia 10719 University of Arizona 10420 University of Central Florida 9521 Stanford University 9322 Texas State University 8723 Northwestern University 8224 Cornell University 8025 Rochester Institute of Technology 7826 North Carolina State University 7527 Columbia University 7427 Oregon State University 7427 Texas Tech University 7427 The State University of New York at Binghamton 7431 University of South Florida 7232 Temple University 7032 University of Pittsburgh 7034 Louisiana State University 6934 University of Arkansas 6936 University of Southern California 6837 San Jose State University 6538 Kansas State University 6438 University of Miami 6440 University of Minnesota -Twin Cities 6141 University of Washington in Seattle 5942 Rutgers, The State University of New Jersey, School of Engineering 54
17
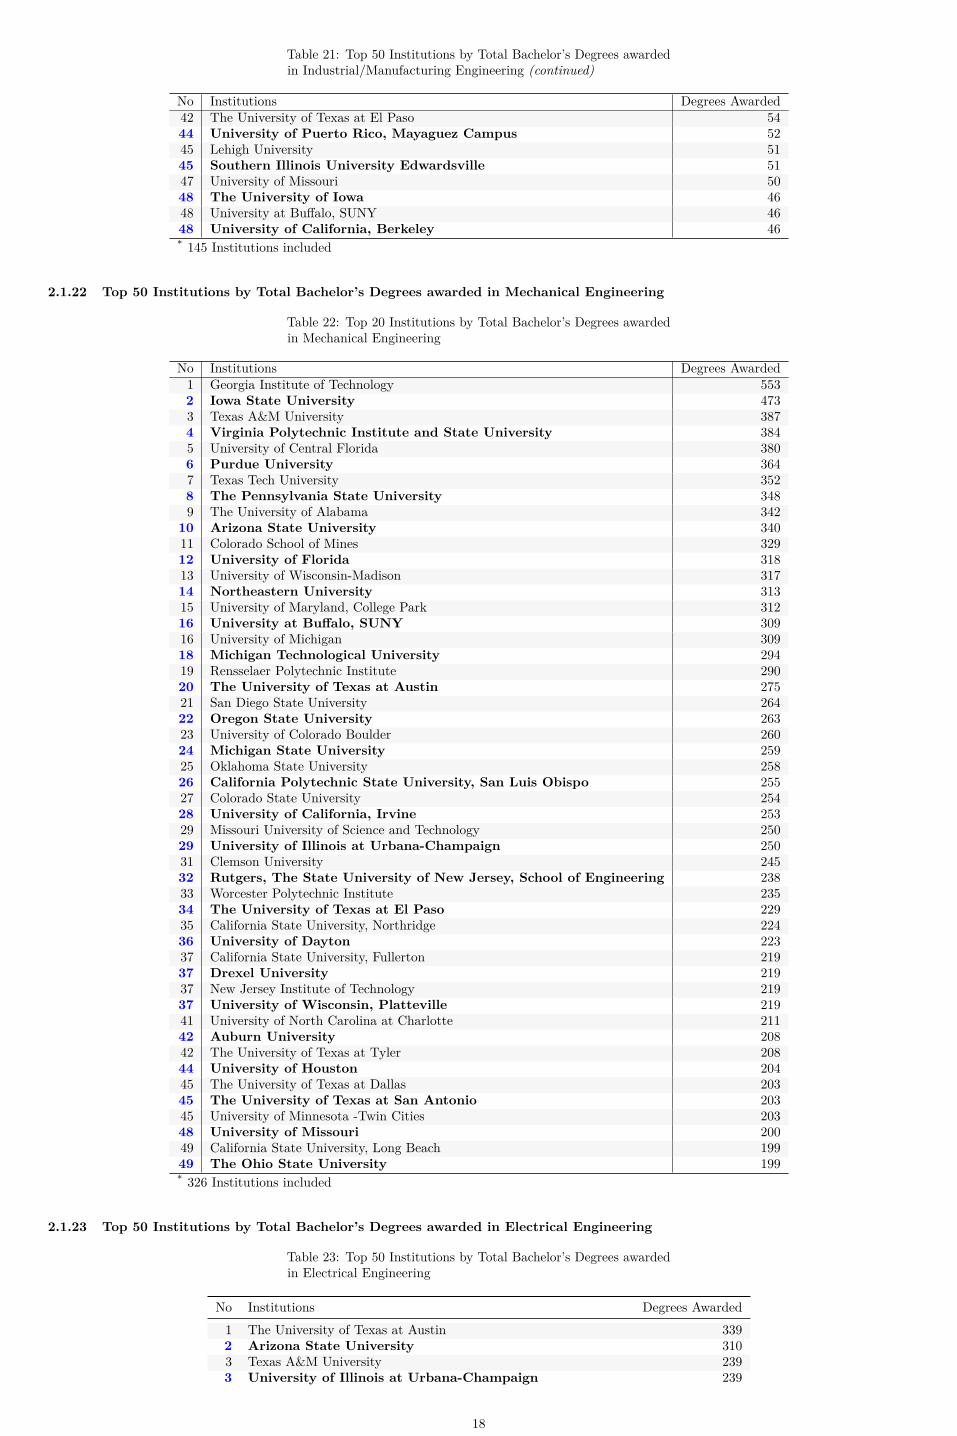
Table 21: Top 50 Institutions by Total Bachelor’s Degrees awardedin Industrial/Manufacturing Engineering (continued)
No Institutions Degrees Awarded42 The University of Texas at El Paso 5444 University of Puerto Rico, Mayaguez Campus 5245 Lehigh University 5145 Southern Illinois University Edwardsville 5147 University of Missouri 5048 The University of Iowa 4648 University at Buffalo, SUNY 4648 University of California, Berkeley 46* 145 Institutions included
2.1.22 Top 50 Institutions by Total Bachelor’s Degrees awarded in Mechanical Engineering
Table 22: Top 20 Institutions by Total Bachelor’s Degrees awardedin Mechanical Engineering
No Institutions Degrees Awarded1 Georgia Institute of Technology 5532 Iowa State University 4733 Texas A&M University 3874 Virginia Polytechnic Institute and State University 3845 University of Central Florida 3806 Purdue University 3647 Texas Tech University 3528 The Pennsylvania State University 3489 The University of Alabama 342
10 Arizona State University 34011 Colorado School of Mines 32912 University of Florida 31813 University of Wisconsin-Madison 31714 Northeastern University 31315 University of Maryland, College Park 31216 University at Buffalo, SUNY 30916 University of Michigan 30918 Michigan Technological University 29419 Rensselaer Polytechnic Institute 29020 The University of Texas at Austin 27521 San Diego State University 26422 Oregon State University 26323 University of Colorado Boulder 26024 Michigan State University 25925 Oklahoma State University 25826 California Polytechnic State University, San Luis Obispo 25527 Colorado State University 25428 University of California, Irvine 25329 Missouri University of Science and Technology 25029 University of Illinois at Urbana-Champaign 25031 Clemson University 24532 Rutgers, The State University of New Jersey, School of Engineering 23833 Worcester Polytechnic Institute 23534 The University of Texas at El Paso 22935 California State University, Northridge 22436 University of Dayton 22337 California State University, Fullerton 21937 Drexel University 21937 New Jersey Institute of Technology 21937 University of Wisconsin, Platteville 21941 University of North Carolina at Charlotte 21142 Auburn University 20842 The University of Texas at Tyler 20844 University of Houston 20445 The University of Texas at Dallas 20345 The University of Texas at San Antonio 20345 University of Minnesota -Twin Cities 20348 University of Missouri 20049 California State University, Long Beach 19949 The Ohio State University 199* 326 Institutions included
2.1.23 Top 50 Institutions by Total Bachelor’s Degrees awarded in Electrical Engineering
Table 23: Top 50 Institutions by Total Bachelor’s Degrees awardedin Electrical Engineering
No Institutions Degrees Awarded1 The University of Texas at Austin 3392 Arizona State University 3103 Texas A&M University 2393 University of Illinois at Urbana-Champaign 239
18
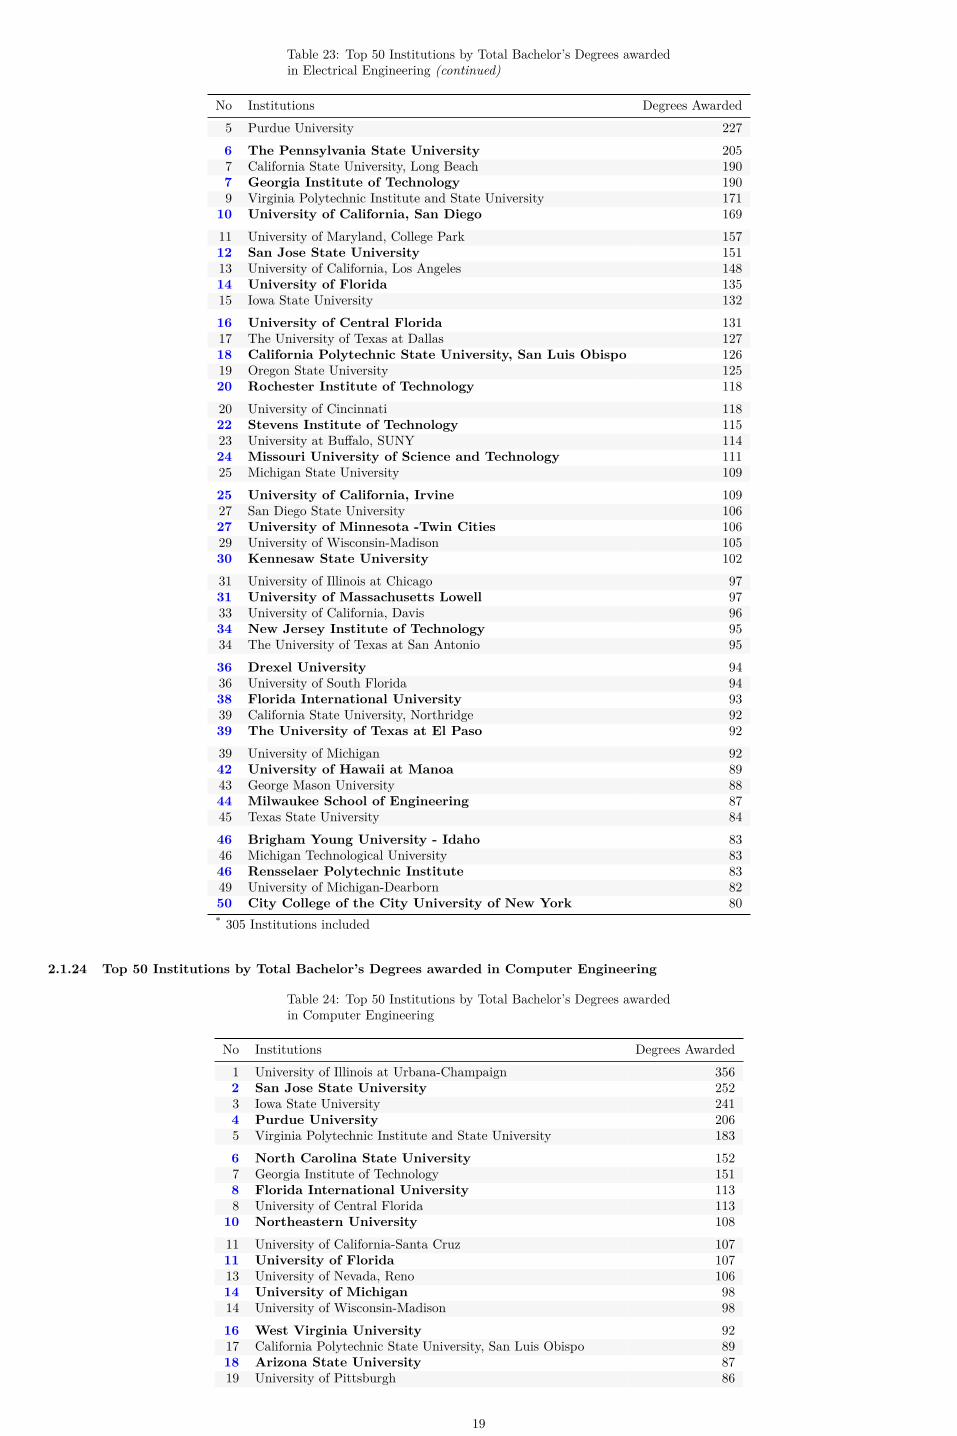
Table 23: Top 50 Institutions by Total Bachelor’s Degrees awardedin Electrical Engineering (continued)
No Institutions Degrees Awarded5 Purdue University 2276 The Pennsylvania State University 2057 California State University, Long Beach 1907 Georgia Institute of Technology 1909 Virginia Polytechnic Institute and State University 171
10 University of California, San Diego 16911 University of Maryland, College Park 15712 San Jose State University 15113 University of California, Los Angeles 14814 University of Florida 13515 Iowa State University 13216 University of Central Florida 13117 The University of Texas at Dallas 12718 California Polytechnic State University, San Luis Obispo 12619 Oregon State University 12520 Rochester Institute of Technology 11820 University of Cincinnati 11822 Stevens Institute of Technology 11523 University at Buffalo, SUNY 11424 Missouri University of Science and Technology 11125 Michigan State University 10925 University of California, Irvine 10927 San Diego State University 10627 University of Minnesota -Twin Cities 10629 University of Wisconsin-Madison 10530 Kennesaw State University 10231 University of Illinois at Chicago 9731 University of Massachusetts Lowell 9733 University of California, Davis 9634 New Jersey Institute of Technology 9534 The University of Texas at San Antonio 9536 Drexel University 9436 University of South Florida 9438 Florida International University 9339 California State University, Northridge 9239 The University of Texas at El Paso 9239 University of Michigan 9242 University of Hawaii at Manoa 8943 George Mason University 8844 Milwaukee School of Engineering 8745 Texas State University 8446 Brigham Young University - Idaho 8346 Michigan Technological University 8346 Rensselaer Polytechnic Institute 8349 University of Michigan-Dearborn 8250 City College of the City University of New York 80* 305 Institutions included
2.1.24 Top 50 Institutions by Total Bachelor’s Degrees awarded in Computer Engineering
Table 24: Top 50 Institutions by Total Bachelor’s Degrees awardedin Computer Engineering
No Institutions Degrees Awarded1 University of Illinois at Urbana-Champaign 3562 San Jose State University 2523 Iowa State University 2414 Purdue University 2065 Virginia Polytechnic Institute and State University 1836 North Carolina State University 1527 Georgia Institute of Technology 1518 Florida International University 1138 University of Central Florida 113
10 Northeastern University 10811 University of California-Santa Cruz 10711 University of Florida 10713 University of Nevada, Reno 10614 University of Michigan 9814 University of Wisconsin-Madison 9816 West Virginia University 9217 California Polytechnic State University, San Luis Obispo 8918 Arizona State University 8719 University of Pittsburgh 86
19

Table 24: Top 50 Institutions by Total Bachelor’s Degrees awardedin Computer Engineering (continued)
No Institutions Degrees Awarded20 University of Maryland, College Park 8521 The University of Texas at Dallas 8322 Missouri University of Science and Technology 8222 University of California, San Diego 8224 Boston University 8125 Santa Clara University 7826 The Pennsylvania State University 7427 Rensselaer Polytechnic Institute 7227 University of Minnesota -Twin Cities 7229 San Diego State University 7030 California State University, Fullerton 6731 Rochester Institute of Technology 6631 University of South Florida 6633 University of Maryland, Baltimore County 6434 Clemson University 6235 Drexel University 6135 University of Cincinnati 6137 Michigan State University 5938 University of California, Irvine 5838 University of Puerto Rico, Mayaguez Campus 5838 Wichita State University 5841 University of California, Los Angeles 5642 Florida Gulf Coast University 5543 Stony Brook University 5444 Michigan Technological University 5244 University of Massachusetts Amherst 5246 California State University, Long Beach 5146 University of California, Santa Barbara 5148 George Mason University 5049 City College of the City University of New York 4950 Embry Riddle Aeronautical University-Daytona Beach 45* 227 Institutions included
2.1.25 Top 20 Institutions by Total Bachelor’s Degrees awarded in Electrical/Computer Engineering
Table 25: Top 20 Institutions by Total Bachelor’s Degrees awardedin Electrical/Computer Engineering
No Institutions Degrees Awarded1 University of California, Berkeley 4342 The Ohio State University 2743 Rutgers, The State University of New Jersey, School of Engineering 2484 University of Washington in Seattle 2215 Carnegie Mellon University 1906 Brigham Young University 1207 University of Arizona 1198 Massachusetts Institute of Technology 1099 The State University of New York at Binghamton 108
10 Duke University 10011 Worcester Polytechnic Institute 8912 Cornell University 8813 New York Institute of Technology 8714 The University of Iowa 8015 Colorado State University 6616 University of Colorado Boulder 6217 University of Missouri - Kansas City 5818 Rowan University 5719 University of South Alabama 5420 University of Washington-Tacoma 47* 102 Institutions included
2.1.26 Top 20 Institutions by Total Bachelor’s Degrees awarded in Computer Science (outside engineering)
Table 26: Top 20 Institutions by Total Bachelor’s Degrees awardedin Computer Science (outside engineering)
No Institutions Degrees Awarded1 University of California, Irvine 9032 Georgia Institute of Technology 6173 University of California, Berkeley 5944 University of Maryland, College Park 5925 University of Wisconsin-Madison 537
20

Table 26: Top 20 Institutions by Total Bachelor’s Degrees awardedin Computer Science (outside engineering) (continued)
No Institutions Degrees Awarded
6 Rutgers, The State University of New Jersey, School of Engineering 4817 Purdue University 4148 New Jersey Institute of Technology 3949 The University of Texas at Austin 365
10 University of Michigan 27011 University of Massachusetts Amherst 26612 Northeastern University 26413 University of Houston 26114 FAMU-FSU College of Engineering 22415 University of Pittsburgh 21616 University of Virginia 20517 Brigham Young University 20418 Rensselaer Polytechnic Institute 19719 The University of Texas at San Antonio 18620 Boston University 182* 52 Institutions included
2.1.27 Top 50 Institutions by Total Bachelor’s Degrees awarded in Computer Science (inside engineering)
Table 27: Top 50 Institutions by Total Bachelor’s Degrees awardedin Computer Science (inside engineering)
No Institutions Degrees Awarded1 Oregon State University 6572 Arizona State University 5503 University of Central Florida 5184 University of Illinois at Urbana-Champaign 5035 The University of Texas at Dallas 4896 University of California-Santa Cruz 4707 University of Michigan 4658 University of California, San Diego 4479 Florida International University 397
10 Texas A&M University 36811 University of California, Davis 36212 University of Washington in Seattle 36113 Stony Brook University 34214 Stanford University 33015 Virginia Polytechnic Institute and State University 30416 The Ohio State University 29617 University of Minnesota -Twin Cities 29518 University at Buffalo, SUNY 27319 Cornell University 27220 University of Southern California 26321 George Mason University 25022 California State University, Fullerton 24623 University of California, Los Angeles 24524 California State University, Sacramento 24325 Michigan State University 23326 California Polytechnic State University, San Luis Obispo 22927 University of Pennsylvania 20828 California State University, Northridge 20729 University of Maryland, Baltimore County 20630 University of Illinois at Chicago 20531 University of North Texas 20331 University of Utah 20333 California State University, Long Beach 20034 The Pennsylvania State University 19535 Auburn University 19336 The University of Texas at Arlington 18637 University of California, Riverside 18238 University of Virginia 17239 University of Washington-Tacoma 16540 Miami University 15541 University of Florida 15442 University of Connecticut 15343 Washington University in St. Louis 15244 University of Colorado Boulder 151
21

Table 27: Top 50 Institutions by Total Bachelor’s Degrees awardedin Computer Science (inside engineering) (continued)
No Institutions Degrees Awarded45 Florida Atlantic University 14645 Portland State University 14647 Princeton University 14548 Clemson University 14048 Oakland University 14048 University of South Florida 140* 149 Institutions included
2.1.28 Top 50 Institutions by Total Bachelor’s Degrees awarded in Engineering (General)
Table 28: Top 50 Institutions by Total Bachelor’s Degrees awardedin Engineering (General)
No Institutions Degrees Awarded1 University at Buffalo, SUNY 2092 Arizona State University 2053 Stanford University 1104 McNeese State University 1095 North Carolina State University 976 University of Wisconsin - Stout 967 Harvey Mudd College 838 James Madison University 758 Montana Technological University 75
10 Geneva College 6611 Olivet Nazarene University 6312 Texas Christian University 5613 University of Detroit Mercy 4413 Walla Walla University 4415 Frostburg State University 4316 Hope College 4217 Smith College 3918 University of Southern Indiana 3619 Marshall University 3520 Vanderbilt University 3321 Swarthmore College 3121 University of Colorado Boulder 3121 University of North Carolina at Asheville 3124 Fort Lewis College 3025 Elizabethtown College 2925 Seattle University 2927 Western Carolina University 2828 John Brown University 2728 Minnesota State University-Mankato 2730 Loyola University Maryland 2631 Seattle Pacific University 2532 Oral Roberts University 2432 The University of Tennessee-Martin 2434 College of Staten Island CUNY 2234 The University of Mississippi 2234 University of Maryland Eastern Shore 2237 Northwest Nazarene University 2138 Bob Jones University 1939 Andrews University 1639 Trinity College 1641 Wentworth Institute of Technology 1542 California Polytechnic State University, San Luis Obispo 1343 University of Hartford 1244 Miami University 1144 Southern Arkansas University Main Campus 1144 University of Rochester 1147 Brown University 1048 Pennsylvania State University-Penn State Abington 949 Pennsylvania State University-Penn State Hazleton 849 The University of Tennessee-Chattanooga 8* 129 Institutions included
22
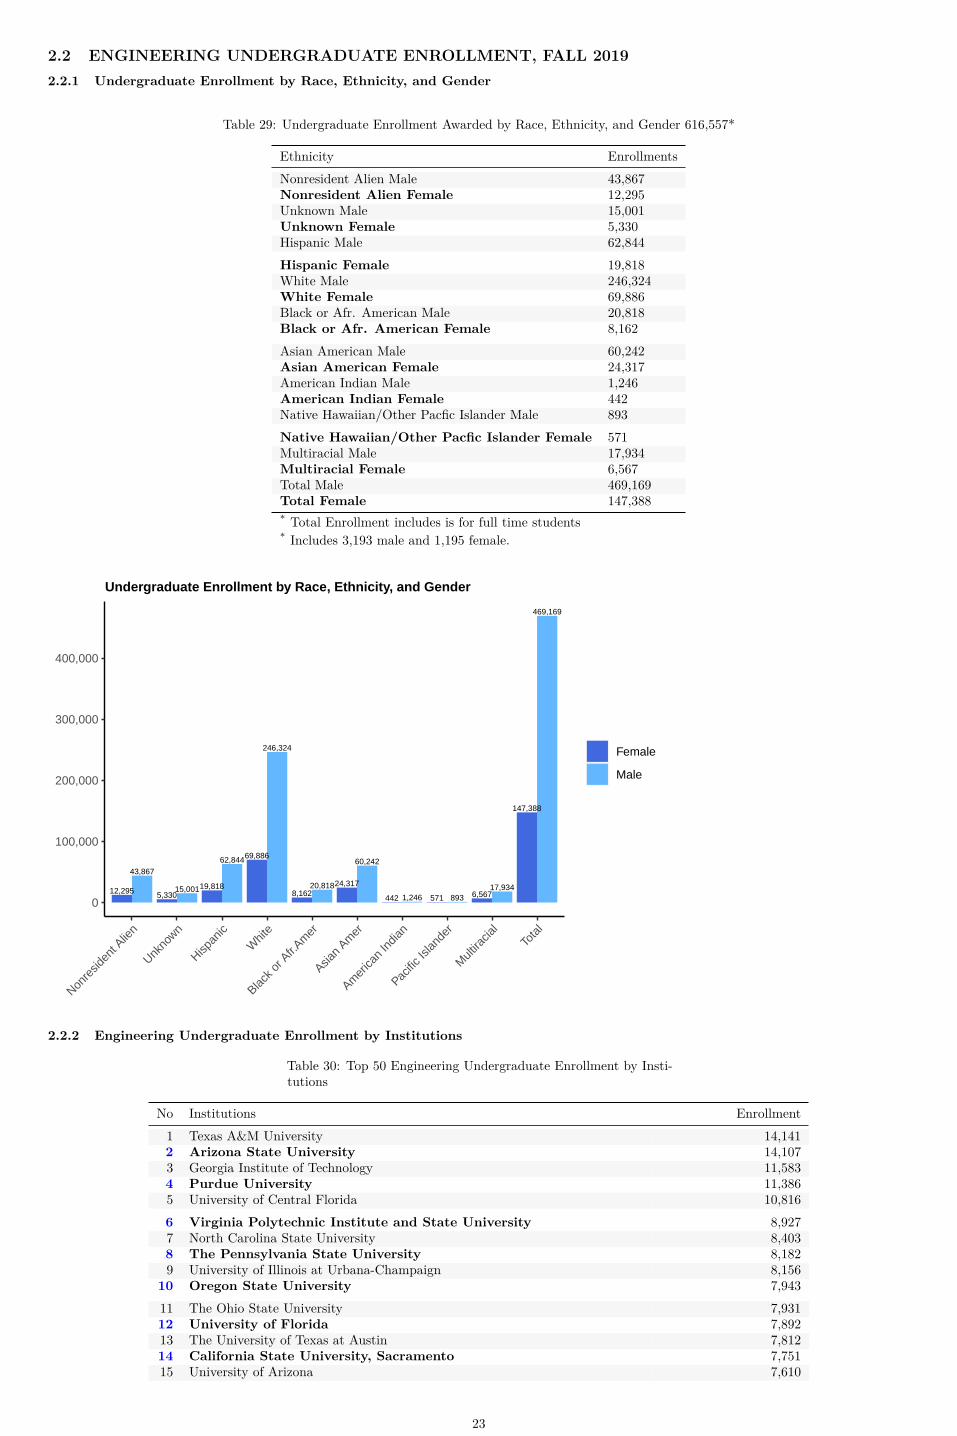
2.2 ENGINEERING UNDERGRADUATE ENROLLMENT, FALL 20192.2.1 Undergraduate Enrollment by Race, Ethnicity, and Gender
Table 29: Undergraduate Enrollment Awarded by Race, Ethnicity, and Gender 616,557*
Ethnicity EnrollmentsNonresident Alien Male 43,867Nonresident Alien Female 12,295Unknown Male 15,001Unknown Female 5,330Hispanic Male 62,844Hispanic Female 19,818White Male 246,324White Female 69,886Black or Afr. American Male 20,818Black or Afr. American Female 8,162Asian American Male 60,242Asian American Female 24,317American Indian Male 1,246American Indian Female 442Native Hawaiian/Other Pacfic Islander Male 893Native Hawaiian/Other Pacfic Islander Female 571Multiracial Male 17,934Multiracial Female 6,567Total Male 469,169Total Female 147,388* Total Enrollment includes is for full time students* Includes 3,193 male and 1,195 female.
43,867
12,295 15,0015,330
62,844
19,818
246,324
69,886
20,8188,162
60,242
24,317
1,246442 89357117,934
6,567
469,169
147,388
0
100,000
200,000
300,000
400,000
Nonre
siden
t Alie
n
Unkno
wn
Hispan
ic
Whit
e
Black o
r Afr.
Amer
Asian
Amer
Amer
ican
India
n
Pacific
Islan
der
Mult
iracia
lTo
tal
Female
Male
Undergraduate Enrollment by Race, Ethnicity, and Gender
2.2.2 Engineering Undergraduate Enrollment by Institutions
Table 30: Top 50 Engineering Undergraduate Enrollment by Insti-tutions
No Institutions Enrollment1 Texas A&M University 14,1412 Arizona State University 14,1073 Georgia Institute of Technology 11,5834 Purdue University 11,3865 University of Central Florida 10,8166 Virginia Polytechnic Institute and State University 8,9277 North Carolina State University 8,4038 The Pennsylvania State University 8,1829 University of Illinois at Urbana-Champaign 8,156
10 Oregon State University 7,94311 The Ohio State University 7,93112 University of Florida 7,89213 The University of Texas at Austin 7,81214 California State University, Sacramento 7,75115 University of Arizona 7,610
23
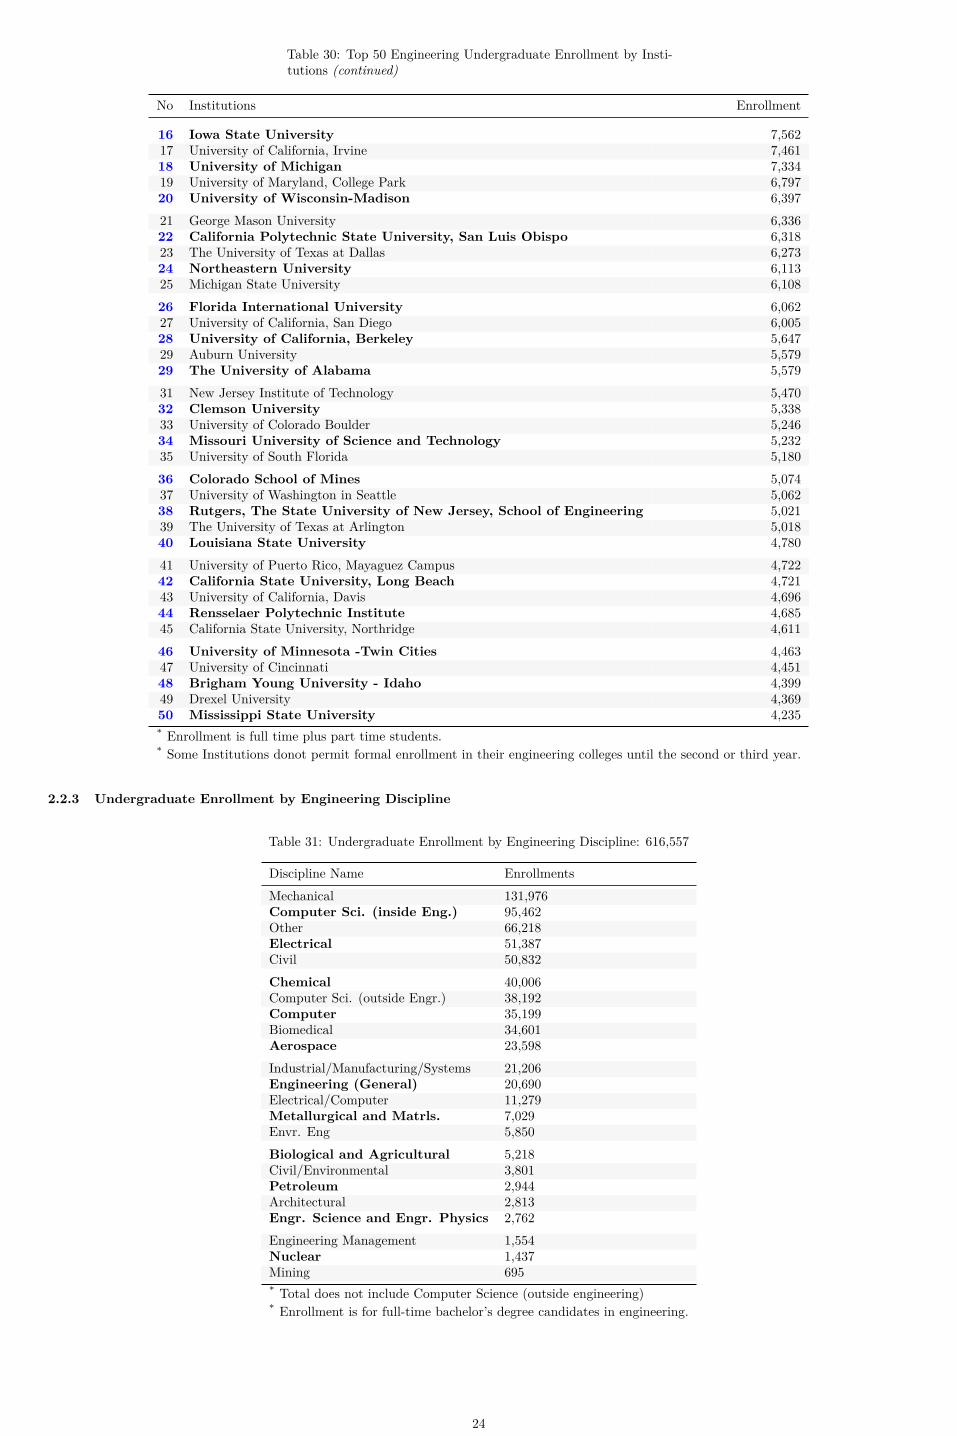
Table 30: Top 50 Engineering Undergraduate Enrollment by Insti-tutions (continued)
No Institutions Enrollment
16 Iowa State University 7,56217 University of California, Irvine 7,46118 University of Michigan 7,33419 University of Maryland, College Park 6,79720 University of Wisconsin-Madison 6,39721 George Mason University 6,33622 California Polytechnic State University, San Luis Obispo 6,31823 The University of Texas at Dallas 6,27324 Northeastern University 6,11325 Michigan State University 6,10826 Florida International University 6,06227 University of California, San Diego 6,00528 University of California, Berkeley 5,64729 Auburn University 5,57929 The University of Alabama 5,57931 New Jersey Institute of Technology 5,47032 Clemson University 5,33833 University of Colorado Boulder 5,24634 Missouri University of Science and Technology 5,23235 University of South Florida 5,18036 Colorado School of Mines 5,07437 University of Washington in Seattle 5,06238 Rutgers, The State University of New Jersey, School of Engineering 5,02139 The University of Texas at Arlington 5,01840 Louisiana State University 4,78041 University of Puerto Rico, Mayaguez Campus 4,72242 California State University, Long Beach 4,72143 University of California, Davis 4,69644 Rensselaer Polytechnic Institute 4,68545 California State University, Northridge 4,61146 University of Minnesota -Twin Cities 4,46347 University of Cincinnati 4,45148 Brigham Young University - Idaho 4,39949 Drexel University 4,36950 Mississippi State University 4,235* Enrollment is full time plus part time students.* Some Institutions donot permit formal enrollment in their engineering colleges until the second or third year.
2.2.3 Undergraduate Enrollment by Engineering Discipline
Table 31: Undergraduate Enrollment by Engineering Discipline: 616,557
Discipline Name EnrollmentsMechanical 131,976Computer Sci. (inside Eng.) 95,462Other 66,218Electrical 51,387Civil 50,832Chemical 40,006Computer Sci. (outside Engr.) 38,192Computer 35,199Biomedical 34,601Aerospace 23,598Industrial/Manufacturing/Systems 21,206Engineering (General) 20,690Electrical/Computer 11,279Metallurgical and Matrls. 7,029Envr. Eng 5,850Biological and Agricultural 5,218Civil/Environmental 3,801Petroleum 2,944Architectural 2,813Engr. Science and Engr. Physics 2,762Engineering Management 1,554Nuclear 1,437Mining 695* Total does not include Computer Science (outside engineering)* Enrollment is for full-time bachelor’s degree candidates in engineering.
24

131,976
95,462
66,218
51,38750,832
40,00638,19235,19934,601
23,59821,20620,690
11,2797,029 5,850 5,218 3,801 2,944 2,813 2,762 1,554 1,437 695
0
50,000
100,000
Mec
hani
cal
Com
pute
r Sci
. (in
side
Eng
.)O
ther
Ele
ctric
alC
ivil
Che
mic
al
Com
pute
r Sci
. (ou
tsid
e E
ngr.)
Com
pute
rB
iom
edic
alA
eros
pace
Indu
stria
l/Man
ufac
turin
g/S
yste
ms
Eng
inee
ring
(Gen
eral
)E
lect
rical
/Com
pute
r
Met
allu
rgic
al a
nd M
atrls
.E
nvr.
Eng
Bio
logi
cal a
nd A
gric
ultu
ral
Civ
il/E
nviro
nmen
tal
Pet
role
umA
rchi
tect
ural
Eng
r. S
cien
ce a
nd E
ngr.
Phy
sics
Eng
inee
ring
Man
agem
ent
Nuc
lear
Min
ing
Undergraduate Enrollment by Engineering Discipline
2.2.4 Undergraduate Enrollment by Engineering Discipline:(Full time and Part time)
Table 32: Undergraduate Enrollment by Engineering Discipline:(Full time and Part time)
Discipline Name Full Time Part TimeAerospace 23,598 1,428Architectural 2,813 133Biological and Agricultural 5,218 235Biomedical 34,601 1,360Chemical 40,006 2,607Civil 50,832 5,183Civil/Environmental 3,801 369Computer 35,199 3,696Computer Sci. (inside Eng.) 95,462 14,380Electrical 51,387 8,118Electrical/Computer 11,279 675Engineering (General) 20,690 1,024Engineering Management 1,554 81Engr. Science and Engr. Physics 2,762 184Envr. Eng 5,850 363Industrial/Manufacturing/Systems 21,206 2,676Mechanical 131,976 14,292Metallurgical and Matrls. 7,029 445Mining 695 83Nuclear 1,437 97Other 66,218 6,262Petroleum 2,944 389
2.2.5 Undergraduate Enrollment by Gender
Table 33: Undergraduate Enrollment by Gender
Gender PercentageFemale 23.8%Male 76.2%
25

76.2%
23.8%
0%
10%
20%
30%
40%
50%
60%
70%
80%
90%
100%
Mal
e
Fem
ale
Undergraduate Enrollment by Gender
2.2.6 Undergraduate Enrollment by Race and Ethnicity
Table 34: Undergraduate Enrollment by Race and Ethnicity*
Ethnicity PercentageBlack or Afr. American 5.2%Hispanic 14.5%Other 4.9%Asian American 16.1%White 55.7%Unknown 3.7%
5.2%
14.5%
4.9%
16.1%
55.7%
3.7%
0%
10%
20%
30%
40%
50%
60%
70%
80%
90%
100%
Bla
ck o
r Afr.
Am
eric
an
His
pani
c
Oth
er
Asi
an A
mer
ican
Whi
te
Unk
now
n
Undergraduate Enrollment by Race and Ethnicity
2.2.7 Undergraduate Enrollment by Residency
Table 35: Undergraduate Enrollment by Residency
Nationality PercentageForeign 9.4%Domestic 90.6%
26

9.4%
90.6%
0%
10%
20%
30%
40%
50%
60%
70%
80%
90%
100%
Dom
estic
Fore
ign
Undergraduate Enrollment by Residency
27
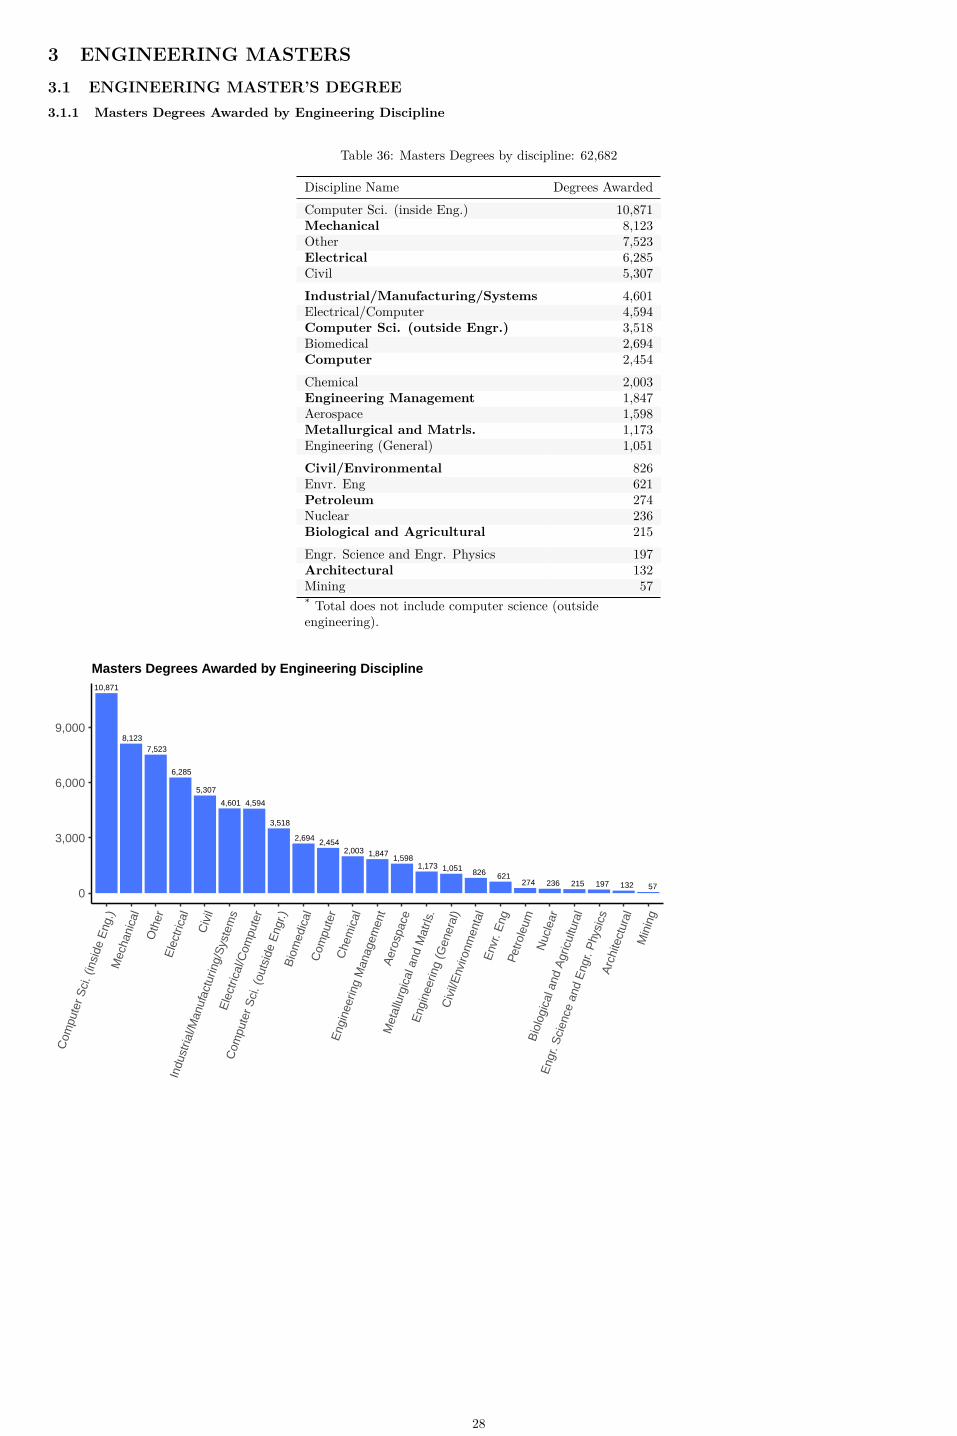
3 ENGINEERING MASTERS3.1 ENGINEERING MASTER’S DEGREE3.1.1 Masters Degrees Awarded by Engineering Discipline
Table 36: Masters Degrees by discipline: 62,682
Discipline Name Degrees AwardedComputer Sci. (inside Eng.) 10,871Mechanical 8,123Other 7,523Electrical 6,285Civil 5,307Industrial/Manufacturing/Systems 4,601Electrical/Computer 4,594Computer Sci. (outside Engr.) 3,518Biomedical 2,694Computer 2,454Chemical 2,003Engineering Management 1,847Aerospace 1,598Metallurgical and Matrls. 1,173Engineering (General) 1,051Civil/Environmental 826Envr. Eng 621Petroleum 274Nuclear 236Biological and Agricultural 215Engr. Science and Engr. Physics 197Architectural 132Mining 57* Total does not include computer science (outsideengineering).
10,871
8,123 7,523
6,285
5,307
4,601 4,594
3,518
2,694 2,454 2,003 1,847 1,598
1,173 1,051 826 621 274 236 215 197 132 57
0
3,000
6,000
9,000
Com
pute
r Sci
. (in
side
Eng
.)M
echa
nica
lO
ther
Ele
ctric
al
Civ
il
Indu
stria
l/Man
ufac
turin
g/S
yste
ms
Ele
ctric
al/C
ompu
ter
Com
pute
r Sci
. (ou
tsid
e E
ngr.)
Bio
med
ical
Com
pute
rC
hem
ical
Eng
inee
ring
Man
agem
ent
Aer
ospa
ce
Met
allu
rgic
al a
nd M
atrls
.E
ngin
eerin
g (G
ener
al)
Civ
il/E
nviro
nmen
tal
Env
r. E
ngP
etro
leum
Nuc
lear
Bio
logi
cal a
nd A
gric
ultu
ral
Eng
r. S
cien
ce a
nd E
ngr.
Phy
sics
Arc
hite
ctur
alM
inin
g
Masters Degrees Awarded by Engineering Discipline
28
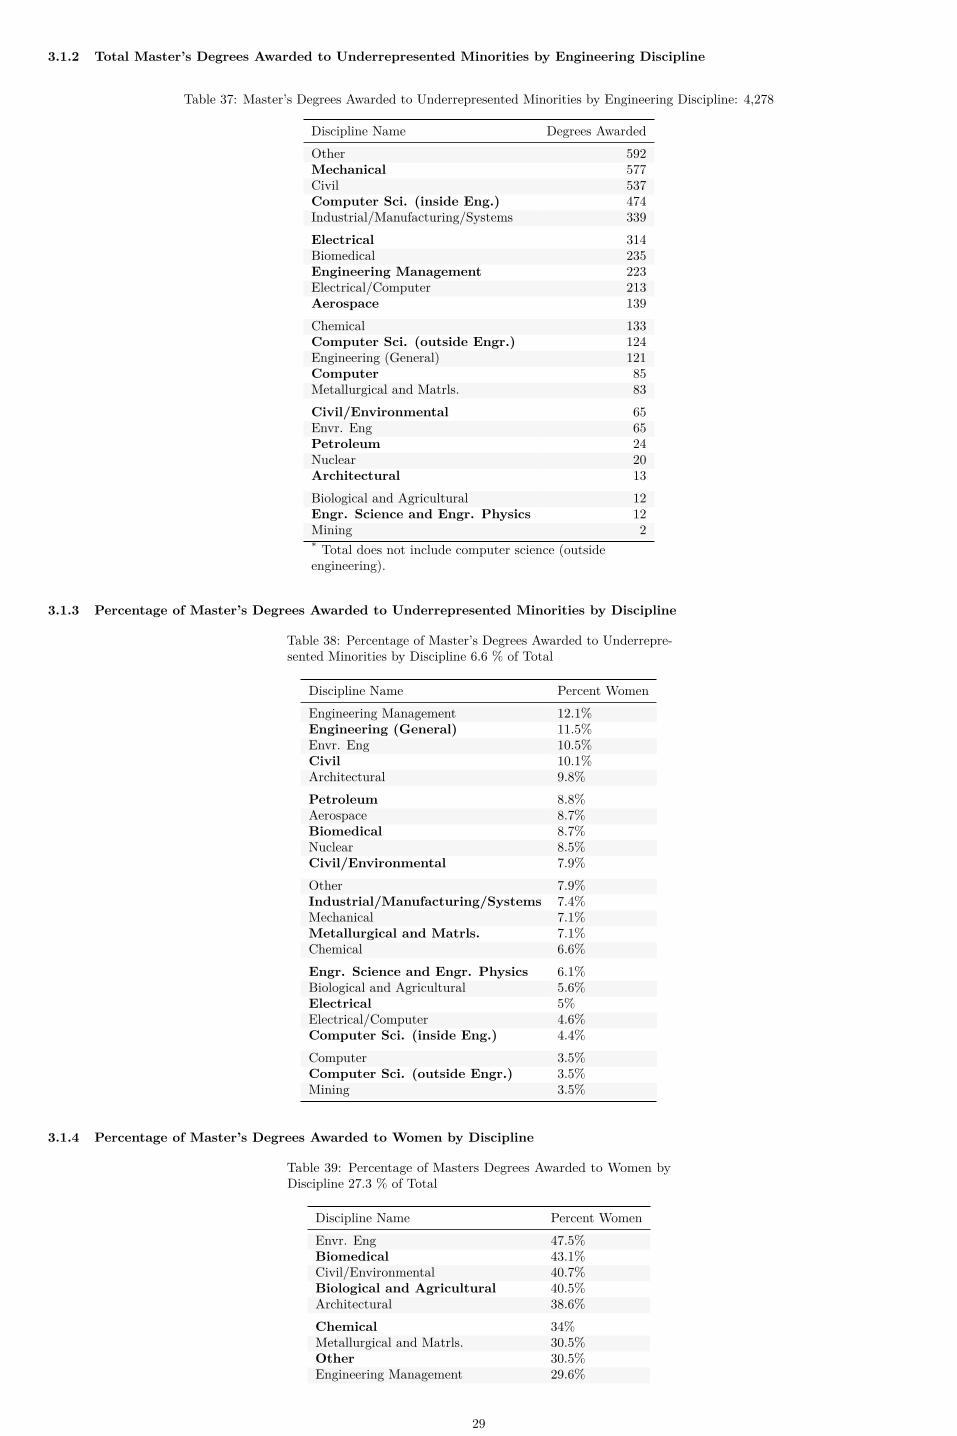
3.1.2 Total Master’s Degrees Awarded to Underrepresented Minorities by Engineering Discipline
Table 37: Master’s Degrees Awarded to Underrepresented Minorities by Engineering Discipline: 4,278
Discipline Name Degrees AwardedOther 592Mechanical 577Civil 537Computer Sci. (inside Eng.) 474Industrial/Manufacturing/Systems 339Electrical 314Biomedical 235Engineering Management 223Electrical/Computer 213Aerospace 139Chemical 133Computer Sci. (outside Engr.) 124Engineering (General) 121Computer 85Metallurgical and Matrls. 83Civil/Environmental 65Envr. Eng 65Petroleum 24Nuclear 20Architectural 13Biological and Agricultural 12Engr. Science and Engr. Physics 12Mining 2* Total does not include computer science (outsideengineering).
3.1.3 Percentage of Master’s Degrees Awarded to Underrepresented Minorities by Discipline
Table 38: Percentage of Master’s Degrees Awarded to Underrepre-sented Minorities by Discipline 6.6 % of Total
Discipline Name Percent WomenEngineering Management 12.1%Engineering (General) 11.5%Envr. Eng 10.5%Civil 10.1%Architectural 9.8%Petroleum 8.8%Aerospace 8.7%Biomedical 8.7%Nuclear 8.5%Civil/Environmental 7.9%Other 7.9%Industrial/Manufacturing/Systems 7.4%Mechanical 7.1%Metallurgical and Matrls. 7.1%Chemical 6.6%Engr. Science and Engr. Physics 6.1%Biological and Agricultural 5.6%Electrical 5%Electrical/Computer 4.6%Computer Sci. (inside Eng.) 4.4%Computer 3.5%Computer Sci. (outside Engr.) 3.5%Mining 3.5%
3.1.4 Percentage of Master’s Degrees Awarded to Women by Discipline
Table 39: Percentage of Masters Degrees Awarded to Women byDiscipline 27.3 % of Total
Discipline Name Percent WomenEnvr. Eng 47.5%Biomedical 43.1%Civil/Environmental 40.7%Biological and Agricultural 40.5%Architectural 38.6%Chemical 34%Metallurgical and Matrls. 30.5%Other 30.5%Engineering Management 29.6%
29
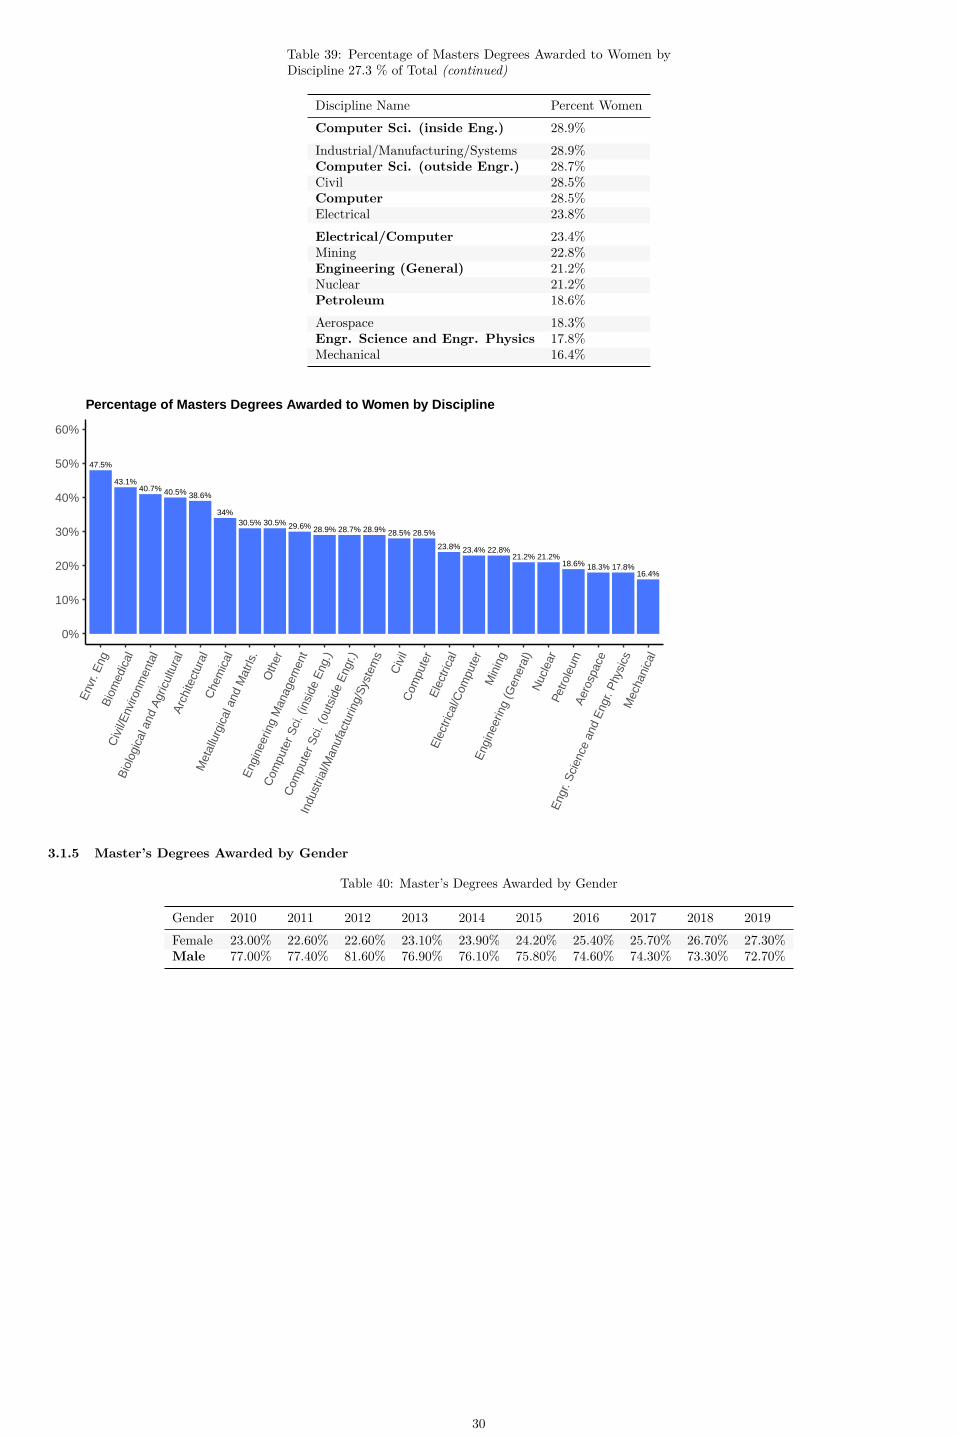
Table 39: Percentage of Masters Degrees Awarded to Women byDiscipline 27.3 % of Total (continued)
Discipline Name Percent WomenComputer Sci. (inside Eng.) 28.9%Industrial/Manufacturing/Systems 28.9%Computer Sci. (outside Engr.) 28.7%Civil 28.5%Computer 28.5%Electrical 23.8%Electrical/Computer 23.4%Mining 22.8%Engineering (General) 21.2%Nuclear 21.2%Petroleum 18.6%Aerospace 18.3%Engr. Science and Engr. Physics 17.8%Mechanical 16.4%
47.5%
43.1%40.7% 40.5% 38.6%
34%30.5% 30.5% 29.6% 28.9% 28.9%28.7% 28.5% 28.5%
23.8% 23.4% 22.8%21.2% 21.2%
18.6% 18.3% 17.8%16.4%
0%
10%
20%
30%
40%
50%
60%
Env
r. E
ngB
iom
edic
alC
ivil/
Env
ironm
enta
l
Bio
logi
cal a
nd A
gric
ultu
ral
Arc
hite
ctur
alC
hem
ical
Met
allu
rgic
al a
nd M
atrls
.O
ther
Eng
inee
ring
Man
agem
ent
Com
pute
r Sci
. (in
side
Eng
.)
Com
pute
r Sci
. (ou
tsid
e E
ngr.)
Indu
stria
l/Man
ufac
turin
g/S
yste
ms
Civ
ilC
ompu
ter
Ele
ctric
al
Ele
ctric
al/C
ompu
ter
Min
ing
Eng
inee
ring
(Gen
eral
)N
ucle
arPe
trole
umA
eros
pace
Eng
r. S
cien
ce a
nd E
ngr.
Phy
sics
Mec
hani
cal
Percentage of Masters Degrees Awarded to Women by Discipline
3.1.5 Master’s Degrees Awarded by Gender
Table 40: Master’s Degrees Awarded by Gender
Gender 2010 2011 2012 2013 2014 2015 2016 2017 2018 2019Female 23.00% 22.60% 22.60% 23.10% 23.90% 24.20% 25.40% 25.70% 26.70% 27.30%Male 77.00% 77.40% 81.60% 76.90% 76.10% 75.80% 74.60% 74.30% 73.30% 72.70%
30

72.7%
27.3%
0%
10%
20%
30%
40%
50%
60%
70%
80%
90%
100%
Mal
e
Fem
ale
Master's Degrees Awarded by Gender
3.1.6 Master’s Degrees Awarded by Race and Ethnicity
Table 41: Master’s Degrees Awarded by Ethnicity
Ethnicity 2011 2012 2013 2014 2015 2016 2017 2018 2019Black or Afr. American 5.1% 4.9% 4.7% 4.7% 4.4% 4.7% 4.7% 4.8% 4.8%Hispanic 6.0% 6.3% 7.3% 7.6% 7.7% 8.3% 8.5% 8.8% 9.2%Other 1.4% 1.5% 2.0% 2.2% 2.6% 3.0% 3.1% 3.8% 3.9%Asian American 14.9% 15.5% 14.5% 15.0% 14.5% 15.1% 15.1% 15.8% 16.3%White 60.9% 58.2% 59.7% 59.5% 60.2% 59.5% 60.1% 58.2% 55.4%Unknown 11.7% 13.6% 11.8% 11.0% 10.6% 9.4% 8.4% 8.6% 10.4%
*Data on ethnicity does not include foreign nationals. American Indian/Alaska Native (0.2%), Native Hawaiian/Other Pacfic Islander(0.1%) andMultiracial (3.6%) are combined under Other.
4.8%9.2%
3.9%
16.3%
55.4%
10.4%
0%
10%
20%
30%
40%
50%
60%
70%
80%
90%
100%
Bla
ck o
r Afr.
Am
eric
an
His
pani
c
Oth
er
Asi
an A
mer
ican
Whi
te
Unk
now
n
Master's Degrees Awarded by Race and Ethnicity
3.1.7 Masters Degrees Awarded by Residency
Table 42: Masters Degrees Awarded by Residency
Nationality 2010 2011 2012 2013 2014 2015 2016 2017 2018 2019Foreign 46.1% 44.4% 43.3% 45.3% 47.5% 52.6% 58.1% 59.2% 57.1% 53.6%Domestic 53.9% 55.6% 56.7% 54.7% 52.5% 47.4% 41.9% 40.8% 42.9% 46.4%
31

53.6%
46.4%
0%
10%
20%
30%
40%
50%
60%
70%
80%
90%
100%
Dom
estic
Fore
ign
Masters Degrees Awarded by Residency
3.1.8 Master’s Degrees Awarded by Race, Ethnicity, and Gender
Table 43: Master’s Degrees Awarded by Race, Ethnicity, and Gender 62,682*
Ethnicity Degrees AwardedNonresident Alien Male 23,521Nonresident Alien Female 9,373Unknown Male 2,178Unknown Female 914Hispanic Male 2,025Hispanic Female 714White Male 12,646White Female 3,830Black or Afr. American Male 1,018Black or Afr. American Female 424Asian American Male 3,381Asian American Female 1,459American Indian Male 43American Indian Female 28Native Hawaiian/Other Pacfic Islander Male 20Native Hawaiian/Other Pacfic Islander Female 6Multiracial Male 751Multiracial Female 315Total Male 45,583Total Female 17,063* Total degree includes 0 total Non binary graduates and 36 total Other Gender graduates.* Includes 34 male and22 female graduates from Puerto Rico.
32

23,521
9,373
2,178914
2,025714
12,646
3,830
1,018424
3,381
1,4594328 206
751315
45,583
17,063
0
10,000
20,000
30,000
40,000
Nonre
siden
t Alie
n
Unkno
wn
Hispan
ic
Whit
e
Black o
r Afr.
Amer
Asian
Amer
Amer
ican
India
n
Pacific
Islan
der
Mult
iracia
lTo
tal
Female
Male
Master’s Degrees Awarded by Race, Ethnicity, and Gender
3.1.9 Top 50 Institutions Awarding Engineering Masters Degrees
Table 44: Top 50 Institutions Awarding Engineering Master’s De-grees
No Institutions Degrees Awarded1 University of Southern California 2,3662 Northeastern University 1,9173 Carnegie Mellon University 1,6464 Columbia University 1,4865 Georgia Institute of Technology 1,4816 The Johns Hopkins University 1,3927 Arizona State University 1,3318 University of Michigan 1,3119 Stanford University 1,166
10 University of Illinois at Urbana-Champaign 1,10111 Cornell University 1,03612 San Jose State University 96113 Stevens Institute of Technology 93614 New Jersey Institute of Technology 92815 North Carolina State University 91316 The University of Texas at Arlington 91017 University of California, Berkeley 89718 Texas A&M University 89519 University of California, San Diego 89220 University of Florida 82321 Massachusetts Institute of Technology 82122 NYU Tandon School of Engineering 78223 The University of Texas at Dallas 75824 Stony Brook University 74325 University of California, Los Angeles 73126 Purdue University 73027 University of Washington in Seattle 72428 Northwestern University 68329 University of Pennsylvania 66330 University of Colorado Boulder 62831 University of Illinois at Chicago 59432 Worcester Polytechnic Institute 56033 George Mason University 53934 The George Washington University 53135 University of Maryland, College Park 52336 University of California, Irvine 51037 Virginia Polytechnic Institute and State University 48938 The Ohio State University 46438 University of Wisconsin-Madison 46440 The University of Texas at Austin 46141 Missouri University of Science and Technology 45642 University of Minnesota -Twin Cities 45543 University of South Florida 45444 Boston University 44045 Rutgers, The State University of New Jersey, School of Engineering 43646 California State University, Fullerton 43247 Rochester Institute of Technology 42448 Duke University 42049 Southern Methodist University 41750 University of Cincinnati 412
33
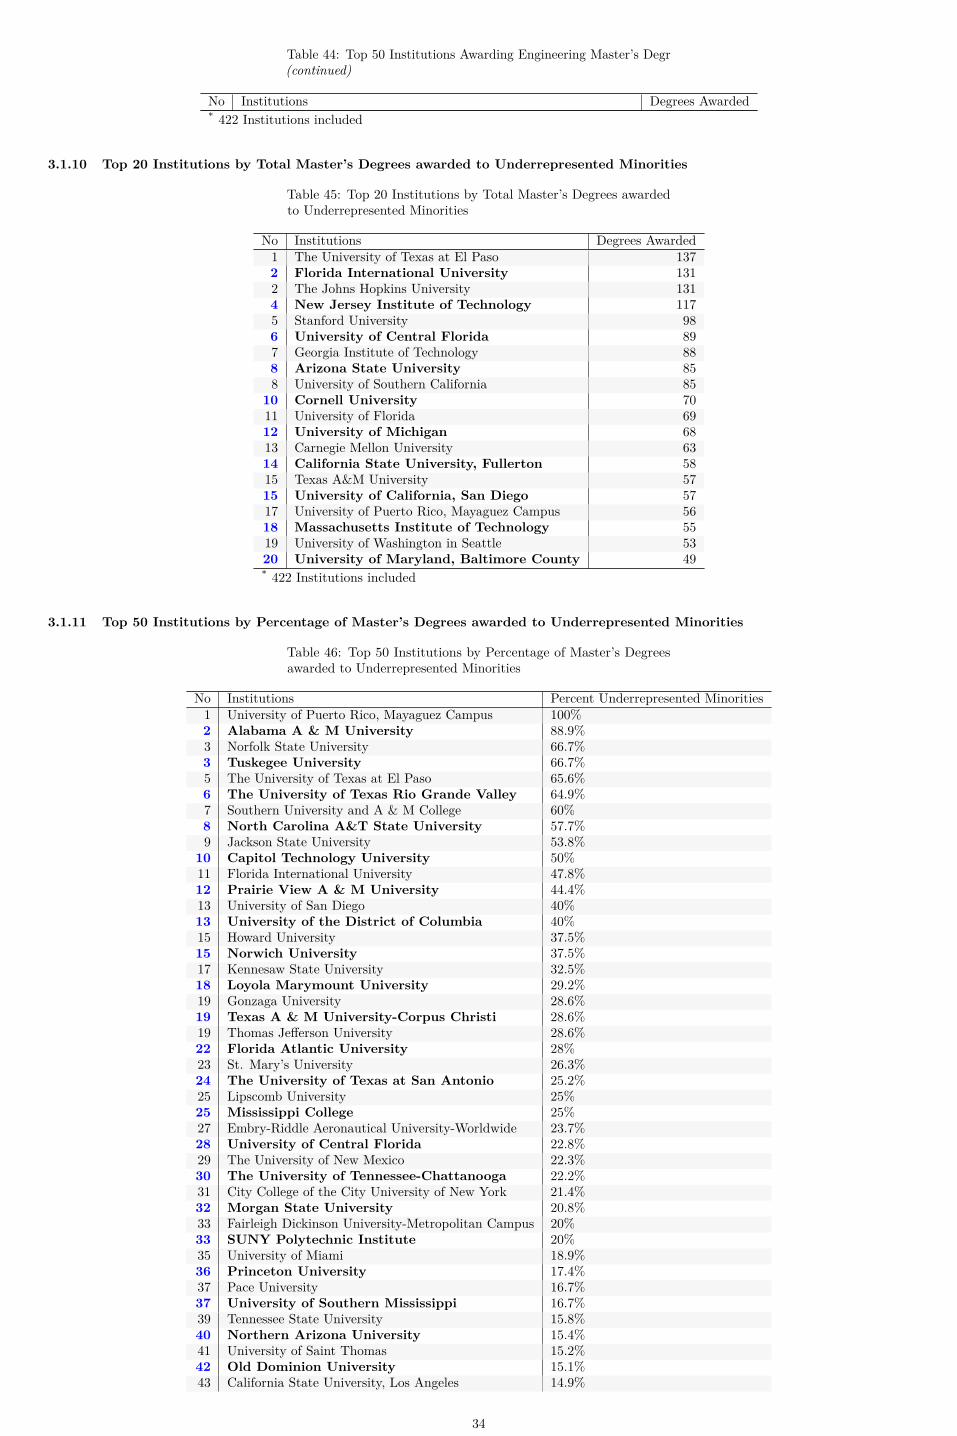
Table 44: Top 50 Institutions Awarding Engineering Master’s Degr(continued)
No Institutions Degrees Awarded* 422 Institutions included
3.1.10 Top 20 Institutions by Total Master’s Degrees awarded to Underrepresented Minorities
Table 45: Top 20 Institutions by Total Master’s Degrees awardedto Underrepresented Minorities
No Institutions Degrees Awarded1 The University of Texas at El Paso 1372 Florida International University 1312 The Johns Hopkins University 1314 New Jersey Institute of Technology 1175 Stanford University 986 University of Central Florida 897 Georgia Institute of Technology 888 Arizona State University 858 University of Southern California 85
10 Cornell University 7011 University of Florida 6912 University of Michigan 6813 Carnegie Mellon University 6314 California State University, Fullerton 5815 Texas A&M University 5715 University of California, San Diego 5717 University of Puerto Rico, Mayaguez Campus 5618 Massachusetts Institute of Technology 5519 University of Washington in Seattle 5320 University of Maryland, Baltimore County 49* 422 Institutions included
3.1.11 Top 50 Institutions by Percentage of Master’s Degrees awarded to Underrepresented Minorities
Table 46: Top 50 Institutions by Percentage of Master’s Degreesawarded to Underrepresented Minorities
No Institutions Percent Underrepresented Minorities1 University of Puerto Rico, Mayaguez Campus 100%2 Alabama A & M University 88.9%3 Norfolk State University 66.7%3 Tuskegee University 66.7%5 The University of Texas at El Paso 65.6%6 The University of Texas Rio Grande Valley 64.9%7 Southern University and A & M College 60%8 North Carolina A&T State University 57.7%9 Jackson State University 53.8%
10 Capitol Technology University 50%11 Florida International University 47.8%12 Prairie View A & M University 44.4%13 University of San Diego 40%13 University of the District of Columbia 40%15 Howard University 37.5%15 Norwich University 37.5%17 Kennesaw State University 32.5%18 Loyola Marymount University 29.2%19 Gonzaga University 28.6%19 Texas A & M University-Corpus Christi 28.6%19 Thomas Jefferson University 28.6%22 Florida Atlantic University 28%23 St. Mary’s University 26.3%24 The University of Texas at San Antonio 25.2%25 Lipscomb University 25%25 Mississippi College 25%27 Embry-Riddle Aeronautical University-Worldwide 23.7%28 University of Central Florida 22.8%29 The University of New Mexico 22.3%30 The University of Tennessee-Chattanooga 22.2%31 City College of the City University of New York 21.4%32 Morgan State University 20.8%33 Fairleigh Dickinson University-Metropolitan Campus 20%33 SUNY Polytechnic Institute 20%35 University of Miami 18.9%36 Princeton University 17.4%37 Pace University 16.7%37 University of Southern Mississippi 16.7%39 Tennessee State University 15.8%40 Northern Arizona University 15.4%41 University of Saint Thomas 15.2%42 Old Dominion University 15.1%43 California State University, Los Angeles 14.9%
34

Table 46: Top 50 Institutions by Percentage of Master’s Degreesawarded to Underrepresented Minorities (continued)
No Institutions Percent Underrepresented Minorities44 University of Louisiana at Lafayette 14.7%45 University of California, Riverside 14.4%46 Colorado State University-Pueblo 14.3%46 Georgia Southern University 14.3%46 Oregon Institute of Technology 14.3%46 The University of Texas at Tyler 14.3%46 University of Central Oklahoma 14.3%* 422 Institutions included
3.1.12 Top 20 Institutions Awarding Highest Percentage of Master’s Degrees to Women
Table 47: Top 20 Highest Percentage of Master’s Degrees to Women
No Institutions Percent Women1 West Texas A & M University 100%2 Thomas Jefferson University 85.7%3 Fairleigh Dickinson University-Metropolitan Campus 80%4 Texas A & M University-Corpus Christi 57.1%5 University of Washington-Tacoma 56.8%6 University of Georgia 53.3%7 Capitol Technology University 50%7 Central Connecticut State University 50%7 Lipscomb University 50%7 Pennsylvania State University-Penn State Great Valley 50%7 Tulane University 50%7 University of South Dakota 50%13 Dartmouth College 46.2%14 The University of Memphis 44.4%15 Monmouth University 43.8%16 Tufts University 43.5%17 Princeton University 43.5%18 University of California, Merced 43.3%19 Georgia Southern University 42.9%19 University of Central Oklahoma 42.9%* 422 included
3.1.13 Top 20 Institutions by Total Masters’s Degrees awarded in Engineering (General)
Table 48: Top 20 Institutions by Total Master’s Degrees awardedin Engineering (General)
No Institutions Degrees Awarded1 Old Dominion University 1002 Lamar University 953 Arizona State University 904 Oklahoma Christian University 605 University of Oklahoma, Gallogly College of Engineering 416 San Francisco State University 407 University of Arkansas 397 University of Wisconsin, Platteville 399 California State University-Fresno 37
10 Marshall University 3210 University of the Pacific 3212 Villanova University 3013 Eastern Michigan University 2713 The University of Tennessee-Chattanooga 2715 University of Massachusetts Lowell 2416 Prairie View A & M University 2316 Purdue University Fort Wayne 2318 Texas State University 2219 University of Georgia 2120 Case Western Reserve University 19* 129 Institutions included
35

3.2 ENGINEERING MASTER’S ENROLLMENT3.2.1 Masters Enrollment by Race, Ethnicity, and Gender
Table 49: Master’s Enrollment Awarded by Race, Ethnicity, and Gender 84,847*
Ethnicity EnrollmentsNonresident Alien Male 38,517Nonresident Alien Female 15,957Unknown Male 1,946Unknown Female 1,001Hispanic Male 2,224Hispanic Female 777White Male 12,261White Female 4,209Black or Afr. American Male 909Black or Afr. American Female 402Asian American Male 3,588Asian American Female 1,624American Indian Male 63American Indian Female 31Native Hawaiian/Other Pacfic Islander Male 32Native Hawaiian/Other Pacfic Islander Female 12Multiracial Male 901Multiracial Female 393Total Male 60,441Total Female 24,406* Total Enrollment includes is for full time students* Includes 112 male and 44 female.
38,517
15,957
1,9461,0012,224
777
12,261
4,209
909402
3,5881,624
6331 3212 901393
60,441
24,406
0
20,000
40,000
60,000
Nonre
siden
t Alie
n
Unkno
wn
Hispan
ic
Whit
e
Black o
r Afr.
Amer
Asian
Amer
Amer
ican
India
n
Pacific
Islan
der
Mult
iracia
lTo
tal
Female
Male
Masters Enrollment by Race, Ethnicity, and Gender
3.2.2 Top 50 Institutions with Highest Graduate Enrollment
Table 50: Top 50 Institutions with Highest Graduate Enrollment*
No Institutions Enrollment1 Northeastern University 6,6812 University of Southern California 6,1993 Georgia Institute of Technology 5,2044 The Johns Hopkins University 4,8825 University of Illinois at Urbana-Champaign 4,5966 Arizona State University 4,3537 Carnegie Mellon University 4,2638 Columbia University 4,1159 Purdue University 4,110
10 Texas A&M University 3,69011 Stanford University 3,63712 North Carolina State University 3,57413 University of Michigan 3,53114 University of Arizona 3,18615 University of California, San Diego 3,17416 Massachusetts Institute of Technology 3,140
36

Table 50: Top 50 Institutions with Highest Graduate Enrollment*(continued)
No Institutions Enrollment17 NYU Tandon School of Engineering 2,87818 University of Washington in Seattle 2,78119 University of Florida 2,61920 The University of Texas at Arlington 2,56821 Cornell University 2,55722 The University of Texas at Austin 2,54923 University of California, Berkeley 2,37324 Virginia Polytechnic Institute and State University 2,20625 University of Pennsylvania 2,19926 Northwestern University 2,19827 The University of Texas at Dallas 2,19528 University of California, Los Angeles 2,19329 San Jose State University 2,18430 The Pennsylvania State University 2,16731 University of Maryland, College Park 2,10232 University of Colorado Boulder 2,09733 New Jersey Institute of Technology 2,00534 Stevens Institute of Technology 1,96135 The George Washington University 1,94936 University of Wisconsin-Madison 1,85837 The Ohio State University 1,81238 George Mason University 1,78239 University of Minnesota -Twin Cities 1,77640 University of Central Florida 1,75441 University of California, Irvine 1,69642 Stony Brook University 1,57443 University at Buffalo, SUNY 1,56744 Clemson University 1,53445 Washington University in St. Louis 1,47446 Duke University 1,46247 Colorado School of Mines 1,38448 Boston University 1,34449 Iowa State University 1,34050 University of Utah 1,321* 50 Institutions reported.Includes both part-time and full-time.
3.2.3 Masters Enrollment by Engineering Discipline:(Full time and Part time)
Table 51: Masters Enrollment by Engineering Discipline:(Full time and Part time)
Discipline Name Full Time Part TimeAerospace 2,164 1,415Architectural 127 27Biological and Agricultural 449 109Biomedical 3,548 939Chemical 2,237 640Civil 5,819 3,266Civil/Environmental 1,237 318Computer 3,404 1,281Computer Sci. (inside Eng.) 19,291 8,006Electrical 8,000 3,801Electrical/Computer 6,478 2,387Engineering (General) 788 1,105Engineering Management 2,530 3,110Engr. Science and Engr. Physics 155 156Envr. Eng 707 495Industrial/Manufacturing/Systems 5,461 4,091Mechanical 10,271 5,280Metallurgical and Matrls. 1,563 579Mining 79 48Nuclear 305 175Other 9,896 5,228Petroleum 338 123
3.2.4 Masters Enrollment by Gender
Table 52: Masters Enrollment by Gender
Gender PercentageFemale 28.9%Male 71.1%
37

71.1%
28.9%
0%
10%
20%
30%
40%
50%
60%
70%
80%
90%
100%
Mal
e
Fem
ale
Masters Enrollment Degrees Awarded by Gender
3.2.5 Masters Enrollment by Race and Ethnicity
Table 53: Masters Enrollment by Race and Ethnicity*
Ethnicity PercentageBlack or Afr. American 4.4%Hispanic 9.7%Other 4.7%Asian American 17.8%White 53.7%Unknown 9.8%
4.4%9.7%
4.7%
17.8%
53.7%
9.8%
0%
10%
20%
30%
40%
50%
60%
70%
80%
90%
100%
Bla
ck o
r Afr.
Am
eric
an
His
pani
c
Oth
er
Asi
an A
mer
ican
Whi
te
Unk
now
n
Masters Enrollment by Race and Ethnicity
3.2.6 Masters Enrollment by Residency
Table 54: Masters Enrollment by Residency
Nationality PercentageForeign 64.9%Domestic 35.1%
38

64.9%
35.1%
0%
10%
20%
30%
40%
50%
60%
70%
80%
90%
100%
Dom
estic
Fore
ign
Masters Enrollment by Residency
39

4 ENGINEERING DOCTORAL4.1 ENGINEERING DOCTORAL DEGREES4.1.1 Doctoral Degrees Awarded by Engineering Discipline
Table 55: Doctoral Degrees by discipline: 12,372
Discipline Name Degrees AwardedMechanical 1,660Electrical/Computer 1,233Electrical 1,162Computer Sci. (inside Eng.) 1,130Biomedical 1,101Chemical 1,092Other 986Civil 975Metallurgical and Matrls. 805Industrial/Manufacturing/Systems 467Computer Sci. (outside Engr.) 451Aerospace 382Civil/Environmental 243Computer 235Envr. Eng 168Petroleum 152Nuclear 144Biological and Agricultural 139Engr. Science and Engr. Physics 131Engineering (General) 129Architectural 14Engr. Management 12Mining 12* Total does not include computer science (outsideengineering).
1,660
1,2331,162 1,130 1,101 1,092
986 975
805
467 451 382
243 235 168 152 144 139 131 129
14 12 120
500
1,000
1,500
Mec
hani
cal
Ele
ctric
al/C
ompu
ter
Ele
ctric
al
Com
pute
r Sci
. (in
side
Eng
.)B
iom
edic
alC
hem
ical
Oth
er
Civ
il
Met
allu
rgic
al a
nd M
atrls
.
Indu
stria
l/Man
ufac
turin
g/S
yste
ms
Com
pute
r Sci
. (ou
tsid
e E
ngr.)
Aer
ospa
ceC
ivil/
Env
ironm
enta
lC
ompu
ter
Env
r. E
ngP
etro
leum
Nuc
lear
Bio
logi
cal a
nd A
gric
ultu
ral
Eng
r. S
cien
ce a
nd E
ngr.
Phy
sics
Eng
inee
ring
(Gen
eral
)A
rchi
tect
ural
Eng
r. M
anag
emen
tM
inin
g
Doctoral Degrees Awarded by Engineering Discipline
40

4.1.2 Total Doctoral Degrees Awarded to Underrepresented Minorities by Engineering Discipline
Table 56: Doctoral Degrees Awarded to Underrepresented Minorities by Engineering Discipline: 568
Discipline Name Degrees AwardedBiomedical 91Other 76Chemical 68Mechanical 61Civil 38Computer Sci. (inside Eng.) 37Electrical/Computer 37Metallurgical and Matrls. 31Industrial/Manufacturing/Systems 30Electrical 26Aerospace 18Envr. Eng 13Civil/Environmental 11Nuclear 9Biological and Agricultural 6Computer 5Computer Sci. (outside Engr.) 5Engineering (General) 4Petroleum 4Engr. Science and Engr. Physics 3Architectural 0Engr. Management 0Mining 0* Total does not include computer science (outsideengineering).
4.1.3 Percentage of Doctoral Degrees Awarded to Underrepresented Minorities by Discipline
Table 57: Percentage of Doctoral Degrees Awarded to Underrepre-sented Minorities by Discipline 4.4 % of Total
Discipline Name Percent WomenBiomedical 8.3%Envr. Eng 7.7%Other 7.7%Industrial/Manufacturing/Systems 6.4%Chemical 6.2%Nuclear 6.2%Aerospace 4.7%Civil/Environmental 4.5%Biological and Agricultural 4.3%Civil 3.9%Metallurgical and Matrls. 3.9%Mechanical 3.7%Computer Sci. (inside Eng.) 3.3%Engineering (General) 3.1%Electrical/Computer 3%Petroleum 2.6%Engr. Science and Engr. Physics 2.3%Electrical 2.2%Computer 2.1%Computer Sci. (outside Engr.) 1.1%Architectural 0%Engr. Management 0%Mining 0%
4.1.4 Percentage of Doctoral Degrees Awarded to Women by Discipline
Table 58: Percentage of Doctoral Degrees Awarded to Women byDiscipline 24.1 % of Total
Discipline Name Percent WomenEngr. Management 50%Envr. Eng 41.1%Biomedical 36.3%Civil/Environmental 35.4%Biological and Agricultural 35.3%Chemical 32.1%Engineering (General) 30.2%Metallurgical and Matrls. 29.2%Industrial/Manufacturing/Systems 28.9%
41
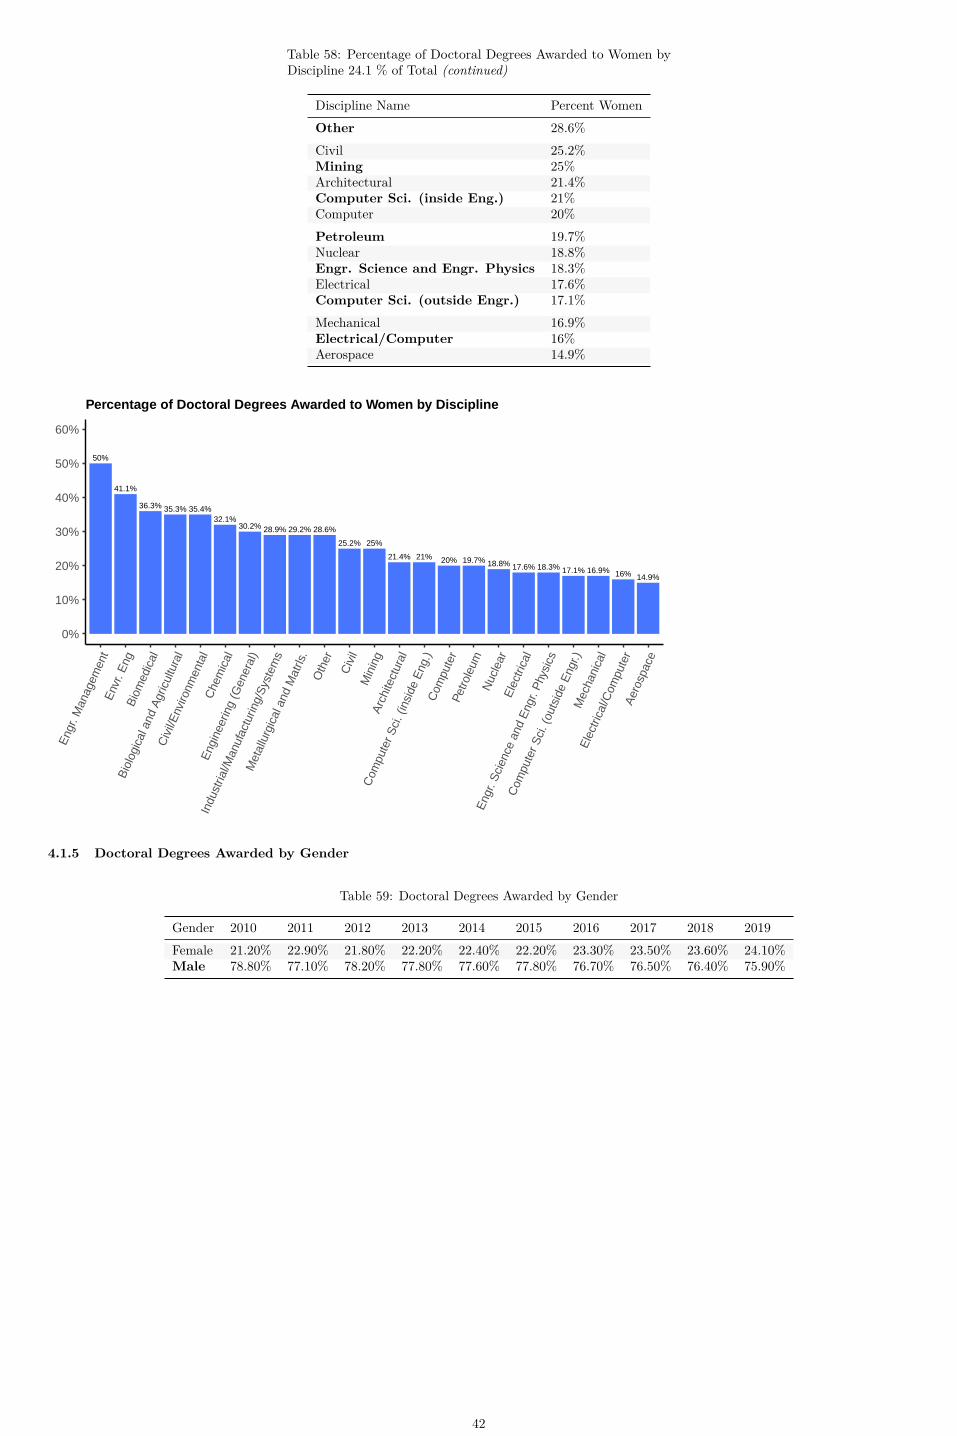
Table 58: Percentage of Doctoral Degrees Awarded to Women byDiscipline 24.1 % of Total (continued)
Discipline Name Percent WomenOther 28.6%Civil 25.2%Mining 25%Architectural 21.4%Computer Sci. (inside Eng.) 21%Computer 20%Petroleum 19.7%Nuclear 18.8%Engr. Science and Engr. Physics 18.3%Electrical 17.6%Computer Sci. (outside Engr.) 17.1%Mechanical 16.9%Electrical/Computer 16%Aerospace 14.9%
50%
41.1%
36.3% 35.4%35.3%32.1%
30.2% 29.2%28.9% 28.6%
25.2% 25%
21.4% 21% 20% 19.7% 18.8% 18.3%17.6% 17.1% 16.9% 16% 14.9%
0%
10%
20%
30%
40%
50%
60%
Eng
r. M
anag
emen
tE
nvr.
Eng
Bio
med
ical
Bio
logi
cal a
nd A
gric
ultu
ral
Civ
il/E
nviro
nmen
tal
Che
mic
al
Eng
inee
ring
(Gen
eral
)
Indu
stria
l/Man
ufac
turin
g/S
yste
ms
Met
allu
rgic
al a
nd M
atrls
.O
ther
Civ
ilM
inin
gA
rchi
tect
ural
Com
pute
r Sci
. (in
side
Eng
.)C
ompu
ter
Petro
leum
Nuc
lear
Ele
ctric
al
Eng
r. S
cien
ce a
nd E
ngr.
Phy
sics
Com
pute
r Sci
. (ou
tsid
e E
ngr.)
Mec
hani
cal
Ele
ctric
al/C
ompu
ter
Aer
ospa
ce
Percentage of Doctoral Degrees Awarded to Women by Discipline
4.1.5 Doctoral Degrees Awarded by Gender
Table 59: Doctoral Degrees Awarded by Gender
Gender 2010 2011 2012 2013 2014 2015 2016 2017 2018 2019Female 21.20% 22.90% 21.80% 22.20% 22.40% 22.20% 23.30% 23.50% 23.60% 24.10%Male 78.80% 77.10% 78.20% 77.80% 77.60% 77.80% 76.70% 76.50% 76.40% 75.90%
42

75.9%
24.1%
0%
10%
20%
30%
40%
50%
60%
70%
80%
90%
100%
Mal
e
Fem
ale
Doctoral Degrees Awarded by Gender
4.1.6 Doctoral Degrees Awarded by Race and Ethnicity
Table 60: Doctoral Degrees Awarded by Ethnicity
Ethnicity 2011 2012 2013 2014 2015 2016 2017 2018 2019Black or Afr. American 3.5% 4.1% 4.1% 3.6% 3.2% 4.4% 3.8% 4.2% 3.9%Hispanic 4.2% 4.1% 4.7% 5.1% 6.1% 5.7% 6.3% 6.0% 6.1%Other 1.6% 1.7% 1.7% 1.6% 2.2% 3.1% 2.9% 2.9% 2.8%Asian American 15.1% 14.1% 13.5% 10.4% 14.1% 14.9% 14.8% 13.9% 15.3%White 60.3% 61.1% 61.8% 65.1% 62.9% 62.0% 62.2% 62.0% 61.1%Unknown 15.3% 14.9% 14.2% 14.2% 11.5% 9.9% 10.0% 11.1% 10.8%
3.9% 6.1%2.8%
15.3%
61.1%
10.8%
0%
10%
20%
30%
40%
50%
60%
70%
80%
90%
100%
Bla
ck o
r Afr.
Am
eric
an
His
pani
c
Oth
er
Asi
an A
mer
ican
Whi
te
Unk
now
n
Doctoral Degrees Awarded by Race and Ethnicity
4.1.7 Doctoral Degrees Awarded by Residency
Table 61: Doctoral Degrees Awarded by Residency
Nationality 2010 2011 2012 2013 2014 2015 2016 2017 2018 2019Foreign 54.2% 54.2% 53.3% 55.1% 54.8% 54.7% 54.8% 55.7% 56.3% 56.4%Domestic 45.8% 45.8% 46.7% 44.9% 45.2% 45.3% 45.2% 44.3% 43.7% 43.6%
43

56.4%
43.6%
0%
10%
20%
30%
40%
50%
60%
70%
80%
90%
100%
Dom
estic
Fore
ign
Doctoral Degrees Awarded by Residency
4.1.8 Doctoral Degrees Awarded by Race, Ethnicity, and Gender
Table 62: Doctoral Degrees Awarded by Race, Ethnicity, and Gender 12,372*
Ethnicity DegreesNonresident Alien Male 5,359Nonresident Alien Female 1,556Unknown Male 446Unknown Female 144Hispanic Male 240Hispanic Female 90White Male 2,488White Female 843Black or Afr. American Male 136Black or Afr. American Female 78Asian American Male 581Asian American Female 250American Indian Male 13American Indian Female 4Native Hawaiian/Other Pacfic Islander Male 6Native Hawaiian/Other Pacfic Islander Female 0Multiracial Male 88Multiracial Female 43Total Male 9,357Total Female 3,008* Total degree includes 0 total Non binary graduates and 8 total Other Gender graduates.* Includes 11 male and0 female graduates from Puerto Rico.
44

5,359
1,556
446144 24090
2,488
843
13678
581250
134 60 8843
9,357
3,008
0
2,500
5,000
7,500
Nonre
siden
t Alie
n
Unkno
wn
Hispan
ic
Whit
e
Black o
r Afr.
Amer
Asian
Amer
Amer
ican
India
n
Pacific
Islan
der
Mult
iracia
lTo
tal
Female
Male
Doctoral Degrees Awarded by Race, Ethnicity, and Gender
4.1.9 Top 50 Institutions Awarding Engineering Doctoral Degrees
Table 63: Highest Number of Engineering Doctoral Degrees
No Institutions Degrees Awarded1 Georgia Institute of Technology 3792 Massachusetts Institute of Technology 3703 Stanford University 3164 University of Illinois at Urbana-Champaign 3105 Purdue University 3046 Texas A&M University 2747 University of Michigan 2738 The University of Texas at Austin 2709 University of California, Berkeley 229
10 Carnegie Mellon University 21211 Virginia Polytechnic Institute and State University 20012 University of Maryland, College Park 19513 University of California, San Diego 18413 University of Washington in Seattle 18415 University of Southern California 18216 University of Wisconsin-Madison 17817 The Pennsylvania State University 17418 Cornell University 16918 The Ohio State University 16920 University of Florida 16621 University of Minnesota -Twin Cities 16222 North Carolina State University 15923 University of California, Los Angeles 15824 Arizona State University 15725 Northwestern University 15026 Iowa State University 14327 Columbia University 13627 The George Washington University 13629 University of California, Irvine 13530 University of Colorado Boulder 13131 The Johns Hopkins University 12132 University of Utah 11333 University of Tennessee, Knoxville 11034 Stony Brook University 10935 University of Central Florida 10836 Rutgers, The State University of New Jersey, School of Engineering 10536 University of California, Davis 10536 William Marsh Rice University 10539 Colorado School of Mines 10139 Rensselaer Polytechnic Institute 10141 Princeton University 9742 University of Houston 9643 Northeastern University 9544 Clemson University 9344 University of Delaware 9346 University of Connecticut 9247 Missouri University of Science and Technology 9147 University of California, Riverside 9149 Michigan State University 9050 Oregon State University 89* 422 Institutions reported.Includes both Part-time and full-time
45

4.1.10 Top 20 Institutions by Total Doctoral Degrees awarded to Underrepresented Minorities
Table 64: Top 20 Institutions by Total Doctoral Degrees awardedto Underrepresented Minorities
No Institutions Degrees Awarded1 The George Washington University 302 Georgia Institute of Technology 242 Massachusetts Institute of Technology 244 Stanford University 205 University of California, Riverside 165 University of Michigan 167 University of Florida 158 University of California, Berkeley 149 University of Puerto Rico, Mayaguez Campus 11
10 Northwestern University 1010 Purdue University 1010 University of California, Los Angeles 1010 University of Maryland, College Park 1014 Cornell University 914 University of California, San Diego 914 University of Central Florida 914 University of Washington in Seattle 914 University of Wisconsin-Madison 919 Texas A&M University 819 The Johns Hopkins University 8* 422 Institutions included
4.1.11 Top 50 Institutions by Percentage of Doctoral Degrees awarded to Underrepresented Minorities
Table 65: Top 50 Institutions by Percentage of Doctoral Degreesawarded to Underrepresented Minorities
No Institutions Percent Underrepresented Minorities1 University of Puerto Rico, Mayaguez Campus 100%2 Texas A&M University - Kingsville 50%2 Texas State University 50%4 Morgan State University 36.4%5 North Carolina A&T State University 30%6 University of Miami 25%7 The George Washington University 22.1%8 The University of Texas at El Paso 21.1%9 University of California, Riverside 17.6%
10 California State University, Long Beach 16.7%10 University of North Carolina at Chapel Hill 16.7%12 University of Hawaii at Manoa 14.3%12 University of North Dakota 14.3%12 University of Southern Mississippi 14.3%15 University of Maryland, Baltimore County 13.9%16 University of Rhode Island 12.5%17 The University of Texas at San Antonio 12.1%18 University of Arkansas 11.4%19 Howard University 11.1%20 City College of the City University of New York 10.3%21 Embry Riddle Aeronautical University-Daytona Beach 9.1%21 Ohio University 9.1%21 Vanderbilt University 9.1%24 University of Florida 9%25 The University of New Mexico 8.9%26 University of South Carolina 8.9%27 University of California-Santa Cruz 8.7%28 University of Notre Dame 8.6%28 West Virginia University 8.6%30 University of Central Florida 8.3%31 Air Force Institute of Technology 7.7%31 The Catholic University of America 7.7%33 University of Missouri 7%34 Duke University 6.9%35 The University of Texas at Dallas 6.7%36 Northwestern University 6.7%36 Tennessee Technological University 6.7%36 William Marsh Rice University 6.7%39 The Johns Hopkins University 6.6%40 Florida International University 6.5%41 Massachusetts Institute of Technology 6.5%42 University of Delaware 6.5%42 Utah State University 6.5%44 Case Western Reserve University 6.4%45 FAMU-FSU College of Engineering 6.3%46 Georgia Institute of Technology 6.3%47 Stanford University 6.3%47 University of California, Los Angeles 6.3%49 Northeastern University 6.3%50 University of California, Berkeley 6.1%
46
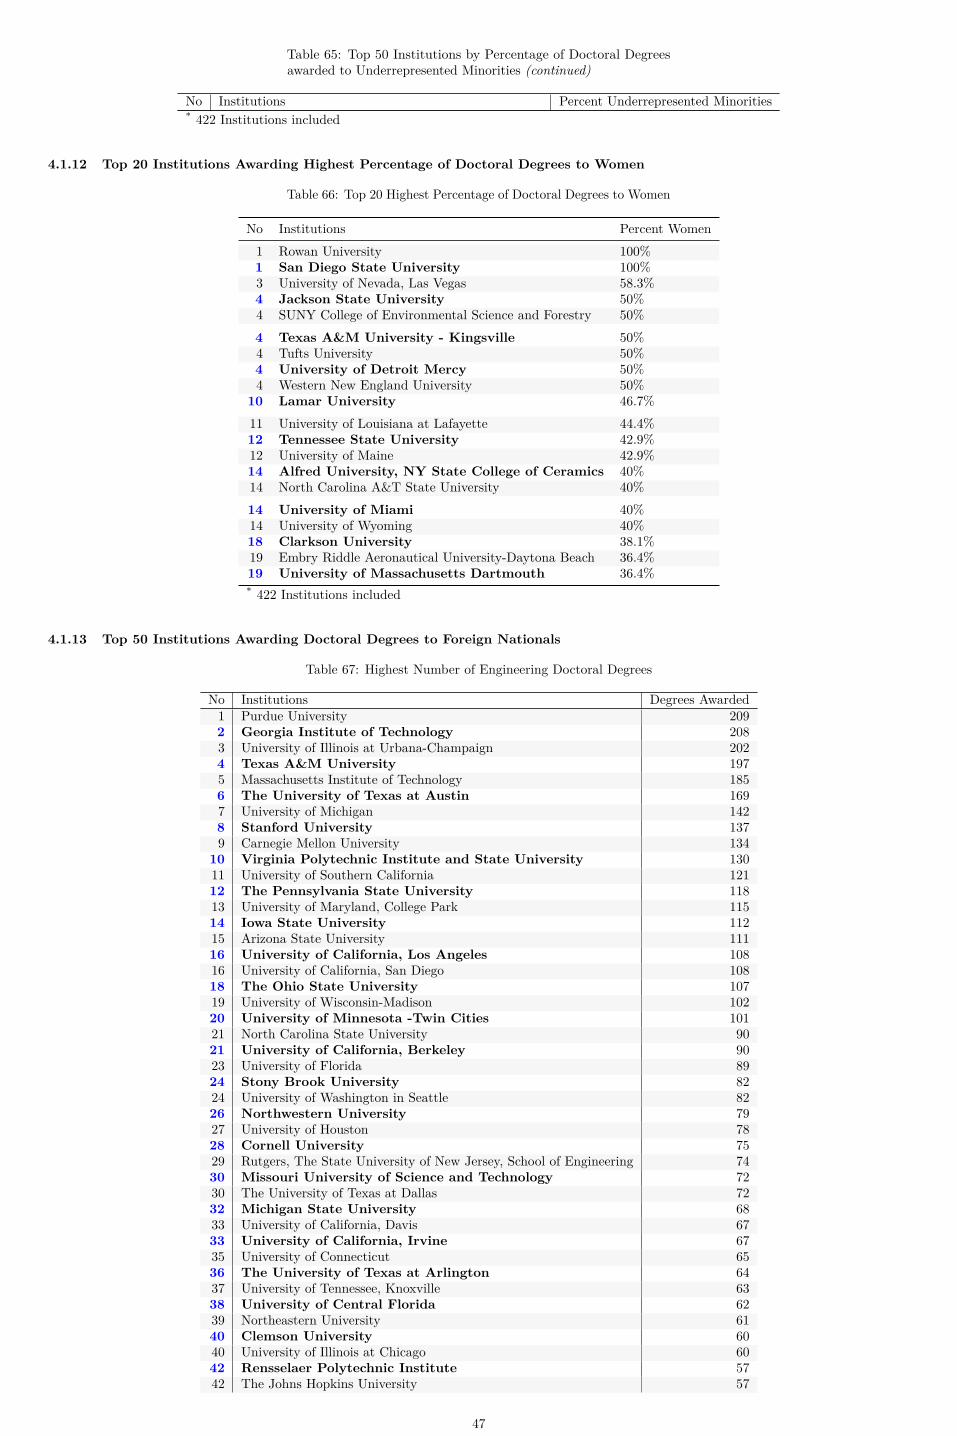
Table 65: Top 50 Institutions by Percentage of Doctoral Degreesawarded to Underrepresented Minorities (continued)
No Institutions Percent Underrepresented Minorities* 422 Institutions included
4.1.12 Top 20 Institutions Awarding Highest Percentage of Doctoral Degrees to Women
Table 66: Top 20 Highest Percentage of Doctoral Degrees to Women
No Institutions Percent Women1 Rowan University 100%1 San Diego State University 100%3 University of Nevada, Las Vegas 58.3%4 Jackson State University 50%4 SUNY College of Environmental Science and Forestry 50%4 Texas A&M University - Kingsville 50%4 Tufts University 50%4 University of Detroit Mercy 50%4 Western New England University 50%
10 Lamar University 46.7%11 University of Louisiana at Lafayette 44.4%12 Tennessee State University 42.9%12 University of Maine 42.9%14 Alfred University, NY State College of Ceramics 40%14 North Carolina A&T State University 40%14 University of Miami 40%14 University of Wyoming 40%18 Clarkson University 38.1%19 Embry Riddle Aeronautical University-Daytona Beach 36.4%19 University of Massachusetts Dartmouth 36.4%* 422 Institutions included
4.1.13 Top 50 Institutions Awarding Doctoral Degrees to Foreign Nationals
Table 67: Highest Number of Engineering Doctoral Degrees
No Institutions Degrees Awarded1 Purdue University 2092 Georgia Institute of Technology 2083 University of Illinois at Urbana-Champaign 2024 Texas A&M University 1975 Massachusetts Institute of Technology 1856 The University of Texas at Austin 1697 University of Michigan 1428 Stanford University 1379 Carnegie Mellon University 134
10 Virginia Polytechnic Institute and State University 13011 University of Southern California 12112 The Pennsylvania State University 11813 University of Maryland, College Park 11514 Iowa State University 11215 Arizona State University 11116 University of California, Los Angeles 10816 University of California, San Diego 10818 The Ohio State University 10719 University of Wisconsin-Madison 10220 University of Minnesota -Twin Cities 10121 North Carolina State University 9021 University of California, Berkeley 9023 University of Florida 8924 Stony Brook University 8224 University of Washington in Seattle 8226 Northwestern University 7927 University of Houston 7828 Cornell University 7529 Rutgers, The State University of New Jersey, School of Engineering 7430 Missouri University of Science and Technology 7230 The University of Texas at Dallas 7232 Michigan State University 6833 University of California, Davis 6733 University of California, Irvine 6735 University of Connecticut 6536 The University of Texas at Arlington 6437 University of Tennessee, Knoxville 6338 University of Central Florida 6239 Northeastern University 6140 Clemson University 6040 University of Illinois at Chicago 6042 Rensselaer Polytechnic Institute 5742 The Johns Hopkins University 57
47
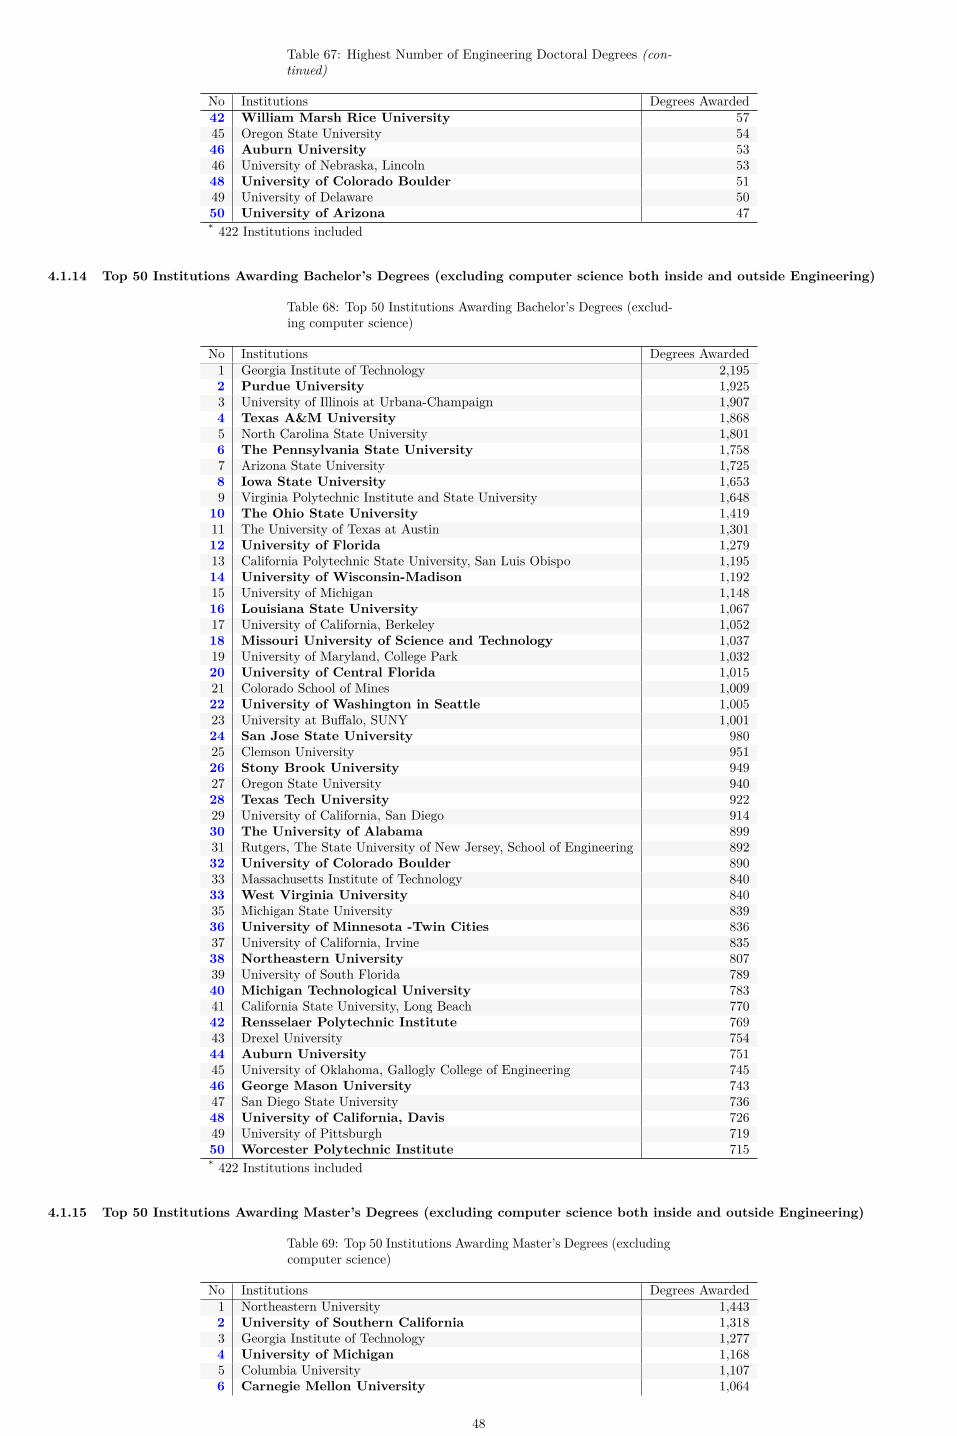
Table 67: Highest Number of Engineering Doctoral Degrees (con-tinued)
No Institutions Degrees Awarded42 William Marsh Rice University 5745 Oregon State University 5446 Auburn University 5346 University of Nebraska, Lincoln 5348 University of Colorado Boulder 5149 University of Delaware 5050 University of Arizona 47* 422 Institutions included
4.1.14 Top 50 Institutions Awarding Bachelor’s Degrees (excluding computer science both inside and outside Engineering)
Table 68: Top 50 Institutions Awarding Bachelor’s Degrees (exclud-ing computer science)
No Institutions Degrees Awarded1 Georgia Institute of Technology 2,1952 Purdue University 1,9253 University of Illinois at Urbana-Champaign 1,9074 Texas A&M University 1,8685 North Carolina State University 1,8016 The Pennsylvania State University 1,7587 Arizona State University 1,7258 Iowa State University 1,6539 Virginia Polytechnic Institute and State University 1,648
10 The Ohio State University 1,41911 The University of Texas at Austin 1,30112 University of Florida 1,27913 California Polytechnic State University, San Luis Obispo 1,19514 University of Wisconsin-Madison 1,19215 University of Michigan 1,14816 Louisiana State University 1,06717 University of California, Berkeley 1,05218 Missouri University of Science and Technology 1,03719 University of Maryland, College Park 1,03220 University of Central Florida 1,01521 Colorado School of Mines 1,00922 University of Washington in Seattle 1,00523 University at Buffalo, SUNY 1,00124 San Jose State University 98025 Clemson University 95126 Stony Brook University 94927 Oregon State University 94028 Texas Tech University 92229 University of California, San Diego 91430 The University of Alabama 89931 Rutgers, The State University of New Jersey, School of Engineering 89232 University of Colorado Boulder 89033 Massachusetts Institute of Technology 84033 West Virginia University 84035 Michigan State University 83936 University of Minnesota -Twin Cities 83637 University of California, Irvine 83538 Northeastern University 80739 University of South Florida 78940 Michigan Technological University 78341 California State University, Long Beach 77042 Rensselaer Polytechnic Institute 76943 Drexel University 75444 Auburn University 75145 University of Oklahoma, Gallogly College of Engineering 74546 George Mason University 74347 San Diego State University 73648 University of California, Davis 72649 University of Pittsburgh 71950 Worcester Polytechnic Institute 715* 422 Institutions included
4.1.15 Top 50 Institutions Awarding Master’s Degrees (excluding computer science both inside and outside Engineering)
Table 69: Top 50 Institutions Awarding Master’s Degrees (excludingcomputer science)
No Institutions Degrees Awarded1 Northeastern University 1,4432 University of Southern California 1,3183 Georgia Institute of Technology 1,2774 University of Michigan 1,1685 Columbia University 1,1076 Carnegie Mellon University 1,064
48

Table 69: Top 50 Institutions Awarding Master’s Degrees (excludingcomputer science) (continued)
No Institutions Degrees Awarded7 The Johns Hopkins University 1,0098 San Jose State University 9619 Arizona State University 951
10 Stanford University 88711 Texas A&M University 88012 University of California, Berkeley 87413 Massachusetts Institute of Technology 81914 University of Illinois at Urbana-Champaign 81315 Cornell University 76316 University of Washington in Seattle 72417 Stevens Institute of Technology 70118 North Carolina State University 67819 Purdue University 66720 University of Florida 66321 The University of Texas at Arlington 64222 Northwestern University 62623 University of California, Los Angeles 57024 University of California, San Diego 55925 University of Colorado Boulder 54226 The George Washington University 53127 New Jersey Institute of Technology 49428 University of Maryland, College Park 49129 NYU Tandon School of Engineering 48630 Worcester Polytechnic Institute 46331 University of Pennsylvania 46032 Stony Brook University 44433 Missouri University of Science and Technology 43534 Virginia Polytechnic Institute and State University 42935 The University of Texas at Austin 42536 University of South Florida 42437 George Mason University 39238 Duke University 38539 The Ohio State University 38440 University of Illinois at Chicago 38341 Illinois Institute of Technology 37742 Santa Clara University 35543 The Pennsylvania State University 35444 Boston University 35345 University of Houston 35046 Drexel University 34447 Rutgers, The State University of New Jersey, School of Engineering 33848 Washington University in St. Louis 33249 Colorado School of Mines 33049 University of Wisconsin-Madison 330* 422 Institutions included
4.1.16 Top 50 Institutions Awarding Doctoral Degrees (excluding computer science both inside and outside Engineering )
Table 70: Top 50 Institutions Awarding Doctoral Degrees (excludingcomputer science)
No Institutions Degrees Awarded1 Massachusetts Institute of Technology 3702 Georgia Institute of Technology 3523 Stanford University 2854 Purdue University 2785 Texas A&M University 2685 University of Illinois at Urbana-Champaign 2687 The University of Texas at Austin 2508 University of Michigan 2419 University of California, Berkeley 190
10 University of Washington in Seattle 18411 Virginia Polytechnic Institute and State University 17912 The Pennsylvania State University 17413 University of Maryland, College Park 16014 University of California, San Diego 15915 University of Wisconsin-Madison 15716 University of Florida 15417 Cornell University 15118 Northwestern University 15019 The Ohio State University 14920 North Carolina State University 13721 The George Washington University 13622 University of California, Los Angeles 13423 Iowa State University 13323 University of Minnesota -Twin Cities 13325 Arizona State University 13225 University of Southern California 13227 Carnegie Mellon University 12928 Columbia University 116
49
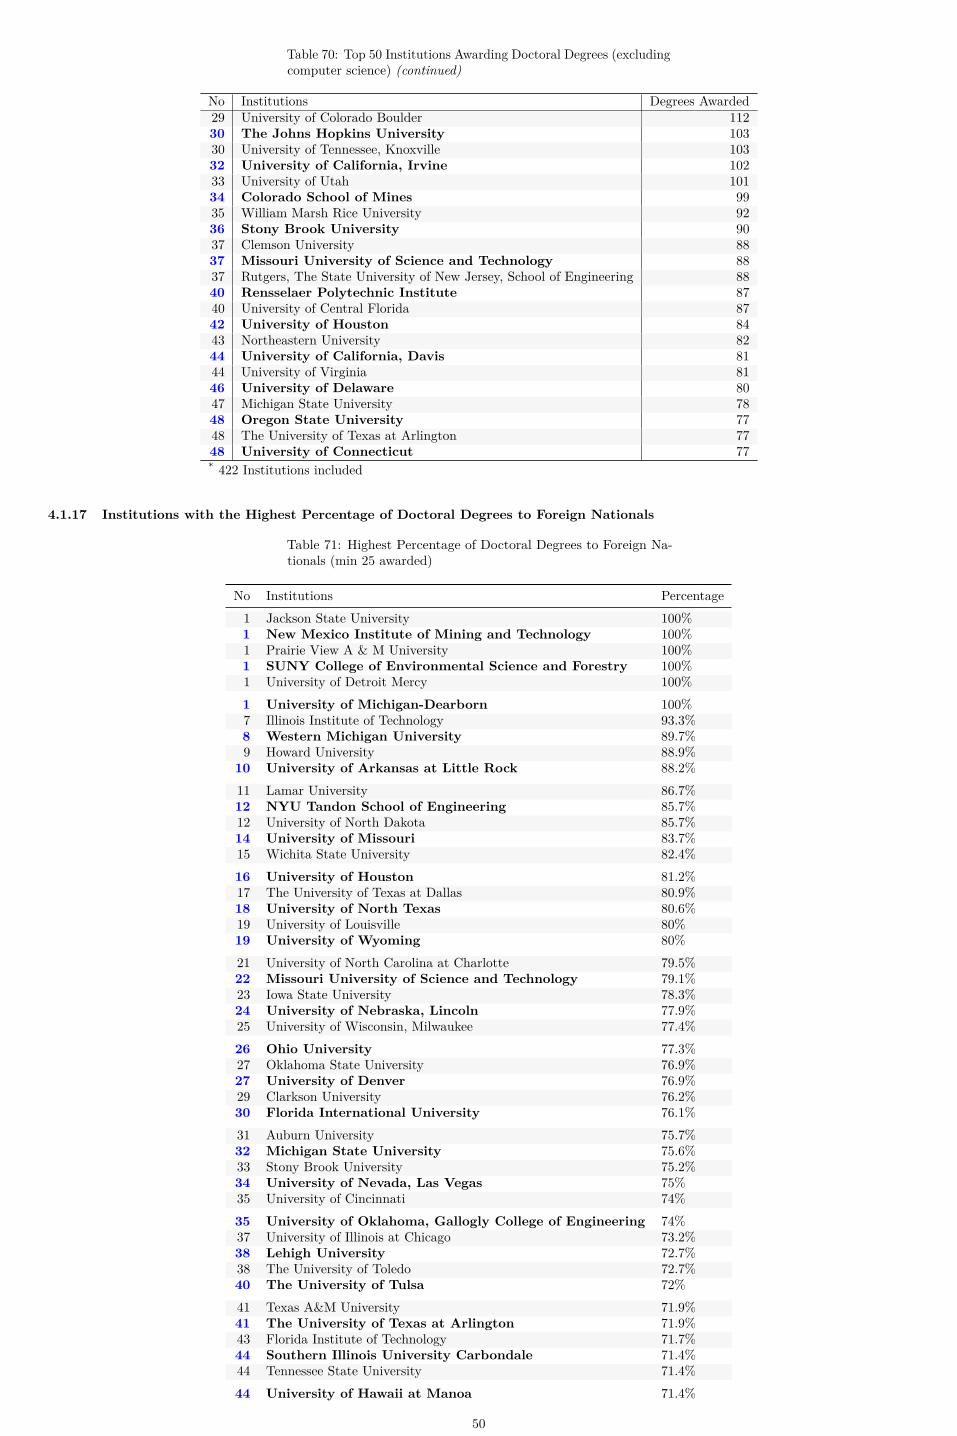
Table 70: Top 50 Institutions Awarding Doctoral Degrees (excludingcomputer science) (continued)
No Institutions Degrees Awarded29 University of Colorado Boulder 11230 The Johns Hopkins University 10330 University of Tennessee, Knoxville 10332 University of California, Irvine 10233 University of Utah 10134 Colorado School of Mines 9935 William Marsh Rice University 9236 Stony Brook University 9037 Clemson University 8837 Missouri University of Science and Technology 8837 Rutgers, The State University of New Jersey, School of Engineering 8840 Rensselaer Polytechnic Institute 8740 University of Central Florida 8742 University of Houston 8443 Northeastern University 8244 University of California, Davis 8144 University of Virginia 8146 University of Delaware 8047 Michigan State University 7848 Oregon State University 7748 The University of Texas at Arlington 7748 University of Connecticut 77* 422 Institutions included
4.1.17 Institutions with the Highest Percentage of Doctoral Degrees to Foreign Nationals
Table 71: Highest Percentage of Doctoral Degrees to Foreign Na-tionals (min 25 awarded)
No Institutions Percentage1 Jackson State University 100%1 New Mexico Institute of Mining and Technology 100%1 Prairie View A & M University 100%1 SUNY College of Environmental Science and Forestry 100%1 University of Detroit Mercy 100%1 University of Michigan-Dearborn 100%7 Illinois Institute of Technology 93.3%8 Western Michigan University 89.7%9 Howard University 88.9%
10 University of Arkansas at Little Rock 88.2%11 Lamar University 86.7%12 NYU Tandon School of Engineering 85.7%12 University of North Dakota 85.7%14 University of Missouri 83.7%15 Wichita State University 82.4%16 University of Houston 81.2%17 The University of Texas at Dallas 80.9%18 University of North Texas 80.6%19 University of Louisville 80%19 University of Wyoming 80%21 University of North Carolina at Charlotte 79.5%22 Missouri University of Science and Technology 79.1%23 Iowa State University 78.3%24 University of Nebraska, Lincoln 77.9%25 University of Wisconsin, Milwaukee 77.4%26 Ohio University 77.3%27 Oklahoma State University 76.9%27 University of Denver 76.9%29 Clarkson University 76.2%30 Florida International University 76.1%31 Auburn University 75.7%32 Michigan State University 75.6%33 Stony Brook University 75.2%34 University of Nevada, Las Vegas 75%35 University of Cincinnati 74%35 University of Oklahoma, Gallogly College of Engineering 74%37 University of Illinois at Chicago 73.2%38 Lehigh University 72.7%38 The University of Toledo 72.7%40 The University of Tulsa 72%41 Texas A&M University 71.9%41 The University of Texas at Arlington 71.9%43 Florida Institute of Technology 71.7%44 Southern Illinois University Carbondale 71.4%44 Tennessee State University 71.4%44 University of Hawaii at Manoa 71.4%
50

Table 71: Highest Percentage of Doctoral Degrees to Foreign Na-tionals (min 25 awarded) (continued)
No Institutions Percentage44 University of Nevada, Reno 71.4%48 Stevens Institute of Technology 71.1%49 Arizona State University 70.7%49 University of Connecticut 70.7%* 422 Institutions included
4.1.18 Institutions with the Lowest Percentage of Doctoral Degrees to Foreign Nationals
Table 72: Institutions with the Lowest Percentage of DoctoralDegrees to Foreign Nationals (min 25 awarded)
No Institutions Percentage1 Idaho State University 33.3%1 University of Alaska Fairbanks, College of Engineering and Mines 33.3%1 University of Louisiana at Lafayette 33.3%4 Duke University 36.8%5 University of South Alabama 37.1%6 Villanova University 37.5%7 University of California, Santa Barbara 38.4%8 Drexel University 38.9%8 University of Colorado Boulder 38.9%
10 University of California, Berkeley 39.3%11 Colorado State University 41%12 University of Colorado Denver 41.2%13 Colorado School of Mines 41.6%13 University of Utah 41.6%15 North Dakota State University 41.7%15 University of Dayton 41.7%17 Vanderbilt University 42.4%18 University of California, Riverside 42.9%18 University of Maine 42.9%20 Stanford University 43.4%21 Cornell University 44.4%22 The University of New Mexico 44.6%22 University of Washington in Seattle 44.6%24 Tufts University 44.7%25 University of Miami 45%
* 422 Institutions included
4.1.19 Top 10 Institutions by Total Doctoral Degrees awarded in Engineering (General)
Table 73: Top 10 Institutions by Total Doctoral Degrees awardedin Engineering (General)
No Institutions Degrees Awarded1 Old Dominion University 362 University of Nebraska, Lincoln 203 Morgan State University 93 University of California, Berkeley 95 Lamar University 85 University of Colorado Denver 85 Villanova University 88 University of Georgia 79 Montana State University 5
10 Jackson State University 4* 129 Institutions included
51

4.2 ENGINEERING DOCTORAL ENROLLMENT4.2.1 Doctoral Enrollment by Race, Ethnicity, and Gender
Table 74: Doctoral Enrollment by Race, Ethnicity, and Gender 75,600*
Ethnicity EnrollmentsNonresident Alien Male 33,121Nonresident Alien Female 11,028Unknown Male 2,769Unknown Female 1,141Hispanic Male 1,845Hispanic Female 839White Male 12,922White Female 5,028Black or Afr. American Male 850Black or Afr. American Female 509Asian American Male 2,883Asian American Female 1,459American Indian Male 55American Indian Female 25Native Hawaiian/Other Pacfic Islander Male 27Native Hawaiian/Other Pacfic Islander Female 14Multiracial Male 731Multiracial Female 354Total Male 55,203Total Female 20,397* Includes 56 male and32 female enrolled students from Institutions in Puerto Rico.
33,121
11,028
2,7691,141 1,845
839
12,922
5,028
850509
2,8831,459
5525 2714 731354
55,203
20,397
0
20,000
40,000
Nonre
siden
t Alie
n
Unkno
wn
Hispan
ic
Whit
e
Black o
r Afr.
Amer
Asian
Amer
Amer
ican
India
n
Pacific
Islan
der
Mult
iracia
lTo
tal
Female
Male
Doctoral Enrollment by Race, Ethnicity, and Gender
52

4.2.2 Doctoral Enrollment by Engineering Discipline:(Full time and Part time)
Table 75: Doctoral Enrollment by Engineering Discipline:(Full time and Part time)
Discipline Name Full Time Part TimeAerospace 2,692 230Architectural 82 1Biological and Agricultural 672 76Biomedical 7,250 468Chemical 6,502 247Civil 4,842 584Civil/Environmental 1,243 166Computer 1,708 211Computer Sci. (inside Eng.) 9,103 993Computer Sci. (outside Engr.) 3,892 331Electrical 6,789 748Electrical/Computer 7,733 843Engineering (General) 729 99Engineering Management 157 199Engr. Science and Engr. Physics 771 58Envr. Eng 811 74Industrial/Manufacturing/Systems 3,008 608Mechanical 10,005 926Metallurgical and Matrls. 4,517 217Mining 99 29Nuclear 865 66Other 5,542 858Petroleum 480 62
4.2.3 Doctoral Enrollment by Gender
Table 76: Doctoral Enrollment by Gender
Gender PercentageFemale 26.8%Male 73.2%
73.2%
26.8%
0%
10%
20%
30%
40%
50%
60%
70%
80%
90%
100%
Mal
e
Fem
ale
Doctoral Enrollment by Gender
4.2.4 Doctoral Enrollment by Race and Ethnicity
Table 77: Doctoral Enrollment by Race and Ethnicity*
Ethnicity PercentageBlack or Afr. American 4.3%Hispanic 8.4%Other 3.8%Asian American 14%White 57.2%Unknown 12.3%
53
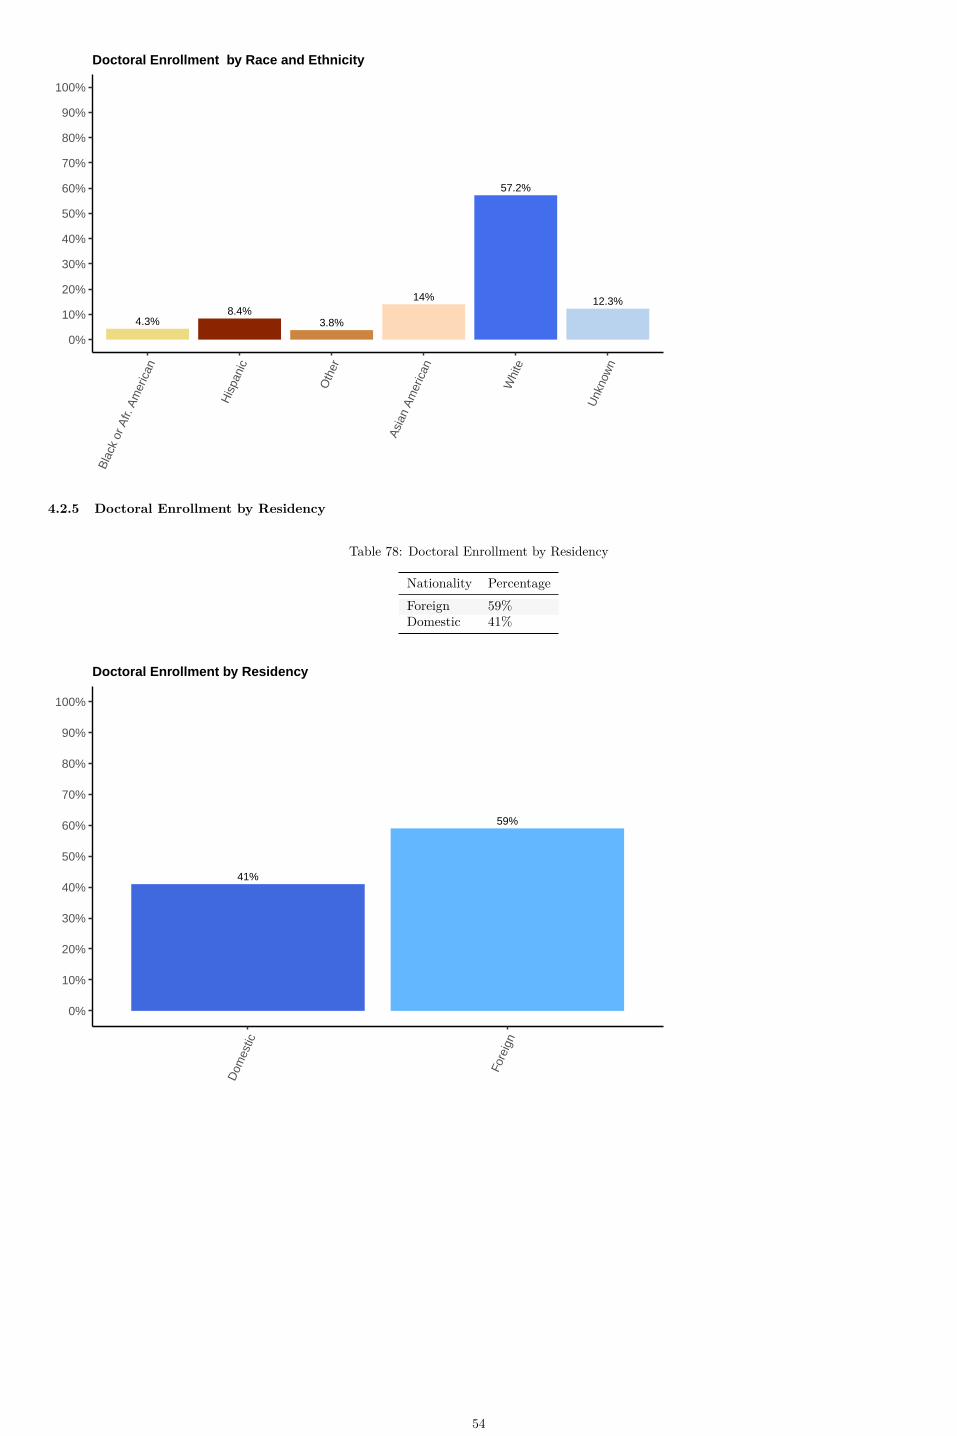
4.3%8.4%
3.8%
14%
57.2%
12.3%
0%
10%
20%
30%
40%
50%
60%
70%
80%
90%
100%B
lack
or A
fr. A
mer
ican
His
pani
c
Oth
er
Asi
an A
mer
ican
Whi
te
Unk
now
n
Doctoral Enrollment by Race and Ethnicity
4.2.5 Doctoral Enrollment by Residency
Table 78: Doctoral Enrollment by Residency
Nationality PercentageForeign 59%Domestic 41%
59%
41%
0%
10%
20%
30%
40%
50%
60%
70%
80%
90%
100%
Dom
estic
Fore
ign
Doctoral Enrollment by Residency
54
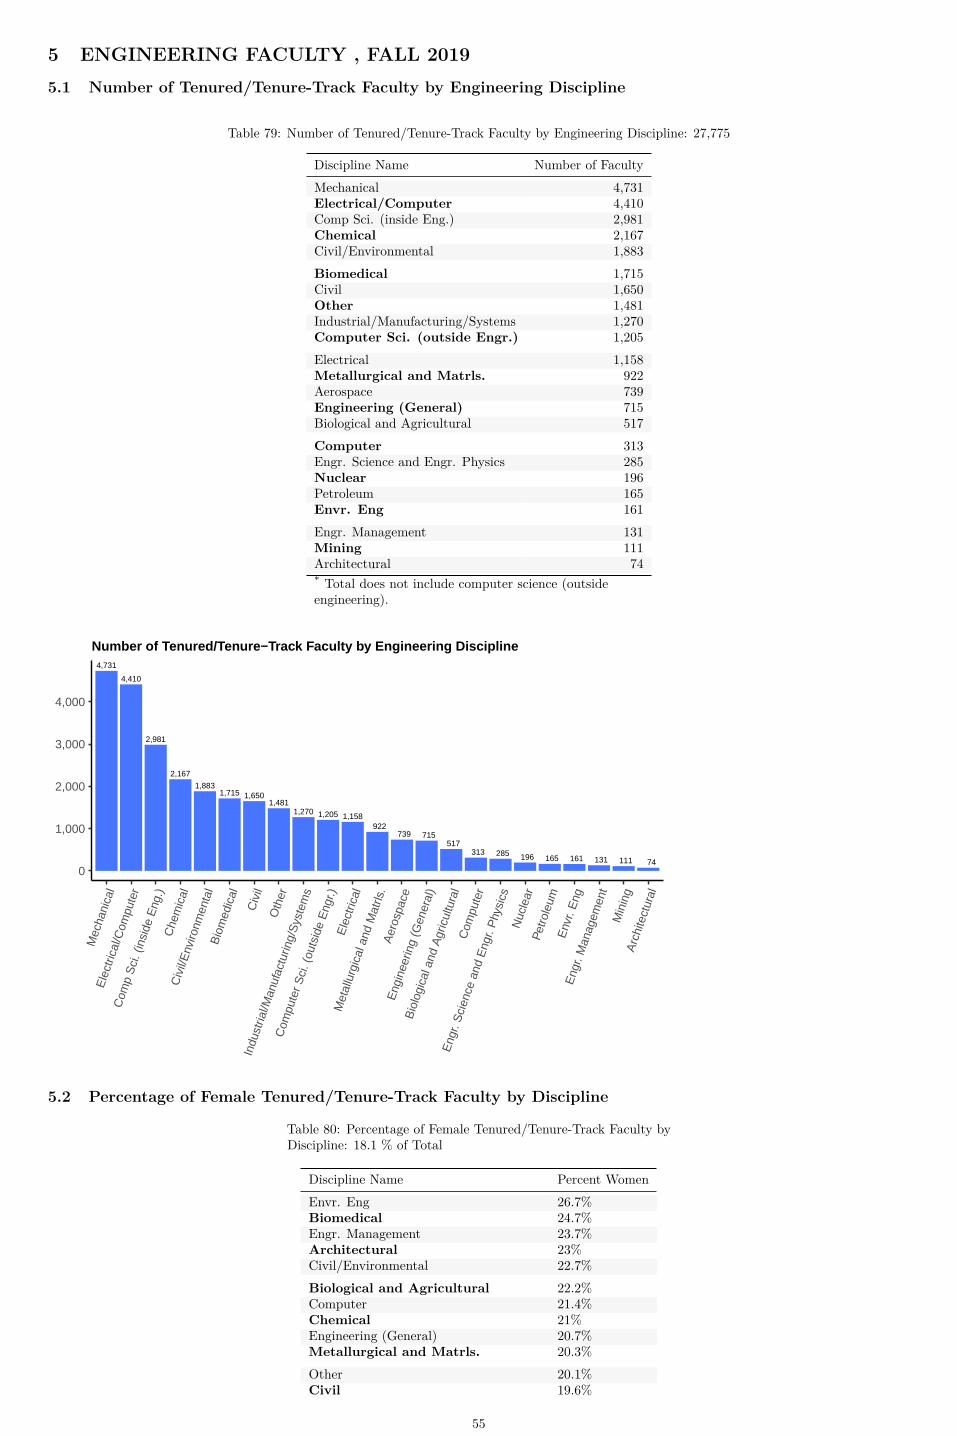
5 ENGINEERING FACULTY , FALL 20195.1 Number of Tenured/Tenure-Track Faculty by Engineering Discipline
Table 79: Number of Tenured/Tenure-Track Faculty by Engineering Discipline: 27,775
Discipline Name Number of FacultyMechanical 4,731Electrical/Computer 4,410Comp Sci. (inside Eng.) 2,981Chemical 2,167Civil/Environmental 1,883Biomedical 1,715Civil 1,650Other 1,481Industrial/Manufacturing/Systems 1,270Computer Sci. (outside Engr.) 1,205Electrical 1,158Metallurgical and Matrls. 922Aerospace 739Engineering (General) 715Biological and Agricultural 517Computer 313Engr. Science and Engr. Physics 285Nuclear 196Petroleum 165Envr. Eng 161Engr. Management 131Mining 111Architectural 74* Total does not include computer science (outsideengineering).
4,731
4,410
2,981
2,167
1,8831,715 1,650
1,4811,270 1,205 1,158
922 739 715
517 313 285 196 165 161 131 111 74
0
1,000
2,000
3,000
4,000
Mec
hani
cal
Ele
ctric
al/C
ompu
ter
Com
p S
ci. (
insi
de E
ng.)
Che
mic
alC
ivil/
Env
ironm
enta
lB
iom
edic
al
Civ
ilO
ther
Indu
stria
l/Man
ufac
turin
g/S
yste
ms
Com
pute
r Sci
. (ou
tsid
e E
ngr.)
Ele
ctric
al
Met
allu
rgic
al a
nd M
atrls
.A
eros
pace
Eng
inee
ring
(Gen
eral
)
Bio
logi
cal a
nd A
gric
ultu
ral
Com
pute
r
Eng
r. S
cien
ce a
nd E
ngr.
Phy
sics
Nuc
lear
Pet
role
umE
nvr.
Eng
Eng
r. M
anag
emen
tM
inin
gA
rchi
tect
ural
Number of Tenured/Tenure−Track Faculty by Engineering Discipline
5.2 Percentage of Female Tenured/Tenure-Track Faculty by Discipline
Table 80: Percentage of Female Tenured/Tenure-Track Faculty byDiscipline: 18.1 % of Total
Discipline Name Percent WomenEnvr. Eng 26.7%Biomedical 24.7%Engr. Management 23.7%Architectural 23%Civil/Environmental 22.7%Biological and Agricultural 22.2%Computer 21.4%Chemical 21%Engineering (General) 20.7%Metallurgical and Matrls. 20.3%Other 20.1%Civil 19.6%
55

Table 80: Percentage of Female Tenured/Tenure-Track Faculty byDiscipline: 18.1 % of Total (continued)
Discipline Name Percent WomenComputer Sci. (outside Engr.) 19.5%Industrial/Manufacturing/Systems 19.4%Nuclear 19.4%Petroleum 18.2%Comp Sci. (inside Eng.) 17.3%Engr. Science and Engr. Physics 16.5%Mining 16.2%Electrical 14.9%Mechanical 14.8%Electrical/Computer 14.2%Aerospace 11.6%
26.7%
24.7%23.7%
23% 22.7%22.2%
21.4%21% 20.7%20.3% 20.1%19.6% 19.5%
19.4% 19.4%18.2%
17.3%16.5% 16.2%
14.9% 14.8%14.2%
11.6%
0%
10%
20%
30%
Env
r. E
ngB
iom
edic
alE
ngr.
Man
agem
ent
Arc
hite
ctur
alC
ivil/
Env
ironm
enta
l
Bio
logi
cal a
nd A
gric
ultu
ral
Che
mic
alC
ompu
ter
Eng
inee
ring
(Gen
eral
)C
ivil
Com
pute
r Sci
. (ou
tsid
e E
ngr.)
Met
allu
rgic
al a
nd M
atrls
.O
ther
Indu
stria
l/Man
ufac
turin
g/S
yste
ms
Nuc
lear
Petro
leum
Com
p S
ci. (
insi
de E
ng.)
Eng
r. S
cien
ce a
nd E
ngr.
Phy
sics
Min
ing
Ele
ctric
alM
echa
nica
l
Ele
ctric
al/C
ompu
ter
Aer
ospa
ce
Percentage of Female Tenured/Tenure−Track Faculty by Discipline
5.3 Top 50 Institutions by Number of Tenured/Tenure-Track Faculty
Table 81: Top 50 Institutions by Number of Tenured/Tenure-TrackFaculty
No Institutions Number of Faculty1 Georgia Institute of Technology 5742 University of Illinois at Urbana-Champaign 4663 Texas A&M University 4364 University of Michigan 4285 Virginia Polytechnic Institute and State University 3956 Purdue University 3917 Massachusetts Institute of Technology 3908 The Pennsylvania State University 3819 North Carolina State University 370
10 Arizona State University 32511 The University of Texas at Austin 31512 University of Florida 30913 The Ohio State University 29814 Carnegie Mellon University 29715 Stanford University 27816 Cornell University 27617 University of Washington in Seattle 27418 University of Wisconsin-Madison 26119 University of California, Berkeley 25819 University of Maryland, College Park 25821 Iowa State University 25522 University of Minnesota -Twin Cities 24523 University of California, San Diego 23724 Clemson University 23625 University of California, Irvine 22526 University of Utah 22127 Northeastern University 21528 The Johns Hopkins University 21228 University of California, Davis 21230 Michigan State University 21030 Oregon State University 21032 Colorado School of Mines 209
56

Table 81: Top 50 Institutions by Number of Tenured/Tenure-TrackFaculty (continued)
No Institutions Number of Faculty33 Northwestern University 20734 University of Nebraska, Lincoln 19935 University at Buffalo, SUNY 19636 University of Massachusetts Amherst 19537 University of Southern California 19138 Drexel University 18739 University of Tennessee, Knoxville 18640 University of Colorado Boulder 18441 University of California, Los Angeles 18342 University of Arizona 18143 Columbia University 17844 Auburn University 17545 University of Central Florida 17245 University of Virginia 17247 University of Kentucky 16748 University of Puerto Rico, Mayaguez Campus 16649 Stony Brook University 16449 University of Houston 164* 301 Institutions included
5.4 Top 20 Institutions by Number of Underrepresented Minorities Tenured/Tenure-Track Faculty
Table 82: Top 20 Institutions by Number of UnderrepresentedMinorities Tenured/Tenure-Track Faculty
No Institutions Number of Faculty1 University of Puerto Rico, Mayaguez Campus 1452 Texas A&M University 453 Georgia Institute of Technology 394 University of Florida 355 Massachusetts Institute of Technology 326 Purdue University 306 Virginia Polytechnic Institute and State University 308 The University of Texas at El Paso 299 University of Illinois at Urbana-Champaign 28
10 Howard University 2611 University of Michigan 2412 University of California, Berkeley 2112 University of California, San Diego 2114 Stanford University 2014 University of California, Irvine 2016 Arizona State University 1916 Florida Institute of Technology 1916 North Carolina A&T State University 1916 The Pennsylvania State University 1916 The University of Texas at Austin 19* 301 Institutions included
5.5 Top 20 Institutions by Percentage of Underrepresented Minorities Tenured/Tenure-Track Faculty
Table 83: Top 20 Institutions by Percentage of UnderrepresentedMinorities Tenured/Tenure-Track Faculty
No Institutions Percent Underrepresented Minorities1 University of Puerto Rico, Mayaguez Campus 87.3%2 Virginia State University 60%3 Howard University 57.8%4 Morgan State University 50%5 Abilene Christian University 37.8%6 The University of Texas at El Paso 35.8%7 Jackson State University 31.2%8 St. Mary’s University 28.6%9 Tuskegee University 25.8%
10 North Carolina A&T State University 25.7%11 James Madison University 25%12 University of Tennessee-Chattanooga 22.7%13 Texas State University 22.2%14 Florida Institute of Technology 21.1%15 John Brown University 20%15 Winona State University 20%17 The University of Texas Rio Grande Valley 19%18 University of California, Merced 16.4%19 FAMU-FSU College of Engineering 15.9%20 The Catholic University of America 15.4%* 301 Institutions included
57
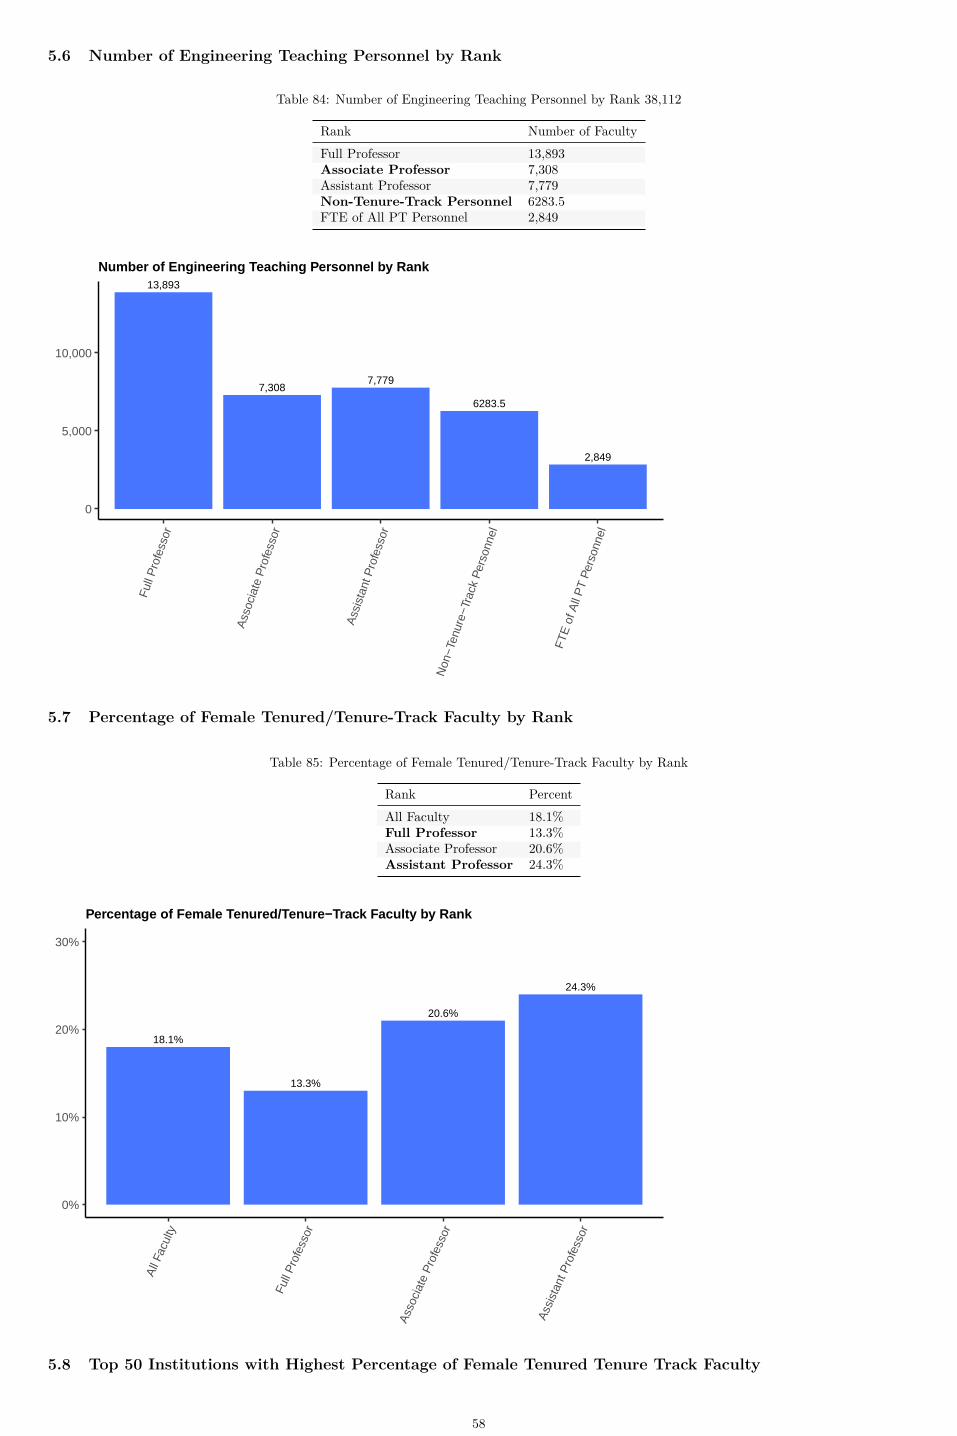
5.6 Number of Engineering Teaching Personnel by Rank
Table 84: Number of Engineering Teaching Personnel by Rank 38,112
Rank Number of FacultyFull Professor 13,893Associate Professor 7,308Assistant Professor 7,779Non-Tenure-Track Personnel 6283.5FTE of All PT Personnel 2,849
13,893
7,3087,779
6283.5
2,849
0
5,000
10,000
Full
Pro
fess
or
Ass
ocia
te P
rofe
ssor
Ass
ista
nt P
rofe
ssor
Non
−Ten
ure−
Trac
k P
erso
nnel
FTE
of A
ll P
T P
erso
nnel
Number of Engineering Teaching Personnel by Rank
5.7 Percentage of Female Tenured/Tenure-Track Faculty by Rank
Table 85: Percentage of Female Tenured/Tenure-Track Faculty by Rank
Rank PercentAll Faculty 18.1%Full Professor 13.3%Associate Professor 20.6%Assistant Professor 24.3%
18.1%
13.3%
20.6%
24.3%
0%
10%
20%
30%
All
Facu
lty
Full
Pro
fess
or
Ass
ocia
te P
rofe
ssor
Ass
ista
nt P
rofe
ssor
Percentage of Female Tenured/Tenure−Track Faculty by Rank
5.8 Top 50 Institutions with Highest Percentage of Female Tenured Tenure Track Faculty
58
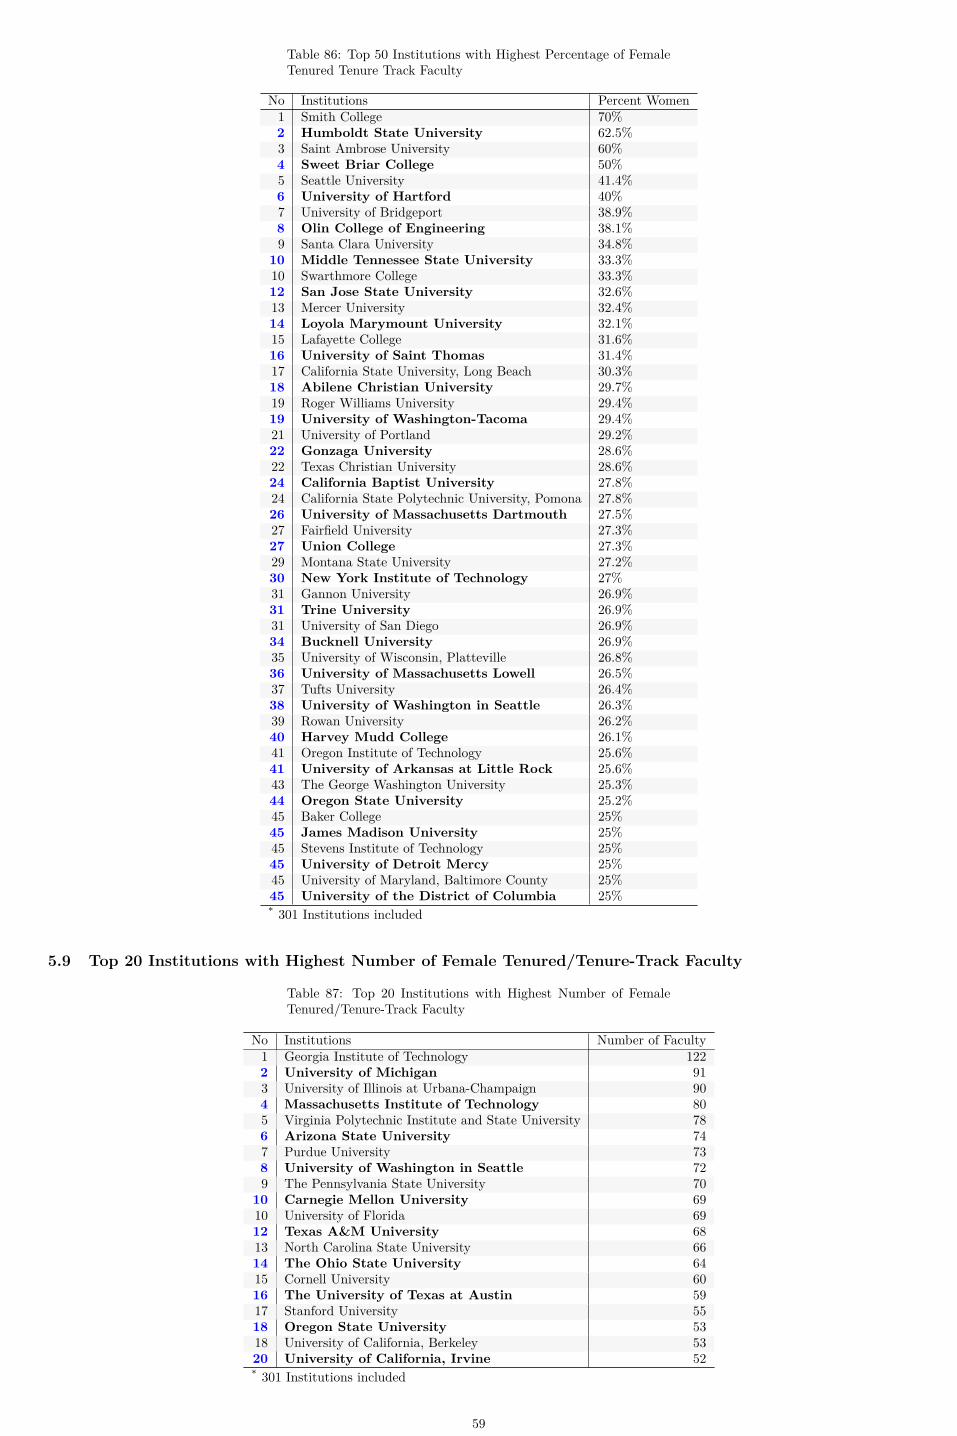
Table 86: Top 50 Institutions with Highest Percentage of FemaleTenured Tenure Track Faculty
No Institutions Percent Women1 Smith College 70%2 Humboldt State University 62.5%3 Saint Ambrose University 60%4 Sweet Briar College 50%5 Seattle University 41.4%6 University of Hartford 40%7 University of Bridgeport 38.9%8 Olin College of Engineering 38.1%9 Santa Clara University 34.8%
10 Middle Tennessee State University 33.3%10 Swarthmore College 33.3%12 San Jose State University 32.6%13 Mercer University 32.4%14 Loyola Marymount University 32.1%15 Lafayette College 31.6%16 University of Saint Thomas 31.4%17 California State University, Long Beach 30.3%18 Abilene Christian University 29.7%19 Roger Williams University 29.4%19 University of Washington-Tacoma 29.4%21 University of Portland 29.2%22 Gonzaga University 28.6%22 Texas Christian University 28.6%24 California Baptist University 27.8%24 California State Polytechnic University, Pomona 27.8%26 University of Massachusetts Dartmouth 27.5%27 Fairfield University 27.3%27 Union College 27.3%29 Montana State University 27.2%30 New York Institute of Technology 27%31 Gannon University 26.9%31 Trine University 26.9%31 University of San Diego 26.9%34 Bucknell University 26.9%35 University of Wisconsin, Platteville 26.8%36 University of Massachusetts Lowell 26.5%37 Tufts University 26.4%38 University of Washington in Seattle 26.3%39 Rowan University 26.2%40 Harvey Mudd College 26.1%41 Oregon Institute of Technology 25.6%41 University of Arkansas at Little Rock 25.6%43 The George Washington University 25.3%44 Oregon State University 25.2%45 Baker College 25%45 James Madison University 25%45 Stevens Institute of Technology 25%45 University of Detroit Mercy 25%45 University of Maryland, Baltimore County 25%45 University of the District of Columbia 25%* 301 Institutions included
5.9 Top 20 Institutions with Highest Number of Female Tenured/Tenure-Track Faculty
Table 87: Top 20 Institutions with Highest Number of FemaleTenured/Tenure-Track Faculty
No Institutions Number of Faculty1 Georgia Institute of Technology 1222 University of Michigan 913 University of Illinois at Urbana-Champaign 904 Massachusetts Institute of Technology 805 Virginia Polytechnic Institute and State University 786 Arizona State University 747 Purdue University 738 University of Washington in Seattle 729 The Pennsylvania State University 70
10 Carnegie Mellon University 6910 University of Florida 6912 Texas A&M University 6813 North Carolina State University 6614 The Ohio State University 6415 Cornell University 6016 The University of Texas at Austin 5917 Stanford University 5518 Oregon State University 5318 University of California, Berkeley 5320 University of California, Irvine 52* 301 Institutions included
59

5.10 Percentage of Women and Minority Faculty Members
Table 88: Percentage of Women and Minority Faculty Members
Ethnicity 2011 2012 2013 2014 2015 2016 2017 2018 2019Women 13.8% 14.0% 14.5% 15.2% 15.7% 16.3% 17.0% 17.6% 18.1%Black or Afr. American 2.5% 2.7% 2.6% 2.5% 2.5% 2.3% 3.1% 2.4% 2.5%Asian 24.1% 24.6% 25.2% 25.6% 26.9% 27.6% 26.0% 28.3% 28.7%Hispanic 3.7% 3.9% 3.6% 3.9% 3.9% 3.7% 5.1% 3.8% 3.7%* *Includes faculty data from University of Puerto Rico, Mayaguez.
18.1%
2.5%
28.7%
3.7%
0%
10%
20%
30%
Wom
en
Bla
ck/A
frica
n A
mer
ican
Asi
an
His
pani
c
Percentage of Women and Minority Faculty Members 2010−2019*
5.11 Number of Full Professors by Race/Ethnicity
Table 89: Number of Full Professors by Race/Ethnicity: 13,275
Ethnicity Number of FacultyWhite 8,125Asian 3,630Unknown 676Hispanic 485Black or Afr. American 261Multiracial 51American Indian 31Hawaiian/Pac.Isl 16* Includes 114 Faculty from Institutions in Puertio Rico.* Computer Science(Outside Engineering) has been removed
60

8,125
3,630
676 485261
51 31 160
2,000
4,000
6,000
8,000
Whi
te
Asi
an
Unk
now
n
His
pani
c
Bla
ck o
r Afr.
Am
eric
an
Mul
tirac
ial
Am
eric
an In
dian
Haw
aiia
n/P
ac.Is
l
Number of Full Professors by Race/Ethnicity (teaching)
5.12 Number of Assistant Professors by Race/Ethnicity
Table 90: Number of Assistant Professors by Race/Ethnicity: 6,882
Ethnicity Number of FacultyWhite 3,433Asian 2,281Unknown 585Hispanic 262Black or Afr. American 221Multiracial 77American Indian 12Hawaiian/Pac.Isl 11* Includes 20 Faculty from Institutions in Puertio Rico.* Computer Science(Outside Engineering) has been removed
3,433
2,281
585
262 22177 12 11
0
1,000
2,000
3,000
Whi
te
Asi
an
Unk
now
n
His
pani
c
Bla
ck o
r Afr.
Am
eric
an
Mul
tirac
ial
Am
eric
an In
dian
Haw
aiia
n/P
ac.Is
l
Number of Assistant Professors by Race/Ethnicity (teaching)
61

5.13 Number of Associate Professors by Race/Ethnicity
Table 91: Number of Associate Professors by Race/Ethnicity: 6,945
Ethnicity Number of FacultyWhite 3,918Asian 2,070Unknown 370Hispanic 301Black or Afr. American 219Multiracial 35American Indian 24Hawaiian/Pac.Isl 8* Includes 32 Faculty from Institutions in Puertio Rico.* Computer Science(Outside Engineering) has been removed
3,918
2,070
370 301 21935 24 8
0
1,000
2,000
3,000
4,000
Whi
te
Asi
an
Unk
now
n
His
pani
c
Bla
ck o
r Afr.
Am
eric
an
Mul
tirac
ial
Am
eric
an In
dian
Haw
aiia
n/P
ac.Is
l
Number of Associate Professors by Race/Ethnicity (teaching)
5.14 Percentage of Black/African American Tenured/Tenure-Track Faculty by Rank
Table 92: Percentage of Black/African American Tenured/Tenure-Track Faculty by Rank
Rank PercentAll Faculty 2.5%Full Professor 1.9%Associate Professor 3%Assistant Professor 2.9%
62
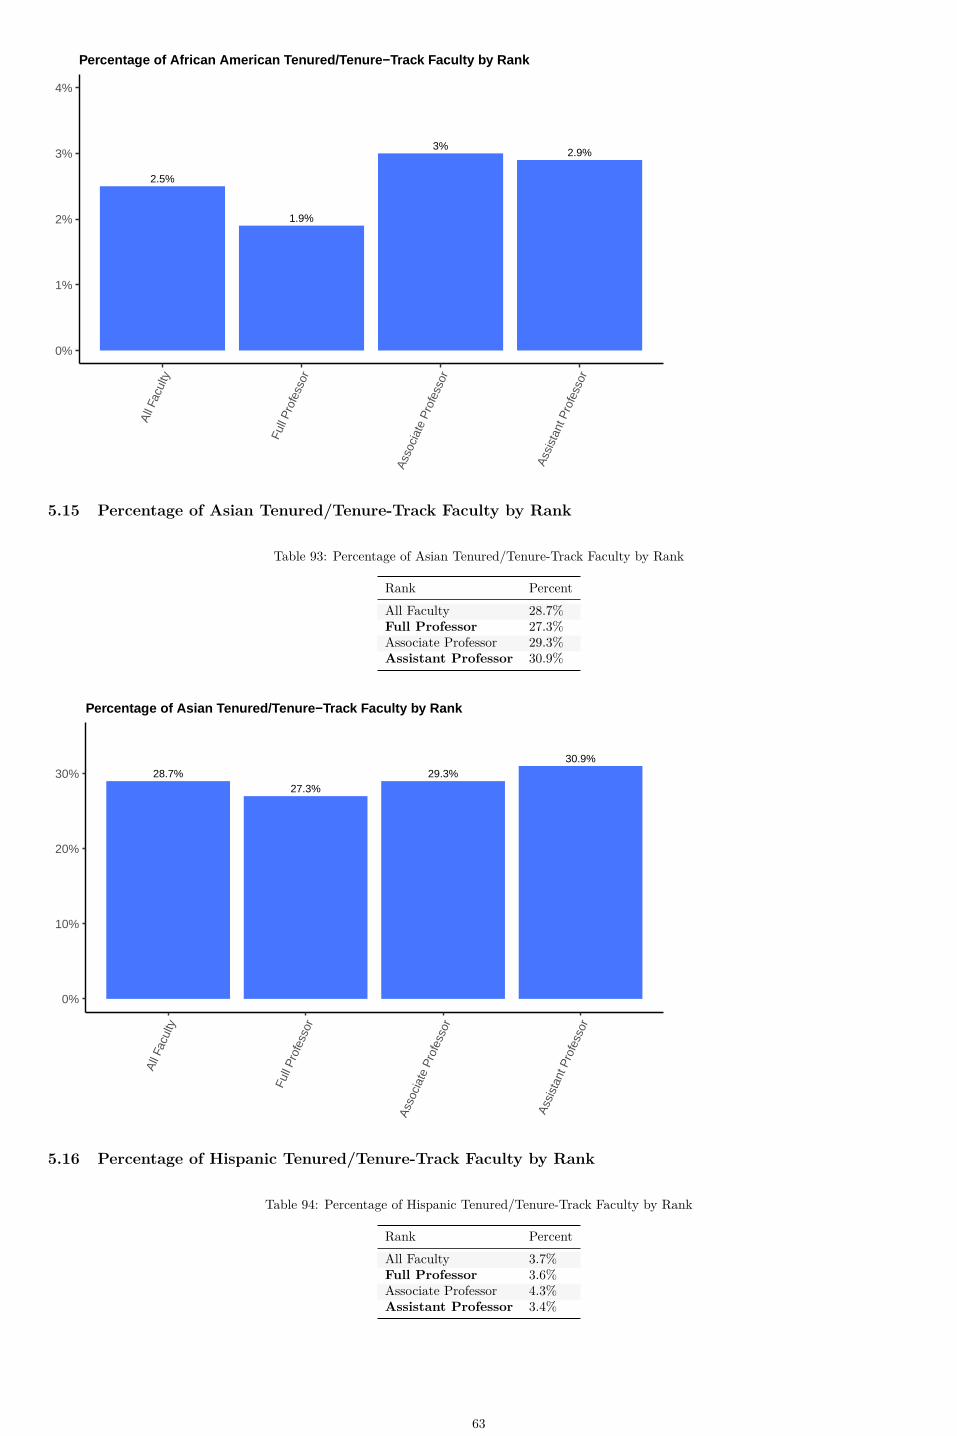
2.5%
1.9%
3%2.9%
0%
1%
2%
3%
4%
All
Facu
lty
Full
Pro
fess
or
Ass
ocia
te P
rofe
ssor
Ass
ista
nt P
rofe
ssor
Percentage of African American Tenured/Tenure−Track Faculty by Rank
5.15 Percentage of Asian Tenured/Tenure-Track Faculty by Rank
Table 93: Percentage of Asian Tenured/Tenure-Track Faculty by Rank
Rank PercentAll Faculty 28.7%Full Professor 27.3%Associate Professor 29.3%Assistant Professor 30.9%
28.7%27.3%
29.3%30.9%
0%
10%
20%
30%
All
Facu
lty
Full
Pro
fess
or
Ass
ocia
te P
rofe
ssor
Ass
ista
nt P
rofe
ssor
Percentage of Asian Tenured/Tenure−Track Faculty by Rank
5.16 Percentage of Hispanic Tenured/Tenure-Track Faculty by Rank
Table 94: Percentage of Hispanic Tenured/Tenure-Track Faculty by Rank
Rank PercentAll Faculty 3.7%Full Professor 3.6%Associate Professor 4.3%Assistant Professor 3.4%
63

3.7% 3.6%
4.3%
3.4%
0%
1%
2%
3%
4%
5%
All
Facu
lty
Full
Pro
fess
or
Ass
ocia
te P
rofe
ssor
Ass
ista
nt P
rofe
ssor
Percentage of Hispanic Tenured/Tenure−Track Faculty by Rank
5.17 African American Tenured/ Tenure Track Faculty by Institutions
Table 95: African American Tenured/ Tenure Track Faculty byInstitutions
No Institutions Number of Faculty1 Howard University 242 Georgia Institute of Technology 213 University of Florida 194 North Carolina A&T State University 185 Morgan State University 166 University of Tennessee-Chattanooga 157 Abilene Christian University 147 FAMU-FSU College of Engineering 147 University of Michigan 14
10 Massachusetts Institute of Technology 1210 Virginia Polytechnic Institute and State University 1212 Cornell University 1012 The Johns Hopkins University 1012 University of Illinois at Urbana-Champaign 1012 University of Maryland, College Park 1016 Clemson University 917 North Carolina State University 817 Purdue University 817 Stanford University 817 Texas A&M University 8* 301 Institutions included
5.18 Asian Tenured/ Tenure Track Faculty by Institutions
Table 96: Asian Tenured/ Tenure Track Faculty by Institutions
No Institutions Number of Faculty1 Georgia Institute of Technology 1802 Texas A&M University 1443 Purdue University 1394 University of Illinois at Urbana-Champaign 1235 Arizona State University 1166 The Ohio State University 1077 Iowa State University 1058 University of Michigan 1029 North Carolina State University 95
10 Virginia Polytechnic Institute and State University 9411 University at Buffalo, SUNY 9212 University of California, Los Angeles 9113 University of California, San Diego 9014 University of Florida 8515 Michigan State University 8316 The Pennsylvania State University 8117 The University of Texas at Austin 7818 University of Central Florida 7418 University of Minnesota -Twin Cities 7420 The University of Texas at Arlington 72* 301 Institutions included
64

5.19 Hispanic Tenured/ Tenure Track Faculty by Institutions
Table 97: Hispanic Tenured/ Tenure Track Faculty by Institutions
No Institutions Number of Faculty1 University of Puerto Rico, Mayaguez Campus 1422 Texas A&M University 343 The University of Texas at El Paso 244 Purdue University 215 Massachusetts Institute of Technology 206 Georgia Institute of Technology 186 University of Illinois at Urbana-Champaign 188 University of California, San Diego 179 University of Florida 169 Virginia Polytechnic Institute and State University 1611 Arizona State University 1512 The University of Texas at Austin 1412 University of California, Berkeley 1414 The Ohio State University 1314 University of California-Santa Cruz 1316 Stanford University 1216 University of California, Irvine 1218 The Pennsylvania State University 1118 The University of Texas at San Antonio 1120 Auburn University 10* 301 Institutions included
5.20 Percentage of African American Tenured/Tenure-Track Faculty by Discipline
Table 98: Percentage of African American Tenured/Tenure-TrackFaculty by Discipline: 2.5 % of Total
Discipline Name PercentageComputer 6.1%Engr. Management 5.3%Biological and Agricultural 4.4%Mining 3.6%Engineering (General) 3.4%Electrical 3.2%Envr. Eng 3.1%Industrial/Manufacturing/Systems 3.1%Civil/Environmental 3%Other 3%Metallurgical and Matrls. 2.7%Aerospace 2.6%Engr. Science and Engr. Physics 2.5%Mechanical 2.5%Chemical 2.4%Electrical/Computer 2.4%Civil 2.2%Biomedical 2%Comp Sci. (inside Eng.) 1.2%Computer Sci. (outside Engr.) 1.2%Petroleum 1.2%Nuclear 1%Architectural 0%
65
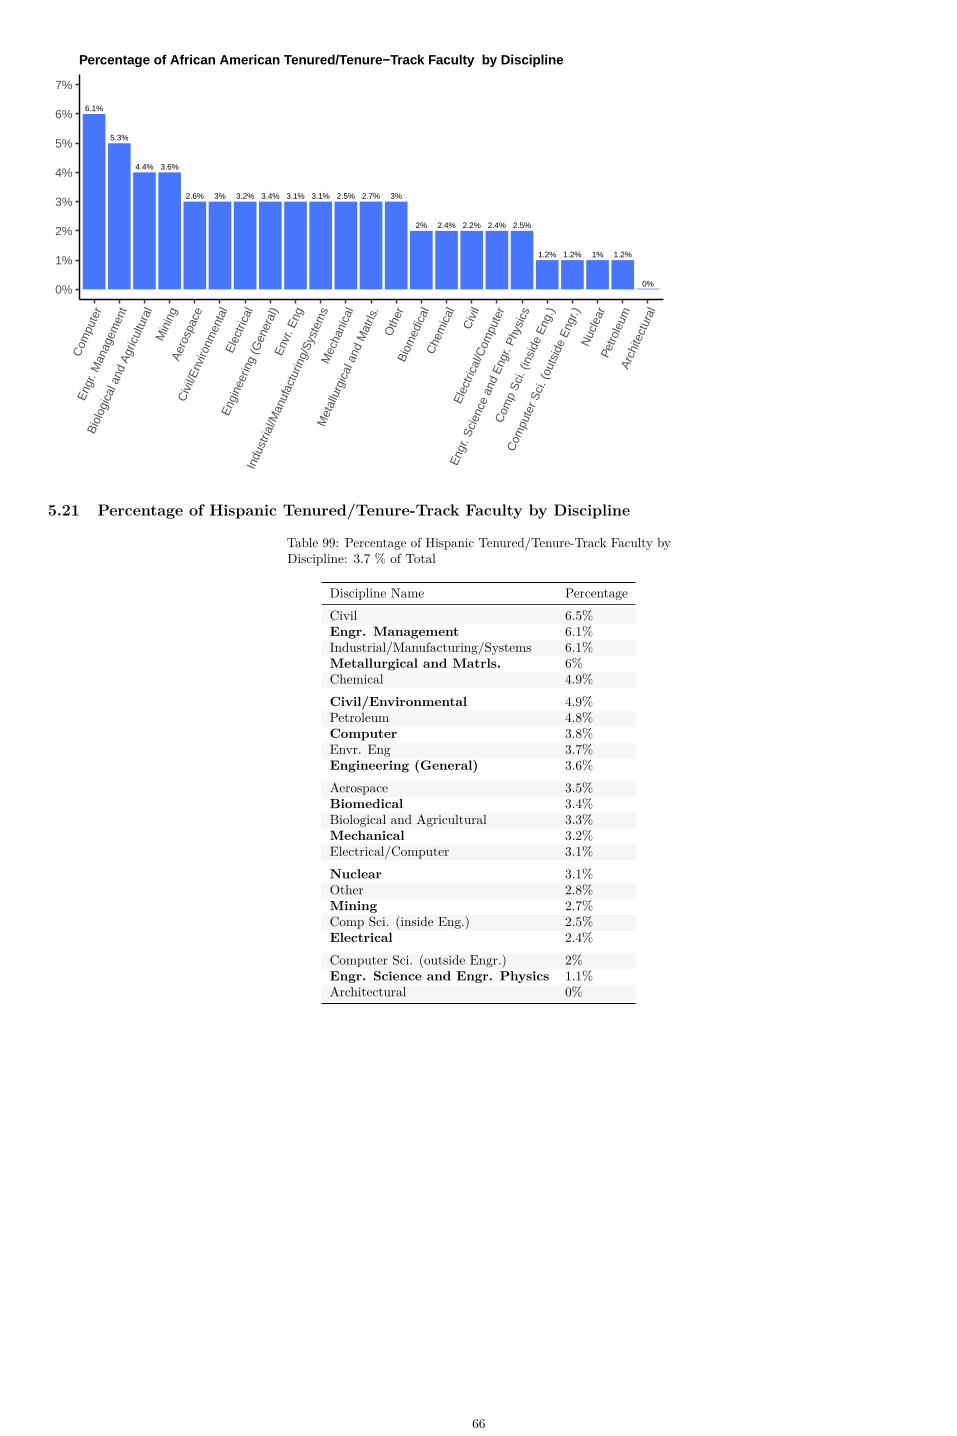
6.1%
5.3%
4.4% 3.6%
3.4%3.2% 3.1% 3.1%3% 3%2.7%2.6%
2.5%
2.5%
2.4% 2.4%2.2%2%
1.2% 1.2% 1.2%1%
0%0%
1%
2%
3%
4%
5%
6%
7%C
ompu
ter
Eng
r. M
anag
emen
t
Bio
logi
cal a
nd A
gric
ultu
ral
Min
ing
Aer
ospa
ceC
ivil/
Env
ironm
enta
lE
lect
rical
Eng
inee
ring
(Gen
eral
)E
nvr.
Eng
Indu
stria
l/Man
ufac
turin
g/S
yste
ms
Mec
hani
cal
Met
allu
rgic
al a
nd M
atrls
.O
ther
Bio
med
ical
Che
mic
alC
ivil
Ele
ctric
al/C
ompu
ter
Eng
r. S
cien
ce a
nd E
ngr.
Phy
sics
Com
p S
ci. (
insi
de E
ng.)
Com
pute
r Sci
. (ou
tsid
e E
ngr.)
Nuc
lear
Petro
leum
Arc
hite
ctur
al
Percentage of African American Tenured/Tenure−Track Faculty by Discipline
5.21 Percentage of Hispanic Tenured/Tenure-Track Faculty by Discipline
Table 99: Percentage of Hispanic Tenured/Tenure-Track Faculty byDiscipline: 3.7 % of Total
Discipline Name PercentageCivil 6.5%Engr. Management 6.1%Industrial/Manufacturing/Systems 6.1%Metallurgical and Matrls. 6%Chemical 4.9%Civil/Environmental 4.9%Petroleum 4.8%Computer 3.8%Envr. Eng 3.7%Engineering (General) 3.6%Aerospace 3.5%Biomedical 3.4%Biological and Agricultural 3.3%Mechanical 3.2%Electrical/Computer 3.1%Nuclear 3.1%Other 2.8%Mining 2.7%Comp Sci. (inside Eng.) 2.5%Electrical 2.4%Computer Sci. (outside Engr.) 2%Engr. Science and Engr. Physics 1.1%Architectural 0%
66

6.5% 6.1% 6.1% 6%
4.9% 4.9% 4.8%
3.8% 3.7%3.6%3.5%
3.4%3.3% 3.2%3.1% 3.1% 2.8%2.7%2.5%
2.4%2%
1.1%
0%0%
1%
2%
3%
4%
5%
6%
7%
8%C
ivil
Eng
r. M
anag
emen
t
Indu
stria
l/Man
ufac
turin
g/S
yste
ms
Met
allu
rgic
al a
nd M
atrls
.C
hem
ical
Civ
il/E
nviro
nmen
tal
Petro
leum
Aer
ospa
ceC
ompu
ter
Eng
inee
ring
(Gen
eral
)E
nvr.
Eng
Bio
logi
cal a
nd A
gric
ultu
ral
Bio
med
ical
Com
p S
ci. (
insi
de E
ng.)
Ele
ctric
al/C
ompu
ter
Mec
hani
cal
Min
ing
Nuc
lear
Oth
er
Com
pute
r Sci
. (ou
tsid
e E
ngr.)
Ele
ctric
al
Eng
r. S
cien
ce a
nd E
ngr.
Phy
sics
Arc
hite
ctur
al
Percentage of African American Tenured/Tenure−Track Faculty by Discipline
5.22 Percentage of Asian Tenured/Tenure-Track Faculty by Discipline
Table 100: Percentage of Asian Tenured/Tenure-Track Faculty byDiscipline: 28.7 % of Total
Discipline Name PercentageComputer 37.7%Electrical 36.2%Comp Sci. (inside Eng.) 34.9%Electrical/Computer 32.9%Industrial/Manufacturing/Systems 31.5%Mechanical 31.4%Computer Sci. (outside Engr.) 28.9%Metallurgical and Matrls. 28.3%Biomedical 27.2%Engineering (General) 25%Biological and Agricultural 24.8%Civil 24.8%Petroleum 24.8%Chemical 24.7%Civil/Environmental 23.6%Aerospace 22.1%Other 20.5%Engr. Management 19.8%Mining 17.1%Nuclear 15.8%Engr. Science and Engr. Physics 13%Envr. Eng 11.2%Architectural 10.8%
67

37.7%36.2%
34.9%32.9%
31.5% 31.4%28.9%
28.3%27.2%
25%24.8% 24.8% 24.8%24.7%23.6%
22.1%20.5%
19.8%
17.1%15.8%
13%11.2%10.8%
0%
10%
20%
30%
40%C
ompu
ter
Ele
ctric
al
Com
p S
ci. (
insi
de E
ng.)
Ele
ctric
al/C
ompu
ter
Indu
stria
l/Man
ufac
turin
g/S
yste
ms
Mec
hani
cal
Com
pute
r Sci
. (ou
tsid
e E
ngr.)
Met
allu
rgic
al a
nd M
atrls
.B
iom
edic
al
Bio
logi
cal a
nd A
gric
ultu
ral
Che
mic
alC
ivil
Eng
inee
ring
(Gen
eral
)Pe
trole
umC
ivil/
Env
ironm
enta
lA
eros
pace
Oth
erE
ngr.
Man
agem
ent
Min
ing
Nuc
lear
Eng
r. S
cien
ce a
nd E
ngr.
Phy
sics
Arc
hite
ctur
alE
nvr.
Eng
Percentage of African American Tenured/Tenure−Track Faculty by Discipline
68
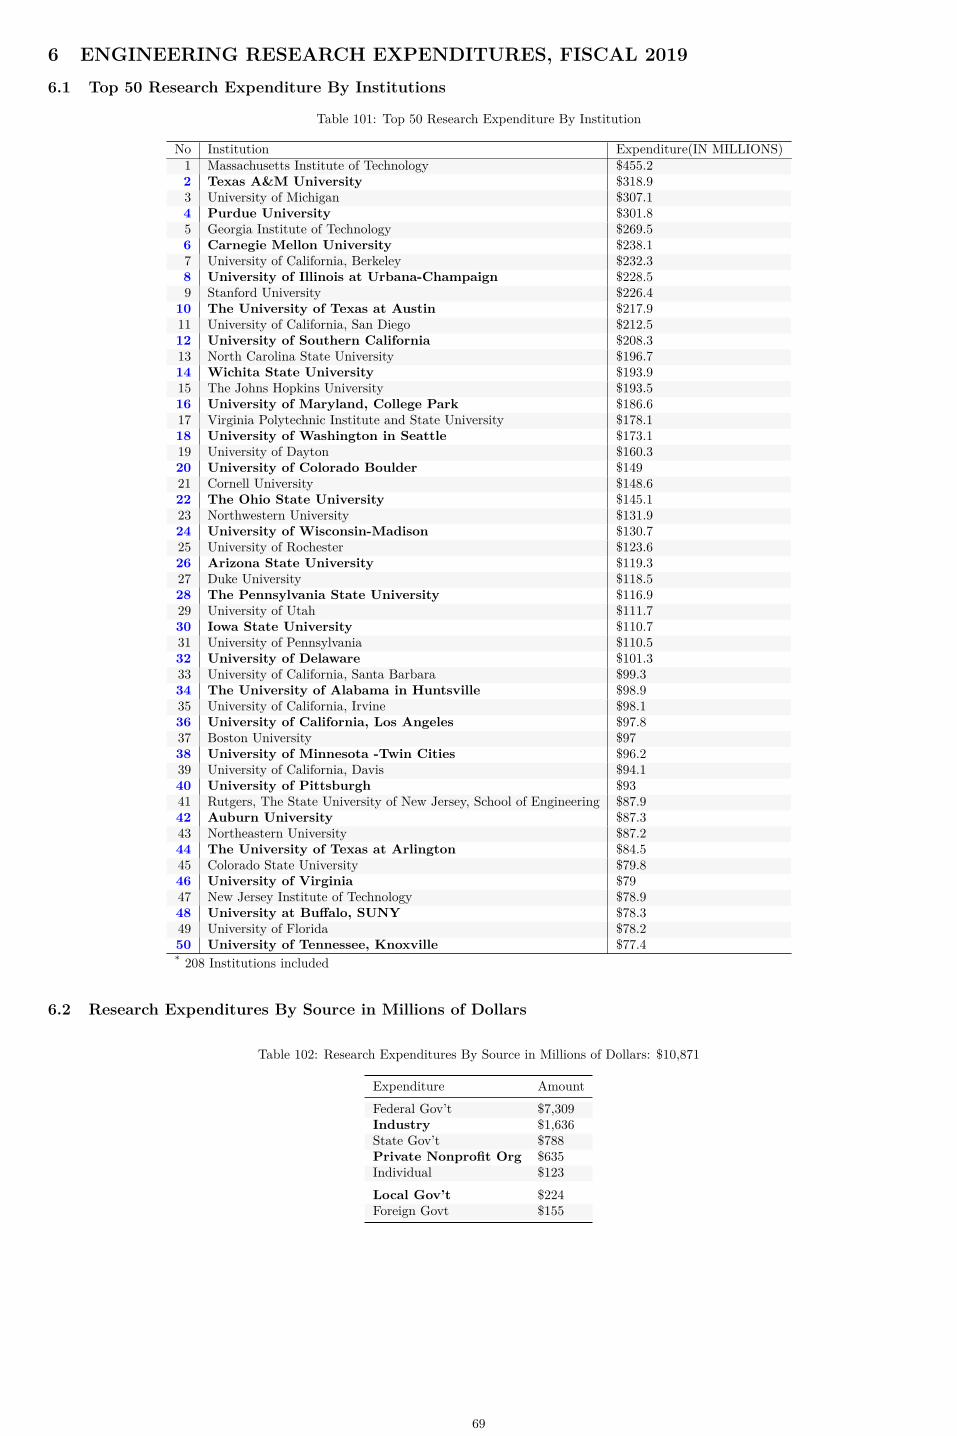
6 ENGINEERING RESEARCH EXPENDITURES, FISCAL 20196.1 Top 50 Research Expenditure By Institutions
Table 101: Top 50 Research Expenditure By Institution
No Institution Expenditure(IN MILLIONS)1 Massachusetts Institute of Technology $455.22 Texas A&M University $318.93 University of Michigan $307.14 Purdue University $301.85 Georgia Institute of Technology $269.56 Carnegie Mellon University $238.17 University of California, Berkeley $232.38 University of Illinois at Urbana-Champaign $228.59 Stanford University $226.4
10 The University of Texas at Austin $217.911 University of California, San Diego $212.512 University of Southern California $208.313 North Carolina State University $196.714 Wichita State University $193.915 The Johns Hopkins University $193.516 University of Maryland, College Park $186.617 Virginia Polytechnic Institute and State University $178.118 University of Washington in Seattle $173.119 University of Dayton $160.320 University of Colorado Boulder $14921 Cornell University $148.622 The Ohio State University $145.123 Northwestern University $131.924 University of Wisconsin-Madison $130.725 University of Rochester $123.626 Arizona State University $119.327 Duke University $118.528 The Pennsylvania State University $116.929 University of Utah $111.730 Iowa State University $110.731 University of Pennsylvania $110.532 University of Delaware $101.333 University of California, Santa Barbara $99.334 The University of Alabama in Huntsville $98.935 University of California, Irvine $98.136 University of California, Los Angeles $97.837 Boston University $9738 University of Minnesota -Twin Cities $96.239 University of California, Davis $94.140 University of Pittsburgh $9341 Rutgers, The State University of New Jersey, School of Engineering $87.942 Auburn University $87.343 Northeastern University $87.244 The University of Texas at Arlington $84.545 Colorado State University $79.846 University of Virginia $7947 New Jersey Institute of Technology $78.948 University at Buffalo, SUNY $78.349 University of Florida $78.250 University of Tennessee, Knoxville $77.4* 208 Institutions included
6.2 Research Expenditures By Source in Millions of Dollars
Table 102: Research Expenditures By Source in Millions of Dollars: $10,871
Expenditure AmountFederal Gov’t $7,309Industry $1,636State Gov’t $788Private Nonprofit Org $635Individual $123Local Gov’t $224Foreign Govt $155
69

$7,309
$1,636
$788 $635
$123 $224 $155$0
$2,000
$4,000
$6,000Fe
dera
l Gov
't
Indu
stry
Sta
te G
ov't
Priv
ate
Non
prof
it O
rg
Indi
vidu
al
Loca
l Gov
't
Fore
ign
Gov
t
Research Expenditures By Source in Millions of Dollars:
6.3 Computer Science Research Expenditures Located Outside of Engineering By Institutions
Table 103: Computer Science Research Expenditures Located Out-side of Engineering By Institution
No Institution Expenditure(IN MILLIONS)1 Carnegie Mellon University $125.52 Georgia Institute of Technology $363 The University of Texas at Austin $29.14 University of California, Irvine $22.25 University of Massachusetts Amherst $206 University of Wisconsin-Madison $177 Northeastern University $16.78 Purdue University $16.29 The University of Alabama in Huntsville $15.2
10 Brown University $7.811 University of Maryland, College Park $5.712 Worcester Polytechnic Institute $5.713 Duke University $5.414 University of Massachusetts Lowell $4.815 The University of Texas at San Antonio $4.516 The University of Memphis $4.417 University of Arizona $4.218 New Jersey Institute of Technology $3.919 FAMU-FSU College of Engineering $3.920 Boston University $3.4* 36 Institutions included
70
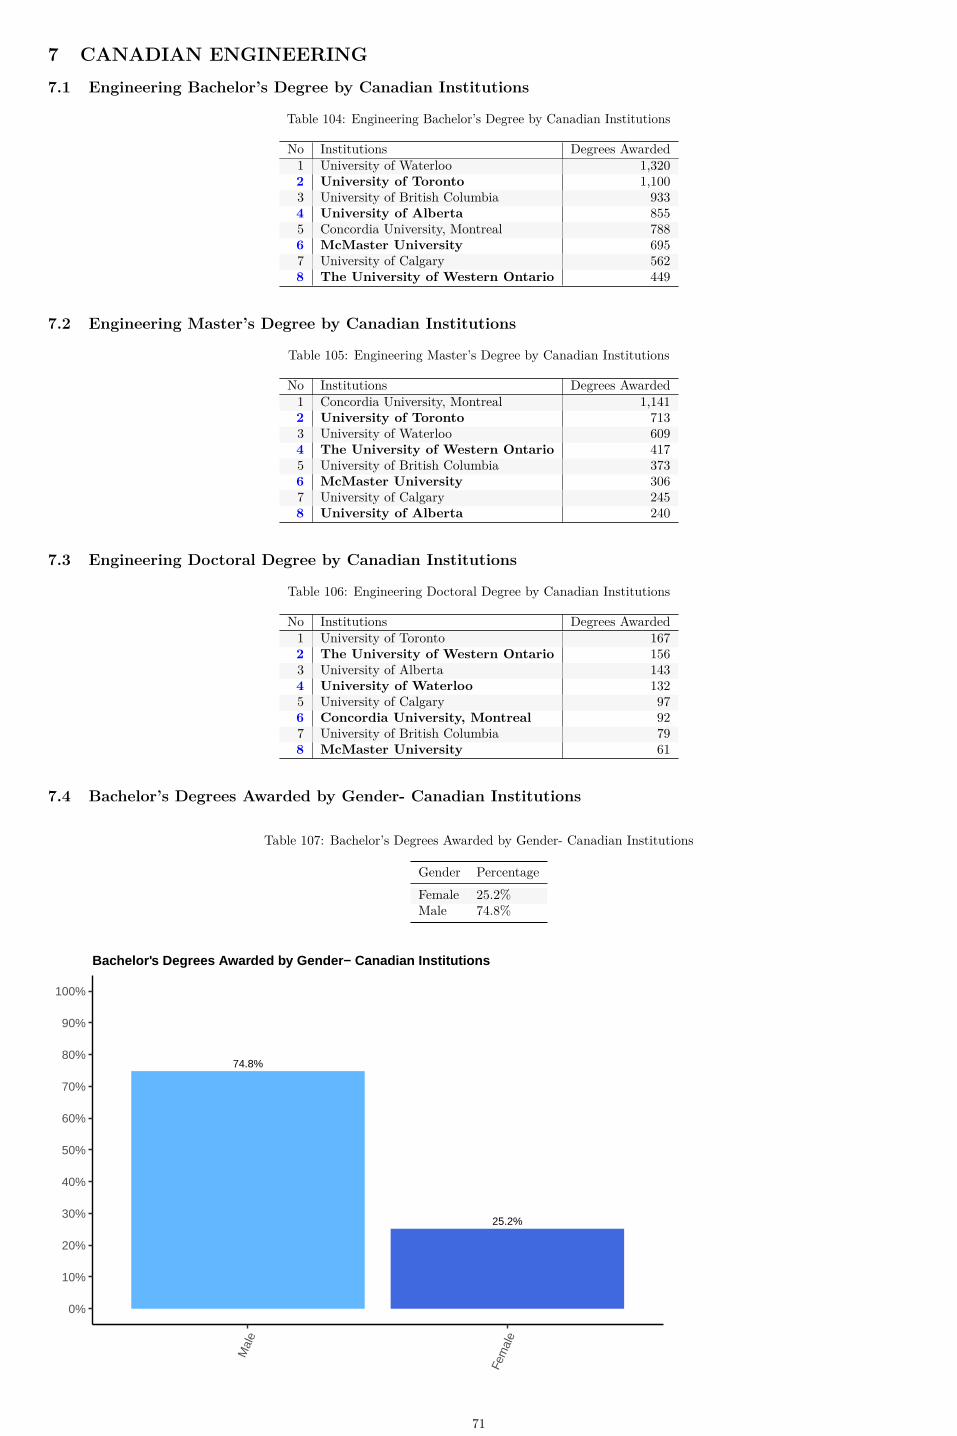
7 CANADIAN ENGINEERING7.1 Engineering Bachelor’s Degree by Canadian Institutions
Table 104: Engineering Bachelor’s Degree by Canadian Institutions
No Institutions Degrees Awarded1 University of Waterloo 1,3202 University of Toronto 1,1003 University of British Columbia 9334 University of Alberta 8555 Concordia University, Montreal 7886 McMaster University 6957 University of Calgary 5628 The University of Western Ontario 449
7.2 Engineering Master’s Degree by Canadian Institutions
Table 105: Engineering Master’s Degree by Canadian Institutions
No Institutions Degrees Awarded1 Concordia University, Montreal 1,1412 University of Toronto 7133 University of Waterloo 6094 The University of Western Ontario 4175 University of British Columbia 3736 McMaster University 3067 University of Calgary 2458 University of Alberta 240
7.3 Engineering Doctoral Degree by Canadian Institutions
Table 106: Engineering Doctoral Degree by Canadian Institutions
No Institutions Degrees Awarded1 University of Toronto 1672 The University of Western Ontario 1563 University of Alberta 1434 University of Waterloo 1325 University of Calgary 976 Concordia University, Montreal 927 University of British Columbia 798 McMaster University 61
7.4 Bachelor’s Degrees Awarded by Gender- Canadian Institutions
Table 107: Bachelor’s Degrees Awarded by Gender- Canadian Institutions
Gender PercentageFemale 25.2%Male 74.8%
74.8%
25.2%
0%
10%
20%
30%
40%
50%
60%
70%
80%
90%
100%
Mal
e
Fem
ale
Bachelor's Degrees Awarded by Gender− Canadian Institutions
71

7.5 Master’s Degrees Awarded by Gender- Canadian
Table 108: Master’s Degrees Awarded by Gender- Canadian Institutions
Gender PercentageFemale 35.9%Male 64.1%
64.1%
35.9%
0%
10%
20%
30%
40%
50%
60%
70%
80%
90%
100%M
ale
Fem
ale
Master's Degrees Awarded by Gender− Canadian Institutions
7.6 Doctoral Degrees Awarded by Gender- Canadian Institutions
Table 109: Doctoral Degrees Awarded by Gender- Canadian Institutions
Gender PercentageFemale 32.1%Male 67.9%
67.9%
32.1%
0%
10%
20%
30%
40%
50%
60%
70%
80%
90%
100%
Mal
e
Fem
ale
Doctoral Degrees Awarded by Gender− Canadian Institutions
7.7 Tenured/Tenure-Track Faculty Members by Institutions
Table 110: Tenured/Tenure-Track Faculty Members by Institutions
No Institutions Degrees Awarded1 University of Waterloo 278
72

Table 110: Tenured/Tenure-Track Faculty Members by Institutions(continued)
No Institutions Degrees Awarded2 University of Toronto 2403 Concordia University, Montreal 2224 University of Alberta 2075 University of British Columbia 1776 University of Calgary 1747 McMaster University 1468 The University of Western Ontario 101
7.8 Percentage of Female Tenured/Tenure-Track Faculty by Rank- Canadian Institutions
Table 111: Doctoral Enrollment by Race and Ethnicity*
Rank PercentAll Faculty 17.5%Full Professor 12.6%Associate Professor 20%Assistant Professor 30.7%
17.5%
12.6%
20%
30.7%
0
10
20
30
All
Facu
lty
Full
Pro
fess
or
Ass
ocia
te P
rofe
ssor
Ass
ista
nt P
rofe
ssor
Percentage of Female Tenured/Tenure−Track Faculty by Rank− Canadian Institutions
73

8 ENGINEERING TECHNOLOGY IN 2019Joseph R. Roy, Ph.D.
There has been a 13.4% increase in Bachelor degrees awarded in Engineering Technology in 2019 and a sizable increase in enrollment, 20%, that couldbe due the inclusion of more institution’s data this year (only 64 were included in 2018 versus 113 institutions in 2019).
8.1 Representation in Engineering Technology of Underrepresented MinoritiesThe ASEE Profiles data collection is in alignment with how the federal government collects race/ethnicity characteristics from institutions in order toensure that institutions can report the data we are asking for. The full definition of each race/ethnicity is included in the methodology section. We usethe term underrepresented minority(URM)to refer to three groups which have representation in the science and engineering workforce far below theirrepresentation in the adult US population. This includes Hispanic, Black/African American and American Indian/Alaskan Native individuals.
The figure below represents the percent of Bachelor’s degrees in Engineering Technology awarded to URM graduates over the last 8 years. The percentof Hispanic graduates has increased from 7.6% in 2011 to 10.4% in 2019 with a steady increase in the intervening years. The percent of Black graduates,however, has no clear trend over the same time span with 9.2% in 2011 and 6.4 % in 2019 and no growth upward in the data. There has been a declinein the percent of American Indian/Alaskan Natives from 0.6% in 2011 to 0.4 % in 2019.
0%
2%
5%
8%
10%
12%
15%
2011 2012 2013 2014 2015 2016 2017 2018 2019Year
Per
cent
of D
omes
tic B
ache
lor's
Gra
duat
es
Race/Ethnicity African American/Black American Indian/Alaska Native Hispanic
8.2 International Students in Engineering TechnologyThe data below represent the percent of international graduates within engineering technology since 2011. The percent of international students has aslight upward trend from 2015 to 2019, but only returns to the same levels as 2013.
0%
2%
4%
6%
8%
10%
12%
2011 2012 2013 2014 2015 2016 2017 2018 2019Year
Percent Eng. Tech. International Bachelor's Graduates
8.3 Engineering Technology Programs at 2-year InstitutionsThe NSF has funded a two-year project to extend the Profiles data collection to include 2-year institutions. This new data collection will examine notonly associates degrees programs, but also certificate programs in engineering technology fields at 2-year institutions. In the figure below, the numberof certificates by program length is displayed for engineering technology fields (as pulled from IPEDS data for 2019). As seen below, large majority ofcertificates awarded in engineering technology are at 2-year institutions.
74

<1 Yr. Cert 1−2 Yr. Cert. Assoc. Degrees
0
5000
10000
15000
20000
Gra
nd T
otal
Institution Type Associate's Bachelor's Doctoral Master's
Certificates/Degrees Awarded in Eng. Tech.
Even though there are not many 2-4 year certificates awarded in 2019, just over 300 awarded in the US, the vast majority of those were from programsat 2-year institutions as well.
0
100
200
300
Gra
nd T
otal
Institution Type Associate's Doctoral Master's
2−4 Yr. Certificates in Eng. Tech.
The Profiles of Technical Workforce Programs and Students at Two-Year Colleges will begin building a national survey instrument to further explorecharacteristics of these programs and field a survey of 2-year institutions in the 2021-22 academic year.
Joseph Roy is Director, Institutional Research & Analytics at the American Society for Engineering Education. He can be reached at [email protected]
75
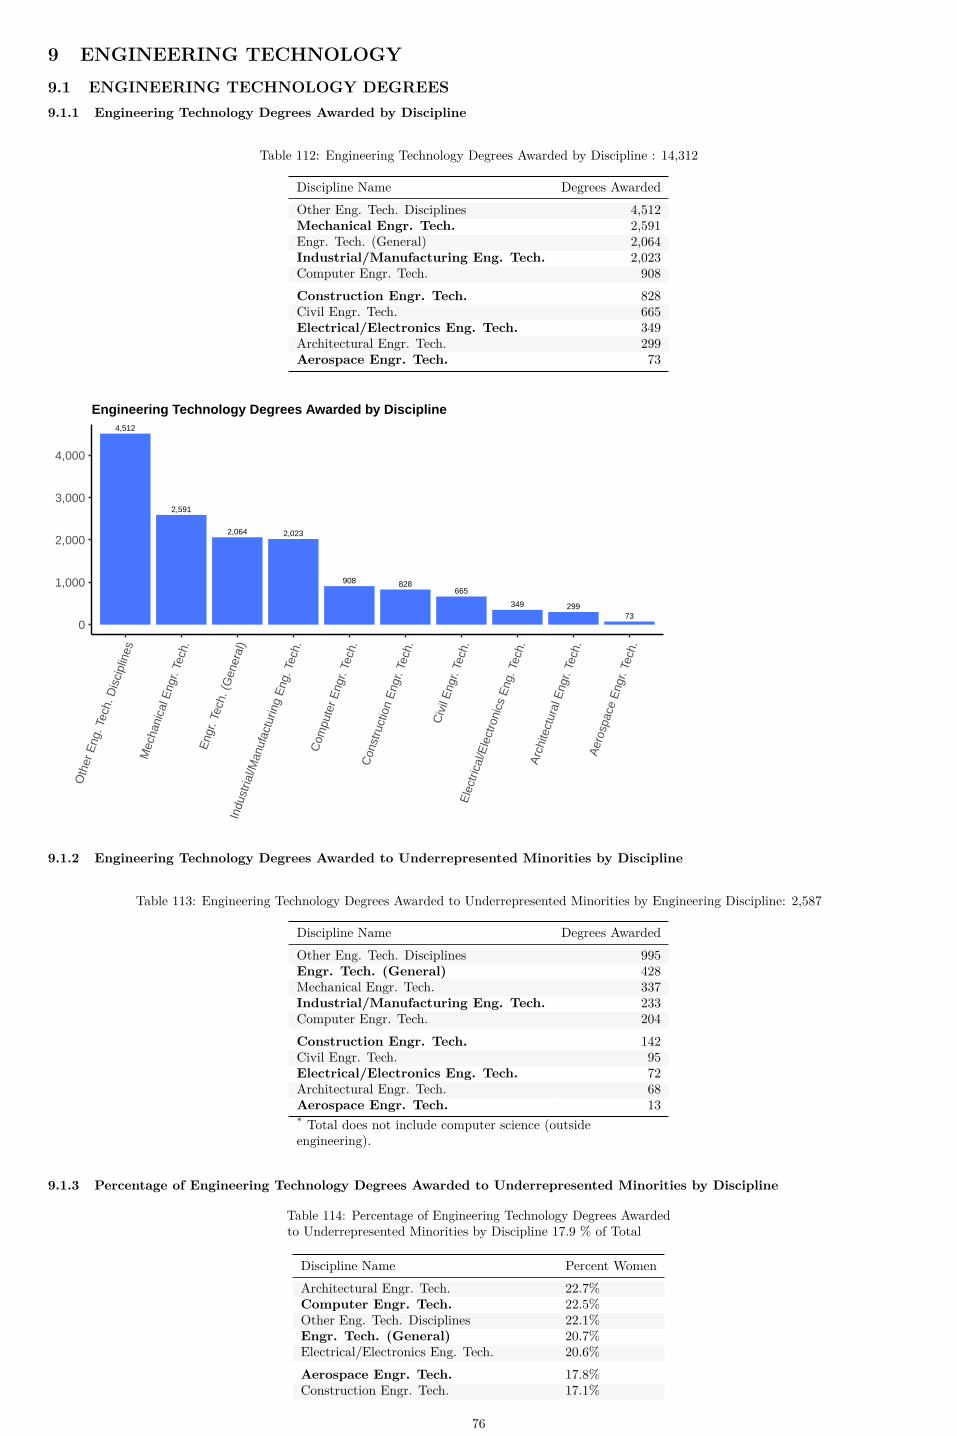
9 ENGINEERING TECHNOLOGY9.1 ENGINEERING TECHNOLOGY DEGREES9.1.1 Engineering Technology Degrees Awarded by Discipline
Table 112: Engineering Technology Degrees Awarded by Discipline : 14,312
Discipline Name Degrees AwardedOther Eng. Tech. Disciplines 4,512Mechanical Engr. Tech. 2,591Engr. Tech. (General) 2,064Industrial/Manufacturing Eng. Tech. 2,023Computer Engr. Tech. 908Construction Engr. Tech. 828Civil Engr. Tech. 665Electrical/Electronics Eng. Tech. 349Architectural Engr. Tech. 299Aerospace Engr. Tech. 73
4,512
2,591
2,064 2,023
908 828665
349 29973
0
1,000
2,000
3,000
4,000
Oth
er E
ng. T
ech.
Dis
cipl
ines
Mec
hani
cal E
ngr.
Tech
.
Eng
r. Te
ch. (
Gen
eral
)In
dust
rial/M
anuf
actu
ring
Eng
. Tec
h.
Com
pute
r Eng
r. Te
ch.
Con
stru
ctio
n E
ngr.
Tech
.
Civ
il E
ngr.
Tech
.E
lect
rical
/Ele
ctro
nics
Eng
. Tec
h.A
rchi
tect
ural
Eng
r. Te
ch.
Aer
ospa
ce E
ngr.
Tech
.
Engineering Technology Degrees Awarded by Discipline
9.1.2 Engineering Technology Degrees Awarded to Underrepresented Minorities by Discipline
Table 113: Engineering Technology Degrees Awarded to Underrepresented Minorities by Engineering Discipline: 2,587
Discipline Name Degrees AwardedOther Eng. Tech. Disciplines 995Engr. Tech. (General) 428Mechanical Engr. Tech. 337Industrial/Manufacturing Eng. Tech. 233Computer Engr. Tech. 204Construction Engr. Tech. 142Civil Engr. Tech. 95Electrical/Electronics Eng. Tech. 72Architectural Engr. Tech. 68Aerospace Engr. Tech. 13* Total does not include computer science (outsideengineering).
9.1.3 Percentage of Engineering Technology Degrees Awarded to Underrepresented Minorities by Discipline
Table 114: Percentage of Engineering Technology Degrees Awardedto Underrepresented Minorities by Discipline 17.9 % of Total
Discipline Name Percent WomenArchitectural Engr. Tech. 22.7%Computer Engr. Tech. 22.5%Other Eng. Tech. Disciplines 22.1%Engr. Tech. (General) 20.7%Electrical/Electronics Eng. Tech. 20.6%Aerospace Engr. Tech. 17.8%Construction Engr. Tech. 17.1%
76

Table 114: Percentage of Engineering Technology Degrees Awardedto Underrepresented Minorities by Discipline 17.9 % of Total (con-tinued)
Discipline Name Percent WomenCivil Engr. Tech. 14.3%Mechanical Engr. Tech. 13%Industrial/Manufacturing Eng. Tech. 11.5%
9.1.4 Engineering Technology Bachelor’s Degrees Awarded by Gender
Table 115: Engineering Technology Bachelor’s Degrees Awarded by Gender
Gender 2010 2011 2012 2013 2014 2015 2016 2017 2018 2019Female 9.4% 9.5% 9.4% 10.2% 10.6% 12.8% 13.3% 14.5% 14.2% 13.6%Male 90.6% 90.5% 90.6% 89.8% 89.4% 87.2% 86.7% 85.5% 85.8% 86.4%
86.4%
13.6%
0%
10%
20%
30%
40%
50%
60%
70%
80%
90%
100%
Mal
e
Fem
ale
Engineering Technology Bachelor’s Degrees Awarded by Gender
9.1.5 Engineering Technology Bachelor’s Degrees Awarded by Race and Ethnicity
Table 116: Engineering Technology Bachelor’s Degrees Awarded by Race and Ethnicity*
Ethnicity 2011 2012 2013 2014 2015 2016 2017 2018 2019Black or Afr. American 9.2% 8.8% 8.8% 8.9% 8.5% 8.6% 6.9% 8.0% 7.5%Hispanic 7.6% 6.5% 7.8% 7.1% 9.2% 12.9% 10.6% 11.4% 11.6%Other 1.7% 1.5% 1.9% 1.7% 3.0% 4.1% 3.3% 3.5% 3.6%Asian American 5.3% 5.0% 4.9% 5.1% 5.8% 6.8% 6.4% 14.7% 5.4%White 70.4% 73.8% 72.4% 72.7% 68.7% 63.8% 68.4% 61.5% 67.3%Unknown 5.8% 4.5% 4.3% 4.5% 4.8% 3.8% 4.4% 4.2% 4.6%* American Indian/Alaska Native 0.4% Native Hawaiian/Other Pacific Islander 0.2% and Multiracial 3% are combined under other* Data on ethnicity does not include foreign nationals.
77

7.5%11.6%
3.6% 5.4%
67.3%
4.6%
0%
10%
20%
30%
40%
50%
60%
70%
80%
90%
100%B
lack
or A
fr. A
mer
ican
His
pani
c
Oth
er
Asi
an A
mer
ican
Whi
te
Unk
now
n
Engineering Technology Bachelor’s Degrees Awarded by Race and Ethnicity
9.1.6 Engineering Technology Bachelor’s Degrees Awarded by Residency
Table 117: Engineering Technology Bachelor’s Degrees Awarded by Residency
Nationality 2010 2011 2012 2013 2014 2015 2016 2017 2018 2019Foreign 5.2% 5.0% 7.4% 10.2% 7.1% 4.9% 6.8% 6.0% 6.8% 8.2%Domestic 94.8% 95.0% 92.6% 89.8% 92.9% 95.1% 93.2% 94.0% 93.2% 91.8%
8.2%
91.8%
0%
10%
20%
30%
40%
50%
60%
70%
80%
90%
100%
Dom
estic
Fore
ign
Engineering Technology Bachelor’s Degrees Awarded by Residency
9.1.7 Top 50 Institutions Awarding Highest Number of ET Degrees
Table 118: Top 50 Institutions Awarding Highest Number of ETDegrees
No Institutions Degrees Awarded1 University of Houston, College of Technology 1,0822 Excelsior College 7263 Arizona State University 6074 Ferris State University 5925 Texas A&M University 5556 Farmingdale State College (SUNY) 4797 Pennsylvania College of Technology 3808 Old Dominion University 3489 Indiana University-Purdue University Indianapolis 346
10 Indiana State University 33211 Purdue University Northwest, Technology 31312 Pittsburg State University 290
78

Table 118: Top 50 Institutions Awarding Highest Number of ETDegrees (continued)
No Institutions Degrees Awarded13 Eastern Michigan University 24614 Rochester Institute of Technology 24315 New Jersey Institute of Technology 22816 University of Southern Mississippi 21217 Weber State University 20418 University of North Carolina at Charlotte 18619 Oklahoma State University 17820 Metropolitan State University of Denver 17621 University of Wisconsin, Platteville 16822 Kennesaw State University 15923 Texas Southern University 15624 Purdue University Fort Wayne 14624 Western Kentucky University 14626 Central Connecticut State University 14227 East Tennessee State University 13627 Southeast Missouri State University 13627 University of Central Missouri 13630 Central Washington University 13431 New England Institute of Technology 13032 Southeastern Louisiana University 12633 Eastern Washington University 12234 Fairmont State University 12035 Middle Tennessee State University 11836 Northern Kentucky University 11636 University of Hartford 11636 University of Louisiana at Lafayette 11639 Minnesota State University-Mankato 11440 University of Cincinnati 11341 Penn State Erie, The Behrend College 10942 California State University Maritime Academy 10843 Murray State University 10444 The Pennsylvania State University 10144 Western Carolina University 10146 Youngstown State University 10047 University of Maine 9948 Miami University 9749 Oregon Institute of Technology 9149 SUNY Polytechnic Institute 91* 111 Institutions included
9.1.8 Top 50 Institutions by Engineering Technology Degrees awarded to Underrepresented Minorities
Table 119: Top 50 Institutions by Engineering Technology Degreesawarded to Underrepresented Minorities
No Institutions Degrees Awarded1 University of Houston, College of Technology 4782 Farmingdale State College (SUNY) 1503 Arizona State University 1444 Texas A&M University 1345 Excelsior College 1266 New Jersey Institute of Technology 957 Old Dominion University 788 Savannah State University 629 University of Southern Mississippi 58
10 Virginia State University 5611 Indiana University-Purdue University Indianapolis 4512 Kennesaw State University 4413 Indiana State University 4213 University of Hartford 4215 Texas Southern University 4016 Rochester Institute of Technology 3717 Eastern Michigan University 3617 Metropolitan State University of Denver 3619 University of North Carolina at Charlotte 3120 Ferris State University 3021 New England Institute of Technology 2821 Northwestern State University of Louisiana 2823 University of North Texas 2724 Pittsburg State University 2625 Purdue University Northwest, Technology 2425 University of Central Missouri 2427 Austin Peay State University 2227 Central Connecticut State University 2227 Colorado State University-Pueblo 2227 University of Louisiana at Lafayette 2231 Oklahoma State University 2132 California State University Maritime Academy 2032 Daytona State College 2032 Fort Valley State University 20
79

Table 119: Top 50 Institutions by Engineering Technology Degreesawarded to Underrepresented Minorities (continued)
No Institutions Degrees Awarded32 Grambling State University 2032 Vaughn College of Aeronautics and Technology 2032 Weber State University 2038 Central Washington University 1838 Pennsylvania College of Technology 1840 Elizabeth City State University 1640 Southeastern Louisiana University 1642 Grantham University 1442 Middle Tennessee State University 1444 Fairleigh Dickinson University-Metropolitan Campus 1244 Northern New Mexico College 1244 SUNY Polytechnic Institute 1244 Western Kentucky University 1248 Capitol Technology University 1048 Louisiana Tech University 1048 Missouri Western State University 10* 111 Institutions included
9.1.9 Top 50 Institutions by Percentage of Engineering Technology Degrees awarded to Underrepresented Minorities
Table 120: Top 50 Institutions by Percentage of Engineering Tech-nology Degrees awarded to Underrepresented Minorities
No Institutions Percent Underrepresented Minorities1 Fort Valley State University 100%2 Savannah State University 86.1%3 Northern New Mexico College 75%3 Southern Illinois University Carbondale 75%5 Capitol Technology University 71.4%6 Elizabeth City State University 66.7%7 Virginia State University 62.2%8 Grambling State University 52.6%9 University of Houston, College of Technology 44.2%
10 New Jersey Institute of Technology 41.7%11 University of Hartford 36.2%12 Northwestern State University of Louisiana 35.9%13 The University of Memphis 35.7%14 Vaughn College of Aeronautics and Technology 33.3%15 Farmingdale State College (SUNY) 31.3%16 University of North Texas 30.7%17 Daytona State College 30.3%18 Austin Peay State University 28.9%19 University of West Alabama 27.8%20 Kennesaw State University 27.7%21 Colorado State University-Pueblo 27.5%22 University of Southern Mississippi 27.4%23 Texas Southern University 25.6%24 Idaho State University 25%25 Texas A&M University 24.1%26 Fairleigh Dickinson University-Metropolitan Campus 24%27 Arizona State University 23.7%28 Old Dominion University 22.4%29 New England Institute of Technology 21.5%30 Temple University 20.9%31 Metropolitan State University of Denver 20.5%32 Oklahoma State University Institute of Technology 20%33 University of Louisiana at Lafayette 19%34 California State University Maritime Academy 18.5%35 University of Central Missouri 17.6%36 Grantham University 17.5%37 Excelsior College 17.4%38 Louisiana Tech University 16.9%39 University of North Carolina at Charlotte 16.7%40 Central Connecticut State University 15.5%41 Rochester Institute of Technology 15.2%42 Missouri Western State University 15.2%42 Northern Michigan University 15.2%44 University of Massachusetts Lowell 14.8%45 Eastern Michigan University 14.6%46 Western Michigan University 14%47 Central Washington University 13.4%48 SUNY Polytechnic Institute 13.2%49 Indiana University-Purdue University Indianapolis 13%50 Southeastern Louisiana University 12.7%* 111 Institutions included
9.1.10 Top 50 Institutions Awarding Engineering Technology Degrees to Women
80

Table 121: Top 50 Institutions Awarding Engineering TechnologyDegrees to Women
No Institutions Degrees Awarded1 University of Houston, College of Technology 3842 Arizona State University 1723 Farmingdale State College (SUNY) 1204 Texas A&M University 1155 Indiana University-Purdue University Indianapolis 886 Eastern Michigan University 747 Ferris State University 548 Purdue University Northwest, Technology 539 Excelsior College 46
10 Rochester Institute of Technology 3811 Old Dominion University 3612 University of Southern Mississippi 2813 Southeast Missouri State University 2613 University of Hartford 2615 Indiana State University 2416 New Jersey Institute of Technology 2317 Kennesaw State University 2017 Middle Tennessee State University 2019 New England Institute of Technology 1819 Pittsburg State University 1819 Virginia State University 1822 Murray State University 1622 Southeastern Louisiana University 1622 Texas Southern University 1622 Youngstown State University 1626 California State University Maritime Academy 1426 Daytona State College 1426 Fairmont State University 1426 Northwestern State University of Louisiana 1426 Oklahoma State University 1426 Pennsylvania College of Technology 1426 Purdue University Fort Wayne 1433 East Tennessee State University 1233 Metropolitan State University of Denver 1233 Miami University 1233 University of North Carolina at Charlotte 1237 University of Cincinnati 1138 Central Washington University 1038 University of Central Missouri 1038 University of West Alabama 1041 University of Louisiana at Lafayette 941 Western Michigan University 943 Central Connecticut State University 843 Eastern Washington University 843 Missouri Western State University 843 Southern Utah University 843 University of Dayton 843 University of North Texas 843 University of Pittsburgh-Johnstown 843 University of Wisconsin-Oshkosh 8* 111 Institutions included
9.2 ENGINEERING TECHNOLOGY ENROLLMENT, FALL 20199.2.1 Full-Time Engineering Technology Enrollment by Discipline
Table 122: Full-Time Engineering Technology Enrollment by Discipline: 34,845
Discipline Name Degrees AwardedOther Eng. Tech. Disciplines 10,486Engr. Tech. (General) 6,221Mechanical Engr. Tech. 4,738Computer Engr. Tech. 3,618Construction Engr. Tech. 3,550Industrial/Manufacturing Eng. Tech. 2,388Electrical/Electronics Eng. Tech. 1,950Aerospace Engr. Tech. 1,170Civil Engr. Tech. 471Architectural Engr. Tech. 253* Enrollment is for full-time bachelor’s degree candidates in Engineering Technology
81
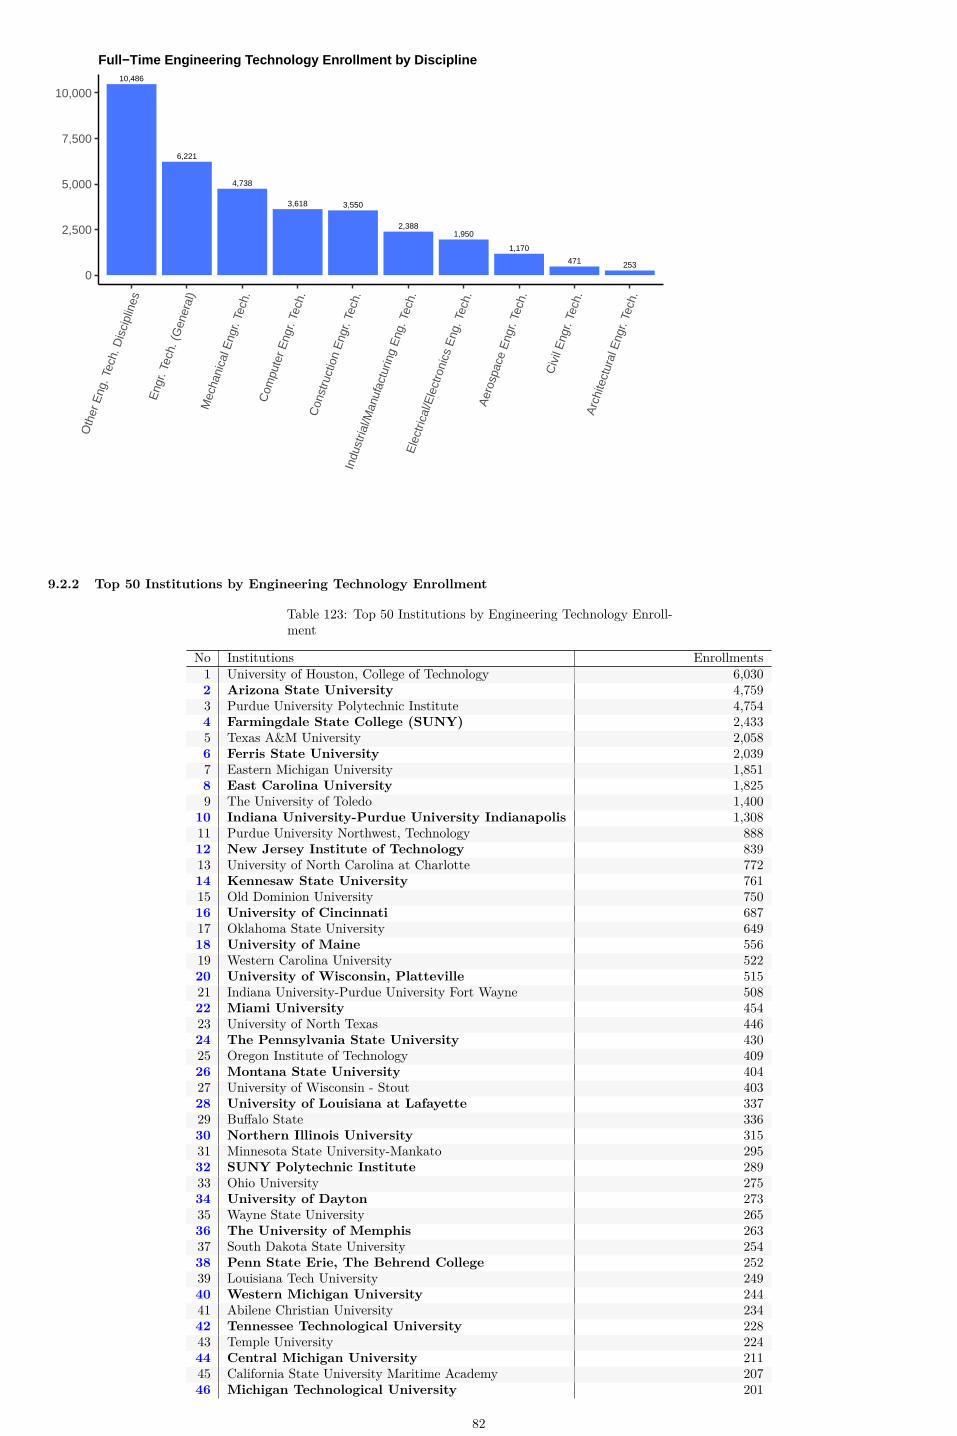
10,486
6,221
4,738
3,618 3,550
2,3881,950
1,170
471 253
0
2,500
5,000
7,500
10,000O
ther
Eng
. Tec
h. D
isci
plin
es
Eng
r. Te
ch. (
Gen
eral
)M
echa
nica
l Eng
r. Te
ch.
Com
pute
r Eng
r. Te
ch.
Con
stru
ctio
n E
ngr.
Tech
.In
dust
rial/M
anuf
actu
ring
Eng
. Tec
h.E
lect
rical
/Ele
ctro
nics
Eng
. Tec
h.A
eros
pace
Eng
r. Te
ch.
Civ
il E
ngr.
Tech
.A
rchi
tect
ural
Eng
r. Te
ch.
Full−Time Engineering Technology Enrollment by Discipline
9.2.2 Top 50 Institutions by Engineering Technology Enrollment
Table 123: Top 50 Institutions by Engineering Technology Enroll-ment
No Institutions Enrollments1 University of Houston, College of Technology 6,0302 Arizona State University 4,7593 Purdue University Polytechnic Institute 4,7544 Farmingdale State College (SUNY) 2,4335 Texas A&M University 2,0586 Ferris State University 2,0397 Eastern Michigan University 1,8518 East Carolina University 1,8259 The University of Toledo 1,400
10 Indiana University-Purdue University Indianapolis 1,30811 Purdue University Northwest, Technology 88812 New Jersey Institute of Technology 83913 University of North Carolina at Charlotte 77214 Kennesaw State University 76115 Old Dominion University 75016 University of Cincinnati 68717 Oklahoma State University 64918 University of Maine 55619 Western Carolina University 52220 University of Wisconsin, Platteville 51521 Indiana University-Purdue University Fort Wayne 50822 Miami University 45423 University of North Texas 44624 The Pennsylvania State University 43025 Oregon Institute of Technology 40926 Montana State University 40427 University of Wisconsin - Stout 40328 University of Louisiana at Lafayette 33729 Buffalo State 33630 Northern Illinois University 31531 Minnesota State University-Mankato 29532 SUNY Polytechnic Institute 28933 Ohio University 27534 University of Dayton 27335 Wayne State University 26536 The University of Memphis 26337 South Dakota State University 25438 Penn State Erie, The Behrend College 25239 Louisiana Tech University 24940 Western Michigan University 24441 Abilene Christian University 23442 Tennessee Technological University 22843 Temple University 22444 Central Michigan University 21145 California State University Maritime Academy 20746 Michigan Technological University 201
82

Table 123: Top 50 Institutions by Engineering Technology Enroll-ment (continued)
No Institutions Enrollments47 University of Hartford 19948 University of Arkansas at Little Rock 16549 Trine University 16450 University of Massachusetts Lowell 134* 111 Institutions reported.* Enrollment is for full-time and part-time bachelor’s degree candidates in engineering technology.
9.2.3 Engineering Technology Enrollment by Gender
Table 124: Engineering Technology Enrollment by Gender
Gender PercentageFemale 24%Male 76%
76%
24%
0%
10%
20%
30%
40%
50%
60%
70%
80%
90%
100%
Mal
e
Fem
ale
Engineering Technology Bachelor’s Enrollment by Gender
9.2.4 Engineering Technology Enrollment by Race and Ethnicity
Table 125: Engineering Technology Enrollment by Race and Ethnicity*
Ethnicity PercentageBlack or Afr. American 9.5%Hispanic 16%Other 4.3%Asian American 7.3%White 60.7%Unknown 2.2%* American Indian/Alaska Native 0.5% Native Hawaiian/Other Pacific Islander 0.2%* and Multiracial 3.5% are combined under other* *Data on ethnicity does not include foreign nationals.
83

9.5%
16%
4.3%7.3%
60.7%
2.2%0%
10%
20%
30%
40%
50%
60%
70%
80%
90%
100%B
lack
or A
fr. A
mer
ican
His
pani
c
Oth
er
Asi
an A
mer
ican
Whi
te
Unk
now
n
Engineering Technology Enrollment by Race and Ethnicity
9.2.5 Engineering Technology Enrollment by Residency
Table 126: Doctoral Enrollment by Residency
Nationality PercentageForeign 3.8%Domestic 96.2%* Enrollment is for full-time and part-time bachelor’s degree candidates in engineering technology* 63 Institutions reported.
3.8%
96.2%
0%
10%
20%
30%
40%
50%
60%
70%
80%
90%
100%
Dom
estic
Fore
ign
Engineering Technology Enrollment Awarded by Residency
84

10 SURVEY DEFINITIONSJoseph R. Roy, Ph.D.
Below are the definitions used for the Profiles Survey. The definitions are the same for both the Engineering and Engineering Technology portions ofthe survey.
10.1 Race/EthnicityThe definitions of race/ethnicity align with the US Department of Education’s data collections in order to ensure that institutions have and can reportthe data requested. We do not survey individual students or faculty, but institutions and only receive total (unduplicated) headcounts for each programor department we collect data for.
American Indian or Alaska Native: A person having origins in any of the original peoples of North and South America (including CentralAmerica), and who maintains tribal affiliation or community attachment.
Asian: A person having origins in any of the original peoples of the Far East, Southeast Asia, or the Indian subcontinent including, for example,Cambodia, China, India, Japan, Korea, Malaysia, Pakistan, the Philippine Islands, Thailand, and Vietnam.
Black or African American: A person having origins in any of the black racial groups of Africa. Terms such as “Haitian” or “Negro” can be usedin addition to “Black or African American.”
Hispanic or Latino: A person of Cuban, Mexican, Puerto Rican, South or Central American, or other Spanish culture or origin, regardless of race.The term, “Spanish origin,” can be used in addition to “Hispanic or Latino.”
Native Hawaiian or Other Pacific Islander: A person having origins in any of the original peoples of Hawaii, Guam, Samoa, or other PacificIslands.
White: A person having origins in any of the original peoples of Europe, the Middle East, or North Africa.
Nonresident alien: A person who is not a citizen or a national of the United States and who is in this country on a visa or temporary basis and doesnot have the right to remain indefinitely.
Two or more: Persons who reported themselves as belonging to more than one of the race categories. These individuals should only be counted inthis field and not any of the race categories.
Unknown: Those individuals who do not select any of the above options.
Hispanic/Latino includes individuals of any race who identify as Hispanic or Latino. The five race categories include only persons who reported one ofthose fields as their sole race and did not report Hispanic/Latino ethnicity.
Nonresident aliens are not included in any of the race or ethnicity fields.
Canadian institutions and other non-US institutions report students under two categories: Unknown and Nonresident Alien.
10.2 GenderInstitutions were given an option how to report their data for graduation, enrollment and faculty counts.
Gender Category Options:
-Male/Female -Male/Female/Non-binary Gender/Another Gender or Unknown
Institutions that choose the binary gender option spreadsheet, are reporting data to ASEE as it would be reported to the U.S. Department ofEducation’s Integrated Post-Secondary Education System (IPEDS) survey. Gender for individuals (student or faculty) which is unknown or anothergender besides male or female would be reported in one of the two categories (male or female) selected by the institution, as noted in the IPEDS FAQ’s.Under this option, institutions included counts for all individuals.
For the second option, institutions were asked to report with four gender categories: -Male -Female -Non-binary Gender -Another Gender or Unknown
This change has been made in response to a request from institutions to reflect their changing student and faculty composition. Please see the technicalreview panel discussion from 2016 for more information about the collection of gender information at a national level.
10.2.1 Reporting Period
The reporting period for the 2019 data collection are listed below.
• For degrees awarded we include all completions between July 1, 2018 to June 30, 2019.
• For enrollment, institutions were instructed to report their data for the Fall 2019 session.
• For full time and part time faculty data, institutions were instructed to report for the Fall 2019 session.
• For research expenditures, institutions were asked to report their data for fiscal year 2019.
10.3 Other Definitions• Full-time staff: As defined by the institution. The type of appointment at the snapshot determines whether an employee is full-time or part-time.
The employee’s term of contract is not considered in making the determination of full- or part-time.
• Full-time student: Undergraduate: A student enrolled for 12 or more semester credits or 12 or more quarter credits or 24 or more clock hours aweek each term Graduate: A student enrolled for 9 or more semester credits or 9 or a student involved in thesis or dissertation preparation thatis considered full-time by the institution.
• Non-tenure track, teaching faculty: Persons identified by the institution as such as typically those whose initial assignments are made for thepurpose of conducting instructions as a principle activity (or activities). They may hold academic rank titles of professor, associate professor,assistant professor, instructor, lecturer, or the equivalent of any of those academic ranks. Graduate instruction (teaching) and research assistantsare not included in this category.
• Part-time student: Undergraduate: A student enrolled for either less than 12 semester or quarter hours or less that 24 clock hours a week eachterm. Graduate: A student enrolled for less than 9 semester or quarter credits.
• Research personnel: An occupational category used to classify persons whose specific assignments customarily are made for the purpose ofconducting research. Regardless of title, academic rank, these employees formally spend the majority of their time conducting research (excludetenure/tenure-track faculty from this count).
• Tuition: The amount of money charged to students for instructional services. Tuition may be charged per term, per course, or per credit
85

• Tuition and fees (published charges): The amount of tuition and required fees covering a full academic year most frequently charged to students.These values represent what a typical student would be charged and may not be the same for all students at an institution. If tuition is chargedon a per-credit-hour basis, the average full-time credit hour load for an entire academic year is used to estimate average tuition. Required feesinclude the fixed sum charged that are required of such a large proportion of all students that the student who does not pay the charges is anexception.
Joseph Roy is Director, Institutional Research & Analytics at the American Society for Engineering Education. He can be reached for questions [email protected]
86