Embed Size (px)
Citation preview

Arndt-Corden Department of Economics Crawford School of Public Policy ANU College of Asia and the Pacific
ASEAN’s limited regional Integration spells globalisation,
not Failure
Jayant Menon
ISEAS Yusof-Ishak Institute Singapore
February 2021
Working Papers in Trade and Development
No. 2020/02

This Working Paper series provides a vehicle for preliminary circulation of research results in the fields of economic development and international trade. The series is intended to stimulate discussion and critical comment. Staff and visitors in any part of the Australian National University are encouraged to contribute. To facilitate prompt distribution, papers are screened, but not formally refereed.
Copies are available at https://acde.crawford.anu.edu.au/acde-research/working-papers-trade-and-development

ASEAN’s Limited Regional Integration Spells Globalisation,
Not Failure
Jayant Menon1
Abstract
In assessing regionalism, it has become customary to look to the European experience to serve
as a benchmark against which all other regional integration programs are judged. But ASEAN
is different. Compared to Europe, it is outward- rather than inward-looking, market rather than
government driven, and institution light rather than heavy. These differences reflect the very
different motivations and objectives of the two regional programs. ASEAN’s success lies in its
almost unique achievement of using regionalism for globalisation. The metrics that we use to
assess regionalism must reflect true objectives, even if they lie below the surface. Widely used
indicators such as shares of intra-regional trade and investment not only fail to capture the real
story, but they can point in the wrong direction.
JEL Classification: F13, F14, F15;
Keywords: Regionalism; Globalisation; ASEAN
1 I am grateful to participants at the Institute of South Asian Studies – Berkeley ASEAN Studies Centre
Workshop on "Revisiting Globalisation: Comparing Country Experiences from South Asia and the World" for
their comments, particularly Vinod Aggarwal. Any remaining errors are mine.
2
ASEAN’s Limited Regional Integration Spells Globalisation,
Not Failure
1. Introduction
As a regional organisation, the Association of Southeast Asian Nations – or ASEAN – is
different in many ways. Previous assessments of ASEAN may not have fully recognised how
different ASEAN’s objectives may have been from most, if not all, other regional
arrangements. This is mainly because in assessing regionalism, it has become customary to
look to the European experience to serve as a benchmark against which all other regional
integration programs are judged, if not ranked. Despite recent challenges, there is little doubt
that Europe has made great strides in the economic sphere as well as in preserving the peace
and security of the region. It is clearly the most integrated region in the world and there was a
time when regional groupings everywhere looked on in awe, aspiring to emulate its many
achievements. So how does ASEAN compare to this so-called model of regionalism?
Unlike Europe, regionalism for ASEAN has evolved to become more of a means rather than
an end. With markedly different objectives in mind, any comparative assessment needs to
employ criteria and metrics that measure intended outcomes as opposed to assumed outputs.
In this paper, we look closely at what ASEAN has tried to achieve through the way in which it
has implemented its economic protocols. By doing this, we try and delineate the true objectives
of ASEAN instead of simply assuming that they must be the same as other regional
arrangements. Put simply, this paper argues that any comparison with the European or other
regional arrangements is likely to yield flawed results if the underlying objectives differ.
Therefore, the metrics used in the assessment should align with true objectives.
The paper is sectioned in five parts. Section 2 provides a brief background of ASEAN and
argues the importance of differentiating between stated and true objectives in evaluating
progress towards goals. In Section 3, we examine ASEAN’s trade performance using
traditional and non-traditional indicators and assess performance accordingly. This section also
brings out the practical importance of identifying true objectives and applying the correct
metrics in assessing performance subsequently. The same is done for foreign direct investment
(FDI) in Section 4. A final section concludes.

3
2. Understanding ASEAN’s Objectives: Stated versus Real
Born as a politico-security pact during the Viet Nam War in 1967, it took a while before
ASEAN decided to get serious about pursuing an economic agenda. It was not until the Bali
Summit of the five leaders in February 1976 that a formal set of regional cooperation measures
were introduced. However, none of the economic cooperation programs had any significant
impact on regional economic relations (Imada and Naya, eds, 1992) as they were explicitly
designed that way. Member countries were not ready, willing, or interested in forging greater
economic ties amongst each other and the implementation of these agreements reflected that.
An outsider observing these outcomes would have declared the program a failure while an
insider would have understood that they achieved exactly what they were designed to achieve:
very little.
The first serious attempt at pursuing economic objectives commenced in 1992 when ASEAN
leaders announced at their Summit that they would pursue the establishment of an ASEAN
Free Trade Area, or AFTA. This marked a clear break with the past and the stated emphasis
was on stronger economic cooperation: for the first time, ‘free trade’ was the regional objective.
There was a clear timetable for implementation and a ‘negative list’ approach was adopted, in
that all goods traded would be included within AFTA unless explicitly excluded.
On the trade liberalisation front, AFTA succeeded in doing much more than mandated – again
drawing the contrast between stated and actual objectives but this time in a more positive way.
However, AFTA had a much wider agenda, covering areas such as services, investment,
intellectual property rights and the like. Yet, progress in all of these areas remained limited.
Instead of backing down, ASEAN decided to double down and announced an even more
ambitious agenda labelled the ASEAN Economic Community (AEC). In 2007, ASEAN leaders
signed the AEC Blueprint defining the actions, measures, and timelines leading up to the
AEC’s creation. An AEC Scorecard was drawn up to track progress in implementing specific
measures within the Blueprint’s timelines.
Like with the AFTA agenda (except for tariffs), ASEAN fell short of its target of realising the
AEC by end-2015. By 2015, the full list of AEC Scorecard measures had grown from 316 to
611; of this total, 506 were identified as the focused base of measures for implementation
between 2008-2015. By end-October 2015, ASEAN had reportedly implemented 92.7% of
these 506 measures. The remaining 105 measures were deferred until after 2015 (ASEAN,

4
2015). A successor Blueprint called AEC 2025 had to be introduced, laying out the work for
ASEAN economic integration that remained to be done.
Some see this as a failure on ASEAN’s part, but should they? An alternative view could be that
ASEAN was never going to meet the deadline of 2015 – which had been moved forward from
2020 – as it had been overly ambitious by design. With this explanation, the real objective was
never to realise the AEC by 2015 (or even 2020) but to create sufficient momentum to get as
close as possible to it than would otherwise have been possible. Given ASEAN’s mixed record,
this is not an implausible explanation.
Other assessments of ASEAN as a regional integration program may also have failed to
delineate true underlying objectives from those that appear on the surface. It is often assumed,
quite understandably, that the primary purpose of regional integration agreements is to increase
regional integration outcomes. If that was the case, then traditional measures of integration
such as changes in the shares of intra-regional trade and investment over time would be the
appropriate metrics for assessing performance or measuring progress. However, if it is not the
primary objective, then these metrics alone may not be sufficient in delivering an accurate
assessment of performance.
3. Assessing Trade Performance
There are both price and quantity indicators that are used to measure the extent of integration.
Price indicators are not as common as quantity indicators because data is limited. However,
when sufficient data on prices are available, they can be employed to examine the degree of
price convergence across markets as a measure of market integration with the law of one price
setting the theoretical limit for perfect convergence. The most commonly used quantitative
indicators of integration are measures of intra-regional trade. These measures are often
concurrently used as indicators of inter-dependence and of self-reliance and independence.2
They can also be used to indicate the degree of resilience to global shocks or shocks emanating
from other regions.
In ASEAN, the share of intra-regional trade has remained low and relatively unchanged at
around 20-25% for almost two decades (Figure 1). Other similar indicators such as trade
2 Measures of business cycle synchronisation such as output correlations are often used as indicators
of macroeconomic interdependence (see Capanelli et al. 2009).

5
intensity measures are less gloomy but still point in the same direction.3 Based on these
traditional indicators of trade integration, ASEAN would be judged a failure. But what if there
are broader objectives being pursued? What if regionalism is only a means towards greater
ends?
Figure 1: Intra-ASEAN Trade
Source: ADB ARIC Integration Indicators Database. https://aric.adb.org
This is indeed the case for ASEAN. To illustrate, consider the implementation of the ASEAN
Free Trade Agreement, or AFTA. ASEAN’s original members have used the agreement as a
stepping-stone to pursue broader liberalisation and thereby promote globalisation. The data
suggest that the original members have been multilateralising their tariff preferences over time,
narrowing or eliminating the difference between preferential and most favoured nation (MFN)
tariff rates. This initially began with multilateralising the Common Effective Preferential Tariff
3 The trade intensity index is used to determine whether the value of trade between two entities is
greater or smaller than would be expected based on their importance in world trade. It is usually
measured as the ratio of two export shares. The numerator is the share of the destination of interest
in the exports of the region under study while the denominator is the share of the destination of
interest in the exports of the world as a whole.
0
5
10
15
20
25
30
0
100
200
300
400
500
600
700
19
90
19
91
19
92
19
93
19
94
19
95
19
96
19
97
19
98
19
99
20
00
20
01
20
02
20
03
20
04
20
05
20
06
20
07
20
08
20
09
20
10
20
11
20
12
20
13
20
14
20
15
20
16
USD billion Percent of Total

6
(CEPT) rates and then continued with the ASEAN Trade in Goods Agreement (ATIGA) rates.4
This has significantly reduced – and often eliminated – the margins of preference (Figure 2).
In a comparison of external tariffs of major regional trade agreements, the World Bank (2005)
found that only the North American Free Trade Agreement (NAFTA) had lower external tariffs
than AFTA. Since then, it is quite likely that the ASEAN’s external tariff rates have been
reduced to be currently lower than NAFTA’s.
Figure 2: Decline of Margins of Preference in ASEAN
Note:
Latest available year. In the calculation of MFN tariff averages, general tariffs (for non-WTO members) and
non-MFN tariffs are included.
Source: ITC Market Access Map Country Tariff Averages, downloaded 9 October 2017
As a result, more than 90% of tariff lines have a margin of preference of zero
(Feridhanusetyawan, 2005) and more than 70% of intra-ASEAN trade is conducted at MFN
zero (Table 1). On average, ASEAN members had 96% of their tariff lines at 0% by August
2017 (ASEAN 2017) and this share is expected to reach 98.7% by 2018 (ASEAN 2016).
4 ATIGA replaces the CEPT scheme of AFTA. It was signed in February 2009 and entered-into-force
in May 2010.
0.29%
0.67%
0.00%
0.08%
0.16%
0.27%
0.31%
0.19%
0.34%
0.11%
1.09%
4.77%
0.00%
0.22%
0.38%
0.45%
0.30%
0.20%
0.39%
0.12%
0.34%
1.03%
0.31%
0.08%
0.16%
0.26%
0.31%
0.20%
0.33%
0.10%
0.00% 1.00% 2.00% 3.00% 4.00% 5.00% 6.00%
Viet Nam
Thailand
Singapore
Philippines
Myanmar
Malaysia
Lao PDR
Indonesia
Cambodia
Brunei
All products Agricultural Non-agricultural

7
There is an unusual amount of discussion about how ASEAN needs to raise the rates of
utilisation of preferences within the agreement. To a certain extent, preference utilisation would
overcome the attribution problem, i.e., to be able to say that such trade would not have taken
place if not for the preferences provided by the trade agreement. Still, it does not fully
overcome this problem as there is no definitive way of determining that such trade would not
have occurred anyway. The case may be strengthened if intra-regional trade shares had
increased significantly over time but this has not been the ASEAN experience.
Table 1: Preferential Trade by Agreement/Type of Regime, 2008 (Selected Regimes)
Regime
Share of Trade by Preferential Margin (PM) and MFN Rate
(in percent of total trade)
Preferential Trade Total Non-
Pref, >0
Total MFN
Zero
Trade
weighted
pref. margin
(percentage
points)
Total
Preferential
PM
>20%
PM
10.1% to
20%
PM
5.1% to
10%
PM
2.6% to
5%
PM
0.1% to
2.5%
Intra-ASEAN 20.1 2.0 2.0 2.6 4.7 8.7 3.6 72.9 1.7
Singapore-USA 7.2 0.2 0.2 0.6 4.8 1.4 0.0 92.7 0.3
Japan-Singapore 3.1 0.0 0.0 0.1 2.4 0.6 1.9 94.0 0.1
Australia-Singapore 6.4 0.0 0.0 0.2 6.1 0.0 0.0 93.6 0.4
India-Singapore 20.0 0.0 0.0 8.7 6.6 4.6 16.2 59.6 1.0
Source: WTO (2011)
Furthermore, rates of utilisation of preferences in ASEAN remain low by international
standards. Table 2 provides utilisation rates for Japanese affiliates operating in ASEAN
reported by Hayakawa et al. (2009). They employ the results of a survey conducted by JETRO
to examine the utilisation of ASEAN FTAs by Japanese affiliates. The authors restrict the
sample to Japanese affiliates that are actually exporting to or importing from ASEAN countries.
They find that average utilisation rates for exports is rarely above 25%, averaging at 22%.
These rates are even lower for imports. Another survey by JETRO (2003) found that in 2002,
the rate was only 4% for Malaysia and 11% for Thailand. Manchin and Pelkmans–Balaoing
(2007) cite estimates based on firm interviews conducted for the ASEAN Secretariat that

8
showed an AFTA tariff preference utilisation rate of about 5% of total trade. ISEAS (2010)
reports AFTA tariff preference utilisation rates of around 15–17% for the Philippines and 20%
for Viet Nam. The average utilisation rate for ASEAN was 23% in 2008. To put this in
comparative perspective, utilisation rates of below 50% are considered low in European
preferential trading agreements (see, for instance, Augier et al., 2005).
Table 2: Utilisation Rates of Japanese Affiliates
Exporter Importer
Use Intend
to Use
No
Intention
to Use
Use Intend
to Use
No
Intention
to Use
ASEAN 22% 28% 50% 18% 27% 55%
Indonesia 26% 35% 39% 24% 37% 39%
Malaysia 25% 21% 53% 16% 18% 66%
Philippines 15% 23% 61% 10% 20% 70%
Singapore 35% 22% 44% NA NA NA
Thailand 22% 34% 44% 21% 33% 46%
Viet Nam 9% 28% 62% 14% 28% 59% Note: NA= Not available.
Source: Hayakawa et al. (2009)
Why are rates of utilisation of preferences so low in ASEAN? There are factors on both the
cost and benefit side of the equation that account for these low rates in ASEAN. On the cost
side, often complex rules of origin (ROO) and limited information and lack of firm-level skills
to comply with requirements discourage the use of ATIGA. On the benefit side, the low and
often non-existent margin of preference limits the value of using the FTA for trade. The most
compelling reason for low utilisation rates is because of irrelevancy – there are hardly any
preferences to utilise. When such is the case, improving information flows, simplifying rules-
of-origin or other similar measures will be misplaced as they will not improve utilisation rates.
Most previous studies on the welfare effects of FTAs have assumed that utilisation is complete,
or 100%.5 This is a serious limitation given the evidence summarised above. Exceptions in the
East Asian context are Petri et al. (2011) and Menon (2014). These studies find that actual
utilisation rates significantly diminish the benefits from preferential liberalisation but in a non-
linear way. For instance, when a utilisation rate of 25% is applied, the results suggest that the
5 See Ando (2009) for a summary of these studies.
9
welfare impacts are less than 25% of the impacts when full utilisation is assumed (Menon,
2014).
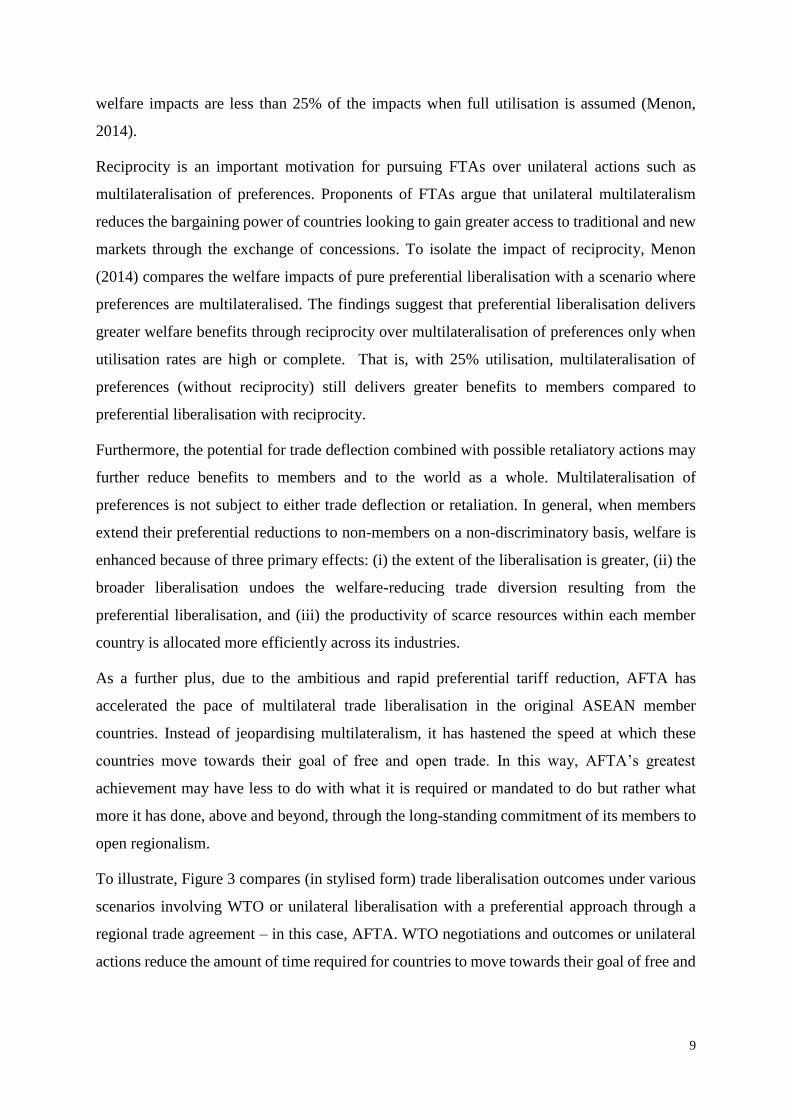
Reciprocity is an important motivation for pursuing FTAs over unilateral actions such as
multilateralisation of preferences. Proponents of FTAs argue that unilateral multilateralism
reduces the bargaining power of countries looking to gain greater access to traditional and new
markets through the exchange of concessions. To isolate the impact of reciprocity, Menon
(2014) compares the welfare impacts of pure preferential liberalisation with a scenario where
preferences are multilateralised. The findings suggest that preferential liberalisation delivers
greater welfare benefits through reciprocity over multilateralisation of preferences only when
utilisation rates are high or complete. That is, with 25% utilisation, multilateralisation of
preferences (without reciprocity) still delivers greater benefits to members compared to
preferential liberalisation with reciprocity.
Furthermore, the potential for trade deflection combined with possible retaliatory actions may
further reduce benefits to members and to the world as a whole. Multilateralisation of
preferences is not subject to either trade deflection or retaliation. In general, when members
extend their preferential reductions to non-members on a non-discriminatory basis, welfare is
enhanced because of three primary effects: (i) the extent of the liberalisation is greater, (ii) the
broader liberalisation undoes the welfare-reducing trade diversion resulting from the
preferential liberalisation, and (iii) the productivity of scarce resources within each member
country is allocated more efficiently across its industries.
As a further plus, due to the ambitious and rapid preferential tariff reduction, AFTA has
accelerated the pace of multilateral trade liberalisation in the original ASEAN member
countries. Instead of jeopardising multilateralism, it has hastened the speed at which these
countries move towards their goal of free and open trade. In this way, AFTA’s greatest
achievement may have less to do with what it is required or mandated to do but rather what
more it has done, above and beyond, through the long-standing commitment of its members to
open regionalism.
To illustrate, Figure 3 compares (in stylised form) trade liberalisation outcomes under various
scenarios involving WTO or unilateral liberalisation with a preferential approach through a
regional trade agreement – in this case, AFTA. WTO negotiations and outcomes or unilateral
actions reduce the amount of time required for countries to move towards their goal of free and
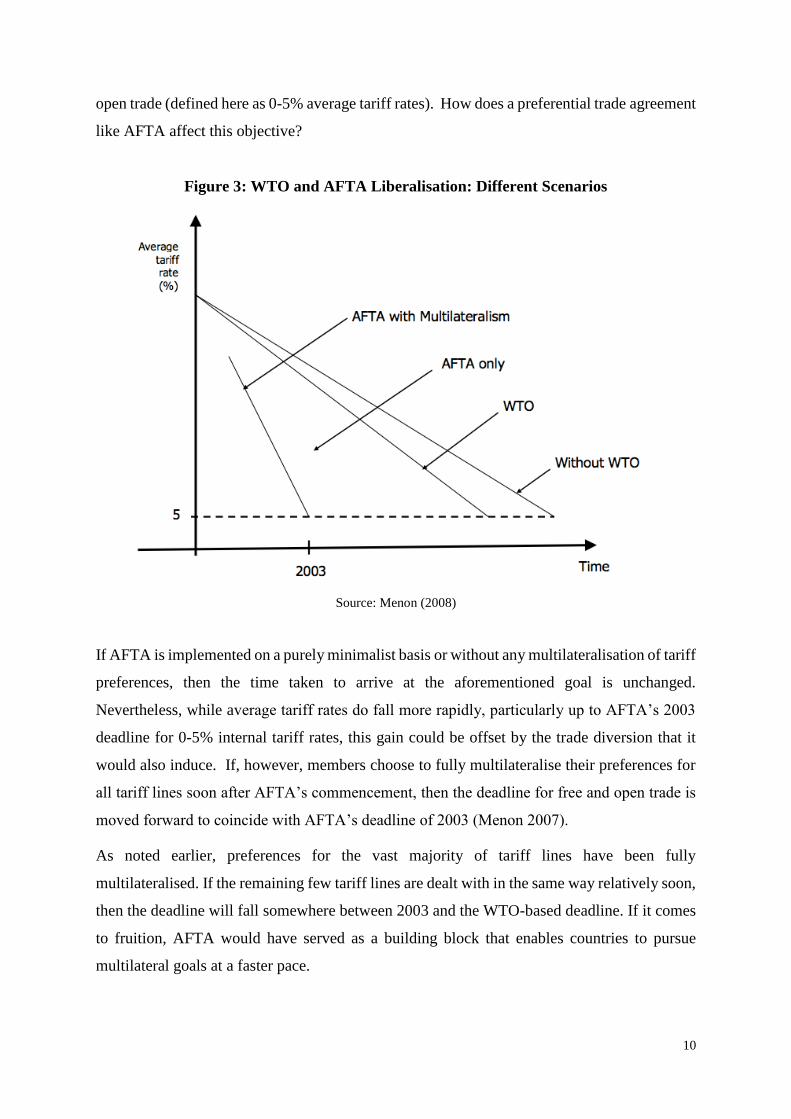
10
open trade (defined here as 0-5% average tariff rates). How does a preferential trade agreement
like AFTA affect this objective?
Figure 3: WTO and AFTA Liberalisation: Different Scenarios
Source: Menon (2008)
If AFTA is implemented on a purely minimalist basis or without any multilateralisation of tariff
preferences, then the time taken to arrive at the aforementioned goal is unchanged.
Nevertheless, while average tariff rates do fall more rapidly, particularly up to AFTA’s 2003
deadline for 0-5% internal tariff rates, this gain could be offset by the trade diversion that it
would also induce. If, however, members choose to fully multilateralise their preferences for
all tariff lines soon after AFTA’s commencement, then the deadline for free and open trade is
moved forward to coincide with AFTA’s deadline of 2003 (Menon 2007).
As noted earlier, preferences for the vast majority of tariff lines have been fully
multilateralised. If the remaining few tariff lines are dealt with in the same way relatively soon,
then the deadline will fall somewhere between 2003 and the WTO-based deadline. If it comes
to fruition, AFTA would have served as a building block that enables countries to pursue
multilateral goals at a faster pace.

11
Emulation of the approach taken by the original members would be in the interest of the
Mekong economies. Indeed, they will need to emulate this approach if they are not to be left
behind and if they are to succeed in deepening regional integration. Regionalism through
ASEAN membership could then provide the GMS economies with an opportunity to pursue
multilateralism aggressively and thus allow regionalism through AFTA to be a building block
rather than stumbling block toward free and open trade. However, whether the worldwide
proliferation of regional trade agreements will eventually integrate rather than fragment the
world economy remains a separate and open question.
Multilateralisation has minimised trade diversion and may account for the stubbornly low intra-
ASEAN trade shares. That being the case, low intra-regional shares may be a sign of success
rather than failure as far as producing welfare enhancing outcomes are concerned. Most of the
intra-ASEAN trade is supply-chain related trade in parts and components which mostly travel
duty-free because of zero tariffs provided by the Information Technology Agreement for
electronic parts and components, Special Economic Zone privileges or duty drawback schemes
(Menon, 2017). ASEAN’s ambitious tariff reduction and trade facilitation programs have
supported value-chain driven trade, as has multilateralisation, as final markets for the finished
goods are predominantly outside the region.
If multilateralisation has subdued intra-regional trade, it has promoted rapid growth in overall
trade, raising ASEAN to be the fourth largest exporting region in the world – next only to the
European Union, North America, and China (Hill and Menon, 2012; 2015). Although ASEAN
accounts for just 3.3 percent of world GDP, it produces more than 7 percent of world exports.
Indeed, according to the McKinsey Global Institute’s 2016 Connectedness Index, four ASEAN
member countries rank among the world’s 50 most connected nations: Singapore (ranked first),
Malaysia (20th), Thailand (22nd), and Viet Nam (37th). Indonesia and the Philippines are not
too far behind, ranking 51st and 54th, respectively (MGI 2016).6 ASEAN member countries
fared even better in DHL’s 2016 Global Connectedness Index, with five member countries
6 The MGI Connected Index measures countries’ integration into the global economy based on their
inflows and outflows of goods, services, finance, people and data and communication.

12
ranking among the top 50: Singapore (2nd), Malaysia (19th), Thailand (22nd), Viet Nam (36th)
and Cambodia (44th).7
After all, it is how much trade that takes place, and on what terms, that matters for welfare and
not who you trade with. Trade preferences are designed to affect who you trade with through
trade diversion which is welfare-reducing. ASEAN has largely avoided this outcome by
multilateralising its trade preferences and removing most or all of the margin of preference.
If the share of intra-ASEAN trade is to increase in the future, it should be driven by factors
other than trade preferences. When intra- or extra-ASEAN trade increases as a result of factors
such as comparative cost advantage, product differentiation or scale economies, then this
growth is welfare-enhancing. There is also great potential to increase trade in services by
reducing barriers, that remain the second highest in the world, in a non-discriminatory manner.
Any increase in intra-ASEAN trade resulting from these factors would be welfare-enhancing.
For all of services, and increasingly for goods as well, non-tariff barriers (NTBs) are the
problem today. For goods, achievements in tariff liberalisation have been offset by the rise in
non-tariff impediments to trade which increased from 1,634 to 5,975 between 2000 and 2015
(Ing, 2016). The data points to a clear negative correlation between the fall in tariff rates and
the increase in non-tariff barriers (NTBs) (Table 3). Whether or not NTBs have been rising
because tariffs have been falling – due to an attempt to restore protection – is unclear.
Irrespective of whether the link between the two is causal or coincidental, this poses a challenge
for ASEAN program of trade liberalisation. Not only are NTBs likely to be more restrictive,
providing more protection to domestic producers, but they are also opaque and more difficult
to dismantle. In addition, NTBs are a moving target as they can evolve to take on new forms
as soon as they are targeted or dismantled. It is likely that, for many sectors, the loss in
protection resulting from reductions in tariffs have been more than compensated for by the
increase in NTBs.
7 The DHL Global Connectedness Index captures cross-border flows of trade, capital, information and
people.

13
Table 3: ASEAN NTM Measures and Tariffs
Country Total
(Number)
SPS (%) TBT (%) Export
related
measures
(%)
Others (%)
Brunei 516 31 56 9 4
Cambodia 243 15 50 29 7
Indonesia 638 20 51 12 18
Lao PDR 301 13 30 27 30
Malaysia 713 36 47 10 7
Myanmar 172 44 24 20 12
Philippines 854 27 42 17 13
Singapore 529 24 59 9 7
Thailand 1630 48 34 8 9
Viet Nam 379 37 37 17 8
ASEAN Total 5975 29 43 16 12
Notes: SPS = Sanitary and Phytosanitary Standards; TBT = Technical Barriers to Trade
Source: Ing (2016).
4. Assessing FDI Performance
As with trade, less than a quarter of foreign direct investment (FDI) flowing to ASEAN
countries originate from within the region (Figure 4). ASEAN had flirted with the idea of
providing preferential treatment to investors from member countries in the original design of
the ASEAN Investment Area. However, it quickly abandoned the idea, reaffirming its
commitment to a non-discriminatory and open foreign investment climate and mirroring the
national regimes in member countries.
Total inflows of FDI flourished as a result, even if flows from each other remained relatively
unchanged. Again, as with trade, it is not where the FDI comes from that matters but how much
and what form it takes. The massive structural transformations that we have observed in the
original ASEAN member countries – and continue to observe in the newer members – would

14
probably have been compromised if ASEAN had not retained an open and non-discriminatory
investment climate.
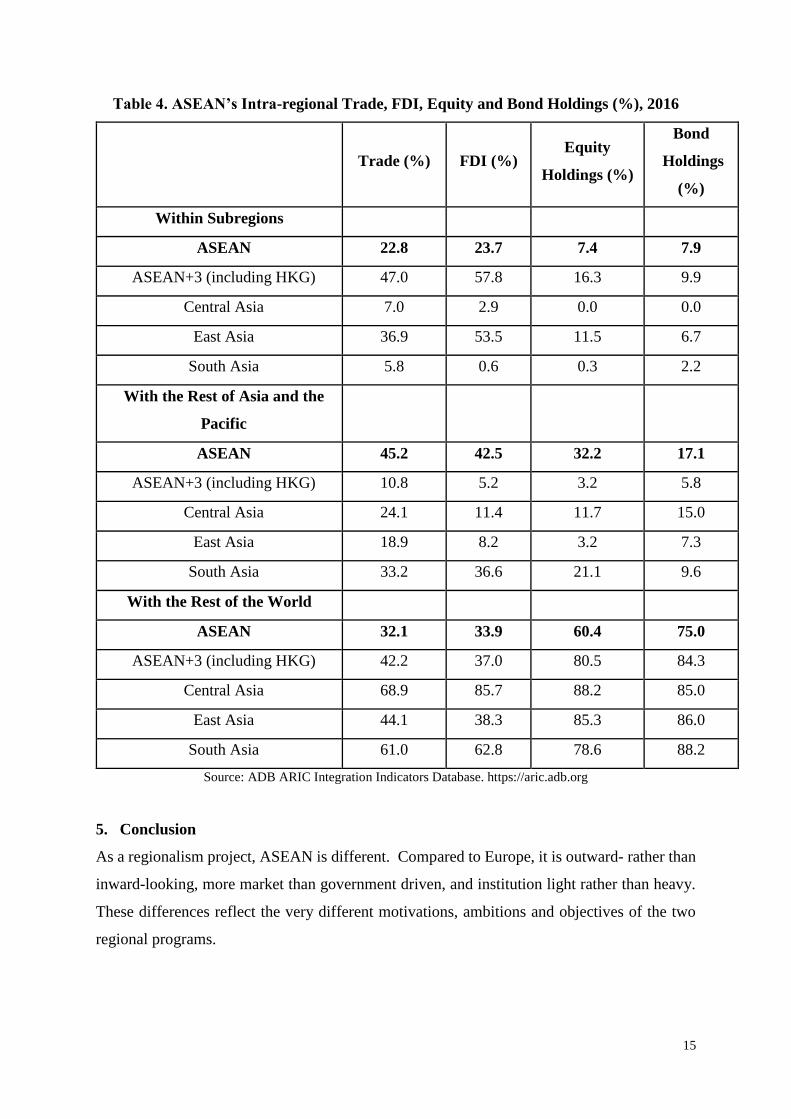
In the financial sphere, other purported measures of inter-dependence such as intra-regional
equity and bond holdings also suggest shallow integration (Table 4). Intra-regional equity or
bond holdings are less than 10% while three-quarters of bond holdings emanate from outside
the Asia-Pacific region.
Figure 4: Intra-ASEAN Flows of FDI, USD billion and percentage shares, 2001-16.
Source: ADB ARIC Integration Indicators Database. https://aric.adb.org
0
10
20
30
40
50
60
0
5
10
15
20
25
30
20
01
20
02
20
03
20
04
20
05
20
06
20
07
20
08
20
09
20
10
20
11
20
12
20
13
20
14
20
15
20
16
USD billion Percent of Total
15
Table 4. ASEAN’s Intra-regional Trade, FDI, Equity and Bond Holdings (%), 2016
Trade (%) FDI (%) Equity
Holdings (%)
Bond
Holdings
(%)
Within Subregions
ASEAN 22.8 23.7 7.4 7.9
ASEAN+3 (including HKG) 47.0 57.8 16.3 9.9
Central Asia 7.0 2.9 0.0 0.0
East Asia 36.9 53.5 11.5 6.7
South Asia 5.8 0.6 0.3 2.2
With the Rest of Asia and the
Pacific
ASEAN 45.2 42.5 32.2 17.1
ASEAN+3 (including HKG) 10.8 5.2 3.2 5.8
Central Asia 24.1 11.4 11.7 15.0
East Asia 18.9 8.2 3.2 7.3
South Asia 33.2 36.6 21.1 9.6
With the Rest of the World
ASEAN 32.1 33.9 60.4 75.0
ASEAN+3 (including HKG) 42.2 37.0 80.5 84.3
Central Asia 68.9 85.7 88.2 85.0
East Asia 44.1 38.3 85.3 86.0
South Asia 61.0 62.8 78.6 88.2
Source: ADB ARIC Integration Indicators Database. https://aric.adb.org
5. Conclusion
As a regionalism project, ASEAN is different. Compared to Europe, it is outward- rather than
inward-looking, more market than government driven, and institution light rather than heavy.
These differences reflect the very different motivations, ambitions and objectives of the two
regional programs.

16
ASEAN’s success lies in its almost unique achievement of being able to use regionalism to
promote globalisation. Therefore, the metrics used to assess regionalism should reflect these
broader objectives – even if they operate indirectly.
In the economic sphere, widely used indicators such as changes in the share of intra-regional
trade and investment not only fail to capture the real story but may point in the wrong direction.
Instead of focusing on the failure to strengthen regional economic ties, attention should be paid
to the strengthening of extra-regional links, since the two are not independent. The lack of
regional economic integration is reflected in an increase in globalisation, because of the
multilateralisation of regional accords. The fact that the regional program may have been
implemented in a manner that minimises trade and investment diversion is another sign of
success. The lesson from the ASEAN experience is that it is overall trade and investment, rather
than where it originates from, that should matter. Therefore, measures of total trade and
investment – that include intra and extra regional flows – should be used in place of a subset
that captures only intra-regional flows in assessing performance of the regional initiative.
When the metrics used in the assessment accurately reflect the broader objectives being
pursued, then what appears as failure can turn into success. This is the case for ASEAN where
traditional indicators of regionalism would deem it a failure. The fact that it is not a failure is
confirmed by empirical analyses that compare welfare impacts of different approaches to
implementing ASEAN’s program of liberalisation. The welfare gains from multilateralisation
of preferences are greater than from pure preferential liberalisation when actual (low)
utilisation rates are considered. In the end, it is welfare results that matter in ranking outcomes
and non-discriminatory approaches such as multilateralisation come out unambiguously ahead.
While the multilateralisation approach has worked well with reducing tariffs, the benefits have
been offset by a concomitant rise in NTBs. Whether or not the NTBs have risen to replace the
protection lost from lower tariffs remains unclear. Whatever the reason, the rise in NTBs poses
a serious challenge for ASEAN’s liberalisation effort because NTBs are more difficult to
identify, track and dismantle. Nevertheless, this does not imply the need for a change in
approach. Unlike tariffs, it is either difficult or costly to exchange concessions in NTBs in a
preferential manner, given the public goods nature of a lot of these types of reforms and the
consequent ease of free riding. Therefore, whether it is tariffs or NTBs, the multilateralisation
approach remains the best way forward.

17
References
ADB. 2013. Multilateralising Asian Regionalism: Approaches to Unraveling the Asian Noodle
Bowl. Theme Chapter. Asian Economic Integration Monitor. Manila: ADB. Available
at https://aric.adb.org/pdf/aeim/AEIM_2013March_SpecialChapter.pdf
Ando, M. 2009. Impacts of FTAs in East Asia: CGE Simulation Analysis. RIETI Discussion
Paper Series 09-E-037. Tokyo: RIETI.
ASEAN. 2017. Joint Media Statement, The 49th ASEAN Economic Ministers’ (AEM)
Meeting. Available at http://asean.org/storage/2017/09/49th-AEM-JMS_FINAL11.pdf
ASEAN. 2016. Joint Media Statement, The 48th ASEAN Economic Ministers’ (AEM)
Meeting. Available at http://asean.org/storage/2016/08/00-AEM-48-JMS-FINAL.pdf
ASEAN. 2015. A Blueprint for Growth ASEAN Economic Community 2015: Progress and
Key Achievements Jakarta: ASEAN Secretariat. Available at:
http://www.asean.org/wp-content/uploads/images/2015/November/media-summary-
ABIS/AEC%202015%20Progress%20and%20Key%20Achievements_04.11.2015.pdf
Augier, P., M. Gasiorek and Charles Lai Tong. 2005. The Impact of Rules of Origin on Trade
Flows, Economic Policy 43, July.
Capanelli, G., J-W Lee and P. Petri. 2009. Developing Indicators For Regional Economic
Integration And Cooperation, UNU-CRIS Working Papers W-2009/22
Feridhanusetyawan, T. 2005. Preferential Trade Agreements in the Asia-Pacific Region, IMF
Working Paper 149, Washington, DC: IMF. Available at
https://www.imf.org/en/Publications/WP/Issues/2016/12/31/Preferential-Trade-
Agreements-in-the-Asia-Pacific-Region-18370
Ghemawat. P. and S.A. Altman. 2016. DHL Global Connectedness Index 2016: The State of
Globalisation in an Age of Ambiguity. Available at:
http://www.dpdhl.com/content/dam/dpdhl/logistik_populaer/zukunftsstudien/gci_201
6/DHL_GCI_2016_Full_Study.pdf.
Hayakawa, K., D. Hitarsuka, K. Shiino, and S. Sukegawa. 2009. Who Uses Free Trade
Agreements? ERIA Discussion Paper No. 2009-22. Jakarta: Economic Research
Institute for ASEAN and East Asia (ERIA). Available at http://eria.org/pdf/ERIA-DP-
2009-22.pdf
Hill, H. and J. Menon. 2012. “ASEAN Economic Integration: Driven by Markets, Bureaucrats,
of Both?”, in Mordechai E. Kreinin and Michael Plummer (eds.), Handbook of
International Commercial Policy, Oxford: Oxford University Press, pp. 357-86.

18
Hill, H. and J. Menon. 2015. “Southeast Asian Commercial Policy: Outward-looking Regional
Integration”, in I. Coxhead (ed.), Routledge Handbook of Southeast Asian Economics,
London: Routledge, pp.366-84.
Imada, P. and S. Naya (eds). 1992. AFTA: The Way Ahead. Singapore: Institute of Southeast
Asian Studies (ISEAS).
Ing, L. Y. 2016. Non-Tariff Measures in ASEAN. Jakarta: ERIA. Available at
http://www.eria.org/non-tariff-measures-in-asean.pdf
Institute of Southeast Asian Studies (ISEAS). 2010. ASEAN Businesses and ASEAN
Economic Integration. Summary of the Brainstorming Session on Achieving the AEC
2015: Challenges for ASEAN Businesses. 23 September 2010. Singapore: ISEAS.
Japan External Trade Organisation (JETRO). 2003. Current Status of AFTA and Corporate
Responses. November 2003. Tokyo: JETRO.
Manchin, M. and A. Pelkmans-Balaoing. 2007. Rules of Origin and the Web of East Asian
Free Trade Agreements. World Bank Policy Research Working Paper No. 4273. July
2007. Washington, DC: World Bank. Available at http://www-
wds.worldbank.org/servlet/WDSContentServer/WDSP/IB/2007/07/06/000016406_20
070706154708/Rendered/PDF/wps4273.pdf
McKinsey Global Institute (MGI). 2016. Digital Globalisation: The New Era of Global Flows.
March 2016. http://www.mckinsey.com/business-functions/digital-mckinsey/our-
insights/digital-globalization-the-new-era-of-global-flows
Menon, J. 2007. Building Blocks or Stumbling Blocks? The GMS and AFTA in Asia, ASEAN
Economic Bulletin 24(2), August 2007, pp. 254-66.
Menon, J. 2014. An ASEAN Economic Community by 2015?, VoxEU, 27 September.
Available at https://voxeu.org/article/asean-economic-community-2015.
Menon, J. 2014. Multilateralisation of Preferences versus Reciprocity when FTAs are
Underutilised, The World Economy, Vol. 37, pp. 1348-66.
Menon, J. 2017. Supporting the Growth and Spread of International Production Networks in
Asia: How Can Trade Policy Help? in J. Menon and T.N. Srinivasan (eds.) South Asia-
East Asia Integration. Oxford University Press.
Petri, P., M. Plummer, and F. Zhai. 2011. The Trans-Pacific Partnership and Asia–Pacific
Integration: A Quantitative Assessment. East–West Center Working Paper No.119.
Hawaii.
World Bank. 2005. Global Economic Prospects 2005: Trade, Regionalism and Development.
Washington, DC: World Bank.