Embed Size (px)
Citation preview
Strategy Note | Alpha series ASEAN December 19, 2018
IMPORTANT DISCLOSURES, INCLUDING ANY REQUIRED RESEARCH CERTIFICATIONS, ARE PROVIDED AT THE END OF THIS REPORT. IF THIS REPORT IS DISTRIBUTED IN THE UNITED STATES IT IS DISTRIBUTED BY CGS-CIMB SECURITIES (USA), INC. AND IS CONSIDERED THIRD-PARTY AFFILIATED RESEARCH.
Powered by the EFA Platform
ASEAN Strategy Near-term pain for long-term gain
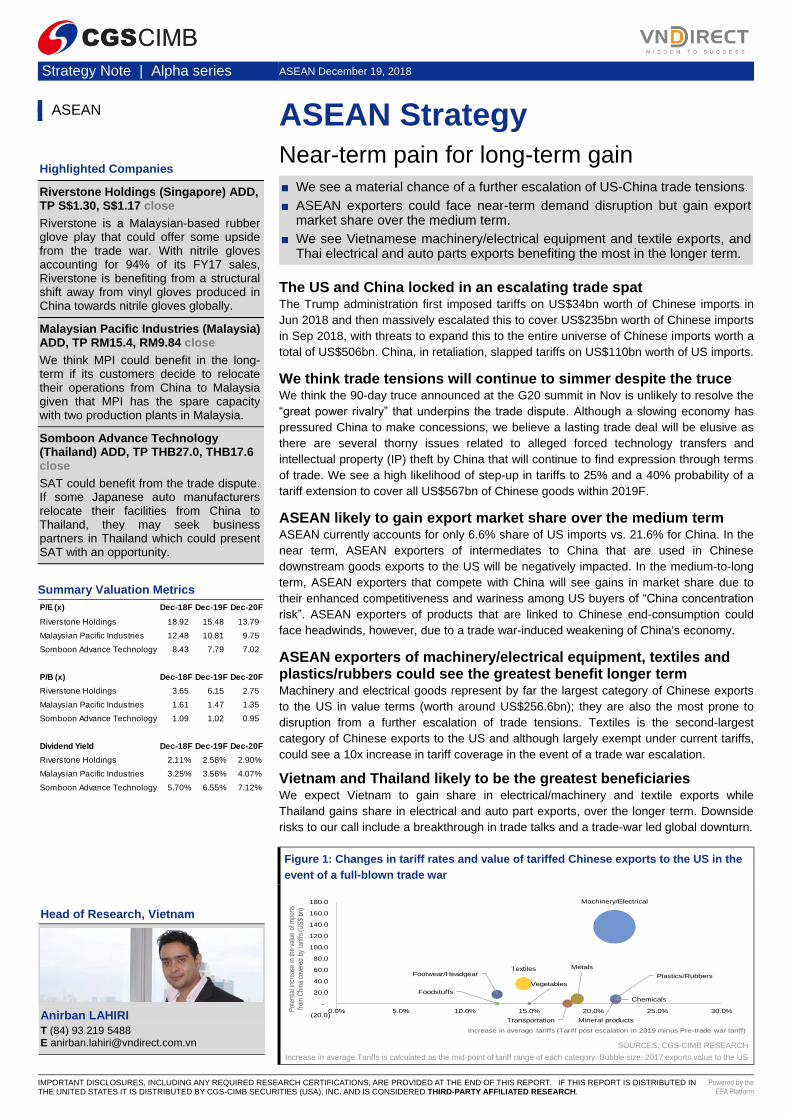
■ We see a material chance of a further escalation of US-China trade tensions.
■ ASEAN exporters could face near-term demand disruption but gain export market share over the medium term.
■ We see Vietnamese machinery/electrical equipment and textile exports, and Thai electrical and auto parts exports benefiting the most in the longer term.
The US and China locked in an escalating trade spat The Trump administration first imposed tariffs on US$34bn worth of Chinese imports in
Jun 2018 and then massively escalated this to cover US$235bn worth of Chinese imports
in Sep 2018, with threats to expand this to the entire universe of Chinese imports worth a
total of US$506bn. China, in retaliation, slapped tariffs on US$110bn worth of US imports.
We think trade tensions will continue to simmer despite the truce We think the 90-day truce announced at the G20 summit in Nov is unlikely to resolve the
“great power rivalry” that underpins the trade dispute. Although a slowing economy has
pressured China to make concessions, we believe a lasting trade deal will be elusive as
there are several thorny issues related to alleged forced technology transfers and
intellectual property (IP) theft by China that will continue to find expression through terms
of trade. We see a high likelihood of step-up in tariffs to 25% and a 40% probability of a
tariff extension to cover all US$567bn of Chinese goods within 2019F.
ASEAN likely to gain export market share over the medium term ASEAN currently accounts for only 6.6% share of US imports vs. 21.6% for China. In the
near term, ASEAN exporters of intermediates to China that are used in Chinese
downstream goods exports to the US will be negatively impacted. In the medium-to-long
term, ASEAN exporters that compete with China will see gains in market share due to
their enhanced competitiveness and wariness among US buyers of “China concentration
risk”. ASEAN exporters of products that are linked to Chinese end-consumption could
face headwinds, however, due to a trade war-induced weakening of China's economy.
ASEAN exporters of machinery/electrical equipment, textiles and plastics/rubbers could see the greatest benefit longer term Machinery and electrical goods represent by far the largest category of Chinese exports
to the US in value terms (worth around US$256.6bn); they are also the most prone to
disruption from a further escalation of trade tensions. Textiles is the second-largest
category of Chinese exports to the US and although largely exempt under current tariffs,
could see a 10x increase in tariff coverage in the event of a trade war escalation.
Vietnam and Thailand likely to be the greatest beneficiaries We expect Vietnam to gain share in electrical/machinery and textile exports while
Thailand gains share in electrical and auto part exports, over the longer term. Downside
risks to our call include a breakthrough in trade talks and a trade-war led global downturn.
Figure 1: Changes in tariff rates and value of tariffed Chinese exports to the US in the
event of a full-blown trade war
SOURCES: CGS-CIMB RESEARCH
Increase in average Tariffs is calculated as the mid-point of tariff range of each category. Bubble size: 2017 exports value to the US
Title:
Source:
Please fill in the values above to have them entered in your report
Machinery/Electrical
Mineral products
Chemicals
Textiles
Plastics/Rubbers
Foodstuffs
Footwear/Headgear
Transportation
Vegetables
Metals
(20.0)
-
20.0
40.0
60.0
80.0
100.0
120.0
140.0
160.0
180.0
0.0% 5.0% 10.0% 15.0% 20.0% 25.0% 30.0%Pot
entia
l inc
reas
e in
the
valu
e of
mpo
rts
from
Chi
na c
over
ed b
y ta
riffs
(US
$ bn
)
Increase in average tariffs (Tariff post escalation in 2019 minus Pre-trade war tariff)
ASEAN
Highlighted Companies
Riverstone Holdings (Singapore) ADD, TP S$1.30, S$1.17 close
Riverstone is a Malaysian-based rubber glove play that could offer some upside from the trade war. With nitrile gloves accounting for 94% of its FY17 sales, Riverstone is benefiting from a structural shift away from vinyl gloves produced in China towards nitrile gloves globally.
Malaysian Pacific Industries (Malaysia) ADD, TP RM15.4, RM9.84 close
We think MPI could benefit in the long-term if its customers decide to relocate their operations from China to Malaysia given that MPI has the spare capacity with two production plants in Malaysia.
Somboon Advance Technology (Thailand) ADD, TP THB27.0, THB17.6 close
SAT could benefit from the trade dispute. If some Japanese auto manufacturers relocate their facilities from China to Thailand, they may seek business partners in Thailand which could present SAT with an opportunity.
Summary Valuation Metrics
Head of Research, Vietnam
Anirban LAHIRI
T (84) 93 219 5488 E [email protected]
P/E (x) Dec-18F Dec-19F Dec-20F
Riverstone Holdings 18.92 15.48 13.79
Malaysian Pacific Industries 12.48 10.81 9.75
Somboon Advance Technology 8.43 7.79 7.02
P/B (x) Dec-18F Dec-19F Dec-20F
Riverstone Holdings 3.65 6.15 2.75
Malaysian Pacific Industries 1.61 1.47 1.35
Somboon Advance Technology 1.09 1.02 0.95
Dividend Yield Dec-18F Dec-19F Dec-20F
Riverstone Holdings 2.11% 2.58% 2.90%
Malaysian Pacific Industries 3.25% 3.56% 4.07%
Somboon Advance Technology 5.70% 6.55% 7.12%

ASEAN
Strategy Note - Alpha series │ December 19, 2018
2
KEY CHARTS
A trade war escalation will bring a wide range of consumer goods into the US tariff regime So far, US tariffs on China have primarily targeted capital goods
and intermediates in the electronic goods and machinery sector to
minimise pain to US consumers. Finished consumer goods
covered by the current tariff regime comprise only around a fifth of
the total universe of Chinese exports to the US subjected to the
tariffs, in value terms. But this will change dramatically if the trade
war escalates.
ASEAN already competes directly with China in several categories of exports to the US Thai and Malaysian exports to the US are primarily concentrated
in machinery and electrical products where China is a big player.
Vietnam has a broad-based export mix with sizable contributions
from both the machinery / electrical and textiles sectors which are
the two largest categories of Chinese exports to the US.
China still dominates over ASEAN in most categories of exports to the US In the machinery / electrical, textiles, footwear / headgear and
plastics / rubbers sectors, China has a large enough share of
global exports to the US to allow for trade war-induced market
share erosion to competing export nations. Meanwhile, ASEAN’s
market share relative to China’s market share is large enough for
it to overcome China’s scale advantage and network/cluster
effects.
ASEAN exporters to China are prone to near-term demand disruption ASEAN has significant indirect exposure to Chinese exports to
the US as it is a sizable exporter of raw materials and
intermediates to China. Malaysia and Vietnam are the two largest
ASEAN exporters to China, but Indonesia and Malaysia have the
highest share of intermediates in their total exports to China.
SOURCES: CGS-CIMB RESEARCH
Page 2 key charts to be inserted into in your report
No chart title and source statement are needed
Capital goods37.3%
Capital goods28.8%
Intermediate goods30.6%
Intermediate goods50.6%
Consumer goods30.8%
Consumer goods19.1%
Transport equipment0.3%
Transport equipment0.8%
Others0.9%
Others0.8%
Product composition shifts in US tariffs on Chinese imports in the event of a full blow trade w ar
Current $250bn list
A full blow n trade war list
Page 2 key charts to be inserted into in your report
No chart title and source statement are needed
0%
20%
40%
60%
80%
100%
Vietnam Malaysia Thailand Indonesia Singapore China
Exports to the US by category (2017)
Machinery/Electrical Mineral products Chemicals & Allied industries
Textiles Plastics/Rubbers Foodstuffs
Footwear/Headgear Transportation Vegetable products
Metals Other
Page 2 key charts to be inserted into in your report
No chart title and source statement are needed
25.1%
16.5%11.1% 9.9%
9.7%
7.3% 3.8% 3.2%1.1% 0.6%
58.3%
35.5%25.1%
3.0%
37.0%
4.8%
7.7%
19.8%
0.6%4.9%
-
0.2
0.4
0.6
0.8
1.0
0.0%
10.0%
20.0%
30.0%
40.0%
50.0%
60.0%
70.0%
Footw
ear/
Hea
dge
ar
Textile
s
Pla
stics/R
ubb
ers
Veg
eta
ble
pro
ducts
Mach
ine
ry/E
lectr
ical
Food
stu
ffs
Ch
em
ica
ls &
Alli
ed ind
ustr
ies
Meta
ls
Min
era
l p
rodu
cts
Tra
nsp
ort
ation
Market share of ASEAN vs. China in exports to the US
ASEAN's market share China's market share ASEAN market share relative to China (RHS)
3.5
1.5
0.6
0.4
0.2
Page 2 key charts to be inserted into in your report
No chart title and source statement are needed85.4% 85.5%
70.9% 69.5%
57.7%
Indonesia Malaysia Singapore Thailand Vietnam
Intermediates exports to China from each ASEAN country (% of total exports to China, 2017)

ASEAN
Strategy Note - Alpha series │December 19, 2018
3
The US-China trade war will impact ASEAN exporters in multiple ways
Trade war background and high level implications for ASEAN exporters
The US and China are locked in an escalating trade spat since Jun 2018
The Trump administration first imposed tariffs on US$34bn worth of Chinese
imports in Jun 2018. It extended tariffs to another US$16bn of imports in Aug
2018 and then massively escalated this to cover US$235bn worth of Chinese
imports in Sep 2018, with threats to expand this to the entire universe of
Chinese imports worth a total of US$506bn in early 2019. China, in retaliation,
slapped import tariffs on US$110bn worth of US imports into China. Even though
the two countries announced a 90-day "truce" at the G20 summit in Argentina in
late-Nov under which the scheduled automatic increase in tariff rates starting in
Jan 2019 would be put on pause, we believe trade tensions will continue to
simmer as there are several thorny issues related to US allegations of forced
technology transfers and intellectual property (IP) theft by China that will
continue to find expression through terms of trade. The recent arrest of the
Huawei CFO in Canada is a case-in-point.
In this report, we primarily focus on the impact US tariffs on Chinese imports will
have on ASEAN exporters as we believe they present both greater opportunities
as well as threats to ASEAN exporters, than Chinese tariffs on US imports would.
US tariffs on China have so far primarily targeted intermediates in the electronic goods and machinery sector
As shown in the chart below, the electrical and machinery category has
accounted for the lion’s share of Chinese goods exports to the US in recent
years. This is not surprising when you consider that China has been rapidly
moving up the export manufacturing value chain in recent years to reduce its
dependence on labour cost arbitrage to drive export growth and also due to a
sustained rise in wages as the labour market becomes tighter and policymakers
reorient economic activity towards domestic consumption. These trends have
led to an increasing shift away from low-end exports such as textiles into higher-
end products such as electronics as well as an upstream migration within the
electronics and machinery value chain into component manufacturing which is
less labour-intensive than downstream assembly activity. The electronics and
machinery category’s share of total exports accounted for slightly over half of
China’s total goods exports into the US in 2017.
Furthermore, if the Trump administration’s tariffs are primarily aimed at re-
shoring manufacturing jobs to the US, it is also logical that the higher-end
imports from China into the US would be the target of these efforts as bringing
back lower-end manufacturing jobs into the US is neither a feasible nor desirable
policy objective.

ASEAN
Strategy Note - Alpha series │December 19, 2018
4
Figure 2: Chinese exports to US by product category in 2017 and 9M 2018
SOURCES: CGS-CIMB RESEARCH, USITC
NOTE: Miscellaneous include clocks, optical/medical instruments, musical instruments, toys, furniture, arms, etc.
Figure 3: Sectors covered by US$250bn tariff list - Current and potential tariff rates
SOURCES: CGS-CIMB RESEARCH, USTR, PIIE
NOTE: (*): Tariff increased was originally scheduled for Jan 2019 but has been put on pause until Mar 2019”
We see a 40% chance of an escalation in the US tariff regime to cover all US$567bn of Chinese imports starting in 2019F
We view the US-China trade war as just one act in a protracted “great power
rivalry” wherein the incumbent super power is increasingly paranoid about being
dethroned by the emerging superpower. This is borne out in recent allegations
by the Trump administration of Chinese attempts to spy on the US as well as
attempts to meddle in US mid-term elections and, more recently, by US Vice
President Mike Pence’s attacks on China’s political regime and branding of One
Belt One Road strategy as “debt trap diplomacy”. Growing US government
scrutiny of sales of high-technology products to China also reflects growing US
concerns around Xi Jinping’s “Made in China 2025” programme aimed at making
China a world leader in high-tech exports. Even though China has reduced
tariffs on US car imports to 15% from 40% and agreed to recommence
Unit: US$ bn 2017 9M2017 9M2018
Machinery/Electrical 256.6 180.7 196.6
Miscellaneous 80.4 57.9 61.7
Textiles 39.0 29.3 29.9
Metals 25.4 19.1 20.7
Plastics/Rubbers 19.8 14.7 17.1
Footwear/Headgear 18.0 13.9 13.7
Chemicals & Allied industries 15.1 11.2 13.6
Transportation 15.8 11.7 13.5
Stone/Glass 10.1 7.4 8.2
Wood & wood products 9.7 7.2 7.6
Raw hides, skins, leather & furs 7.4 5.7 5.5
Foodstuffs 3.0 2.2 2.4
Animal & Animal products 2.5 1.8 1.9
Vegetable products 1.6 1.2 1.2
Mineral products 1.1 0.8 1.0
Total 505.5 364.7 394.7
Categories HS code Key products Current
tariff
Potential tariffs post
step-up in 2019*
Note
Chemicals & Allied industries 28-38 - All kinds of chemical products
- Includes cosmetics and cleaning agents
(such as soap)
0-25% 25% Lubricating preparations - not for the
treatment of textile, Lubricating oil
additives (tariff: 25%)
Foodstuffs 16-24 - Prepared meat, aquatic products,
vegetables, fruit
- Sugars and confectionary
- Beverages and alcohol
- Soy sauce and seasonings
- Excludes cocoa and preparations
0-35% 25%-35%
Footwear/Headgear 64-67 - Mainly headgear, shoes and umbrellas 0-48% 25-48%
Machinery/Electrical 84-85 - In additional to various capital goods, also
includes TVs & parts
0-25% 25%
Metals 72-83 - Steel/alloy, copper, nickel, aluminum, ect. 0-25% 25% Structures of iron or steel (tariff: 25%)
Mineral products 25-27 - All kinds of mineral products 0-25% 25% Petroleum oils - not light oils and
preparations (tariff: 25%)
Plastics/Rubbers 39-40 - Includes decoration materials
- Includes consumer goods such as plastic
bags, gloves, tires
0-25% 25% Most of plastic products: 25%, rubber
products: 10%
Textiles 50-63 - Mainly cover various cloths 0-20.9% 25%
Transportation 86-89 - Mainly car parts 0-25% 25% Railway, tramway locomotives (tariff: 25%)
Vegetable products 6-15 - All kinds of vegetables, fruits, nuts,
cereals, fish oils
0-20% 25%

ASEAN
Strategy Note - Alpha series │December 19, 2018
5
purchases of US soybean, we see a threat of re-escalation in the future as there
are limits to how much ground China can cede.
A trade war escalation will bring a wide range of finished consumer goods from China into the US tariff regime
As mentioned earlier and illustrated by the chart below, the current tariff regime
is targeted more at capital goods and intermediates rather than finished
consumer goods imports from China into the US. Finished consumer goods
covered by the current tariff regime comprise only around a fifth of the total
universe of Chinese exports to the US subjected to the tariffs, in value terms.
This appears to be a deliberate strategy by the Trump administration to soften
the immediate impact of the trade war on US consumers and avoid a demand
shock due to a sudden increase in prices of consumer goods. However, for the
US to really up the ante on China, we believe it is necessary that the tariffs are
extended to include finished consumer goods imports from China even at the
risk of stoking consumer price inflation in the US as finished consumer goods
are an instrumental pillar of China-US bilateral trade, accounting for an
estimated 30.8% of Chinese goods exports to the US in 2017.
Figure 4: US imports from China subjected to $250bn list Figure 5: US imports from China in 2017
SOURCES: CGS-CIMB RESEARCH, PIIE SOURCES: CGS-CIMB RESEARCH, PIIE
If the Trump administration goes ahead and delivers on its threat to extend the
tariff regime to cover the entire universe of Chinese goods imports into the US,
this will cover a broad swath of finished consumer goods such as mobile phones,
laptop computers as well as finished apparel, all of which have so far been
spared from trade war related tariffs.
Title:
Source:
Please fill in the values above to have them entered in your report
Capital goods28.8%
Intermediate goods
50.6%
Consumer goods19.1%
Transport equipment
0.8%
Others0.8%
Title:
Source:
Please fill in the values above to have them entered in your report
Capital goods37.3%
Intermediate goods
30.6%
Consumer goods30.8%
Transport equipment
0.3%
Others0.9%

ASEAN
Strategy Note - Alpha series │December 19, 2018
6
Figure 6: Value of Chinese imports covered by US tariffs: Current and post-escalation
SOURCES: CGS-CIMB RESEARCH, USTR, PIIE
NOTE: Data is based on US imports from China in 2017 | Miscellaneous include clocks, optical/medical instruments, musical instruments, toys, furniture, arms, etc.
The machinery/electrical and textiles sectors present the
greatest opportunity for ASEAN exporters to benefit from the
trade war
As shown in the chart below, machinery and electrical goods represent, by far,
the largest category of Chinese exports to the US in value terms (worth a total of
around US$256.6bn). They are also the most prone to disruption from a further
escalation of trade tensions. In terms of value exposure to the existing tariff
regime, this sector is also by far the largest; a total of US$120.2bn of machinery
and electrical goods are already subjected to tariffs, comprising around 47% of
the total value of Chinese exports to the US that are already subjected to tariffs.
If the US goes ahead and extends the tariff regime to cover all US$506bn of
Chinese imports into the US, this will expose an additional US$136bn worth of
Chinese machinery and electrical goods exports to tariffs; this incremental value
exposure is higher than the incremental value exposure in any other category of
Chinese exports to the US. Even if the US does not extend the tariff regime to
cover all US$506bn of Chinese imports to the US, we expect the machinery and
electrical goods export sector to see significant disruption just from the tariff
increases on the existing universe of tariffed goods: if the step-up in tariffs goes
ahead after the expiry of the 90-day “truce” in 2019, the average tariff (non-
weighted) levied on Chinese machinery and electrical goods imports into the US
would have seen a 21.7% point increase from pre-trade war levels. This pre-
trade war-to-post step-up increase in tariffs is matched only by the tariff
increases in the chemicals and plastics/rubber categories which are much
smaller in value terms than the machinery and electrical goods category.
Textiles comprise the second-largest category of Chinese exports to the US
(worth a total of around US$39bn in 2017) and are largely exempt from trade
war-related tariffs thus far, with just under 9% of the textile export universe from
China to the US currently subjected to tariffs. In the event of an escalation of the
trade war to cover all US$506bn of Chinese exports to the US, the total value of
tariffed Chinese textile exports to the US could increase over 10x from current
levels, equivalent to an incremental export value exposure of over US$35bn.
Other sectors that present great opportunities for exporters to the US to grab
market share from China include transportation (largely automotive), metals and
plastics/rubbers. The transportation sector looks attractive as it is sizable and
already almost completely covered under the existing tariff regime. The metals
and plastics/rubbers sectors are interesting because they are sizable in value
Unit: US$ bn Current status Full-blown trade war
Machinery/Electrical 120.2 256.6
Miscellaneous 35.3 80.4
Textiles 3.4 39.0
Metals 16.4 25.4
Plastics/Rubbers 10.9 19.8
Footwear/Headgear 1.3 18.0
Transportation 14.6 15.1
Chemicals & Allied industries 7.7 15.8
Stone/Glass 5.0 10.1
Wood & wood products 6.4 9.7
Raw hides, skins, leather & furs 7.4 7.4
Foodstuffs 2.6 3.0
Animal & Animal products 1.8 2.5
Vegetable products 0.9 1.6
Mineral products 0.5 1.1
Total 234.5 505.5
ASEAN
Strategy Note - Alpha series │December 19, 2018
7
terms, meaningfully covered already under existing tariffs, and expected to see a
sharp increase in tariff rates once the 90-day “truce” ends in 2019 (unless a new
trade deal is negotiated by then) from pre trade-war levels, and could also see a
meaningful increase in tariff exposure in value terms should the US extend tariffs
to cover the entire universe of imports from China.
Figure 7: Changes in tariff rates and value of tariffed Chinese exports to the US in the event of a full-blown trade war
SOURCES: CGS-CIMB RESEARCH, USTR
NOTE: Increase in average Tariffs is calculated as the mid-point of tariff range of each category. Bubble size: 2017 exports value to the US
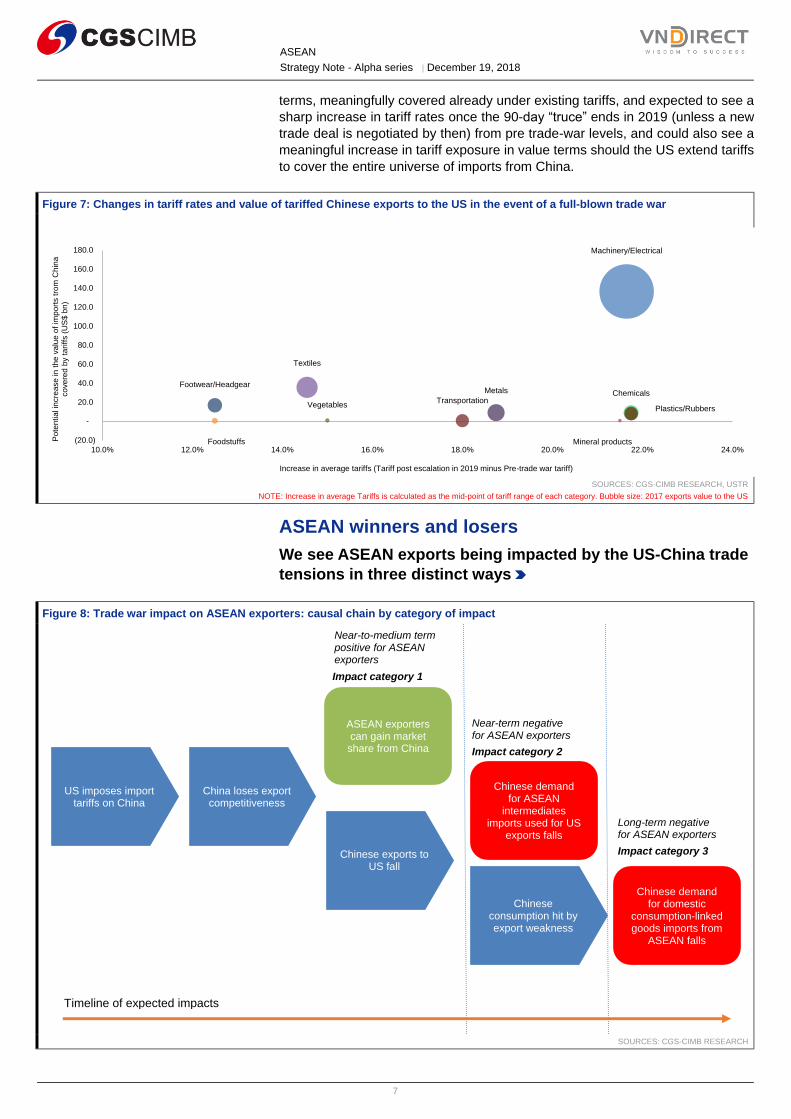
ASEAN winners and losers
We see ASEAN exports being impacted by the US-China trade
tensions in three distinct ways
Figure 8: Trade war impact on ASEAN exporters: causal chain by category of impact
SOURCES: CGS-CIMB RESEARCH
Machinery/Electrical
Mineral products
Chemicals
Textiles
Plastics/Rubbers
Foodstuffs
Footwear/Headgear
Transportation Vegetables
Metals
(20.0)
-
20.0
40.0
60.0
80.0
100.0
120.0
140.0
160.0
180.0
10.0% 12.0% 14.0% 16.0% 18.0% 20.0% 22.0% 24.0%
Po
ten
tia
l in
cre
ase
in t
he
va
lue
of
imp
ort
s tro
m C
hin
a
co
ve
red
by t
ariff
s (
US
$ b
n)
Increase in average tariffs (Tariff post escalation in 2019 minus Pre-trade war tariff)
US imposes import tariffs on China
China loses export competitiveness
ASEAN exporters can gain market
share from China
Chinese exports to US fall
Chinese demand for ASEAN
intermediates imports used for US
exports falls
Chinese consumption hit by export weakness
Chinese demand for domestic
consumption-linked goods imports from
ASEAN falls
Impact category 1
Impact category 2
Impact category 3
Long-term negative for ASEAN exporters
Near-term negative for ASEAN exporters
Near-to-medium term positive for ASEAN exporters
Timeline of expected impacts

ASEAN
Strategy Note - Alpha series │December 19, 2018
8
Impact category #1. ASEAN exporters to the US could win market share
from Chinese exporters due to enhanced competitiveness.
Rather fortunately for ASEAN countries, many of the key categories of Chinese
exports to the US that are prone to the greatest disruption from the trade war (as
identified above) also happen to be export categories in which ASEAN countries
collectively have unique strengths and emerging export clusters. These include
the machinery and electrical equipment, textiles, footwear/headgear,
plastics/rubbers, metals, and to a lesser extent, the automotive (transportation)
sectors as evinced in a) the sizable share contributed by each of these
categories to total exports to the US for each of the ASEAN countries, and b) the
size of the production base within each of these categories across ASEAN.
To arrive at our shortlist of “high potential” sectors in this impact category, we
also look at the absolute value of China’s exports in that sector, and the market
share of ASEAN exports to the US in each category relative to China’s market
share as well as China’s absolute market share in each of these categories.
We like categories which are large in terms of export value and those in
which China has sizable global market share but in which ASEAN’s market
share relative to China’s market share is not tiny. This is because in sectors
in which China dominates, there is more room for market share erosion to
ASEAN due to a high market share base and a growing realisation among US
buyers of overreliance on sourcing from China. However, since export
manufacturing dominance also creates network efforts and cluster benefits,
sectors in which China has much higher market share relative to ASEAN are
also sectors in which ASEAN will find it more difficult to dislodge China from its
leadership position. This is particularly true in the area of electrical and
machinery manufacturing which has complex supply chains and relies heavily on
established component supplier ecosystems. Finally, we also give credit to those
categories or sectors in which ASEAN has a significant domestic-facing
manufacturing base even if it does not have a meaningful share of exports since
it is conceivable that an export orientation can be developed among domestic-
oriented manufacturers in recognition of the export opportunity created by the
trade war.
Based on the above criteria, we identify machinery and electrical equipment,
textiles, footwear/headgear and plastics/rubbers as the sectors that
present the greatest opportunities for ASEAN to benefit from the US-China
trade war for the following reasons:
1) China’s exports to the US in each of these categories is substantial in value
terms, making them sizable opportunities for ASEAN;
2) In each of these categories, China has large enough market share positions
to allow ASEAN competitors to “nibble at the periphery” and yet does not tower
over ASEAN to an extent that would make it difficult for ASEAN countries to
compete with China due to the aforementioned network effects.
3) In each of these categories, ASEAN, collectively, has a sizable domestic-
facing manufacturing base even if its export market share is not significant,
thereby allowing the region to leverage its domestic manufacturing base to grab
export opportunities created by the decline in China’s competitiveness.
We include the automotive (transportation) sector on our shortlist even
though it does not strictly meet these selection criteria because a) Thailand has
a strong automotive manufacturing base, b) automotive products are already
extensively covered by the existing tariff regime, meaning that benefits to
ASEAN from the trade war in this category are not contingent upon a further
escalation of the trade war. We discuss each of these sectors in greater detail
below:

ASEAN
Strategy Note - Alpha series │December 19, 2018
9
Figure 9: Total exports to the US from each ASEAN country
(US$ bn)
Figure 10: ASEAN exports to the US by category (2017)
SOURCES: CGS-CIMB RESEARCH, USTR SOURCES: CGS-CIMB RESEARCH, USTR
Figure 11: Market share of ASEAN vs. China in exports to the US
SOURCES: CGS-CIMB RESEARCH, USITC
Figure 12: Summary of how we arrived at our shortlist of “high potential” sectors for ASEAN to benefit from the trade war
Machinery/
Electrical
Plastics/ Rubbers Textiles/
Footwear&
Headgear
Transportation
(Automotive)
How big Is the addressable market for ASEAN exporters
(China’s current exports to US)?
How does ASEAN currently stack-up versus China in
exporting to the US?
Is ASEAN’s relative market share of exports to the US small
enough to allow for market share gains from China (<0.5)? Yes Yes Yes Yes
How sizable is ASEAN’s existing manufacturing base in the
sector (for domestic + exports)?
How contained is the competitive threat from other regions
ex-ASEAN in gaining export market share from China?
Overall attractiveness rating
SOURCES: CGS-CIMB RESEARCH
NOTE: = “Very favourable”; = “Unfavourable”
Title:
Source:
Please fill in the values above to have them entered in your report
46
37
31
20 19
-
5
10
15
20
25
30
35
40
45
50
Vietnam Malaysia Thailand Indonesia Singapore
Title:
Source:
Please fill in the values above to have them entered in your report
0%
10%
20%
30%
40%
50%
60%
70%
80%
90%
100%
Vietnam Malaysia Thailand Indonesia Singapore
Machinery/Electrical Mineral products Chemicals & Allied industries
Textiles Plastics/Rubbers Foodstuffs
Footwear/Headgear Transportation Vegetable products
Metals Other
Title:
Source:
Please fill in the values above to have them entered in your report
25.1%
16.5%11.1% 9.9%
9.7%7.3% 3.8% 3.2%
1.1%0.6%
58.3%
35.5%
25.1%
3.0%
37.0%
4.8%
7.7%
19.8%
0.6%
4.9%
-
0.2
0.4
0.6
0.8
1.0
0.0%
10.0%
20.0%
30.0%
40.0%
50.0%
60.0%
70.0%
Foo
twear/H
eadgear
Tex
tiles
Pla
stic
s/R
ubbers
Vegeta
ble
pro
ducts
Mach
inery
/Ele
ctrica
l
Foo
dstu
ffs
Chem
icals
& A
llied
industrie
s Meta
ls
Min
era
l pro
ducts
Tra
nsp
ort
atio
n
ASEAN's market share China's market share ASEAN market share relative to China (RHS)
3.5
1.5

ASEAN
Strategy Note - Alpha series │December 19, 2018
10
Machinery and Electrical
In the area of machinery and electrical equipment exports, Vietnam, Malaysia,
Thailand and Singapore each already have a track record and an established or
fast-emerging manufacturing base. While Singapore plays in high-tech
categories and precision components which are not the current focus of Chinese
exporters, Thailand, Malaysia and Vietnam are competitors to China in electrical
and machinery exports to the US. Of these three countries, Malaysia perhaps
has the greatest exposure to upstream value chain products such as
semiconductor devices and photovoltaic cells and, hence, is a potential
beneficiary even under the current tariff regime which targets electrical and
machinery intermediates rather than finished goods.
Thailand plays primarily in downstream value chain segments of the machinery
and electrical manufacturing industry with activity being centered more on
production of finished consumer electrical appliances. In fact, Thailand has
ASEAN’s largest production base in the electrical appliances sector and the
country is the world’s second-largest producer of air conditioning units and
fourth-largest producer of refrigerators (source: website of the Royal Thai
Embassy in Mexico). The country exported US$2.4bn worth of air conditioning
products and US$1.8bn worth of refrigeration products in 2017 (Source: Bank of
Thailand) and remains a regional leader in these categories of consumer
appliances even though it has ceded some market share to Vietnam in the
television and microwave oven product categories in recent years.
Since global exports of electrical appliances are dominated by China, Thailand
could be a big beneficiary of a potential future escalation of the trade war which
will bring finished consumer electrical appliances under the tariff umbrella.
Vietnam probably has the least developed electrical and machinery export
manufacturing base among the above three countries but is rapidly emerging as
an electrical export manufacturing powerhouse thanks in large part to massive
anchor investments by global OEMs such as Samsung, LG and Intel.
It is also important to note that although the current tariff regime mostly covers
electrical and machinery intermediates, sheer anticipation of future trade war
escalation to cover Chinese finished electrical goods exports to the US could
already be catalysing some shift in export orders and manufacturing capacity out
of China and into both Vietnam and Thailand. Hence, an escalation of the trade
war is not a necessary precondition for both countries to grab electrical and
machinery export market share from China, in our view.
Textiles, footwear/headgear
We lump these two sectors together as they are allied and countries with a
strong textile export industry also tend to be strong in footwear/headgear exports.
As shown in Figure 13, Vietnam and Indonesia have a sizable market share of
exports to the US in both the textiles and footwear/headgear sectors. Given the
labor-intensive nature of textile and footwear manufacturing, it is no surprise that
the US export market share of ASEAN countries in these sectors is inversely
correlated with labour costs – Vietnam is the biggest player in both categories
followed by Indonesia. Thailand, Malaysia and Singapore, which have
significantly higher labour costs than other ASEAN countries, have no
meaningful presence in these sectors.

ASEAN
Strategy Note - Alpha series │December 19, 2018
11
Figure 13: Market share of each ASEAN country vs. China in US imports
SOURCES: CGS-CIMB RESEARCH, USITC
NOTE: Pink shading denotes the ASEAN market share leader in each category; orange shading denotes second largest ASEAN player in each category
Figure 14: Current factory labour cost of each ASEAN country Figure 15: Labour cost vs. market share of textile and
footwear/headgear exports to the US by ASEAN country
SOURCES: CGS-CIMB RESEARCH, SHENGLU, ASIABRIEFING SOURCES: CGS-CIMB RESEARCH, SHENGLU, USITC
This sector is particularly potent for ASEAN to benefit from the trade war for
three reasons:
1) A structural shift in textile, garment and footwear export manufacturing
away from China to other low-wage countries has been underway as
labour costs in China have been rising rapidly and the government there
looks to reorient its manufacturing industry towards higher value-added
and hi-tech sectors. The trade war will only accelerate this trend and
ASEAN can benefit from the existing momentum created by the
structural shift;
2) The textile and apparel sector has lower entry barriers and less supply
chain complexity as compared with other sectors such as machinery
and electronics, making it much easier to move facilities out of China;
3) ASEAN saw heavy investment along the entire textile value chain in the
years leading up to the anticipated ratification of the Trans Pacific
Partnership (TPP) in 2017 which was meant to include the US but
exclude China. Vietnam, in particular, saw heavy investment in
midstream and upstream segments of the textile and apparel value
chain due to the yarn forward rules of origin stipulated by the TPP. Even
though TPP was abandoned in 2017, the investment leading up to it has
created a solid ecosystem within ASEAN to allow it to gain market share
from China. The ratification of CPTTP could further reinforce this trend.
Vietnam Malaysia Thailand Indonesia Singapore China
Footwear/Headgear 18.7% 0.0% 0.4% 5.9% 0.0% 58.3%
Raw hides, skins, leather & furs 8.3% 0.0% 0.9% 1.7% 0.0% 53.2%
Machinery/Electrical 2.0% 4.1% 2.3% 0.3% 0.9% 37.0%
Textiles 10.8% 0.4% 1.0% 4.4% 0.0% 35.5%
Plastics/Rubbers 1.2% 2.3% 4.4% 2.8% 0.5% 25.1%
Wood & wood products 0.8% 0.5% 0.4% 1.4% 0.1% 22.2%
Metals 1.0% 0.4% 1.2% 0.5% 0.1% 19.8%
Stone/Glass 0.5% 0.2% 1.8% 0.4% 0.3% 12.6%
Animal & Animal products 3.0% 0.0% 1.6% 4.0% 0.1% 7.8%
Chemicals & Allied industries 0.1% 0.3% 0.2% 0.3% 2.8% 7.7%
Transportation 0.1% 0.1% 0.3% 0.1% 0.1% 4.9%
Foodstuffs 1.2% 0.4% 3.8% 1.8% 0.1% 4.8%
Vegetable products 4.0% 0.9% 1.2% 3.7% 0.1% 3.0%
Mineral products 0.1% 0.1% 0.0% 0.4% 0.4% 0.6%
Unit: US$ per hour Minimum wage Actual garment factory labour wage
Singapore na 6.42
Vietnam 1.31 1.55
Indonesia 1.46 1.44
Thailand 2.29 3.95
Malaysia 1.90 3.48
Title:
Source:
Please fill in the values above to have them entered in your report
Singapore
VietnamIndonesia
Thailand
Malaysia
0
1
2
3
4
5
6
7
0.0% 2.0% 4.0% 6.0% 8.0% 10.0% 12.0% 14.0%
Hourly la
bour w
age o
f garm
ent w
ork
er (U
S$)
Market share of exports to the US

ASEAN
Strategy Note - Alpha series │December 19, 2018
12
It must be noted, however, that the ASEAN countries touched upon in this report
are up against formidable competitors in the sector including established
incumbents such as Bangladesh, India, Sri Lanka and Cambodia as well as
emerging textile and footwear export hubs such as Pakistan and Myanmar.
Figure 16: Top 5 textile and apparel exporters by global market
share (2017)
Figure 17: Top 5 textile and apparel exporter to US market by
market share (9M2018)
SOURCES: CGS-CIMB RESEARCH, WTO SOURCES: CGS-CIMB RESEARCH, OFFICE OF TEXTILES AND APPAREL (OTEXA)
Plastics /rubbers
The plastics/rubbers sector is the fifth largest category of Chinese exports to the
US. Plastics exports mostly include plastic packaging, pipes, tubes and
household goods usually made of polymers like polyvinyl and polyethylene.
Rubbers exports are mostly comprised of both natural and synthetic rubber
products such as tyres, gloves and household or personal consumption items
such as mats, belts, etc.
Total plastics/rubbers exports from China to the US in 2017 amounted to around
$US20bn, equivalent to around 4% of total Chinese exports to the US in that
year. Thailand, Malaysia and Indonesia are the three ASEAN players that have
a significant share of total exports to the US in this sector. Thailand is
particularly strong in plastic and synthetic rubber product exports due to its well-
developed downstream energy and petrochemicals industries. Thailand,
Malaysia and Indonesia have particular strengths in natural rubber product
exports given their huge natural rubber plantation assets. Vietnam is a relative
newcomer in these categories but is well positioned to increase its market share
given that the country is investing heavily in petroleum refining capacity and also
has significant land area (including in Cambodia and Laos, leased to
Vietnamese rubber plantation owners) under natural rubber cultivation.
China supplies a quarter of total plastics/rubber exports to the US. This is
sizable enough to allow for some market share erosion to ASEAN, especially
given that ASEAN has certain key strengths in terms of raw material supply
(natural rubber, crude) as well as an existing manufacturing ecosystem
(petrochemical production) and, as a result, a still sizable market share relative
to China. Also, in the event of a future escalation of trade tensions or a
resumption of the tariff escalation post expiration of the “moratorium” period
recently agreed between the US and Chinese delegations at the G20 trade
summit in Argentina, this sector would see one of the steepest hikes in tariffs.
Also, if the tariff umbrella is extended to cover all Chinese imports to the US, the
total tariffed value of Chinese exports would nearly double from US$11bn today
to nearly US$20bn. While the incremental value of exports to be brought under
the tariffs regime is small relative to that of the machinery/electrical and textiles
sectors, it represents a big increase in percentage terms.
Title:
Source:
Please fill in the values above to have them entered in your report
33.4%
4.5% 4.4% 4.4% 3.9%
China India Italy Germany Vietnam
Title:
Source:
Please fill in the values above to have them entered in your report
36.0%
11.8%
7.1%
5.2%4.3%
China Vietnam India Bangladesh Indonesia

ASEAN
Strategy Note - Alpha series │December 19, 2018
13
Figure 18: Annual natural rubber production and harvested area
by ASEAN country (2016)
Figure 19: Styrene and butadiene capacity by ASEAN country
(2018, '000 tpa)
SOURCES: CGS-CIMB RESEARCH, FAO SOURCES: CGS-CIMB RESEARCH, BMI
Figure 20: Refining capacity by ASEAN country ('000 b/d) Figure 21: Capacity of select petrochemical products by ASEAN
country ('000 tpa)
SOURCES: CGS-CIMB RESEARCH, BMI SOURCES: CGS-CIMB RESEARCH, BMI
Automotive (Transportation)
The transportation category largely comprises of automotive products. While this
is only the eight biggest category of Chinese exports to the US, we believe it
deserves mention since it is not insignificant in value terms ($US16bn in 2017)
and is a sector in which Thailand has a particularly strong competitive advantage
given its status as the “Detroit of Asia”.
However, it is important to note that most of China’s automotive product exports
are comprised of auto parts rather than finished vehicles. Although we do not
have data on how much of China’s transportation product exports to the US
relate to finished vehicle exports, The Economist Intelligence Unit (EIU)
estimates that finished vehicle exports accounted for only 0.3% of China’s total
exports globally in 2017, worth around US$7.2bn. This compares with an
estimated US$31bn worth of auto parts exports globally by China in the same
year, equivalent to 1.4% of total Chinese exports in that year. The same source
estimates that China is the world’s fourth largest exporter of auto parts with 8.0%
market share in 2017, after Germany (16.1%), the US (11.6%) and Japan (8.9%),
and the US is the biggest market for Chinese auto part exports. Hence, ASEAN
Title:
Source:
Please fill in the values above to have them entered in your report
-
500,000
1,000,000
1,500,000
2,000,000
2,500,000
3,000,000
3,500,000
4,000,000
4,500,000
5,000,000
Thailand Indonesia Malaysia Vietnam
Production (tonnes) Area harvested (ha)
Title:
Source:
Please fill in the values above to have them entered in your report
0
100
200
300
400
500
600
Thailand Singapore Indonesia Malaysia
Styrene capacity Butadiene capacity
Title:
Source:
Please fill in the values above to have them entered in your report
-
200
400
600
800
1,000
1,200
1,400
1,600
Singapore Thailand Indonesia Malaysia Vietnam
Title:
Source:
Please fill in the values above to have them entered in your report
0
500
1,000
1,500
2,000
2,500
3,000
3,500
4,000
Thailand Singapore Indonesia Malaysia Vietnam
PVC capacity Polypropylene capacity PE capacity

ASEAN
Strategy Note - Alpha series │December 19, 2018
14
countries with a strong auto parts and components manufacturing ecosystem
will be positioned to benefit from this.
Figure 22: China's top auto parts export markets (2017)
SOURCES: CGS-CIMB RESEARCH, INTERNATIONAL TRADE CENTRE
Thailand has a long history of automotive production following a period of heavy
and sustained investment by Japanese auto OEMs in the nineteen eighties and
nineties. Like the machinery/electrical sector – and unlike the textiles and
footwear/headgear sectors – automotive production comes with complex supply
chain dependencies and requires an intricate ecosystem of component suppliers.
This makes it difficult to move production assets quickly but, given that Thailand
already has a strong auto parts manufacturing ecosystem in place and that over
half of its automotive production is geared towards exports (source: EIU), we
believe it is well positioned to grab market share from China on the back of the
trade war.
Although Malaysia is a small player in automotive exports, Malaysia has a
vibrant – if somewhat fragmented – auto parts manufacturing ecosystem with
over 800 auto component manufacturers (source: EIU). This could allow the
country to grab market share from China which, if it happens, could significantly
boost Malaysian automotive exports given the current low base.
Even though Vietnam’s government is trying to develop a local automotive
manufacturing sector, the auto component industry in the country remains
underdeveloped and the local market is still small, thereby limiting potential for
economies of scale in producing auto components in the country. Furthermore,
with the Asian Free Trade Agreement (AFTA) reducing import tariffs on auto
exports within the ASEAN region to zero, we believe Vietnam will find it
challenging to compete versus entrenched incumbents such as Thailand in this
industry. Finally, this sector is less reliant on labour than on capital thereby
making Vietnam’s low labour costs less of an advantage than in labour-intensive
sectors such as textiles and footwear.
It is worth noting, however, that other Asian countries such as India will also be
vying for a share of automotive exports that leave China’s shores. India has a
sizable domestic car market and its components sector has benefitted from the
presence of several large global car manufacturers. However, the country’s
automotive manufacturing has a domestic orientation which, combined with
infrastructure bottlenecks, makes it less formidable of a competitor to ASEAN.
Title:
Source:
Please fill in the values above to have them entered in your reportUS, 32.5%
Japan, 9.5%
Germany, 5.2%
Mexico, 4.7%
South Korea, 3.9%
Other, 44.2%

ASEAN
Strategy Note - Alpha series │December 19, 2018
15
Figure 23: Automotive production by ASEAN country (units, 2017)
SOURCES: CGS-CIMB RESEARCH, OICA
NOTE: Data is not available for Singapore
As a final step in vetting our shortlist of ASEAN sector beneficiaries in
impact category 1, we also look at the differential in tariffs imposed by the
US on the imports from China versus on imports from the ASEAN region in
each key export category as this is clearly an important determinant of the
competitiveness of ASEAN versus China in exporting to the US. In calculating
the tariff differential, we use the expected tariffs on Chinese imports into the US,
post a step-up in the tariff rates as we believe that the recently struck trade war
“truce” at the G20 summit in Argentina is temporary in nature and, eventually,
the tariffs will be raised to increase the pressure on China. We use ranges rather
than a single value for the tariff rate as there are hundreds of product lines within
each export category and each product line is subject to a different tariff rate.
This analysis (refer to figure below) should be treated more as a “sanity check”
on the overall conclusion on which sectors lend themselves to ASEAN, as a
region, gaining market share from China in exports to the US as a consequence
of the trade tensions. Based on this analysis and the shortlist of key sectors
identified earlier, we can see that the top end of the tariff range on Chinese
exports to the US (post step-up) is significantly higher than on ASEAN exports to
the US in the machinery/electrical and plastics/rubbers sectors while ASEAN’s
relative “tariff advantage” over China is more nuanced in the textiles,
footwear/headgear and transportation (automotive) sectors. Despite ASEAN’S
“tariff advantage” in the minerals, metals and chemicals/additives categories, we
do not include these in our shortlist of sectors in which ASEAN can benefit from
the trade war because of the following reasons:
1) Chinese mineral exports to the US are small relative to other sectors.
2) In the metals sector, ASEAN’s market share relative to China is rather
small which, combined with the overcapacity in the Chinese metals
industry, limits the extent to which ASEAN can win market share from
China.
3) In the chemicals/additives sector, ASEAN supply is concentrated in
Singapore where production is dominated by large global multinational
corporations, rather than local players.
Title:
Source:
Please fill in the values above to have them entered in your report
-
500,000
1,000,000
1,500,000
2,000,000
2,500,000
Thailand Indonesia Malaysia Vietnam

ASEAN
Strategy Note - Alpha series │December 19, 2018
16
Figure 24: Tariffs on ASEAN exports to the US compared with tariffs on Chinese exports to the US
SOURCES: CGS-CIMB RESEARCH, TARIFFDATA.WTO.ORG
NOTE: ASEAN countries include Vietnam, Thailand, Malaysia, Indonesia | Singapore has FTA with the US, tariff is 0% for above categories
Figure 25: Comparative advantage of each ASEAN country by sector
Country Sector Reason
Singapore High-tech - Singapore is not competitive in manufacturing due to its high operating costs and strong currency. - Manufacturing is focused on high value, low volume products or those that customers insist on doing in Singapore given its strong intellectual property protection regime.
Vietnam Textile, clothing & footwear - Vietnam has much lower labour costs than China and most ASEAN peers with sizable labour forces. - The country has been a major exporter of textile, apparel and footwear for well over a decade and therefore, has a strong skills base relative to other ASEAN countries.
Electronics - The country is shifting gear into electronics manufacturing, spurred by large anchor investments from Samsung and LG. - Vietnam’s proximity to China’s Pearl River Delta and long coastline make it easy to ship in components and parts which is a crucial advantage given the complex supply chains in this sector and China’s position as a dominant supply hub.
Indonesia Food and beverage - Huge domestic market potential and well supported by productive agricultural sector and relatively predictable yields.
Textile and clothing - Low labour costs relative to China and a large labour force - Indonesia’s textile exports contribute c.2% of the world textile demand, the second largest exporter after Vietnam in ASEAN implying a strong skills base. - Expertise in production of functional clothing (i.e. sports-wear) on top of basic clothing production ability.
Automotive - Indonesia has the largest automotive production capacity within ASEAN and was second only to Thailand in terms of auto exports in 2017.
Plastics/ Rubbers - Indonesia is the second largest natural rubber producer globally. Around 85% of Indonesia’s rubber production is exported, while domestically sold rubber is mostly consumed by the automotive sector.
Thailand Automotive - Thailand has been the auto production hub in Southeast Asia over the past few decades as Thailand has a large domestic market and the government never had a national car brand development policy, thereby making way for global OEMs. - The Thai labour force is highly-skilled relative to most of ASEAN. - Strong presence of Japanese OEMs has also attracted many auto parts suppliers into the country, that have learnt to supply auto makers on a just-in-time basis. - Strong road, rail and port infrastructure helps reduce logistics costs.
Current tariffs Potential tariffs
Machinery/Electrical 84-85 - Nuclear reactors, boilers, machinery and mechanical appliances; parts thereof
- Electrical machinery and equipment and parts thereof; sound recorders and
reproducers, television recorders and reproducers, parts and accessories
0-25% 25% 0-15%
Mineral products 25-27 - Salt; sulfur; earths and stone; plastering materials, lime and cement
- Ores, slag and ash
- Mineral fuels, mineral oils and products of their distillation; bituminous
substances; mineral waxes
0-25% 25% 0-7%
Chemicals & Allied industries 28-38 - Chemicals, pharmaceutical products, fertilizers, other chemical products 0-25% 25% 0-6.5%
Textiles 50-63 - Silk, wool, cotton, including yarns and woven fabrics
- Fibers, filaments,
- Carpets, textile floor coverings
- Knitted or crocheted fabrics
- Articles of apparel and clothing accessories
0-20.9% 25% 0-28.6%
Plastics/Rubbers 39-40 - Plastics/Rubbers products 0-25% 25% 0-14%
Foodstuffs 16-24 - Edible preparation of fish, meat
- Sugars/ Cocoa
- Preparation of cereals, flour, starch, vegetables, fruit, nuts
- Beverages, spirits, vinegar
- Tobacco
0-35% 25-35% 0-35%
Footwear/Headgear 64-67 - Footwear, headgear, umbrellas 0-48% 25%-48% 0-48%
Transportation 86-89 - Railway locomotives, track fixtures, other vehicles, aircraft, ships, boats 0-25% 25% 0-25%
Vegetable products 6-15 - Vegetables, fruit, nuts, coffee, tea, cereals,, oil seeds, etc 0-20% 25% 0-29.8%
Metals 72-83 - Iron and steel, copper, aluminium, lead, zinc, tin, etc 0-25% 25% 0-15%
China ASEANKey productsHS CodeProduct category

ASEAN
Strategy Note - Alpha series │December 19, 2018
17
Electronics - Strong automotive manufacturing ecosystem has created spillovers into electronics auto part manufacturing capabilities. - Thai electronic companies have ventured into making components for mobile phones and IT telecom equipment which also gives it an advantage in finished electronic goods production. Thailand is a major producer of consumer electrical appliances.
Food and beverage - Thailand is one of the largest food producers in the world due to a large agrarian base; the country has been a leading producer of processed food for years.
Plastics/ Rubbers - Thailand ranks as the largest rubber producer and exporter in the world. Complementing the natural rubber industry, Thailand is also growing its synthetic rubber segment by leveraging its robust petrochemicals production base. - Tyres are the number one rubber-based export from Thailand, with tyre producers accounting for roughly half of domestic rubber consumption given the country’s large automotive manufacturing base. - Thailand has a large petrochemicals industry and is a regional leader in plastics production. Plastic packaging accounts for 48% of Thailand’s raw plastic consumption, followed by 15% for its electronic sector, 14% for its construction sector and 8% for its automotive sector, according to ASEAN Briefing.
Malaysia Semiconductor - Malaysian semiconductor companies have built niche capabilities in assembly, packaging and testing of semiconductor chips. - Malaysian semiconductor companies have been the preferred partners/suppliers for foreign MNCs that are concerned over Intellectual Property (IP) infringement issues experienced with contract manufacturers in China. - The sector is supported by a strong ecosystem of local suppliers in Penang.
Automotive - Malaysia has a strong ecosystem of auto parts suppliers, many of which leverage its strong electronics parts and components manufacturing ecosystem.
Plastics/ Rubbers - Malaysia is the ASEAN region’s top plastic export country. Its primary export destinations include Europe, China, Singapore, Japan and Thailand. - The Malaysian plastics market was estimated at US$3,305.4m, by revenue, in 2017 and is likely to expand at an estimated CAGR of 5.27%, during the forecast period 2018-2023, according to Mordor Intelligence.
SOURCES: CGS-CIMB RESEARCH
Figure 26: Importance of success factor by export sector and potential ASEAN trade-war beneficiaries by sector
Machinery/ Electrical
Plastics/ Rubbers Textiles/ Footwear & Headgear
Transportation (Automotive)
Cheap labour force
VN, ID
VN, ID
VN, ID
VN, ID
Proximity to major component supply base
VN, TH
SG, TH, MY, VN
VN, TH
TH, MY, VN
Strong existing manufacturing/relevant skills base
MY, TH, VN
SG, TH, ID, MY
VN, ID
TH, MY
Captive raw material supply base
NONE
TH, ID, MY
TH
TH, ID, VN
Strong existing US export orientation
MY, TH, VN
TH, ID, MY
VN, ID
TH
Biggest potential beneficiaries in ASEAN by sector, based on comparative advantage
MY, TH, VN TH, ID, MY VN, ID TH, MY
SOURCES: CGS-CIMB RESEARCH
NOTE: = “Critical success factor”, = “Unimportant success factor”
Impact category #2. ASEAN exporters of intermediate products to China
which are used as inputs for re-export from China to the US could see a
slowdown in demand
ASEAN has significant indirect exposure to Chinese exports to the US as it is a
sizable exporter of raw materials and intermediates to China. Malaysia and
Vietnam are the two largest ASEAN exporters to China but Indonesia and
Malaysia have the highest share of intermediates in their total exports to China.
This is not surprising when you consider that ASEAN is mostly an exporter of
basic materials and commodities to China, rather than of finished goods, and
Indonesia is a large global exporter of hard commodities (iron ore, coal, etc.)
while both Malaysia and Indonesia are big producers of palm oil and natural
rubber; nearly 90% of total exports to China from both these countries is

ASEAN
Strategy Note - Alpha series │December 19, 2018
18
comprised of intermediates. Singapore has a sizable chunk of its exports to
China being comprised of intermediates but this is more in the area of high-tech
or precision components as well as chemicals and advanced materials. Notably,
Vietnam has the lowest share of its exports to China contributed by
intermediates. Being more of a mid-to-downstream value chain operator in
export manufacturing which is more focused on assembly work, Vietnam’s
exports to China include a mix of intermediates and finished products (such as
mobile handsets) although the country appears to be rapidly moving up the
value chain into intermediates as evinced in Samsung’s recent addition of LCD
display manufacturing capacity in Vietnam.
Figure 27: Exports to China from each ASEAN country (2017,
US$ bn)
Figure 28: ASEAN exports to China by category (2017)
SOURCES: CGS-CIMB RESEARCH, TRADEMAP SOURCES: CGS-CIMB RESEARCH, TRADEMAP
Figure 29: Intermediates exports to China from each ASEAN country (% of total exports to China, 2017)
SOURCES: CGS-CIMB RESEARCH, TRADE MAP, UNSTATS
While supply chain linkages between ASEAN intermediates exports to China
and China’s exports to the US are complex and there is no data to map this, we
attempted to qualitatively evaluate the degree to which ASEAN exports to the
China are consumed in Chinese goods exports to the US, by export category or
sector. Just to illustrate this, Indonesian timber is used to manufacture furniture
and other wooden products in China which are then exported to US; Thai and
Indonesian rubber exports to China are used to produce tyres for export to the
US while Malaysian and Singapore electronic components and precision parts
exported to China are used for production of finished electrical products and
machinery which are then exported from China to the US.
Title:
Source:
Please fill in the values above to have them entered in your report
54
50
42
34
29
-
10
20
30
40
50
60
Malaysia Vietnam Thailand Singapore Indonesia
Title:
Source:
Please fill in the values above to have them entered in your report
0%
10%
20%
30%
40%
50%
60%
70%
80%
90%
100%
Malaysia Vietnam Thailand Singapore Indonesia
Machinery/Electrical Mineral products Chemicals & Allied industries
Textiles Plastics/Rubbers Foodstuffs
Footwear/Headgear Transportation Vegetable products
Metals Other
Title:
Source:
Please fill in the values above to have them entered in your report
85.4% 85.5%
70.9% 69.5%
57.7%
0.0%
10.0%
20.0%
30.0%
40.0%
50.0%
60.0%
70.0%
80.0%
90.0%
Indonesia Malaysia Singapore Thailand Vietnam

ASEAN
Strategy Note - Alpha series │December 19, 2018
19
Figure 30: Map shows how upstream or downstream a country plays in exporting to China within each category
SOURCES: CGS-CIMB RESEARCH
ASEAN’s transportation (automotive), machinery/electrical, foodstuffs,
vegetable products and wood and wood products exports to China are
consumed in moderate-to-high degrees in production of goods that China
exports to the US, as shown in the table below:
Figure 31: Degree to which ASEAN intermediates exports to China by category are consumed in China’s exports to the US
SOURCES: CGS-CIMB RESEARCH
For these abovementioned categories of ASEAN exports to China that are highly
exposed to Chinese exports to the US, the demand-side disruption may only be
temporary in nature as the entire supply chain becomes less China-centered.
For example, in the machinery/electrical sector, Malaysia and Singapore may
initially see a strong decline in the demand for precision parts and components
from China as downstream Chinese exporters of finished electrical products are
unable to competitively export to the US. However, if ASEAN becomes more
competitive in exports of the downstream products to the US than China, then
the Malaysian and Singapore upstream suppliers can re-direct their exports to
supply ASEAN manufacturers of finished electrical products and machinery who
will gain market share from their Chinese competitors, thereby ultimately
offsetting the impact of lower Chinese demand.
However, given China’s dominance in multiple categories of exports to the US,
ASEAN and other competing regions could take significant time to gain market
share from China and this implies that ASEAN suppliers of intermediates to
0% 10% 20% 30% 40% 50% 60% 70% 80% 90% 100%
Foodstuffs
Machinery/Electrical
Textiles
Vegetable products
Plastics/Rubbers
Transportation
Wood and wood products
% of intermediates as % of toal exports to China (2017)
TH ID MY SG VN
Vietnam Thailand Singapore Malaysia Indonesia
Machinery/Electrical 19,942 9,441 9,446 29,332 796 Moderate
Mineral products 1,410 1,249 1,459 8,223 10,011 Low
Chemicals & Allied industries 278 1,997 3,812 2,172 1,934 Insignificant
Textiles 2,606 470 44 181 584 Low
Plastics/Rubbers 1,856 8,892 3,724 2,952 1,650 Low
Foodstuffs 193 131 140 160 121 Moderate
Footwear/Headgear 2 1 0 0 0 Low
Transportation 238 531 38 145 183 High
Vegetable products 274 690 9 1,652 3,453 Very high
Metals 190 994 183 954 2,585 Low
Wood and wood products 1,094 1,965 291 248 2,878 Very high
China intermediates imports from ASEAN country (US$ million) Degree of consumption in China's
exports to US
Product category
Downstream Upstream
ID SG MY VN TH
SG TH VN MY ID
MY VN ID TH SG
VN TH SG ID MY
ID VN TH SG MY
ID TH SG VN MY

ASEAN
Strategy Note - Alpha series │December 19, 2018
20
China which are linked to Chinese exports of downstream products to the US
are likely to be negatively impacted in the near term.
Even though we earlier identified machinery/electrical and transportation
as sectors which present great potential for ASEAN to gain market share
from China in exports to the US (impact category #1), investors will need
to be discerning when honing in on countries or companies to ride this
theme. Vietnam, for example, exports both components and parts as well as
finished products to China (e.g. mobile handsets) and could, in the interim, feel
the twin impact of a disruption in Chinese finished goods exports as well as
falling Chinese domestic consumption in sectors of the economy that are
vulnerable to weakening demand. It will benefit in longer term as factories are
relocated out of China to Vietnam. Malaysia, which plays even further upstream
from Vietnam in electronics manufactured exports to China (e.g.
semiconductors), is likely to see a pronounced negative impact in the near term.
However, because the US tariffs on Chinese electronics and machinery goods
currently apply only to intermediates and components (which is Malaysia’s
strength), certain exporters in Malaysia could capitalise on this opportunity to
gain market share from Chinese competitors.
Thailand, on the other hand, has a sizable contribution of finished electrical
appliance exports to total exports and is already a major exporter to the US in
this category. Even though current US tariffs on Chinese imports do not cover
finished electrical appliances, the imminent threat of an escalation of the trade
war will already lead to a shift in finished electrical appliances to Thailand, at
China’s expense, in our view.
Impact category #3. ASEAN exporters of products to China which are
primarily driven by Chinese end-consumption will be impacted by a
slowdown in the Chinese economy
One final, albeit indirect, manner in which we see ASEAN’s exports being
impacted by the trade war is through the fallout of the trade war on China’s
economy. China’s economy was slowing even before the trade war due to
efforts by the government to reduce leverage, reduce environmental pollution
and root out corruption. In the last few months, China’s exports to the US
accelerated as US buyers resorted to hoarding Chinese imports before the
anticipated step-up in tariffs to 25% starting in Jan 2019, which was
subsequently delayed under the terms of the “truce” agreed upon at the G20
summit in Nov 18. Even though China’s overall export growth slowed markedly
in Nov 2018 to just 5.4% yoy, down from 15.6% yoy in Oct 2018, according to
the data released by the General Administration of Customs, this appeared to be
driven more by slowing demand conditions globally rather than a direct result of
the trade war; Chinese exports to the US in Nov grew by a still robust 10.0%
yoy, down from 13.2% yoy in Oct.
Figure 32: China's GDP growth vs. exports growth (quarterly, % yoy)
SOURCES: CGS-CIMB RESEARCH, BLOOMBERG
Title:
Source:
Please fill in the values above to have them entered in your report
0.0
2.0
4.0
6.0
8.0
10.0
12.0
14.0
16.0
6.3
6.4
6.5
6.6
6.7
6.8
6.9
7.0
1Q17 2Q17 3Q17 4Q17 1Q18 2Q18 3Q18
GDP growth (% yoy) Export growth (% yoy, RHS)

ASEAN
Strategy Note - Alpha series │December 19, 2018
21
However, we expect China’s export growth to the US to slow markedly in the
coming months as some of these “front-end loading” effects taper off. This,
together with a general souring of sentiment due to the trade war, is certain to
exacerbate China’s economic slowdown unless, of course, the government
steps up stimulus measures.
Nevertheless, we focus on categories of ASEAN exports to China that will be
impacted by weaker Chinese consumption rather than those impacted by capital
investment since we believe that, in the event of a sharp deterioration of
economic conditions, the Chinese government is likely to ramp up fixed asset
investment to stimulate the economy even if that requires “kicking the
deleveraging can down the road”. Any such stimulus will have an immediate
impact on capital investment but could take time to be transmitted to the wider
economy; hence, consumption is likely to weaken in the medium term, even if
the government resorts to stimulus measures.
While there is no reliable data mapping ASEAN’s exports to end-consumption in
China (as opposed to exports of downstream goods out of China), we
qualitatively identify ASEAN’s exports of textiles/footwear & headgear,
plastics/rubbers and vegetable products as having significant exposure to
China’s domestic consumption. In the machinery/electrical sector, the picture
is mixed: Vietnam’s exports to China are likely more exposed to end-
consumption, relative to Malaysia, as they include a sizable amount of finished
products such as mobile handsets which are consumed in China whereas
Malaysia mostly exports components and parts some of which are used in
Chinese finished machinery and electrical goods for export (only some of which
are destined for the US market).
Of these four categories of ASEAN exports to China which are likely to have
significant exposure to Chinese domestic consumption, vegetable products are
likely to be the least impacted by a slowdown in China; vegetable-based
products such as palm oil (imported in large quantities from Malaysia and
Indonesia) are used widely for production of personal care products and
processed foods which are relatively staple in nature. However, given the
relatively discretionary nature of apparel, footwear and consumer electronics
(such as smartphones), ASEAN’s exports of textiles, footwear & headgear and
certain types of electronic products are likely to suffer from the fallout of any
further deceleration in the Chinese economy. Plastics and rubbers exports from
ASEAN are also vulnerable to a slowdown in Chinese consumption – for
example, rubber gloves imported from ASEAN are used by Chinese
manufacturing workers and manufacturing activity in China is likely to feel the
twin impact of falling exports and a slowdown in domestic consumption;
meanwhile, rubber exports from ASEAN to China are likely to be negatively
impacted by a further weakening of car sales in China.
However, since ASEAN is increasingly competing with China in global exports of
textiles/footwear & headgear as well as consumer electronics, the impact of a
Chinese slowdown on ASEAN exporters of these categories of products is likely
to be transitory in nature; over time, ASEAN exporters can shift their export
focus away from the Chinese market and to the US market to capitalise on the
opportunities created by the trade war and to offset demand weakness in China.

ASEAN
Strategy Note - Alpha series │December 19, 2018
22
Figure 33: Degree of ASEAN exports to Chinese end consumption
SOURCES: CGS-CIMB RESEARCH
Figure 34: Summary of the trade war impact on manufacturing sector in ASEAN region by key sector
Export category Opportunities
under Impact
Category 1
Downside
risks from
Impact
Category 2
Downside risks
from Impact
Category 3
Net
near/medium -
term impact
Net long-term
impact
Net longer-term strong /
(mild) beneficiary
countries in ASEAN
Machinery /
Electronics High Moderate Low
Negative-to-
Neutral Positive
VN, MY, (TH)
Plastics/ Rubbers High Low High Neutral Mild Positive
TH, MY, (VN)
Textiles/ Footwear
& Headgear Moderate Low
Moderate-to-
High Positive Mild Positive
VN, (ID)
Transportation
(Automotive) Moderate High Low Negative Positive
TH, MY
SOURCES: CGS-CIMB RESEARCH
Figure 35: Summary of trade war-based investment strategy for ASEAN region
Export Category High level investment strategy for ASEAN region
Machinery / Electronics Medium-term: Avoid exporters with high exposure to China.
Long-term: Buy upstream, midstream and downstream exporters in MY and TH that can meet US
quality standards. In VN, buy service providers to machinery and electronics export manufacturers as a
proxy for exports in this category (e.g. logistics services, air cargo services, industrial park operators)
as electrical and machinery exports are dominated by unlisted subsidiaries of foreign enterprises.
Plastics/ Rubbers Medium-term: Buy exporters of packaging, plastics and rubber with significant exposure to the US.
Avoid exporters that are exposed to key sectors of the Chinese consumption that are already showing
weakening (tyres/auto, industrial gloves, etc.).
Long-term: Buy exporters in MY and TH that can meet US quality standards. Consider up-and-coming
plastics exporters in VN that will benefit from greater domestic petrochemical production capacity
expansion in the country. Avoid exporters that have high exposure to China and are unable to meet US
import standards.
Textiles/ Footwear & Headgear Medium-term: Buy VN yarn producers and garment exporters, especially those with significant
exposure to the US market.
Long-term: Buy VN yarn producers and garment exporters. Avoid exporters that have high exposure to
China and are unable to meet US import standards.
Transportation (Automotive) Medium-term: Avoid exporters with high exposure to China.
Long-term: Buy TH and MY automotive parts and components suppliers with sizable US exposure or
potential to increase US exposure.
SOURCES: CGS-CIMB RESEARCH
Vietnam Thailand Singapore Malaysia Indonesia
Machinery/Electrical 24,160 16,075 13,573 34,498 1,713 Low
Mineral products 1,430 1,374 5,070 8,928 10,366 High
Chemicals & Allied industries 365 2,189 4,050 2,366 2,103 Low
Textiles 3,678 646 56 206 902 High
Plastics/Rubbers 1,893 9,029 3,753 3,131 1,677 High
Foodstuffs 381 727 298 455 426 Low
Footwear/Headgear 1,510 55 0 1 595 Moderate
Transportation 244 1,192 126 147 185 Low
Vegetable products 2,247 3,589 11 1,772 3,787 Moderate
Metals 223 1,022 187 959 2,586 Low
China imports from ASEAN country (US$ million) Degree of exposure to Chinese-end
consumption
Product category

ASEAN
Strategy Note - Alpha series │December 19, 2018
23
Key stocks that will be impacted by the trade war
Malaysian Pacific Industries (Malaysia) (ADD, TP of RM15.4)
● The group recently highlighted that one of its customers have started to diversify its manufacturing exposure outside of China, albeit at small volume, in view of a potential escalation in US-China trade war. We think MPI could benefit in the long term if more customers decide to relocate their operations from China to Malaysia given that MPI has the spare capacity with two production plants in Malaysia.
● MPI is targeting to double its revenue from US$377m in FY6/18 to over US$750m within 3-5 years, driven by new customers and design wins in automotive and industrial (A&I) and communication segments.
● The group plans to keep its capex level in FY19F similar to FY18’s circa RM170m as it continues to invest in automation in a bid to boost efficiency.
● We maintain Add with a RM15.40 TP, still based on 16x CY20F P/E, in line with our target sector P/E. MPI trades at 7.5x CY19F P/E-ex cash.
Unisem (Malaysia) (ADD, TP of RM3.30)
● We see the potential entry of a new single-largest shareholder, China-based Tianshui Huatian Technology (TSHT), as positive for Unisem as it could assist the group to penetrate the Chinese market.
● In addition, we think Unisem could also benefit from Chinese customers’ plans to find a new manufacturing site out of China as the group has two production facilities in Ipoh and Batam.
● Unisem is investing in a 12-inch wafer bumping line at its Ipoh plant. The new line is
undergoing equipment installation and we expect the line to enter qualification process
in 1Q19F and commence operation in 2Q19F.
● We maintain Add and RM3.30 TP, based on 14.4x CY20F P/E, a 10% discount to the
target sector P/E of 16x.
Riverstone Holdings (Singapore) (ADD, TP of S$1.30)
● Riverstone is a Malaysia-based rubber glove play that could offer some upside from
the trade war, in view of resilient demand for its nitrile rubber gloves which appears to
be benefiting from a trade war-induced acceleration in the shift away from vinyl gloves.
● With nitrile gloves accounting for 94% of its FY17 sales, Riverstone is benefiting from a
structural shift away from vinyl gloves produced in China towards nitrile gloves globally
as China tackles air pollution and curbs vinyl glove manufacturers’ production.
● Though medical gloves are not included in the US tariff list, tariffs on vinyl (which is not
getting any cheaper) could possibly exacerbate the shift towards nitrile gloves, making
Riverstone a potential beneficiary.
● We retain our Add call and TP of S$1.30, pegged to 16.7x FY19F P/E that represents
16% discount to its Malaysia peers’ average.
Delta Electronics (Thailand) (ADD, TP of THB87.0)
● With DELTA expanding facilities to cater to the increasing demand for automotive
power supply (APS) products, we believe the company is poised to benefit from the
increasing number of EV cars produced across the globe amid tightening
environmental regulations worldwide.
● We note the US has levied a 25% import tariff on power supply parts from China for
automatic data processing machines (HTS Codes: 8504.40.60, 8504.40.70). We
believe DELTA can be a substitute supplier for these products from its production
facilities in Thailand.
● We maintain our Add rating for DELTA with an end-19 target price of THB87.00, based
on 15x FY20F P/E (-0.5 s.d. from DELTA’s 5-year historical mean).

ASEAN
Strategy Note - Alpha series │December 19, 2018
24
Somboon Advance Technology (Thailand) (ADD, TP of THB27.0)
● SAT manufactures and sells automobile parts to automobile OEMs. Its major clients
include Mitsubishi, Toyota/Hino. We think SAT should benefit from strong auto
production growth as SAT supplies spare parts mainly for commercial vehicles (CV).
● SAT could benefit from the US-China trade dispute. If some Japanese auto
manufacturers relocate their manufacturing facilities from China to Thailand, they may
seek business partners in Thailand which would present SAT with an opportunity.
● Our target price of THB27.0 is based on 12x FY19F P/E (+1 s.d. of 5-year average).
Catalysts that could lift its share price further are 1) synergy with new business
partners in terms of cost savings, and 2) political stability.
Hana Microelectronics (Thailand) (HOLD, TP of THB38.0)
● We see risks to HANA’s automotive segment, given China's domestic passenger car
sales (all brands) contracted by 12.6% yoy in Nov 2018, the largest monthly decline in
six years.
● Despite a relatively low direct exposure to the supply chains between the US and
China, HANA is vulnerable to China’s economic outlook due to its high exposure to
China and we believe that the trade war could continue to pressure China’s economic
growth.
● We also see that US tariffs on EU automotive imports could further hurt HANA.
● We maintain our Hold call on HANA with an end-19F target price of THB38, based on
11.5x FY20F P/E (-1 s.d. from its 5-year mean).
Sri Trang Agro-Industry (Thailand) (REDUCE, TP of THB16.0)
● STA is the world’s largest fully integrated natural rubber company headquartered in
Thailand.
● STA's share price jumped 70% between 29 Jun 18 and 7 Dec 18 and we believe there
could be limited upside due to 1) lower sales from low selling natural rubber (NR)
prices, especially to China, 2) low sustained NR margins, and 3) recent government
policies to shore up low prices for domestic NR.
● We expect the general slowdown in Chinese economy and its auto sector to negatively
affect rubber prices, partly driven the trade war. We expect only a 2% yoy increase in
rubber price in 2019 after a 17% decline YTD this year.
● We keep our Reduce rating and target price of THB16, based on 15.5x CY19F
blended P/E (1 s.d. below its historical 5-year average).
An Phat Plastic JSC (Vietnam) (Non-rated)
● AAA is the largest plastic packaging manufacturer and exporter in Southeast Asia in
terms of production capacity.
● According to management, AAA stands to benefit from the trade war between the US
and China as US importers are seeking non-Chinese plastic bag suppliers to reduce
the impact of the 13% tariff imposed on Chinese plastic packaging.
● Rather than solely concentrating on the existing packaging production (accounting for
68% of the company’s FY17 total revenue), AAA will start to launch new products
through its subsidiaries, including hi-tech injection molding spare parts, premium
industrial bags and building materials such as plastic walls and floor tiles in 2019F.
● AAA is currently trading at a TTM P/E of 9.5x, an 8.4% discount to the peer average
TTM P/E of both domestic and regional plastic producers (10.3x).
Century Synthetic Fiber Corp (Vietnam) (Non-rated)
● STK is the second-largest polyester yarn manufacturer in Vietnam (in terms of
capacity), accounting for 28% of national polyester yarn exports in 2017.
● The US’s package of recently-imposed tariffs in Sep 18 on Chinese imports includes
synthetic fibers and other polyester-based products, hence making Vietnamese
synthetic yarn manufacturers like STK more competitive, said STK’s management.

ASEAN
Strategy Note - Alpha series │December 19, 2018
25
● According to STK’s management, the Trang Bang 5 factory (TB5) will begin operations
in 1Q19 at a utilisation rate of 90%, after the trial phase in 4Q18. TB5 will raise STK’s
total production capacity to 63,300 tonnes of yarn, up 5.5% from current levels.
Kinh Bac City Corp (Vietnam) (Non-rated)
● Management expects the US-China trade war to boost leasing from 2019F, as foreign
companies in China are seeking to diversify their production bases to Vietnam to
bypass US trade tariffs.
● According to management, KBC will launch a new industrial park Nam Son Hap Linh
with an NLA of 66ha in 2019F, adding to its current total NLA of 453ha available for
lease (as at end-2017).
● The stock currently trades at a discount to its BVPS of VND20,364 as at end-3Q18.
Saigon Cargo Service Corp (Vietnam) (Non-rated)
● SCS is one of Vietnam’s two integrated air cargo service providers servicing the Tan
Son Nhat airport (SGN) in Ho Chi Minh City.
● Air cargo service providers at SGN are faced with capacity constraints. But SCS is the
only one able to expand capacity as its competitor, TCS has no available land bank for
expansion. SCS’s current cargo-handling capacity is 200,000 tonnes and the company
plans to increase it to 350,000 tonnes in 2019, per management.
● Global companies have yet to adjust their supply chains to circumvent US trade tariffs
on China. Therefore, cargo throughput volumes at SGN could be hurt in the short term
and this will negatively affect cargo service providers like SCS, per management.
● However, management expects SCS to be a beneficiary of the trade war in the
medium-to-long term as factories, particularly in the electronics industry, relocate from
China to Vietnam.
Thanh Cong Textile Garment JSC (Vietnam) (Non-rated)
● TCM is the only Vietnamese textile manufacturer that operates a fully vertically-
integrated production chain ranging from yarn to garment products.
● According to TCM’s Management, under the current US tariff regime, sewed/knitted
products (e.g. fabric) from China will be taxed at 25% on average vs. a tariff rate of
17.5% on similar goods imported from Vietnam. Therefore, TCM expects to benefit
from the trade war, as fabric contributed 13.4% of TCM’s 9M18 revenue.
● TCM’s Vinh Long dyeing factory (capex of ~US$10m in FY19F and capacity of 2,500m
of fabric per day) will serve in-house fabric production needs after expected
commissioning around FY19-20F, reducing its reliance on outsourced dyeing and
boosting margins, says management.

ASEAN
Strategy Note - Alpha series │December 19, 2018
26
APPENDIX – TOP 5 EXPORTS TO CHINA & US
Figure 36: Vietnam exports to US (2017, US$ m) Figure 37: Vietnam exports to China (2017, US$ m)
SOURCES: CGS-CIMB RESEARCH, USITC SOURCES: CGS-CIMB RESEARCH, TRADEMAP
Figure 38: Thailand exports to US (2017, US$ m) Figure 39: Thailand exports to China (2017, US$ m)
SOURCES: CGS-CIMB RESEARCH, USITC SOURCES: CGS-CIMB RESEARCH, TRADEMAP
Figure 40: Malaysia exports to US (2017, US$ m) Figure 41: Malaysia exports to China (2017, US$ m)
SOURCES: CGS-CIMB RESEARCH, USITC SOURCES: CGS-CIMB RESEARCH, TRADEMAP
Title:
Source:
Please fill in the values above to have them entered in your report
Machinery/Electrical14,082
Metals1,282
Textiles11,853
Vegetable products
2,055
Footw ear/Headgear5,766
Other6,633
Title:
Source:
Please fill in the values above to have them entered in your report
Machinery/Electrical 24,160
Textiles 3,678 Plastics/Rubbers
1,893
Vegetable products
2,247
Footw ear/Headgear 1,510
Other16,886
Title:
Source:
Please fill in the values above to have them entered in your report
Machinery/Electrical16,137
Metals1,482Stone/Glass
1,448
Plastics/Rubbers3,502
Foodstuffs2,411
Other5,582
Title:
Source:
Please fill in the values above to have them entered in your report
Machinery/Electrical 16,075
Chemicals & Allied industries 2,189
Plastics/Rubbers 9,029
Vegetable products
3,590
Wood & w ood products
1,973
Other8,740
Title:
Source:
Please fill in the values above to have them entered in your report
Machinery/Electrical28,348
Chemicals & Allied
industries653
Metals558
Plastics/Rubbers1,797
Vegetable products
475 Other2,014
Title:
Source:
Please fill in the values above to have them entered in your report
Machinery/Electrical 34,498
Mineral products 8,928
Chemicals & Allied industries
2,366
Plastics/Rubbers 3,131
Vegetable products 1,772
Other3,731

ASEAN
Strategy Note - Alpha series │December 19, 2018
27
Figure 42: Indonesia exports to US (2017, US$ m) Figure 43: Indonesia exports to China (2017, US$ m)
SOURCES: CGS-CIMB RESEARCH, USITC SOURCES: CGS-CIMB RESEARCH, TRADEMAP
Figure 44: Singapore exports to US (2017, US$ m) Figure 45: Singapore exports to China (2017, US$ m)
SOURCES: CGS-CIMB RESEARCH, USITC SOURCES: CGS-CIMB RESEARCH, TRADEMAP
Title:
Source:
Please fill in the values above to have them entered in your report
Machinery/Electrical2,030
Textiles4,785
Plastics/Rubbers2,200
Vegetable products
1,920Footw ear/Headgear1,833
Other7,441
Title:
Source:
Please fill in the values above to have them entered in your report
Mineral products 10,366
Chemicals & Allied industries
2,103
Metals 2,593
Vegetable products
3,787
Wood & w ood products
3,351
Other6,374
Title:
Source:
Please fill in the values above to have them entered in your report
Machinery/Electrical6,428
Mineral products759Chemicals &
Allied industries
5,584
Stone/Glass268
Plastics/Rubbers355
Other5,973
Title:
Source:
Please fill in the values above to have them entered in your report
Machinery/Electrical 13,573
Mineral products 5,070
Chemicals & Allied industries
4,173
Stone/Glass 4,900
Plastics/Rubbers 3,753
Other2,780

Company Brief Semiconductor │ Malaysia │ December 19, 2018
IMPORTANT DISCLOSURES, INCLUDING ANY REQUIRED RESEARCH CERTIFICATIONS, ARE PROVIDED AT THE END OF THIS REPORT. IF THIS REPORT IS DISTRIBUTED IN THE UNITED STATES IT IS DISTRIBUTED BY CGS-CIMB SECURITIES (USA), INC. AND IS CONSIDERED THIRD-PARTY AFFILIATED RESEARCH.
Powered by the EFA Platform
Malaysian Pacific Industries
Top pick for Malaysian semiconductor
■ MPI targets to double its revenue from US$377m in FY6/18 to US$750m in 3-5 years, driven by new design and customer wins in A&I and communication.
■ It also plans to invest in robotics equipment in FY19F to promote automation and improve efficiency, while reducing its dependence on human interface.
■ Maintain Add and RM15.40 target price. MPI is our sector top pick in view of its attractive growth prospects in the A&I segment.
Tepid industry demand growth projected for 2019F ● Semiconductor market research group WSTS projects 2.6% industry sales growth in
2019F, driven by higher demand across all four markets – Asia Pacific, Americas,
Japan and Europe – driven by optoelectronics, sensors and discrete demand. WSTS
projects 15.9% semiconductor industry sales growth in 2018F, mainly driven by a
33.2% surge in memory demand. Stripping out the memory segment, WSTS expects
the semiconductor industry to grow at 9% yoy in 2018F.
Exciting long-term prospects ● MPI is targeting to double its revenue from US$377m in FY6/18 to over US$750m
within 3-5 years, driven by new customers and design wins in automotive and
industrial (A&I) and communication segments. For example, the group is in
discussions with one of its customers to transfer its existing assembly and packaging
business to MPI. Moreover, MPI is planning to introduce new sensor applications to
strengthen its position in A&I chip assembly and packaging.
Investing in robotics to drive efficiency and quality improvement ● The group plans to keep its capex level in FY19F similar to FY18’s circa RM170m as it
continues to invest in automation in a bid to boost efficiency. For example, it is
investing in automated guided vehicles (AGV) to help with its packaging and testing
processes. The AGVs will replace human beings as part of the process of placing the
wafers into wire bonders and tester equipment.
Potential beneficiary from US-China trade war ● The group recently highlighted that one of its customers has started to diversify its
manufacturing exposure outside of China, albeit at small volume, in view of a potential
escalation in US-China trade dispute. We think MPI could benefit in the long term if
more customers decide to relocate their operations from China to Malaysia given that
MPI has the spare capacity with two production plants in Malaysia.
Maintain Add and target price ● Maintain Add with a RM15.40 TP, still based on 16x CY20F P/E, in line with our target
sector P/E. MPI trades at 7.5x CY19F P/E-ex cash. Earnings-accretive acquisitions,
ringgit depreciation vs. US$, and higher dividends are potential re-rating catalysts.
Wafer supply constraints and a stronger ringgit vs. US$ are key downside risks.
SOURCES: CIMB RESEARCH, COMPANY REPORTS
Malaysia
ADD (no change)
Consensus ratings*: Buy 5 Hold 3 Sell 0
Current price: RM9.84
Target price: RM15.40
Previous target: RM15.40
Up/downside: 56.5%
CGS-CIMB / Consensus: 20.5%
Reuters: MPIM.KL
Bloomberg: MPI MK
Market cap: US$468.9m
RM1,957m
Average daily turnover: US$0.58m
RM2.41m
Current shares o/s 209.9m
Free float: 44.4% *Source: Bloomberg
Source: Bloomberg
Price performance 1M 3M 12M
Absolute (%) -18.3 -23.6 -20
Relative (%) -14.1 -14.8 -13.3
Major shareholders % held Hong Leong Manufacturing 50.3
EPF 5.4
Insert
Analyst(s)
Mohd Shanaz NOOR AZAM
T (60) 3 2261 9078 E [email protected]
Financial Summary Jun-17A Jun-18A Jun-19F Jun-20F Jun-21F
Revenue (RMm) 1,545 1,542 1,640 1,761 1,847
Net Profit (RMm) 184.2 146.6 165.5 191.0 211.8
Core EPS (RM) 0.88 0.70 0.79 0.91 1.01
Core EPS Growth 23.0% (20.4%) 12.8% 15.4% 10.9%
FD Core P/E (x) 11.21 14.08 12.48 10.81 9.75
Price To Sales (x) 1.34 1.34 1.26 1.17 1.12
DPS (RM) 0.27 0.29 0.32 0.35 0.40
Dividend Yield 2.74% 2.95% 3.25% 3.56% 4.07%
EV/EBITDA (x) 4.06 4.44 3.76 3.10 2.60
P/FCFE (x) 6.90 10.51 11.69 7.01 5.95
Net Gearing (33.4%) (40.8%) (46.0%) (55.8%) (65.1%)
P/BV (x) 1.84 1.74 1.61 1.47 1.35
ROE 17.5% 12.7% 13.4% 14.2% 14.4%
% Change In Core EPS Estimates 0% 0% 0%
CIMB/consensus EPS (x) 0.99 1.00 1.05
51.0
68.1
85.3
102.4
7.0
9.0
11.0
13.0
Price Close Relative to FBMKLCI (RHS)
1
2
3
Dec-17 Mar-18 Jun-18 Sep-18
Vo
l m

Semiconductor │ Malaysia
Malaysian Pacific Industries │ December 19, 2018
29
BY THE NUMBERS
SOURCES: CIMB RESEARCH, COMPANY REPORTS
Profit & Loss
(RMm) Jun-18A Jun-19F Jun-20F Jun-21F
Total Net Revenues 1,542 1,640 1,761 1,847
Gross Profit 1,542 1,640 1,761 1,847
Operating EBITDA 385 436 472 480
Depreciation And Amortisation (182) (194) (193) (172)
Operating EBIT 203 242 279 308
Financial Income/(Expense) (1) 1 2 4
Pretax Income/(Loss) from Assoc. 0 0 0 0
Non-Operating Income/(Expense) 0 0 0 0
Profit Before Tax (pre-EI) 202 243 281 311
Exceptional Items
Pre-tax Profit 202 243 281 311
Taxation (25) (39) (45) (50)
Exceptional Income - post-tax
Profit After Tax 177 204 236 262
Minority Interests (30) (39) (45) (50)
Preferred Dividends
FX Gain/(Loss) - post tax
Other Adjustments - post-tax
Net Profit 147 165 191 212
Recurring Net Profit 147 165 191 212
Fully Diluted Recurring Net Profit 147 165 191 212
Balance Sheet
(RMm) Jun-18A Jun-19F Jun-20F Jun-21F
Total Cash And Equivalents 648 807 1,085 1,412
Total Debtors 249 294 316 331
Inventories 118 157 169 177
Total Other Current Assets 3 0 0 0
Total Current Assets 1,018 1,258 1,570 1,920
Fixed Assets 647 623 570 497
Total Investments 0 0 0 0
Intangible Assets 0 0 0 0
Total Other Non-Current Assets 32 32 32 32
Total Non-current Assets 678 654 601 529
Short-term Debt 75 75 75 75
Current Portion of Long-Term Debt
Total Creditors 211 224 240 252
Other Current Liabilities 5 5 5 5
Total Current Liabilities 291 304 320 332
Total Long-term Debt 0 0 0 0
Hybrid Debt - Debt Component
Total Other Non-Current Liabilities 0 20 42 67
Total Non-current Liabilities 0 20 42 67
Total Provisions 0 0 0 0
Total Liabilities 291 324 363 399
Shareholders' Equity 1,188 1,286 1,403 1,531
Minority Interests 217 306 408 521
Total Equity 1,405 1,592 1,811 2,052
Cash Flow
(RMm) Jun-18A Jun-19F Jun-20F Jun-21F
EBITDA 385.1 436.3 471.9 480.1
Cash Flow from Invt. & Assoc.
Change In Working Capital 24.7 (71.1) (16.7) (11.9)
(Incr)/Decr in Total Provisions
Other Non-Cash (Income)/Expense
Other Operating Cashflow
Net Interest (Paid)/Received (1.2) 0.9 1.8 3.5
Tax Paid (30.0) (19.5) (22.5) (24.9)
Cashflow From Operations 378.7 346.7 434.6 446.8
Capex (170.7) (170.0) (140.0) (100.0)
Disposals Of FAs/subsidiaries 0.0 0.0 0.0 0.0
Acq. Of Subsidiaries/investments 0.0 0.0 0.0 0.0
Other Investing Cashflow 0.7 0.0 0.0 0.0
Cash Flow From Investing (170.0) (170.0) (140.0) (100.0)
Debt Raised/(repaid) (12.2) 0.0 0.0 0.0
Proceeds From Issue Of Shares 0.5 0.0 0.0 0.0
Shares Repurchased
Dividends Paid (76.1) (17.5) (16.2) (20.4)
Preferred Dividends 0.0 0.0 0.0 0.0
Other Financing Cashflow 0.5 0.0 0.0 0.0
Cash Flow From Financing (87.4) (17.5) (16.2) (20.4)
Total Cash Generated 121.3 159.1 278.4 326.4
Free Cashflow To Equity 196.5 176.7 294.6 346.8
Free Cashflow To Firm 211.9 179.7 297.6 349.8
Key Ratios
Jun-18A Jun-19F Jun-20F Jun-21F
Revenue Growth (0.14%) 6.35% 7.34% 4.88%
Operating EBITDA Growth (14.6%) 13.3% 8.1% 1.7%
Operating EBITDA Margin 25.0% 26.6% 26.8% 26.0%
Net Cash Per Share (RM) 2.73 3.49 4.81 6.37
BVPS (RM) 5.66 6.13 6.69 7.30
Gross Interest Cover 63.3 80.7 92.9 102.6
Effective Tax Rate 12.6% 16.0% 16.0% 16.0%
Net Dividend Payout Ratio 37.6% 40.6% 38.5% 39.6%
Accounts Receivables Days 62.08 60.41 63.38 63.93
Inventory Days N/A N/A N/A N/A
Accounts Payables Days N/A N/A N/A N/A
ROIC (%) 22.9% 29.1% 31.8% 36.6%
ROCE (%) 14.2% 15.6% 16.0% 15.7%
Return On Average Assets 10.7% 11.3% 11.5% 11.2%
7.3
9.3
11.3
13.3
15.3
17.3
19.3
21.3
Jan-15A Jan-16A Jan-17A Jan-18A
12-mth Fwd FD P/E (x) - Malaysian Pacific Industries Key Drivers
Jun-18A Jun-19F Jun-20F Jun-21F
ASP Change (%, Main Product) -99.9% -100.0% -100.0% -100.0%
Unit sales growth (%, main prod) N/A N/A N/A N/A
No. Of Lines (main Product) 5 5 5 5
Rev per line (US$, main prod) N/A N/A N/A N/A
ASP chg (%, 2ndary prod) N/A N/A N/A N/A
Unit sales grth (%, 2ndary prod) N/A N/A N/A N/A
No. Of Lines (secondary Product) N/A N/A N/A N/A
Rev per line (US$, 2ndary prod) N/A N/A N/A N/A

Company Brief Semiconductor │ Malaysia │ December 19, 2018 Shariah Compliant
IMPORTANT DISCLOSURES, INCLUDING ANY REQUIRED RESEARCH CERTIFICATIONS, ARE PROVIDED AT THE END OF THIS REPORT. IF THIS REPORT IS DISTRIBUTED IN THE UNITED STATES IT IS DISTRIBUTED BY CGS-CIMB SECURITIES (USA), INC. AND IS CONSIDERED THIRD-PARTY AFFILIATED RESEARCH.
Powered by the EFA Platform
Unisem
New growth driver from China?
■ We project Unisem to record stronger earnings growth in FY19F, driven by its new 12-inch wafer bumping capacity expansion and favourable forex.
■ Unisem could benefit from having a new single-largest shareholder, TSHT, which will help to penetrate the China market and create economies of scale.
■ Maintain Add and RM3.30 TP, based on 14.4x CY20F P/E.
Tepid demand growth projected for 2019F ● Semiconductor market research group WSTS projects 2.6% industry sales growth in
2019F, driven by higher demand across all four markets – Asia Pacific, Americas,
Japan and Europe – driven by optoelectronics, sensors and discrete demand. WSTS
projects 15.9% semiconductor industry sales growth in 2018F, mainly driven by a
33.2% surge in memory demand. Stripping out the memory segment, WSTS expects
the semiconductor industry to grow at 9% yoy in 2018F.
Investing for future growth with new 12-inch bumping capacity ● Unisem is investing in a 12-inch wafer bumping line at its Ipoh plant. The new line is
undergoing equipment installation and we expect the line to enter qualification process
in 1Q19F and commence operation in 2Q19F. The group plans to raise its wafer
bumping capacity in Chengdu as it is exploring the possibility of adding a Chinese
wafer foundry customer following its capacity expansion in Chengdu in 2018.
Potential beneficiary from US-China trade dispute? ● We see the potential entry of a new single-largest shareholder, China-based Tianshui
Huatian Technology (TSHT), as positive for Unisem as it could assist the group to
penetrate the Chinese market. To recap, Unisem received a pre-conditional voluntary
take-over offer of RM3.30/share in Sep 2018; it was a joint-offer from TSHT and
existing major shareholders. The deal will require more than 50% acceptance from
Unisem’s shareholders. In addition, we think Unisem could also benefit from Chinese
customers’ plans to find a new manufacturing site out of China as the group has two
production facilities in Ipoh and Batam.
New growth driver in microphone assembly programme ● We learnt that its new piezoelectric microphone assembly and packaging programme
for US-based acoustic sensor developer Vesper began contribution in 3Q18, albeit at
a small percentage. Vesper produces microphone sensors for voice-assisted devices,
such as smart speakers. Vesper is planning to ramp up its production volume from
several thousand microphones shipped in 1H18 to several million per month in 2019.
Maintain Add and target price ● Maintain Add and RM3.30 TP, based on 14.4x CY20F P/E, a 10% discount to the
target sector P/E of 16x. Key downside risks to our call are appreciation of the ringgit
vs. US$, and a slowdown in semiconductor industry demand.
SOURCES: CIMB RESEARCH, COMPANY REPORTS
Malaysia
ADD (no change)
Consensus ratings*: Buy 1 Hold 4 Sell 2
Current price: RM3.05
Target price: RM3.30
Previous target: RM3.30
Up/downside: 8.2%
CGS-CIMB / Consensus: 5.6%
Reuters: UNSM.KL
Bloomberg: UNI MK
Market cap: US$531.3m
RM2,218m
Average daily turnover: US$1.84m
RM7.66m
Current shares o/s 730.4m
Free float: 75.2% *Source: Bloomberg
Source: Bloomberg
Price performance 1M 3M 12M
Absolute (%) -6.2 -2.6 -9.8
Relative (%) -2 6.2 -3.1
Major shareholders % held John Chia 24.8
Insert
Analyst(s)
Mohd Shanaz NOOR AZAM
T (60) 3 2261 9078 E [email protected]
Financial Summary Dec-16A Dec-17A Dec-18F Dec-19F Dec-20F
Revenue (RMm) 1,323 1,466 1,403 1,494 1,562
Net Profit (RMm) 162.3 159.5 108.5 132.5 170.2
Core EPS (RM) 0.21 0.23 0.15 0.18 0.23
Core EPS Growth (7.8%) 11.4% (35.0%) 22.1% 28.5%
FD Core P/E (x) 14.85 13.34 20.53 16.81 13.09
Price To Sales (x) 1.68 1.52 1.59 1.49 1.43
DPS (RM) 0.11 0.11 0.10 0.12 0.14
Dividend Yield 3.62% 3.62% 3.29% 3.95% 4.61%
EV/EBITDA (x) 5.92 5.48 6.43 5.28 4.27
P/FCFE (x) 8.81 11.63 22.13 13.69 8.84
Net Gearing (14.2%) (20.8%) (22.4%) (27.0%) (35.5%)
P/BV (x) 1.58 1.53 1.49 1.45 1.39
ROE 10.8% 11.6% 7.4% 8.8% 10.8%
% Change In Core EPS Estimates 0% 0% 0%
CIMB/consensus EPS (x) 1.14 1.06 1.24
36.0
50.0
64.0
78.0
92.0
106.0
1.40
1.90
2.40
2.90
3.40
3.90
Price Close Relative to FBMKLCI (RHS)
10
20
30
Dec-17 Mar-18 Jun-18 Sep-18
Vo
l m

Semiconductor │ Malaysia
Unisem │ December 19, 2018
31
BY THE NUMBERS
SOURCES: CIMB RESEARCH, COMPANY REPORTS
Profit & Loss
(RMm) Dec-17A Dec-18F Dec-19F Dec-20F
Total Net Revenues 1,466 1,403 1,494 1,562
Gross Profit 1,466 1,403 1,494 1,562
Operating EBITDA 352 295 345 390
Depreciation And Amortisation (168) (173) (189) (190)
Operating EBIT 184 122 156 200
Financial Income/(Expense) 3 3 3 5
Pretax Income/(Loss) from Assoc. 0 0 0 0
Non-Operating Income/(Expense) 0 0 0 0
Profit Before Tax (pre-EI) 187 125 160 205
Exceptional Items (6) 0
Pre-tax Profit 181 125 160 205
Taxation (19) (15) (26) (33)
Exceptional Income - post-tax
Profit After Tax 161 110 134 172
Minority Interests (2) (1) (2) (2)
Preferred Dividends
FX Gain/(Loss) - post tax
Other Adjustments - post-tax
Net Profit 159 108 132 170
Recurring Net Profit 167 108 132 170
Fully Diluted Recurring Net Profit 167 108 132 170
Balance Sheet
(RMm) Dec-17A Dec-18F Dec-19F Dec-20F
Total Cash And Equivalents 349 381 462 618
Total Debtors 187 179 191 200
Inventories 163 156 166 173
Total Other Current Assets 26 26 26 26
Total Current Assets 725 742 845 1,017
Fixed Assets 1,118 1,125 1,086 996
Total Investments 0 0 0 0
Intangible Assets 1 1 1 1
Total Other Non-Current Assets 1 1 1 1
Total Non-current Assets 1,121 1,127 1,088 998
Short-term Debt 36 36 36 36
Current Portion of Long-Term Debt
Total Creditors 280 268 285 298
Other Current Liabilities 5 5 5 5
Total Current Liabilities 320 308 326 339
Total Long-term Debt 9 9 9 9
Hybrid Debt - Debt Component
Total Other Non-Current Liabilities 8 8 8 8
Total Non-current Liabilities 17 17 17 17
Total Provisions 45 45 45 45
Total Liabilities 382 370 388 401
Shareholders' Equity 1,455 1,491 1,535 1,602
Minority Interests 7 9 10 12
Total Equity 1,463 1,499 1,545 1,615
Cash Flow
(RMm) Dec-17A Dec-18F Dec-19F Dec-20F
EBITDA 352.1 295.3 345.1 390.3
Cash Flow from Invt. & Assoc.
Change In Working Capital 27.3 3.0 (4.4) (3.3)
(Incr)/Decr in Total Provisions
Other Non-Cash (Income)/Expense
Other Operating Cashflow
Net Interest (Paid)/Received (2.3) (2.7) (2.5) (2.2)
Tax Paid (29.0) (15.0) (25.5) (32.8)
Cashflow From Operations 348.0 280.6 312.7 352.0
Capex (156.5) (180.0) (150.0) (100.0)
Disposals Of FAs/subsidiaries
Acq. Of Subsidiaries/investments
Other Investing Cashflow
Cash Flow From Investing (156.5) (180.0) (150.0) (100.0)
Debt Raised/(repaid)
Proceeds From Issue Of Shares
Shares Repurchased
Dividends Paid (80.7) (73.4) (88.1) (102.7)
Preferred Dividends
Other Financing Cashflow (2.3) (2.7) (2.5) (2.2)
Cash Flow From Financing (83.0) (76.1) (90.5) (105.0)
Total Cash Generated 108.5 24.6 72.2 147.0
Free Cashflow To Equity 191.5 100.6 162.7 252.0
Free Cashflow To Firm 193.9 103.3 165.2 254.2
Key Ratios
Dec-17A Dec-18F Dec-19F Dec-20F
Revenue Growth 10.8% (4.3%) 6.5% 4.6%
Operating EBITDA Growth 2.6% (16.1%) 16.9% 13.1%
Operating EBITDA Margin 24.0% 21.0% 23.1% 25.0%
Net Cash Per Share (RM) 0.42 0.46 0.57 0.78
BVPS (RM) 1.99 2.04 2.10 2.19
Gross Interest Cover 79.69 45.27 63.23 89.19
Effective Tax Rate 10.7% 12.0% 16.0% 16.0%
Net Dividend Payout Ratio 48.7% 67.6% 66.5% 60.4%
Accounts Receivables Days 50.62 47.73 45.25 45.79
Inventory Days N/A N/A N/A N/A
Accounts Payables Days N/A N/A N/A N/A
ROIC (%) 14.6% 10.1% 12.8% 17.0%
ROCE (%) 12.4% 8.1% 10.1% 12.4%
Return On Average Assets 9.09% 5.76% 6.87% 8.48%
6.3
8.3
10.3
12.3
14.3
16.3
18.3
20.3
22.3
24.3
26.3
Jan-14A Jan-15A Jan-16A Jan-17A Jan-18F
12-mth Fwd FD P/E (x) - Unisem Key Drivers
Dec-17A Dec-18F Dec-19F Dec-20F
ASP Change (%, Main Product) N/A N/A N/A N/A
Unit sales growth (%, main prod) 9.9% 10.6% -1.0% 1.0%
No. Of Lines (main Product) N/A N/A N/A N/A
Rev per line (US$, main prod) 0.2 0.2 0.2 0.2
ASP chg (%, 2ndary prod) N/A N/A N/A N/A
Unit sales grth (%, 2ndary prod) N/A N/A N/A N/A
No. Of Lines (secondary Product) N/A N/A N/A N/A
Rev per line (US$, 2ndary prod) N/A N/A N/A N/A

Company Brief Rubber Gloves │ Singapore │ December 17, 2018 Shariah Compliant
IMPORTANT DISCLOSURES, INCLUDING ANY REQUIRED RESEARCH CERTIFICATIONS, ARE PROVIDED AT THE END OF THIS REPORT. IF THIS REPORT IS DISTRIBUTED IN THE UNITED STATES IT IS DISTRIBUTED BY CGS-CIMB SECURITIES (USA), INC. AND IS CONSIDERED THIRD-PARTY AFFILIATED RESEARCH.
Powered by the EFA Platform
Riverstone Holdings
Growing capacity; beneficiary of trade war
■ Perceived rubber glove play looks sheltered from trade-war fallout with c.50% of sales fuelled by healthcare glove consumption in the US and Europe.
■ The structural shift from vinyl gloves (produced in China) to nitrile could possibly be exacerbated amid tariffs on vinyl, favouring Riverstone.
■ Maintain Add. Our TP of S$1.30 is based on 16.7x FY19F P/E.
Perceived rubber glove play sheltered from trade war ● Riverstone is a Malaysia-based rubber glove play that could offer some shelter from
the trade war, in view of resilient demand for its nitrile rubber gloves.
● Sales to the US are trending upwards and formed 19% of Riverstone’s FY17 sales at
RM159m. More stringent US Pharmacopeia (USP) Convention standards (requires
double-gloving for workers handling hazardous drugs) that will come into effect in Dec
2019 could fuel US demand further.
● China accounted for c.7% of FY17 sales at RM55m, comprising mainly gloves and
cleanroom consumables.
● Riverstone’s annual glove capacity is set to expand 18% to 9bn pieces by end-FY18F
and another 16% to 10.4bn by end-FY19F. This underpins our c.14% CAGR in our
FY18-20F sales growth forecasts.
Tariffs could possibly exacerbate shift from vinyl towards nitrile ● With nitrile gloves accounting for 94% of its FY17 sales, Riverstone is benefiting from
a structural shift away from vinyl (PVC) gloves produced in China towards nitrile
gloves globally as China tackles air pollution and curbs vinyl glove manufacturers’
production.
● Though medical gloves are not included in the US tariff list, tariffs on finished goods
containing PVC could dampen the demand for PVC in China. This could exacerbate
production cuts for PVC-based goods (including gloves) and facilitate the shift towards
nitrile gloves, which we believe could benefit Riverstone.
Healthy balance sheet to boot ● At end-Sep 18, Riverstone had a net cash position of RM86m, supporting further
capacity expansion without running into any solvency risk.
● We project 3% dividend yield in FY19-20F, based on a conservative c.40% payout and
supported by 12-22% EPS growth forecasts in the same period.
Maintain Add ● At 16x FY19 P/E, we see Riverstone as a laggard play, trading at c.22% discount to
Malaysian peers’ average of 20x.
● We retain our Add call and TP of S$1.30, pegged to 16.7x FY19F P/E that represents
16% discount to its Malaysia peers’ average.
● Re-rating catalysts could come from better-than-expected margins and earnings
growth. Increase in raw material costs remains a key risk.
SOURCES: CGS-CIMB RESEARCH, COMPANY REPORTS
Singapore
ADD (no change)
Consensus ratings*: Buy 1 Hold 1 Sell 0
Current price: S$1.17
Target price: S$1.30
Previous target: S$1.30
Up/downside: 11.1%
CGS-CIMB / Consensus: 5.3%
Reuters: RVHL.SI
Bloomberg: RSTON SP
Market cap: US$629.9m
S$867.1m
Average daily turnover: US$0.09m
S$0.12m
Current shares o/s 741.1m
Free float: 32.6% *Source: Bloomberg
Source: Bloomberg
Price performance 1M 3M 12M
Absolute (%) 6.4 2.6 13.6
Relative (%) 5.3 5.3 24
Major shareholders % held Ringlet Investment Limited 50.8
Lee Wai Keong 10.9
Wong Teck Choon 3.2
Insert
Analyst(s)
Colin TAN
T (65) 6210 8685 E [email protected]
Financial Summary Dec-16A Dec-17A Dec-18F Dec-19F Dec-20F
Revenue (RMm) 655 817 920 1,083 1,204
Operating EBITDA (RMm) 167.9 184.2 208.1 248.3 276.4
Net Profit (RMm) 120.4 129.3 139.4 170.3 191.2
Core EPS (RM) 0.16 0.17 0.19 0.23 0.26
Core EPS Growth (4.9%) 7.4% 7.8% 22.2% 12.2%
FD Core P/E (x) 21.91 20.40 18.92 15.48 13.79
DPS (RM) 0.06 0.07 0.08 0.09 0.10
Dividend Yield 1.82% 1.97% 2.11% 2.58% 2.90%
EV/EBITDA (x) 15.09 13.83 12.22 10.04 8.77
P/FCFE (x) 117.8 43.6 47.2 25.1 19.2
Net Gearing (18.6%) (14.1%) (13.0%) (17.2%) (22.3%)
P/BV (x) 4.76 4.16 3.65 3.15 2.75
ROE 23.2% 21.8% 20.6% 21.9% 21.3%
CIMB/consensus EPS (x) 1.02 1.04 1.07
84.0
98.3
112.6
126.9
0.900
1.000
1.100
1.200
Price Close Relative to FSSTI (RHS)
2
4
6
Dec-17 Mar-18 Jun-18 Sep-18
Vo
l m

Rubber Gloves │ Singapore
Riverstone Holdings │ December 17, 2018
33
BY THE NUMBERS
SOURCES: CGS-CIMB RESEARCH, COMPANY REPORTS
Profit & Loss
(RMm) Dec-17A Dec-18F Dec-19F Dec-20F
Total Net Revenues 817.4 920.4 1,083.1 1,203.6
Gross Profit 197.8 202.5 255.6 284.1
Operating EBITDA 184.2 208.1 248.3 276.4
Depreciation And Amortisation (34.5) (44.8) (48.7) (52.3)
Operating EBIT 149.7 163.2 199.6 224.1
Financial Income/(Expense) 1.1 0.8 0.8 0.8
Pretax Income/(Loss) from Assoc. 0.0 0.0 0.0 0.0
Non-Operating Income/(Expense) 0.0 0.0 0.0 0.0
Profit Before Tax (pre-EI) 150.8 164.0 200.4 224.9
Exceptional Items
Pre-tax Profit 150.8 164.0 200.4 224.9
Taxation (21.5) (24.6) (30.1) (33.7)
Exceptional Income - post-tax
Profit After Tax 129.3 139.4 170.3 191.2
Minority Interests 0.0 0.0 0.0 0.0
Preferred Dividends
FX Gain/(Loss) - post tax
Other Adjustments - post-tax
Net Profit 129.3 139.4 170.3 191.2
Recurring Net Profit 129.3 139.4 170.3 191.2
Fully Diluted Recurring Net Profit 129.3 139.4 170.3 191.2
Balance Sheet
(RMm) Dec-17A Dec-18F Dec-19F Dec-20F
Total Cash And Equivalents 114.3 119.0 169.1 238.8
Total Debtors 160.3 191.9 223.1 246.2
Inventories 71.1 98.3 113.4 126.0
Total Other Current Assets 5.5 5.5 5.5 5.5
Total Current Assets 351.1 414.8 511.1 616.5
Fixed Assets 419.8 460.0 496.3 529.0
Total Investments 0.0 0.0 0.0 0.0
Intangible Assets 0.0 0.0 0.0 0.0
Total Other Non-Current Assets 9.7 9.7 9.7 9.7
Total Non-current Assets 429.6 469.7 506.0 538.7
Short-term Debt 6.0 6.0 6.0 6.0
Current Portion of Long-Term Debt
Total Creditors 101.7 118.0 136.0 151.2
Other Current Liabilities 8.4 8.4 8.4 8.4
Total Current Liabilities 116.2 132.5 150.5 165.6
Total Long-term Debt 19.0 19.0 19.0 19.0
Hybrid Debt - Debt Component
Total Other Non-Current Liabilities 0.2 0.2 0.2 0.2
Total Non-current Liabilities 19.2 19.2 19.2 19.2
Total Provisions 11.0 11.0 11.0 11.0
Total Liabilities 146.4 162.7 180.7 195.8
Shareholders' Equity 634.3 721.8 836.4 959.4
Minority Interests
Total Equity 634.3 721.8 836.4 959.4
Cash Flow
(RMm) Dec-17A Dec-18F Dec-19F Dec-20F
EBITDA 184.2 208.1 248.3 276.4
Cash Flow from Invt. & Assoc.
Change In Working Capital (11.9) (42.6) (28.2) (20.6)
(Incr)/Decr in Total Provisions
Other Non-Cash (Income)/Expense
Other Operating Cashflow (6.6) (0.8) (0.8) (0.8)
Net Interest (Paid)/Received 1.1 0.8 0.8 0.8
Tax Paid (21.3) (24.6) (30.1) (33.7)
Cashflow From Operations 145.7 140.9 190.1 222.0
Capex (111.3) (85.0) (85.0) (85.0)
Disposals Of FAs/subsidiaries 1.0 0.0 0.0 0.0
Acq. Of Subsidiaries/investments
Other Investing Cashflow 0.0 0.0 0.0 0.0
Cash Flow From Investing (110.3) (85.0) (85.0) (85.0)
Debt Raised/(repaid) 25.0 0.0 0.0 0.0
Proceeds From Issue Of Shares 0.0 0.0 0.0 0.0
Shares Repurchased 0.0 0.0 0.0 0.0
Dividends Paid (48.1) (51.9) (55.8) (68.1)
Preferred Dividends
Other Financing Cashflow 0.0 0.0 0.0 0.0
Cash Flow From Financing (23.1) (51.9) (55.8) (68.1)
Total Cash Generated 12.3 4.0 49.3 68.9
Free Cashflow To Equity 60.4 55.9 105.1 137.0
Free Cashflow To Firm 36.4 56.7 105.9 137.8
Key Ratios
Dec-17A Dec-18F Dec-19F Dec-20F
Revenue Growth 24.8% 12.6% 17.7% 11.1%
Operating EBITDA Growth 9.7% 12.9% 19.3% 11.3%
Operating EBITDA Margin 22.5% 22.6% 22.9% 23.0%
Net Cash Per Share (RM) 0.12 0.13 0.19 0.29
BVPS (RM) 0.86 0.97 1.13 1.29
Gross Interest Cover 146 204 249 280
Effective Tax Rate 14.3% 15.0% 15.0% 15.0%
Net Dividend Payout Ratio 40.1% 40.0% 40.0% 40.0%
Accounts Receivables Days 63.67 63.72 64.74 66.68
Inventory Days 40.67 43.08 46.69 47.63
Accounts Payables Days 56.61 55.86 56.03 57.15
ROIC (%) 26.8% 24.4% 25.9% 26.4%
ROCE (%) 24.5% 23.1% 24.7% 24.2%
Return On Average Assets 17.7% 16.7% 17.8% 17.5%
4.7
9.7
14.7
19.7
24.7
29.7
34.7
39.7
Jan-14A Jan-15A Jan-16A Jan-17A Jan-18F
12-mth Fwd FD P/E (x)
Kossan Rubber Industries Riverstone Holdings Supermax Corp
Key Drivers
Dec-17A Dec-18F Dec-19F Dec-20F
ASP (% chg, main prod./serv.) N/A N/A N/A N/A
Unit sales grth (%, main prod./serv.) 20.2% 14.3% 11.0% 11.2%
Util. rate (%, main prod./serv.) N/A N/A N/A N/A
ASP (% chg, 2ndary prod./serv.) N/A N/A N/A N/A
Unit sales grth (%,2ndary prod/serv) 20.2% 23.0% 19.0% 11.2%
Util. rate (%, 2ndary prod/serv) N/A N/A N/A N/A
Unit raw mat ASP (%chg,main) N/A N/A N/A N/A
Unit raw mat ASP (%chg,2ndary) N/A N/A N/A N/A

Company Brief Technology Components │ Thailand │ December 17, 2018
IMPORTANT DISCLOSURES, INCLUDING ANY REQUIRED RESEARCH CERTIFICATIONS, ARE PROVIDED AT THE END OF THIS REPORT. IF THIS REPORT IS DISTRIBUTED IN THE UNITED STATES IT IS DISTRIBUTED BY CGS-CIMB SECURITIES (USA), INC. AND IS CONSIDERED THIRD-PARTY AFFILIATED RESEARCH.
Powered by the EFA Platform
Delta Electronics (Thailand)
Marching steadily forward
■ We retain our positive outlook on DELTA and expect robust earnings growth in FY19F, thanks to its unique exposure to data centres and electric vehicles.
■ We believe DELTA stands to benefit from the trade war between the US and China.
■ Maintain Add with an end-19 target price of THB87, based on 15x FY20F P/E (-0.5 s.d. from its historical mean).
Demand for data centre components likely to stay strong in FY19F ● We believe the demand for servers will remain strong in FY19F, driven by exponential
growth in data usage and investments in data storage facilities.
● We believe the need for more data infrastructure is the result of the prevalence of
social media, e-commerce and other technologies, such as Internet of Things (IOT),
the 5G network and artificial intelligence, which require massive computing power as
well as large data storage infrastructure.
Automotive to remain the key earnings driver in the next 5 years ● We reiterate our strong positive view as we expect an increase in the number of
electric vehicles (EV) across the world which should have a positive impact on DELTA.
● Unlike its local peers whose businesses focus on traditional cars, DELTA is unaffected
by the environmental regulations in China and Worldwide Harmonised Light Vehicle
Test Procedure (WLTP) in Europe as its automotive exposure is to the EV industry.
● With DELTA expanding facilities to cater to the increasing demand for automotive
power supply (APS) products, we believe the company is poised to benefit from the
increasing number of EV cars produced across the globe amid tightening
environmental regulations worldwide.
A clear trade war beneficiary ● We note the US has levied a 25% import tariff on power supply parts from China for
automatic data processing machines (HTS Codes: 8504.40.60, 8504.40.70)
● We believe DELTA can be a substitute supplier for these products from its production
facilities in Thailand.
● Moreover, we believe the EV market is relatively shielded from the trade war as EVs
have become increasingly prevalent in China, and sales significantly increased in 2018
due to the central and local government subsidies for EV purchases in China.
Maintain Add with an end-19 target price of THB87 ● We maintain our Add rating for DELTA with an end-19 target price of THB87.00, based
on 15x FY20F P/E (-0.5 s.d. from DELTA’s 5-year historical mean).
● We believe a potential re-rating catalyst is strong capex momentum at large tech
companies, while a key risk to our call is a potential slowdown in Chinese EV industry.
SOURCES: CGS-CIMB RESEARCH, COMPANY REPORTS
Thailand
ADD (no change)
Consensus ratings*: Buy 8 Hold 4 Sell 3
Current price: THB69.25
Target price: THB87.00
Previous target: THB87.00
Up/downside: 25.6%
CGS-CIMB / Consensus: 12.7%
Reuters: DELT.BK
Bloomberg: DELTA TB
Market cap: US$2,633m
THB86,381m
Average daily turnover: US$1.77m
THB58.02m
Current shares o/s 1,247m
Free float: 36.9% *Source: Bloomberg
Source: Bloomberg
Price performance 1M 3M 12M
Absolute (%) 0.4 -0.7 -11.8
Relative (%) 3 5.9 -5.6
Major shareholders % held Deltron Holding Ltd 27.7
Delta Electronics Taiwan 20.0
Insert
Analyst(s)
Kitichan SIRISUKARCHA, CFP
T (66) 2 761 9232 E [email protected]
Financial Summary Dec-16A Dec-17A Dec-18F Dec-19F Dec-20F
Revenue (THBm) 46,887 49,269 53,157 61,983 71,030
Net Profit (THBm) 5,516 4,929 5,650 6,392 7,250
Core EPS (THB) 4.28 4.65 4.41 5.12 5.81
Core EPS Growth (15.4%) 8.8% (5.3%) 16.3% 13.4%
FD Core P/E (x) 16.20 14.88 15.71 13.51 11.91
Price To Sales (x) 1.84 1.75 1.63 1.39 1.22
DPS (THB) 3.10 3.00 2.20 2.60 3.00
Dividend Yield 4.48% 4.33% 3.18% 3.75% 4.33%
EV/EBITDA (x) 11.03 10.32 9.95 8.64 7.50
P/FCFE (x) 23.60 39.95 12.06 26.85 14.62
Net Gearing (62.1%) (53.3%) (58.9%) (56.3%) (56.2%)
P/BV (x) 2.71 2.66 2.38 2.30 2.09
ROE 17.1% 18.0% 16.0% 17.3% 18.4%
CIMB/consensus EPS (x) 1.04 1.02 1.04
77.0
87.0
97.0
107.0
53.0
63.0
73.0
83.0
Price Close Relative to SET (RHS)
5
10
Dec-17 Mar-18 Jun-18 Sep-18
Vo
l m

Technology Components │ Thailand
Delta Electronics (Thailand) │ December 17, 2018
35
BY THE NUMBERS
SOURCES: CGS-CIMB RESEARCH, COMPANY REPORTS
Profit & Loss
(THBm) Dec-17A Dec-18F Dec-19F Dec-20F
Total Net Revenues 49,269 53,157 61,983 71,030
Gross Profit 13,669 13,707 16,228 18,372
Operating EBITDA 6,694 6,530 7,550 8,428
Depreciation And Amortisation (1,123) (1,341) (1,416) (1,343)
Operating EBIT 5,571 5,190 6,134 7,085
Financial Income/(Expense) 173 173 165 170
Pretax Income/(Loss) from Assoc. 59 150 153 156
Non-Operating Income/(Expense) (598) 372 276 220
Profit Before Tax (pre-EI) 5,205 5,885 6,728 7,632
Exceptional Items
Pre-tax Profit 5,205 5,885 6,728 7,632
Taxation (276) (235) (336) (382)
Exceptional Income - post-tax
Profit After Tax 4,929 5,650 6,392 7,250
Minority Interests 0 0 0 0
Preferred Dividends
FX Gain/(Loss) - post tax
Other Adjustments - post-tax
Net Profit 4,929 5,650 6,392 7,250
Recurring Net Profit 5,804 5,498 6,392 7,250
Fully Diluted Recurring Net Profit 5,804 5,498 6,392 7,250
Balance Sheet
(THBm) Dec-17A Dec-18F Dec-19F Dec-20F
Total Cash And Equivalents 17,535 21,578 21,302 23,291
Total Debtors 10,468 11,417 13,313 15,256
Inventories 7,684 8,535 9,870 11,299
Total Other Current Assets 866 866 866 866
Total Current Assets 36,554 42,397 45,352 50,713
Fixed Assets 7,302 7,347 7,518 7,761
Total Investments 0 0 0 0
Intangible Assets 940 940 940 940
Total Other Non-Current Assets 1,358 353 353 353
Total Non-current Assets 9,600 8,641 8,812 9,055
Short-term Debt 229 183 146 117
Current Portion of Long-Term Debt 0 0 0 0
Total Creditors 10,480 11,761 13,699 15,654
Other Current Liabilities 1,127 1,127 1,127 1,127
Total Current Liabilities 11,836 13,071 14,972 16,898
Total Long-term Debt
Hybrid Debt - Debt Component
Total Other Non-Current Liabilities 423 423 423 418
Total Non-current Liabilities 423 423 423 418
Total Provisions 1,421 1,421 1,421 1,421
Total Liabilities 13,680 14,915 16,817 18,737
Shareholders' Equity 32,459 36,338 37,565 41,236
Minority Interests 15 0 0 0
Total Equity 32,474 36,338 37,565 41,236
Cash Flow
(THBm) Dec-17A Dec-18F Dec-19F Dec-20F
EBITDA 6,694 6,530 7,550 8,428
Cash Flow from Invt. & Assoc. 0 0 0 0
Change In Working Capital (1,028) (520) (1,292) (1,417)
(Incr)/Decr in Total Provisions 1 0 1 2
Other Non-Cash (Income)/Expense 2,483 2,833 (704) 1,239
Other Operating Cashflow (3,111) (795) (975) (952)
Net Interest (Paid)/Received 173 173 165 170
Tax Paid (276) (235) (336) (382)
Cashflow From Operations 4,936 7,986 4,408 7,089
Capex (2,378) (1,300) (1,500) (1,500)
Disposals Of FAs/subsidiaries
Acq. Of Subsidiaries/investments
Other Investing Cashflow (303) 524 346 349
Cash Flow From Investing (2,681) (776) (1,154) (1,151)
Debt Raised/(repaid) (92) (46) (37) (29)
Proceeds From Issue Of Shares
Shares Repurchased
Dividends Paid (3,742) (2,775) (3,164) (3,579)
Preferred Dividends
Other Financing Cashflow 200 0 0 0
Cash Flow From Financing (3,634) (2,821) (3,201) (3,609)
Total Cash Generated (1,380) 4,389 54 2,330
Free Cashflow To Equity 2,162 7,164 3,218 5,909
Free Cashflow To Firm 2,274 7,229 3,282 5,961
Key Ratios
Dec-17A Dec-18F Dec-19F Dec-20F
Revenue Growth 5.1% 7.9% 16.6% 14.6%
Operating EBITDA Growth 10.9% (2.4%) 15.6% 11.6%
Operating EBITDA Margin 13.6% 12.3% 12.2% 11.9%
Net Cash Per Share (THB) 13.87 17.15 16.96 18.58
BVPS (THB) 26.02 29.13 30.12 33.06
Gross Interest Cover 283.7 264.3 218.0 315.3
Effective Tax Rate 5.31% 4.00% 5.00% 5.00%
Net Dividend Payout Ratio 75.9% 49.1% 49.5% 49.4%
Accounts Receivables Days 78.40 75.14 72.82 73.61
Inventory Days 76.80 75.03 73.41 73.57
Accounts Payables Days 111.9 102.9 101.5 102.0
ROIC (%) 39.5% 30.5% 37.0% 39.3%
ROCE (%) 17.7% 15.5% 17.0% 18.4%
Return On Average Assets 10.3% 11.3% 11.8% 12.4%
10.0
12.0
14.0
16.0
18.0
20.0
22.0
Jan-14A Jan-15A Jan-16A Jan-17A Jan-18F
12-mth Fwd FD P/E (x) - Delta Electronics (Thailand) Key Drivers
Dec-17A Dec-18F Dec-19F Dec-20F
ASP Change (%, Main Product) 0.0% 0.0% 0.0% 0.0%
Unit sales growth (%, main prod) 5.1% 7.9% 16.6% 14.6%
No. Of Lines (main Product) N/A N/A N/A N/A
Rev per line (US$, main prod) N/A N/A N/A N/A
ASP chg (%, 2ndary prod) 0.0% 0.0% 0.0% 0.0%
Unit sales grth (%, 2ndary prod) 10.5% 12.3% 13.1% 14.6%
No. Of Lines (secondary Product) N/A N/A N/A N/A
Rev per line (US$, 2ndary prod) N/A N/A N/A N/A

Company Brief Auto Parts │ Thailand │ December 17, 2018
IMPORTANT DISCLOSURES, INCLUDING ANY REQUIRED RESEARCH CERTIFICATIONS, ARE PROVIDED AT THE END OF THIS REPORT. IF THIS REPORT IS DISTRIBUTED IN THE UNITED STATES IT IS DISTRIBUTED BY CGS-CIMB SECURITIES (USA), INC. AND IS CONSIDERED THIRD-PARTY AFFILIATED RESEARCH.
Powered by the EFA Platform
Somboon Advance Technology
A clear road ahead
■ We forecast SAT’s FY18 core earnings to be the highest in the past decade.
■ Strong auto domestic demand should drive SAT’s earnings going forward.
■ Our Add call and TP are intact. Potential dividend yield is over 6% in FY19F.
FY18 core earnings likely the highest in the past 10 years ● We expect core net profit of THB888m (+11% yoy) in FY18F while SAT earned
THB656m core net profit in 9M18 which accounted for 74% of our FY18F forecast. If
our forecast materialises, SAT’s FY18 core earnings will be the highest since 2008.
● The factors that drove earning growth this year included 1) higher sales from strong
auto production growth in FY18F, 2) efficient cost control, and 3) higher GPM (18% in
9M18 vs 15.9% in 9M17).
Strong support from auto industry growth ● We project Thailand auto production to rise 6.6% yoy in FY18F. We think SAT should
benefit from strong auto production growth as SAT supplies spare parts mainly for
commercial vehicles (CV). Its major clients include Mitsubishi, Toyota/Hino.
● In addition, Thailand has two big exhibitions a year to boost auto sales i.e. Motor Expo
(29 Nov – 10 Dec 18) and Motor Show (27 Mar 19 – 7 Apr 19) which typically generate
double-digit sales growth each year. We think it should be positive to SAT’s sales.
Higher revenue contribution expected from Kubota ● Agricultural machinery producer Kubota contributed 19% of SAT’s revenue in 9M18.
Kubota estimates its tractor production to increase 13.6% yoy in 2018, given strong
demand for tractor machinery in the domestic and export markets.
2019F outlook ● Recently, SAT received new orders to manufacture axle shafts for 1.5 tonne pick-up
trucks from foreign auto manufacturers. We expect these orders to generate some
c.THB70m revenue in 4Q18F and THB300m-350m p.a. over the next six years (the
typical cycle for a car model). However, SAT does not need to expand its production
facilities as it ran at 67% utilisation rate in 3Q18.
● SAT could benefit from the US-China trade dispute. For instance, if some Japanese
auto manufacturers relocate their manufacturing facilities from China to Thailand, they
may seek business partners in Thailand which would present SAT with an opportunity.
Maintain Add, target price of THB27.0 ● Maintain Add. Our target price of THB27.0 is based on 12x FY19F P/E (+1 s.d. of 5-
year average). Catalysts that could lift its share price further are 1) synergy with new
business partners in terms of cost savings, and 2) political stability.
● Downside risk to our call is weaker than expected demand for auto vehicles.
SOURCES: CGS-CIMB RESEARCH, COMPANY REPORTS
Thailand
ADD (no change)
Consensus ratings*: Buy 12 Hold 0 Sell 1
Current price: THB17.60
Target price: THB27.00
Previous target: THB27.00
Up/downside: 53.4%
CGS-CIMB / Consensus: 0.9%
Reuters: SAT.BK
Bloomberg: SAT TB
Market cap: US$228.1m
THB7,483m
Average daily turnover: US$0.54m
THB17.60m
Current shares o/s 425.2m
Free float: 58.1% *Source: Bloomberg
Source: Bloomberg
Price performance 1M 3M 12M
Absolute (%) -15.4 -24.1 -17.8
Relative (%) -12.8 -17.5 -11.6
Major shareholders % held Somboon Holding Co.,Ltd. 29.9
Thai Nvdr Co., Ltd. 13.9
Kitaphanich Family 10.0
Insert
Analyst(s)
Praphan YUKHUNTHORNTHAM
T (66) 2 761 9239 E [email protected]
Financial Summary Dec-16A Dec-17A Dec-18F Dec-19F Dec-20F
Revenue (THBm) 8,299 8,593 8,544 9,670 10,728
Operating EBITDA (THBm) 1,377 1,440 1,497 1,478 1,518
Net Profit (THBm) 608 811 888 960 1,065
Core EPS (THB) 1.44 1.64 2.09 2.26 2.51
Core EPS Growth (4.9%) 14.1% 27.4% 8.1% 10.9%
FD Core P/E (x) 12.25 10.73 8.43 7.79 7.02
DPS (THB) 0.60 0.90 1.00 1.15 1.25
Dividend Yield 3.41% 5.11% 5.70% 6.55% 7.12%
EV/EBITDA (x) 5.44 4.12 3.07 2.53 1.92
P/FCFE (x) 8.43 8.20 7.40 6.81 6.30
Net Gearing 6.0% (17.6%) (34.2%) (41.8%) (47.6%)
P/BV (x) 1.27 1.17 1.09 1.02 0.95
ROE 10.7% 11.3% 13.4% 13.5% 14.0%
CIMB/consensus EPS (x) 1.03 1.02 1.04
83.0
91.9
100.8
109.7
118.6
16.0
18.0
20.0
22.0
24.0
Price Close Relative to SET (RHS)
2
4
6
Dec-17 Mar-18 Jun-18 Sep-18
Vo
l m

Auto Parts │ Thailand
Somboon Advance Technology │ December 17, 2018
37
BY THE NUMBERS
SOURCES: CGS-CIMB RESEARCH, COMPANY REPORTS
Profit & Loss
(THBm) Dec-17A Dec-18F Dec-19F Dec-20F
Total Net Revenues 8,593 8,544 9,670 10,728
Gross Profit 2,120 2,110 2,168 2,290
Operating EBITDA 1,440 1,497 1,478 1,518
Depreciation And Amortisation (789) (693) (620) (563)
Operating EBIT 651 804 858 955
Financial Income/(Expense) (58) (45) (45) (44)
Pretax Income/(Loss) from Assoc. 92 126 139 146
Non-Operating Income/(Expense) 75 88 100 111
Profit Before Tax (pre-EI) 760 973 1,052 1,167
Exceptional Items 134 0 0 0
Pre-tax Profit 894 973 1,052 1,167
Taxation (83) (85) (91) (102)
Exceptional Income - post-tax
Profit After Tax 811 888 960 1,065
Minority Interests
Preferred Dividends
FX Gain/(Loss) - post tax
Other Adjustments - post-tax
Net Profit 811 888 960 1,065
Recurring Net Profit 697 888 960 1,065
Fully Diluted Recurring Net Profit 697 888 960 1,065
Balance Sheet
(THBm) Dec-17A Dec-18F Dec-19F Dec-20F
Total Cash And Equivalents 2,339 3,250 3,957 4,625
Total Debtors 1,519 1,466 1,659 1,841
Inventories 428 523 610 686
Total Other Current Assets 200 0 0 0
Total Current Assets 4,486 5,239 6,226 7,152
Fixed Assets 4,114 3,621 3,201 2,838
Total Investments 418 544 683 829
Intangible Assets 18 18 18 18
Total Other Non-Current Assets 536 187 187 187
Total Non-current Assets 5,085 4,370 4,089 3,872
Short-term Debt 200 0 0 0
Current Portion of Long-Term Debt 537 212 208 206
Total Creditors 1,216 1,169 1,363 1,533
Other Current Liabilities 511 464 488 476
Total Current Liabilities 2,465 1,845 2,059 2,215
Total Long-term Debt 469 693 685 679
Hybrid Debt - Debt Component
Total Other Non-Current Liabilities 218 217 245 272
Total Non-current Liabilities 687 910 930 951
Total Provisions 0 0 0 0
Total Liabilities 3,152 2,754 2,989 3,166
Shareholders' Equity 6,419 6,855 7,326 7,859
Minority Interests
Total Equity 6,419 6,855 7,326 7,859
Cash Flow
(THBm) Dec-17A Dec-18F Dec-19F Dec-20F
EBITDA 1,440 1,497 1,478 1,518
Cash Flow from Invt. & Assoc.
Change In Working Capital 70 (89) (86) (88)
(Incr)/Decr in Total Provisions
Other Non-Cash (Income)/Expense
Other Operating Cashflow 226 60 182 148
Net Interest (Paid)/Received (58) (45) (45) (44)
Tax Paid (83) (85) (91) 0
Cashflow From Operations 1,594 1,338 1,438 1,534
Capex 0 (200) (200) (200)
Disposals Of FAs/subsidiaries
Acq. Of Subsidiaries/investments (196) (126) (139) (146)
Other Investing Cashflow (486) (0) 0 (0)
Cash Flow From Investing (681) (327) (339) (346)
Debt Raised/(repaid)
Proceeds From Issue Of Shares 0 0 0 0
Shares Repurchased
Dividends Paid (251) (383) (426) (426)
Preferred Dividends
Other Financing Cashflow (643) (149) (28) (26)
Cash Flow From Financing (893) (531) (454) (452)
Total Cash Generated 19 479 646 737
Free Cashflow To Equity 913 1,011 1,100 1,189
Free Cashflow To Firm 971 1,056 1,144 1,233
Key Ratios
Dec-17A Dec-18F Dec-19F Dec-20F
Revenue Growth 3.5% (0.6%) 13.2% 10.9%
Operating EBITDA Growth 4.55% 3.97% (1.26%) 2.74%
Operating EBITDA Margin 16.8% 17.5% 15.3% 14.2%
Net Cash Per Share (THB) 2.66 5.52 7.21 8.80
BVPS (THB) 15.10 16.12 17.23 18.48
Gross Interest Cover 11.25 17.76 19.20 21.58
Effective Tax Rate 9.30% 8.70% 8.68% 8.75%
Net Dividend Payout Ratio 56.5% 48.0% 51.0% 50.0%
Accounts Receivables Days 62.63 63.77 58.99 59.71
Inventory Days 29.68 26.98 27.57 28.11
Accounts Payables Days 66.32 67.65 61.61 62.81
ROIC (%) 10.5% 15.8% 20.5% 25.0%
ROCE (%) 8.5% 10.4% 10.7% 11.3%
Return On Average Assets 7.7% 9.7% 10.1% 10.4%
2.9
4.9
6.9
8.9
10.9
12.9
14.9
Jan-14A Jan-15A Jan-16A Jan-17A Jan-18F
12-mth Fwd FD P/E (x)
AAPICO Hitech PCL Somboon Advance Technology
Key Drivers
Dec-17A Dec-18F Dec-19F Dec-20F
ASP (% chg, main prod./serv.) N/A N/A N/A N/A
Unit sales grth (%, main prod./serv.) -0.7% 7.4% 13.4% 9.7%
Util. rate (%, main prod./serv.) N/A N/A N/A N/A
ASP (% chg, 2ndary prod./serv.) N/A N/A N/A N/A
Unit sales grth (%,2ndary prod/serv) 8.9% 5.7% 8.7% 4.5%
Util. rate (%, 2ndary prod/serv) N/A N/A N/A N/A
Unit raw mat ASP (%chg,main) N/A N/A N/A N/A
Unit raw mat ASP (%chg,2ndary) N/A N/A N/A N/A
Total Export Sales Growth (%) N/A N/A N/A N/A
Export Sales/total Sales (%) N/A N/A N/A N/A

Company Brief Technology Components │ Thailand │ December 17, 2018
IMPORTANT DISCLOSURES, INCLUDING ANY REQUIRED RESEARCH CERTIFICATIONS, ARE PROVIDED AT THE END OF THIS REPORT. IF THIS REPORT IS DISTRIBUTED IN THE UNITED STATES IT IS DISTRIBUTED BY CGS-CIMB SECURITIES (USA), INC. AND IS CONSIDERED THIRD-PARTY AFFILIATED RESEARCH.
Powered by the EFA Platform
Hana Microelectronics
Still not out of the woods
■ We believe HANA’s strong sales growth and GPM momentum in 3Q18 are unlikely to sustain given the current weak semiconductor outlook.
■ While easing trade war tensions could help improve the sentiment for HANA given its semiconductor exposure, we see limited gains.
■ We remain cautious on its outlook for the next 3-6 months. Maintain Hold and TP of THB38, based on 11.5x FY20F P/E (-1 s.d. from 5-year mean).
Growth driven mainly by customers’ market share consolidation ● Sales growth in printed circuit board assembly (PCBA) remained robust in 3Q18,
driven by strong auto and chip testing demand. Integrated circuit (IC) sales growth was
attributable largely to higher volumes from customers’ M&A activities.
● We expect a slowdown in HANA’s revenue growth in FY19F as the momentum of
order inflows from consolidation activities subside.
● While the 90-day halt on additional tariffs by the US on Chinese imports could lift the
sentiment for HANA, we see limited direct benefits for the company due to its low US
exposure.
Weakening economic outlook in China poses risks for automotive ● Despite a relatively low direct exposure to the supply chains between the US and
China, HANA is vulnerable to China’s economic outlook due to its high exposure to
China.
● We see risks to HANA’s automotive segment, given China's domestic passenger car
sales (all brands) contracted by 12.6% yoy in Nov 2018, the largest monthly decline in
six years.
● We believe this is due to weakening consumer confidence amid escalating US-China
trade conflict, falling equity prices and a softening property market.
● As such, we are concerned about an eventual demand slowdown in China, should the
US-China trade war escalate in FY19F.
US automotive tariffs on EU imports could further hurt HANA ● We observed that both Germany car production and exports fell by 22% in Nov 2018.
● In 2017, the US was the biggest export destination for European cars. However, if the
25% import tariff is implemented by the US, we believe it could lead to a further
slowdown in the EU car industry which could hurt HANA.
Maintain Hold with an end-19F target price of THB38 ● We remain conservative on HANA's outlook for the next 3-6 months as semiconductor
demand has started to show signs of stagnation.
● We maintain our Hold call on HANA with an end-19F target price of THB38, based on
11.5x FY20F P/E (-1 s.d. from its 5-year mean).
● Stronger-than-expected growth in its automotive and smartphone segments is a
potential re-rating catalyst; an escalation of the US-China trade conflict is a key risk.
SOURCES: CGS-CIMB RESEARCH, COMPANY REPORTS
Thailand
HOLD (no change)
Consensus ratings*: Buy 10 Hold 4 Sell 1
Current price: THB35.00
Target price: THB38.00
Previous target: THB38.00
Up/downside: 8.6%
CGS-CIMB / Consensus: -9.3%
Reuters: HANA.BK
Bloomberg: HANA TB
Market cap: US$858.7m
THB28,171m
Average daily turnover: US$3.37m
THB110.4m
Current shares o/s 804.9m
Free float: 49.7% *Source: Bloomberg
Source: Bloomberg
Price performance 1M 3M 12M
Absolute (%) 5.3 -13.6 -26.3
Relative (%) 7.9 -7 -20.1
Major shareholders % held OMAC (HK) LIMITED 21.4
CREDIT SUISSE AG, SINGAPORE BRANCH
10.5
Thai NVDR 7.3
Insert
Analyst(s)
Kitichan SIRISUKARCHA, CFP
T (66) 2 761 9232 E [email protected]
Financial Summary Dec-16A Dec-17A Dec-18F Dec-19F Dec-20F
Revenue (THBm) 20,523 21,551 22,292 24,381 26,649
Net Profit (THBm) 2,105 2,888 2,174 2,348 2,675
Core EPS (THB) 2.52 2.93 2.62 2.92 3.32
Core EPS Growth (12.9%) 16.3% (10.5%) 11.3% 13.9%
FD Core P/E (x) 13.90 11.95 13.35 12.00 10.53
Price To Sales (x) 1.37 1.31 1.26 1.16 1.06
DPS (THB) 2.00 2.00 2.00 2.00 2.00
Dividend Yield 5.71% 5.71% 5.71% 5.71% 5.71%
EV/EBITDA (x) 5.67 4.65 5.45 5.09 4.41
P/FCFE (x) 10.03 27.84 12.68 21.16 16.94
Net Gearing (48.3%) (44.8%) (47.0%) (44.9%) (45.9%)
P/BV (x) 1.48 1.38 1.35 1.30 1.24
ROE 10.8% 11.9% 10.2% 11.0% 12.1%
CIMB/consensus EPS (x) 1.03 0.96 1.00
60.0
71.3
82.5
93.8
105.0
29.0
34.0
39.0
44.0
49.0
Price Close Relative to SET (RHS)
5
10
15
20
Dec-17 Mar-18 Jun-18 Sep-18
Vo
l m

Technology Components │ Thailand
Hana Microelectronics │ December 17, 2018
39
BY THE NUMBERS
SOURCES: CGS-CIMB RESEARCH, COMPANY REPORTS
Profit & Loss
(THBm) Dec-17A Dec-18F Dec-19F Dec-20F
Total Net Revenues 22,583 23,120 24,959 27,280
Gross Profit 5,330 5,105 5,270 5,712
Operating EBITDA 4,110 3,389 3,646 4,050
Depreciation And Amortisation (1,083) (1,101) (1,160) (1,219)
Operating EBIT 3,027 2,289 2,486 2,831
Financial Income/(Expense) (7) (7) (7) (7)
Pretax Income/(Loss) from Assoc. 0 0 0 0
Non-Operating Income/(Expense) 0 0 0 0
Profit Before Tax (pre-EI) 3,020 2,281 2,479 2,823
Exceptional Items 0 0 0 0
Pre-tax Profit 3,020 2,281 2,479 2,823
Taxation (132) (107) (130) (148)
Exceptional Income - post-tax
Profit After Tax 2,888 2,174 2,348 2,675
Minority Interests
Preferred Dividends
FX Gain/(Loss) - post tax
Other Adjustments - post-tax
Net Profit 2,888 2,174 2,348 2,675
Recurring Net Profit 2,357 2,110 2,348 2,675
Fully Diluted Recurring Net Profit 2,357 2,110 2,348 2,675
Balance Sheet
(THBm) Dec-17A Dec-18F Dec-19F Dec-20F
Total Cash And Equivalents 9,274 9,924 9,810 10,515
Total Debtors 3,904 3,861 4,223 4,616
Inventories 4,083 4,000 4,375 4,782
Total Other Current Assets 632 632 632 632
Total Current Assets 17,893 18,418 19,040 20,544
Fixed Assets 6,066 5,915 6,337 6,268
Total Investments 138 138 138 138
Intangible Assets 50 50 50 50
Total Other Non-Current Assets 256 256 256 256
Total Non-current Assets 6,510 6,359 6,781 6,712
Short-term Debt 0 0 0 0
Current Portion of Long-Term Debt 0 0 0 0
Total Creditors 2,921 2,976 3,246 3,548
Other Current Liabilities 465 465 465 465
Total Current Liabilities 3,386 3,441 3,711 4,012
Total Long-term Debt 0 0 0 0
Hybrid Debt - Debt Component
Total Other Non-Current Liabilities 327 327 327 327
Total Non-current Liabilities 327 327 327 327
Total Provisions 0 0 0 0
Total Liabilities 3,713 3,768 4,038 4,340
Shareholders' Equity 20,476 20,903 21,642 22,707
Minority Interests 214 214 214 214
Total Equity 20,690 21,117 21,856 22,921
Cash Flow
(THBm) Dec-17A Dec-18F Dec-19F Dec-20F
EBITDA 4,110 3,389 3,646 4,050
Cash Flow from Invt. & Assoc. 0 0 0 0
Change In Working Capital (581) 71 (1,007) (1,101)
(Incr)/Decr in Total Provisions 0 0 0 0
Other Non-Cash (Income)/Expense
Other Operating Cashflow (327) (497) (387) (387)
Net Interest (Paid)/Received (7) (7) (7) (7)
Tax Paid 0 0 0 0
Cashflow From Operations 3,195 2,956 2,245 2,554
Capex (943) (950) (1,150) (1,150)
Disposals Of FAs/subsidiaries 16 0 0 0
Acq. Of Subsidiaries/investments
Other Investing Cashflow (1,256) 216 237 259
Cash Flow From Investing (2,183) (734) (913) (891)
Debt Raised/(repaid) 0 0 0 0
Proceeds From Issue Of Shares 0 0 0 0
Shares Repurchased
Dividends Paid (1,610) (1,610) (1,610) (1,610)
Preferred Dividends
Other Financing Cashflow 0 0 0 0
Cash Flow From Financing (1,610) (1,610) (1,610) (1,610)
Total Cash Generated (598) 613 (278) 53
Free Cashflow To Equity 1,012 2,223 1,332 1,663
Free Cashflow To Firm 1,019 2,230 1,339 1,670
Key Ratios
Dec-17A Dec-18F Dec-19F Dec-20F
Revenue Growth 5.01% 3.44% 9.37% 9.30%
Operating EBITDA Growth 19.8% (17.5%) 7.6% 11.1%
Operating EBITDA Margin 19.1% 15.2% 15.0% 15.2%
Net Cash Per Share (THB) 11.52 12.33 12.19 13.06
BVPS (THB) 25.44 25.97 26.89 28.21
Gross Interest Cover 415.6 314.2 341.3 388.6
Effective Tax Rate 4.37% 4.68% 5.26% 5.26%
Net Dividend Payout Ratio 55.7% 74.0% 68.5% 60.2%
Accounts Receivables Days 63.22 63.57 60.51 60.70
Inventory Days 81.81 81.88 77.63 77.69
Accounts Payables Days 60.39 59.74 57.67 57.64
ROIC (%) 28.3% 19.7% 22.1% 23.3%
ROCE (%) 14.9% 10.9% 11.6% 12.6%
Return On Average Assets 12.0% 8.9% 9.3% 10.1%
8.7
10.7
12.7
14.7
16.7
18.7
20.7
Jan-14A Jan-15A Jan-16A Jan-17A Jan-18F
12-mth Fwd FD P/E (x) - Hana Microelectronics Key Drivers
Dec-17A Dec-18F Dec-19F Dec-20F
ASP Change (%, Main Product) 8.9% 5.0% 3.9% 5.0%
Unit sales growth (%, main prod) 7.8% 10.5% 7.2% 9.8%
No. Of Lines (main Product) N/A N/A N/A N/A
Rev per line (US$, main prod) 356.4 393.7 422.2 463.5
ASP chg (%, 2ndary prod) 0.3% 5.0% 1.9% 2.4%
Unit sales grth (%, 2ndary prod) 12.5% 5.4% 4.8% 9.4%
No. Of Lines (secondary Product) N/A N/A N/A N/A
Rev per line (US$, 2ndary prod) 257.3 271.1 284.2 310.9

Company Brief Ind Goods & Services │ Thailand │ December 17, 2018
IMPORTANT DISCLOSURES, INCLUDING ANY REQUIRED RESEARCH CERTIFICATIONS, ARE PROVIDED AT THE END OF THIS REPORT. IF THIS REPORT IS DISTRIBUTED IN THE UNITED STATES IT IS DISTRIBUTED BY CGS-CIMB SECURITIES (USA), INC. AND IS CONSIDERED THIRD-PARTY AFFILIATED RESEARCH.
Powered by the EFA Platform
Sri Trang Agro-Industry
Positive newsflow likely factored in
■ In our view, most positive newsflow has been priced in and STA offers limited upside.
■ Weak demand and excess supply could pressure natural rubber prices.
■ Reiterate Reduce and our target price of THB16. We recommend switching to related rubber stocks, i.e. automobile counters.
Limited upside potential ● STA's share price jumped 70% between 29 Jun 18 and 7 Dec 18 and we believe
there could be limited upside due to 1) lower sales from low selling natural rubber (NR)
prices, especially to China, 2) low sustained NR margins, and 3) recent government
policies to shore up low prices for domestic NR.
● We believe most positive factors have been priced in. Moreover, demand from China
has yet to recover and excess supply continues to put pressure on NR prices.
4Q18F – NR prices unlikely to recover yet ● We think that NR prices remained weak due to 1) excess supply as a result of the high
number of trees planted in 2010-2012, 2) lower demand from China due to trade
tensions and rising stockpiles in Qinqdao and in the Shanghai Futures Exchange
(SHFE) rubber stocks, and 3) short-term policies by the Thai government (15 Dec 18-
16 Jan 19) to increase domestic NR consumption, which should have a minimal
impact on operations as STA exports more than 80% of total output.
Acquisition could increase glove capacity in 2Q19F ● STA is expected to manufacture 17.2bn gloves in FY18F and it plans to acquire
ThaiKong (TK, unlisted), which will add another c.4bn gloves p.a. If the acquisition
goes through, STA will have production capacity of c.21.2bn gloves p.a.
● According to company disclosure, FY18F capacity for Kossan Rubber is 26.5bn pieces
p.a., Supermax Corp 25.4bn pcs p.a., Top Glove Corp 60.5bn pcs p.a. and Hartalega
32.7bn pcs p.a.
Outlook in 2019F ● We expect NR prices to rise to c. US$1.4/kg in FY19F on the SICOM futures market
given 1) excess supply carried forward from 4Q18 in Thailand, 2) rising supply from
Indonesia after the tapping period ends in Feb 19, and 3) high stockpiles in China from
weak demand in the auto industry. We forecast that STA will sell 1.4m tonnes of NR in
FY19F vs. 1.37m tonnes in FY18F, though selling prices could remain low.
Maintain Reduce call ● We keep our Reduce rating and target price of THB16, based on 15.5x CY19F
blended P/E (1 s.d. below its historical 5-year average). Potential de-rating catalysts
are 1) appreciation of Thai baht against US$, which could hurt its export sales, and 2)
high capex to expand its glove business. Key upside risks are 1) stronger-than-
expected demand for gloves, and 2) higher NR prices.
!!Do Not Leave Any 'Remainder Text etc' beyond the last line, they will Appear in the Email.
SOURCES: CGS-CIMB RESEARCH, COMPANY REPORTS
Thailand
REDUCE (no change)
Consensus ratings*: Buy 6 Hold 0 Sell 1
Current price: THB16.90
Target price: THB16.00
Previous target: THB16.00
Up/downside: -5.3%
CGS-CIMB / Consensus: -19.1%
Reuters: STA.BK
Bloomberg: STA TB
Market cap: US$791.2m
THB25,958m
Average daily turnover: US$8.71m
THB285.5m
Current shares o/s 1,536m
Free float: 55.2% *Source: Bloomberg
Source: Bloomberg
Price performance 1M 3M 12M
Absolute (%) -4.5 30 32
Relative (%) -1.9 36.6 38.2
Major shareholders % held Sri Trang Holding 22.4
Mr. Viyavood Sincharoenkul 10.7
Sincharoenkul family 12.4
Insert
Analyst(s)
Praphan YUKHUNTHORNTHAM
T (66) 2 761 9239 E [email protected]
Financial Summary Dec-16A Dec-17A Dec-18F Dec-19F Dec-20F
Revenue (THBm) 77,266 89,387 74,945 78,972 83,273
Operating EBITDA (THBm) 1,370 455 2,984 3,348 3,384
Net Profit (THBm) (758) (1,437) 2,151 1,579 1,741
Core EPS (THB) 0.18 (1.38) 0.69 0.76 0.84
Core EPS Growth 899% (877%) 10% 10%
FD Core P/E (x) 95.21 NA 24.48 22.30 20.21
DPS (THB) 0.40 0.00 0.42 0.42 0.42
Dividend Yield 2.37% 0.00% 2.49% 2.49% 2.49%
EV/EBITDA (x) 36.5 111.0 14.3 12.2 12.0
P/FCFE (x) NA NA 9.64 16.70 74.49
Net Gearing 150% 115% 67% 58% 55%
P/BV (x) 1.09 1.13 1.04 1.01 0.97
ROE 1.11% (9.08%) 4.44% 4.60% 4.88%
CIMB/consensus EPS (x) 1.33 0.87 0.99
73
106
140
9.0
14.0
19.0
Price Close Relative to SET (RHS)
20
40
60
80
Dec-17 Mar-18 Jun-18 Sep-18
Vo
l m

Ind Goods & Services │ Thailand
Sri Trang Agro-Industry │ December 17, 2018
41
BY THE NUMBERS
SOURCES: CGS-CIMB RESEARCH, COMPANY REPORTS
Profit & Loss
(THBm) Dec-17A Dec-18F Dec-19F Dec-20F
Total Net Revenues 90,073 75,127 79,152 83,438
Gross Profit 6,314 8,077 8,714 9,042
Operating EBITDA 455 2,984 3,348 3,384
Depreciation And Amortisation (1,852) (1,839) (1,932) (1,882)
Operating EBIT (1,397) 1,145 1,416 1,502
Financial Income/(Expense) (1,196) (617) (618) (595)
Pretax Income/(Loss) from Assoc. 130 456 481 507
Non-Operating Income/(Expense) 0 0 0 0
Profit Before Tax (pre-EI) (2,463) 984 1,278 1,414
Exceptional Items
Pre-tax Profit (2,463) 984 1,278 1,414
Taxation (21) 71 (108) (122)
Exceptional Income - post-tax 504 1,091 415 456
Profit After Tax (1,980) 2,146 1,586 1,748
Minority Interests (19) 5 (7) (7)
Preferred Dividends
FX Gain/(Loss) - post tax 562 0 0 0
Other Adjustments - post-tax
Net Profit (1,437) 2,151 1,579 1,741
Recurring Net Profit (1,941) 1,060 1,164 1,285
Fully Diluted Recurring Net Profit (1,941) 1,060 1,164 1,285
Balance Sheet
(THBm) Dec-17A Dec-18F Dec-19F Dec-20F
Total Cash And Equivalents 2,650 4,823 5,118 5,160
Total Debtors 8,023 7,022 7,399 7,802
Inventories 17,123 15,231 16,001 16,900
Total Other Current Assets 554 434 494 464
Total Current Assets 28,349 27,510 29,012 30,326
Fixed Assets 26,022 27,220 26,435 25,704
Total Investments 730 880 880 880
Intangible Assets 3,414 3,377 3,409 3,400
Total Other Non-Current Assets 1,193 1,128 1,106 1,158
Total Non-current Assets 31,358 32,606 31,830 31,142
Short-term Debt 22,637 21,695 20,219 20,074
Current Portion of Long-Term Debt 0 0 0 0
Total Creditors 2,615 2,315 2,432 2,568
Other Current Liabilities 3,299 9,226 9,708 8,634
Total Current Liabilities 28,550 33,236 32,359 31,275
Total Long-term Debt 4,500 0 0 0
Hybrid Debt - Debt Component
Total Other Non-Current Liabilities 3,073 1,422 2,053 2,676
Total Non-current Liabilities 7,573 1,422 2,053 2,676
Total Provisions 308 247 277 262
Total Liabilities 36,431 34,904 34,690 34,214
Shareholders' Equity 22,908 24,848 25,781 26,877
Minority Interests 369 364 371 377
Total Equity 23,277 25,211 26,152 27,254
Cash Flow
(THBm) Dec-17A Dec-18F Dec-19F Dec-20F
EBITDA 455 2,984 3,348 3,384
Cash Flow from Invt. & Assoc.
Change In Working Capital 3,959 2,592 (1,030) (1,166)
(Incr)/Decr in Total Provisions
Other Non-Cash (Income)/Expense
Other Operating Cashflow 851 (304) 392 324
Net Interest (Paid)/Received (1,196) (587) (591) (578)
Tax Paid (21) 71 (108) (122)
Cashflow From Operations 4,049 4,756 2,012 1,842
Capex (10,467) (3,000) (1,100) (1,100)
Disposals Of FAs/subsidiaries
Acq. Of Subsidiaries/investments
Other Investing Cashflow 5,226 936 643 (394)
Cash Flow From Investing (5,241) (2,064) (457) (1,494)
Debt Raised/(repaid)
Proceeds From Issue Of Shares
Shares Repurchased
Dividends Paid 0 (645) (645) (645)
Preferred Dividends
Other Financing Cashflow 2,378 (7,313) 261 165
Cash Flow From Financing 2,378 (7,958) (385) (481)
Total Cash Generated 1,186 (5,266) 1,170 (132)
Free Cashflow To Equity (1,192) 2,693 1,554 348
Free Cashflow To Firm 4 3,310 2,172 944
Key Ratios
Dec-17A Dec-18F Dec-19F Dec-20F
Revenue Growth 15.7% (16.2%) 5.4% 5.4%
Operating EBITDA Growth (67%) 555% 12% 1%
Operating EBITDA Margin 0.51% 3.98% 4.24% 4.06%
Net Cash Per Share (THB) (17.42) (10.98) (9.83) (9.71)
BVPS (THB) 14.91 16.18 16.78 17.50
Gross Interest Cover (1.17) 1.86 2.29 2.52
Effective Tax Rate 0.00% 0.00% 8.42% 8.66%
Net Dividend Payout Ratio NA 61% 55% 50%
Accounts Receivables Days 34.20 36.64 33.33 33.41
Inventory Days 82.92 88.06 80.92 80.93
Accounts Payables Days 12.60 13.42 12.30 12.30
ROIC (%) (3.13%) 1.96% 2.86% 3.04%
ROCE (%) (2.67%) 2.29% 3.02% 3.19%
Return On Average Assets (1.24%) 2.65% 2.82% 2.95%
0
5
10
15
20
25
30
35
40
45
50
Jan-14A Jan-15A Jan-16A Jan-17A Jan-18F
12-mth Fwd FD P/E (x)
Hartalega Holdings Kossan Rubber Industries
Sri Trang Agro-Industry Supermax Corp
Top Glove Corporation
Key Drivers
Dec-17A Dec-18F Dec-19F Dec-20F
ASP (% chg, main prod./serv.) 28.4% -15.0% 2.0% 0.8%
Unit sales grth (%, main prod./serv.) -11.4% 5.7% 2.8% 4.1%
Util. rate (%, main prod./serv.) 74.1% 72.4% 73.3% 74.2%
ASP (% chg, 2ndary prod./serv.) N/A N/A N/A N/A
Unit sales grth (%,2ndary prod/serv) N/A N/A N/A N/A
Util. rate (%, 2ndary prod/serv) N/A N/A N/A N/A
Unit raw mat ASP (%chg,main) N/A N/A N/A N/A
Unit raw mat ASP (%chg,2ndary) N/A N/A N/A N/A

Eyes on the Ground Packaging │ Vietnam │ December 19, 2018 Shariah Compliant
IMPORTANT DISCLOSURES, INCLUDING ANY REQUIRED RESEARCH CERTIFICATIONS, ARE PROVIDED AT THE END OF THIS REPORT. IF THIS REPORT IS DISTRIBUTED IN THE UNITED STATES IT IS DISTRIBUTED BY CGS-CIMB SECURITIES (USA), INC. AND IS CONSIDERED THIRD-PARTY AFFILIATED RESEARCH.
Powered by the EFA Platform
An Phat Plastic JSC
Unwrap the packaging to discover more
■ AAA is the largest plastic packaging manufacturer and exporter in Southeast Asia in terms of production capacity.
■ AAA could be a prime beneficiary of the trade war between the U.S and China, according to the company.
■ 2018 marks an inflection point for AAA, as it rapidly diversifies beyond just plastic packaging into plastic parts and building materials production.
■ The stock now trades at a TTM P/E of 9.4x, an 8.7% discount to the domestic and regional plastic packaging industry peer TTM average of 10.3x.
The no.1 plastic packaging exporter in Vietnam AAA is the largest manufacturer of plastic packaging in Southeast Asia, with current
production capacity of 8,000 tonnes/month. Almost all its revenue from selling self-
manufactured products comes from exports to foreign markets, such as the U.S, Japan
and European countries as at 3Q18. AAA has focused on equipping itself with modern
production lines that meet the standards of international markets. According to
management, this gives AAA a sizable competitive advantage vis-à-vis other domestic
plastic packaging manufacturers that focus on more commoditised, lower quality
packaging.
Jumping on the trade war bandwagon According to management, AAA stands to benefit from the trade war between the U.S
and China as U.S importers are seeking non-Chinese plastic bag suppliers to reduce the
impact of the 13% tariff imposed on Chinese plastic packaging. Given that Vietnamese
plastic bags are subjected to U.S. import tariffs of only 3%, AAA believes that the U.S
market could be a new growth driver for its plastic packaging segment. Illustratively,
AAA’s plastic packaging exports to the U.S surged by 324% yoy in Sep 2018.
AAA is restructuring to be more than just a plastic bag producer Rather than solely concentrating on the existing packaging production (accounting for
68% of the company’s FY17 total revenue), AAA will start to launch new products through
its subsidiaries, including hi-tech injection molding spare parts, premium industrial bags
and building materials such as plastic walls and floor tiles in 2019F. Notably, the
company, via its subsidiary An Trung, is striving to become the primary smartphone parts
supplier for Samsung Electronics Vietnam – a giant FDI enterprise in Vietnam,
management said.
Poor 9M18 business results, TTM P/E of 9.4x For Jan-Sep 2018, the company reports it has realised VND5,809bn in revenue (+119%
yoy, fulfilling 97% of its 2018 full year revenue target) but only VND159bn in PAT (-16%
yoy, completing only 48% of the full year net profit target). The management blamed the
striking divergence in topline and bottomline results on the rapid expansion of the low-
margin trading segment, part of a deliberate initiative to develop a market for its
upcoming new products. AAA is currently trading at a TTM P/E of 9.4x, an 8.7% discount
to the peer average TTM P/E of both domestic and regional plastic producers (10.3x).
[Add FP Header] [Add FP BodyText]
SOURCES: VND RESEARCH, COMPANY REPORTS
2 Vietnam
NON RATED Current price: VND15,700
Consensus Tgt Price: VND15,913
Up/downside: N/A Reuters: AAA.HM
Bloomberg: AAA VN
Market cap: US$115.3m
VND2,687,840m
Average daily turnover: US$1.26m
VND29,309m
Current shares o/s: 171.2m
Free float: 57.0%
Source: Bloomberg
Price performance 1M 3M 12M
Absolute (%) 12.1 -7.7 -37.2
Relative (%) 8.9 -1 -34
Major shareholders % held An Phat Holdings JSC 46.6
Kallang Limited 7.6
PYN Fund Elite (Non-Ucits) 5.0
This Eyes On the Ground report represents a preliminary assessment of the subject company, and does not represent initiation into CGS-CIMB's coverage universe. It does not carry investment ratings and CGS-CIMB does not commit to regular updates on an ongoing basis.
Insert
Analyst(s)
Natalie NGUYEN
T (84) 91 269 6988 E [email protected]
Financial Summary Dec-13A Dec-14A Dec-15A Dec-16A Dec-17A
Revenue (VNDb) 1,158 1,561 1,615 2,144 4,070
Operating EBITDA (VNDb) 129 132 156 280 534
Net Profit (VNDb) 55 41 40 142 224
Core EPS (VND) 2,778 1,035 808 2,493 2,679
Core EPS Growth -63.0% -22.0% 208.0% 7.0%
FD Core P/E (x) 5.8 15.6 19.9 6.5 6.0
DPS (VND) 474 539 1,540 1,540
Dividend Yield 2.9% 3.3% 9.6% 9.6%
Net Gearing 51.9% 15.3% 17.1% 144.2% 115.0%
P/BV (x) 0.6 0.8 1.0 1.0 1.0
ROE 10.4% 7.1% 4.0% 15.3% 17.7%
41.0
62.9
84.8
106.6
12,000
17,000
22,000
27,000
Price Close Relative to VNINDEX (RHS)
2
4
6
Dec-17 Mar-18 Jun-18 Sep-18
Vo
l m

Eyes on the Ground Textile │ Vietnam │ December 19, 2018 Shariah Compliant
IMPORTANT DISCLOSURES, INCLUDING ANY REQUIRED RESEARCH CERTIFICATIONS, ARE PROVIDED AT THE END OF THIS REPORT. IF THIS REPORT IS DISTRIBUTED IN THE UNITED STATES IT IS DISTRIBUTED BY CGS-CIMB SECURITIES (USA), INC. AND IS CONSIDERED THIRD-PARTY AFFILIATED RESEARCH.
Powered by the EFA Platform
Century Synthetic Fiber Corp
Changing product mix to boost margin
■ STK is the second-largest polyester yarn manufacturer in Vietnam (in terms
of capacity), accounting for 28% of national polyester yarn exports in 2017.
■ Management believes STK should benefit of the US-China trade war.
■ Trang Bang 5 factory, which will start commercial operations in 1Q19, will raise STK’s total production capacity by 5.5% to 63,300 tonnes of yarn.
Second-largest synthetic fiber manufacturer in Vietnam STK’s current total capacity of 60,000 tonnes of yarn, makes it the largest Vietnamese
synthetic yarn manufacturer, and it is ranked second-largest in the domestic market, after
Taiwanese firm, Formosa (1326 TT, Not rated). STK produces Fully-Drawn Yarn (FDY),
Drawn-Textured Yarn (DTY) and recycled yarn, which are used as key input materials for
the textile industry.
Demand driven by recent trade agreements Vietnam’s total domestic yarn production only met 39.2% of domestic demand in 2016.
STK’s management said that Vietnam’s downstream textile industry is also benefitting
from growing export demand driven by a slew of new Free Trade Agreements (FTAs), the
Comprehensive and Progressive Agreement for Trans-Pacific Partnership (CPTPP), and
relatively low labour costs. Management believes that these conditions bode well for STK.
Direct beneficiary of US-China trade war, per management The US’s package of recently-imposed tariffs (Sep 2018) on Chinese imports includes
synthetic fibers and other polyester-based products, hence making Vietnamese synthetic
yarn manufacturers like STK more competitive, said STK’s management.
Shift in product mix towards high-margin recycled yarn According to STK’s management, the product mix will also shift towards recycled yarn,
which has gross margins of around 22%, higher than that of normal yarn which is 12%.
STK’s management aims to increase recycled yarn revenue contribution from 6% in FY17
to 30% in FY20F, in order to raise blended margins.
Trang Bang 5 to begin operations in 1Q19 According to STK’s management, the Trang Bang 5 factory (TB5) will begin operations in
1Q19 at a utilisation rate of 90%, after the trial phase in 4Q18. TB5, with designed
capacity of 3,300 tons of DTY and 1,500 tons of recycled chips (which is used as material
for producing recycled yarn), will raise STK’s total production capacity to 63,300 tonnes of
yarn, up 5.5% from current levels.
Downside risks, according to management Synthetic fiber’s input material is the PET chip, which, being a downstream petrochemical
product, is exposed to oil price volatility. According to management, Chinese
manufacturers of yarn are also relocating to Southeast Asia and could pose direct
competition to STK by establishing a presence in Vietnam.
SOURCES: VND RESEARCH, COMPANY REPORTS
2 Vietnam
NON RATED Current price: VND17,600
Consensus Tgt Price: VND22,000
Up/downside: N/A Reuters: STK.HM
Bloomberg: STK VN
Market cap: US$45.27m
VND1,054,905m
Average daily turnover: US$0.06m
VND1,405m
Current shares o/s: 59.94m
Free float: 44.2%
Source: Bloomberg
Price performance 1M 3M 12M
Absolute (%) -10.2 20.5 -24.5
Relative (%) -13.4 27.2 -21.3
Major shareholders % held Huong Viet Investment Consultant Corporation 20.2
Dang Trieu Hoa 13.9
Dang My Linh 8.5
This Eyes On the Ground report represents a preliminary assessment of the subject company, and does not represent initiation into CGS-CIMB's coverage universe. It does not carry investment ratings and CGS-CIMB does not commit to regular updates on an ongoing basis.
Insert
Analyst(s)
Natalie NGUYEN
T (84) 91 269 6988 E [email protected]
Financial Summary Dec-13A Dec-14A Dec-15A Dec-16A Dec-17A
Revenue (VNDb) 1,035 1,358 1,989
Operating EBITDA (VNDb) 210 181 274
Net Profit (VNDb) 72 29 100
Core EPS (VND) 1,537 539 1,670
Core EPS Growth -64.9% 209.5%
FD Core P/E (x) 11.5 32.6 10.5
DPS (VND) 1,363 431 265
Dividend Yield 7.7% 2.5% 1.5%
EV/EBITDA (x) 7.9 10.6 6.5
Net Gearing 117.5% 137.3% 88.7%
P/BV (x) 1.2 1.4 1.4
ROE 9.1% 4.1% 13.5%
33
62
90
12,000
17,000
22,000
Price Close Relative to VNINDEX (RHS)
200
400
600
Dec-17 Mar-18 Jun-18 Sep-18
Vo
l th

Eyes on the Ground Property Devt & Invt │ Vietnam │ December 18, 2018 Shariah Compliant
IMPORTANT DISCLOSURES, INCLUDING ANY REQUIRED RESEARCH CERTIFICATIONS, ARE PROVIDED AT THE END OF THIS REPORT. IF THIS REPORT IS DISTRIBUTED IN THE UNITED STATES IT IS DISTRIBUTED BY CGS-CIMB SECURITIES (USA), INC. AND IS CONSIDERED THIRD-PARTY AFFILIATED RESEARCH.
Powered by the EFA Platform
Kinh Bac City Corp
Vietnam’s Industrial Park Giant
■ Experiencing steady rental growth and high occupancy rates and facing a healthy demand for industrial properties in northern industrial zones.
■ Expecting to launch Nam Son Hap Linh industrial park phase 1 in FY19F, comprising 66ha, adding to its total available NLA of 453ha as at end-2017.
■ Residential real estate segment now a big revenue contributor.
■ Management guides for 2018F revenue of VND2,339bn (+85.6% yoy) and net
profit of VND 718.9bn (+ 23% yoy).
Burgeoning northern industrial zones enjoy healthy rental growth Based on estate services firm, Jones Lang Lasalle's figures, northern industrial land
leasing in 2018F is expected to reach an average occupancy rate of 85% (+400 bp yoy)
and an average rental rate of US$82/sq m/lease term (+10% yoy). Meanwhile,
management expects the US-China trade war to boost leasing from 2019F, as foreign
companies in China are seeking to diversify their production bases to Vietnam to bypass
US trade tariffs. With the second largest net leasable area (NLA) of 519ha in the northern
industrial zones, KBC expects to benefit from strong demand for industrial property in the
medium term; it believes occupancy and rental rates will rise in 2019F given this backdrop.
The Nam Son Hap Linh industrial park (phase 1) launches in 2019 According to management, KBC will launch a new industrial park Nam Son Hap Linh with
an NLA of 66ha in 2019F, adding to its current total NLA of 453ha available for lease (as at
end-2017). KBC has guided that this new park will realise a healthy rental rate of
US$80/sq m/lease term and rising occupancy driven by its proximity to Que Vo industrial
parks, the local manufacturing hubs of South Korean multinational giants.
Strong pre-sales backlog for residential segment The management stated in Mar 2018 that the Phuc Ninh townhouse project is being
launched in two phases with total first net saleable area (NSA) of 13.9ha. Management
also guides for total contracted sales of VND2,337bn over 2018-20F and reported
unbooked presales of VND1,361bn at end-2017. However, the People’s Committee of Bac
Ninh province has issued a notice in Oct 2018 of KBC’s non-compliance with the master
zone plan.
Management guides for strong growth in 2018F On the back of rising contribution from residential real estate and strong growth in leasing
sales from its sizable nationwide industrial land bank, KBC’s management is targeting
2018F revenue of VND2,339bn (+85.6% yoy), net profit of VND718.9bn (23% yoy).
Stock trading under book value The company has yet to launch its Trang Cat Townhouse project, the largest component
of its inventory valued at VND3,498bn, due to market timing issues, as per management.
The stock currently trades at a discount to its BVPS of VND20,364 as at end-3Q18.
SOURCES: VND RESEARCH, COMPANY REPORTS
2 Vietnam
NON RATED Current price: VND14,000
Consensus Tgt Price: VND16,000
Up/downside: N/A Reuters: KBC.HM
Bloomberg: KBC VN
Market cap: US$282.2m
VND6,576,643m
Average daily turnover: US$1.40m
VND32,915m
Current shares o/s: 475.7m
Free float: 37.0%
Source: Bloomberg
Price performance 1M 3M 12M
Absolute (%) 15.7 15.2 6.5
Relative (%) 12.5 21.9 9.7
Major shareholders % held Dang Thanh Tam 16.0
Kinh Bac Consulting and Investment 9.6
Dragon Capital 5.6
This Eyes On the Ground report represents a preliminary assessment of the subject company, and does not represent initiation into CGS-CIMB's coverage universe. It does not carry investment ratings and CGS-CIMB does not commit to regular updates on an ongoing basis.
Insert
Analyst(s)
Nhan LAI, CFA
T (84) 914 459 879 E [email protected]
Financial Summary Dec-14A Dec-15A Dec-16A Dec-17A
Total Net Revenues (VNDb) 1,069.0 1,434.8 1,972.5 1,260.2
Operating EBITDA (VNDb) 517.7 478.4 980.5 512.6
Net Profit (VNDb) 325.6 611.9 557.4 584.5
Core EPS (VND) 904 1,316 1,176 489
Core EPS Growth 46% (11%) (58%)
DPS (VND) - - - -
Dividend Yield 0% 0% 0% 0%
EV/EBITDA (x) 12.70 13.74 6.71 12.83
P/FCFE (x) 118.59 83.18 98.30 31.39
Net Gearing 62.4% 29.0% 19.4% 24.5%
P/BV (x) 0.87 0.82 0.76 0.73
ROE 5.2% 7.6% 6.5% 6.5%
72.0
87.0
102.0
117.0
10,000
12,000
14,000
16,000
Price Close Relative to VNINDEX (RHS)
5
10
Dec-17 Mar-18 Jun-18 Sep-18
Vo
l m

Eyes on the Ground Airport Services │ Vietnam │ December 19, 2018 Shariah Compliant
IMPORTANT DISCLOSURES, INCLUDING ANY REQUIRED RESEARCH CERTIFICATIONS, ARE PROVIDED AT THE END OF THIS REPORT. IF THIS REPORT IS DISTRIBUTED IN THE UNITED STATES IT IS DISTRIBUTED BY CGS-CIMB SECURITIES (USA), INC. AND IS CONSIDERED THIRD-PARTY AFFILIATED RESEARCH.
Powered by the EFA Platform
Saigon Cargo Service Corp
Integrated air cargo service provider
■ SCS is one of Vietnam’s two integrated air cargo service providers servicing the Tan Son Nhat airport (SGN) in Ho Chi Minh City.
■ Management believes SCS is well-positioned to ride the air cargo boom and is the only air cargo terminal operator at SGN able to expand its capacity.
Vietnam’s air cargo sector is expected to see sustained growth According to the Ministry of Transportation, the country‘s air cargo throughput volume is
forecast to grow at a CAGR of 18% over FY16-20F, with growth to be propelled by the
burgeoning cross-border trade. Additionally, the rapid growth of Vietnamese e-commerce
will be a new growth engine for the air cargo sector, according to Ministry of
Transportation.
An integrated air cargo service provider SCS is one of two air cargo terminal operators located in the Tan Son Nhat airport (SGN),
which serves Ho Chi Minh City and southern Vietnam. SCS operates in a duopolistic
market with its only competitor being Tan Son Nhat Cargo Service JSC (TCS), a
subsidiary of Vietnam Airlines (HVN VN Not rated). SCS has three main business lines:
air cargo services, airport apron leasing and office & parking space leasing. Its core
business, air cargo services, accounted for 93% of total revenue in 1H18. Meanwhile,
office leasing and airport apron leasing contributed 6% and 1% to 1H18 revenue,
respectively.
Technology is a key differentiator versus competition SCS increased market share of international cargo through-put volume in SGN from 22%
in 2013 to 36% in 8M2018. According to management, SCS uses newer technology
which enables higher levels of automation and better monitoring of customer requests
this is driving differentiation in its service levels, according to management. Meanwhile,
TCS is running at full capacity since 2017.
The only air cargo terminal operator at SGN able to expand capacity Both air cargo service providers at SGN are faced with capacity constraints according to
the Ministry of Transportation. But SCS is the only one able to expand capacity as its
competitor, TCS has no available land bank for expansion according to SGN airport.
SCS’ current cargo-handling capacity is 200,000 tonnes and the company plans to
increase it to 350,000 tonnes in 2019F, per management. The extension is possible as
management says SCS has a vacant 13,000 sq m land bank to the south of SGN.
Implications of the Chins-US trade war Global companies have also yet to adjust their supply chains to circumvent US trade
tariffs on China. Therefore, cargo throughput volumes at SGN could be hurt in the short-
term and this will negatively affect cargo service providers like SCS, according to its
management team. However, management expects SCS to be a beneficiary of the trade
war in the medium-to-long term as factories, particularly in the electronics industry,
relocate from China to Vietnam.
SOURCES: VND RESEARCH, COMPANY REPORTS
2 Vietnam
NON RATED Current price: VND149,000
Consensus Tgt Price: VND178,500
Up/downside: N/A Reuters: SCS.HM
Bloomberg: SCS VN
Market cap: US$329.9m
VND7,587,830m
Average daily turnover: US$0.07m
VND1,703m
Current shares o/s: 49.99m
Free float: 33.7%
Source: Bloomberg
Price performance 1M 3M 12M
Absolute (%) 2.3 -4.8 32
Relative (%) -2.4 -2.2 27.8
Major shareholders % held Gemadept Corporation 36.9
Airport Corporation of Vietnam 15.0
A41 Aircraft Repairing Company 14.4
This Eyes On the Ground report represents a preliminary assessment of the subject company, and does not represent initiation into CGS-CIMB's coverage universe. It does not carry investment ratings and CGS-CIMB does not commit to regular updates on an ongoing basis.
Insert
Analyst(s)
Natalie NGUYEN
T (84) 91 269 69889 E [email protected]
88
121
155
100,000
150,000
200,000
Price Close Relative to VNINDEX (RHS)
1
1
2
2
Dec-17 Mar-18 Jun-18 Sep-18
Vo
l m

Eyes on the Ground Textile │ Vietnam │ December 19, 2018 Shariah Compliant
IMPORTANT DISCLOSURES, INCLUDING ANY REQUIRED RESEARCH CERTIFICATIONS, ARE PROVIDED AT THE END OF THIS REPORT. IF THIS REPORT IS DISTRIBUTED IN THE UNITED STATES IT IS DISTRIBUTED BY CGS-CIMB SECURITIES (USA), INC. AND IS CONSIDERED THIRD-PARTY AFFILIATED RESEARCH.
Powered by the EFA Platform
Thanh Cong Textile Garment JSC
Changing sales mix and vertical integration
■ TCM is the only Vietnamese textile manufacturer that operates a fully vertically-integrated production chain ranging from yarn to garment products.
■ Restructuring of product portfolio to focus on garments has helped to raise gross margin by 190bp yoy during 9M18, according to management.
■ Bankruptcy of Sears (TCM’s customer) has put VND95bn of TCM’s receivables in doubt, the company said.
The only vertically-integrated textile manufacturer in Vietnam TCM owns a near-complete production chain, including yarn, fabric and garments,
allowing it to reduce its reliance on imported materials (yarn, fabric). According to TCM’s
management, the majority of materials used for making garments (annual capacity of
27m units), are insourced from two yarn factories (11,000 tonnes of cotton yarn) and two
fabric factories (capacity of 15,000 tonnes of knitted fabric and 9.6m metres of woven
fabric).
Improving product mix fuelling gross margin expansion 9M18 revenue from yarn fell by 36.2% yoy (after selling one yarn factory and switching
another’s production to fabric), while fabric and garment revenue surged 47.6% yoy and
26.5% yoy, respectively, with the purchase of a new garment factory in 3Q18. This has
expanded blended gross margin by 190bp yoy to reach 17.8% in 9M18.
Dyeing factory to further support margins, per management The dyeing stage, a stage between fabric and garment making, has been a bottleneck for
the Vietnamese textile industry, as not many companies have been able to obtain
licenses for dyeing, due to the strict environmental rules for disposal of dyeing chemicals.
TCM’s Vinh Long dyeing factory (capex of ~US$10m in FY19F and capacity of 2,500m of
fabric per day) will serve in-house fabric production needs after expected commissioning
around FY19-20F, reducing its reliance on outsourced dyeing and boosting margins, says
management.
A potential beneficiary of US – China trade war, per management According to TCM’s Management, under the current US tariff regime, sewed/knitted
products (e.g. fabric) from China will be taxed at 25% on average vs. a tariff rate of 17.5%
on similar goods imported from Vietnam. Therefore, TCM expects to benefit from the
trade war, as fabric contributed 13.4% of TCM’s 9M18 revenue.
Management says Sears’ bankruptcy creates some receivables risk Sears Holding Corporation (SHLD US, Not rated), a key customer of TCM that
contributed 7% of TCM’s annual revenue in FY17 and accounted for 19% of total
receivables outstanding as at 9M18, filed for bankruptcy in the US on Oct 14, 2018.
SOURCES: VND RESEARCH, COMPANY REPORTS
2 Vietnam
NON RATED Current price: VND24,600
Consensus Tgt Price: VND27,750
Up/downside: N/A Reuters: TCM.HM
Bloomberg: TCM VN
Market cap: US$57.1418m
VND1,331,588m
Average daily turnover: US$0.92m
VND21,412m
Current shares o/s: 54.230m
Free float: 52.2%
Source: Bloomberg
Price performance 1M 3M 12M
Absolute (%) -1.6 -17.5 -11.6
Relative (%) -4.8 -10.8 -8.4
Major shareholders % held E-Land Asia Holding Pte., Ltd. 43.2
This Eyes On the Ground report represents a preliminary assessment of the subject company, and does not represent initiation into CGS-CIMB's coverage universe. It does not carry investment ratings and CGS-CIMB does not commit to regular updates on an ongoing basis.
Insert
Analyst(s)
Natalie NGUYEN
T (84) 91 269 69883816 E [email protected]
Financial Summary Dec-13A Dec-14A Dec-15A Dec-16A Dec-17A
Revenue (VNDb) 2,554 2,571 2,792 3,071 3,209
Operating EBITDA (VNDb) 237 264 289 265 349
Net Profit (VNDb) 124 168 154 116 193
Core EPS (VND) 2,408 3,265 2,986 2,246 3,753
Core EPS Growth 35.6% -8.5% -24.8% 67.1%
FD Core P/E (x) 10.2 7.5 8.2 11.0 6.6
DPS (VND) 635 998 1,197 831 639
Dividend Yield 2.6% 4.1% 4.9% 3.4% 2.6%
EV/EBITDA (x) 8.7 7.5 8.1 9.2 6.8
Net Gearing 108.8% 89.5% 119.4% 129.8% 105.6%
P/BV (x) 1.6 1.5 1.3 1.3 1.2
ROE 18.2% 21.8% 18.1% 12.7% 16.5%
49.0
65.7
82.3
99.0
14,000
19,000
24,000
29,000
Price Close Relative to VNINDEX (RHS)
1
2
3
4
Dec-17 Mar-18 Jun-18 Sep-18
Vo
l m

ASEAN
Strategy Note - Alpha series │ December 19, 2018
47
DISCLAIMER
The content of this report (including the views and opinions expressed therein, and the information comprised therein) has been prepared by and belongs to VNDIRECT Securities Corporation, and is distributed by CGS-CIMB or CIMB Investment Bank Berhad (“CIMB”), as the case may be, pursuant to an arrangement between VNDIRECT Securities Corporation and CGS-CIMB. VNDIRECT Securities Corporation is not an affiliate of CGS-CIMB or CIMB.
This report is not directed to, or intended for distribution to or use by, any person or entity who is a citizen or resident of or located in any locality, state, country or other jurisdiction where such distribution, publication, availability or use would be contrary to law or regulation.
By accepting this report, the recipient hereof represents and warrants that he is entitled to receive such report in accordance with the restrictions set forth below and agrees to be bound by the limitations contained herein (including the “Restrictions on Distributions” set out below). Any failure to comply with these limitations may constitute a violation of law. This publication is being supplied to you strictly on the basis that it will remain confidential. No part of this report may be (i) copied, photocopied, duplicated, stored or reproduced in any form by any means or (ii) redistributed or passed on, directly or indirectly, to any other person in whole or in part, for any purpose without the prior written consent of CGS-CIMB or CIMB, as the case may be.
The information contained in this research report is prepared from data believed to be correct and reliable at the time of issue of this report.
VNDIRECT Securities Corporation may or may not issue regular reports on the subject matter of this report at any frequency and may cease to do so or change the periodicity of reports at any time. None of VNDIRECT Securities Corporation, CGS-CIMB or CIMB is under any obligation to update this report in the event of a material change to the information contained in this report. None of VNDIRECT Securities Corporation, CGS-CIMB or CIMB has any and will accept any, obligation to (i) check or ensure that the contents of this report remain current, reliable or relevant, (ii) ensure that the content of this report constitutes all the information a prospective investor may require, (iii) ensure the adequacy, accuracy, completeness, reliability or fairness of any views, opinions and information, and accordingly, VNDIRECT Securities Corporation, CGS-CIMB and CIMB and their respective affiliates and related persons including China Galaxy International Financial Holdings Limited (“CGIFHL”) and CIMB Group Sdn. Bhd. (“CIMBG”) and their respective related corporations (and their respective directors, associates, connected persons and/or employees) shall not be liable in any manner whatsoever for any consequences (including but not limited to any direct, indirect or consequential losses, loss of profits and damages) of any reliance thereon or usage thereof. In particular, VNDIRECT Securities Corporation, CGS-CIMB and CIMB disclaim all responsibility and liability for the views and opinions set out in this report.
Unless otherwise specified, this report is based upon reasonable sources. Such sources will, unless otherwise specified, for market data, be market data and prices available from the main stock exchange or market where the relevant security is listed, or, where appropriate, any other market. Information on the accounts and business of company(ies) will generally be based on published statements of the company(ies), information disseminated by regulatory information services, other publicly available information and information resulting from our research. Whilst every effort is made to ensure that statements of facts made in this report are accurate, all estimates, projections, forecasts, expressions of opinion and other subjective judgments contained in this report are based on assumptions considered to be reasonable as of the date of the document in which they are contained and must not be construed as a representation that the matters referred to therein will occur. Past performance is not a reliable indicator of future performance. The value of investments may go down as well as up and those investing may, depending on the investments in question, lose more than the initial investment. No report shall constitute an offer or an invitation by or on behalf of CGS-CIMB, CIMB, or VNDIRECT Securities Corporation, or their respective affiliates (including CGIFHL, CIMBG and their respective related corporations) to any person to buy or sell any investments.
CGS-CIMB, CIMB and/or VNDIRECT Securities Corporation and/or their respective affiliates and related corporations (including CGIFHL, CIMBG and their respective related corporations), their respective directors, associates, connected parties and/or employees may own or have positions in securities of the company(ies) covered in this research report or any securities related thereto and may from time to time add to or dispose of, or may be materially interested in, any such securities. Further, CGS-CIMB, CIMB and/or VNDIRECT Securities Corporation, and/or their respective affiliates and their respective related corporations (including CGIFHL, CIMBG and their respective related corporations) do and seek to do business with the company(ies) covered in this research report and may from time to time act as market maker or have assumed an underwriting commitment in securities of such company(ies), may sell them to or buy them from customers on a principal basis and may also perform or seek to perform significant investment banking, advisory, underwriting or placement services for or relating to such company(ies) as well as solicit such investment, advisory or other services from any entity mentioned in this report.
CGS-CIMB, CIMB and/or VNDIRECT Securities Corporation and/or their respective affiliates (including CGIFHL, CIMBG and their respective related corporations) may enter into an agreement with the company(ies) covered in this report relating to the production of research reports. CGS-CIMB, CIMB and/or VNDIRECT Securities Corporation may disclose the contents of this report to the company(ies) covered by it and may have amended the contents of this report following such disclosure.
The analyst responsible for the production of this report hereby certifies that the views expressed herein accurately and exclusively reflect his or her personal views and opinions about any and all of the issuers or securities analysed in this report and were prepared independently and autonomously. No part of the compensation of the analyst(s) was, is, or will be directly or indirectly related to the inclusion of specific recommendations(s) or view(s) in this report. The analyst(s) who prepared this research report is prohibited from receiving any compensation, incentive or bonus based on specific investment banking transactions or for providing a specific recommendation for, or view of, a particular company. Information barriers and other arrangements may be established where necessary to prevent conflicts of interests arising. However, the analyst(s) may receive compensation that is based on his/their coverage of company(ies) in the performance of his/their duties or the performance of his/their recommendations and the research personnel involved in the preparation of this report may also participate in the solicitation of the businesses as described above. In reviewing this research report, an investor should be aware that any or all of the foregoing, among other things, may give rise to real or potential conflicts of interest. Additional information is, subject to the duties of confidentiality, available on request.
The term “VNDIRECT Securities Corporation” shall, unless the context otherwise requires, mean VNDIRECT Securities Corporation and its affiliates, subsidiaries and related companies. The term “CGS-CIMB” shall denote, where appropriate, the relevant entity distributing or disseminating the report in the particular jurisdiction referenced below, or, in every other case except as otherwise stated herein, CIMB Securities

ASEAN
Strategy Note - Alpha series │ December 19, 2018
48
International Pte. Ltd. and its affiliates, subsidiaries and related corporations.
CGS-CIMB
Country CGS-CIMB Entity Regulated by
Hong Kong CGS-CIMB Securities Limited Securities and Futures Commission Hong Kong
India CGS-CIMB Securities (India) Private Limited Securities and Exchange Board of India (SEBI)
Indonesia PT CGS-CIMB Sekuritas Indonesia Financial Services Authority of Indonesia
Singapore CGS-CIMB Research Pte. Ltd. Monetary Authority of Singapore
South Korea CGS-CIMB Securities Limited, Korea Branch Financial Services Commission and Financial Supervisory Service
Thailand CGS-CIMB Securities (Thailand) Co. Ltd. Securities and Exchange Commission Thailand
CIMB
Country CIMB Entity Regulated by
Malaysia CIMB Investment Bank Berhad Securities Commission Malaysia
(i) As of December 18, 2018 VNDIRECT Securities Corporation has a proprietary position in the securities (which may include but not limited to shares, warrants, call warrants and/or any other derivatives) in the following company or companies covered or recommended in this report:
(a) -
(ii) As of December 18, 2018, the analyst(s) who prepared this report, and the associate(s), has / have an interest in the securities (which may include but not limited to shares, warrants, call warrants and/or any other derivatives) in the following company or companies covered or recommended in this report:
(a) -
This report does not purport to contain all the information that a prospective investor may require. CGS-CIMB, and VNDIRECT Securities Corporation and their respective affiliates (including CGIFHL, CIMBG and their related corporations) do not make any guarantee, representation or warranty, express or implied, as to the adequacy, accuracy, completeness, reliability or fairness of any such information and opinion contained in this report. None of CGS-CIMB, CIMB and VNDIRECT Securities Corporation and their respective affiliates nor their related persons (including CGIFHL, CIMBG and their related corporations) shall be liable in any manner whatsoever for any consequences (including but not limited to any direct, indirect or consequential losses, loss of profits and damages) of any reliance thereon or usage thereof.
This report is general in nature and has been prepared for information purposes only. It is intended for circulation amongst CGS-CIMB’s, CIMB’s and their respective affiliates’ (including CGIFHL’s, CIMBG’s and their respective related corporations’) clients generally and does not have regard to the specific investment objectives, financial situation and the particular needs of any specific person who may receive this report. The information and opinions in this report are not and should not be construed or considered as an offer, recommendation or solicitation to buy or sell the subject securities, related investments or other financial instruments or any derivative instrument, or any rights pertaining thereto.
Investors are advised to make their own independent evaluation of the information contained in this research report, consider their own individual investment objectives, financial situation and particular needs and consult their own professional and financial advisers as to the legal, business, financial, tax and other aspects before participating in any transaction in respect of the securities of company(ies) covered in this research report. The securities of such company(ies) may not be eligible for sale in all jurisdictions or to all categories of investors.
Australia: Despite anything in this report to the contrary, this research is provided in Australia by CGS-CIMB Securities (Singapore) Pte. Ltd. and CGS-CIMB Securities (Hong Kong) Limited. This research is only available in Australia to persons who are “wholesale clients” (within the meaning of the Corporations Act 2001 (Cth) and is supplied solely for the use of such wholesale clients and shall not be distributed or passed on to any other person. You represent and warrant that if you are in Australia, you are a “wholesale client”. This research is of a general nature only and has been prepared without taking into account the objectives, financial situation or needs of the individual recipient. CGS-CIMB Securities (Singapore) Pte. Ltd. and CGS-CIMB Securities (Hong Kong) Limited do not hold, and are not required to hold an Australian financial services license. CGS-CIMB Securities (Singapore) Pte. Ltd. and CGS-CIMB Securities (Hong Kong) Limited rely on “passporting” exemptions for entities appropriately licensed by the Monetary Authority of Singapore (under ASIC Class Order 03/1102) and the Securities and Futures Commission in Hong Kong (under ASIC Class Order 03/1103).
Canada: This research report has not been prepared in accordance with the disclosure requirements of Dealer Member Rule 3400 – Research Restrictions and Disclosure Requirements of the Investment Industry Regulatory Organization of Canada. For any research report distributed by CIBC, further disclosures related to CIBC conflicts of interest can be found at https://researchcentral.cibcwm.com.
China: For the purpose of this report, the People’s Republic of China (“PRC”) does not include the Hong Kong Special Administrative Region, the Macau Special Administrative Region or Taiwan. The distributor of this report has not been approved or licensed by the China Securities Regulatory Commission or any other relevant regulatory authority or governmental agency in the PRC. This report contains only marketing information. The distribution of this report is not an offer to buy or sell to any person within or outside PRC or a solicitation to any person within or outside of PRC to buy or sell any instruments described herein. This report is being issued outside the PRC to a limited number of institutional investors and may not be provided to any person other than the original recipient and may not be reproduced or used for any other purpose.
France: Only qualified investors within the meaning of French law shall have access to this report. This report shall not be considered as an offer to subscribe to, or used in connection with, any offer for subscription or sale or marketing or direct or indirect distribution of financial instruments and it is not intended as a solicitation for the purchase of any financial instrument.
Germany: This report is only directed at persons who are professional investors as defined in sec 31a(2) of the German Securities Trading Act (WpHG). This publication constitutes research of a non-binding nature on the market situation and the investment instruments cited here at the time of the publication of the information.

ASEAN
Strategy Note - Alpha series │ December 19, 2018
49
The current prices/yields in this issue are based upon closing prices from Bloomberg as of the day preceding publication. Please note that neither the German Federal Financial Supervisory Agency (BaFin), nor any other supervisory authority exercises any control over the content of this report.
Hong Kong: This report is issued and distributed in Hong Kong by CGS-CIMB Securities (Hong Kong) Limited (“CHK”) which is licensed in Hong Kong by the Securities and Futures Commission for Type 1 (dealing in securities), Type 4 (advising on securities) and Type 6 (advising on corporate finance) activities. Any investors wishing to purchase or otherwise deal in the securities covered in this report should contact the Head of Sales at CGS-CIMB Securities (Hong Kong) Limited. The views and opinions in this research report are of VNDIRECT Securities Corporation as of the date hereof and are subject to change. If the Financial Services and Markets Act of the United Kingdom or the rules of the Financial Conduct Authority apply to a recipient, our obligations owed to such recipient therein are unaffected. CHK has no obligation to update its opinion or the information in this research report.
CHK does not make a market on other securities mentioned in the report.
India: This report is issued and distributed in India by CGS-CIMB Securities (India) Private Limited (“CIMB India”) which is registered with the National Stock Exchange of India Limited and BSE Limited as a trading and clearing member under the Securities and Exchange Board of India (Stock Brokers and Sub-Brokers) Regulations, 1992. In accordance with the provisions of Regulation 4(g) of the Securities and Exchange Board of India (Investment Advisers) Regulations, 2013, CGS-CIMB India is not required to seek registration with the Securities and Exchange Board of India (“SEBI”) as an Investment Adviser. CGS-CIMB India is registered with SEBI as a Research Analyst pursuant to the SEBI (Research Analysts) Regulations, 2014 ("Regulations").
This report does not take into account the particular investment objectives, financial situations, or needs of the recipients. It is not intended for and does not deal with prohibitions on investment due to law/jurisdiction issues etc. which may exist for certain persons/entities. Recipients should rely on their own investigations and take their own professional advice before investment.
The report is not a “prospectus” as defined under Indian Law, including the Companies Act, 2013, and is not, and shall not be, approved by, or filed or registered with, any Indian regulator, including any Registrar of Companies in India, SEBI, any Indian stock exchange, or the Reserve Bank of India. No offer, or invitation to offer, or solicitation of subscription with respect to any such securities listed or proposed to be listed in India is being made, or intended to be made, to the public, or to any member or section of the public in India, through or pursuant to this report.
The research analysts, strategists or economists principally responsible for the preparation of this research report are segregated from the other activities of CGS-CIMB India and they have received compensation based upon various factors, including quality, accuracy and value of research, firm profitability or revenues, client feedback and competitive factors. Research analysts', strategists' or economists' compensation is not linked to investment banking or capital markets transactions performed or proposed to be performed by CGS-CIMB India or its affiliates.
CGS-CIMB India has not received any investment banking related compensation from the companies mentioned in the report in the past 12 months.
CGS-CIMB India has not received any compensation from the companies mentioned in the report in the past 12 months.
Indonesia: This report is issued and distributed by PT CGS-CIMB Sekuritas Indonesia (“CGS-CIMB Indonesia”). The views and opinions in this research report are our own as of the date hereof and are subject to change. CGS-CIMB Indonesia has no obligation to update its opinion or the information in this research report. Neither this report nor any copy hereof may be distributed in Indonesia or to any Indonesian citizens wherever they are domiciled or to Indonesian residents except in compliance with applicable Indonesian capital market laws and regulations.
This research report is not an offer of securities in Indonesia. The securities referred to in this research report have not been registered with the Financial Services Authority (Otoritas Jasa Keuangan) pursuant to relevant capital market laws and regulations, and may not be offered or sold within the territory of the Republic of Indonesia or to Indonesian citizens through a public offering or in circumstances which constitute an offer within the meaning of the Indonesian capital market law and regulations.
Ireland: CGS-CIMB is not an investment firm authorised in the Republic of Ireland and no part of this document should be construed as CGS-CIMB acting as, or otherwise claiming or representing to be, an investment firm authorised in the Republic of Ireland.
Malaysia: This report is distributed in Malaysia by CIMB solely for the benefit of and for the exclusive use of our clients. Recipients of this report are to contact CIMB, at 17th Floor Menara CIMB No. 1 Jalan Stesen Sentral 2, Kuala Lumpur Sentral 50470 Kuala Lumpur, Malaysia, in respect of any matters arising from or in connection with this report. CIMB has no obligation to update, revise or reaffirm its opinion or the information in this research reports after the date of this report.
New Zealand: In New Zealand, this report is for distribution only to persons who are wholesale clients pursuant to section 5C of the Financial Advisers Act 2008.
Singapore: This report is issued and distributed by CGS-CIMB Research Pte Ltd (“CGS-CIMBR”). CGS-CIMBR is a financial adviser licensed under the Financial Advisers Act, Cap 110 (“FAA”) for advising on investment products, by issuing or promulgating research analyses or research reports, whether in electronic, print or other form. Accordingly CGS-CIMBR is a subject to the applicable rules under the FAA unless it is able to avail itself to any prescribed exemptions.
Recipients of this report are to contact CGS-CIMB Research Pte Ltd, 50 Raffles Place, #16-02 Singapore Land Tower, Singapore in respect of any matters arising from, or in connection with this report. CGS-CIMBR has no obligation to update its opinion or the information in this research report. This publication is strictly confidential and is for private circulation only. If you have not been sent this report by CGS-CIMBR directly, you may not rely, use or disclose to anyone else this report or its contents.
If the recipient of this research report is not an accredited investor, expert investor or institutional investor, CGS-CIMBR accepts legal responsibility for the contents of the report without any disclaimer limiting or otherwise curtailing such legal responsibility. If the recipient is an accredited investor, expert investor or institutional investor, the recipient is deemed to acknowledge that CGS-CIMBR is exempt from certain requirements under the FAA and its attendant regulations, and as such, is exempt from complying with the following :
(a) Section 25 of the FAA (obligation to disclose product information);
(b) Section 27 (duty not to make recommendation with respect to any investment product without having a reasonable basis where you may be reasonably expected to rely on the recommendation) of the FAA;
(c) MAS Notice on Information to Clients and Product Information Disclosure [Notice No. FAA-N03];
(d) MAS Notice on Recommendation on Investment Products [Notice No. FAA-N16];

ASEAN
Strategy Note - Alpha series │ December 19, 2018
50
(e) Section 36 (obligation on disclosure of interest in securities), and
(f) any other laws, regulations, notices, directive, guidelines, circulars and practice notes which are relates to the above, to the extent permitted by applicable laws, as may be amended from time to time, and any other laws, regulations, notices, directive, guidelines, circulars, and practice notes as we may notify you from time to time. In addition, the recipient who is an accredited investor, expert investor or institutional investor acknowledges that a CGS-CIMBR is exempt from Section 27 of the FAA, the recipient will also not be able to file a civil claim against CGS-CIMBR for any loss or damage arising from the recipient’s reliance on any recommendation made by CGS-CIMBR which would otherwise be a right that is available to the recipient under Section 27 of the FAA, the recipient will also not be able to file a civil claim against CGS-CIMBR for any loss or damage arising from the recipient’s reliance on any recommendation made by CGS-CIMBR which would otherwise be a right that is available to the recipient under Section 27 of the FAA.
CGS-CIMBR, its affiliates and related corporations, their directors, associates, connected parties and/or employees may own or have positions in securities of the company(ies) covered in this research report or any securities related thereto and may from time to time add to or dispose of, or may be materially interested in, any such securities. Further, CGS-CIMBR, its affiliates and its related corporations do and seek to do business with the company(ies) covered in this research report and may from time to time act as market maker or have assumed an underwriting commitment in securities of such company(ies), may sell them to or buy them from customers on a principal basis and may also perform or seek to perform significant investment banking, advisory, underwriting or placement services for or relating to such company(ies) as well as solicit such investment, advisory or other services from any entity mentioned in this report.
As of December 18, 2018,, CGS-CIMBR does not have a proprietary position in the recommended securities in this report.
CGS-CIMBR does not make a market on the securities mentioned in the report.
South Korea: This report is issued and distributed in South Korea by CGS-CIMB Securities (Hong Kong) Limited, Korea Branch (“CGS-CIMB Korea”) which is licensed as a cash equity broker, and regulated by the Financial Services Commission and Financial Supervisory Service of Korea. In South Korea, this report is for distribution only to professional investors under Article 9(5) of the Financial Investment Services and Capital Market Act of Korea (“FSCMA”).
Spain: This document is a research report and it is addressed to institutional investors only. The research report is of a general nature and not personalised and does not constitute investment advice so, as the case may be, the recipient must seek proper advice before adopting any investment decision. This document does not constitute a public offering of securities.
CGS-CIMB is not registered with the Spanish Comision Nacional del Mercado de Valores to provide investment services.
Sweden: This report contains only marketing information and has not been approved by the Swedish Financial Supervisory Authority. The distribution of this report is not an offer to sell to any person in Sweden or a solicitation to any person in Sweden to buy any instruments described herein and may not be forwarded to the public in Sweden.
Switzerland: This report has not been prepared in accordance with the recognized self-regulatory minimal standards for research reports of banks issued by the Swiss Bankers’ Association (Directives on the Independence of Financial Research).
Thailand: This report is issued and distributed by CGS-CIMB Securities (Thailand) Co. Ltd. (“CGS-CIMB Thailand”) based upon sources believed to be reliable (but their accuracy, completeness or correctness is not guaranteed). The statements or expressions of opinion herein were arrived at after due and careful consideration for use as information for investment. Such opinions are subject to change without notice and CGS-CIMB Thailand has no obligation to update its opinion or the information in this research report.
CGS-CIMB Thailand may act or acts as Market Maker, and issuer and offerer of Derivative Warrants and Structured Note which may have the following securities as its underlying securities. Investors should carefully read and study the details of the derivative warrants in the prospectus before making investment decisions.
AAV, ADVANC, AMATA, ANAN, AOT, AP, BA, BANPU, BBL, BCH, BCP, BCPG, BDMS, BEAUTY, BEC, BEM, BJC, BH, BIG, BLA, BLAND, BPP, BTS, CBG, CENTEL, CHG, CK, CKP, COM7, CPALL, CPF, CPN, DELTA, DTAC, EA, EGCO, EPG, GFPT, GLOBAL, GLOW, GPSC, GUNKUL, HMPRO, INTUCH, IRPC, ITD, IVL, KBANK, KCE, KKP, KTB, KTC, LH, LHBANK, LPN, MAJOR, MALEE, MEGA, MINT, MONO, MTLS, PLANB, PSH, PTL, PTG, PTT, PTTEP, PTTGC, QH, RATCH, ROBINS, S, SAWAD, SCB, SCC, SCCC, SIRI, SPALI, SPRC, STEC, STPI, SUPER, TASCO, TCAP, THAI, THANI, THCOM, TISCO, TKN, TMB, TOP, TPIPL, TRUE, TTA, TU, TVO, UNIQ, VGI, WHA, WORK.
Corporate Governance Report:
The disclosure of the survey result of the Thai Institute of Directors Association (“IOD”) regarding corporate governance is made pursuant to the policy of the Office of the Securities and Exchange Commission. The survey of the IOD is based on the information of a company listed on the Stock Exchange of Thailand and the Market for Alternative Investment disclosed to the public and able to be accessed by a general public investor. The result, therefore, is from the perspective of a third party. It is not an evaluation of operation and is not based on inside information.
The survey result is as of the date appearing in the Corporate Governance Report of Thai Listed Companies. As a result, the survey result may be changed after that date. CGS-CIMB Thailand does not confirm nor certify the accuracy of such survey result.
Score Range: 90 - 100 80 – 89 70 - 79 Below 70 or No Survey Result
Description: Excellent Very Good Good N/A
United Arab Emirates: The distributor of this report has not been approved or licensed by the UAE Central Bank or any other relevant licensing authorities or governmental agencies in the United Arab Emirates. This report is strictly private and confidential and has not been reviewed by, deposited or registered with UAE Central Bank or any other licensing authority or governmental agencies in the United Arab Emirates. This report is being issued outside the United Arab Emirates to a limited number of institutional investors and must not be provided to any person other than the original recipient and may not be reproduced or used for any other purpose. Further, the information contained in this report is not intended to lead to the sale of investments under any subscription agreement or the conclusion of any other contract of whatsoever nature within the territory of the United Arab Emirates.
United Kingdom and European Economic Area (EEA): In the United Kingdom and European Economic Area, this material is also being distributed by CGS-CIMB Securities (UK) Limited (“CGS-CIMB UK”). CGS-CIMB UK is authorized and regulated by the Financial Conduct Authority

ASEAN
Strategy Note - Alpha series │ December 19, 2018
51
and its registered office is at 27 Knightsbridge, London, SW1X7YB. The material distributed by CGS-CIMB UK has been prepared in accordance with CGS-CIMB’s policies for managing conflicts of interest arising as a result of publication and distribution of this material. This material is for distribution only to, and is solely directed at, selected persons on the basis that those persons: (a) are eligible counterparties and professional clients of CGS-CIMB UK; (b) have professional experience in matters relating to investments falling within Article 19(5) of the Financial Services and Markets Act 2000 (Financial Promotion) Order 2005 (as amended, the “Order”), (c) fall within Article 49(2)(a) to (d) (“high net worth companies, unincorporated associations etc”) of the Order; (d) are outside the United Kingdom subject to relevant regulation in each jurisdiction, material(all such persons together being referred to as “relevant persons”). This material is directed only at relevant persons and must not be acted on or relied on by persons who are not relevant persons. Any investment or investment activity to which this material relates is available only to relevant persons and will be engaged in only with relevant persons.
Where this material is labelled as non-independent, it does not provide an impartial or objective assessment of the subject matter and does not constitute independent “research” (cannot remove research from here under the applicable rules of the Financial Conduct Authority in the UK. Consequently, any such non-independent material will not have been prepared in accordance with legal requirements designed to promote the independence of research (cannot remove research from here) and will not subject to any prohibition on dealing ahead of the dissemination of research. Any such non-independent material must be considered as a marketing communication.
United States: This research report is distributed in the United States of America by CGS-CIMB Securities (USA) Inc, a U.S. registered broker-dealer and a related company of CGS-CIMB Research Pte Ltd, PT CGS-CIMB Sekuritas Indonesia, CGS-CIMB Securities (Thailand) Co. Ltd, CGS-CIMB Securities (Hong Kong) Limited, CGS-CIMB Securities (India) Private Limited, and is distributed solely to persons who qualify as “U.S. Institutional Investors” as defined in Rule 15a-6 under the Securities and Exchange Act of 1934. This communication is only for Institutional Investors whose ordinary business activities involve investing in shares, bonds, and associated securities and/or derivative securities and who have professional experience in such investments. Any person who is not a U.S. Institutional Investor or Major Institutional Investor must not rely on this communication. The delivery of this research report to any person in the United States of America is not a recommendation to effect any transactions in the securities discussed herein, or an endorsement of any opinion expressed herein. CGS-CIMB Securities (USA) Inc, is a FINRA/SIPC member and takes responsibility for the content of this report. For further information or to place an order in any of the above-mentioned securities please contact a registered representative of CGS-CIMB Securities (USA) Inc.
CGS-CIMB Securities (USA) Inc. does not make a market on other securities mentioned in the report.
CGS-CIMB Securities (USA) Inc. has not managed or co-managed a public offering of any of the securities mentioned in the past 12 months.
CGS-CIMB Securities (USA) Inc. has not received compensation for investment banking services from any of the company mentioned in the past 12 months.
CGS-CIMB Securities (USA) Inc. neither expects to receive nor intends to seek compensation for investment banking services from any of the company mentioned within the next 3 months.
Other jurisdictions: In any other jurisdictions, except if otherwise restricted by laws or regulations, this report is only for distribution to professional, institutional or sophisticated investors as defined in the laws and regulations of such jurisdictions.
Corporate Governance Report of Thai Listed Companies (CGR). CG Rating by the Thai Institute of Directors Association (Thai IOD) in 2018, Anti-Corruption 2018
ADVANC – Excellent, Certified, AEONTS – Good, n/a, AH – Very Good, n/a, AMATA – Excellent, Declared, ANAN – Excellent, Declared, AOT – Excellent, Declared, AP – Excellent, Certified, ASP – Very Good, Certified, BANPU – Excellent, Certified, BAY – Excellent, Certified, BBL – Very Good, Certified, BCH – Good, Certified, BCP - Excellent, Certified, BCPG – Excellent, Certified, BEM – Very Good, n/a, BDMS – Very Good, n/a, BEAUTY – Good, n/a, BEC – Very Good, n/a, , BGRIM – Very Good, Declared, BH - Good, n/a, BJC – Very Good, Declared, BJCHI – Very Good, Certified, BPP – Very Good, Declared, BR - Good, Declared, BTS - Excellent, Certified, CBG – Very Good, n/a, CCET – Good, n/a, CENTEL – Very Good, Certified, CHG – Very Good, Declared, CK – Excellent, n/a, COL – Excellent, Declared, CPALL – Very Good, Certified, CPF – Excellent, Certified, CPN - Excellent, Certified, DELTA - Excellent, n/a, DEMCO – Excellent, Certified, DDD – Very Good, Declared, DIF – not available, n/a, DTAC – Excellent, Certified, EA – Excellent, n/a, ECL – Very Good, Certified, EGCO - Excellent, Certified, EPG – Very Good, n/a, ERW – Very Good, n/a, GFPT - Excellent, Certified, GGC – Excellent, Certified, GLOBAL – Very Good, n/a, GLOW – Very Good, Certified, GPSC – Excellent, Certified, GULF – Very Good, n/a, GUNKUL – Excellent, Certified, HANA - Excellent, Certified, HMPRO - Excellent, Certified, HREIT - Excellent, Certified ICHI – Excellent, Declared, HUMAN – not available, n/a, III – Good, n/a, INTUCH - Excellent, Certified, IRPC – Excellent, Certified, ITD* – Very Good, n/a, IVL - Excellent, Certified, JASIF – not available, n/a, KBANK - Excellent, Certified, KCE - Excellent, Certified, KKP – Excellent, Certified, KSL – Excellent, Certified, KTB - Excellent, Certified, KTC – Excellent, Certified, LH - Very Good, n/a, LPN – Excellent, Certified, M – Very Good, Certified, MACO – Very Good, n/a, MAJOR – Very Good, n/a, MAKRO – Excellent, Declared, MALEE – Very Good, Certified, MC – Very Good, Certified, MCOT – Excellent, Certified, MEGA – Very Good, n/a, MINT - Excellent, Certified, MTC – Excellent, Declared, NETBAY – Good, n/a, PLANB – Excellent, Declared, PLAT – Very Good, Certified, PSH – Excellent, Certified, PSTC – Good, Certified, PTT - Excellent, Certified, PTTEP - Excellent, Certified, PTTGC - Excellent, Certified, QH – Excellent, Certified, RATCH – Excellent, Certified, ROBINS – Excellent, Certified, RS – Very Good, n/a, RSP – not available, n/a, SAMART - Excellent, n/a, SAPPE – Very Good, Declared, SAT – Excellent, Certified, SAWAD – Very Good, n/a, SC – Excellent, Declared, SCB - Excellent, Certified, SCC – Excellent, Certified, SCN – Very Good, Certified, SF – Good, n/a, SIRI – Very Good, Certified, SPA - Good, n/a, SPALI - Excellent, n/a, SPRC – Excellent, Certified, STA – Very Good, Certified, STEC – Excellent, n/a, SVI – Excellent, Certified, SYNEX – Very Good, Declared, TASCO – Excellent, Certified, TCAP – Excellent, Certified, TIPCO – Very Good, Certified, TISCO - Excellent, Certified, TKN – Very Good, Declared, TMB - Excellent, Certified, TNR – Very Good, Declared, TOP - Excellent, Certified, TPCH – Good, n/a, TPIPP – Good, n/a, TRUE – Excellent, Certified, TU – Excellent, Certified, TVO – Very Good, Declared, UNIQ – Good, n/a, VGI –
Rating Distribution (%) Investment Banking clients (%)
Add 60.5% 4.2%
Hold 25.8% 2.4%
Reduce 13.7% 0.4%
Distribution of stock ratings and investment banking clients for quarter ended on 30 September 2018
759 companies under coverage for quarter ended on 30 September 2018

ASEAN
Strategy Note - Alpha series │ December 19, 2018
52
Excellent, Certified, WHA – Excellent, Certified, WHART – not available, n/a, WORK – Good, n/a. Companies participating in Thailand’s Private Sector Collective Action Coalition Against Corruption programme (Thai CAC) under Thai Institute of Directors (as of August 31, 2018) are categorized into:
- Companies that have declared their intention to join CAC, and
- Companies certified by CAC
* The company, its director or management had been reportedly accused for breaching proper corporate governance such as violation of the SEC’s regulations or charged with corruption.
RECOMMENDATION FRAMEWORK
Stock Ratings Definition:
Add The stock’s total return is expected to reach 15% or higher over the next 12 months.
Hold The stock’s total return is expected to be between negative 10% and positive 15% over the next 12 months.
Reduce The stock’s total return is expected to fall below negative 10% over the next 12 months.
The total expected return of a stock is defined as the sum of the:(i) percentage difference between the target price and the current price and (ii) the forward net dividend yields of the stock. Stock price targets have an investment horizon of 12 months.
Sector Ratings Definition:
Overweight An Overweight rating means stocks in the sector have, on a market cap-weighted basis, a positive absolute recommendation.
Neutral A Neutral rating means stocks in the sector have, on a market cap-weighted basis, a neutral absolute recommendation.
Underweight An Underweight rating means stocks in the sector have, on a market cap-weighted basis, a negative absolute recommendation.
Country Ratings Definition:
Overweight An Overweight rating means investors should be positioned with an above-market weight in this country relative to benchmark.
Neutral A Neutral rating means investors should be positioned with a neutral weight in this country relative to benchmark.
Underweight An Underweight rating means investors should be positioned with a below-market weight in this country relative to benchmark.
Anirban Lahiri – Head of Research, Vietnam Email: [email protected]
– Email: – Email: – Email: VNDIRECT Securities Corporation 1 Nguyen Thuong Hien Str – Hai Ba Trung Dist – Ha Noi │ Tel: +84 2439724568 Email: [email protected] │ Website: https://vndirect.com.vn