Embed Size (px)
Citation preview

ed-CK / sa- YM, PY
Flying a little lower
Airline earnings in 2017 to see margin pressure
from higher fuel cost
Aircraft deliveries reaccelerating after two-year
slowdown, yields to see downwards pressure
Structural regional growth in fleet and passengers
bodes well for aeronautical support and airport
players
ASEAN airline picks: AIRA MK, AAV TB, CEB PM;
other aviation picks: AOT TB, CAO SP, STE SP
Carrier earnings moving out of sweet spot as fuel prices
depart from bottom. ASEAN airlines are (for the most part) on track for record CY16 performances on the back of the trough in jet fuel prices. However, the CY17 outlook is less benign as fuel has tracked crude oil prices’ upward trend. We think margins will be squeezed from the bottom, as average cost/available-seat-kilometre (ASKs) will be pushed up – our current CY2017 forecast for jet fuel is US$60/bbl, c.13% higher than 2016’s US$52.9/bbl average.
More planes to fill the skies. Capacity growth is on the cards for most airlines after a general lull in 2015-16, as strong CY16 earnings bolstered balance sheets and expansion plans. Even those adding fewer aircraft aim to improve volume. We think competition is set to rise which will pull down average fares as airlines attempt to drive up or maintain load factors.
Preference for airlines with market share strongholds.
Overall, we are unperturbed by the likely step-down in airline profits as it comes from a high base. In this environment, we prefer airlines with stronger market shares and thus more flexibility in tweaking the levers (price / volume) to strengthen their position or achieve their desired bottomlines. Top BUY recommendations along this theme are: AirAsia (AIRA MK), Asia Aviation (AAV TB), and Cebu Air (CEB PM).
AoT remains a favoured pick while we also like CAO and
ST Engineering. We prefer AoT to MAHB given the former’s strong earnings growth prospects, which is driven by Thailand’s dynamic tourism sector. We also like China Aviation Oil (CAO) as a proxy for China’s firm civil air travel demand growth and finally, we prefer ST Engineering to SIA Engineering as it has a strong order pipeline to underpin earnings and dividend visibility.
KLCI : 1,688.50 STI : 3,071.64 SET : 1,589.29
Analyst Marvin KHOR +60 32604 3911 Paul YONG CFA +65 6682 3712 [email protected] [email protected]
Suvro SARKAR +65 6682 3720 Namida ARTISPONG +66 2657 7833 [email protected] [email protected]
Singapore Research Team [email protected]
Source: AllianceDBS, DBS Bank, Bloomberg Finance L.P. Closing price as of 9 Feb 2017
AirAsia : Low cost carrier based in Malaysia with similar-branded associates across Asia AirAsia X : Long-haul low cost carrier based in Malaysia Airports of Thailand : The national airport operator managing six international airports throughout Thailand, including Suvarnabhumi Airport in Bangkok. Asia Aviation : Majority owner of Thai AirAsia, low cost carrier based in Thailand Bangkok Airways : Full service regional carrier with hubs in Bangkok and Samui, and is also a major and controlling shareholder of Samui Airport Property Fund Cebu Air : Low cost carrier based in the Philippines China Aviation Oil : CAO is the largest physical jet fuel trader in the Asia Pacific region and the key importer of jet fuel into the PRC. Garuda Indonesia : Garuda Indonesia (GIAA) is the national flag carrier of Indonesia focusing in passenger and cargo service. Malaysia Airports : Malaysia's primary airport operator, also operating the Istanbul Sabiha Gokcen airport SIA Engineering : Provision of aviation maintenance, repair and overhaul services Singapore Airlines : Singapore Airlines owns and operates SIA, SIA Cargo and Silk Air, Scoot. They also own majority stakes in SGX-listed SIA Engineering and Tigerair. ST Engineering : An integrated engineering group providing solutions and services in aerospace, electronics, land systems and marine sectors. Thai Airways : National Carrier of Kingdom of Thailand
DBS Group Research . Equity 10 Feb 2017
ASEAN Industry Focus
ASEAN Aviation
Refer to important disclosures at the end of this report
STOCKS
12-mth
Price Mkt Cap Target Price Performance (%)
RM US$m RM 3 mth 12 mth Rating
AirAsia 2.70 2,032 3.25 (4.3) 92.9 BUY AirAsia X 0.41 383 0.38 (4.7) 70.8 HOLD Airports of Thailand 42.00 1,713 45.50 12.6 12.3 BUY Asia Aviation 6.10 845 7.60 (14.1) 9.9 BUY Bangkok Airways 21.30 1,277 26.30 (13.8) (11.3) BUY Cebu Air 96.40 1,171 125 (9.5) 24.4 BUY China Aviation Oil 1.48 900 1.70 6.1 126.9 BUY Garuda Indonesia 338 658 475 (4.5) (17.2) BUY Malaysia Airports 6.70 2,504 6.80 4.2 9.1 HOLD SIA Engineering 3.61 2,856 3.58 2.9 3.7 HOLD Singapore Airlines 9.80 8,175 10.10 (0.2) (12.8) HOLD ST Engineering 3.33 7,309 3.68 8.5 20.7 BUY Thai Airways 21.90 1,365 23.25 (19.6) 163.9 HOLD

Industry Focus
ASEAN Aviation
Page 2
Executive summary – airline earnings coming off peak
Aviation players in the ASEAN region are (mostly) largely on track to achieve stellar earnings in 2016, on the back of earlier anticipated factors of 1) bottoming of effective jet fuel prices, and 2) favourable supply-demand conditions from slower aircraft deliveries.
Moving into 2017, we think margins are set to come under some pressure as those factors unwind, with a number of airlines under our coverage expected to see dips in core earnings – except those charting low 2016 bases from underperformance due to respective specific reasons.
Regional airlines’ 9M16 core earnings (local currency)
9MCY16 9MCY15 % variance
AAV (THB m) 1,674 1,047 +60%AAX (RM m) 151 (217) turnaround AIRA (RM m) 923 165 +>100% BA (THB m) 2,535 1,740 +46% CEB (PHP m) 7,574 4,449 +70% GIAA (US$ m) (22) 16 n.m. SIA (S$ m)* 546 356 53% THAI (THB m) 3,349 (4,621) turnaround
Source: Companies, DBS Bank, AllianceDBS * FYE Mar
However, we are not overly concerned with a prospective decline – as it would not be outside the norm for global airline peers. The International Air Transport Association (IATA) has forecasted 2017 global airline industry net profit of US$29.8bn, 16% down from US$35.6bn it projected for 2016. For Asia-Pacific carriers in particular, IATA forecasted an aggregated 14% decline in 2017 net profit to US$6.3bn, from US$7.3bn expected for 2016. We observe two key reasons for the broad decline for ASEAN airline earnings: 1) the gradual uptick in fuel prices, and 2) easing of average fares due to competition. Industry traffic growth is expected to record a decent pace, though unable to overcome margin erosion implied by the two headwind factors. Airlines we favour under such circumstances are those with higher control over volume – i.e. with strong demand positioning or captive markets.
Regional airlines’ FY16/17F core earnings forecasts (local
currency)
FY17F FY16F % variance
AAV (THB m) 2,215 2,322 (5%)AAX (RM m) 189 206 (8%)AIRA (RM m) 975 1,334 (27%)BA (THB m) 3,011 3,286 (8%)CEB (PHP m) 9,480 9,892 (4%)GIAA (US$ m) 49 10 >100%SIA (S$ m)* 684 629 9%THAI (THB m) 4,882 4,590 6%
Source: Companies, DBS Bank, AllianceDBS * FYE Mar, figures are FY18F/FY17F respectively
Given this outlook, we also find other aviation plays like airports and aerospace maintenance, report & operations (MRO) firms provide a good avenue for exposure to ASEAN aviation. Passenger traffic demand is picking up in both Malaysia and Singapore, while Thailand is expected to rebound to being a key ASEAN tourist draw after a short blip given the crackdown on ‘zero-dollar’ tours that hurt China visitations. MRO players are a natural beneficiary of higher aircraft volumes in the region, for which Asia is also a good longer-term prospect as the propensity to travel grows.
Airlines regaining growth ambitions
ASEAN airlines are looking at larger fleet growth in 2017. We think this is in part incentivised by strong financial performances in 2016 – which had for many airlines grew or rejuvenated cash piles and book values. Across our coverage, we expect a net fleet growth of 35 (from 27 expected in 2016), which adds on the expected growth from competitors as well. This is led by Malaysia and Thai AirAsia with planned increases of seven and six, respectively, which we view as the group’s strategy to entrench its domestic market share dominance. Notably, demand appears to be skewed towards short-haul and/or low-cost aircraft; and with less demand for new long-haul capacity. No new planes are expected for Malaysia AirAsia X, and players like Bangkok Air and Garuda are only adding to their short-haul aircraft (the latter via low-cost unit Citilink).
Page 2

Industry Focus
ASEAN Aviation
Page 3
Expected year-end active fleet counts (non-exhaustive)
2017F Net chg 2016E
Net chg 2015
Thailand
Thai AirAsia 57 +6 51 +6 45
Bangkok Air 39 +4 35 +4 31
Thai Airways 97 +2 95 - 95
Nok Airways 34 +1 33 +5 28
Thai AirAsia X 6 - 6 +1 5
Thai Lion 24 +6 18
Thai VietJet 3 +2 1
NokScoot 5 +2 3 - 3
Malaysia
Malaysia AirAsia 84 +7 77 -3 80
Malaysia AirAsia X 22 - 22 +2 20
Malaysia Airlines 87 +9 78
Malindo / Batik M’sia 52 +10 42 +15 27
Singapore
Singapore Airlines (main) 110 1 109 7 102
Silk Air 35 4 31 2 29
Tiger + Scoot 38 3 35 - 35
Philippines
Cebu Air 59 +2 57 +2 55
PAL 66 +4 62 +4 58
Philippines AirAsia 18 +4 14 - 14
Indonesia
Garuda (mainline) 144 - 144 +1 143
Citilink 56 +4 52 +8 44
Indonesia AirAsia 24 +2 22 -2 25
Indonesia AirAsia X 2 - 2 - 2
Lion Air (+Wings + Batik) 233 +22 204 +16 188
Source: CAPA, companies, DBS Bank, AllianceDBS Major unlisted player Lion Group continues to be a major contender in terms of capacity through its network comprising Indonesian LCCs (Lion Air, Wings Air) and FSC (Batik Air), Malaysian FSC (Malindo – soon Batik Malaysia), and Thai LCC (Thai Lion Air). The group’s burgeoning orderbook of 442 aircraft at the start of 2017 implies that growth must continue, despite a slowdown in deliveries in 2016, which had contributed to the sector’s stronger margin performance. CAPA estimates that the group is set to receive 32 (non-turboprop) aircraft in 2017 – which after removing the 10 slated for Malindo, leaves 22 to be split among Thai Lion Air and its Indonesian units.
Fares and yields to pare down as airlines opt for volume
Given the competitive environment above, we expect yields (fares/RPK) to broadly pare down for the ASEAN airlines. We contrast the yield movement below relative to industry capacity growth for each of the major markets, where it had demonstratively fallen in higher competitive scenarios. The main exception will be the Thai airlines, in particular those serving domestic routes – which be imposing an additional Bt150-200 per flight to pass on newly hiked jet fuel excise taxes. See further elaboration in “Thailand’s domestic jet fuel excise quandary” section below. Additionally, yield, capacity and load factor also generally show a trade-off pattern, where higher capacity growth impact yield or load factor or both adversely, and vice versa. For example, ambitious capacity growth from Malaysia AirAsia X from 2Q13 to 1Q14 resulted in a concurrent severe decline in yield; it is apparent that during this time, AirAsia X sacrificed yield amid capacity growth to maintain a reasonable level of load factor. In contrast, after the capacity tapering, which started in 1Q14, Singapore Tigerair is now enjoying higher load factors. Another important factor in yields is the fuel surcharge which now has been abolished. Reaching as high as one-fifth of total yields at its peak, fuel surcharges have largely been removed by airlines following the collapse of jet fuel prices since late-2014, driving down yields external to supply-demand conditions. Malaysia Fare/RPK (in local currency) y-o-y changes - Malaysia
Source: Companies, DBS Bank, AllianceDBS
‐30%
‐20%
‐10%
0%
10%
20%
30%
1Q13
2Q13
3Q13
4Q13
1Q14
2Q14
3Q14
4Q14
1Q15
2Q15
3Q15
4Q15
1Q16
2Q16
3Q16
Malaysia AirAsia Malaysia AirAsia X
Page 3

Industry Focus
ASEAN Aviation
Page 4
Capacity (y-o-y changes) - Malaysia
Source: Companies, DBS Bank, AllianceDBS Load factors - Malaysia
Source: Companies, DBS Bank, AllianceDBS Thailand Fare/RPK (local currency) y-o-y changes - Thailand
Source: Companies, DBS Bank, AllianceDBS
Capacity y-o-y changes - Thailand
Source: Companies, DBS Bank, AllianceDBS Load factors - Thailand
Source: Companies, DBS Bank, AllianceDBS Singapore Fare/RPK (local currency) y-o-y changes - Singapore
Source: Companies, DBS Bank, AllianceDBS
‐25%
‐20%
‐15%
‐10%
‐5%
0%
5%
10%
15%
20%
1Q13
2Q13
3Q13
4Q13
1Q14
2Q14
3Q14
4Q14
1Q15
2Q15
3Q15
4Q15
1Q16
2Q16
3Q16
Thai AirAsia Bangkok Air Thai Airways Nok Air
-20%
-10%
0%
10%
20%
30%
40%
50%
60%
Malaysia AirAsia Malaysia AirAsia X
55%
60%
65%
70%
75%
80%
85%
90%
Malaysia AirAsia Malaysia AirAsia X
-10%
0%
10%
20%
30%
40%
50%
Thai AirAsia Bangkok Air Thai Airways Nok Air
55%
60%
65%
70%
75%
80%
85%
90%
Thai AirAsia Bangkok Air Thai Airways Nok Air
-15%
-10%
-5%
0%
5%
10%
SIA mainline Silkair Tigerair Scoot
Page 4

Industry Focus
ASEAN Aviation
Page 5
Capacity y-o-y changes - Singapore
Source: Companies, DBS Bank, AllianceDBS Load factors - Singapore
Source: Companies, DBS Bank, AllianceDBS Indonesia Fare/RPK (local currency) y-o-y changes - Indonesia
Source: Companies, DBS Bank, AllianceDBS
Capacity (y-o-y changes) - Indonesia
Source: Companies, DBS Bank, AllianceDBS Load factors - Indonesia
Source: Companies, DBS Bank, AllianceDBS Philippines Fare/RPK (local currency) y-o-y changes - Philippines
Source: Companies, DBS Bank, AllianceDBS
‐25%
‐20%
‐15%
‐10%
‐5%
0%
5%
10%
1Q13
2Q13
3Q13
4Q13
1Q14
2Q14
3Q14
4Q14
1Q15
2Q15
3Q15
4Q15
1Q16
2Q16
3Q16
Cebu Air
‐20%
‐15%
‐10%
‐5%
0%
5%
10%
15%
20%
25%
1Q13
2Q13
3Q13
4Q13
1Q14
2Q14
3Q14
4Q14
1Q15
2Q15
3Q15
4Q15
1Q16
2Q16
3Q16
Garuda (group) Indonesia AirAsia
-20%
-10%
0%
10%
20%
30%
40%
50%
60%
SIA mainline Silkair Tigerair Scoot
65%
70%
75%
80%
85%
90%
SIA mainline Silkair Tigerair Scoot
-30%
-20%
-10%
0%
10%
20%
30%
40%
50%
60%
Garuda (group) Indonesia AirAsia
65%
70%
75%
80%
85%
90%
Garuda (group) Indonesia AirAsia
Page 5

Industry Focus
ASEAN Aviation
Page 6
Capacity (y-o-y changes) and load factors - Philippines
Source: Companies, DBS Bank, AllianceDBS The LCC factor on yields
A factor frequently associated with easing average industry yield growth is the prevalence of low cost carriers or LCCs, which had been a key factor boosting air travel over the 00s. LCC market penetration for ASEAN air travel had stagnated for two years since 2014, implying it may be near to a mature level for ASEAN. LCC market share: intra- & to/from ASEAN
Source: CAPA, AllianceDBS, DBS Bank After peaking at 57% in 2014, the proportion of LCC seats over total seats available for intra-ASEAN flights had pared down to 56% in 2015 and further to 54% in 9M16. This trend was slightly less noticeable for flights to/from ASEAN, which has lower LCC share justified by mostly longer average flight times. Breaking it down, LCC seat growth for intra-ASEAN air travel had, for the first time since 2015, grown at a slower (9%) pace than that of total seat growth (10%). On one hand, this may be due to the simple maturing exposure of ASEAN to the LCC concept. However, the removal of fuel surcharges has
brought down the relative price difference between FSC and LCC average fares – which we think made FSCs more competitive and viable as a growth model. Going forward, we see LCC market penetration to be steady – evidenced by the two largest groups AirAsia and Lion Air choosing different tactics in service expansion (continued LCC for the former, and more FSC products for the latter). LCC vs total seat growth – intra-ASEAN segment
Source: CAPA, AllianceDBS, DBS Bank Jet fuel tracking crude oils tentative uphill climb
The severe collapse in oil and jet fuel prices were instrumental in the record profitability logged in 2016, but the bottom appears to have come to pass in 1Q16. Right now, jet fuel has reached levels of above US$60/bbl (our average forecast for 2017), contrasting with the average of US$52/bbl in 2016. This is expected to contribute to cost/ASK rising up to 7% among our coverage. Jet fuel price FOB Singapore (US$/barrel)
Source: Bloomberg Finance L.P., DBS Bank, AllianceDBS
30
40
50
60
70
80
90
Jan-15 Apr-15 Jul-15 Oct-15 Jan-16 Apr-16 Jul-16 Oct-16 Jan-17
Spot jet fuel (US$/bbl) Calendar quarter average
70%
72%
74%
76%
78%
80%
82%
84%
86%
0%
5%
10%
15%
20%
25%
30%
35%
Cebu Air Load Factor (RHS) Cebu Air Capacity Growth (LHS)
32%37%
41%43%
45% 47%
54%57.0% 56.4%
54.2%
17% 19% 20% 21% 22% 22% 24% 24.2% 23.7% 23.7%
0%
10%
20%
30%
40%
50%
60%
2007 2008 2009 2010 2011 2012 2013 2014 2015 Jan-Sep2016
LCC market share - intra-ASEANLCC market share - to/from ASEAN
10.2%
9.0%
0%
5%
10%
15%
20%
25%
30%
35%
0
50
100
150
200
250
300
350
2007 2008 2009 2010 2011 2012 2013 2014 2015 Jan-Sep2016
Total seats - intra-ASEAN (m) LCC seats - intra-ASEAN (m)
Growth - Total Growth - LCC
Page 6
Industry Focus
ASEAN Aviation
Page 7
Airline cost/ASK to rise
FY17F FY16F % variance AAV (THB) 1.51 1.42 6.3% AAX (RM sen) 13.5 12.7 5.6% AIRA (RM sen) 13.4 12.5 7.3% BA (THB) 3.30 3.19 3.2% CEB (PHP m) 2.00 1.89 5.5% GIAA (US ct) 6.14 6.23 (1.5%) SIA (S ct)* 9.36 9.14 2.4% THAI^ (THB) 14.9 14.8 0.5%
Source: Bloomberg L.P., DBS Bank, AllianceDBS * FY18F end-Mar ^cost/ATK Thailand’s domestic jet fuel excise quandary
The Thai Excise Department had in Jan 2017 raised excise taxes on jet fuel for domestic flights to the higher of Bt3 or 23% of price per litre; from Bt0.2 or 1% before. At current spot jet fuel prices of c.USD65/bbl, this works out to c.US$13-15/bbl. The municipal tax (10%) and VAT (7%) on the excise amount will thus also grow in tandem. Given the large impact, the changes necessitated key local-serving carriers like Thai AirAsia, Nok Air and Thai Lion Air to announce fare hikes of Bt150, and Bangkok Airways of Bt200, per flight. This represents upwards of c.6%-9% of their average fare/passenger currently (higher because shorter-haul domestic flights would likely have cheaper fares than the average). Calculation of preliminary incremental excise tax impact
Source: Companies, AllianceDBS, DBS Bank
Quantum of fare hike over current average fares
Source: Companies, AllianceDBS, DBS Bank Overall, the fare hikes offset most but not all of the impact – we cut estimates by up to 14% after imputing the changes. A potential after-effect in our view is that the higher prices may make passengers more selective in picking air travel – airlines may find that stronger market shares can help mitigate this. Airline fuel price sensitivity
Our current base case assumption is for spot jet fuel to average US$60/bbl in 2017 (2016: US$52.9/bbl) – however airlines would see different effective prices depending on their respective hedging levels. Among our coverage, a sensitivity analysis for a US$5/bbl deviation from our spot jet fuel assumption of US$60/bbl would result in FY17F (FY18F for SIA) negative earnings impact of 3-33%). Note that this looks at changes to spot prices, meaning that the impact is diluted by the hedges the respective airlines have in place. FY17F jet fuel hedges
FY17F hedge %
(inc planned) Approx. hedge price (US$/bbl)
AAV 74% 60 AAX 74% 60 AIRA 74% 60 BA 38% 57 CEB^ 41% 65 GIAA Up to 50% - SIA*^ 32% 65 THAI 43% -
Source: Companies, DBS Bank, AllianceDBS * FY18F end-Mar ^includes hedges of Brent crude
AAV BA* NOK^
9M16 avg fare / passenger (Bt) 1616 3196 1686Fare increase (Bt) 150 200 150Share of previous avg fare 9.3% 6.3% 8.9%
*domestic segment only^not under coverage
USDTHB Inc re me nta l excise
tax
Jet fuel (US$/bbl)
Inc re me nta l % of current price
Revised* Previous (US$/bbl)b a
3.3 0.2 35.2 14 65 22%
*assuming 23% of current spot
FY17F fuel req. (m bbls)
Assumed % for
domestic use
Incremental cost
(THB m) - 11M
Previous FY17F
earnings (THB m)*
% of current
forecasts
c d= (a *b) *
(c *d)AAV 4.2 50% 946 2570 37%BA 1.4 60% 387 3488 11%THAI 19.1 5% 433 5270 8%
*before our net earnings adjustment
Excise tax (THB/litre)
Page 7

Industry Focus
ASEAN Aviation
Page 8
FY17F earnings forecasts changes per US$5/bbl
deviation from US$60/bbl base assumption for jet fuel
FY17F
adjusted FY17F % variance AAV (THB m) 2,113m 2,215m (5%) AAX (RM m) 143m 189m (24%) AIRA (RM m) 947m 975m (3%) BA (THB m) 2,898m 3,011m (4%) CEB (PHP m) 8,874m 9,480m (6%) GIAA (US$ m) 32.9m 49.3m (33%) SIA (S$ m)* 598m 682m (12%) THAI (THB m) 3,287m 4,882m (33%)
Source: Companies, DBS Bank, AllianceDBS * FY18F end-Mar This relatively mild increase (or indeed any further spikes) may not result in the immediate collapse of airline earnings, somewhat like the initial oil price collapse took time to raise airline profitability. This is simply because of the hedges airlines have employed are up to or even above half of their expected requirements in 2017. As such a sustained increase will only have more meaningful impact in 2018, wherein the operating landscape may yet shift again to accommodate the higher cost environment. Over the past five years, fuel costs as a % of overall cost/ASK has deteriorated from 23-50% to 20-40% AirAsia cost per ASK breakdown (RM sen)
Source: Bloomberg Finance L.P., DBS Bank, AllianceDBS
Thai AirAsia cost per ASK breakdown (THB)
Source: Bloomberg Finance L.P., DBS Bank, AllianceDBS SIA cost per ASK breakdown (S$ cents)
Source: Bloomberg Finance L.P., DBS Bank, AllianceDBS Garuda cost per ASK breakdown (US cents)
Source: Bloomberg Finance L.P., DBS Bank, AllianceDBS
42% 40%
0
2
4
6
8
10
12
14
2010 2011 2012 2013 2014 2015
Fuel Cost / ASK Cash Opex / ASK Asset Cost / ASK
38%28%
0
1
2
3
4
5
6
7
8
9
10
2011 2012 2013 2014 2015
Fuel Cost / ASK Cash Opex / ASK Asset Cost / ASK
37% 35%
0.0
0.2
0.4
0.6
0.8
1.0
1.2
1.4
1.6
1.8
2010 2011 2012 2013 2014 2015
Fuel Cost / ASK Cash Opex / ASK Asset Cost / ASK
35% 32%
0
2
4
6
8
10
12
2010 2011 2012 2013 2014 2015
Fuel Cost / ASK Cash Opex / ASK Asset Cost / ASK
Page 8

Industry Focus
ASEAN Aviation
Page 9
Cebu Air cost per ASK breakdown (PHP)
Source: Bloomberg Finance L.P., DBS Bank, AllianceDBS Will fuel prices eventually raise fares for other countries? The developments from Thailand provide some reassurance that excessive fuel price-related escalations indeed will induce airlines to pass it on via higher fares or yields. In relation to spot jet price increases, however, the chance of reintroducing surcharges at present levels appear slim given that the last instances (before being removed) were in place when prices were above the US$100/bbl level (>50% higher than current) back in 2014 and prior. Air travel demand still looking robust Demand in ASEAN remains generally positive though still below peak conditions. Air travel demand has generally been tied to economic activity in a region (i.e. correlated with GDP growth), but with more underlying potential in region where propensity to travel has yet to mature. ASEAN GDP vs ASEAN passenger (RPK) y-o-y growth
Source: ASEAN, Boeing, DBS Bank, AllianceDBS *Includes, Africa, Asia Pacific, Europe, Middle East, North America As GDP expectations for ASEAN countries remain on the mild side for 2017, air travel is accordingly not expected to chart
excessive growth. Most countries are still expecting single-digit expansion. Still confident in Thailand tourism
For Thailand, the number of international tourist arrivals to the country has been strong in the first nine months of 2016, growing by 12.4%. However, tourist arrivals growth started to slow down in Oct as the impact from crackdown on low cost zero-dollar tours by the Thai and Chinese governments have kicked in, coupled with the passing of Thailand’s beloved late King Bhumibol Adulyadej in mid-Oct in which several forms of public entertainment were banned for one month until 13 November. As a result, the Ministry of Tourism reported only 0.5% growth in international tourist arrivals to Thailand in Oct and a 4.4% fall in arrivals in Nov. Note that Chinese tourist numbers fell for the first time in Oct by 16.2% and continued to decline by 29.7% in Nov. Nevertheless, the sentiment on tourism has improved after the Thai government announced in Nov that they will lift Bt1,000 visa fee for tourists who sought visas at Thai embassies and consulates for 19 countries (including China, Bhutan, India, Taiwan). Also, the visa on arrival fee will also be cut from Bt2,000 to Bt1,000. This has been implemented from 1 Dec 2016 to 28 Feb 2017. Thanks to the government’s effort to boost tourism, international tourist arrivals increased by 1.1% in Dec while the number of Chinese tourists fell by a smaller magnitude (-16% y-o-y). In line with Ministry of Tourism’s numbers, AOT's international passenger traffic growth started to slow down in Oct with growth of 3%, followed by a negative growth (in a low single digit) in Nov. Then international passenger growth rebounded to 4% in Dec. For the full year 2016, there were 32.6m international tourists visiting Thailand, representing an increase of 8.9%. AOT: International passenger traffic at its six airports
Source: AOT, DBS Vickers For year 2017, we maintain our positive view on Thailand tourism which has shown its resilience by rebounding rapidly in the wake of several unfavourable events in the past. We believe the impact from crackdown on zero-dollar tours should be temporary and that the zero-dollar tour ban will
0%
2%
4%
6%
8%
10%
12%
14%
16%
18%
20%
2010 2011 2012 2013 2014 2015
ASEAN GDP growth Within ASEAN RPK growthASEAN to key regions* RPK growth
-5%0%5%10%15%20%25%30%35%40%45%
0
1,000
2,000
3,000
4,000
5,000
6,000
7,000
Dec
14Ja
n15
Feb1
5M
ar15
Apr
15M
ay15
Jun1
5Ju
l15
Aug
15Se
p15
Oct
15N
ov15
Dec
15Ja
n16
Feb1
6M
ar16
Apr
16M
ay16
Jun1
6Ju
l16
Aug
16Se
p16
Oct
16N
ov16
Dec
16
International movement growth yoy (RHS)
'000 passengers
43%38%
0.0
0.5
1.0
1.5
2.0
2.5
2010 2011 2012 2013 2014 2015
Fuel Cost / ASK Cash Opex / ASK Asset Cost / ASK
Page 9

Industry Focus
ASEAN Aviation
Page 10
benefit Thai tourism as a whole in a the long term from the qualitative improvement of Chinese tourists. Thailand will then be depending not only on the number of foreign tourist arrivals but also the quality of their spending per head. Nevertheless, we should see the return of Chinese tourist arrivals to Thailand given Thailand’s cost-competitive travelling and variety of destinations, as well as, the close proximity of these two countries and flight connectivity. The Tourism Authority of Thailand (TAT) expects international tourist arrivals to Thailand to grow by 7.7% to 35.1m in 2017 while Chinese arrivals are also expected to increase by 11.3% to 9.8m as tourists from zero-dollar tours were estimated to account for only 20% of arrivals last year. However, strong growth in other key feed markets such as Russia, India, the US, and the Middle East should compensate for Chinese arrivals if they were to continue to slow down. On a positive note, Russian tourists which account for 3.3% of total arrivals have showed positive signs of recovery, growing by 23.3% to 1.1m in 2016 after a long decline. Additionally, we believe the government will continue to support the tourism sector if any unfavourable event arises by lifting visa fee or offering tax rebates for domestic travel. Thailand: International tourist arrivals
Source: Ministry of Tourism and Sports (Thailand), DBS Vickers Passenger growth in Malaysia staved off two years of slowing progress, with Malaysia Airports (MAHB) reporting a 6% increase in 2016 (from 0.6% in 2015, 4.7% in 2014). Pax growth notched a long-unseen double-digit rate of c.10% in 2H16; appearing to shrug off a 24-month or 2-year slowdown (0.4% average growth) largely attributed to the airline incidences in 2014. Looking forward, MAHB’s MD Datuk Badlisham Ghazali stated its internal growth target of 5% for 2017 (and in a newer statement, 5-7%), likewise our forecast for the year. This represents a closer match with the pace of Malaysia’s nominal GDP growth from pre-2H14.
MAHB passenger growth by month, segment
Source: MAHB, DBS Bank, AllianceDBS Quarter pax growth vs Malaysia’s nominal GDP
Source: MAHB, Department of Statistics, DBS Bank, AllianceDBS In Singapore, Changi Airport pax growth charted a healthy +5.9% for 2016, showing a somewhat similar rebound trend to Malaysia. This continued improvements from 2015 (+2.5%), moving on from a relative slowdown in 2014 (+0.7%). Changi Airport’s y-o-y passenger growth
Source: Changi Airport, DBS Bank, AllianceDBS
(50%)
(40%)
(30%)
(20%)
(10%)
0%
10%
20%
30%
40%
50%
0
1
2
3
4
5
6
7
8
9
10
Jan-
13
Mar
-13
May
-…
Jul-1
3
Sep-
13
Nov
-13
Jan-
14
Mar
-14
May
-…
Jul-1
4
Sep-
14
Nov
-14
Jan-
15
Mar
-15
May
-…
Jul-1
5
Sep-
15
Nov
-15
Jan-
16
Mar
-16
May
-…
Jul-1
6
Sep-
16
Nov
-16
% y-o-ym paxDomestic pax (lhs) International pax (lhs)Dom pax growth (rhs) Int pax growth (rhs)
Period of 2H14-1H16 averaged 0.4% growth
‐15%
‐10%
‐5%
0%
5%
10%
15%
20%
25%
30%1Q
FY09
2QFY09
3QFY09
4QFY09
1QFY10
2QFY10
3QFY10
4QFY10
1QFY11
2QFY11
3QFY11
4QFY11
1QFY12
2QFY12
3QFY12
4QFY12
1QFY13
2QFY13
3QFY13
4QFY13
1QFY14
2QFY14
3QFY14
4QFY14
1QFY15
2QFY15
3QFY15
4QFY15
1QFY16
2QFY16
3QFY16
4QFY16
Total passenger growth (y‐o‐y)
Malaysian GDP growth, current prices (y‐o‐y)
600
1,000
1,400
1,800
2,200
2,600
3,000
3,400
Jan
Feb
Mar
Apr
May Jun Jul
Aug Se
p
Oct
Nov
Dec
'000 People
2009 2010 2011 20122013 2014 2015 2016
0.0%
2.0%
4.0%
6.0%
8.0%
10.0%
12.0%
36
40
44
48
52
56
60
2011 2012 2013 2014 2015 2016
Changi Airport passenger movements (m) y‐o‐y growth
Page 10

Industry Focus
ASEAN Aviation
Page 11
Aerospace MRO has steady growth potential but structural challenges persist Global air traffic outlook
Source: Boeing CMO 2016-2035 Increasing air traffic trend can be sustained in Asia. Facilitated by rapid economic growth, there has been increasing demand for air travel for the past 20 years. The air travel industry has weathered various major external shocks over the years to register a 5.4% CAGR over that period, almost double the average global GDP growth rate. Going forward, increasing per-capita income, increasing affordability and propensity to travel and the emergence of low cost carriers (LCCs) will continue to drive traffic growth, especially in emerging markets like Asia and spur the need for more aircraft and aircraft maintenance. Driven by China and India as the main engines of growth, passenger traffic in the region is forecast to grow by around 6.1% CAGR till 2035, outstripping the global growth rate of 4.8%. Liberalisation and policy initiatives like open skies and easing of visa regulations are also driving the traffic expansion in this region. Single aisle aircraft will dominate deliveries in future. Total jet aircraft fleet is expected to double over the next 20 years according to Boeing, and close to 71% of new deliveries will be single-aisle or narrowbody aircraft. Better fuel economics and lower maintenance requirements drive the replacement demand for the narrowbody fleet.
Expected global aircraft delivery demand
Source: Boeing CMO 2016-2035 Asia will dominate narrowbody aircraft demand. To accommodate the growing demand, Asia will need to add 15,130 aircraft over the next 20 years (5% CAGR), according to Boeing, nearly tripling the existing aircraft base. The growth will be driven by Low Cost Carriers (LCCs) and as a result, 40% of all new projected single aisle aircraft deliveries will be in Asia.
2380
28140
9100
0
5000
10000
15000
20000
25000
30000
Regional Jets Single Aisle Widebody
De livery demand (2016-2035)
Page 11

Industry Focus
ASEAN Aviation
Page 12
Regional variation in single aisle fleet demand
Source: Boeing CMO 2016-2035 Airline profitability trends holding up well. With oil prices falling up to 50% from the highs of 2014, airline profitability has improved significantly since 2015, as evident from the figure below. According to latest estimates from industry body IATA, airlines are expected to enjoy another good year in 2017, the third year in succession that airlines will record a return on invested capital (ROIC) that is better than the weighted average cost of capital (WACC). The strongest performance is from North America, which benefits from a strong local currency and consolidated industry structure. Airlines are likely to use the improved financial position to invest in interior upgrades, operational improvements and new planes, boosting prospects for aviation service companies like MRO providers. Airline profitability trends
Source: International Air Transport Association (IATA)
North American airlines leading profit projections
Source: International Air Transport Association (IATA) All this bodes well for MRO growth but heavy maintenance will lag. Industry consultant Oliver Wyman expects the global MRO market to grow at around 4.4% CAGR for the rest of the decade and at a slightly lower CAGR of 3.9% for the next five years to 2025. Engine MRO will remain the largest segment, with sustained engine MRO outsourcing trend. However, growth in heavy maintenance or airframe maintenance segment will be lower than average as new technology will lead to lower costs and longer schedules of heavy maintenance. Global MRO market size forecast
Source: Oliver Wyman In line with the fleet additions in the region, Asia is expected to drive the growth of the global MRO market at 6.6% CAGR over 2015-2025, with market share expanding from 27% to 35%. The North American MRO market is likely to stagnate though, as fleet additions will be offset to a large extent by retirements.
02000400060008000
100001200014000
Asia N.America
Europe MiddleEast
LatinAmerica
Africa Russiaand CIS
S ingle Aisle Fleet Development
2015 2035
-6.0%
-4.0%
-2.0%
0.0%
2.0%
4.0%
6.0%
-30.0
-20.0
-10.0
0.0
10.0
20.0
30.0
40.0
Global airline industry profitability trends
Net profit/ loss (US$bn) (LHS) Net profit margin (%) (RHS)
-5.0
0.0
5.0
10.0
15.0
20.0
25.0
NorthAmerica
Europe Asia-Pacific Middle East LatinAmerica
Africa
Industry Profitability by Region
2015 2016E 2017F
14.5 15.9 16.7
27.937.1
46.812.4
15.219.2
12.3
15.0
17.8
0.0
20.0
40.0
60.0
80.0
100.0
120.0
2015 2020 2025
Airframe Engine Components Line
4.4% CAGR
3.8% CAGR
Page 12

Industry Focus
ASEAN Aviation
Page 13
Global MRO market size forecast by geography
Source: Oliver Wyman
Structural changes in industry here to stay. Despite the steady growth potential for the MRO industry in general, MRO operators will need to reinvent to stay relevant as Original Equipment Manufacturers (OEMs) are increasingly taking a bigger share of the aftermarket space, especially for new generation planes. MRO operators will also need to invest in big data analytics and predictive maintenance software to provide value-added services to customers, given the huge amount of operational data generated by new generation aircraft. Advances in data management may also result in lower downtimes for heavy checks and fewer repairs, resulting in lower manhour revenues in future. MROs will need to compensate for this by capturing more of the value chain in predicting maintenance cycle requirements for clients and providing fleet management services.
Key structural trends in MRO industry
OEMs will see increased aftermarket presence for newgeneration aircraft
Increased need for data analysis for new generationaircraft will necessitate MROs to design rigorous datamanagement software to value-add
Health monitoring and predictive maintenance willreduce overall time for individual checks with fewerrepairs
Mature markets are stagnating and nexus of MRO willcontinue to shift to Asia
Price and customer service are key levers to compete instagnant MRO markets
Source: Oliver Wyman
STE will continue to leverage its status as the largest 3rd party MRO provider. STE’s wholly owned subsidiary, ST Aerospace is the only major 3rd party MRO operator in the Asia Pacific region, and hence, is a natural choice for many low cost carriers operating in the region. Most LCCs tend to outsource MRO activities to a large extent, and ST Aerospace remains a partner of choice for operators like Air Asia, Jetstar Asia and Lion Air. SIA Engineering, on the other hand, has developed superior capabilities for modern wide body planes, as a direct beneficiary of the fact that parent SIA is a leader in adopting new generation aircraft. Thus, the two operators rarely compete in the same segments of the market and we believe the higher growth potential of LCCs in the region with their narrowbody fleet vis-à-vis the full service carriers, where new planes are mostly meant for fleet renewal, will likely benefit ST Engineering more than SIA Engineering.
SIA Engineering has formed joint ventures with airframe OEMs. As a specialist widebody MRO provider servicing network airlines, SIE is facing a bigger challenge of OEMs bundling aftermarket services into new generation aircraft sales agreements. To overcome this, SIE has adopted a strategy of partnering with airframe OEMs to win back some of the lost revenues. In 2015, SIE incorporated a 49:51 JV with Boeing to provide fleet management services in the Asia Pacific region, having received regulatory approvals in the relevant geographies. This will help SIE to develop fleet management partnerships with airlines with Boeing fleet in the region and also open the doors for heavy maintenance business in the longer term. SIE has also established a heavy maintenance JV with Airbus (65:35) in 2016 to provide MRO services for A380, A350 and A330 aircraft in Asia Pacific and beyond. Airbus will develop the JV as its Centre of Excellence for Airbus A380 and A350 Heavy Maintenance in Asia. While near-term contribution from these JVs may not be significant, they will be crucial over the long term, in our view.
Narrowbody engine MRO is another driver for STE. As we saw earlier, global engine MRO is the largest MRO segment, and is expected to maintain the highest growth rate over the next 10 years. STE is well positioned for the growth in engine MRO with tie-ups with the top two engine manufacturers – GE and CFM. GE and CFM are expected to further increase their market share from around 57% in 2016 to 61% by 2025, according to industry consultant CAVOK/Oliver Wyman. To recall, STE has set up an engine MRO facility in Xiamen (China) for total support of CFM56 series of engines. STE also has an engine leasing joint venture with Marubeni Corp of Japan, which provides engine leasing services for CFM56-3, CFM56-5B, CFM56-7B engines that power narrow-body
20.0 21.3
17.9 24.93.2
6.57.5
12.818.3
34.8
0.0
20.0
40.0
60.0
80.0
100.0
120.0
2015 2025
North America Europe Latin America Africa/ ME Asia
Page 13

Industry Focus
ASEAN Aviation
Page 14
aircraft such as the A320 and B737, and the opportunities in this segment in Asia Pacific region remains potentially huge. SIA Engineering, on the other hand, with its exposure to legacy widebody engines, has seen a structural decline in engine MRO demand and will hope for the Rolls Royce Trent series widebody engines to contribute to demand growth in future.
Cabin retrofitting and VIP reconfigurations will be a key business area for STE, going forward. In 2011, STE had launched AERIA Luxury Interiors in the US, a unit that focuses on refurbishing and outfitting of VIP aircraft. ST Aerospace is armed with endorsements from the world's leading aircraft OEMs – both an Airbus Corporate Jet service centre and an approved Boeing Business Jet completion centre. ST Aerospace has also extended its VIP aircraft interior business to Singapore, by unveiling a new facility at Seletar Aerospace Park to target demand for bespoke cabin interiors from Asian and Middle Eastern customers. In 2016, ST Aerospace’s VIP aircraft interiors business gained traction by securing five major maintenance and refurbishments contracts – for three Boeing Business Jet (BBJ), one Airbus Corporate Jet (ACJ) and a Boeing 757, from VIP customers in Asia Pacific and the US. ST Aerospace has also established an aircraft seats JV in Singapore to complement its cabin interiors business.
STE expanding into aircraft and engine leasing business to generate new maintenance streams. ST Aerospace has commenced its aircraft leasing business with acquisition of two aircraft in FY15, and added more aircraft in FY16. It has decided to collaborate with Sojitz Corporation of Japan in its aircraft leasing business, by divesting 50% stake the holding company for STE’s aircraft leasing investments.
STE has also further strengthened leadership position in PTF. ST Aerospace’s 55% owned European MRO centre in Dresden in collaboration with Airbus – EADS EFW – has successfully launched the A330 and the A320/321 Passenger to Freighter programmes. This will add to STE’s existing track record of PTF capabilities – MD11, B767-300, and B757-200 (14 &141/2
pallet). STE has also received the supplemental type certificate from US FAA for the 15-Pallet B757-200SF conversion.
Page 14

Industry Focus
ASEAN Aviation
Page 15
Valuations and stock picks
Airline valuations to cool off peak multiples
ASEAN airline share prices ended 2016 on a subdued note, as the cooling-off period started around Sep 16 – largely reacting to the rising jet fuel price and US dollar; despite a larger proportion of 2Q16 results being in line or beating consensus. This is not isolated to ASEAN as the Asia-Pacific Airlines Index has likewise deteriorated on similar factors.
Asia Pacific Airlines Index
Source: Bloomberg Finance L.P., DBS Bank, AllianceDBS
2H16 price movement, indexed (30 Jun 2016 = 100)
Source: Bloomberg Finance L.P., DBS Bank, AllianceDBS
Airlines under our coverage gave up gains from Sep 16 onwards, to close the year at slightly below end-1H16 levels. That said y-o-y performance at end-2016 remained mostly positive (6 out of 8).
Given a squeezed profit outlook, there may be some de-rating of valuations from a P/BV perspective – our chosen method of valuing airlines under coverage – easing from peak levels (see P/BV charts in Appendix below). That said, we think that there remains room for individual stocks to trade up to +1SD above mean as 1) performance may yet hold up until end 1HCY17, and 2) the performance gap may widen between performers and loss-makers. Further, given that fuel prices still remain far below peak of >US$100/bbl, we think that most players will have sufficient space for competitive, load-inducing yields without severely eating into equity values.
Look for market share winners among airlines
Despite expectations of thinner profitability, we still expect most airlines to be able to preserve book value – i.e. not fall into loss-making positions – barring a severe upswing in fuel price or the US dollar. In such conditions we expect valuations to edge down with the exception of airlines managing to expand their business position by growing market share without severely impacting profitability.
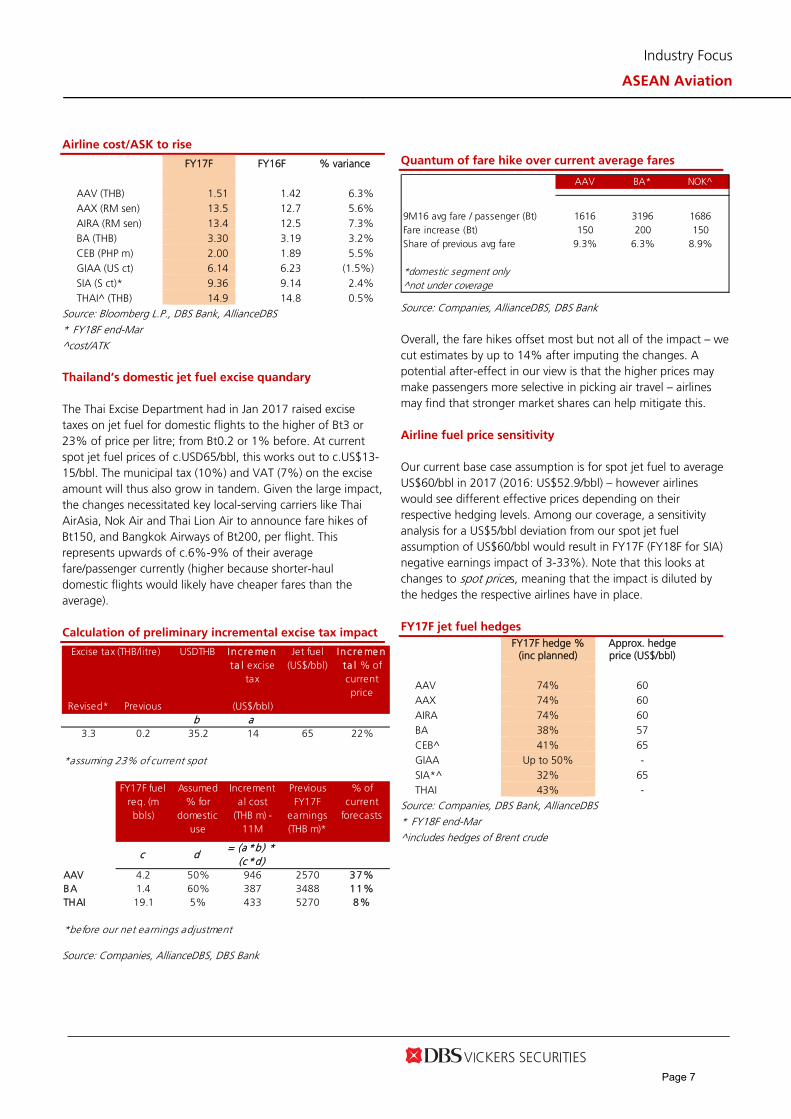
Top airline picks To that end, our BUY picks are AirAsia (BUY, TP: RM3.25), Asia Aviation (Buy, TP: Bt7.60), and Cebu Air (BUY, TP: P125). All three of AIRA, AAV and CEB are expected to handily maintain their domestic market share leads even despite growing competitor efforts in 2017. While earnings may indeed pare down, we think given their market positioning, price leadership and cost control; it’s more likely that their respective competition is squeezed out before the players units see overtly unfavourable financial impact.
Other calls For other stocks under our coverage, BA is also a pick as its focuses on relatively less contested markets of niche holiday routes, in particular to Samui (where it has the majority of flight slots to the key airport, which it also partly owns). GIAA remains a BUY on a valuation basis, as we think its discount to book value is unjustified as risks of severe prolonged loss-making has eased. AAX remains a HOLD given its heightened sensitivity to fuel or currency cost escalation. While THAI is expected to make progress on its Transformation Plan, risks still remain elevated in its unsold decommissioned fleet, and its high gearing of >4x.
0
50
100
150
200
250
300
Jan-
07
Jul-0
7
Jan-
08
Jul-0
8
Jan-
09
Jul-0
9
Jan-
10
Jul-1
0
Jan-
11
Jul-1
1
Jan-
12
Jul-1
2
Jan-
13
Jul-1
3
Jan-
14
Jul-1
4
Jan-
15
Jul-1
5
Jan-
16
Jul-1
6
Jan-
17
Mean
+2 SD
+1 SD
-1 SD
-2 SD
60
80
100
120
140
Jul‐16 Aug‐16 Sep‐16 Oct‐16 Nov‐16 Dec‐16
AsiaAviationAirAsia X
AirAsia
BangkokAirwaysCebu Air
GarudaIndonesiaSingaporeAirlinesThaiAirways
Page 15Page 15

Industry Focus
ASEAN Aviation
Page 16
Peer Comparison – Airlines
Sources: DBS Bank, Bloomberg Finance L.P. Prices as of 7 Feb 2017
Other Aviation Picks Airports of Thailand (BUY, TP Bt 455) For airport picks, AOT TB would be the best proxy for a Thailand tourism recovery in our view. We believe the decline in passenger traffic at its six airports should have already bottomed out in Nov last year as international passenger growth rebounded to 4% in Dec 2016 and 7% during 1-20 Jan 2017. AOT has maintained its FY17F total passenger movement target at its six airports at 8.7% (vs our assumptions of 6.5%). We expect the improving volume growth would support the share price. Another short-term catalyst for AOT will be the split of par value from Bt10 to Bt1 which will be subjected to shareholders' approval at AGM on 27 Feb. The par split should increase AOT's liquidity
China Aviation Oil (BUY, TP S$1.70). With the backing of its SOE parent, CNAF, and monopoly in the supply of bonded jet fuel in China, we like CAO as a proxy to the long-term growth of China's international air travel market, growing international presence, and for its exposure to Pudong International Airport's firm outlook through 33%-owned associate, SPIA. Currently trading at <10x FY17F PE, we believe that the group is poised to see a
structural re-rating to 12x on sustained earnings growth, especially if CAO can utilise its strong net cash balance of US$203m to further accelerate growth via M&A.
ST Engineering (BUY, TP S$3.50) STE is a relatively defensive stock with a healthy balance sheet, strong order book and secure dividend payouts. Its Aerospace segment has positioned itself well by investing in growth markets such as narrow-body aircraft Passenger-to-Freighter (PTF) conversions, the Chinese MRO market, and cabin interior solutions, to name a few. The Electronics segment should also benefit from the ‘Smart City’ trend, not only in Singapore but various overseas markets as well.
Other Calls MAHB remains a HOLD despite improving Malaysian pax growth and a recent extension of its operating agreement; as the group is still heavily dragged by its loss-making Turkish operations. SIA Engineering is seeing limited engines for growth, while core base maintenance and fleet management businesses are on declining trends given SIA’s fleet cycle. .
Valuations – other ASEAN Aviation
Sources: DBS Bank, Bloomberg Finance L.P. Prices as of 7 Feb 2017
Cur Las t 12-mth Rtg Mkt Cap EPS Gth Fwd yld
Company Px Tgt Px US$m CY16 CY17 CY17 CY16 CY17 CY16 CY17 CY16 CY17 CY17
AirAsia MYR 2.65 3.25 BUY 1,999 6.6x 9.1x -27% 6.1x 7.6x 1.2x 1.1x 31.3% 13.0% 2.4%
AirAsia X MYR 0.42 0.38 HOLD 393 8.5x 9.2x -8% 5.6x 4.8x 2.1x 1.7x 28.4% 20.5% 0.0%
Asia Aviation THB 6.20 7.60 BUY 859 12.9x 13.6x -5% 6.7x 7.3x 1.4x 1.3x 10.6% 9.4% 2.8%
Bangkok Airways THB 21.20 26.30 BUY 1,271 13.5x 14.8x -8% 6.9x 7.2x 1.4x 1.3x 9.0% 9.1% 3.8%
Cebu Air PHP 95.0 125.0 BUY 1,162 5.8x 6.1x -4% 4.8x 4.5x 1.7x 1.4x 33.8% 25.8% 5.4%
Garuda Indonesia IDR 346.0 475.0 BUY 672 66.3x 13.6x >100% 4.4x 3.4x 0.7x 0.7x 1.1% 5.1% 0.0%
Singapore Airlines SGD 9.81 10.10 HOLD 8,228 14.2x 17.0x -17% 3.4x 3.9x 0.9x 0.9x 6.4% 5.4% 4.1%
Thai Airways THB 21.80 23.25 HOLD 1,359 10.4x 9.7x 6% 6.9x 7.2x 1.3x 1.1x 13.1% 12.2% 0.0%
ASEAN Airl ines Avg 17.3x 11.6x -9% 5.6x 5.7x 1.3x 1.2x 16.7% 12.6% 2.3%
-------- PER --------- EV/EBITDA P/BV ROAE
TP Las t 12-mth Rtg Mkt Cap EPS Gth Fwd yld
Company Crncy Px Tgt Px US$m CY16 CY17 CY17 CY16 CY17 CY16 CY17 CY16 CY17 CY17
Airports of Thailand THB 414.00 455.00 BUY 16,891 29.2x 25.6x 14% 17.8x 16.3x 4.7x 4.2x 17.1% 17.2% 0.0%
Malaysia Airports MYR 6.60 6.80 HOLD 2,472 238.2x 47.8x 398% 9.5x 8.1x 1.4x 1.4x 0.6% 2.9% 1.9%
China Aviation Oil SGD 1.53 1.70 BUY 935 11.8x 10.9x 9% 8.2x 6.8x 1.4x 1.3x 12.7% 12.6% 2.9%
SIA Engineering SGD 3.52 3.58 HOLD 2,800 23.1x 24.9x -7% 15.2x 16.0x 2.4x 2.4x 18.8% 12.0% 3.6%
ST Engineering SGD 3.34 3.68 BUY 7,371 21.3x 20.0x 7% 12.8x 12.1x 5.0x 4.8x 20.2% 24.5% 4.5%
Avg 64.7x 25.8x 84% 12.7x 11.9x 3.0x 2.8x 13.9% 13.9% 2.6%
-------- PER --------- EV/EBITDA P/BV ROAE
Page 16

Industry Focus
ASEAN Aviation
Page 17
Appendix
Valuation charts – P/BV
AirAsia PB Band (x)
AirAsia. AIRA MK (BUY, RM3.25 TP) had tracked back to its longer-term mean of near 1.3x P/BV as profitability began to recover as demonstrated by its earnings reports from 4Q15, as well as improvements in the standing of its receivables from loss-making associates. However concerns over a weakening ringgit dragged its share price from end-2016 onwards. As group performance steadies itself amid strong market shares in Malaysia and Thailand, we think the group should trade above mean valuations as its network and branding ensures longevity of the business.
AirAsia X PB Band (x)
AirAsia X. AAX MK (HOLD, RM0.38 TP) exceeded +1SD of its mean historical valuations after charting successive profit since 4Q15, and reaching high ROAEs given a severely beaten down net asset value from multiple FYs of losses. As its profitability outlook is more uncertain, we see it de-rating back towards historical mean levels.
Asia Aviation PB Band (x)
Asia Aviation. AAV TB (BUY, Bt7.60 TP) re-rated reaching +2SD of historical mean P/BV, but was dragged by growing concerns of Thai LCC competition plus the slowdown in tourist arrivals near end-2016 from the crackdown on zero-dollar tours. We think it has consolidated its position in 2016 and is poised to defend or grow its market share in 2017 even against competitors’ fleet expansion; while remaining financially.
Bangkok Airways PB Band (x)
Bangkok Airways. BA TB (BUY, Bt26.30 TP) has historically traded at a slight premium to airline peers averaging 1.6x P/BV, given its more secure profit stream with a stake in Samui Airport (where it also controls the majority of the slots). However a one-off taxation recognition dragged FY16 earnings and concerns on tourism growth dragged it to -1SD. We find this unjustified given its strong niche position servicing boutique routes in Thailand.
Avg: 1.33x
+1sd: 1.62x
+2sd: 1.92x
‐1sd: 1.03x
‐2sd: 0.74x
0.4
0.6
0.8
1.0
1.2
1.4
1.6
1.8
2.0
2.2
Feb-13 Feb-14 Feb-15 Feb-16 Feb-17
(x)
Avg: 1.33x
+1sd: 1.62x
+2sd: 1.92x
‐1sd: 1.03x
‐2sd: 0.74x
0.4
0.6
0.8
1.0
1.2
1.4
1.6
1.8
2.0
2.2
Feb-13 Feb-14 Feb-15 Feb-16 Feb-17
(x)
Avg: 1.33x
+1sd: 1.62x
+2sd: 1.92x
‐1sd: 1.03x
‐2sd: 0.74x
0.4
0.6
0.8
1.0
1.2
1.4
1.6
1.8
2.0
2.2
Feb-13 Feb-14 Feb-15 Feb-16 Feb-17
(x)
Avg: 1.33x
+1sd: 1.62x
+2sd: 1.92x
‐1sd: 1.03x
‐2sd: 0.74x
0.4
0.6
0.8
1.0
1.2
1.4
1.6
1.8
2.0
2.2
Feb-13 Feb-14 Feb-15 Feb-16 Feb-17
(x)

Industry Focus
ASEAN Aviation
Page 18
Cebu Air PB Band (x)
Cebu Air. CEB PM (BUY, P125 TP) has typically traded far above regional peers at almost 2x P/BV, given its consistently strong ROAEs and solid profit track record even during peak oil prices. Valuations had come down in 2016 given a deceleration of its capacity growth due to infrastructure constraints in the Philippines, and caution on travel statistics with a new political regime. We remain confident on its maintenance of profit stability and expect a reversion to mean with good earnings reports.
Garuda Indonesia PB Band (x)
Garuda Indonesia. GIAA IJ (BUY, Rp475 TP) has typically traded below book value given a loss-making track record, in part due to a continuous weakening rupiah against the US dollar. We think it is nearer to profit stability after easing aircraft deliveries and restructuring efforts, and should trade nearer to mean of 0.9x P/BV with the production of profitable quarters.
Singapore Airlines PB Band (x)
Singapore Airlines. SIA SP (S$10.10 TP) is expected to trade to below or -1SD (0.9x) of its historical mean of 1x P/BV, as ROAEs decline to near 5% given a weak demand scenario while fuel cost savings are offset by softer yields and higher operating expenses.
Thai Airways PB Band (x)
Thai Airways. THAI TB (HOLD, Bt23.25 TP) re-rated very strongly to around +2SD from historical mean of below-book value as the beginning of its Transformation Plan coincided with low jet fuel to show sharply improved profitability. However low season still turned losses and we remain wary of a large unsold fleet and high gearing, which imply below-potential earnings until those items are resolved.
Avg: 1.33x
+1sd: 1.62x
+2sd: 1.92x
‐1sd: 1.03x
‐2sd: 0.74x
0.4
0.6
0.8
1.0
1.2
1.4
1.6
1.8
2.0
2.2
Feb-13 Feb-14 Feb-15 Feb-16 Feb-17
(x)
Avg: 1.33x
+1sd: 1.62x
+2sd: 1.92x
‐1sd: 1.03x
‐2sd: 0.74x
0.4
0.6
0.8
1.0
1.2
1.4
1.6
1.8
2.0
2.2
Feb-13 Feb-14 Feb-15 Feb-16 Feb-17
(x)
Avg: 1.33x
+1sd: 1.62x
+2sd: 1.92x
‐1sd: 1.03x
‐2sd: 0.74x
0.4
0.6
0.8
1.0
1.2
1.4
1.6
1.8
2.0
2.2
Feb-13 Feb-14 Feb-15 Feb-16 Feb-17
(x)
Avg: 1.33x
+1sd: 1.62x
+2sd: 1.92x
‐1sd: 1.03x
‐2sd: 0.74x
0.4
0.6
0.8
1.0
1.2
1.4
1.6
1.8
2.0
2.2
Feb-13 Feb-14 Feb-15 Feb-16 Feb-17
(x)

Industry Focus
ASEAN Aviation
Page 19
COMPANY GUIDES
Page 19

ASIAN INSIGHTS VICKERS SECURITIES ed: CK / sa:BC, PY
BUYLast Traded Price ( 13 Dec 2016): RM2.51 (KLCI : 1,645.28) Price Target 12-mth : RM3.25 (29% upside) (Prev RM3.25)
Potential Catalyst: Value-accretive disposals, associate profit growth Where we differ: Lower yield forecasts than consensus
Analyst Marvin KHOR +60 32604 3911 [email protected]
Price Relative
Forecasts and Valuation FY Dec (RM m) 2015A 2016F 2017F 2018F Revenue 6,299 6,589 6,880 7,383 EBITDA 1,487 2,696 2,314 2,398 Pre-tax Profit 215 1,848 1,019 1,059 Net Profit 541 1,819 975 1,025 Net Pft (Pre Ex.) 412 1,334 975 1,025 Net Pft Gth (Pre-ex) (%) 56.0 224.2 (26.9) 5.1 EPS (sen) 19.4 54.4 29.2 30.7 EPS Pre Ex. (sen) 14.8 39.9 29.2 30.7 EPS Gth Pre Ex (%) 56 170 (27) 5 Diluted EPS (sen) 19.4 54.4 29.2 30.7 Net DPS (sen) 4.00 8.72 6.10 6.33 BV Per Share (sen) 160 214 235 259 PE (X) 12.9 4.6 8.6 8.2 PE Pre Ex. (X) 17.0 6.3 8.6 8.2 P/Cash Flow (X) 3.2 4.6 4.4 4.6 EV/EBITDA (X) 11.6 6.0 7.4 6.4 Net Div Yield (%) 1.6 3.5 2.4 2.5 P/Book Value (X) 1.6 1.2 1.1 1.0 Net Debt/Equity (X) 2.3 1.1 1.1 0.8 ROAE (%) 12.0 31.3 13.0 12.4 Earnings Rev (%): 0 0 0 Consensus EPS (sen): 45.8 39.0 39.3 Other Broker Recs: B: 16 S: 2 H: 4
Source of all data on this page: Company, AllianceDBS, Bloomberg Finance L.P.
Ambitions refuelled
Value emerging in market leader. AirAsia (AIRA) firmed up its leading position in the Malaysian air travel space with 15.6% revenue-passenger-kilometre (RPK) growth for 2016, on 86.5% load factor. This alongside lower average jet fuel prices secures strong FY16 profitability. We think the P/BV valuation at current prices appear unjustified given decent expected of ROAEs of 12-13% despite its aggressive growth plans. Potential catalysts may come from its plan to unlock value via divestments, or further improvements of associate performance.
Well equipped to defend market share. AirAsia (AIRA) has taken advantage of the restructuring of key competitor Malaysia Airlines (MAB) to expand its leading market share to c.32% from c.27% in 2014. Going into 2017, AIRA is prepared to expand capacity to absorb any pick-up in demand, with 7-8 new aircraft deliveries from 77 currently. We think that it is in a strong position to defend or grow its expanded market share given its active branding and digitalisation efforts.
Measures in place to manage margin pressure. AIRA has hedged c.74% of its jet fuel requirements at USD60/bbl, plus currencyor natural hedges for c.67% of USD-denominated borrowings. From the revenue perspective, yields (fares/RPK) are expected to pare down in light of steeper competition, which we account for by imputing 3% yield contraction in FY17. That said, we are reassured by the fact that MAB has a profitability priority going forward, implying fare competition should not reach the mutually damaging levels seen in pre-2014.
Valuation: Reiterate BUY. Our TP of RM3.25 is based on 1.5x (historical mean) FY16/17F P/BV; on book value adjusted for cumulative unrecognised losses from associates.
Key Risks to Our View: Severe yield or ringgit depreciation. If yields or the ringgit sees severe sustained weakening, earnings and ROAE are at risk of erosion.
At A GlanceIssued Capital (m shrs) 2,783 Mkt. Cap (RMm/US$m) 6,985 / 1,577 Major Shareholders (%) Tune Air 16.7 Tune Live 15.5 Employees Provident Fund 4.5
Free Float (%) 75.4 3m Avg. Daily Val (US$m) 7.3 ICB Industry : Consumer Services / Travel & Leisure
DBS Group Research . Equity 14 Dec 2016
Malaysia Company Guide
AirAsia Version 7 | Bloomberg: AIRA MK | Reuters: AIRA.KL Refer to important disclosures at the end of this report
27
47
67
87
107
127
147
167
187
207
0.7
1.2
1.7
2.2
2.7
3.2
3.7
Dec-12 Dec-13 Dec-14 Dec-15 Dec-16
Relative IndexRM
AirAsia (LHS) Relative KLCI (RHS)
Page 20

ASIAN INSIGHTS VICKERS SECURITIES Page 2
Company Guide
AirAsia
CRITICAL DATA POINTS TO WATCH
Earnings Drivers:
Returning to ASK growth. Airline capacity is measured via ASK (available seat kilometres), which is a function of the active fleet and flight distances of routes served. Malaysia AirAsia (MAA) is shrinking its fleet to 77 by end-2016 from 80 in 2015, but is looking at resuming growth by up to 7/8 new aircraft in FY17 as strong volumes had driven up load factors. However, we expect ASK to dive 8% in FY17. Nevertheless, efficiency improvements like reducing time of grounded aircraft may also help boost overall ASK. Load factors to ease after peaking in FY16. Load factors determine the ASK that is converted into RPKs (revenue passenger kilometres). AIRA’s passenger load factor averaged 80.2% in 2015 (+1.4ppts) as Malaysia Airlines’ (MAB) capacity cuts helped to rebalance supply and demand. We forecast an improved 86% load factor for FY16 (86.6% for 9M16) as supply-demand dynamics remain friendly, and easing to 84% from FY17F onwards as MAB replenishes some capacity. Expect yields to ease. Passenger yields (fare/RPK) were 5.1% lower in 2015 due to the spillover effect of the stiff competition, plus phasing out of the fuel surcharge in fares. Despite MAB carrying out rationalisation, we view that yields are not still due for an upcycle in 2016, having declined 1.1% in 9M16. Moving into FY17, resumption of MAB’s capacity growth may mean more fare competition, thus easing yields further. Forecast flattish ancillary income. AIRA has in the pipeline several initiatives to boost ancillary income (onboard WIFI, enhanced duty-free operation, new purchasing system, etc.). However, we conservatively assume flat growth in our forecast years to account for a slower pick-up in the more novel offerings, and the prevalence of value-sensitive passengers. Cheaper fuel leads cost savings. AIRA’s key expenses can be split into cash opex, asset costs and fuel costs. We expect cost/ASK to drop by 6% in FY16F (c.2% fall charted in 9M16), led by fuel cost/ASK falling 26%. Going into FY17F we expect a weaker ringgit to drive up costs/ASK by 7%, plus slightly higher fuel costs of USD60/bbl of which AIRA has hedged 74% of requirements. Our spot jet fuel assumptions are US$50/60/65/bbl in FY16/17/18F. Keeping a tab on regional associates. AIRA maintains a strong regional presence with its associates in Thailand, Indonesia, the Philippines, India and Japan. While the group gains from the extended network and brand image, challenging operating conditions have led to losses in a few associates. Of its associates, we are most positive on Thai AirAsia (TAA) (listed on the Stock Exchange of Thailand), and expect it to be the key contributor to associate income.
ASK growth (%)
Load Factor (%)
Fare / RPK (sen)
Ancillary income / pax (RM)
Cost / ASK (sen)
Source: Company, AllianceDBS
3.56
8.15
7
8
4.35
0.0
1.2
2.4
3.5
4.7
5.9
7.1
8.2
2014A 2015A 2016F 2017F 2018F
78.8 80.286 84 84
0.0
17.5
35.1
52.6
70.2
87.7
2014A 2015A 2016F 2017F 2018F
13.412.8 12.6 12.2 12.6
0.00
2.74
5.48
8.23
10.97
13.71
2014A 2015A 2016F 2017F 2018F
43.2 43.1 43.8 43.8 43.8
0.0
8.8
17.7
26.5
35.4
44.2
2014A 2015A 2016F 2017F 2018F
13.813.2
12.513.4 13.8
0.0
2.8
5.6
8.4
11.2
14.0
2014A 2015A 2016F 2017F 2018F
Page 21

ASIAN INSIGHTS VICKERS SECURITIES Page 3
Company Guide
AirAsia
Balance Sheet:
Expect gearing to improve. We expect AIRA’s net gearing to ease from 1.5x at end-Sep16 to 1.1x FY16/17F, given improved profits and aided by the c.RM1bn injection from major shareholders via a new share issuance. Any further divestments may serve to bring net gearing down further if proceeds are used to pare down debts. Share Price Drivers:
Continued profitability for the group. AIRA had notched losses in previous FYs due to forex translation items and losses from associates. As associate performance stabilises, and the group demonstrates profitability even against expected higher competition, we expect valuations to catch-up to mean. Value-accretive disposals and spin-offs. AIRA is mulling unlocking value by potentially 1) divesting its leasing arm, 2) conducting IPOs for IAA, PAA, and flight school AACE, and/or 3) entering JVs for its ground handling and cargo units. Favourable valuations by counterparties may prove accretive to the group, potentially in the form of cash proceeds to pare down borrowings or pay out in the form of dividends. Key Risks:
Further depreciation of the MYR against the USD. A stronger USD will pressure AIRA’s profitability as a significant portion of its operating and financing costs are in USD. Irrational competition. The emergence of irrational competition in the form of excessive capacity increases by AIRA’s competitors or new entrants pose threats to both yields and load factors. Besides the natural dilution of demand, the airline players would also drive down fares to recapture passengers. Company Background
AirAsia (AIRA) is a low-cost airline that operates short-haul, point-to point domestic and international route operating out of its hub in klia2, Malaysia. The group also has similarly-branded associates in Thailand, Indonesia, the Philippines, Japan and India, forming a network for its airlines to leverage on for passenger connectivity.
Leverage & Asset Turnover (x)
Capital Expenditure
ROE (%)
Forward PE Band (x)
PB Band (x)
Source: Company, AllianceDBS
0.2
0.2
0.2
0.3
0.3
0.3
0.3
0.3
0.4
0.4
0.4
0.00
0.50
1.00
1.50
2.00
2.50
2014A 2015A 2016F 2017F 2018F
Gross Debt to Equity (LHS) Asset Turnover (RHS)
0.0
500.0
1,000.0
1,500.0
2,000.0
2,500.0
3,000.0
2014A 2015A 2016F 2017F 2018F
Capital Expenditure (-)
RMm
0.0%
5.0%
10.0%
15.0%
20.0%
25.0%
30.0%
2014A 2015A 2016F 2017F 2018F
Avg: 14.4x
+1sd: 22.1x
+2sd: 29.8x
‐1sd: 6.8x
-0.8
4.2
9.2
14.2
19.2
24.2
29.2
Dec-12 Dec-13 Dec-14 Dec-15 Dec-16
(x)
Avg: 1.35x
+1sd: 1.64x
+2sd: 1.94x
‐1sd: 1.05x
‐2sd: 0.76x
0.4
0.6
0.8
1.0
1.2
1.4
1.6
1.8
2.0
2.2
Dec-12 Dec-13 Dec-14 Dec-15 Dec-16
(x)
Page 22

ASIAN INSIGHTS VICKERS SECURITIES Page 4
Company Guide
AirAsia
Key Assumptions
FY Dec 2014A 2015A 2016F 2017F 2018F ASK growth (%) 3.56 8.15 7.00 8.00 4.35 Load Factor (%) 78.9 80.2 86.0 84.0 84.0 Fare / RPK (sen) 13.4 12.8 12.6 12.2 12.6 Ancillary income / pax (RM) 43.2 43.1 43.8 43.8 43.8 Cost / ASK (sen) 13.8 13.2 12.5 13.4 13.8
Segmental Breakdown
FY Dec 2014A 2015A 2016F 2017F 2018F Revenues (RMm) MAA - Airline Operations 4,623 4,874 5,532 5,698 6,085 MAA - Aircraft leasing 793 1,425 1,057 1,182 1,299 Associates and JV 0.0 0.0 0.0 0.0 0.0 Total 5,416 6,299 6,589 6,880 7,383 Core PBT (RMm)
MAA - Airline Operations 262 386 1,077 640 559 MAA - Aircraft leasing 152 709 230 243 341 Associates and JV 27.6 (800) 149 136 158 Total 441 296 1,457 1,019 1,059 Core PBT Margins (%) MAA - Airline Operations 5.7 7.9 19.5 11.2 9.2 MAA - Aircraft leasing 19.2 49.8 21.8 20.6 26.3 Associates and JV N/A N/A N/A N/A N/A Total 8.2 4.7 22.1 14.8 14.3
Income Statement (RMm)
FY Dec 2014A 2015A 2016F 2017F 2018F Revenue 5,416 6,299 6,589 6,880 7,383 Other Opng (Exp)/Inc (4,590) (4,716) (4,799) (5,584) (6,028) Operating Profit 826 1,583 1,790 1,296 1,355 Other Non Opg (Exp)/Inc 0.0 0.0 0.0 0.0 0.0 Associates & JV Inc 27.6 (800) 149 136 158 Net Interest (Exp)/Inc (412) (488) (482) (413) (454) Exceptional Gain/(Loss) (419) (80.6) 391 0.0 0.0 Pre-tax Profit 22.7 215 1,848 1,019 1,059 Tax 60.1 326 (29.2) (43.8) (33.8) Minority Interest 0.0 0.09 0.0 0.0 0.0 Preference Dividend 0.0 0.0 0.0 0.0 0.0 Net Profit 82.8 541 1,819 975 1,025 Net Profit before Except. 264 412 1,334 975 1,025 EBITDA 1,573 1,487 2,696 2,314 2,398 Growth Revenue Gth (%) 5.9 16.3 4.6 4.4 7.3 EBITDA Gth (%) 3.8 (5.5) 81.3 (14.2) 3.6 Opg Profit Gth (%) (4.3) 91.7 13.0 (27.6) 4.6 Net Profit Gth (Pre-ex) (%) (41.6) 56.0 224.2 (26.9) 5.1 Margins & Ratio Opg Profit Margin (%) 15.3 25.1 27.2 18.8 18.4 Net Profit Margin (%) 1.5 8.6 27.6 14.2 13.9 ROAE (%) 1.7 12.0 31.3 13.0 12.4 ROA (%) 0.4 2.6 8.2 4.1 4.2 ROCE (%) 4.7 8.5 8.9 5.8 6.0 Div Payout Ratio (%) 100.8 20.6 16.0 20.9 20.7 Net Interest Cover (x) 2.0 3.2 3.7 3.1 3.0
Source: Company, AllianceDBS
Page 23

ASIAN INSIGHTS VICKERS SECURITIES Page 5
Company Guide
AirAsia
Quarterly / Interim Income Statement (RMm)
FY Dec 3Q2015 4Q2015 1Q2016 2Q2016 3Q2016 Revenue 1,516 2,168 1,699 1,624 1,687 Other Oper. (Exp)/Inc (1,200) (1,367) (1,178) (1,209) (1,242) Operating Profit 316 801 521 415 445 Other Non Opg (Exp)/Inc 0.0 0.0 0.0 0.0 0.0 Associates & JV Inc (156) (225) 219 11.4 35.9 Net Interest (Exp)/Inc (150) (106) (111) (138) (88.9) Exceptional Gain/(Loss) (472) (34.5) 464 (33.9) 81.5 Pre-tax Profit (462) 435 1,093 254 474 Tax 56.0 120 (216) 88.1 (121) Minority Interest 0.0 (0.1) 0.85 0.24 1.43 Net Profit (406) 554 878 342 354 Net profit bef Except. 115 244 381 214 328 EBITDA 329 759 919 608 674 Growth Revenue Gth (%) 14.4 43.0 (21.6) (4.5) 3.9 EBITDA Gth (%) (19.6) 130.8 21.0 (33.9) 11.0 Opg Profit Gth (%) 37.1 153.4 (34.9) (20.4) 7.4 Net Profit Gth (Pre-ex) (%) nm 112.5 55.9 (43.9) 53.3 Margins Opg Profit Margins (%) 20.8 36.9 30.7 25.5 26.4 Net Profit Margins (%) (26.8) 25.6 51.7 21.1 21.0
Balance Sheet (RMm)
FY Dec 2014A 2015A 2016F 2017F 2018F Net Fixed Assets 13,034 11,593 11,102 12,859 11,912 Invts in Associates & JVs 422 1,185 1,334 1,470 1,628 Other LT Assets 4,675 4,690 4,690 4,690 4,690 Cash & ST Invts 1,338 2,431 4,562 3,524 5,205 Inventory 304 458 458 458 458 Debtors 891 923 1,083 1,131 1,214 Other Current Assets 0.0 0.0 0.0 0.0 0.0 Total Assets 20,664 21,279 23,228 24,132 25,106 ST Debt 2,275 2,432 2,432 2,432 2,432 Creditor 853 1,624 1,231 1,427 1,539 Other Current Liab 984 1,123 1,092 1,116 1,157 LT Debt 10,453 10,185 9,845 9,845 9,845 Other LT Liabilities 1,544 1,467 1,467 1,467 1,467 Shareholder’s Equity 4,555 4,447 7,161 7,845 8,666 Minority Interests 0.0 0.0 0.0 0.0 0.0 Total Cap. & Liab. 20,664 21,279 23,228 24,132 25,106 Non-Cash Wkg. Capital (642) (1,367) (782) (954) (1,024) Net Cash/(Debt) (11,390) (10,185) (7,715) (8,752) (7,072) Debtors Turn (avg days) 80.9 52.5 55.6 58.7 58.0 Creditors Turn (avg days) (409.3) (642.8) (688.5) (550.3) (611.8) Inventory Turn (avg days) (85.5) (197.9) (220.9) (189.6) (188.9) Asset Turnover (x) 0.3 0.3 0.3 0.3 0.3 Current Ratio (x) 0.6 0.7 1.3 1.0 1.3 Quick Ratio (x) 0.5 0.6 1.2 0.9 1.3 Net Debt/Equity (X) 2.5 2.3 1.1 1.1 0.8 Net Debt/Equity ex MI (X) 2.5 2.3 1.1 1.1 0.8 Capex to Debt (%) 14.3 (7.0) 2.2 21.5 (0.5) Z-Score (X) 0.8 0.8 1.2 1.2 1.3
Source: Company, AllianceDBS
Page 24

ASIAN INSIGHTS VICKERS SECURITIES Page 6
Company Guide
AirAsia
Cash Flow Statement (RMm)
FY Dec 2014A 2015A 2016F 2017F 2018F Pre-Tax Profit 22.7 215 1,848 1,019 1,059 Dep. & Amort. 720 703 757 882 885 Tax Paid (15.2) (31.0) (29.2) (43.8) (33.8) Assoc. & JV Inc/(loss) (27.6) 800 (149) (136) (158) Chg in Wkg.Cap. (871) (138) (585) 172 70.6 Other Operating CF 511 567 0.0 0.0 0.0 Net Operating CF 302 2,191 1,842 1,893 1,822 Capital Exp.(net) (1,823) 888 (266) (2,639) 61.9 Other Invts.(net) 49.3 (53.8) 0.0 0.0 0.0 Invts in Assoc. & JV (381) 258 0.0 0.0 0.0 Div from Assoc & JV 0.0 0.0 0.0 0.0 0.0 Other Investing CF 0.0 71.4 0.0 0.0 0.0 Net Investing CF (2,154) 1,164 (266) (2,639) 61.9 Div Paid (111) (83.5) (111) (291) (204) Chg in Gross Debt 1,888 (2,456) (340) 0.0 0.0 Capital Issues 2.06 0.0 1,006 0.0 0.0 Other Financing CF 0.0 (11.9) 0.0 0.0 0.0 Net Financing CF 1,779 (2,551) 555 (291) (204) Currency Adjustments 30.4 290 0.0 0.0 0.0 Chg in Cash (42.6) 1,093 2,131 (1,037) 1,680 Opg CFPS (sen) 42.2 83.7 72.6 51.5 52.4 Free CFPS (sen) (54.6) 111 47.1 (22.3) 56.4
Source: Company, AllianceDBS
Target Price & Ratings History
Source: AllianceDBS
Analyst: Marvin KHOR
S.No.Date of Report
Closing Price
12-mth Target Price
Rat ing
1: 29 Feb 16 1.47 1.90 BUY
2: 04 Apr 16 1.93 2.20 BUY
3: 06 Apr 16 1.90 2.20 BUY
4: 10 May 16 2.05 2.20 BUY
5: 27 May 16 2.40 2.70 BUY
6: 01 Aug 16 3.00 2.70 BUY
7: 30 Aug 16 3.00 3.20 HOLD
8: 01 Nov 16 2.84 3.20 HOLD
9: 25 Nov 16 2.71 3.25 BUY
Note : Share price and Target price are adjusted for corporate actions.
1
2
3
4 5
6 7
8
9
1.20
1.70
2.20
2.70
3.20
Dec-15 Apr-16 Aug-16 Dec-16
RM
Page 25

ASIAN INSIGHTS VICKERS SECURITIES ed: CK / sa:CS, PY
BUY Last Traded Price ( 6 Feb 2017): Bt6.20 (SET : 1,589.13) Price Target 12-mth: Bt7.60 (23% upside) (Prev Bt8.20)
Potential Catalyst: Positive yield or volume growth surprise Where we differ: More conservative margins than consensus Analyst Marvin KHOR +60 32604 3911 [email protected] Paul YONG CFA +65 6682 3712 [email protected]
What’s New FY16F earnings supported by 16% RPK growth
Expect cost escalation from hiked fuel excise, but
fare increases are set to help mitigate impact
Leading market share to drive FY17 volume
growth, but cut FY17/18F earnings by 14%/8% for
higher cost/ASK – offset by higher yields
Upside remains on reduced TP of Bt7.60 on more
conservative P/BV multiple, maintain BUY
Price Relative
Forecasts and Valuation FY Dec (Bt m) 2015A 2016F 2017F 2018F Revenue 29,507 33,374 38,491 43,067 EBITDA 3,898 6,092 6,093 6,660 Pre-tax Profit 2,109 4,325 4,116 4,400 Net Profit 1,078 2,212 2,105 2,250 Net Pft (Pre Ex.) 1,274 2,322 2,215 2,360 Net Pft Gth (Pre-ex) (%) 862.6 82.3 (4.6) 6.6 EPS (Bt) 0.22 0.46 0.43 0.46 EPS Pre Ex. (Bt) 0.26 0.48 0.46 0.49 EPS Gth Pre Ex (%) 863 82 (5) 7 Diluted EPS (Bt) 0.22 0.46 0.43 0.46 Net DPS (Bt) 0.10 0.15 0.15 0.17 BV Per Share (Bt) 4.15 4.46 4.74 5.03 PE (X) 27.9 13.6 14.3 13.4 PE Pre Ex. (X) 23.6 12.9 13.6 12.7 P/Cash Flow (X) 10.0 4.7 4.7 4.4 EV/EBITDA (X) 11.4 6.7 7.3 6.5 Net Div Yield (%) 1.6 2.4 2.4 2.8 P/Book Value (X) 1.5 1.4 1.3 1.2 Net Debt/Equity (X) 0.2 0.0 0.1 CASH ROAE (%) 6.4 11.1 9.9 10.0 Earnings Rev (%): 0 (14) (8) Consensus EPS (Bt): 0.46 0.50 0.52 Other Broker Recs: B: 12 S: 3 H: 7 Source of all data on this page: Company, AllianceDBS, Bloomberg Finance L.P
Well positioned to compete Coming out strong from 2016. Asia Aviation (AAV) is on track for a strong earnings year as 55%-owned Thai AirAsia (TAA) clocked in outperforming revenue-passenger-kilometre (RPK) growth of 16% in 2016, on 83.8% load factor (+1.7ppts). This should cement its leading domestic market share of near 30%. While 2017 brings cost headwinds primarily relating to fuel, higher fares will soften the earnings impact and we think TAA’s market positioning will support its volume ambitions. We also reiterate that AAV holds implicit value from the TAA stake, given the longer-term ambitions of the AirAsia group to consolidate its regional airlines. Maintain BUY with a lower TP of Bt7.60, based on 1.6x P/BV. Equipped for rising-price environment. The excise tax increase on jet fuel for domestic flights (up to 23% of value, from 1%) will exacerbate already-expected unit cost hikes, as spot prices have exceeded US$60/bbl from 2016’s average of US$53/bbl. TAA and other local carriers have implemented a Bt150 fare hike to offset this. As higher ticket prices may induce more selective consumer behaviour, we think AAV has an edge in keeping volume given its leadership in market position and costing. Focus on international growth. TAA’s capacity expansion is focused on the India and CLMV markets, given a more saturated domestic airspace. It plans to add six aircraft (reaching 57) to support its 2017 target of 19.5m passenger carriage (+13%), with a load factor of 84%. Our estimates employ a more conservative 83% load factor and 19m passengers (+11%).
Valuation:
Reiterate BUY. Our revised TP of Bt7.60 is based on 1.6x FY17F P/BV (+1.5SD of mean), lowered from 1.7x before. While airlines generally see profitability being eroded by higher expenses, we think AAV should command a premium to peers with its domestic market share dominance. Key Risks to Our View:
Higher jet fuel prices. Even with hedges in place, AAV (and other domestic-serving Thai airlines) is now more sensitive to higher fuel prices given the higher %-based excise taxes on fuel for local flights. At A Glance Issued Capital (m shrs) 4,850 Mkt. Cap (Btm/US$m) 30,070 / 859 Major Shareholders (%) Srivaddhanaprabha Family 39.3 Bijleveld Family 5.0
Free Float (%) 45.4 3m Avg. Daily Val (US$m) 7.1 ICB Industry : Consumer Services / Travel & Leisure
DBS Group Research . Equity 7 Feb 2017
Thailand Company Guide
Asia Aviation Version 7 | Bloomberg: AAV TB | Reuters: AAV.BK Refer to important disclosures at the end of this report
Page 26

ASIAN INSIGHTS VICKERS SECURITIES Page 2
Company Guide
Asia Aviation
CRITICAL DATA POINTS TO WATCH
Earnings Drivers:
Adding five to six aircraft annually. Airline capacity is measured via ASK (available seat kilometres), which is a function of the active fleet and the flight distances of routes served. Thai AirAsia (TAA) grew its fleet by six aircraft in 2016 to reach 51 planes – including two A320neos which have better fuel efficiency. Six more are to be added in 2017 and five p.a. going forward. Premised on this, we expect TAA to grow ASK by 11%/10% in FY17/18F, with current focus on destinations in India and CLMV. Conservative load factor expectations. Load factors determine the ASK that is converted into RPKs (revenue passenger kilometres). TAA saw its load factor expand 1.7ppts in 2016 to 83.8% supported by tourist growth and service quality issues in key LCC competitors. We forecast a mild tapering to 83% in FY17/18F as the tourist growth pares to a steadier pace, contrasted to its capacity expansion. Yields boosted by passing on fuel excise hike. Passenger yields (fare/RPK) are expected to fall in FY16 largely due to competition and desire to spur volume. While competition remains rife in 2017, the steep jet fuel excise hike led to carriers hiking domestic flight fares by Bt150 – c.9% of previous average fare/passenger, potentially a higher % of some domestic routes. As such, we expect average yields to make a u-turn in FY17/18F with +5.5%/+1.7% growth to pass on the additional costs. Mild ancillary income/pax outlook. Like other members of the AirAsia group, TAA focuses on growing ancillary income with offerings like value pack bundling, dynamic baggage pricing and Fly Thru connectivity. However, we conservatively assume mild near-term growth of 1%in FY17/18F to account for a slower pick-up in the newer offerings, and prevalence of value-sensitive passengers. Unit costs jumping from fuel-related factors. We expect fuel cost/ASK to rise 22% in FY17F, making a u-turn from an expected 29% fall in FY16F. This is partly contributed by spot jet fuel edging above US$60/bbl, after averaging US$53/bbl in 2016; though driven largely by the hiked jet fuel excise tax on domestic flights. We forecast this to push overall cost/ASK up 6% FY17F, taking into account AAV’s hedging up to 74% of its 2017 requirements at c.US$60/bbl. Our spot jet fuel assumptions are US$60/65/bbl in FY17/18F.
ASK growth (%)
Load Factor (%)
Fare / RPK (sen)
Ancillary income / pax (THB)
Cost / ASK (THB)
Source: Company, AllianceDBS
Page 27

ASIAN INSIGHTS VICKERS SECURITIES Page 3
Company Guide
Asia Aviation
Balance Sheet:
Finding the right balance in financing aircraft. TAA ended 2016 with 14 aircraft under finance lease (i.e. on balance sheet), and 37 on operating leases. Going forward, it plans receive a majority of its six planes in 2017 under finance leases given its low gearing position. Thus, we expect a mild rise in AAV’s net gearing position from 0.1x in FY16F to 0.2x in FY17F, potentially easing thereafter, depending on the number of finance leases. Share Price Drivers:
Travel and tourism growth. As the largest domestic LCC carrier with a wide international connectivity thanks to the AirAsia group connection, TAA’s earnings will be impacted by growth in both Thailand’s internal air traffic and its inbound tourist arrivals. Positivity from those indicators, and TAA’s own route expansion and development, can help drive earnings growth and share price re-rating. Key Risks:
Price competition. The emergence of strong price competition by airline competitors is a threat to both yields and earnings, as TAA would have to compete to maintain market share. Fuel price upswing. Our forecasts and call are based on moderate low oil/fuel prices. A sudden rise will impact earnings and may exacerbate associate-related risks. Stronger USD. The stronger USD against the THB and other regional currencies (i.e. MYR, SGD, IDR, RMB, JPY) will hurt AAV. The bulk of TAA’s revenues are in regional currencies, while 66%/50% of opex/finance costs are in USD. Company Background
AAV owns a 55% stake in TAA, the Thai-based sister company of AirAsia which owns the remaining 45%. TAA operates a low-cost, short-haul model out of five hubs in Thailand – Don Mueng Airport (Bangkok), Phuket International Airport (Phuket), Chiang Mai International Airport (Chiang Mai), Krabi International Airport (Krabi) and U-Tapao Rayong-Pattaya International Airport (Rayong).
Leverage & Asset Turnover (x)
Capital Expenditure
ROE (%)
Forward PE Band (x)
PB Band (x)
Source: Company, AllianceDBS
Page 28

ASIAN INSIGHTS VICKERS SECURITIES Page 4
Company Guide
Asia Aviation
Key Assumptions
FY Dec 2014A 2015A 2016F 2017F 2018F ASK growth (%) 19.1 17.5 13.9 11.3 10.2 Load Factor (%) 80.6 82.1 83.8 83.0 83.0 Fare / RPK (sen) 1.56 1.63 1.57 1.65 1.68 Ancillary income / pax 493 359 364 366 370 Cost / ASK (THB) 1.66 1.53 1.42 1.51 1.54
Income Statement (Btm)
FY Dec 2014A 2015A 2016F 2017F 2018F Revenue 25,356 29,507 33,374 38,491 43,067 Cost of Goods Sold (23,708) (25,315) (26,530) (31,525) (35,471) Gross Profit 1,648 4,192 6,844 6,966 7,596 Other Opng (Exp)/Inc (1,131) (1,421) (1,985) (2,317) (2,663) Operating Profit 517 2,771 4,859 4,649 4,933 Other Non Opg (Exp)/Inc 0.0 0.0 0.0 0.0 0.0 Associates & JV Inc 0.0 0.0 0.0 0.0 0.0 Net Interest (Exp)/Inc (313) (457) (533) (533) (533) Exceptional Gain/(Loss) 126 (205) 0.0 0.0 0.0 Pre-tax Profit 330 2,109 4,325 4,116 4,400 Tax 1.28 (151) (303) (288) (308) Minority Interest (148) (880) (1,810) (1,722) (1,841) Preference Dividend 0.0 0.0 0.0 0.0 0.0 Net Profit 183 1,078 2,212 2,105 2,250 Net Profit before Except. 132 1,274 2,322 2,215 2,360 EBITDA 1,340 3,898 6,092 6,093 6,660 Growth Revenue Gth (%) 8.0 16.4 13.1 15.3 11.9 EBITDA Gth (%) (53.4) 190.8 56.3 0.0 9.3 Opg Profit Gth (%) (79.1) 436.3 75.3 (4.3) 6.1 Net Profit Gth (Pre-ex) (%) (87.4) 862.6 82.3 (4.6) 6.6 Margins & Ratio Gross Margins (%) 6.5 14.2 20.5 18.1 17.6 Opg Profit Margin (%) 2.0 9.4 14.6 12.1 11.5 Net Profit Margin (%) 0.7 3.7 6.6 5.5 5.2 ROAE (%) 0.7 6.4 11.1 9.9 10.0 ROA (%) 0.3 2.5 4.2 3.7 3.7 ROCE (%) 1.3 5.8 9.5 8.5 8.5 Div Payout Ratio (%) 0.0 45.0 32.9 34.6 37.6 Net Interest Cover (x) 1.7 6.1 9.1 8.7 9.2
Source: Company, AllianceDBS
Page 29

ASIAN INSIGHTS VICKERS SECURITIES Page 5
Company Guide
Asia Aviation
Quarterly / Interim Income Statement (Btm)
FY Dec 3Q2015 4Q2015 1Q2016 2Q2016 3Q2016 Revenue 7,254 7,634 8,952 7,756 8,145 Cost of Goods Sold (6,354) (6,764) (6,467) (6,556) (6,944) Gross Profit 900 870 2,485 1,200 1,201 Other Oper. (Exp)/Inc (391) (341) (433) (429) (496) Operating Profit 510 529 2,052 771 705 Other Non Opg (Exp)/Inc 0.0 0.0 0.0 0.0 0.0 Associates & JV Inc 0.0 0.0 0.0 0.0 0.0 Net Interest (Exp)/Inc (88.2) (117) (127) (109) (160) Exceptional Gain/(Loss) (231) 95.6 (2.4) 28.3 39.3 Pre-tax Profit 190 507 1,923 690 584 Tax (21.4) (10.0) (90.3) 76.2 139 Minority Interest (76.6) (223) (824) (344) (326) Net Profit 91.9 274 1,009 423 397 Net profit bef Except. 231 227 1,010 365 299 EBITDA 788 822 2,338 1,059 1,001 Growth Revenue Gth (%) 5.4 5.2 17.3 (13.4) 5.0 EBITDA Gth (%) (3.2) 4.4 184.4 (54.7) (5.5) Opg Profit Gth (%) (4.3) 3.9 287.8 (62.4) (8.5) Net Profit Gth (Pre-ex) (%) 7.3 (1.7) 345.1 (63.9) (18.1) Margins Gross Margins (%) 12.4 11.4 27.8 15.5 14.8 Opg Profit Margins (%) 7.0 6.9 22.9 9.9 8.7 Net Profit Margins (%) 1.3 3.6 11.3 5.4 4.9
Balance Sheet (Btm)
FY Dec 2014A 2015A 2016F 2017F 2018F Net Fixed Assets 16,033 18,216 17,287 23,248 24,665 Invts in Associates & JVs 0.0 0.0 0.0 0.0 0.0 Other LT Assets 25,976 25,781 25,777 25,772 25,767 Cash & ST Invts 6,298 7,591 13,019 11,355 14,196 Inventory 96.9 94.0 94.0 94.0 94.0 Debtors 1,057 1,081 1,280 1,476 1,652 Other Current Assets 40.3 63.3 63.3 63.3 63.3 Total Assets 49,502 52,827 57,520 62,009 66,438 ST Debt 959 1,261 1,261 1,261 1,261 Creditor 2,212 2,965 2,907 3,455 3,887 Other Current Liab 4,693 4,070 5,526 6,367 7,119 LT Debt 11,118 12,775 12,775 12,775 12,775 Other LT Liabilities 3,503 3,671 3,671 3,671 3,671 Shareholder’s Equity 19,534 20,142 21,627 23,005 24,409 Minority Interests 7,482 7,941 9,751 11,473 13,315 Total Cap. & Liab. 49,502 52,827 57,520 62,009 66,438 Non-Cash Wkg. Capital (5,712) (5,797) (6,996) (8,188) (9,198) Net Cash/(Debt) (5,779) (6,446) (1,018) (2,682) 159 Debtors Turn (avg days) 16.5 13.2 12.9 13.1 13.3 Creditors Turn (avg days) 35.0 39.1 42.4 38.6 39.7 Inventory Turn (avg days) 1.5 1.4 1.4 1.1 1.0 Asset Turnover (x) 0.5 0.6 0.6 0.6 0.7 Current Ratio (x) 1.0 1.1 1.5 1.2 1.3 Quick Ratio (x) 0.9 1.0 1.5 1.2 1.3 Net Debt/Equity (X) 0.2 0.2 0.0 0.1 CASH Net Debt/Equity ex MI (X) 0.3 0.3 0.0 0.1 CASH Capex to Debt (%) 10.5 5.8 2.1 52.7 22.4 Z-Score (X) 1.9 2.0 2.1 2.1 2.1
Source: Company, AllianceDBS
Page 30

ASIAN INSIGHTS VICKERS SECURITIES Page 6
Company Guide
Asia Aviation
Cash Flow Statement (Btm)
FY Dec 2014A 2015A 2016F 2017F 2018F Pre-Tax Profit 330 2,109 4,325 4,116 4,400 Dep. & Amort. 824 1,127 1,234 1,444 1,727 Tax Paid (121) (6.6) (303) (288) (308) Assoc. & JV Inc/(loss) 0.0 0.0 0.0 0.0 0.0 Chg in Wkg.Cap. 444 (1,738) 1,199 1,192 1,009 Other Operating CF 373 1,514 0.0 0.0 0.0 Net Operating CF 1,849 3,007 6,455 6,464 6,828 Capital Exp.(net) (1,270) (818) (300) (7,400) (3,140) Other Invts.(net) 3,120 1,719 0.0 0.0 0.0 Invts in Assoc. & JV 0.0 0.0 0.0 0.0 0.0 Div from Assoc & JV 0.0 0.0 0.0 0.0 0.0 Other Investing CF 175 (17.7) 0.0 0.0 0.0 Net Investing CF 2,025 883 (300) (7,400) (3,140) Div Paid 0.0 (483) (728) (728) (847) Chg in Gross Debt (704) (1,059) 0.0 0.0 0.0 Capital Issues 0.0 0.0 0.0 0.0 0.0 Other Financing CF (326) (987) 0.0 0.0 0.0 Net Financing CF (1,031) (2,529) (728) (728) (847) Currency Adjustments (13.1) (27.3) 0.0 0.0 0.0 Chg in Cash 2,830 1,334 5,428 (1,664) 2,841 Opg CFPS (Bt) 0.29 0.98 1.08 1.09 1.20 Free CFPS (Bt) 0.12 0.45 1.27 (0.2) 0.76
Source: Company, AllianceDBS
Target Price & Ratings History
Source: AllianceDBS
Analyst: Marvin KHOR
Paul YONG CFA THAI-CAC Declared Corporate Governance CG Rating 2016 THAI-CAC is Companies participating in Thailand's Private Sector Collective Action Coalition Against Corruption programme (Thai CAC) under Thai Institute of Directors (as of October 28, 2016) are categorised into:
Score Description
Declared Companies that have declared their intention to join CAC
Certified Companies certified by CAC.
Corporate Governance CG Rating is based on Thai Institute of Directors (IOD)’s annual assessment of corporate governance practices of listed companies. The assessment covers 235 criteria in five categories including board responsibilities (35% weighting), disclosure and transparency (20%), role of stakeholders (20%), equitable treatment of shareholders (10%) and rights of shareholders (15%). The IOD then assigns numbers of logos to each company based on their scoring as follows:
Score Range Number of Logo Description 90-100 Excellent
80-89 Very Good
70-79 Good
60-69 Satisfactory
50-59 Pass <50 No logo given N/A
Page 31

ASIAN INSIGHTS VICKERS SECURITIES ed: CK / sa:CS, PY
BUY
Last Traded Price ( 9 Feb 2017): Bt40.25 (SET : 1,583.25)
Price Target 12-mth: Bt45.50 (13% upside)
Potential Catalyst: Recovery of international tourist arrivals to Thailand,
increasing liquidity from par-value split
Analyst Namida ARTISPONG +66 2657 7833 [email protected]
What’s New Expect 1QFY17F core earnings to rise 3% y-o-y
despite mourning period and fewer Chinese
tourists
Core earnings growth to accelerate and hit a new
record-high in 2QFY17F
Extended government’s policy in cutting visa fee
will surely boost international tourist arrivals
TP of Bt45.50, reflecting the par-value split
Price Relative
Forecasts and Valuation FY Sep (Bt m) 2015A 2016A 2017F 2018F
Revenue 43,969 50,962 55,373 61,194 EBITDA 26,880 31,024 33,731 37,044 Pre-tax Profit 23,335 24,424 28,089 30,834 Net Profit 18,729 19,571 22,536 24,740 Net Pft (Pre Ex.) 15,755 19,482 22,536 24,740 Net Pft Gth (Pre-ex) (%) 31.0 23.7 15.7 9.8 EPS (Bt) 13.1 13.7 15.8 17.3 EPS Pre Ex. (Bt) 11.0 13.6 15.8 17.3 EPS Gth Pre Ex (%) 31 24 16 10 Diluted EPS (Bt) 13.1 13.7 15.8 17.3 Net DPS (Bt) 5.00 5.00 5.00 6.00 BV Per Share (Bt) 76.0 84.9 95.7 108 PE (X) 3.1 2.9 2.6 2.3 PE Pre Ex. (X) 3.6 3.0 2.6 2.3 P/Cash Flow (X) 2.3 1.9 2.2 1.9 EV/EBITDA (X) 1.6 0.9 1.0 0.9 Net Div Yield (%) 12.4 12.4 12.4 14.9 P/Book Value (X) 0.5 0.5 0.4 0.4 Net Debt/Equity (X) CASH CASH CASH CASH ROAE (%) 18.2 17.0 17.5 17.0 Earnings Rev (%): 0 0 0 Consensus EPS (Bt): N/A 15.2 16.9 Other Broker Recs: B: 18 S: 3 H: 5
Source of all data on this page: Company, DBS Vickers, Bloomberg Finance L.P
Best proxy for Thailand’s tourism recovery
Reiterate BUY. The rebound of international tourist arrivals to
Thailand and strong demand of domestic travelling should
support the share price. Additionally, the par-value split would
increase trading liquidity.
Expect 1QFY17F core earnings to still grow. Despite the
mourning period and the crackdown on zero-dollar tours, we
expect AOT to still deliver core earnings growth in 1QFY17F
(Oct-Dec), though not as robust as before. We estimate
1QFY17F total revenue to rise by 7.9% y-o-y to Bt12.8bn, but
core earnings should increase at a slower pace by 3.2% y-o-y
to Bt4.8bn due to narrower operating margins from the slow
growth in international passengers. Note that we expect AOT
to book FX gains in the quarter from the weakening of JPY
against THB (most of AOT’s loans are in JPY). Total passengers
through its six airports in 1QFY17F are expected to rise by
6.1% y-o-y, mainly driven by domestic volume growth of
11.1%. International passenger traffic only grew by 2.2% y-o-
y as the number of Chinese tourists dropped.
Government policy on visa fee to boost international arrivals.
We expect core earnings growth to accelerate and hit a new
record high in 2QFY17F, thanks to the government’s stimulus
measure in cutting visa fees on arrival temporarily and waiver of
visa fees at Thai embassies for 19 nations. There were signs of a
foreign tourist rebound, with AOT reporting a 3.8% y-o-y
increase in international passengers through its airports in Dec
2016 and the number continued to grow in Jan 2017 (+7.1%)
and 1-4 Feb 2017 (+13.7%). Recently, the government has
extended this visa fee policy to be implemented by another six
months till 31 Aug 2017. We believe this will surely boost
international arrivals to Thailand and AOT would be a key
beneficiary.
Valuation:
The split of par value from Bt10 to Bt1 gives a new TP of
Bt45.50 vs Bt455.0 previously. Our TP is based on DCF
valuation (10.4% WACC, 3% terminal growth).
Key Risks to Our View:
The key risk is a slowdown in Thailand’s tourism industry which
can dampen passenger traffic. At A Glance
Issued Capital (m shrs) 1,429
Mkt. Cap (Btm/US$m) 57,500 / 1,642
Major Shareholders (%)
Ministry Of Finance 70.0
Thai NVDR 5.0
State Street Bank Europe Limited 1.9
Free Float (%) 22.1
3m Avg. Daily Val (US$m) 43.2
ICB Industry : Industrials / Industrial Transportation
DBS Group Research . Equity
10 Feb 2017
Thailand Company Guide
Airports of Thailand Version 5 | Bloomberg: AOT TB | Reuters: AOT.BK Refer to important disclosures at the end of this report
Page 32

ASIAN INSIGHTS VICKERS SECURITIES
Company Guide
Airports of Thailand
WHAT’S NEW
Tourism returning to bright spot
Expect 1QFY17F core earnings to still grow: Despite the
mourning period and the crackdown on zero-dollar tours, we
expect AOT to still deliver core earnings growth in 1QFY17F
(Oct-Dec), though not as robust as before.
AOT should be able to post 6.1% y-o-y growth in total
passengers through its six airports in 1QFY17F, mainly driven
by domestic volume growth of 11.1%. International
passenger traffic only grew by 2.2% y-o-y as the number of
Chinese tourists dropped. Nevertheless, we should still see an
increase in the number of European and Russian arrivals.
Meanwhile, we expect to see same trend for aircraft traffic,
growing by 6.9% y-o-y in 1QFY17F (domestic; +12.2% and
international; +1.9%).
Revenues from office and state property rents, and
concession are also expected to grow y-o-y in 1QFY17F,
thanks to additional commercial areas at Don Muang airport
and a 1-ppt increase in the revenue sharing rate to 19%,
respectively.
We estimate 1QFY17F total revenue to rise by 7.9% y-o-y to
Bt12.8bn, but core earnings should increase at a slower pace
of 3.2% y-o-y to Bt4.8bn due to narrower operating margins
from the slow growth in international passengers. Note that
we expect AOT to book FX gains in the quarter from the
weakening of JPY against THB (most of AOT’s loans are in
JPY).
Government’s stimulus measure to boost Thailand tourism:
We believe international tourist arrivals have already
bottomed out in Nov 2016, in which we saw 4.4% decrease
in international tourist arrivals to Thailand and also a decline
of 1.6% y-o-y for international passengers through AOT’s six
airports. With the government’s stimulus measure to cut visa
fees on arrival temporarily from Bt2,000 to Bt1,000 and the
waiver of visa fees of Bt1,000 at Thai embassies for foreign
tourists from 19 nations, including China, Bhutan, India,
Taiwan, and Saudi Arabia, from 1 Dec to 28 Feb 2017,
foreign tourists (including Chinese) have rebounded. AOT
reported 3.8% y-o-y increase in international passengers
through its airports in Dec 2016 and the number continued
to grow in Jan 2017 (+7.1%) and 1-4 Feb 2017 (+13.7%).
Hence, we expected core earnings growth to accelerate in
2QFY17F.
Recently, the government has extended the visa fee policy to
be implemented till 31 Aug 2017 and will be valid for two
additional countries, Fiji and Papua New Guinea. We believe
this will surely boost international arrivals to Thailand.
Thailand’s Tourism and Sports Ministry expects international
tourist arrivals to Thailand to grow by 7.7% y-o-y to 35m in
2017. Meanwhile, Chinese tourists are expected to increase
to 9.8m (+11.4% y-o-y).
Reiterate BUY. In our view, AOT would be the best proxy of
tourism recovery. The improving volume growth and the split
of par value from Bt10 to Bt1 would support the share price.
Page 33

ASIAN INSIGHTS VICKERS SECURITIES
Company Guide
Airports of Thailand
AOT: 1QFY17F results preview
FY Sep (Btm) 1Q16 4Q16 1Q17F % Chg % Chg
y-o-y q-o-q
Total Revenue 11,814 12,775 12,751 8% (0%) Operating exp. 5,294 6,769 6,044 14% (11%) EBIT 6,520 6,006 6,707 3% 12% Interest inc. 299 270 270 (10%) (0%) Interest exp. 361 329 344 (5%) 5% Other inc. 41 59 44 6% (25%) Other exp. 629 535 701 11% 31% Pretax Profit 5,871 5,471 5,975 2% 9% Extra Gain/(Loss) (6) (96) 0 na na MI (10) (8) (6) na na Tax 1,229 1,053 1,195 (3%) 13% Net Profit 4,626 4,314 4,774 3% 11% Norm Profit 4,632 4,410 4,774 3% 8% EBITDA 7,813 7,412 8,079 3% 9%
EBITDA margin 66.1% 58.0% 63.4% EBIT Margin 55.2% 47.0% 52.6% Net Margin 39.2% 33.8% 37.4% Eff.Tax Rate % 20.9% 19.2% 20.0%
Source of all data: Company, DBS Vickers
Page 34

ASIAN INSIGHTS VICKERS SECURITIES
Company Guide
Airports of Thailand
CRITICAL DATA POINTS TO WATCH
Earnings Drivers:
Rising traffic volume.
Management has no plans to submit another proposal to the
DCA (Department of Civil Aviation) to approve a hike in PSC
(Passenger Service Charge) just yet, but may revisit the proposal
in FY19F when Suvarnabhumi Airport expansion phase II is
completed. Therefore, earnings growth over the next two to
three years would be driven by higher passenger throughput
and aircraft traffic at its six airports. Rising air travel demand
and expanding airline capacities will support traffic growth.
AOT’s passenger and aircraft traffic have been growing at an
average of 12.6% and 12% p.a., respectively, in the past five
years. We expect them to average 8.2% and 4%, respectively,
over the next few years.
Growth of low-cost carriers.
The number of domestic passengers had grown at 8.7% p.a.
over FY03-FY10. But in the last five years, growth has
accelerated to an average of 16.1% because the rising number
of low-cost carriers has stimulated domestic demand by offering
affordable fares and convenient booking platforms.
Additionally, domestic passengers are supporting passenger
throughput at AOT’s airports, like in FY14 when Thailand
experienced political unrest. Total passenger throughput still
grew 1.7% y-o-y despite the 5.7% drop in international
passenger traffic.
Higher concession revenue-sharing rate.
In FY16, the duty-free concessionaires will pay AOT 18% of
their gross revenues or the minimum guaranteed payment
(MGP), whichever is higher. This rate is subject to 1-ppt increase
p.a. to a maximum rate of 20%.
Additional commercial space.
Terminal 2 at Don Muang Airport was opened in Dec 2015,
which would add commercial space of another 27,109 sqm
(from 6,144 sqm) to AOT’s rental portfolio. Meanwhile, the
construction of Phuket Airport which was completed in Sep
2016 also doubled the existing commercial area to 10,289 sqm.
This should lift overall concession and retail rental revenues.
Airport expansion to support sustainable growth.
The Suvarnabhumi (BKK) airport development project (phase 2)
with an investment budget of Bt62.5bn finally kicked off in Sep
2016. Upon completion in 2019, BKK Airport’s capacity will
increase from 45m to 60m. Additionally, AOT also plans to build
terminal 2 at BKK Airport (capacity will rise to 90m in 2021) and
construct the third runway (flight capacity will rise from 68
flights per hour to 94 flights per hour in 2020).
International aircrafts movement (flts)
Domestic aircrafts movement (flts)
No. of international passengers
No. of domestic passengers
Revenue breakdown
Source: Company, DBS Vickers
16% 13% 14% 13% 13%
43% 45% 43% 45% 43%
2% 1% 2% 2% 2%
5% 5% 5% 4% 4%
11% 10% 11% 10% 12%
23% 25% 26% 27% 27%
0%
20%
40%
60%
80%
100%
FY12 FY13 FY14 FY15 FY16
Landing and parking charges Passenger service charges
Aircraft service charges Office and state property rents
Service revenues Concession revenues
Page 35

ASIAN INSIGHTS VICKERS SECURITIES
Company Guide
Airports of Thailand
Balance Sheet:
Low leverage.
AOT has healthy operating and free cash flows with a low
gearing of 0.3x at end-3QFY16. The bulk of its long-term loans
are in Japanese yen borrowed from financial institutions
overseas. Nonetheless, AOT has hedged 93.4% of the total loan
with cross currency swap contracts. The Suvarnabhumi Airport
Expansion II project should be sufficiently funded by internal
cash flow and debt.
Share Price Drivers:
International passenger traffic through AOT’s six airports should
remain strong given that Thailand still offers cost-competitive
travelling and a variety of destinations. The Department of
Thailand Tourism expects the number of international tourist
arrivals to Thailand to continue to grow by 10% in 2017.
Key Risks:
Slowdown in the tourism industry
AOT's earnings are driven by flight and passenger traffic
volumes in Thailand. An economic slowdown, natural disasters,
and political uncertainty are main threats to its operations, and
their frequent recurrence would dampen air traffic.
Company Background
Airports of Thailand Public Company Ltd. is a state-owned
enterprise which operates six major airports in Thailand –
Suvarnabhumi, Don Muang, Phuket, Chiang Rai, Chiang Mai,
and Had Yai. AOT’s airports account for over 90% of
Thailand’s air traffic. Most of the other airports in Thailand are
much smaller in scale and located in second tier cities, and are
owned by the Department of Civil Aviation (DCA), Royal Thai
Navy, and Bangkok Airways Company.
Leverage & Asset Turnover (x)
Capital Expenditure
ROE (%)
Forward PE Band (x)
PB Band (x)
Source: Company, DBS Vickers
Page 36

ASIAN INSIGHTS VICKERS SECURITIES
Company Guide
Airports of Thailand
Key Assumptions
FY Sep 2014A 2015A 2016A 2017F 2018F
International aircrafts movement (flts)
324,859 365,321 402,720 428,897 458,920
Domestic aircrafts movement (flts)
285,077 342,041 374,200 404,136 444,550 No. of international passengers
50,163 60,296 67,129 71,276 77,932
No. of domestic passengers
36,354 45,436 51,832 55,488 60,641
Income Statement (Btm)
FY Sep 2014A 2015A 2016A 2017F 2018F
Revenue 37,585 43,969 50,962 55,373 61,194
Cost of Goods Sold (14,559) (15,805) (17,020) (17,789) (20,384)
Gross Profit 23,027 28,164 33,942 37,583 40,809
Other Opng (Exp)/Inc (7,934) (7,734) (9,587) (10,355) (11,382)
Operating Profit 15,093 20,430 24,355 27,229 29,427
Other Non Opg (Exp)/Inc 414 262 265 292 321
Associates & JV Inc 0.0 0.0 0.0 0.0 0.0
Net Interest (Exp)/Inc (430) (330) (285) 569 1,086
Exceptional Gain/(Loss) 191 2,974 89.7 0.0 0.0
Pre-tax Profit 15,269 23,335 24,424 28,089 30,834
Tax (3,007) (4,585) (4,821) (5,519) (6,059)
Minority Interest (41.8) (21.4) (32.1) (33.7) (35.4)
Preference Dividend 0.0 0.0 0.0 0.0 0.0
Net Profit 12,220 18,729 19,571 22,536 24,740
Net Profit before Except. 12,029 15,755 19,482 22,536 24,740
EBITDA 21,157 26,880 31,024 33,731 37,044
Growth
Revenue Gth (%) 2.1 17.0 15.9 8.7 10.5
EBITDA Gth (%) 4.6 27.0 15.4 8.7 9.8
Opg Profit Gth (%) 0.2 35.4 19.2 11.8 8.1
Net Profit Gth (Pre-ex) (%) 21.1 31.0 23.7 15.7 9.8
Margins & Ratio
Gross Margins (%) 61.3 64.1 66.6 67.9 66.7
Opg Profit Margin (%) 40.2 46.5 47.8 49.2 48.1
Net Profit Margin (%) 32.5 42.6 38.4 40.7 40.4
ROAE (%) 13.0 18.2 17.0 17.5 17.0
ROA (%) 8.0 12.0 11.8 12.6 13.0
ROCE (%) 8.7 11.4 12.8 13.2 13.3
Div Payout Ratio (%) 57.7 38.1 36.5 31.7 34.6
Net Interest Cover (x) 35.1 61.9 85.3 NM NM
Source: Company, DBS Vickers
Page 37

ASIAN INSIGHTS VICKERS SECURITIES
Company Guide
Airports of Thailand
Quarterly / Interim Income Statement (Btm)
FY Sep 4Q2015 1Q2016 2Q2016 3Q2016 4Q2016
Revenue 10,945 11,814 13,800 12,572 12,775
Cost of Goods Sold (4,789) (3,863) (4,193) (4,152) (4,812)
Gross Profit 6,156 7,952 9,608 8,420 7,963
Other Oper. (Exp)/Inc (1,439) (1,431) (1,900) (1,888) (1,957)
Operating Profit 4,718 6,521 7,707 6,532 6,006
Other Non Opg (Exp)/Inc (188) (588) (603) (479) (476)
Associates & JV Inc 0.0 0.0 0.0 0.0 0.0
Net Interest (Exp)/Inc (83.6) (61.6) (94.7) (70.5) (58.6)
Exceptional Gain/(Loss) 2,752 (6.4) (75.8) 268 (96.1)
Pre-tax Profit 7,198 5,865 6,933 6,251 5,375
Tax (1,339) (1,229) (1,353) (1,186) (1,053)
Minority Interest (9.7) (9.9) (14.2) (0.1) (8.0)
Net Profit 5,850 4,626 5,567 5,065 4,314
Net profit bef Except. 3,098 4,632 5,642 4,796 4,410
EBITDA 6,332 7,513 8,716 7,654 7,142
Growth
Revenue Gth (%) 0.8 7.9 16.8 (8.9) 1.6
EBITDA Gth (%) (4.9) 18.6 16.0 (12.2) (6.7)
Opg Profit Gth (%) (17.2) 38.2 18.2 (15.2) (8.0)
Net Profit Gth (Pre-ex) (%) (24.3) 49.5 21.8 (15.0) (8.0)
Margins
Gross Margins (%) 56.2 67.3 69.6 67.0 62.3
Opg Profit Margins (%) 43.1 55.2 55.8 52.0 47.0
Net Profit Margins (%) 53.4 39.2 40.3 40.3 33.8
Balance Sheet (Btm)
FY Sep 2014A 2015A 2016A 2017F 2018F
Net Fixed Assets 81,624 95,253 91,692 110,290 127,154
Invts in Associates & JVs 0.0 0.0 0.0 0.0 0.0
Other LT Assets 25,725 12,446 16,366 15,298 14,932
Cash & ST Invts 43,203 48,490 60,490 55,764 50,311
Inventory 195 238 261 274 288
Debtors 2,094 2,356 2,871 3,034 3,353
Other Current Assets 947 841 535 546 557
Total Assets 153,789 159,624 172,216 185,206 196,594
ST Debt 3,971 4,228 4,797 3,280 2,927
Creditor 1,444 1,151 1,370 1,137 1,283
Other Current Liab 12,550 10,476 12,262 11,648 11,066
LT Debt 30,679 28,202 27,261 27,187 21,731
Other LT Liabilities 7,898 6,755 4,949 4,949 4,949
Shareholder’s Equity 97,044 108,588 121,322 136,715 154,313
Minority Interests 203 225 257 290 326
Total Cap. & Liab. 153,789 159,624 172,216 185,206 196,594
Non-Cash Wkg. Capital (10,757) (8,192) (9,964) (8,931) (8,151)
Net Cash/(Debt) 8,553 16,060 28,433 25,297 25,653
Debtors Turn (avg days) 21.2 18.5 18.7 19.5 19.0
Creditors Turn (avg days) 55.3 49.2 43.3 39.5 33.7
Inventory Turn (avg days) 8.2 8.2 8.6 8.4 7.8
Asset Turnover (x) 0.2 0.3 0.3 0.3 0.3
Current Ratio (x) 2.6 3.3 3.5 3.7 3.6
Quick Ratio (x) 2.5 3.2 3.4 3.7 3.5
Net Debt/Equity (X) CASH CASH CASH CASH CASH
Net Debt/Equity ex MI (X) CASH CASH CASH CASH CASH
Capex to Debt (%) 22.0 21.3 15.1 76.4 93.3
Z-Score (X) 6.9 7.8 8.5 8.8 10.0
Source: Company, DBS Vickers
Page 38

ASIAN INSIGHTS VICKERS SECURITIES
Company Guide
Airports of Thailand
Cash Flow Statement (Btm)
FY Sep 2014A 2015A 2016A 2017F 2018F
Pre-Tax Profit 15,269 23,335 24,424 28,089 30,834
Dep. & Amort. 5,650 6,189 6,405 6,212 7,297
Tax Paid 4,869 3,007 4,585 4,821 5,519
Assoc. & JV Inc/(loss) 0.0 0.0 0.0 0.0 0.0
Chg in Wkg.Cap. (740) 9,571 (3,254) (665) (413)
Other Operating CF (6,108) (17,195) (1,834) (11,933) (12,800)
Net Operating CF 18,941 24,907 30,327 26,524 30,437
Capital Exp.(net) (7,609) (6,919) (4,850) (23,277) (23,000)
Other Invts.(net) 1,750 (9,250) (9,900) 7,104 0.0
Invts in Assoc. & JV 0.0 0.0 0.0 0.0 0.0
Div from Assoc & JV 0.0 0.0 0.0 0.0 0.0
Other Investing CF (72.4) 90.3 27.3 27.3 27.3
Net Investing CF (5,932) (16,079) (14,722) (16,146) (22,973)
Div Paid (6,571) (7,057) (7,142) (7,143) (7,143)
Chg in Gross Debt (6,775) (1,952) (557) (1,591) (5,809)
Capital Issues 0.0 0.0 0.0 0.0 0.0
Other Financing CF 768 (3,781) (5,104) 33.7 35.4
Net Financing CF (12,578) (12,790) (12,803) (8,700) (12,916)
Currency Adjustments 0.0 0.0 0.0 0.0 0.0
Chg in Cash 431 (3,962) 2,801 1,678 (5,452)
Opg CFPS (Bt) 13.8 10.7 23.5 19.0 21.6
Free CFPS (Bt) 7.93 12.6 17.8 2.27 5.21
Source: Company, DBS Vickers
Target Price & Ratings History
Source: DBS Vickers
Analyst: Namida ARTISPONG
THAI-CAC Declared
Corporate Governance CG Rating 2016
THAI-CAC is Companies participating in Thailand's Private Sector Collective Action Coalition Against Corruption programme (Thai CAC) under Thai Institute of Directors (as of October 28, 2016) are categorised into:
Score Description
Declared Companies that have declared their intention to join CAC
Certified Companies certified by CAC.
Corporate Governance CG Rating is based on Thai Institute of
Directors (IOD)’s annual assessment of corporate governance practices of listed companies. The assessment covers 235 criteria in five categories including board responsibilities (35% weighting), disclosure and transparency (20%), role of stakeholders (20%), equitable treatment of shareholders (10%) and rights of shareholders (15%). The IOD then assigns numbers of logos to each company based on their scoring as follows:
Score Range Number of Logo Description
90-100 Excellent
80-89 Very Good
70-79 Good
60-69 Satisfactory
50-59 Pass
<50 No logo given N/A
Page 39
ASIAN INSIGHTS VICKERS SECURITIES ed: TH / sa:MR, PY
BUYLast Traded Price ( 14 Nov 2016): P105 (PCOMP : 6,871.48) Price Target 12-mth: P125 (19% upside) (Prev P143)
Potential Catalyst: Sustained growth in yields Where we differ: Wider margin assumption than consensus Analyst Marvin KHOR +60 32604 3911 [email protected] Paul YONG CFA +65 6682 3712 [email protected]
What’s New
CEB records core profits despite 3Q16 low season,
and adverse forex translation hitting headline
Surprise yield growth lifted earnings, supported
by cheaper fuel and healthy load factors
Tweak core earnings forecasts by 6%/2% for
FY16/17F; TP adjusted to P125 on more
conservative multiple – maintain BUY
Price Relative
Forecasts and Valuation FY Dec (P m) 2015A 2016F 2017F 2018F Revenue 56,502 60,876 65,599 72,564 EBITDA 11,916 17,065 16,924 18,788 Pre-tax Profit 3,529 10,485 10,048 10,683 Net Profit 4,387 9,892 9,480 10,079 Net Pft (Pre Ex.) 5,857 9,892 9,480 10,079 Net Pft Gth (Pre-ex) (%) 79.5 68.9 (4.2) 6.3 EPS (P) 7.24 16.3 15.6 16.6 EPS Pre Ex. (P) 9.67 16.3 15.6 16.6 EPS Gth Pre Ex (%) 80 69 (4) 6 Diluted EPS (P) 9.67 16.3 15.6 16.6 Net DPS (P) 1.50 2.00 5.39 5.16 BV Per Share (P) 41.2 55.5 65.8 77.2 PE (X) 14.5 6.4 6.7 6.3 PE Pre Ex. (X) 10.9 6.4 6.7 6.3 P/Cash Flow (X) 5.1 4.0 3.9 3.5 EV/EBITDA (X) 8.0 5.1 4.8 5.4 Net Div Yield (%) 1.4 1.9 5.1 4.9 P/Book Value (X) 2.5 1.9 1.6 1.4 Net Debt/Equity (X) 1.3 0.7 0.4 0.8 ROAE (%) 25.2 33.8 25.8 23.3 Earnings Rev (%): 6 2 3 Consensus EPS (P): 16.2 14.2 12.4 Other Broker Recs: B: 12 S: 1 H: 3 Source of all data on this page: Company, AllianceDBS, Bloomberg Finance L.P
Running a tight ship
Solid FY16 performance is on track. CEB is due to deliver a robust FY16, having notched a respectable 6.7% revenue-passenger-kilometre growth (on 81.6% load factor) for the year despite a backdrop of limited capacity growth space, due to airport constraints. Meanwhile, core profitability has leapt from cheaper fuel costs and resilient yields, despite some Peso depreciation. We continue to be positive about CEB’s dominating position in the Philippines’ domestic air travel market, maintain BUY with TP of P125.
Sound fundamental outlook for profitability. Thanks to supportive demand and capacity constraints in the domestic space, CEB is achieving previously-unexpected growth in yields & fares. This further supplements FY16’s margin expansion from cheaper fuel. As the dominant market share leader (>56%), we expect CEB to maintain its robust profitability via further yield management against a backdrop of low industry capacity expansion.
Constrained capacity conditions are positive for domestic and short-haul international operations. We anticipate more good performance in CEB’s domestic and short-haul international operations, which will more than offset a tougher long-haul segment which faces stiffer competition. This comes especially as slot limitations in Manila are expected to rein in capacity competition for the airlines players.
Valuation:
Reiterate BUY. We change our valuation multiple on CEB to 1.9x (from 2.2x) FY17F P/BV (historical mean, from +1SD) to reflect higher macro-related risks such as a stronger US$ against the Peso. Nonetheless, upside remains visible backed by regionally outperforming ROAE - maintain BUY.
Key Risks to Our View:
Substantial strengthening of US$ against Peso. CEB is vulnerable to a stronger US$, as a significant proportion of its earnings are denominated in Peso, while the company incurs more than half its expenses in US$ and almost all its debt is denominated in US$.
At A Glance
Issued Capital (m shrs) 606 Mkt. Cap (Pm/US$m) 63,625 / 1,297 Major Shareholders (%) CP Air Holdings 66.2
Free Float (%) 33.8 3m Avg. Daily Val (US$m) 1.6 ICB Industry : Consumer Services / Travel & Leisure
DBS Group Research . Equity 15 Nov 2016
Philippines Company Guide
Cebu Air Version 2 | Bloomberg: CEB PM | Reuters: CEB.PS Refer to important disclosures at the end of this report
Page 40

ASIAN INSIGHTS VICKERS SECURITIES Page 2
Company Guide
Cebu Air
CRITICAL DATA POINTS TO WATCH
Earnings Drivers:
Conservative ASK growth. Airline capacity is measured via ASK (available seat kilometres), which is a function of the active fleet and flight distances of routes served. As CEB has marginal net fleet growth planned (+2/+2 in FY16/17F, from 55 at end-2015), we expect slower overall capacity growth. Expansion will be mainly led by up-gauging of aircraft (larger capacity planes on the same routes) and improving fleet utilisation. More growth is set to come in FY18 with +10 net fleet additions planned as it receives 12 of its A321neo orders (less other lease expiries and replacements). Load factors to improve. Load factors are calculated as number of passengers into the distance they travelled (RPK – Revenue Passenger km) as a percentage of ASK (i.e. how full the aircraft are). Given the muted capacity addition in the domestic segment, CEB as the market leader expects its load factors to improve, and we forecast 81.5%/82% in FY16/17F (+1.7/0.5ppt) and remain flat in FY18F. CEB prides itself on its competitive index score of >1, i.e. having a greater proportion of passenger share than seat share – implying stronger load factors than its competitors. A more neutral outlook for yields. Passenger yield (fare per RPK) estimates the average payment by a passenger to fly a kilometre. The 13% decline in FY15 yields was largely due to the abolishment of fuel surcharges. We forecast yield to stay flat in FY16, grow by a mild 2% in FY17 and remain at that level in FY18. While the competitive landscape is not expected to be slack, we think the capacity constraints at Manila airport limiting capacity addition for all players will allow fares to be edged up. Ancillary and other income to inch up. Ancillary and other income per pax includes per passenger in-flight sales, excess baggage and changing reservations payments, plus freight charges. Both FY14 and FY15 have recorded above 7% growth in ancillary income per pax. With higher range of in-flight offerings and on average longer flights (mainly due to international expansion), further growth can be expected and we have forecast a conservative growth rate of 2%/2%/1% for FY16/17/18F. Unit costs to edge up. Cost/ASK measures fuel costs, cash operating costs and asset costs (aircraft rental & depreciation) with respect to flying a seat for a kilometre. We forecast a decline of 4% in FY16F cost/ASK largely due to a decline of 16% in fuel costs. We forecast spot jet fuel price at US$50/60/bbl in FY16/17F and depreciation of Peso at 4%/5% against the USD in FY16/17F. Accordingly, cost/ASK is expected to increase by 9% in FY17F and by a milder 3% in FY18F due to smaller fuel price increase and stable forecast of Peso.
ASK growth (%)
Load Factor (%)
Fare / RPK (PHP)
Ancillary income / pax (PHP)
Cost / ASK (PHP)
Source: Company, AllianceDBS
Page 41

ASIAN INSIGHTS VICKERS SECURITIES Page 3
Company Guide
Cebu Air
Balance Sheet:
Gearing expected to remain moderate. With the rising earnings, net gearing is forecast to gradually ease to 0.7x/0.4x in FY16/17F from 1.3x in FY15. However, we expect some bump up with the more sizeable delivery of 12 A321neos beginning 2018, with it rising to a still-manageable level of 0.8x in FY18F. Share Price Drivers:
Continuing earnings momentum. As margins are lifted from lower fuel costs; we project CEB to see core earnings growth of 69% in FY16F to reach record bottom-line figures, and help drive share price performance. Furthermore, our FY17F assumptions are tame given the expected inching up of fuel costs – if CEB finds another engine of growth (via larger yield improvement, market share expansion, or further cost reductions), further re-rating may be seen. Key Risks:
Sustained rise in jet fuel prices. Fuel costs are a major component of the group’s operating expenditures, at c.38% in FY15. Despite hedging strategies securing c.52%/41% of FY16/17F requirements, a sustained rise in jet fuel prices will risk increasing unit costs. Our current spot jet fuel price assumptions are US$50/60/bbl in FY16/17F. Adverse exposure to a stronger US$. About 58% of CEB’s expenses are US$-denominated (in FY15) – primarily fuel, aircraft leasing and repair & maintenance costs. However, the group’s US$-denominated revenue is at a much lower level. Additionally, all the long-term liabilities of the group are denominated in US$. Further appreciation of the US$ against the Peso may result in cost escalation as well as foreign exchange translation losses. Company Background
CEB wholly owns and operates two LCC carriers in Philippines, namely Cebu Pacific and Cebgo. Cebu Pacific has an extensive domestic network in addition to international services in Asia Pacific and Middle East. Cebgo, formally known as Tigerair Philippines, was acquired in 2014 and is currently operating the group’s turboprop fleet on domestic routes.
Leverage & Asset Turnover (x)
Capital Expenditure
ROE (%)
Forward PE Band (x)
PB Band (x)
Source: Company, AllianceDBS
Page 42

ASIAN INSIGHTS VICKERS SECURITIES Page 4
Company Guide
Cebu Air
Key Assumptions
FY Dec 2014A 2015A 2016F 2017F 2018F ASK growth (%) 26.5 21.5 5.00 5.00 10.3 Load Factor (%) 79.1 79.8 81.5 82.0 82.0 Fare / RPK (PHP) 2.48 2.15 2.15 2.19 2.19 Ancillary income / pax 700 752 767 783 790 Cost / ASK (PHP) 2.33 1.88 1.80 1.96 2.01
Income Statement (Pm)
FY Dec 2014A 2015A 2016F 2017F 2018F Revenue 52,000 56,502 60,876 65,599 72,564 Other Opng (Exp)/Inc (50,157) (49,733) (49,472) (54,794) (60,972) Operating Profit 1,843 6,769 11,404 10,805 11,592 Other Non Opg (Exp)/Inc 0.0 0.0 0.0 0.0 0.0 Associates & JV Inc 96.3 35.4 83.7 83.7 83.7 Net Interest (Exp)/Inc (933) (990) (1,004) (840) (993) Exceptional Gain/(Loss) (127) (2,286) 0.0 0.0 0.0 Pre-tax Profit 879 3,529 10,485 10,048 10,683 Tax (25.1) 858 (593) (568) (604) Minority Interest 0.0 0.0 0.0 0.0 0.0 Preference Dividend 0.0 0.0 0.0 0.0 0.0 Net Profit 854 4,387 9,892 9,480 10,079 Net Profit before Except. 3,262 5,857 9,892 9,480 10,079 EBITDA 6,221 11,916 17,065 16,924 18,788 Growth Revenue Gth (%) 26.8 8.7 7.7 7.8 10.6 EBITDA Gth (%) (0.8) 91.5 43.2 (0.8) 11.0 Opg Profit Gth (%) (31.6) 267.3 68.5 (5.3) 7.3 Net Profit Gth (Pre-ex) (%) 68.6 79.5 68.9 (4.2) 6.3 Margins & Ratio Opg Profit Margin (%) 3.5 12.0 18.7 16.5 16.0 Net Profit Margin (%) 1.6 7.8 16.2 14.5 13.9 ROAE (%) 15.3 25.2 33.8 25.8 23.3 ROA (%) 4.5 7.3 11.1 9.7 8.8 ROCE (%) 3.3 11.2 15.8 13.5 12.0 Div Payout Ratio (%) 71.0 20.7 12.3 34.4 31.0 Net Interest Cover (x) 2.0 6.8 11.4 12.9 11.7
Source: Company, AllianceDBS
Page 43

ASIAN INSIGHTS VICKERS SECURITIES Page 5
Company Guide
Cebu Air
Quarterly / Interim Income Statement (Pm)
FY Dec 3Q2015 4Q2015 1Q2016 2Q2016 3Q2016 Revenue 12,753 14,243 16,106 16,987 13,598 Other Oper. (Exp)/Inc (13,336) (12,955) (11,967) (11,874) (12,500) Operating Profit (583) 1,288 4,139 5,113 1,098 Other Non Opg (Exp)/Inc 0.0 0.0 0.0 0.0 0.0 Associates & JV Inc 10.6 36.5 55.6 47.9 48.7 Net Interest (Exp)/Inc (252) (269) (274) (251) (263) Exceptional Gain/(Loss) (1,444) (476) 460 (887) (1,341) Pre-tax Profit (2,268) 580 4,381 4,024 (457) Tax 623 252 (344) (378) (127) Minority Interest 0.0 0.0 0.0 0.0 0.0 Net Profit (1,645) 832 4,037 3,645 (584) Net profit bef Except. (112) 1,408 3,369 3,506 699 EBITDA 715 2,679 5,673 6,707 2,717 Growth Revenue Gth (%) (16.7) 11.7 13.1 5.5 (20.0) EBITDA Gth (%) (85.3) 274.8 111.7 18.2 (59.5) Opg Profit Gth (%) nm nm 221.3 23.5 (78.5) Net Profit Gth (Pre-ex) (%) nm nm 139.3 4.0 (80.0) Margins Opg Profit Margins (%) (4.6) 9.0 25.7 30.1 8.1 Net Profit Margins (%) (12.9) 5.8 25.1 21.5 (4.3)
Balance Sheet (Pm)
FY Dec 2014A 2015A 2016F 2017F 2018F Net Fixed Assets 65,227 72,076 72,994 74,212 102,890 Invts in Associates & JVs 591 526 609 693 777 Other LT Assets 1,717 2,464 2,464 2,464 2,464 Cash & ST Invts 3,964 4,706 12,870 18,661 15,870 Inventory 679 919 970 1,107 1,253 Debtors 1,302 1,398 1,501 1,618 1,789 Other Current Assets 2,581 2,739 2,739 2,739 2,739 Total Assets 76,062 84,829 94,147 101,494 127,782 ST Debt 4,712 5,424 5,424 5,424 5,424 Creditor 3,984 3,773 3,878 4,427 5,011 Other Current Liab 15,364 17,303 17,837 18,419 19,278 LT Debt 29,137 31,165 31,165 31,165 49,060 Other LT Liabilities 1,325 2,208 2,208 2,208 2,208 Shareholder’s Equity 21,539 24,955 33,635 39,851 46,802 Minority Interests 0.0 0.0 0.0 0.0 0.0 Total Cap. & Liab. 76,062 84,829 94,147 101,494 127,782 Non-Cash Wkg. Capital (14,786) (16,020) (16,505) (17,382) (18,508) Net Cash/(Debt) (29,886) (31,883) (23,719) (17,928) (38,614) Debtors Turn (avg days) 7.9 8.7 8.7 8.7 8.6 Creditors Turn (avg days) 353.7 277.0 250.4 251.2 242.2 Inventory Turn (avg days) 59.3 57.1 61.8 62.8 60.6 Asset Turnover (x) 0.7 0.7 0.7 0.7 0.6 Current Ratio (x) 0.4 0.4 0.7 0.9 0.7 Quick Ratio (x) 0.2 0.2 0.5 0.7 0.6 Net Debt/Equity (X) 1.4 1.3 0.7 0.4 0.8 Net Debt/Equity ex MI (X) 1.4 1.3 0.7 0.4 0.8 Capex to Debt (%) 39.3 32.9 17.8 19.8 65.7 Z-Score (X) NA NA NA NA NA
Source: Company, AllianceDBS
Page 44

ASIAN INSIGHTS VICKERS SECURITIES Page 6
Company Guide
Cebu Air
Cash Flow Statement (Pm)
FY Dec 2014A 2015A 2016F 2017F 2018F Pre-Tax Profit 879 3,529 10,485 10,048 10,683 Dep. & Amort. 4,282 5,112 5,577 6,035 7,112 Tax Paid (45.0) (60.8) (593) (568) (604) Assoc. & JV Inc/(loss) (96.3) (35.4) (83.7) (83.7) (83.7) Chg in Wkg.Cap. 901 1,001 485 877 1,125 Other Operating CF 1,628 2,840 0.0 0.0 0.0 Net Operating CF 7,575 12,395 15,871 16,309 18,232 Capital Exp.(net) (13,316) (12,035) (6,495) (7,254) (35,790) Other Invts.(net) (489) 0.0 0.0 0.0 0.0 Invts in Assoc. & JV 0.0 0.0 0.0 0.0 0.0 Div from Assoc & JV 83.8 101 0.0 0.0 0.0 Other Investing CF 116 129 0.0 0.0 0.0 Net Investing CF (13,605) (11,805) (6,495) (7,254) (35,790) Div Paid (606) (909) (1,212) (3,264) (3,129) Chg in Gross Debt 4,301 949 0.0 0.0 17,895 Capital Issues 0.0 0.0 0.0 0.0 0.0 Other Financing CF 0.0 0.0 0.0 0.0 0.0 Net Financing CF 3,695 39.7 (1,212) (3,264) 14,766 Currency Adjustments (14.4) 113 0.0 0.0 0.0 Chg in Cash (2,349) 742 8,164 5,791 (2,791) Opg CFPS (P) 11.0 18.8 25.4 25.5 28.2 Free CFPS (P) (9.5) 0.59 15.5 14.9 (29.0)
Source: Company, AllianceDBS
Target Price & Ratings History
Source: AllianceDBS
Analyst: Marvin KHOR
Paul YONG CFA
Page 45

ASIAN INSIGHTS VICKERS SECURITIES ed: JS / sa:YM, PY
BUY Last Traded Price ( 28 Dec 2016): S$1.405 (STI : 2,898.30) Price Target 12-mth: S$1.70 (21% upside) Potential Catalyst: Earnings growth and delivery; value-accretive acquisitions Where we differ: Slightly below consensus due to lower GP/tonne estimates
Analyst
Paul YONG CFA +65 6682 3712 [email protected] Singapore Research Team [email protected]
Price Relative
Forecasts and Valuation FY Dec (US$ m) 2015A 2016F 2017F 2018F Revenue 8,987 9,410 10,948 11,495 EBITDA 66.2 83.9 90.8 95.9 Pre-tax Profit 63.6 81.8 88.9 94.3 Net Profit 61.3 78.6 85.4 90.5 Net Pft (Pre Ex.) 61.3 78.6 85.4 90.5 Net Pft Gth (Pre-ex) (%) 24.7 28.2 8.7 6.0 EPS (S cts) 10.3 13.2 14.4 15.3 EPS Pre Ex. (S cts) 10.3 13.2 14.4 15.3 EPS Gth Pre Ex (%) 25 28 9 6 Diluted EPS (S cts) 10.3 13.2 14.4 15.3 Net DPS (S cts) 3.08 3.97 4.32 4.58 BV Per Share (S cts) 99.9 109 119 130 PE (X) 13.6 10.6 9.8 9.2 PE Pre Ex. (X) 13.6 10.6 9.8 9.2 P/Cash Flow (X) 16.0 18.9 18.3 16.5 EV/EBITDA (X) 10.0 7.1 5.7 4.6 Net Div Yield (%) 2.2 2.8 3.1 3.3 P/Book Value (X) 1.4 1.3 1.2 1.1 Net Debt/Equity (X) CASH CASH CASH CASH ROAE (%) 10.7 12.7 12.6 12.2 Earnings Rev (%): 0 0 - Consensus EPS (S cts): 13.3 15.7 17.8 Other Broker Recs: B: 4 S: 0 H: 0
Source of all data on this page: Company, DBS Bank, Bloomberg Finance L.P
Cruising towards record 2016
Maintain BUY with TP of S$1.70 as our 2017 outlook remains unchanged. Registering a 31% y-o-y jump in net profit to US$23.2m in 3Q16, China Aviation Oil (CAO)’s results were above expectations, as several associates benefited from one-offs such as mark-to-market inventory gains and favourable currency movements.
While our FY17F earnings are intact, we lift FY16F earnings by 4% as we adjust for slightly higher supply and trading volumes.
Sole supplier of imported jet fuel in China with growing international presence. With monopoly on the supply of bonded jet fuel to China’s civil aviation industry, CAO should benefit from the long-term growth of China’s international air travel market. Furthermore, with the backing of SOE parent China National Aviation Fuel Group (CNAF), CAO has expanded its business to marketing and supply of jet fuel at 43 international airports outside China, and further growing its reach, volumes, and ultimately achieving greater economies of scale.
Firm outlook for prized asset 33%-owned associate, SPIA. As the exclusive supplier of jet fuel to Pudong International Airport, Shanghai Pudong International Airport Aviation Fuel Supply Company (SPIA) has and should carry on to benefit from rising air traffic at the airport, which is driven by the continued development of Shanghai as China’s key financial centre. Net cash and strong balance sheet could fund acquisition-driven growth. With net cash of c.US$203m at the end of 3Q16, and strong support from its parent CNAF, we believe that CAO could be on the lookout for acquisitions to further grow the scale and reach of its business and profits.
Valuation:
Our TP of S$1.70 is based on 12x FY17F PE. We think that 12x earnings against the projected 18% EPS CAGR over FY15-FY17F is reasonable, and believe that the group is poised to see a structural re-rating of its valuation multiple on sustained earnings growth, especially if CAO can utilise its strong cash balance to further accelerate growth through M&A.
Key Risks to Our View:
Weaker demand for air travel and execution risk. A sustained slowdown in demand for air travel could impact jet fuel demand and volumes. Further, the group could also face execution risk in its trading business and prospective M&A activities.
At A Glance Issued Capital (m shrs) 865 Mkt. Cap (S$m/US$m) 1,215 / 838 Major Shareholders (%) China National Aviation Fuel Grp 51.0 BP Plc 20.1
Free Float (%) 28.9 3m Avg. Daily Val (US$m) 1.4 ICB Industry : Oil & Gas / Oil & Gas Producers
DBS Group Research . Equity 29 Dec 2016
Singapore Company Guide
China Aviation Oil Version 3 | Bloomberg: CAO SP | Reuters: CNAO.SI Refer to important disclosures at the end of this report
64
84
104
124
144
164
184
204
224
0.5
0.7
0.9
1.1
1.3
1.5
1.7
Dec-12 Dec-13 Dec-14 Dec-15 Dec-16
Relative IndexS$
China Aviation Oil (LHS) Relative STI (RHS)
Page 46

ASIAN INSIGHTS VICKERS SECURITIES Page 2
Company Guide
China Aviation Oil
CRITICAL DATA POINTS TO WATCH
Earnings Drivers: Sole importer of jet fuel into the PRC with growing international presence… Leveraging on the network of its parent, China National Aviation Fuel Group Corporation (CNAF) – a state-owned enterprise and the largest aviation transportation logistics services provider in the PRC – China Aviation Oil (Singapore) Corporation Ltd (CAO) has monopoly in the supply of imported jet fuel (or bonded jet fuel) to 17 international airports in China.
With the backing of its parent, CAO has also expanded its business to the marketing and supply of jet fuel to airline companies at 43 international airports outside of the PRC, spanning across Asia Pacific, North America, Europe and the Middle East.
Owing to its domestic monopoly, CAO should benefit from the long-term growth of China’s international air travel market. Coupled with its ongoing international expansion, we expect jet fuel volumes supplied and traded to grow at a 4.5% CAGR from c.12m in FY15 to almost 16m by FY18F.
Optimising of margins through trading activities. As CAO enjoys cost-plus pricing (we estimate gross profit (GP) of US$3.02/tonne) for its China jet fuel supply business, and after hedging downside risk, CAO will seek to further optimise margins when viable trading opportunities arise.
While opportunities to improve margins are available in both backwardation and contango markets, CAO generally prefers contango markets as it allows for superior opportunities for margin optimisation from the storing and trading of fuels (which also includes gas oil, fuel oil and avgas).
With trading opportunities potentially constrained by the lack of clarity in the underlying oil market, we have lowered our GP/tonne assumptions to US$1.37 and US$1.46 for FY16F and FY17F respectively.
Contributions from associates, including prized asset SPIA. Arguably CAO’s best-performing asset, SPIA has never had a cash call since the group first invested in Shanghai Pudong International Airport’s exclusive supplier of jet fuel in 2002, and has historically close to 90% share in the annual income contributions from CAO’s associated companies. Notably, SPIA alone contributed c.61.3% of the group’s FY15 profit, and continues to perform firmly as it contributed c.66% of CAO’s 9M16 net profit.
With two new runways added in the last 18 months, which has doubled the capacity of the airport, and additional satellite concourse expected to be completed by 2019, capacity at China’s second-largest airport is expected to be raised from 60m to 80m passengers p.a., which should underpin SPIA’s long-term growth prospects.
Nearer term, given SPIA’s consistently firm performance - even as expected air traffic increases from the recent opening of Shanghai Disneyland have yet to show up, we think that contributions from the associate should more than offset trading challenges (if any) in 2H16.
Jet Fuel Volumes (m tonnes)
Other Oil Product Volumes (m tonnes)
Implied Average Jet Fuel Price (USD/bbl)
Gross Profit per Tonne (US$)
Contribution from Associates (US$ m)
Source: Company, DBS Bank
12.1 11.9
14.315
15.7
0.0
2.3
4.5
6.8
9.1
11.3
13.6
15.9
2014A 2015A 2016F 2017F 2018F
8.29 8.28
16.615.7
16.5
0.0
3.4
6.8
10.1
13.5
16.9
2014A 2015A 2016F 2017F 2018F
141
74.4
56.664.7 64.7
0.00
28.77
57.53
86.30
115.06
143.83
2014A 2015A 2016F 2017F 2018F
1.34
1.76
1.371.46 1.51
0.0
0.4
0.7
1.1
1.4
1.8
2014A 2015A 2016F 2017F 2018F
43.2 42.3
58.862.9
66.8
0.0
13.5
27.0
40.5
54.0
67.4
2014A 2015A 2016F 2017F 2018F
Page 47

ASIAN INSIGHTS VICKERS SECURITIES Page 3
Company Guide
China Aviation Oil
Balance Sheet:
Strong balance sheet with a net cash position of US$203m as at end-3Q16. With net cash of US$202.8m in 3Q16, we believe the company has sufficient firepower with room to gear up further to finance its M&A opportunities and grow the scale and reach of its business and profits. Share Price Drivers:
Progress on the M&A front. While CAO is armed with dry powder for potential acquisitions and investments, it has yet to announce significant M&A plans – its last major investment was in 2013, when the company acquired a 39% stake in refueller CNAF Hong Kong Refuelling Limited. Management has shared that they will be looking at both “asset-light” investments, which will allow the group to gain access to air spaces, customer contracts, strategic alliances and further trading synergies, as well as “asset-backed” investments (or infrastructure assets), which may include airport refuelling stations, pipelines going into airports and storage facilities. We believe that the eventual deployment of cash to fund value-accretive opportunities should lead to a further rerating of the stock. Key Risks:
Weaker demand for air travel. Given the group’s exposure to the air passenger market, events that could significantly dampen travellers’ sentiment, such as the outbreak of diseases and acts of terror, pose direct threats to the tourism and air travel industry which in turn, could weigh on global demand for jet fuel. Potential mark-to-market losses for associates. As SPIA and CNAF-HKR hold inventories of fifteen days and seven days respectively, these have to be marked to market. In a declining oil price environment, these would result in paper losses for these associates, which add volatility to CAO’s bottom line. Trading and execution risks. CAO is exposed to a myriad of risks that are inherent in the lifecycle of trades, which include market risk, credit risk, and operational risk. Company Background
China Aviation Oil (Singapore) Corporation Ltd (CAO SP) is principally engaged in the supply and trading of bonded jet fuel, with monopoly in China and a growing international presence. Apart from jet fuel, the group also trades and/or supplies other transportation fuel (such as fuel oil, gas oil and aviation gas) and has varying equity stakes in oil-related assets. These assets include airport refuelling facilities (SPIA and CNAF HKR), pipelines (TSN-PEKCL) and storage facilities (Xinyuan and OKYC).
Leverage & Asset Turnover (x)
Capital Expenditure
ROE (%)
Forward PE Band (x)
PB Band (x)
Source: Company, DBS Bank
8.0
8.5
9.0
9.5
10.0
10.5
11.0
0.00
0.01
0.01
0.02
0.02
0.03
0.03
0.04
0.04
0.05
0.05
2014A 2015A 2016F 2017F 2018F
Gross Debt to Equity (LHS) Asset Turnover (RHS)
0.2
0.2
0.2
0.2
0.2
0.2
0.2
0.2
0.3
0.3
2014A 2015A 2016F 2017F 2018F
Capital Expenditure (-)
US$m
0.0%
2.0%
4.0%
6.0%
8.0%
10.0%
12.0%
2014A 2015A 2016F 2017F 2018F
Avg: 8.6x
+1sd: 10.5x
+2sd: 12.4x
‐1sd: 6.6x
‐2sd: 4.7x4.0
5.0
6.0
7.0
8.0
9.0
10.0
11.0
12.0
13.0
Dec-12 Dec-13 Dec-14 Dec-15 Dec-16
(x)
Avg: 0.99x
+1sd: 1.2x
+2sd: 1.41x
‐1sd: 0.78x
‐2sd: 0.57x0.5
0.7
0.9
1.1
1.3
1.5
1.7
Dec-12 Dec-13 Dec-14 Dec-15 Dec-16
(x)
Page 48

ASIAN INSIGHTS VICKERS SECURITIES Page 4
Company Guide
China Aviation Oil
Key Assumptions
FY Dec 2014A 2015A 2016F 2017F 2018F Jet Fuel Volumes (m 12.1 11.9 14.3 15.0 15.7 Other Oil Product 8.29 8.28 16.6 15.7 16.5 Implied Average Jet Fuel 141 74.4 56.6 64.7 64.7 Gross Profit per Tonne 1.34 1.76 1.37 1.46 1.51 Contribution from 43.2 42.3 58.8 62.9 66.8
Segmental Breakdown
FY Dec 2014A 2015A 2016F 2017F 2018F Revenues (US$m) Middle distillates 13,508 7,010 6,400 7,680 8,064 Other oil products 3,553 1,978 3,010 3,268 3,431 Total 17,061 8,987 9,410 10,948 11,495
Income Statement (US$m)
FY Dec 2014A 2015A 2016F 2017F 2018F Revenue 17,061 8,987 9,410 10,948 11,495 Cost of Goods Sold (17,034) (8,952) (9,368) (10,903) (11,447) Gross Profit 27.4 35.4 42.3 45.0 48.6 Other Opng (Exp)/Inc (16.5) (13.1) (18.7) (18.5) (20.6) Operating Profit 10.9 22.3 23.5 26.5 28.0 Other Non Opg (Exp)/Inc 0.0 0.0 0.0 0.0 0.0 Associates & JV Inc 43.2 42.3 58.8 62.9 66.8 Net Interest (Exp)/Inc (3.1) (1.0) (0.5) (0.5) (0.5) Exceptional Gain/(Loss) 0.0 0.0 0.0 0.0 0.0 Pre-tax Profit 51.0 63.6 81.8 88.9 94.3 Tax (1.9) (2.3) (3.3) (3.6) (3.8) Minority Interest 0.0 0.0 0.0 0.0 0.0 Preference Dividend 0.0 0.0 0.0 0.0 0.0 Net Profit 49.2 61.3 78.6 85.4 90.5 Net Profit before Except. 49.2 61.3 78.6 85.4 90.5 EBITDA 55.6 66.2 83.9 90.8 95.9 Growth Revenue Gth (%) 9.6 (47.3) 4.7 16.3 5.0 EBITDA Gth (%) (30.1) 19.1 26.7 8.2 5.7 Opg Profit Gth (%) (65.1) 104.8 5.3 12.5 5.7 Net Profit Gth (Pre-ex) (%) (30.0) 24.7 28.2 8.7 6.0 Margins & Ratio Gross Margins (%) 0.2 0.4 0.4 0.4 0.4 Opg Profit Margin (%) 0.1 0.2 0.3 0.2 0.2 Net Profit Margin (%) 0.3 0.7 0.8 0.8 0.8 ROAE (%) 9.1 10.7 12.7 12.6 12.2 ROA (%) 3.2 5.5 8.9 8.8 8.4 ROCE (%) 1.9 3.7 3.6 3.7 3.6 Div Payout Ratio (%) 26.5 29.8 30.0 30.0 30.0 Net Interest Cover (x) 3.5 21.5 47.1 53.0 56.0
Source: Company, DBS Bank
We adjust our GP/tonne assumptions for FY16F/17F slightly downward on the expectation of a more challenging trading environment.
Tax rate to remain low as CAO receives tax incentives under Singapore’s Global Trader Programme.
Page 49

ASIAN INSIGHTS VICKERS SECURITIES Page 5
Company Guide
China Aviation Oil
Quarterly / Interim Income Statement (US$m)
FY Dec 3Q2015 4Q2015 1Q2016 2Q2016 3Q2016 Revenue 2,399 1,973 1,464 3,023 3,940 Cost of Goods Sold (2,386) (1,965) (1,451) (3,013) (3,929) Gross Profit 12.9 8.00 13.2 9.90 10.4 Other Oper. (Exp)/Inc (4.1) (5.7) (2.3) (4.3) (5.3) Operating Profit 8.80 2.30 10.8 5.62 5.08 Other Non Opg (Exp)/Inc 0.0 0.0 0.0 0.0 0.0 Associates & JV Inc 9.73 9.75 14.2 19.4 19.5 Net Interest (Exp)/Inc (0.2) (0.2) (0.1) (0.2) (0.7) Exceptional Gain/(Loss) 0.0 0.0 0.0 0.0 0.0 Pre-tax Profit 18.3 11.9 24.9 24.8 23.9 Tax (0.6) (0.4) (0.7) (1.2) (0.7) Minority Interest 0.0 0.0 0.0 0.0 0.0 Net Profit 17.7 11.4 24.2 23.6 23.2 Net profit bef Except. 17.7 11.4 24.2 23.6 23.2 EBITDA 18.5 12.0 25.0 25.0 24.6 Growth Revenue Gth (%) (4.9) (17.8) (25.8) 106.5 30.3 EBITDA Gth (%) (1.7) (35.0) 107.7 (0.1) (1.7) Opg Profit Gth (%) 64.2 (73.9) 371.7 (48.1) (9.7) Net Profit Gth (Pre-ex) (%) (0.3) (35.6) 111.6 (2.2) (1.7) Margins Gross Margins (%) 0.5 0.4 0.9 0.3 0.3 Opg Profit Margins (%) 0.4 0.1 0.7 0.2 0.1 Net Profit Margins (%) 0.7 0.6 1.6 0.8 0.6
Balance Sheet (US$m)
FY Dec 2014A 2015A 2016F 2017F 2018F Net Fixed Assets 6.79 6.21 5.64 5.06 4.49 Invts in Associates & JVs 270 266 275 285 295 Other LT Assets 9.96 9.43 8.70 8.20 7.90 Cash & ST Invts 94.3 171 241 313 392 Inventory 38.1 56.8 66.9 75.2 78.9 Debtors 959 337 314 342 348 Other Current Assets 0.0 0.0 0.0 0.0 0.0 Total Assets 1,379 846 910 1,029 1,128 ST Debt 0.0 0.0 0.0 0.0 0.0 Creditor 819 247 253 311 347 Other Current Liab 0.02 0.01 3.28 3.56 3.78 LT Debt 0.0 0.0 0.0 0.0 0.0 Other LT Liabilities 6.24 6.16 6.16 6.16 6.16 Shareholder’s Equity 554 593 648 707 771 Minority Interests 0.0 0.0 0.0 0.0 0.0 Total Cap. & Liab. 1,379 846 910 1,029 1,128 Non-Cash Wkg. Capital 179 147 124 102 76.7 Net Cash/(Debt) 94.3 171 241 313 392 Debtors Turn (avg days) 23.8 26.3 12.6 10.9 11.0 Creditors Turn (avg days) 21.2 21.7 9.7 9.5 10.5 Inventory Turn (avg days) 1.6 1.9 2.4 2.4 2.5 Asset Turnover (x) 11.0 8.1 10.7 11.3 10.7 Current Ratio (x) 1.3 2.3 2.4 2.3 2.3 Quick Ratio (x) 1.3 2.1 2.2 2.1 2.1 Net Debt/Equity (X) CASH CASH CASH CASH CASH Net Debt/Equity ex MI (X) CASH CASH CASH CASH CASH Capex to Debt (%) N/A N/A N/A N/A N/A
Source: Company, DBS Bank
Contribution from SPIA alone represented c.75% of 3Q16 net profit.
With net cash of US$203m as at end-Sep 2016, CAO is well able to finance value-accretive M&A opportunities internally, if they arise.
Page 50

ASIAN INSIGHTS VICKERS SECURITIES Page 6
Company Guide
China Aviation Oil
Cash Flow Statement (US$m)
FY Dec 2014A 2015A 2016F 2017F 2018F Pre-Tax Profit 51.0 63.6 81.8 88.9 94.3 Dep. & Amort. 1.50 1.56 1.56 1.33 1.13 Tax Paid (2.6) (2.2) 0.0 (3.3) (3.6) Assoc. & JV Inc/(loss) (43.2) (42.3) (58.8) (62.9) (66.8) Chg in Wkg.Cap. 36.1 33.1 19.6 21.6 25.4 Other Operating CF 4.34 (1.7) 0.0 0.0 0.0 Net Operating CF 47.2 52.1 44.2 45.6 50.5 Capital Exp.(net) (0.2) (0.3) (0.3) (0.3) (0.3) Other Invts.(net) 0.0 0.0 0.0 0.0 0.0 Invts in Assoc. & JV 0.0 0.0 0.0 0.0 0.0 Div from Assoc & JV 35.2 37.2 49.9 52.9 56.0 Other Investing CF 0.07 0.19 0.0 0.0 0.0 Net Investing CF 35.0 37.2 49.6 52.6 55.8 Div Paid (13.7) (12.8) (23.6) (25.6) (27.2) Chg in Gross Debt (28.6) 0.0 0.0 0.0 0.0 Capital Issues 0.0 0.0 0.0 0.0 0.0 Other Financing CF (1.6) (0.3) 0.0 0.0 0.0 Net Financing CF (43.9) (13.0) (23.6) (25.6) (27.2) Currency Adjustments (0.4) (0.1) 0.0 0.0 0.0 Chg in Cash 38.0 76.2 70.3 72.6 79.1 Opg CFPS (S cts) 1.87 3.20 4.15 4.05 4.23 Free CFPS (S cts) 7.92 8.75 7.41 7.65 8.46
Source: Company, DBS Bank
Target Price & Ratings History
Source: DBS Bank
Analyst: Paul YONG CFA
Singapore Research Team
S.No.Date of Report
Closing Price
12-mth Target Price
Rat ing
1: 29 Apr 16 0.87 1.04 NOT RATED
2: 07 Jul 16 1.30 1.62 BUY
3: 02 Aug 16 1.47 1.70 BUY
4: 30 Aug 16 1.44 1.70 BUY
5: 03 Nov 16 1.40 1.70 BUY
6: 13 Dec 16 1.43 1.70 BUY
Note : Share price and Target price are adjusted for corporate actions.
1
2 3
4
5
6
0.55
0.75
0.95
1.15
1.35
1.55
Dec-15 Apr-16 Aug-16 Dec-16
S$
Page 51

ASIAN INSIGHTS VICKERS SECURITIES ed: CK / sa:JC, PY
BUY Last Traded Price ( 13 Dec 2016): S$3.41 (STI : 2,955.23) Price Target 12-mth: S$3.68 (8% upside) (Prev S$3.50) Potential Catalyst: Smart city-related contract wins, M&A Where we differ: Slightly more conservative on earnings than consensus Analyst Suvro SARKAR +65 6682 3720 [email protected] Singapore Research Team
What’s New FY16 final dividends should be unaffected by one-off
write-downs recorded during the year
Expect earnings recovery in FY17
STE is a beneficiary of the stronger US$
Price Relative
Forecasts and Valuation FY Dec (S$ m) 2015A 2016F 2017F 2018F Revenue 6,335 6,492 6,543 6,676 EBITDA 834 837 883 904 Pre-tax Profit 630 552 654 673 Net Profit 529 426 519 534 Net Pft (Pre Ex.) 529 487 519 534 Net Pft Gth (Pre-ex) (%) (0.5) (7.9) 6.6 2.8 EPS (S cts) 17.1 13.7 16.7 17.2 EPS Pre Ex. (S cts) 17.1 15.7 16.7 17.2 EPS Gth Pre Ex (%) 0 (8) 7 3 Diluted EPS (S cts) 17.1 13.7 16.7 17.2 Net DPS (S cts) 15.0 15.0 15.0 15.0 BV Per Share (S cts) 68.7 67.3 69.0 71.2 PE (X) 19.9 24.8 20.4 19.8 PE Pre Ex. (X) 19.9 21.7 20.4 19.8 P/Cash Flow (X) 22.7 19.7 16.1 16.0 EV/EBITDA (X) 12.9 13.0 12.3 12.0 Net Div Yield (%) 4.4 4.4 4.4 4.4 P/Book Value (X) 4.9 5.1 4.9 4.8 Net Debt/Equity (X) 0.0 0.1 0.1 0.1 ROAE (%) 24.8 20.2 24.5 24.5 Earnings Rev (%): 0 0 0 Consensus EPS (S cts): 15.3 17.2 18.3 Other Broker Recs: B: 6 S: 0 H: 6
Source of all data on this page: Company, DBS Bank, Bloomberg Finance L.P
Earnings should rebound in FY17 Maintain BUY; fundamentals remain strong. ST Engineering (STE) remains a relatively defensive stock with a healthy balance sheet and secure dividend payouts, and also looks set to resume its earnings recovery trajectory in FY17. Its Aerospace segment has positioned itself well by investing in growth markets such as narrow-body aircraft Passenger-to-Freighter (PTF) conversions, the Chinese MRO market, and cabin interior solutions, to name a few. The Electronics segment should also benefit from the ‘Smart City’ trend, not only in Singapore but various overseas markets as well. Expect earnings recovery in 2017. In 3Q16, STE reported S$61.1m in one-off write-downs and closure costs related to its Chinese specialty vehicles subsidiary that has ceased operations. But our core estimates remained largely unchanged for FY16/17. We expect a reasonable earnings rebound in FY17, following a kitchen-sinking year in FY16 associated with a management transition. Cessation of losses at the Chinese specialty vehicle subsidiaries, coupled with continued growth at Electronics division, should help offset weakness at the Marine division in FY17.Orderbook remained flattish at S$11.4bn as of end-3Q16, and the YTD announced order win trend is encouraging. Beneficiary of strong US$, no impact to dividends from one-off items. We believe dividends in FY16/17 should be maintained at 15 Scts, notwithstanding the one-off earnings impact in FY16. STE should also stand to benefit from the stronger US$ expectations as around 25% of sales are derived from the US. Valuation: Our TP is adjusted to S$3.68 as we roll over to FY17 numbers. Our TP is based on a blended valuation framework to factor in both earnings growth and long-term cash-generative nature of the business. Key Risks to Our View: A protracted slowdown in the shipbuilding and commercial vehicle businesses could hurt prospects, unless STE can offer niche products or streamline operations quickly. Also, the continued lack of action on the M&A front could lead to inefficient use of balance sheet and lower ROEs in the future. At A Glance Issued Capital (m shrs) 3,109 Mkt. Cap (S$m/US$m) 10,569 / 7,425 Major Shareholders (%) Temasek Holdings Pte Ltd (%) 51.2 Aberdeen Asset Management (%) 5.0 Capital Group (%) 4.2
Free Float (%) 39.6 3m Avg. Daily Val (US$m) 7.5 ICB Industry : Industrials / Aerospace & Defense
DBS Group Research . Equity 13 Dec 2016
Singapore Company Guide
ST Engineering Version 6 | Bloomberg: STE SP | Reuters: STEG.SI Refer to important disclosures at the end of this report
Page 52

ASIAN INSIGHTS VICKERS SECURITIES
Company Guide
ST Engineering
CRITICAL DATA POINTS TO WATCH
Earnings Drivers: Conglomerate with diverse interests in defense and commercial spheres. STE started out life as a defense contractor but has leveraged its technical knowhow over the years to penetrate the commercial market. It boasts multinational operations with a global presence in 23 countries and 41 cities, and hires more than 22,000 employees. The group has reduced its reliance on the defense sector over time from 57% of revenues in 2002 to the current 36%, with another 33% from government agencies and the balance from commercial businesses.
STE's four key business divisions bring diversification benefits. Its Aerospace, Electronics, Land Systems and Marine businesses contributed 33%, 27%, 22% and 15% respectively to FY15 revenues, allowing the company to avoid reliance on any particular sector. This has engendered relatively stable revenues and earnings, weathering even crisis periods.
Acquisitions have been a key driver, accounting for around 40% of revenue growth over the last decade. However, the dampening effect of a weakening US dollar and addition of lower-margin businesses meant earnings growth has not kept up with top-line growth. Utilisation of its strong balance sheet and steady cash flows to undertake acquisitions of high-ROE assets could boost future earnings.
Healthy orderbook drives visibility. As of end-3Q16, STE's orderbook stood at S$11.4bn, down slightly from S$11.6bn at end-2Q16 but still provides healthy visibility on revenues over FY16/17 at a roughly 1.8x book-to-bill ratio.
Aerospace MRO primed for steady growth. Continued initiatives by ST Aerospace to broaden its capabilities should propel its growth in the longer term. These include a partnership with Airbus for passenger-to-freighter conversion of its A320/A321 and A330 jets, marking a diversification of its conversion portfolio; a continued expansion of its cabin interior service solutions business, particularly for VIP aircraft completions; and expansion of its mid-life aircraft leasing business.
Electronics division’s initiatives should be a key long-term growth driver. Within the Smart Nation framework, we estimate projects worth more than S$1bn in the near future, as the Singaporean government pushes for smart technology usage across the utilities, healthcare, housing and transport spaces. The recently launched TeLEOS-1 satellite is now ready to provide commercial imagery services and should herald a new space-centred growth channel for the division. We are also seeing increased importance being placed on robotics, which could be another future key growth driver.
Aerospace sales growth (%)
Electronics sales growth (%)
Land Systems sales growth (%)
Marine sales growth (%)
Source: Company, DBS Bank
Page 53

ASIAN INSIGHTS VICKERS SECURITIES
Company Guide
ST Engineering
Balance Sheet: Healthy balance sheet can drive M&A ambitions. STE has traditionally been in net cash position but ended FY15 in a minor gearing position due to channelling of cash into bonds and share buybacks to improve returns on capital. Nevertheless, its balance sheet remains very strong and STE has ample ammunition to pursue attractive acquisitions in growth areas.
Dividend payout should remain steady. Strong operating cash flows provide support to healthy dividend yield levels of around 4.8% currently. Despite the fall in headline net profit expected in FY16, we believe the non-cash writedown recorded in 3Q16 should not have an effect on dividends, and total payout for FY16 should be similar to the FY15 level of 15 Scts.
Share Price Drivers: Strong order wins. Total announced order wins in FY15 of S$4bn were slightly lower than previous years, as a result of the Land Systems and Marine divisions seeing some weak industry trends, while the Aerospace and Electronics divisions have announced steady order wins. YTD order wins in 2016 are trending slightly higher than 2015 order wins, and any further improvement in order win momentum would be beneficial to its stock price.
Recovery in the Marine sector. The Marine sector is arguably facing the strongest industry headwinds on the commercial front, with low offshore oil & gas spending and broad overcapacity in shipping. Cost overruns in the US exacerbate the situation. An industry recovery, as well as better productivity in the US, would provide more confidence in the medium-term earnings of the business.
Key Risks: Aerospace margins could come under pressure during transition period. As STE has consolidated the European EfW Airbus P2F operations, revenue will increase but margins will be low owing to the learning cost involved in new P2F programmes for the A330-300. STE also faces slowdown in its CFM-56B engine MRO operations owing to increased engine reliability and intense competition.
Protracted slowdown in shipbuilding. The traditional shipping sector has been plagued by overcapacity for some time now, while the slide in oil prices also affects demand for offshore vessels. Visibility on demand recovery is low at this point.
Company Background ST Engineering (STE) is an integrated engineering group in the aerospace, electronics, land systems and marine sectors. The company has over the years diversified its businesses and geographies.
Leverage & Asset Turnover (x)
Capital Expenditure
ROE (%)
Forward PE Band (x)
PB Band (x)
Source: Company, DBS Bank
Page 54

ASIAN INSIGHTS VICKERS SECURITIES
Company Guide
ST Engineering
Key Assumptions
FY Dec 2014A 2015A 2016F 2017F 2018F
Aerospace sales growth (0.9) 1.41 14.1 4.64 3.92 Electronics sales growth (4.1) 7.96 8.79 6.75 6.78 Land Systems sales (5.3) (0.1) (14.3) (3.1) 0.0 Marine sales growth (%) 8.32 (28.6) (7.3) (16.6) (13.4)
Segmental Breakdown FY Dec 2014A 2015A 2016F 2017F 2018F
Revenues (S$m) Aerospace 2,061 2,090 2,384 2,494 2,592 Electronics 1,583 1,709 1,859 1,985 2,119 Land Systems 1,397 1,396 1,197 1,159 1,159 Marine 1,341 958 888 740 641 Others 157 182 164 164 164 Total 6,539 6,335 6,492 6,543 6,676 PBT (S$m) Aerospace 283 291 296 309 320 Electronics 184 191 188 205 220 Land Systems 56.2 65.0 10.1 89.9 81.2 Marine 123 88.3 68.7 53.2 50.1 Others 4.70 (4.6) (11.0) (3.3) 1.64 Total 651 630 552 654 673 PBT Margins (%) Aerospace 13.7 13.9 12.4 12.4 12.3 Electronics 11.6 11.2 10.1 10.3 10.4 Land Systems 4.0 4.7 0.8 7.8 7.0 Marine 9.2 9.2 7.7 7.2 7.8 Others 3.0 (2.5) (6.7) (2.0) 1.0 Total 10.0 9.9 8.5 10.0 10.1
Income Statement (S$m)
FY Dec 2014A 2015A 2016F 2017F 2018F
Revenue 6,539 6,335 6,492 6,543 6,676 Cost of Goods Sold (5,221) (5,053) (5,193) (5,182) (5,274) Gross Profit 1,319 1,282 1,298 1,361 1,402 Other Opng (Exp)/Inc (711) (694) (712) (726) (750) Operating Profit 608 588 586 635 652 Other Non Opg (Exp)/Inc 0.0 0.0 0.0 0.0 0.0 Associates & JV Inc 57.2 58.3 59.5 53.6 54.6 Net Interest (Exp)/Inc (14.3) (16.3) (32.9) (34.3) (34.0) Exceptional Gain/(Loss) 0.0 0.0 (61.1) 0.0 0.0 Pre-tax Profit 651 630 552 654 673 Tax (114) (98.7) (121) (131) (135) Minority Interest (5.0) (2.6) (4.3) (4.2) (4.3) Preference Dividend 0.0 0.0 0.0 0.0 0.0 Net Profit 532 529 426 519 534 Net Profit before Except. 532 529 487 519 534 EBITDA 835 834 837 883 904 Growth Revenue Gth (%) (1.4) (3.1) 2.5 0.8 2.0 EBITDA Gth (%) (6.4) (0.2) 0.3 5.5 2.4 Opg Profit Gth (%) (15.5) (3.2) (0.3) 8.3 2.7 Net Profit Gth (Pre-ex) (%) (8.4) (0.5) (7.9) 6.6 2.8 Margins & Ratio Gross Margins (%) 20.2 20.2 20.0 20.8 21.0 Opg Profit Margin (%) 9.3 9.3 9.0 9.7 9.8 Net Profit Margin (%) 8.1 8.4 6.6 7.9 8.0 ROAE (%) 25.0 24.8 20.2 24.5 24.5 ROA (%) 6.2 6.4 5.2 6.4 6.5 ROCE (%) 10.3 10.6 9.9 11.0 11.1 Div Payout Ratio (%) 87.9 87.9 109.5 89.8 87.4 Net Interest Cover (x) 42.7 36.2 17.8 18.5 19.2
Source: Company, DBS Bank
Boost from Efw acquisition
Marine revenues likely to remain under pressure
Learning curve in Efw P2F programmes
One-off items related to closure of Chinese specialty vehicle subsidiary JHK
Page 55

ASIAN INSIGHTS VICKERS SECURITIES
Company Guide
ST Engineering
Quarterly / Interim Income Statement (S$m)
FY Dec 3Q2015 4Q2015 1Q2016 2Q2016 3Q2016
Revenue 1,500 1,779 1,627 1,623 1,613 Cost of Goods Sold (1,181) (1,441) (1,335) (1,294) (1,279) Gross Profit 319 338 292 330 334 Other Oper. (Exp)/Inc (175) (185) (180) (167) (177) Operating Profit 144 153 112 162 157 Other Non Opg (Exp)/Inc 0.0 0.0 0.0 0.0 0.0 Associates & JV Inc 15.4 17.6 22.6 12.4 13.3 Net Interest (Exp)/Inc (4.6) (3.9) (4.2) (4.6) (3.1) Exceptional Gain/(Loss) 0.0 0.0 0.0 0.0 (61.1) Pre-tax Profit 155 167 130 170 107 Tax (22.3) (23.4) (19.6) (37.3) (34.2) Minority Interest 0.81 (2.3) (0.6) (5.8) 4.21 Net Profit 133 141 110 127 76.7 Net profit bef Except. 133 141 110 127 138 EBITDA 207 221 190 231 236
Growth Revenue Gth (%) (2.9) 18.6 (8.5) (0.2) (0.6) EBITDA Gth (%) (0.6) 6.7 (13.7) 21.4 2.0 Opg Profit Gth (%) (2.8) 6.2 (26.7) 45.0 (3.1) Net Profit Gth (Pre-ex) (%) 6.6 5.7 (21.7) 15.5 8.2 Margins Gross Margins (%) 21.3 19.0 18.0 20.3 20.7 Opg Profit Margins (%) 9.6 8.6 6.9 10.0 9.8 Net Profit Margins (%) 8.9 7.9 6.8 7.8 4.8
Balance Sheet (S$m) FY Dec 2014A 2015A 2016F 2017F 2018F
Net Fixed Assets 1,578 1,709 1,718 1,724 1,726 Invts in Associates & JVs 478 462 491 515 539 Other LT Assets 937 1,208 1,208 1,208 1,208 Cash & ST Invts 1,590 1,134 1,035 1,055 1,079 Inventory 1,802 1,943 1,991 2,007 2,047 Debtors 1,319 1,320 1,298 1,309 1,335 Other Current Assets 615 394 394 394 394 Total Assets 8,319 8,169 8,135 8,210 8,328
ST Debt 74.7 195 195 195 195 Creditor 1,667 1,703 1,623 1,636 1,669 Other Current Liab 1,974 1,822 1,903 1,908 1,921 LT Debt 944 1,019 1,019 1,019 1,019 Other LT Liabilities 1,395 1,170 1,170 1,170 1,170 Shareholder’s Equity 2,132 2,132 2,093 2,146 2,213 Minority Interests 132 129 133 137 142 Total Cap. & Liab. 8,319 8,169 8,135 8,210 8,328
Non-Cash Wkg. Capital 94.8 132 158 166 187 Net Cash/(Debt) 571 (79.3) (179) (159) (135) Debtors Turn (avg days) 70.9 76.0 73.6 72.7 72.3 Creditors Turn (avg days) 118.2 126.4 121.3 119.2 118.8 Inventory Turn (avg days) 130.4 140.5 143.5 146.3 145.8 Asset Turnover (x) 0.8 0.8 0.8 0.8 0.8 Current Ratio (x) 1.4 1.3 1.3 1.3 1.3 Quick Ratio (x) 0.8 0.7 0.6 0.6 0.6 Net Debt/Equity (X) CASH 0.0 0.1 0.1 0.1 Net Debt/Equity ex MI (X) CASH 0.0 0.1 0.1 0.1 Capex to Debt (%) 22.0 22.5 16.5 16.5 16.5 Z-Score (X) 2.5 2.4 2.5 2.5 2.5
Source: Company, DBS Bank
One-off items related to closure of Chinese specialty vehicle subsidiary JHK
Page 56

ASIAN INSIGHTS VICKERS SECURITIES
Company Guide
ST Engineering
Cash Flow Statement (S$m)
FY Dec 2014A 2015A 2016F 2017F 2018F
Pre-Tax Profit 651 630 552 654 673 Dep. & Amort. 171 187 191 194 198 Tax Paid (133) (111) (121) (131) (135) Assoc. & JV Inc/(loss) (57.2) (58.3) (59.5) (53.6) (54.6) Chg in Wkg.Cap. (72.2) (227) (25.8) (8.0) (20.8) Other Operating CF 65.3 44.6 0.0 0.0 0.0 Net Operating CF 624 465 536 656 660 Capital Exp.(net) (224) (273) (200) (200) (200) Other Invts.(net) 79.0 (264) 0.0 0.0 0.0 Invts in Assoc. & JV 5.67 0.27 (5.0) (5.0) (5.0) Div from Assoc & JV 35.0 51.4 35.0 35.0 35.0 Other Investing CF (53.4) 7.98 0.0 0.0 0.0 Net Investing CF (157) (477) (170) (170) (170) Div Paid (499) (498) (465) (467) (467) Chg in Gross Debt (394) 109 0.0 0.0 0.0 Capital Issues 10.7 (75.9) 0.0 0.0 0.0 Other Financing CF (43.8) (55.1) 0.0 0.0 0.0 Net Financing CF (926) (520) (465) (467) (467) Currency Adjustments (0.3) 12.6 0.0 0.0 0.0 Chg in Cash (459) (519) (99.4) 19.6 23.8 Opg CFPS (S cts) 22.3 22.3 18.1 21.4 21.9 Free CFPS (S cts) 12.8 6.20 10.8 14.7 14.8
Source: Company, DBS Bank
Target Price & Ratings History
Source: DBS Bank
Analyst: Suvro SARKAR
Page 57

Industry Focus
ASEAN Aviation
Page 20
DBS Bank recommendations are based an Absolute Total Return* Rating system, defined as follows:
STRONG BUY (>20% total return over the next 3 months, with identifiable share price catalysts within this time frame)
BUY (>15% total return over the next 12 months for small caps, >10% for large caps)
HOLD (-10% to +15% total return over the next 12 months for small caps, -10% to +10% for large caps)
FULLY VALUED (negative total return i.e. > -10% over the next 12 months)
SELL (negative total return of > -20% over the next 3 months, with identifiable catalysts within this time frame)
Share price appreciation + dividends
Completed Date: 10 Feb 2017 07:15:17 (SGT) Dissemination Date: 10 Feb 2017 08:00:04 (SGT)
GENERAL DISCLOSURE/DISCLAIMER
This report is prepared by DBS Bank Ltd. This report is solely intended for the clients of DBS Bank Ltd, DBS Vickers Securities (Singapore) Pte Ltd,
its respective connected and associated corporations and affiliates only and no part of this document may be (i) copied, photocopied or duplicated
in any form or by any means or (ii) redistributed without the prior written consent of DBS Bank Ltd.
The research set out in this report is based on information obtained from sources believed to be reliable, but we (which collectively refers to DBS
Bank Ltd, its respective connected and associated corporations, affiliates and their respective directors, officers, employees and agents (collectively,
the “DBS Group”)) do not make any representation or warranty as to its accuracy, completeness or correctness. Opinions expressed are subject to
change without notice. This document is prepared for general circulation. Any recommendation contained in this document does not have regard
to the specific investment objectives, financial situation and the particular needs of any specific addressee. This document is for the information of
addressees only and is not to be taken in substitution for the exercise of judgement by addressees, who should obtain separate independent legal
or financial advice. The DBS Group accepts no liability whatsoever for any direct, indirect and/or consequential loss (including any claims for loss of
profit) arising from any use of and/or reliance upon this document and/or further communication given in relation to this document. This
document is not to be construed as an offer or a solicitation of an offer to buy or sell any securities. The DBS Group, along with its affiliates and/or
persons associated with any of them may from time to time have interests in the securities mentioned in this document. The DBS Group may have
positions in, and may effect transactions in securities mentioned herein and may also perform or seek to perform broking, investment banking and
other banking services for these companies.
Any valuations, opinions, estimates, forecasts, ratings or risk assessments herein constitutes a judgment as of the date of this report, and there can be no assurance that future results or events will be consistent with any such valuations, opinions, estimates, forecasts, ratings or risk assessments. The information in this document is subject to change without notice, its accuracy is not guaranteed, it may be incomplete or condensed and it may not contain all material information concerning the company (or companies) referred to in this report and the DBS Group is under no obligation to update the information in this report.
This publication has not been reviewed or authorized by any regulatory authority in Singapore, Hong Kong or elsewhere. There is no planned schedule or frequency for updating research publication relating to any issuer.
The valuations, opinions, estimates, forecasts, ratings or risk assessments described in this report were based upon a number of estimates and
assumptions and are inherently subject to significant uncertainties and contingencies. It can be expected that one or more of the estimates on
which the valuations, opinions, estimates, forecasts, ratings or risk assessments were based will not materialize or will vary significantly from actual
results. Therefore, the inclusion of the valuations, opinions, estimates, forecasts, ratings or risk assessments described herein IS NOT TO BE RELIED
UPON as a representation and/or warranty by the DBS Group (and/or any persons associated with the aforesaid entities), that:
(a) such valuations, opinions, estimates, forecasts, ratings or risk assessments or their underlying assumptions will be achieved, and
(b) there is any assurance that future results or events will be consistent with any such valuations, opinions, estimates, forecasts, ratings or risk
assessments stated therein.
Please contact the primary analyst for valuation methodologies and assumptions associated with the covered companies or price targets.
Any assumptions made in this report that refers to commodities, are for the purposes of making forecasts for the company (or companies)
mentioned herein. They are not to be construed as recommendations to trade in the physical commodity or in the futures contract relating to the
commodity referred to in this report.
Page 58
Industry Focus
ASEAN Aviation
Page 21
DBS Vickers Securities (USA) Inc ("DBSVUSA")"), a U.S.-registered broker-dealer, does not have its own investment banking or research
department, has not participated in any public offering of securities as a manager or co-manager or in any other investment banking transaction
in the past twelve months and does not engage in market-making.
ANALYST CERTIFICATION The research analyst(s) primarily responsible for the content of this research report, in part or in whole, certifies that the views about the companies and their securities expressed in this report accurately reflect his/her personal views. The analyst(s) also certifies that no part of his/her compensation was, is, or will be, directly, or indirectly, related to specific recommendations or views expressed in the report. The DBS Group has procedures in place to eliminate, avoid and manage any potential conflicts of interests that may arise in connection with the production of research reports. As of 10 Feb 2017, the analyst(s) and his/her spouse and/or relatives who are financially dependent on the analyst(s), do not hold interests in the securities recommended in this report (“interest” includes direct or indirect ownership of securities). The research analyst(s) responsible for this report operates as part of a separate and independent team to the investment banking function of the DBS Group and procedures are in place to ensure that confidential information held by either the research or investment banking function is handled appropriately.
COMPANY-SPECIFIC / REGULATORY DISCLOSURES
1. DBS Bank Ltd, DBS Vickers Securities (Singapore) Pte Ltd (''DBSVS''), their subsidiaries and/or other affiliates have a proprietary positions in the
Airports of Thailand, SIA Engineering, Singapore Airlines, ST Engineering, Thai Airways recommended in this report as of 30 Dec 2016.
2. DBS Bank Ltd does not market make in equity securities of the issuer(s) or company(ies) mentioned in this Research Report.
Compensation for investment banking services:
3. DBS Bank Ltd., DBSVS, their subsidiaries and/or other affiliates of DBSVUSA have received compensation, within the past 12 months for
investment banking services from Singapore Airlines as of 30 Dec 2016.
4. DBS Bank Ltd., DBSVS, their subsidiaries and/or other affiliates of DBSVUSA, within the next 3 months, will receive or intend to seek
compensation for investment banking services from Singapore Airlines as of 30 Dec 2016.
5. DBS Bank Ltd., DBSVS, their subsidiaries and/or other affiliates of DBSVUSA have managed or co-managed a public offering of securities for
Singapore Airlines as of 30 Dec 2016.
6. DBSVUSA does not have its own investment banking or research department, nor has it participated in any public offering of securities as a
manager or co-manager or in any other investment banking transaction in the past twelve months. Any US persons wishing to obtain further
information, including any clarification on disclosures in this disclaimer, or to effect a transaction in any security discussed in this document
should contact DBSVUSA exclusively.
Directorship/trustee interests
7. Peter Seah Lim Huat, Chairman & Director of DBS Group Holdings, is a Director / Chairman of Singapore Airlines as of 1 Jan 2017.
Lim Sim Seng, a member of DBS Group Executive Committee, is an Independent Non-Executive Director of ST Engineering as of 1 Feb 2017
Disclosure of previous investment recommendation produced:
8. DBS Bank Ltd, DBS Vickers Securities (Singapore) Pte Ltd (''DBSVS''), their subsidiaries and/or other affiliates may have published other
investment recommendations in respect of the same securities / instruments recommended in this research report during the preceding 12
months. Please contact the primary analyst listed in the first page of this report to view previous investment recommendations published by
DBS Bank Ltd, DBS Vickers Securities (Singapore) Pte Ltd (''DBSVS''), their subsidiaries and/or other affiliates in the preceding 12 months.
RESTRICTIONS ON DISTRIBUTION
General This report is not directed to, or intended for distribution to or use by, any person or entity who is a citizen or resident of or located in any locality, state, country or other jurisdiction where such distribution, publication, availability or use would be contrary to law or regulation.
Australia This report is being distributed in Australia by DBS Bank Ltd. (“DBS”) or DBS Vickers Securities (Singapore) Pte Ltd (“DBSVS”), both of which are exempted from the requirement to hold an Australian Financial Services Licence under the Corporation Act 2001 (“CA”) in respect of financial services provided to the recipients. Both DBS and DBSVS are regulated by the Monetary Authority of Singapore under the laws of Singapore, which differ from Australian laws. Distribution of this report is intended only for “wholesale investors” within the meaning of the CA.
Page 59

Industry Focus
ASEAN Aviation
Page 22
Hong Kong This report is being distributed in Hong Kong by or on behalf of, and is attributable to DBS Vickers (Hong Kong) Limited which is licensed and regulated by the Hong Kong Securities and Futures Commission and/or by DBS Bank (Hong Kong) Limited which is regulated by the Hong Kong Monetary Authority and the Securities and Futures Commission. Where this publication relates to a research report, unless otherwise stated in the research report(s), DBS Bank (Hong Kong) Limited is not the issuer of the research report(s). This publication including any research report(s) is/are distributed on the express understanding that, whilst the information contained within is believed to be reliable, the information has not been independently verified by DBS Bank (Hong Kong) Limited. This report is intended for distribution in Hong Kong only to professional investors (as defined in the Securities and Futures Ordinance (Chapter 571 of the Laws of Hong Kong) and any rules promulgated thereunder.) For any query regarding the materials herein, please contact Paul Yong (CE. No. ASE988) at [email protected].
Indonesia This report is being distributed in Indonesia by PT DBS Vickers Sekuritas Indonesia.
Malaysia This report is distributed in Malaysia by AllianceDBS Research Sdn Bhd ("ADBSR"). Recipients of this report, received from ADBSR are to contact the undersigned at 603-2604 3333 in respect of any matters arising from or in connection with this report. In addition to the General Disclosure/Disclaimer found at the preceding page, recipients of this report are advised that ADBSR (the preparer of this report), its holding company Alliance Investment Bank Berhad, their respective connected and associated corporations, affiliates, their directors, officers, employees, agents and parties related or associated with any of them may have positions in, and may effect transactions in the securities mentioned herein and may also perform or seek to perform broking, investment banking/corporate advisory and other services for the subject companies. They may also have received compensation and/or seek to obtain compensation for broking, investment banking/corporate advisory and other services from the subject companies.
Wong Ming Tek, Executive Director, ADBSR
Singapore This report is distributed in Singapore by DBS Bank Ltd (Company Regn. No. 196800306E) or DBSVS (Company Regn No. 198600294G), both of which are Exempt Financial Advisers as defined in the Financial Advisers Act and regulated by the Monetary Authority of Singapore. DBS Bank Ltd and/or DBSVS, may distribute reports produced by its respective foreign entities, affiliates or other foreign research houses pursuant to an arrangement under Regulation 32C of the Financial Advisers Regulations. Where the report is distributed in Singapore to a person who is not an Accredited Investor, Expert Investor or an Institutional Investor, DBS Bank Ltd accepts legal responsibility for the contents of the report to such persons only to the extent required by law. Singapore recipients should contact DBS Bank Ltd at 6327 2288 for matters arising from, or in connection with the report.
Thailand This report is being distributed in Thailand by DBS Vickers Securities (Thailand) Co Ltd. Research reports distributed are only intended for institutional clients only and no other person may act upon it.
United Kingdom This report is produced by DBS Bank Ltd which is regulated by the Monetary Authority of Singapore. This report is disseminated in the United Kingdom by DBS Vickers Securities (UK) Ltd, ("DBSVUK"). DBSVUK is authorised and regulated by the Financial Conduct Authority in the United Kingdom. In respect of the United Kingdom, this report is solely intended for the clients of DBSVUK, its respective connected and associated corporations and affiliates only and no part of this document may be (i) copied, photocopied or duplicated in any form or by any means or (ii) redistributed without the prior written consent of DBSVUK. This communication is directed at persons having professional experience in matters relating to investments. Any investment activity following from this communication will only be engaged in with such persons. Persons who do not have professional experience in matters relating to investments should not rely on this communication.
Dubai
This research report is being distributed in The Dubai International Financial Centre (“DIFC”) by DBS Bank Ltd., (DIFC Branch) having its office at PO Box 506538, 3rd Floor, Building 3, East Wing, Gate Precinct, Dubai International Financial Centre (DIFC), Dubai, United Arab Emirates. DBS Bank Ltd., (DIFC Branch) is regulated by The Dubai Financial Services Authority. This research report is intended only for professional clients (as defined in the DFSA rulebook) and no other person may act upon it.
Page 60

Industry Focus
ASEAN Aviation
Page 23
United States This report was prepared by DBS Bank Ltd. DBSVUSA did not participate in its preparation. The research analyst(s) named on this report are not registered as research analysts with FINRA and are not associated persons of DBSVUSA. The research analyst(s) are not subject to FINRA Rule 2241 restrictions on analyst compensation, communications with a subject company, public appearances and trading securities held by a research analyst. This report is being distributed in the United States by DBSVUSA, which accepts responsibility for its contents. This report may only be distributed to Major U.S. Institutional Investors (as defined in SEC Rule 15a-6) and to such other institutional investors and qualified persons as DBSVUSA may authorize. Any U.S. person receiving this report who wishes to effect transactions in any securities referred to herein should contact DBSVUSA directly and not its affiliate.
Other jurisdictions In any other jurisdictions, except if otherwise restricted by laws or regulations, this report is intended only for qualified, professional, institutional or sophisticated investors as defined in the laws and regulations of such jurisdictions.
DBS Bank Ltd
12 Marina Boulevard, Marina Bay Financial Centre Tower 3 Singapore 018982 Tel. 65-6878 8888
e-mail: [email protected] Company Regn. No. 196800306E
Page 61