Embed Size (px)
Citation preview
A C I FA C I FASEAN COMMUNITY IN FIGURES
ASSOCIATION OF SOUTHEAST ASIAN NATIONS
2 0 0 9

A C I FA C I FASEAN COMMUNITY IN FIGURES
ASSOCIATION OF SOUTHEAST ASIAN NATIONS
2 0 0 9
The Association of Southeast Asian Nations (ASEAN) was established on8 August 1967. The Member States of the Association are Brunei Darussalam,Cambodia, Indonesia, Lao PDR, Malaysia, Myanmar, Philippines, Singapore,Thailand and Viet Nam. The ASEAN Secretariat is based in Jakarta, Indonesia.
For inquiries, contact:The ASEAN SecretariatPublic Outreach and Civil Society Division70A Jalan SisingamangarajaJakarta 12110IndonesiaPhone : (62 21) 724-3372, 726-2991Fax : (62 21) 739-8234, 724-3504E-mail : [email protected]
General information on ASEAN appears online atthe ASEAN Website: www.asean.org
Catalogue-in-Publication Data
ASEAN Community in Figures – ACIF 2009Jakarta: ASEAN Secretariat, February 2010
viii, 61 p. ; 15 cm
315.951. Statistics – ASEAN2. Economy – Social – Environment
ISBN 978-602-8411-21-9
The text of this publication may be freely quoted or reprinted with properacknowledgement.
Copyright © ASEAN Secretariat 2010All rights reserved
ASEAN Community in Figures (ACIF) 2009 is the second in a series of periodicstatistical updates about the economies, peoples and societies of ASEANMember States and, where applicable, of the ASEAN region as a whole. Thispublication features statistical information on key characteristics and trends inASEAN’s general economy, trade, investment, tourism, population, labour force,health, education and poverty.
Intended to be issued between the annual releases of the ASEAN StatisticalYearbook, the ACIF includes updates on selected indicators in the Yearbook.
The ACIF is purposely designed to be a handy publication, and hence presentsonly a selection of the most-sought-after or referred-to indicators for the last fewyears. For users’ convenience it also provides short descriptions of keydevelopments, as appropriate.
We appreciate and value your comments and suggestions in the improvement ofthis publication and of our other statistical products and services. Please contactASEANstats at [email protected] if you have any feedback.
Dr. Surin PitsuwanSecretary-General of ASEAN
September 2009
FOREWORD

01 ASEAN and the worldTable 1 ASEAN population, territory and economy, 2008Table 2 ASEAN population and economy compared with those of
selected trading partner countries/regions, 2008Table 3 Trends of per capita GDP in ASEAN and selected trading
partner countries/regionsTable 4 ASEAN GDP, rate of growth, and share of CLMVTable 5 CPI and its selected components in ASEAN6, 2003-2008Table 6 Inflation rate (year-on-year change of the Consumer Price
Index), end period (in percent)Table 7 Lending rates in ASEAN (in percent)Table 8 Exchange rates in ASEAN (in national currency per US$ 1),
average of period
02 ASEAN trade aggregatesTable 9 Share of international trade to overall ASEAN economyTable 10 ASEAN Balance of trade with selected trading partner countriesTable 11 Trade by ASEAN Member StatesTable 12 Export and Import by ASEAN Member StatesTable 13 Trade Balance by ASEAN Member States
03 ASEAN trade dependency
Table 14 Trade value by selected trade partner countries, rankedaccording to the 2008 levels (US$ million)
Table 15 ASEAN Trade with selected partner countries, ranked accordingto the 2008 shares (in percent)
Table 16 ASEAN Member States Export to ASEAN+3, 2008Table 17 ASEAN Member States Import from ASEAN+3, 2008Table 18 ASEAN Member States Trade with ASEAN+3, 2008Table 19 ASEAN Member States Export to Other Selected Trade Partner
Countries, 2008Table 20 ASEAN Member States Import from Other Selected Trade
Partner Countries, 2008Table 21 ASEAN Member States Trade with Other Selected Trade
Partner Countries, 2008Table 22 Share of ASEAN Member States Export by Selected Trade
Partner, 2008, (in percent)Table 23 Share of ASEAN Member States Import by Selected Trade
Partner, 2008, (in percent)
TABLE OF CONTENTS Page
12
3
456
78
910111213
14
15
16171819
20
21
22
23
Table 24 Share of ASEAN Member States Trade by Selected TradePartner, 2008, (in percent)
Table 25 Top 20 ASEAN exported commodities (based on 4-digitHarmonised System codes), 2008
Table 26 Top 20 ASEAN imported commodities (based on 4-digitHarmonised System codes), 2008
Table 27 Commodities with high-significant share in ASEAN trade, 2008
04 ASEAN trade liberalisationChart 1 Average tariff rates on imports from ASEANChart 2 Percent of tariff lines in the CEPT* Inclusion List (IL)Chart 3 Percent of items in the CEPT* Inclusion List (IL) with 0 tariff
05 ASEAN trade in priority integration sectorsTable 28 Trend of ASEAN exports of its seven priority integration sector’s
productsTable 29 Trend of intra-ASEAN export of its seven priority integration
sector’s products
06 ASEAN foreign direct investmentTable 30 Trend of foreign direct investment (FDI) inflows in ASEANTable 31 Trend of FDI inflow in ASEAN by host country (in US$ million)Table 32 Trend of FDI inflow by source country (US$ million)
07 ASEAN tourismTable 33 Trend in tourist arrivals by host country (in thousand)Table 34 Rate of growth of tourist arrivals in ASEAN (in percent)Table 35 Tourist arrivals by country of origin, sorted by the 2008 shares
08 ASEAN telecommunicationsTable 36 ASEAN internet subscribers/users per 1000 personsChart 4 Internet subscribers/users per 1000 PersonsTable 37 Cellular/mobile phone density (number of units per 1000
persons)Chart 5 Cellular/mobile phone density (per 1000 persons)
24
25
26
27
303132
33
34
353637
383940
414243
44
Page
09 ASEAN social developmentTable 38 Distribution of ASEAN Population by Age Group, 2008Table 39 Population living under PPP $1 and $2 a day (in percent)Table 40 Poor population based on National Poverty Line (in percent)Table 41 Gini coefficient in ASEAN Member States (in percent)Table 42 Life expectancy at birth (years)Table 43 Infant mortality rate (per 1000 live births)Table 44 Government health expenditure as percentage of GDP
(in percent)Table 45 Children less than 5 years old underweight for age (in percent)Table 46 Adult literacy rate 15 years old and above (in percent)Table 47 Net primary enrolment rate (in percent)Table 48 Unemployment rate by gender (in percent)Table 49 Labour force participation rate by gender (in percent)Table 50 Employment by sector (in percent)Table 51 Employment by Occupation (in percent)Table 52 Population with access to safe drinking water (in percent)Table 53 Population with access to sanitation facilities (in percent)Table 54 Ratio of protected area to total area (in percent)
45464748495051
52535455565758596061
Page

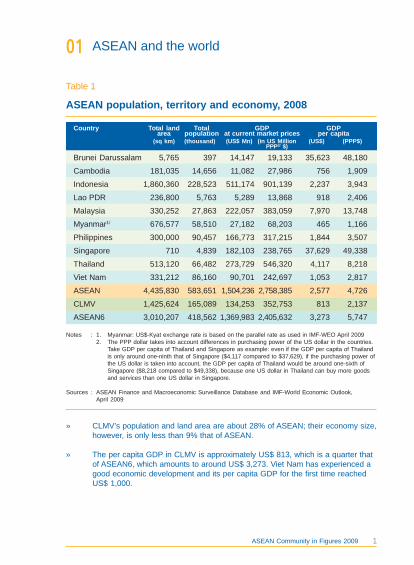
Brunei Darussalam 5,765 397 14,147 19,133 35,623 48,180
Cambodia 181,035 14,656 11,082 27,986 756 1,909
Indonesia 1,860,360 228,523 511,174 901,139 2,237 3,943
Lao PDR 236,800 5,763 5,289 13,868 918 2,406
Malaysia 330,252 27,863 222,057 383,059 7,970 13,748
Myanmar1/ 676,577 58,510 27,182 68,203 465 1,166
Philippines 300,000 90,457 166,773 317,215 1,844 3,507
Singapore 710 4,839 182,103 238,765 37,629 49,338
Thailand 513,120 66,482 273,729 546,320 4,117 8,218
Viet Nam 331,212 86,160 90,701 242,697 1,053 2,817
ASEAN 4,435,830 583,651 1,504,236 2,758,385 2,577 4,726
CLMV 1,425,624 165,089 134,253 352,753 813 2,137
ASEAN6 3,010,207 418,562 1,369,983 2,405,632 3,273 5,747
ASEAN and the world01
ASEAN population, territory and economy, 2008
Table 1
Country Total land Total GDP GDParea population at current market prices per capita
(sq km) (thousand) (US$ Mn) (in US Million (US$) (PPP$)PPP2/ $)
Notes : 1. Myanmar: US$-Kyat exchange rate is based on the parallel rate as used in IMF-WEO April 20092. The PPP dollar takes into account differences in purchasing power of the US dollar in the countries.
Take GDP per capita of Thailand and Singapore as example: even if the GDP per capita of Thailandis only around one-ninth that of Singapore ($4,117 compared to $37,629), if the purchasing power ofthe US dollar is taken into account, the GDP per capita of Thailand would be around one-sixth ofSingapore ($8,218 compared to $49,338), because one US dollar in Thailand can buy more goodsand services than one US dollar in Singapore.
Sources : ASEAN Finance and Macroeconomic Surveillance Database and IMF-World Economic Outlook,April 2009
» CLMV’s population and land area are about 28% of ASEAN; their economy size,however, is only less than 9% that of ASEAN.
» The per capita GDP in CLMV is approximately US$ 813, which is a quarter thatof ASEAN6, which amounts to around US$ 3,273. Viet Nam has experienced agood economic development and its per capita GDP for the first time reachedUS$ 1,000.
1ASEAN Community in Figures 2009
ASEAN and the world01
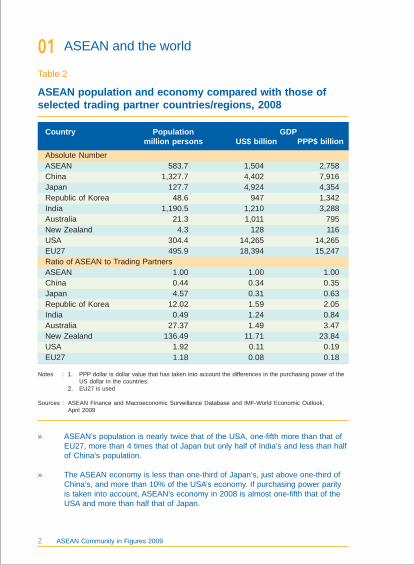
ASEAN population and economy compared with those ofselected trading partner countries/regions, 2008
Table 2
Country Population GDPmillion persons US$ billion PPP$ billion
Notes : 1. PPP dollar is dollar value that has taken into account the differences in the purchasing power of theUS dollar in the countries.
2. EU27 is used
Sources : ASEAN Finance and Macroeconomic Surveillance Database and IMF-World Economic Outlook,April 2009
» ASEAN’s population is nearly twice that of the USA, one-fifth more than that ofEU27, more than 4 times that of Japan but only half of India’s and less than halfof China’s population.
» The ASEAN economy is less than one-third of Japan’s, just above one-third ofChina’s, and more than 10% of the USA’s economy. If purchasing power parityis taken into account, ASEAN’s economy in 2008 is almost one-fifth that of theUSA and more than half that of Japan.
Absolute NumberASEAN 583.7 1,504 2,758China 1,327.7 4,402 7,916Japan 127.7 4,924 4,354Republic of Korea 48.6 947 1,342India 1,190.5 1,210 3,288Australia 21.3 1,011 795New Zealand 4.3 128 116USA 304.4 14,265 14,265EU27 495.9 18,394 15,247Ratio of ASEAN to Trading PartnersASEAN 1.00 1.00 1.00China 0.44 0.34 0.35Japan 4.57 0.31 0.63Republic of Korea 12.02 1.59 2.05India 0.49 1.24 0.84Australia 27.37 1.49 3.47New Zealand 136.49 11.71 23.84USA 1.92 0.11 0.19EU27 1.18 0.08 0.18
2 ASEAN Community in Figures 2009

In US $ASEAN 960 1,159 1,327 1,895 2,249 2,577 2.69
China 817 946 1,270 2,022 2,560 3,315 4.06
Japan 30,645 36,811 33,180 34,159 34,318 38,559 1.26
Republic of Korea 7,848 11,353 13,455 19,712 21,655 19,505 2.49
India 406 440 519 757 940 1,016 2.50
Australia 19,904 20,324 26,485 36,413 43,199 47,400 2.38
New Zealand 14,384 13,557 19,765 25,279 30,432 30,049 2.09
USA 31,689 34,776 37,715 44,119 45,778 46,859 1.48
EU27 19,083 17,672 23,528 29,816 34,259 37,091 1.94
In PPP International DollarASEAN 2,749 3,134 3,613 4,510 4,895 4,726 1.72
China 1,993 2,372 3,217 4,658 5,378 5,963 2.99
Japan 23,828 25,274 27,222 31,932 33,573 34,100 1.43
Republic of Korea 13,574 16,456 19,697 24,654 26,523 27,647 2.04
India 1,279 1,446 1,700 2,312 2,557 2,762 2.16
Australia 24,531 26,819 30,111 34,424 36,215 37,299 1.52
New Zealand 17,415 19,333 22,072 25,427 26,664 27,060 1.55
USA 31,689 34,776 37,715 44,119 45,778 46,859 1.48
EU27 21,816 24,063 26,323 30,421 31,924 32,708 1.50
Note : EU refers to EU27
Sources : ASEAN Finance and Macroeconomic Surveillance Database and IMF-World Economic Outlook,April 2009
ASEAN and the world01
Trends of per capita GDP in ASEAN and selected tradingpartner countries/regions
Table 3
RatioCountry/Region 1998 2000 2003 2006 2007 2008 2008/
1998
» Following a sharp decline in 1998 due to the Asian financial crisis, the averageGDP per capita of ASEAN Member States had increased from US$ 960 in 1998to US$ 2,577 in 2008.
3ASEAN Community in Figures 2009

ASEAN and the world01
ASEAN GDP, rate of growth, and share of CLMV
Table 4
Countries 1998 2000 2003 2006 2007 2008
» CLMV economies in general have grown faster than ASEAN6 countries. Theircollective share to ASEAN GDP has increased from less than 6% in 1998 toaround 8% in 2007.
» CLMV were less affected by the 1997 Asian financial crisis, managing to growby 5.7% in 1998 when ASEAN6 contracted by 8.8%, and grew faster in 2008 by6.0% as compared to 4.2%.
Notes : GDP growth is based on GDP at constant prices; ASEAN, ASEAN6 and CLMV figures are estimatedweighted average using the share of PPP$ GDP to world total as used in the IMF WEO Database ofApril 2009.
Sources : ASEAN Finance and Macroeconomic Surveillance Database and IMF-World Economic Outlook,April 2009
GDP at current prices (US $million)ASEAN 480,472 598,623 718,393 1,074,377 1,292,573 1,504,236CLMV 38,029 46,291 58,051 84,933 102,861 134,253ASEAN6 442,443 552,332 660,342 989,444 1,189,712 1,369,983GDP share (%)ASEAN 100.0 100.0 100.0 100.0 100.0 100.0CLMV 7.9 7.7 8.1 7.9 8.0 8.9ASEAN6 92.1 92.3 91.9 92.1 92.0 91.1Annual rate of growth of ASEAN GDP (%)Brunei Darussalam -0.6 2.9 2.9 4.4 0.6 0.4Cambodia 5.0 8.4 12.6 10.8 10.2 6.0Indonesia -13.1 5.4 4.8 5.5 6.3 6.1Lao PDR 4.0 5.8 5.8 8.3 6.0 8.4Malaysia -7.4 8.9 5.8 5.8 6.3 4.6Myanmar 5.8 13.7 5.1 6.9 5.6 4.5Philippines -0.6 4.4 3.7 5.3 7.4 3.6Singapore -1.4 0.1 3.1 7.9 10.1 1.1Thailand -10.5 4.8 7.1 5.2 4.9 2.6Viet Nam 5.8 6.8 7.4 8.2 8.5 6.3ASEAN -7.4 6.3 5.4 6.0 6.6 4.4CLMV 5.7 7.9 7.3 8.1 8.0 6.0ASEAN6 -8.8 6.1 4.8 5.7 6.5 4.2
4 ASEAN Community in Figures 2009
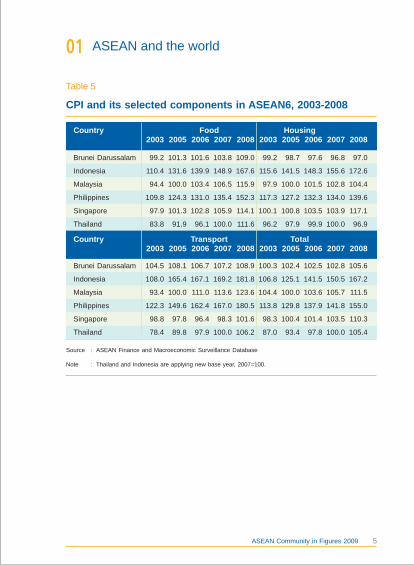
Brunei Darussalam 99.2 101.3 101.6 103.8 109.0 99.2 98.7 97.6 96.8 97.0
Indonesia 110.4 131.6 139.9 148.9 167.6 115.6 141.5 148.3 155.6 172.6
Malaysia 94.4 100.0 103.4 106.5 115.9 97.9 100.0 101.5 102.8 104.4
Philippines 109.8 124.3 131.0 135.4 152.3 117.3 127.2 132.3 134.0 139.6
Singapore 97.9 101.3 102.8 105.9 114.1 100.1 100.8 103.5 103.9 117.1
Thailand 83.8 91.9 96.1 100.0 111.6 96.2 97.9 99.9 100.0 96.9
Country Food Housing2003 2005 2006 2007 2008 2003 2005 2006 2007 2008
Country Transport Total2003 2005 2006 2007 2008 2003 2005 2006 2007 2008
ASEAN and the world01
CPI and its selected components in ASEAN6, 2003-2008
Table 5
Brunei Darussalam 104.5 108.1 106.7 107.2 108.9 100.3 102.4 102.5 102.8 105.6
Indonesia 108.0 165.4 167.1 169.2 181.8 106.8 125.1 141.5 150.5 167.2
Malaysia 93.4 100.0 111.0 113.6 123.6 104.4 100.0 103.6 105.7 111.5
Philippines 122.3 149.6 162.4 167.0 180.5 113.8 129.8 137.9 141.8 155.0
Singapore 98.8 97.8 96.4 98.3 101.6 98.3 100.4 101.4 103.5 110.3
Thailand 78.4 89.8 97.9 100.0 106.2 87.0 93.4 97.8 100.0 105.4
Source : ASEAN Finance and Macroeconomic Surveillance Database
Note : Thailand and Indonesia are applying new base year, 2007=100.
5ASEAN Community in Figures 2009

Brunei Darussalam -0.7 1.6 2.0 0.7 -0.7 1.3 2.6
Cambodia 11.1 0.3 0.3 6.7 2.8 10.8 7.5
Indonesia 77.5 9.3 5.2 17.1 6.6 6.6 11.1
Lao PDR 142.4 10.6 15.2 8.8 -3.7 5.5 8.5
Malaysia 5.4 2.1 1.2 -5.3 3.1 2.4 4.4
Myanmar - - - - - - -
Philippines 10.0 6.5 3.9 6.7 4.3 3.9 8.0
Singapore -1.4 2.1 0.7 1.3 0.8 4.4 4.9
Thailand 4.3 1.4 1.8 5.8 3.5 3.2 0.4
Viet Nam 8.6 -0.6 2.9 8.9 6.6 12.6 19.9
ASEAN and the world01
Inflation rate (year-on-year change of the Consumer PriceIndex), end period (in percent)
Table 6
Country 1998 2000 2003 2005 2006 2007 2008
Source : ASEAN Finance and Macroeconomic Surveillance Database.
6 ASEAN Community in Figures 2009
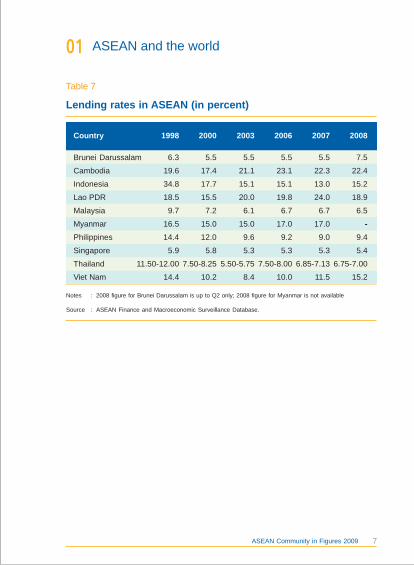
Brunei Darussalam 6.3 5.5 5.5 5.5 5.5 7.5
Cambodia 19.6 17.4 21.1 23.1 22.3 22.4
Indonesia 34.8 17.7 15.1 15.1 13.0 15.2
Lao PDR 18.5 15.5 20.0 19.8 24.0 18.9
Malaysia 9.7 7.2 6.1 6.7 6.7 6.5
Myanmar 16.5 15.0 15.0 17.0 17.0 -Philippines 14.4 12.0 9.6 9.2 9.0 9.4
Singapore 5.9 5.8 5.3 5.3 5.3 5.4
Thailand 11.50-12.00 7.50-8.25 5.50-5.75 7.50-8.00 6.85-7.13 6.75-7.00
Viet Nam 14.4 10.2 8.4 10.0 11.5 15.2
Notes : 2008 figure for Brunei Darussalam is up to Q2 only; 2008 figure for Myanmar is not available
Source : ASEAN Finance and Macroeconomic Surveillance Database.
ASEAN and the world01
Lending rates in ASEAN (in percent)
Table 7
Country 1998 2000 2003 2006 2007 2008
7ASEAN Community in Figures 2009

Brunei Darussalam 1.7 1.7 1.7 1.6 1.5 1.4
Cambodia 3,836 3,894 4,001 4,113 4,080 4,088
Indonesia 10,014 8,422 8,575 9,168 9,164 9,757
Lao PDR 3,298 7,888 10,554 10,054 9,567 8,643
Malaysia 3.9 3.8 3.8 3.7 3.4 3.3
Myanmar 249 287 737 1,162 1,156 1,103
Philippines 40.9 44.2 54.2 51.3 45.7 44.5
Singapore 1.7 1.7 1.7 1.6 1.5 1.4
Thailand 41.3 40.1 41.5 37.9 34.5 33.3
Viet Nam 13,268 14,168 15,509 15,963 16,121 16,303
ASEAN and the world01
Exchange rates in ASEAN (in national currency per US$ 1),average of period
Table 8
Source : ASEAN Finance and Macroeconomic Surveillance Database.
Country 1998 2000 2003 2006 2007 2008
8 ASEAN Community in Figures 2009
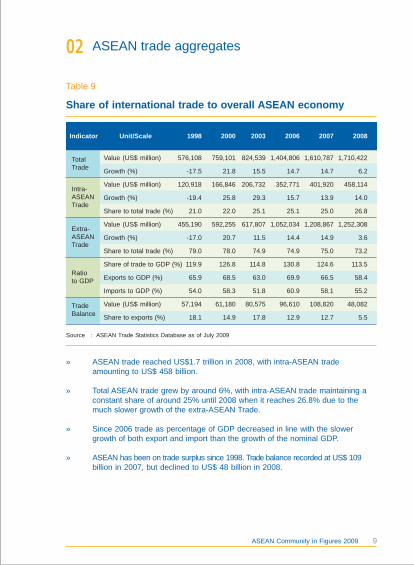
Value (US$ million) 576,108 759,101 824,539 1,404,806 1,610,787 1,710,422
Growth (%) -17.5 21.8 15.5 14.7 14.7 6.2
Value (US$ million) 120,918 166,846 206,732 352,771 401,920 458,114
Growth (%) -19.4 25.8 29.3 15.7 13.9 14.0
Share to total trade (%) 21.0 22.0 25.1 25.1 25.0 26.8
Value (US$ million) 455,190 592,255 617,807 1,052,034 1,208,867 1,252,308
Growth (%) -17.0 20.7 11.5 14.4 14.9 3.6
Share to total trade (%) 79.0 78.0 74.9 74.9 75.0 73.2
Share of trade to GDP (%) 119.9 126.8 114.8 130.8 124.6 113.5
Exports to GDP (%) 65.9 68.5 63.0 69.9 66.5 58.4
Imports to GDP (%) 54.0 58.3 51.8 60.9 58.1 55.2
Value (US$ million) 57,194 61,180 80,575 96,610 108,820 48,082
Share to exports (%) 18.1 14.9 17.8 12.9 12.7 5.5
ASEAN trade aggregates02
Share of international trade to overall ASEAN economy
Table 9
Source : ASEAN Trade Statistics Database as of July 2009
» ASEAN trade reached US$1.7 trillion in 2008, with intra-ASEAN tradeamounting to US$ 458 billion.
» Total ASEAN trade grew by around 6%, with intra-ASEAN trade maintaining aconstant share of around 25% until 2008 when it reaches 26.8% due to themuch slower growth of the extra-ASEAN Trade.
» Since 2006 trade as percentage of GDP decreased in line with the slowergrowth of both export and import than the growth of the nominal GDP.
» ASEAN has been on trade surplus since 1998. Trade balance recorded at US$ 109billion in 2007, but declined to US$ 48 billion in 2008.
Indicator Unit/Scale 1998 2000 2003 2006 2007 2008
TotalTrade
Intra-ASEANTrade
Extra-ASEANTrade
Ratioto GDP
TradeBalance
9ASEAN Community in Figures 2009
Value (US$ million) -11,977 -15,071 -7,005 789 -2,786 -2,192Share to exports (%) -34.5 -29.8 -13.2 1.0 -3.3 -2.1Value (US$ million) 13,678 25,322 21,463 32,691 33,684 21,218Share to exports (%) 21.2 34.3 30.8 33.7 31.7 21.0Value (US$ million) 14,160 24,103 18,869 28,354 29,264 23,415Share to exports (%) 29.1 38.0 31.4 30.0 27.1 20.7Value (US$ million) -2,009 -3,958 -1,517 -9,941 -15,228 -21,557Share to exports (%) -21.8 -27.9 -5.2 -15.3 -19.5 -25.2Value (US$ million) -1,454 -727 335 -1,180 -2,211 -5,603Share to exports (%) -18.6 -5.0 2.0 -4.6 -7.5 -16.0Value (US$ million) 1,418 198 4,727 9,886 12,904 15,773Share to exports (%) 19.9 2.2 39.5 42.7 47.0 46.8Value (US$ million) 3,467 3,237 4,393 9,153 12,445 12,707Share to exports (%) 66.5 50.2 52.0 48.4 50.1 42.2Value (US$ million) 548 581 890 946 1,051 288Share to exports (%) 23.7 21.5 32.4 24.2 19.9 5.3Value (US$ million) -106 179 320 1,487 1,308 898Share to exports (%) -14.0 14.7 21.7 49.3 36.8 21.6Value (US$ million) -90 -722 -588 -1,258 -1,245 -4,206Share to exports (%) -19.1 -220.8 -65.0 -79.5 -60.0 -155.4Value (US$ million) 1,055 2,907 1,421 2,690 3,441 3,929Share to exports (%) 81.9 90.8 85.5 90.1 91.0 89.6
ASEAN trade aggregates02
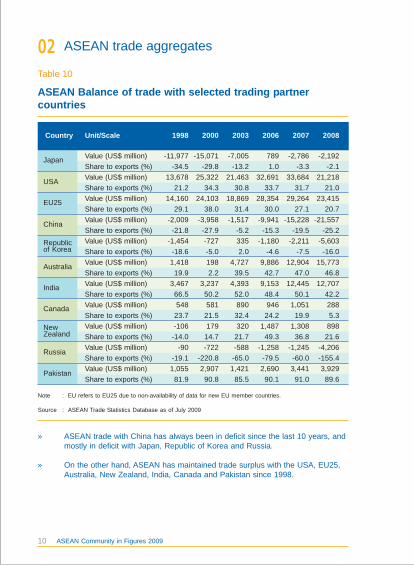
ASEAN Balance of trade with selected trading partnercountries
Table 10
Note : EU refers to EU25 due to non-availability of data for new EU member countries.
Source : ASEAN Trade Statistics Database as of July 2009
» ASEAN trade with China has always been in deficit since the last 10 years, andmostly in deficit with Japan, Republic of Korea and Russia.
» On the other hand, ASEAN has maintained trade surplus with the USA, EU25,Australia, New Zealand, India, Canada and Pakistan since 1998.
Country Unit/Scale 1998 2000 2003 2006 2007 2008
Japan
USA
EU25
China
Republicof Korea
Australia
India
Canada
NewZealand
Russia
Pakistan
10 ASEAN Community in Figures 2009
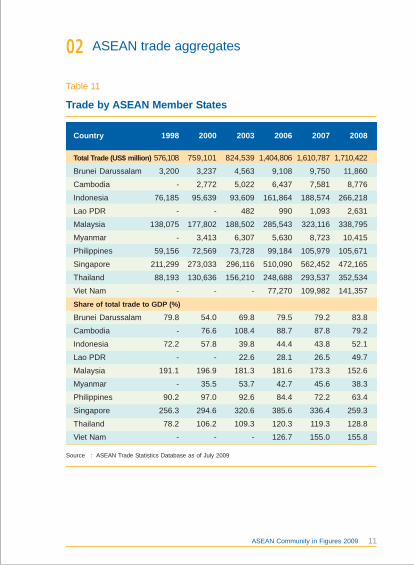
Total Trade (US$ million) 576,108 759,101 824,539 1,404,806 1,610,787 1,710,422
Brunei Darussalam 3,200 3,237 4,563 9,108 9,750 11,860
Cambodia - 2,772 5,022 6,437 7,581 8,776
Indonesia 76,185 95,639 93,609 161,864 188,574 266,218
Lao PDR - - 482 990 1,093 2,631
Malaysia 138,075 177,802 188,502 285,543 323,116 338,795
Myanmar - 3,413 6,307 5,630 8,723 10,415
Philippines 59,156 72,569 73,728 99,184 105,979 105,671
Singapore 211,299 273,033 296,116 510,090 562,452 472,165
Thailand 88,193 130,636 156,210 248,688 293,537 352,534
Viet Nam - - - 77,270 109,982 141,357
Share of total trade to GDP (%)
Brunei Darussalam 79.8 54.0 69.8 79.5 79.2 83.8
Cambodia - 76.6 108.4 88.7 87.8 79.2
Indonesia 72.2 57.8 39.8 44.4 43.8 52.1
Lao PDR - - 22.6 28.1 26.5 49.7
Malaysia 191.1 196.9 181.3 181.6 173.3 152.6
Myanmar - 35.5 53.7 42.7 45.6 38.3
Philippines 90.2 97.0 92.6 84.4 72.2 63.4
Singapore 256.3 294.6 320.6 385.6 336.4 259.3
Thailand 78.2 106.2 109.3 120.3 119.3 128.8
Viet Nam - - - 126.7 155.0 155.8
ASEAN trade aggregates02
Trade by ASEAN Member States
Table 11
Country 1998 2000 2003 2006 2007 2008
Source : ASEAN Trade Statistics Database as of July 2009
11ASEAN Community in Figures 2009

Export (US$ million) 316,651 410,141 452,557 750,708 859,804 879,252
Brunei Darussalam 1,924 2,169 3,211 7,619 7,653 8,754
Cambodia - 1,368 2,116 3,514 3,906 4,359
Indonesia 48,848 62,124 61,058 100,799 114,101 137,020
Lao PDR - - 144 403 382 828
Malaysia 77,099 98,154 104,983 157,227 176,206 194,496
Myanmar - 1,194 4,464 3,515 5,933 6,621
Philippines 29,496 38,078 36,231 47,410 50,466 49,025
Singapore 109,803 138,352 159,900 271,608 299,297 241,405
Thailand 49,482 68,701 80,450 121,579 153,571 174,967
Viet Nam - - - 37,034 48,289 61,778
Import (US$ million) 259,457 348,960 371,982 654,098 750,984 831,170
Brunei Darussalam 1,276 1,068 1,352 1,489 2,097 3,106
Cambodia - 1,405 2,906 2,923 3,675 4,417
Indonesia 27,337 33,515 32,551 61,065 74,473 129,197
Lao PDR - - 338 588 711 1,803
Malaysia 60,976 79,647 83,519 128,316 146,910 144,299
Myanmar - 2,219 1,843 2,115 2,789 3,795
Philippines 29,660 34,491 37,497 51,774 55,514 56,646
Singapore 101,496 134,680 136,216 238,482 263,155 230,760
Thailand 38,712 61,935 75,759 127,109 139,966 177,568
Viet Nam - - - 40,237 61,694 79,579
ASEAN trade aggregates02
Export and Import by ASEAN Member States
Table 12
Source : ASEAN Trade Statistics Database as of July 2009
Country 1998 2000 2003 2006 2007 2008
12 ASEAN Community in Figures 2009

Trend of trade balance (US$ million)Brunei Darussalam 647 1,102 1,859 6,130 5,557 5,648
Cambodia - -37 -791 591 230 -58
Indonesia 21,511 28,609 28,508 39,733 39,627 7,823
Lao PDR - - -194 -185 -329 -976
Malaysia 16,122 18,507 21,464 28,911 29,295 50,197
Myanmar - -1,026 2,621 1,399 3,144 2,826
Philippines -164 3,587 -1,265 -4,364 -5,048 -7,620
Singapore 8,307 3,672 23,684 33,126 36,143 10,644
Thailand 10,770 6,766 4,691 -5,529 13,605 -2,601
Viet Nam - - - -3,203 -13,405 -17,801
Trend of trade balance as percentage of exportsBrunei Darussalam 33.7 50.8 57.9 80.5 72.6 64.5
Cambodia - -2.7 -37.4 16.8 5.9 -1.3
Indonesia 44.0 46.1 46.7 39.4 34.7 5.7
Lao PDR - - -134.9 -45.9 -86.2 -117.9
Malaysia 20.9 18.9 20.4 18.4 16.6 25.8
Myanmar - -85.9 58.7 39.8 53.0 42.7
Philippines -0.6 9.4 -3.5 -9.2 -10.0 -15.5
Singapore 7.6 2.7 14.8 12.2 12.1 4.4
Thailand 21.8 9.8 5.8 -4.5 8.9 -1.5
Viet Nam - - - -8.6 -27.8 -28.8
ASEAN trade aggregates02
Trade Balance by ASEAN Member States
Table 13
Source : ASEAN Trade Statistics Database as of July 2009
Country 1998 2000 2003 2006 2007 2008
13ASEAN Community in Figures 2009
ASEAN 120,918 166,846 206,732 352,771 401,920 458,114
Japan 81,410 116,191 113,401 161,781 173,062 211,916
EU25 83,302 102,647 101,365 160,332 186,720 202,358
China 20,414 32,316 59,637 139,961 171,118 192,672
USA 115,562 122,218 117,886 161,196 179,068 181,039
Republic of Korea 17,080 29,635 33,548 55,942 61,184 75,480
Australia 12,822 17,589 19,197 36,411 41,963 51,589
India 6,968 9,656 12,512 28,703 37,235 47,465
Canada 4,081 4,833 4,612 6,887 9,499 10,546
Russia 1,035 1,375 2,397 4,424 5,398 9,620
New Zealand 1,621 2,248 2,621 4,550 5,795 7,425
Pakistan 1,521 3,493 1,902 3,282 4,125 4,844
Rest of the World 109,372 150,055 148,729 288,564 333,700 257,355
Total 576,108 759,101 824,539 1,404,805 1,610,787 1,710,422
ASEAN trade dependency03
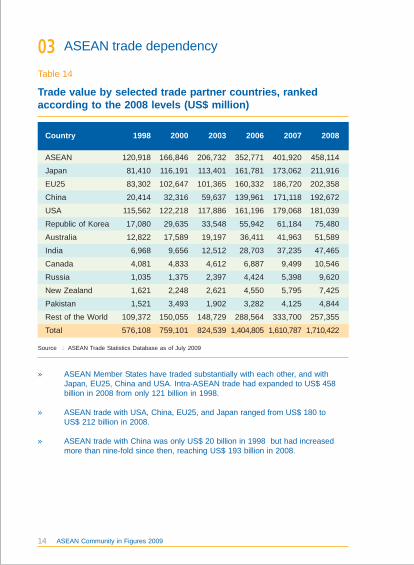
Trade value by selected trade partner countries, rankedaccording to the 2008 levels (US$ million)
Table 14
Country 1998 2000 2003 2006 2007 2008
» ASEAN Member States have traded substantially with each other, and withJapan, EU25, China and USA. Intra-ASEAN trade had expanded to US$ 458billion in 2008 from only 121 billion in 1998.
» ASEAN trade with USA, China, EU25, and Japan ranged from US$ 180 toUS$ 212 billion in 2008.
» ASEAN trade with China was only US$ 20 billion in 1998 but had increasedmore than nine-fold since then, reaching US$ 193 billion in 2008.
Source : ASEAN Trade Statistics Database as of July 2009
14 ASEAN Community in Figures 2009
ASEAN 21.0 22.0 25.1 25.1 25.0 26.8
Japan 14.1 15.3 13.8 11.5 10.7 12.4
EU25 14.5 13.5 12.3 11.4 11.6 11.8
China 3.5 4.3 7.2 10.0 10.6 11.3
USA 20.1 16.1 14.3 11.5 11.1 10.6
Republic of Korea 3.0 3.9 4.1 4.0 3.8 4.4
Australia 2.2 2.3 2.3 2.6 2.6 3.0
India 1.2 1.3 1.5 2.0 2.3 2.8
Canada 0.7 0.6 0.6 0.5 0.6 0.6
Russia 0.2 0.2 0.3 0.3 0.3 0.6
New Zealand 0.3 0.3 0.3 0.3 0.4 0.4
Pakistan 0.3 0.5 0.2 0.2 0.3 0.3
Rest of the World 19.0 19.8 18.0 20.5 20.7 15.0
Total 100.0 100.0 100.0 100.0 100.0 100.0
ASEAN trade dependency03
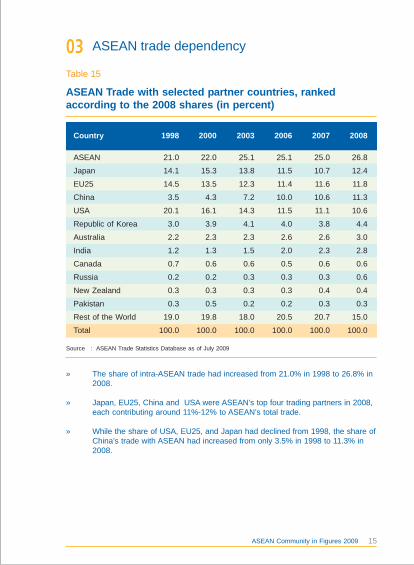
ASEAN Trade with selected partner countries, rankedaccording to the 2008 shares (in percent)
Table 15
Country 1998 2000 2003 2006 2007 2008
Source : ASEAN Trade Statistics Database as of July 2009
» The share of intra-ASEAN trade had increased from 21.0% in 1998 to 26.8% in2008.
» Japan, EU25, China and USA were ASEAN’s top four trading partners in 2008,each contributing around 11%-12% to ASEAN’s total trade.
» While the share of USA, EU25, and Japan had declined from 1998, the share ofChina’s trade with ASEAN had increased from only 3.5% in 1998 to 11.3% in2008.
15ASEAN Community in Figures 2009

In billion US$Brunei Darussalam 1.97 0.00 4.49 0.70 7.16Cambodia 0.31 0.01 0.03 0.01 0.36Indonesia 27.17 11.64 27.74 9.12 75.67Lao PDR 0.72 0.02 0.00 0.01 0.75Malaysia 50.40 18.42 20.88 7.41 97.12Myanmar 3.85 0.50 0.18 0.08 4.61Philippines 7.08 5.47 7.68 2.52 22.75Singapore 101.48 29.08 15.59 11.49 157.64Thailand 39.49 15.93 19.76 3.61 78.79Viet Nam 10.02 4.49 8.50 0.00 23.01ASEAN 242.50 85.56 104.86 34.94 467.86
Share (%)Brunei Darussalam 0.81 0.00 4.28 2.00 1.53Cambodia 0.13 0.02 0.03 0.02 0.08Indonesia 11.20 13.60 26.46 26.09 16.17Lao PDR 0.30 0.02 0.00 0.02 0.16Malaysia 20.78 21.53 19.92 21.21 20.76Myanmar 1.59 0.58 0.17 0.23 0.99Philippines 2.92 6.39 7.33 7.21 4.86Singapore 41.85 33.99 14.86 32.89 33.69Thailand 16.28 18.62 18.84 10.33 16.84Viet Nam 4.13 5.25 8.11 0.00 4.92ASEAN 100.0 100.0 100.0 100.0 100.0
Country ASEAN China Japan Rep. ASEAN+3of Korea
Country ASEAN China Japan Rep. ASEAN+3of Korea
ASEAN trade dependency03
ASEAN Member States Export to ASEAN+3, 2008
Table 16
Source : ASEAN Trade Statistics Database as of July 2009.
16 ASEAN Community in Figures 2009
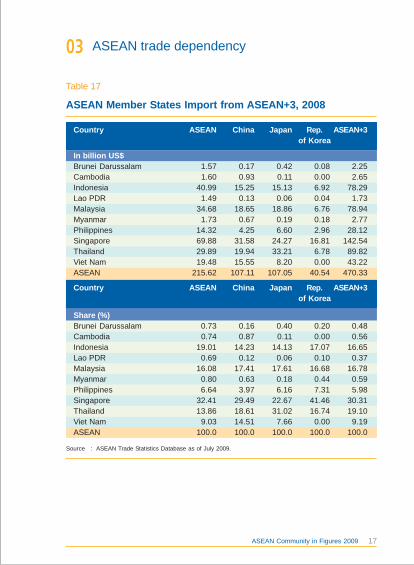
In billion US$Brunei Darussalam 1.57 0.17 0.42 0.08 2.25Cambodia 1.60 0.93 0.11 0.00 2.65Indonesia 40.99 15.25 15.13 6.92 78.29Lao PDR 1.49 0.13 0.06 0.04 1.73Malaysia 34.68 18.65 18.86 6.76 78.94Myanmar 1.73 0.67 0.19 0.18 2.77Philippines 14.32 4.25 6.60 2.96 28.12Singapore 69.88 31.58 24.27 16.81 142.54Thailand 29.89 19.94 33.21 6.78 89.82Viet Nam 19.48 15.55 8.20 0.00 43.22ASEAN 215.62 107.11 107.05 40.54 470.33
Share (%)Brunei Darussalam 0.73 0.16 0.40 0.20 0.48Cambodia 0.74 0.87 0.11 0.00 0.56Indonesia 19.01 14.23 14.13 17.07 16.65Lao PDR 0.69 0.12 0.06 0.10 0.37Malaysia 16.08 17.41 17.61 16.68 16.78Myanmar 0.80 0.63 0.18 0.44 0.59Philippines 6.64 3.97 6.16 7.31 5.98Singapore 32.41 29.49 22.67 41.46 30.31Thailand 13.86 18.61 31.02 16.74 19.10Viet Nam 9.03 14.51 7.66 0.00 9.19ASEAN 100.0 100.0 100.0 100.0 100.0
ASEAN trade dependency03
ASEAN Member States Import from ASEAN+3, 2008
Table 17
Source : ASEAN Trade Statistics Database as of July 2009.
Country ASEAN China Japan Rep. ASEAN+3of Korea
Country ASEAN China Japan Rep. ASEAN+3of Korea
17ASEAN Community in Figures 2009
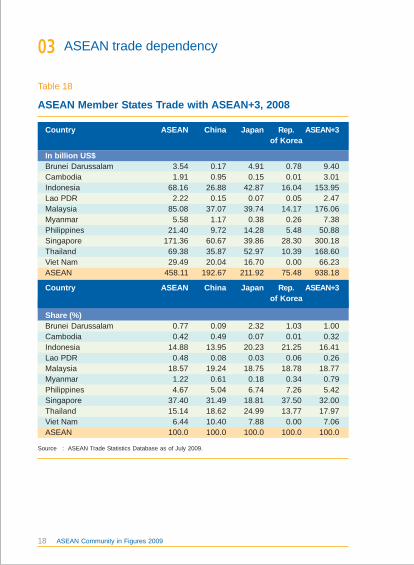
In billion US$Brunei Darussalam 3.54 0.17 4.91 0.78 9.40Cambodia 1.91 0.95 0.15 0.01 3.01Indonesia 68.16 26.88 42.87 16.04 153.95Lao PDR 2.22 0.15 0.07 0.05 2.47Malaysia 85.08 37.07 39.74 14.17 176.06Myanmar 5.58 1.17 0.38 0.26 7.38Philippines 21.40 9.72 14.28 5.48 50.88Singapore 171.36 60.67 39.86 28.30 300.18Thailand 69.38 35.87 52.97 10.39 168.60Viet Nam 29.49 20.04 16.70 0.00 66.23ASEAN 458.11 192.67 211.92 75.48 938.18
Share (%)Brunei Darussalam 0.77 0.09 2.32 1.03 1.00Cambodia 0.42 0.49 0.07 0.01 0.32Indonesia 14.88 13.95 20.23 21.25 16.41Lao PDR 0.48 0.08 0.03 0.06 0.26Malaysia 18.57 19.24 18.75 18.78 18.77Myanmar 1.22 0.61 0.18 0.34 0.79Philippines 4.67 5.04 6.74 7.26 5.42Singapore 37.40 31.49 18.81 37.50 32.00Thailand 15.14 18.62 24.99 13.77 17.97Viet Nam 6.44 10.40 7.88 0.00 7.06ASEAN 100.0 100.0 100.0 100.0 100.0
ASEAN trade dependency03
ASEAN Member States Trade with ASEAN+3, 2008
Table 18
Source : ASEAN Trade Statistics Database as of July 2009.
Country ASEAN China Japan Rep. ASEAN+3of Korea
Country ASEAN China Japan Rep. ASEAN+3of Korea
18 ASEAN Community in Figures 2009

In billion US$Brunei Darussalam 1.22 0.00 0.02 0.29 0.07 0.00 0.00 0.00Cambodia 0.01 0.29 0.76 0.00 0.00 0.00 0.01 1.97Indonesia 4.11 0.65 15.36 7.16 0.54 0.93 0.34 13.04Lao PDR 0.05 0.00 0.01 0.00 0.00 0.00 0.00 0.00Malaysia 6.99 0.97 22.19 7.18 0.96 1.65 0.95 23.94Myanmar 0.01 0.00 0.11 0.74 0.01 0.03 0.00 0.00Philippines 0.47 0.27 8.47 0.19 0.05 0.04 0.03 8.15Singapore 12.96 1.83 32.23 11.17 1.81 1.10 0.42 22.20Thailand 7.86 1.40 23.02 3.34 0.73 0.63 0.94 19.95Viet Nam 0.00 0.00 10.72 0.00 0.00 0.00 0.00 11.88ASEAN 33.68 5.42 112.89 30.09 4.16 4.39 2.71 101.13
Share (%)Brunei Darussalam 3.61 0.02 0.02 0.96 1.65 0.00 0.00 0.00Cambodia 0.03 5.38 0.67 0.01 0.02 0.00 0.44 1.95Indonesia 12.21 11.92 13.60 23.81 13.03 21.19 12.65 12.89Lao PDR 0.15 0.00 0.01 0.00 0.01 0.00 0.00 0.00Malaysia 20.74 17.91 19.66 23.88 22.98 37.57 35.27 23.67Myanmar 0.04 0.01 0.10 2.45 0.22 0.77 0.05 0.00Philippines 1.40 4.98 7.50 0.64 1.15 1.01 1.25 8.06Singapore 38.49 33.85 28.55 37.13 43.39 24.99 15.52 21.95Thailand 23.33 25.94 20.40 11.11 17.55 14.46 34.82 19.73Viet Nam 0.00 0.00 9.49 0.00 0.00 0.00 0.00 11.74ASEAN 100.0 100.0 100.0 100.0 100.0 100.0 100.0 100.0
Country Australia Canada EU25 India New Pakistan Russia USA Zealand
ASEAN trade dependency03
ASEAN Member States Export to Other Selected TradePartner Countries, 2008
Table 19
Country Australia Canada EU25 India New Pakistan Russia USA Zealand
Source : ASEAN Trade Statistics Database as of July 2009.
19ASEAN Community in Figures 2009
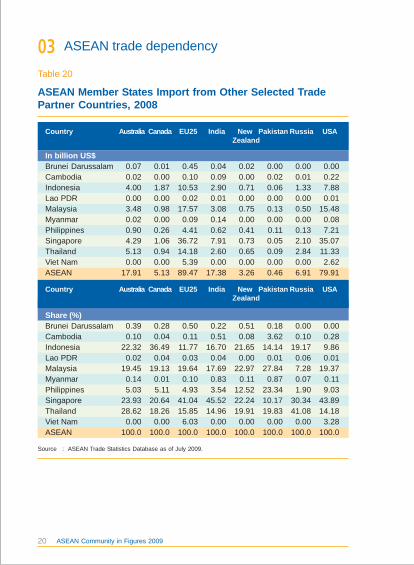
In billion US$Brunei Darussalam 0.07 0.01 0.45 0.04 0.02 0.00 0.00 0.00Cambodia 0.02 0.00 0.10 0.09 0.00 0.02 0.01 0.22Indonesia 4.00 1.87 10.53 2.90 0.71 0.06 1.33 7.88Lao PDR 0.00 0.00 0.02 0.01 0.00 0.00 0.00 0.01Malaysia 3.48 0.98 17.57 3.08 0.75 0.13 0.50 15.48Myanmar 0.02 0.00 0.09 0.14 0.00 0.00 0.00 0.08Philippines 0.90 0.26 4.41 0.62 0.41 0.11 0.13 7.21Singapore 4.29 1.06 36.72 7.91 0.73 0.05 2.10 35.07Thailand 5.13 0.94 14.18 2.60 0.65 0.09 2.84 11.33Viet Nam 0.00 0.00 5.39 0.00 0.00 0.00 0.00 2.62ASEAN 17.91 5.13 89.47 17.38 3.26 0.46 6.91 79.91
Share (%)Brunei Darussalam 0.39 0.28 0.50 0.22 0.51 0.18 0.00 0.00Cambodia 0.10 0.04 0.11 0.51 0.08 3.62 0.10 0.28Indonesia 22.32 36.49 11.77 16.70 21.65 14.14 19.17 9.86Lao PDR 0.02 0.04 0.03 0.04 0.00 0.01 0.06 0.01Malaysia 19.45 19.13 19.64 17.69 22.97 27.84 7.28 19.37Myanmar 0.14 0.01 0.10 0.83 0.11 0.87 0.07 0.11Philippines 5.03 5.11 4.93 3.54 12.52 23.34 1.90 9.03Singapore 23.93 20.64 41.04 45.52 22.24 10.17 30.34 43.89Thailand 28.62 18.26 15.85 14.96 19.91 19.83 41.08 14.18Viet Nam 0.00 0.00 6.03 0.00 0.00 0.00 0.00 3.28ASEAN 100.0 100.0 100.0 100.0 100.0 100.0 100.0 100.0
ASEAN trade dependency03
ASEAN Member States Import from Other Selected TradePartner Countries, 2008
Table 20
Source : ASEAN Trade Statistics Database as of July 2009.
Country Australia Canada EU25 India New Pakistan Russia USA Zealand
Country Australia Canada EU25 India New Pakistan Russia USA Zealand
20 ASEAN Community in Figures 2009
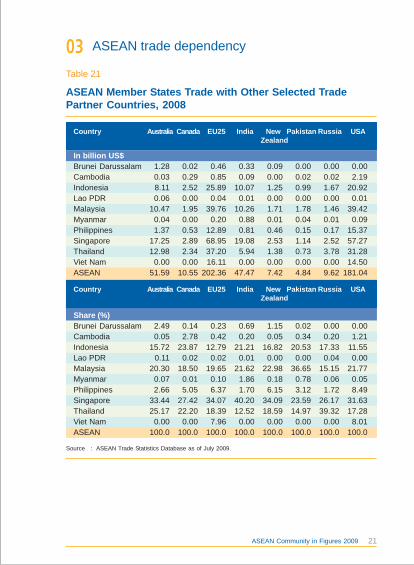
In billion US$Brunei Darussalam 1.28 0.02 0.46 0.33 0.09 0.00 0.00 0.00Cambodia 0.03 0.29 0.85 0.09 0.00 0.02 0.02 2.19Indonesia 8.11 2.52 25.89 10.07 1.25 0.99 1.67 20.92Lao PDR 0.06 0.00 0.04 0.01 0.00 0.00 0.00 0.01Malaysia 10.47 1.95 39.76 10.26 1.71 1.78 1.46 39.42Myanmar 0.04 0.00 0.20 0.88 0.01 0.04 0.01 0.09Philippines 1.37 0.53 12.89 0.81 0.46 0.15 0.17 15.37Singapore 17.25 2.89 68.95 19.08 2.53 1.14 2.52 57.27Thailand 12.98 2.34 37.20 5.94 1.38 0.73 3.78 31.28Viet Nam 0.00 0.00 16.11 0.00 0.00 0.00 0.00 14.50ASEAN 51.59 10.55 202.36 47.47 7.42 4.84 9.62 181.04
Share (%)Brunei Darussalam 2.49 0.14 0.23 0.69 1.15 0.02 0.00 0.00Cambodia 0.05 2.78 0.42 0.20 0.05 0.34 0.20 1.21Indonesia 15.72 23.87 12.79 21.21 16.82 20.53 17.33 11.55Lao PDR 0.11 0.02 0.02 0.01 0.00 0.00 0.04 0.00Malaysia 20.30 18.50 19.65 21.62 22.98 36.65 15.15 21.77Myanmar 0.07 0.01 0.10 1.86 0.18 0.78 0.06 0.05Philippines 2.66 5.05 6.37 1.70 6.15 3.12 1.72 8.49Singapore 33.44 27.42 34.07 40.20 34.09 23.59 26.17 31.63Thailand 25.17 22.20 18.39 12.52 18.59 14.97 39.32 17.28Viet Nam 0.00 0.00 7.96 0.00 0.00 0.00 0.00 8.01ASEAN 100.0 100.0 100.0 100.0 100.0 100.0 100.0 100.0
ASEAN trade dependency03
Country Australia Canada EU25 India New Pakistan Russia USA Zealand
ASEAN Member States Trade with Other Selected TradePartner Countries, 2008
Table 21
Source : ASEAN Trade Statistics Database as of July 2009.
Country Australia Canada EU25 India New Pakistan Russia USA Zealand
21ASEAN Community in Figures 2009

Brunei Darussalam 22.54 0.00 51.23 7.96 13.89 0.01 0.20Cambodia 7.13 0.30 0.74 0.17 0.25 6.69 17.34Indonesia 19.83 8.49 20.25 6.65 3.00 0.47 11.21Lao PDR 87.52 1.85 0.29 0.87 6.19 0.00 1.76Malaysia 25.91 9.47 10.74 3.81 3.59 0.50 11.41Myanmar 58.20 7.54 2.76 1.19 0.19 0.01 1.66Philippines 14.44 11.15 15.67 5.14 0.96 0.55 17.28Singapore 42.04 12.05 6.46 4.76 5.37 0.76 13.35Thailand 22.57 9.11 11.29 2.06 4.49 0.80 13.16Viet Nam 16.22 7.27 13.76 0.00 0.00 0.00 17.35ASEAN 27.58 9.73 11.93 3.97 3.83 0.62 12.84
Brunei Darussalam 3.29 0.78 0.00 0.00 0.00 0.10 100.0Cambodia 0.10 0.02 0.00 0.27 45.21 21.79 100.0Indonesia 5.23 0.40 0.68 0.25 9.51 14.03 100.0Lao PDR 0.00 0.03 0.00 0.00 0.37 1.13 100.0Malaysia 3.69 0.49 0.85 0.49 12.31 16.74 100.0Myanmar 11.15 0.14 0.51 0.02 0.02 16.61 100.0Philippines 0.39 0.10 0.09 0.07 16.63 17.52 100.0Singapore 4.63 0.75 0.45 0.17 9.19 0.02 100.0Thailand 1.91 0.42 0.36 0.54 11.40 21.88 100.0Viet Nam 0.00 0.00 0.00 0.00 19.23 26.18 100.0ASEAN 3.42 0.47 0.50 0.31 11.50 13.30 100.0
ASEAN trade dependency03
Share of ASEAN Member States Export by Selected TradePartner, 2008, (in percent)
Table 22
Source : ASEAN Trade Statistics Database as of July 2009.
Country ASEAN China Japan Rep. Australia Canada EU25of Korea
Country India New Pakistan Russia USA Rest of Total Zealand the world
22 ASEAN Community in Figures 2009
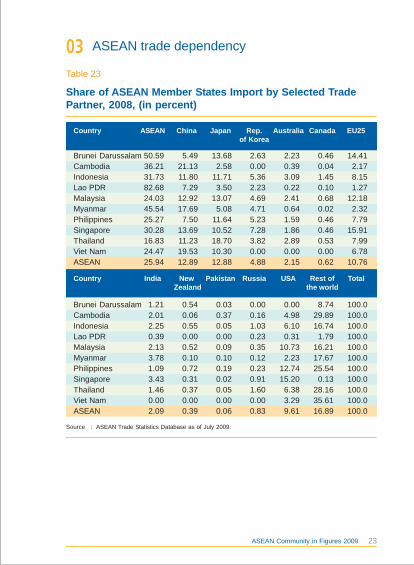
Brunei Darussalam 50.59 5.49 13.68 2.63 2.23 0.46 14.41Cambodia 36.21 21.13 2.58 0.00 0.39 0.04 2.17Indonesia 31.73 11.80 11.71 5.36 3.09 1.45 8.15Lao PDR 82.68 7.29 3.50 2.23 0.22 0.10 1.27Malaysia 24.03 12.92 13.07 4.69 2.41 0.68 12.18Myanmar 45.54 17.69 5.08 4.71 0.64 0.02 2.32Philippines 25.27 7.50 11.64 5.23 1.59 0.46 7.79Singapore 30.28 13.69 10.52 7.28 1.86 0.46 15.91Thailand 16.83 11.23 18.70 3.82 2.89 0.53 7.99Viet Nam 24.47 19.53 10.30 0.00 0.00 0.00 6.78ASEAN 25.94 12.89 12.88 4.88 2.15 0.62 10.76
Brunei Darussalam 1.21 0.54 0.03 0.00 0.00 8.74 100.0Cambodia 2.01 0.06 0.37 0.16 4.98 29.89 100.0Indonesia 2.25 0.55 0.05 1.03 6.10 16.74 100.0Lao PDR 0.39 0.00 0.00 0.23 0.31 1.79 100.0Malaysia 2.13 0.52 0.09 0.35 10.73 16.21 100.0Myanmar 3.78 0.10 0.10 0.12 2.23 17.67 100.0Philippines 1.09 0.72 0.19 0.23 12.74 25.54 100.0Singapore 3.43 0.31 0.02 0.91 15.20 0.13 100.0Thailand 1.46 0.37 0.05 1.60 6.38 28.16 100.0Viet Nam 0.00 0.00 0.00 0.00 3.29 35.61 100.0ASEAN 2.09 0.39 0.06 0.83 9.61 16.89 100.0
ASEAN trade dependency03
Share of ASEAN Member States Import by Selected TradePartner, 2008, (in percent)
Table 23
Source : ASEAN Trade Statistics Database as of July 2009.
Country ASEAN China Japan Rep. Australia Canada EU25of Korea
Country India New Pakistan Russia USA Rest of Total Zealand the world
23ASEAN Community in Figures 2009
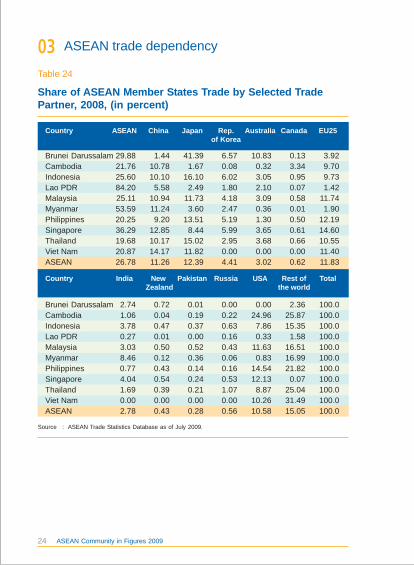
Brunei Darussalam 29.88 1.44 41.39 6.57 10.83 0.13 3.92Cambodia 21.76 10.78 1.67 0.08 0.32 3.34 9.70Indonesia 25.60 10.10 16.10 6.02 3.05 0.95 9.73Lao PDR 84.20 5.58 2.49 1.80 2.10 0.07 1.42Malaysia 25.11 10.94 11.73 4.18 3.09 0.58 11.74Myanmar 53.59 11.24 3.60 2.47 0.36 0.01 1.90Philippines 20.25 9.20 13.51 5.19 1.30 0.50 12.19Singapore 36.29 12.85 8.44 5.99 3.65 0.61 14.60Thailand 19.68 10.17 15.02 2.95 3.68 0.66 10.55Viet Nam 20.87 14.17 11.82 0.00 0.00 0.00 11.40ASEAN 26.78 11.26 12.39 4.41 3.02 0.62 11.83
Brunei Darussalam 2.74 0.72 0.01 0.00 0.00 2.36 100.0Cambodia 1.06 0.04 0.19 0.22 24.96 25.87 100.0Indonesia 3.78 0.47 0.37 0.63 7.86 15.35 100.0Lao PDR 0.27 0.01 0.00 0.16 0.33 1.58 100.0Malaysia 3.03 0.50 0.52 0.43 11.63 16.51 100.0Myanmar 8.46 0.12 0.36 0.06 0.83 16.99 100.0Philippines 0.77 0.43 0.14 0.16 14.54 21.82 100.0Singapore 4.04 0.54 0.24 0.53 12.13 0.07 100.0Thailand 1.69 0.39 0.21 1.07 8.87 25.04 100.0Viet Nam 0.00 0.00 0.00 0.00 10.26 31.49 100.0ASEAN 2.78 0.43 0.28 0.56 10.58 15.05 100.0
ASEAN trade dependency03
Share of ASEAN Member States Trade by Selected TradePartner, 2008, (in percent)
Table 24
Source : ASEAN Trade Statistics Database as of July 2009.
Country ASEAN China Japan Rep. Australia Canada EU25of Korea
Country India New Pakistan Russia USA Rest of Total Zealand the world
24 ASEAN Community in Figures 2009
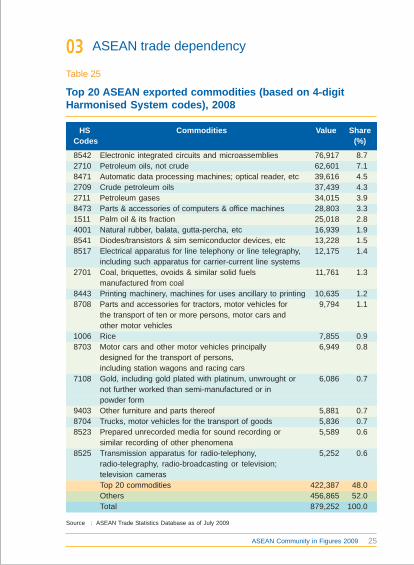
8542 Electronic integrated circuits and microassemblies 76,917 8.72710 Petroleum oils, not crude 62,601 7.18471 Automatic data processing machines; optical reader, etc 39,616 4.52709 Crude petroleum oils 37,439 4.32711 Petroleum gases 34,015 3.98473 Parts & accessories of computers & office machines 28,803 3.31511 Palm oil & its fraction 25,018 2.84001 Natural rubber, balata, gutta-percha, etc 16,939 1.98541 Diodes/transistors & sim semiconductor devices, etc 13,228 1.58517 Electrical apparatus for line telephony or line telegraphy, 12,175 1.4
including such apparatus for carrier-current line systems2701 Coal, briquettes, ovoids & similar solid fuels 11,761 1.3
manufactured from coal8443 Printing machinery, machines for uses ancillary to printing 10,635 1.28708 Parts and accessories for tractors, motor vehicles for 9,794 1.1
the transport of ten or more persons, motor cars andother motor vehicles
1006 Rice 7,855 0.98703 Motor cars and other motor vehicles principally 6,949 0.8
designed for the transport of persons,including station wagons and racing cars
7108 Gold, including gold plated with platinum, unwrought or 6,086 0.7not further worked than semi-manufactured or inpowder form
9403 Other furniture and parts thereof 5,881 0.78704 Trucks, motor vehicles for the transport of goods 5,836 0.78523 Prepared unrecorded media for sound recording or 5,589 0.6
similar recording of other phenomena8525 Transmission apparatus for radio-telephony, 5,252 0.6
radio-telegraphy, radio-broadcasting or television;television camerasTop 20 commodities 422,387 48.0Others 456,865 52.0Total 879,252 100.0
ASEAN trade dependency03
Top 20 ASEAN exported commodities (based on 4-digitHarmonised System codes), 2008
Table 25
HS Commodities Value ShareCodes (%)
Source : ASEAN Trade Statistics Database as of July 2009
25ASEAN Community in Figures 2009
ASEAN trade dependency03
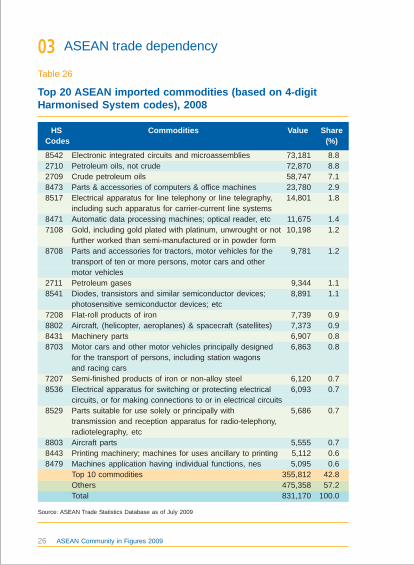
Top 20 ASEAN imported commodities (based on 4-digitHarmonised System codes), 2008
Table 26
HS Commodities Value ShareCodes (%)
Source: ASEAN Trade Statistics Database as of July 2009
8542 Electronic integrated circuits and microassemblies 73,181 8.82710 Petroleum oils, not crude 72,870 8.82709 Crude petroleum oils 58,747 7.18473 Parts & accessories of computers & office machines 23,780 2.98517 Electrical apparatus for line telephony or line telegraphy, 14,801 1.8
including such apparatus for carrier-current line systems8471 Automatic data processing machines; optical reader, etc 11,675 1.47108 Gold, including gold plated with platinum, unwrought or not 10,198 1.2
further worked than semi-manufactured or in powder form8708 Parts and accessories for tractors, motor vehicles for the 9,781 1.2
transport of ten or more persons, motor cars and othermotor vehicles
2711 Petroleum gases 9,344 1.18541 Diodes, transistors and similar semiconductor devices; 8,891 1.1
photosensitive semiconductor devices; etc7208 Flat-roll products of iron 7,739 0.98802 Aircraft, (helicopter, aeroplanes) & spacecraft (satellites) 7,373 0.98431 Machinery parts 6,907 0.88703 Motor cars and other motor vehicles principally designed 6,863 0.8
for the transport of persons, including station wagonsand racing cars
7207 Semi-finished products of iron or non-alloy steel 6,120 0.78536 Electrical apparatus for switching or protecting electrical 6,093 0.7
circuits, or for making connections to or in electrical circuits8529 Parts suitable for use solely or principally with 5,686 0.7
transmission and reception apparatus for radio-telephony,radiotelegraphy, etc
8803 Aircraft parts 5,555 0.78443 Printing machinery; machines for uses ancillary to printing 5,112 0.68479 Machines application having individual functions, nes 5,095 0.6
Top 10 commodities 355,812 42.8Others 475,358 57.2Total 831,170 100.0
26 ASEAN Community in Figures 2009
Bituminous mixtures fromnatural asphalt, natural &petroleum bitumen, mineraltar,
Uranium or thorium oresand concentratesSlag, dross other thangranulated slagIron ores & concentrates;including roasted iron pyritesAluminum ores andconcentratesChromium ores andconcentrates
Zirconium and articlesthereof, including waste andscrapIron oxides & hydroxides
Compounded rubber,unvulcanised,in primaryformsOres and concentrates, nes
Zinc ores and concentrates
Niobium, tantalum,vanadium or zirconium oresand concentratesMarble, travertine,ecaussine etc,
ASEAN trade dependency03
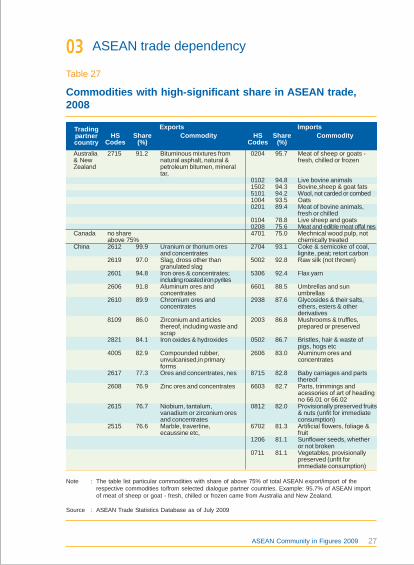
Commodities with high-significant share in ASEAN trade,2008
Table 27
95.7
94.894.394.293.589.4
78.875.675.0
93.1
92.8
92.4
88.5
87.6
86.8
86.7
83.0
82.8
82.7
82.0
81.3
81.1
81.1
Meat of sheep or goats -fresh, chilled or frozen
Live bovine animalsBovine,sheep & goat fatsWool, not carded or combedOatsMeat of bovine animals,fresh or chilledLive sheep and goatsMeat and edible meat offal nesMechnical wood pulp, notchemically treatedCoke & semicoke of coal,lignite, peat; retort carbonRaw silk (not thrown)
Flax yarn
Umbrellas and sunumbrellasGlycosides & their salts,ethers, esters & otherderivativesMushrooms & truffles,prepared or preserved
Bristles, hair & waste ofpigs, hogs etcAluminum ores andconcentrates
Baby carriages and partsthereofParts, trimmings andacessories of art of headingno 66.01 or 66.02Provisionally preserved fruits& nuts (unfit for immediateconsumption)Artificial flowers, foliage &fruitSunflower seeds, whetheror not brokenVegetables, provisionallypreserved (unfit forimmediate consumption)
2715
no shareabove 75%2612
2619
2601
2606
2610
8109
2821
4005
2617
2608
2615
2515
Australia& NewZealand
Canada
China
91.2
99.9
97.0
94.8
91.8
89.9
86.0
84.1
82.9
77.3
76.9
76.7
76.6
Note : The table list particular commodities with share of above 75% of total ASEAN export/import of therespective commodities to/from selected dialogue partner countries. Example: 95.7% of ASEAN importof meat of sheep or goat - fresh, chilled or frozen came from Australia and New Zealand.
Source : ASEAN Trade Statistics Database as of July 2009
0204
01021502510110040201
010402084701
2704
5002
5306
6601
2938
2003
0502
2606
8715
6603
0812
6702
1206
0711
Tradingpartnercountry
HSCodes
Share(%)
CommodityExports
HSCodes
Share(%)
CommodityImports
27ASEAN Community in Figures 2009
Wine lees; argol
Chamois leather
Glands & extracts, secretionsfor organotherapeutic uses;heparin & its salts; otherRyeOrgano-sulphur compounds
QuartzBicycles & other cycles, notmotorisedMeat and edible meat offal nesSetts, curbstones andflagstones, of natural stoneHormones; their derivatives;steroids nes
Oxygen-function amino-compoundsPatent leather and patentlaminated leather;metallised leather
ASEAN trade dependency03
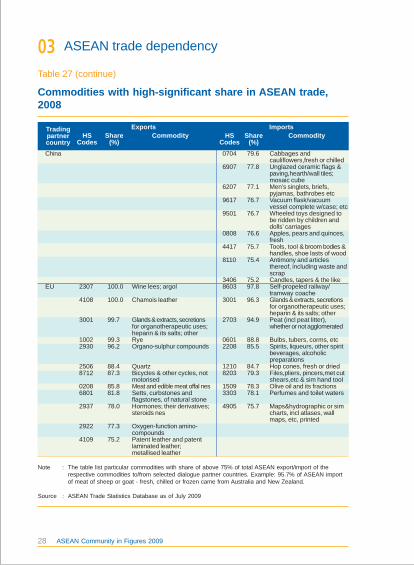
Commodities with high-significant share in ASEAN trade,2008
Table 27 (continue)
79.6
77.8
77.1
76.7
76.7
76.6
75.7
75.4
75.297.8
96.3
94.9
88.885.5
84.779.3
78.378.1
75.7
Cabbages andcauliflowers,fresh or chilledUnglazed ceramic flags &paving,hearth/wall tiles;mosaic cubeMen’s singlets, briefs,pyjamas, bathrobes etcVacuum flask/vacuumvessel complete w/case; etcWheeled toys designed tobe ridden by children anddolls’ carriagesApples, pears and quinces,freshTools, tool & broom bodies &handles, shoe lasts of woodAntimony and articlesthereof, including waste andscrapCandles, tapers & the likeSelf-propeled railway/tramway coacheGlands & extracts, secretionsfor organotherapeutic uses;heparin & its salts; otherPeat (incl peat litter),whether or not agglomerated
Bulbs, tubers, corms, etcSpirits, liqueurs, other spiritbeverages, alcoholicpreparationsHop cones, fresh or driedFiles,pliers, pincers,met cutshears,etc & sim hand toolOlive oil and its fractionsPerfumes and toilet waters
Maps&hydrographic or simcharts, incl atlases, wallmaps, etc, printed
2307
4108
3001
10022930
25068712
02086801
2937
2922
4109
China
EU 100.0
100.0
99.7
99.396.2
88.487.3
85.881.8
78.0
77.3
75.2
Note : The table list particular commodities with share of above 75% of total ASEAN export/import of therespective commodities to/from selected dialogue partner countries. Example: 95.7% of ASEAN importof meat of sheep or goat - fresh, chilled or frozen came from Australia and New Zealand.
Source : ASEAN Trade Statistics Database as of July 2009
0704
6907
6207
9617
9501
0808
4417
8110
34068603
3001
2703
06012208
12108203
15093303
4905
Tradingpartnercountry
HSCodes
Share(%)
CommodityExports
HSCodes
Share(%)
CommodityImports
28 ASEAN Community in Figures 2009
no share above 75% no share above 75%
Nickel matte,nickel oxidesinters
Sulphides; polysulphides
Unrefined copper; copperanodes for electrolytic refining
Silk waste, nes
Electrical signalling/trafficcontrol equip for railway/road (o/t hd 8608)Railway or tramway sleepers(cross-ties) of woodAntimony and articles thereof,including waste and scrapDolomiteCeramic ware for laboratory,chemical or techinal use, etcPrecious metal ores andconcentratesVacuum flask/vacuumvessel complete w/case; etcBones&horn-coresdegelatinisedOther inorganic compounds;liquid & compressed airNatural honey
Revolvers and pistols, otherthan those of heading no93.03 or 93.04Hand-woven and needle-worked tapestriesWomen’s blouses & shirts,knitted or crochetedVegetable tanning extracts;tannings & their salts
Lignite wether or notagglomerated, excluding jetMeat of horses, asses ormules fresh, chilled or frozenFlax, raw or processed butnot spun; flax tow and wasteMechnical wood pulp
ASEAN trade dependency03
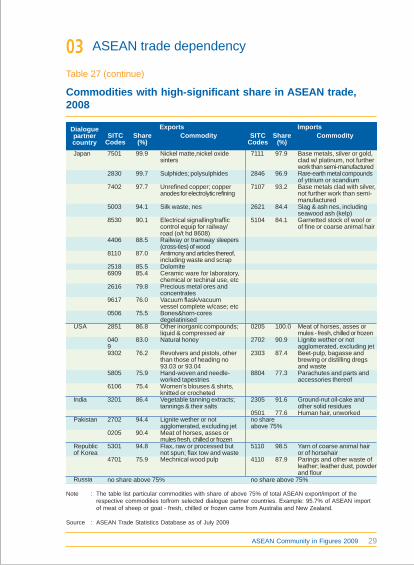
Commodities with high-significant share in ASEAN trade,2008
Table 27 (continue)
Base metals, silver or gold,clad w/ platinum, not furtherwork than semi-manufacturedRare-earth metal compoundsof yttrium or scandiumBase metals clad with silver,not further work than semi-manufacturedSlag & ash nes, includingseawood ash (kelp)Garnetted stock of wool orof fine or coarse animal hair
Meat of horses, asses ormules - fresh, chilled or frozenLignite wether or notagglomerated, excluding jetBeet-pulp, bagasse andbrewing or distilling dregsand wasteParachutes and parts andaccessories thereof
Ground-nut oil-cake andother solid residuesHuman hair, unworked
Yarn of coarse animal hairor of horsehairParings and other waste ofleather; leather dust, powderand flour
7501
2830
7402
5003
8530
4406
8110
25186909
2616
9617
0506
2851
04099302
5805
6106
3201
2702
0205
5301
4701
Japan
USA
India
Pakistan
Republicof Korea
Russia
99.9
99.7
97.7
94.1
90.1
88.5
87.0
85.585.4
79.8
76.0
75.5
86.8
83.0
76.2
75.9
75.4
86.4
94.4
90.4
94.8
75.9
Note : The table list particular commodities with share of above 75% of total ASEAN export/import of therespective commodities to/from selected dialogue partner countries. Example: 95.7% of ASEAN importof meat of sheep or goat - fresh, chilled or frozen came from Australia and New Zealand.
Source : ASEAN Trade Statistics Database as of July 2009
7111
2846
7107
2621
5104
0205
2702
2303
8804
2305
0501no shareabove 75%
5110
4110
Dialoguepartnercountry
SITCCodes
Share(%)
CommodityExports
SITCCodes
Share(%)
CommodityImports
97.9
96.9
93.2
84.4
84.1
100.0
90.9
87.4
77.3
91.6
77.6
98.5
87.9
29ASEAN Community in Figures 2009

ASEAN trade liberalisation04
Average tariff rates on imports from ASEAN
Chart 1
8
7
6
5
4
3
2
1
0
in percent
3.00
1.65
0.79
2000 2001 2002 2003 2004 2005 2006 2007 2008 2009
Note : For 2009, Cambodia use the ASEAN Harmonized Tariff Nomenclature (AHTN) 2002 while the others useAHTN 2007
* CEPT - Common Effective Preferential Tariff
Source : ASEAN Tariff Database
CLMV ASEAN ASEAN6
30 ASEAN Community in Figures 2009
ASEAN trade liberalisation04
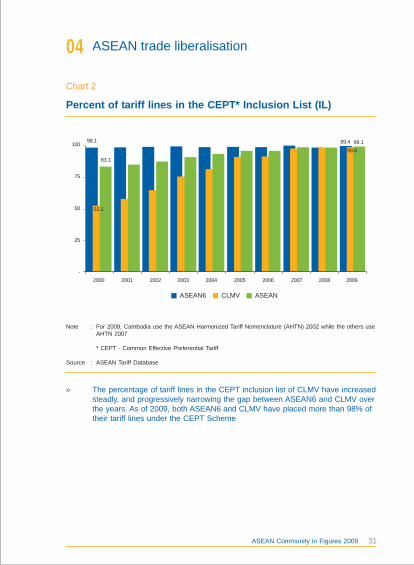
Percent of tariff lines in the CEPT* Inclusion List (IL)
Chart 2
100
75
50
25
-2000 2001 2002 2003 2004 2005 2006 2007 2008 2009
ASEAN6 CLMV ASEAN
98.1
83.1
99.4 99.1
Note : For 2009, Cambodia use the ASEAN Harmonized Tariff Nomenclature (AHTN) 2002 while the others useAHTN 2007
* CEPT - Common Effective Preferential Tariff
Source : ASEAN Tariff Database
» The percentage of tariff lines in the CEPT inclusion list of CLMV have increasedsteadly, and progressively narrowing the gap between ASEAN6 and CLMV overthe years. As of 2009, both ASEAN6 and CLMV have placed more than 98% oftheir tariff lines under the CEPT Scheme
52.1
98.6
31ASEAN Community in Figures 2009

ASEAN trade liberalisation04
Percent of items in the CEPT* Inclusion List (IL) with 0 tariff
Chart 3
100
75
50
25
0
2000 2001 2002 2003 2004 2005 2006 2007 2008 2009
70,000
60,000
50,000
40,000
30,000
20,000
10,000
0
percent
Note : For 2009, Cambodia uses the ASEAN Harmonized Tariff Nomenclature (AHTN) 2002 while the othersuse AHTN 2007
* CEPT - Common Effective Preferential Tariff
Source : ASEAN Tariff Database
» The number of items in the CEPT inclusion list with zero tariff in ASEAN6increased significantly in 2003 and continued to increase until 2009. The growthin CLMV was more modest. In percentage terms, the growth in ASEAN6showed a break in 2005 and 2006; but it was due to the rapid increase of thenumber of items in the CEPT IL
Number in IL
line chart: in absolute
bar chart: in percent ASEAN6 (%) CMLV (%)ASEAN (%)
CMLVASEAN ASEAN6
32 ASEAN Community in Figures 2009
Value (US$ million) 11,761 16,813 26,279 37,840Growth (%) 29.9 17.0 56.3 44.0Share to total (%) 2.6 2.2 3.1 4.3Value (US$ million) 6,845 13,436 19,817 21,456Growth (%) 24.0 18.9 47.5 8.3Share in total (%) 1.5 1.8 2.3 2.4Value (US$ million) 10,151 14,900 15,931 13,383Growth (%) 6.1 13.4 6.9 (16.0)Share in total (%) 2.2 2.0 1.9 1.5Value (US$ million) 6,830 10,864 12,370 12,545Growth (%) 13.5 10.9 13.9 1.4Share in total (%) 1.5 1.4 1.4 1.4Value (US$ million) 21,924 32,935 35,047 35,079Growth (%) 17.9 9.2 6.4 0.1Share in total (%) 4.8 4.4 4.1 4.0Value (US$ million) 193,766 302,118 294,167 178,688Growth (%) 96.4 11.9 (2.6) (39.3)Share in total (%) 42.8 40.2 34.2 20.3Value (US$ million) 11,387 24,535 36,067 41,009Growth (%) 76.3 14.7 47.0 13.7Share in total (%) 2.5 3.3 4.2 4.7
ASEAN trade in priority integration sectors05
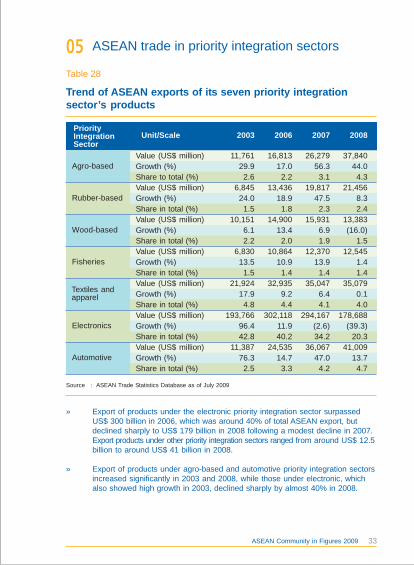
Trend of ASEAN exports of its seven priority integrationsector’s products
Table 28
» Export of products under the electronic priority integration sector surpassedUS$ 300 billion in 2006, which was around 40% of total ASEAN export, butdeclined sharply to US$ 179 billion in 2008 following a modest decline in 2007.Export products under other priority integration sectors ranged from around US$ 12.5billion to around US$ 41 billion in 2008.
» Export of products under agro-based and automotive priority integration sectorsincreased significantly in 2003 and 2008, while those under electronic, whichalso showed high growth in 2003, declined sharply by almost 40% in 2008.
Source : ASEAN Trade Statistics Database as of July 2009
Unit/Scale 2003 2006 2007 2008PriorityIntegrationSector
Agro-based
Rubber-based
Wood-based
Fisheries
Electronics
Automotive
Textiles andapparel
33ASEAN Community in Figures 2009
Value (US$ million) 1,268 2,174 3,103 4,398Growth (%) 23.6 28.7 42.7 41.8Share in total agro-based (%) 1.1 1.1 1.4 1.8Value (US$ million) 680 1,741 2,603 2,697Growth (%) 66.0 38.5 49.5 3.6Share in total rubber-based (%) 0.6 0.9 1.2 1.1Value (US$ million) 729 1,022 1,159 954Growth (%) 15.0 9.6 13.4 (17.7)Share in total wood-based (%) 0.6 0.5 0.5 0.4Value (US$ million) 536 821 1,013 1,092Growth (%) 4.0 4.3 23.4 7.8Share in total fisheries (%) 0.5 0.4 0.5 0.5Value (US$ million) 2,052 3,261 3,592 3,621Growth (%) 37.9 8.2 10.1 0.8Share in total textiles & apparrel (%) 1.8 1.7 1.7 1.5Value (US$ million) 45,096 72,552 70,447 45,754Growth (%) 104.3 9.1 (2.9) (35.1)Share in total electronics (%) 39.0 38.4 32.4 18.9Value (US$ mn) 3,827 8,583 11,000 13,674Growth (%) 94.0 1.1 28.2 24.3Share in total automotive (%) 3.3 4.5 5.1 5.6
Agro-based
Rubber-based
Wood-based
Fisheries
Electronics
Automotive
Textiles andapparel
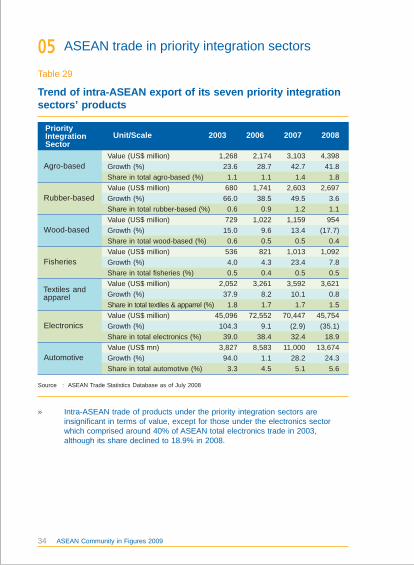
ASEAN trade in priority integration sectors05
» Intra-ASEAN trade of products under the priority integration sectors areinsignificant in terms of value, except for those under the electronics sectorwhich comprised around 40% of ASEAN total electronics trade in 2003,although its share declined to 18.9% in 2008.
Source : ASEAN Trade Statistics Database as of July 2008
Unit/Scale 2003 2006 2007 2008PriorityIntegrationSector
Trend of intra-ASEAN export of its seven priority integrationsectors’ products
Table 29
34 ASEAN Community in Figures 2009
Value of FDI inflow (US$ million)
Total 22,959.8 23,541.3 24,234.7 54,979.9 69,938.9 59,660.6
Intra-ASEAN 2,727.6 761.9 2,702.0 7,596.0 9,408.6 10,913.2
Rest of the World 19,989.3 22,964.9 21,364.7 45,786.9 59,563.4 48,577.4
Unspecified 242.9 -185.5 168.0 1,597.0 967.0 170.0
Shares in Total FDI inflow (%)
Total 100.0 100.0 100.0 100.0 100.0 100.0
Intra-ASEAN 11.9 3.2 11.1 13.8 13.5 18.3
Rest of the World 87.1 97.6 88.2 83.3 85.2 81.4
Unspecified 1.1 -0.8 0.7 2.9 1.4 0.3
ASEAN foreign direct investment06
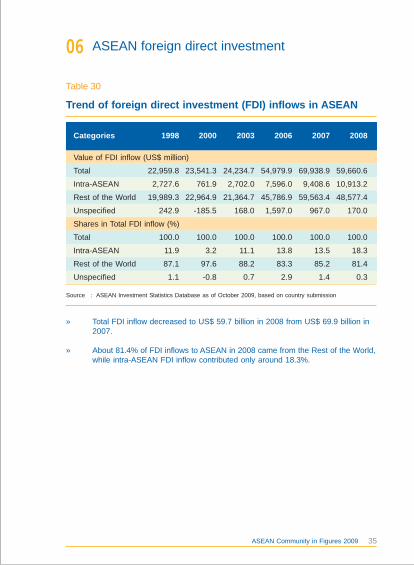
Trend of foreign direct investment (FDI) inflows in ASEAN
Table 30
» Total FDI inflow decreased to US$ 59.7 billion in 2008 from US$ 69.9 billion in2007.
» About 81.4% of FDI inflows to ASEAN in 2008 came from the Rest of the World,while intra-ASEAN FDI inflow contributed only around 18.3%.
Source : ASEAN Investment Statistics Database as of October 2009, based on country submission
Categories 1998 2000 2003 2006 2007 2008
35ASEAN Community in Figures 2009
Brunei Darussalam 573 549 3,123 434 260 239 0.3
Cambodia 243 149 84 483 867 815 1.2
Indonesia -356 -4,550 -596 4,914 6,928 8,340 11.9
Lao PDR 45 34 20 187 324 228 0.3
Malaysia 2,714 3,788 2,473 6,072 8,401 7,318 10.5
Myanmar 683 208 291 428 715 258 0.4
Philippines 2,272 2,240 491 2,921 2,916 1,520 2.2
Singapore 7,594 16,485 11,664 27,681 31,550 22,802 32.6
Thailand 7,491 3,350 5,235 9,460 11,238 10,091 14.4
Viet Nam 1,700 1,289 1,450 2,400 6,739 8,050 11.5
Total ASEAN 22,960 23,541 24,235 54,980 69,939 59,661 85.3
CLMV 2,672 1,679 1,845 3,498 8,645 9,351 13.4
ASEAN6 20,288 21,862 22,390 51,481 61,294 50,310 71.9
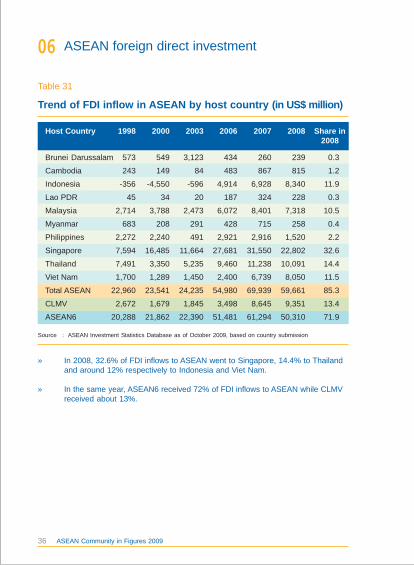
ASEAN foreign direct investment06
Trend of FDI inflow in ASEAN by host country (in US$ million)
Table 31
Host Country 1998 2000 2003 2006 2007 2008 Share in2008
» In 2008, 32.6% of FDI inflows to ASEAN went to Singapore, 14.4% to Thailandand around 12% respectively to Indonesia and Viet Nam.
» In the same year, ASEAN6 received 72% of FDI inflows to ASEAN while CLMVreceived about 13%.
Source : ASEAN Investment Statistics Database as of October 2009, based on country submission
36 ASEAN Community in Figures 2009
ASEAN 2,728 762 2,702 7,596 9,409 10,913 18.3
USA 3,712 7,293 1,495 3,419 6,346 3,380 5.7
EU25 5,553 13,469 6,679 10,672 18,384 13,118 22.0
Japan 3,944 503 3,908 10,230 8,382 7,233 12.1
China 290 -133 187 1,016 1,227 1,496 2.5
Republic of Korea 91 -42 550 1,254 3,125 1,412 2.4
Australia -302 -303 157 303 1,040 991 1.7
New Zealand 25 43 88 -198 120 112 0.2
India 93 80 102 -448 535 430 0.7
Pakistan 3 4 2 10 21 6 0.0
Russia n.a n.a n.a 7 31 75 0.1
Canada -207 -398 101 465 935 803 1.3
Rest of the World 6,787 2,450 8,096 19,058 19,419 19,522 32.7
Unspecified 243 -186 168 1,597 967 170 0.3
Total 22,960 23,541 24,235 54,980 69,939 59,661 100.0
ASEAN foreign direct investment06
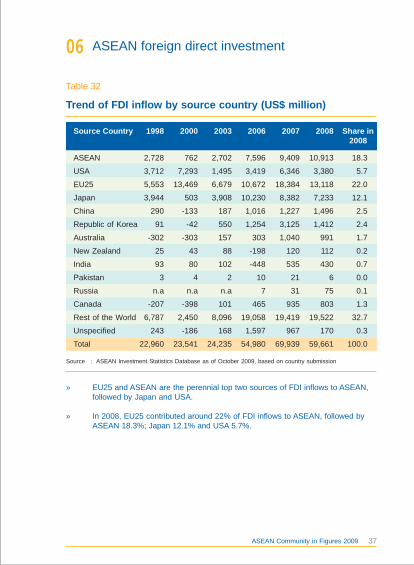
Trend of FDI inflow by source country (US$ million)
Table 32
Source Country 1998 2000 2003 2006 2007 2008 Share in2008
Source : ASEAN Investment Statistics Database as of October 2009, based on country submission
» EU25 and ASEAN are the perennial top two sources of FDI inflows to ASEAN,followed by Japan and USA.
» In 2008, EU25 contributed around 22% of FDI inflows to ASEAN, followed byASEAN 18.3%; Japan 12.1% and USA 5.7%.
37ASEAN Community in Figures 2009
Brunei Darussalam 944 127 158 179 226
Cambodia 701 1,422 1,700 2,015 2,125
Indonesia 4,371 5,002 4,871 5,506 6,234
Lao PDR 636 1,095 1,215 1,624 2,005
Malaysia 10,577 16,431 18,472 20,236 22,052
Myanmar 597 660 653 732 661
Philippines 1,907 2,623 2,688 3,092 3,139
Singapore 6,127 8,942 9,752 10,288 10,116
Thailand 10,082 11,517 13,822 14,464 14,584
Viet Nam 2,429 3,468 3,583 4,150 4,254
ASEAN 38,371 51,288 56,914 62,285 65,398
ASEAN6 34,008 44,643 49,763 53,764 56,353
CLMV 4,363 6,645 7,152 8,521 9,045
Share (%)ASEAN 100.0 100.0 100.0 100.0 100.0
ASEAN6 88.6 87.0 87.4 86.3 86.2
CLMV 11.4 13.0 12.6 13.7 13.8
ASEAN tourism07
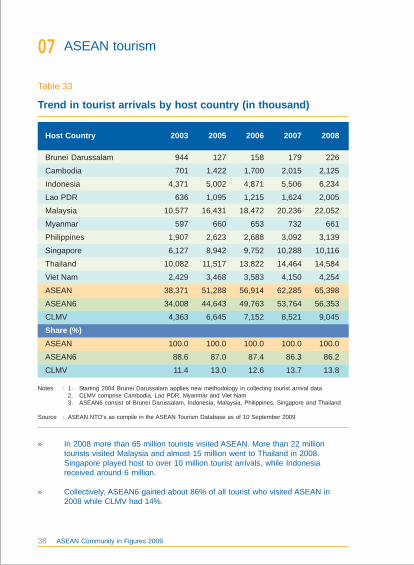
Trend in tourist arrivals by host country (in thousand)
Table 33
Host Country 2003 2005 2006 2007 2008
Notes : 1. Starting 2004 Brunei Darussalam applies new methodology in collecting tourist arrival data2. CLMV comprise Cambodia, Lao PDR, Myanmar and Viet Nam3. ASEAN6 consist of Brunei Darussalam, Indonesia, Malaysia, Philippines, Singapore and Thailand
Source : ASEAN NTO’s as compile in the ASEAN Tourism Database as of 10 September 2009
» In 2008 more than 65 million tourists visited ASEAN. More than 22 milliontourists visited Malaysia and almost 15 million went to Thailand in 2008.Singapore played host to over 10 million tourist arrivals, while Indonesiareceived around 6 million.
» Collectively, ASEAN6 gained about 86% of all tourist who visited ASEAN in2008 while CLMV had 14%.
38 ASEAN Community in Figures 2009
Brunei Darussalam 6.0 7.0 24.3 12.9 26.4
Cambodia -10.9 34.7 19.6 18.5 5.5
Indonesia -11.0 -6.0 -2.6 13.0 13.2
Lao PDR -13.5 22.4 10.9 33.6 23.5
Malaysia -20.4 4.6 12.4 9.6 9.0
Myanmar 174.9 0.5 -1.1 12.1 -9.7
Philippines -1.3 14.5 2.5 15.0 1.5
Singapore -19.0 6.8 9.0 5.5 -1.7
Thailand -6.6 -1.9 20.0 4.6 0.8
Viet Nam -7.6 18.4 3.3 15.8 2.5
ASEAN -12.3 4.5 11.0 9.4 4.6
ASEAN6 -13.7 2.5 11.5 8.0 4.8
CLMV -0.1 20.1 7.6 19.1 2.9
ASEAN tourism07
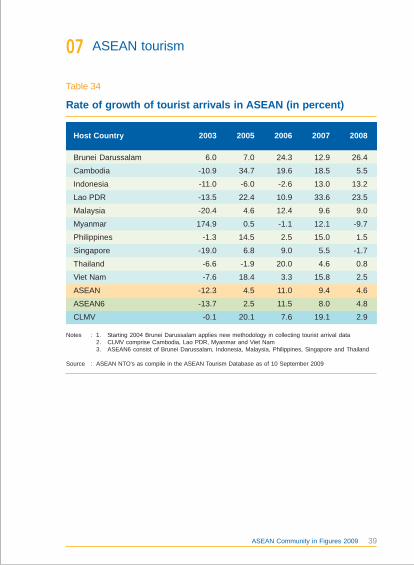
Rate of growth of tourist arrivals in ASEAN (in percent)
Table 34
Host Country 2003 2005 2006 2007 2008
Notes : 1. Starting 2004 Brunei Darussalam applies new methodology in collecting tourist arrival data2. CLMV comprise Cambodia, Lao PDR, Myanmar and Viet Nam3. ASEAN6 consist of Brunei Darussalam, Indonesia, Malaysia, Philippines, Singapore and Thailand
Source : ASEAN NTO’s as compile in the ASEAN Tourism Database as of 10 September 2009
39ASEAN Community in Figures 2009
ASEAN 27,341 30,276 43.9 46.3
Europe 7,789 8,208 12.5 12.6
China 3,926 4,471 6.3 6.8
Japan 3,701 3,624 5.9 5.5
Australia 2,435 2,905 3.9 4.4
USA 2,537 2,653 4.1 4.1
Republic of Korea 3,539 2,657 5.7 4.1
India 1,814 1,985 2.9 3.0
Rest of the World 9,202 8,606 14.8 13.2
TOTAL 62,285 65,398 100.0 100.0
ASEAN tourism07
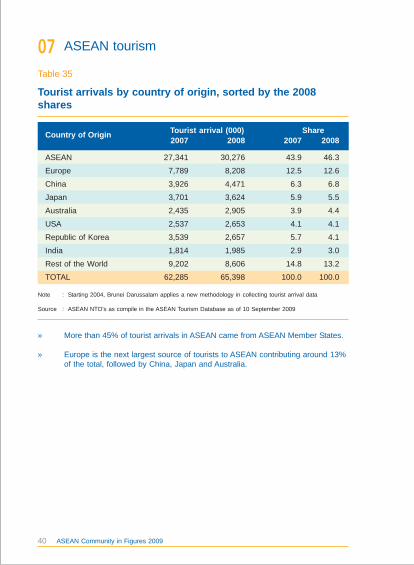
Tourist arrivals by country of origin, sorted by the 2008shares
Table 35
» More than 45% of tourist arrivals in ASEAN came from ASEAN Member States.
» Europe is the next largest source of tourists to ASEAN contributing around 13%of the total, followed by China, Japan and Australia.
Note : Starting 2004, Brunei Darussalam applies a new methodology in collecting tourist arrival data
Source : ASEAN NTO’s as compile in the ASEAN Tourism Database as of 10 September 2009
2007 2008 2007 2008Tourist arrival (000)Country of Origin Share
40 ASEAN Community in Figures 2009
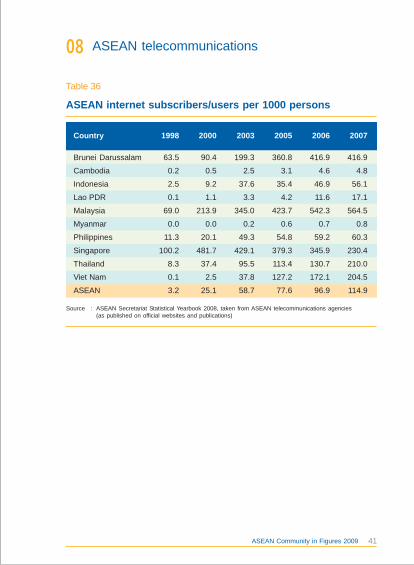
Brunei Darussalam 63.5 90.4 199.3 360.8 416.9 416.9
Cambodia 0.2 0.5 2.5 3.1 4.6 4.8
Indonesia 2.5 9.2 37.6 35.4 46.9 56.1
Lao PDR 0.1 1.1 3.3 4.2 11.6 17.1
Malaysia 69.0 213.9 345.0 423.7 542.3 564.5
Myanmar 0.0 0.0 0.2 0.6 0.7 0.8
Philippines 11.3 20.1 49.3 54.8 59.2 60.3
Singapore 100.2 481.7 429.1 379.3 345.9 230.4
Thailand 8.3 37.4 95.5 113.4 130.7 210.0
Viet Nam 0.1 2.5 37.8 127.2 172.1 204.5
ASEAN 3.2 25.1 58.7 77.6 96.9 114.9
Source : ASEAN Secretariat Statistical Yearbook 2008, taken from ASEAN telecommunications agencies(as published on official websites and publications)
ASEAN telecommunications08
ASEAN internet subscribers/users per 1000 persons
Table 36
Country 1998 2000 2003 2005 2006 2007
41ASEAN Community in Figures 2009
ASEAN telecommunications08
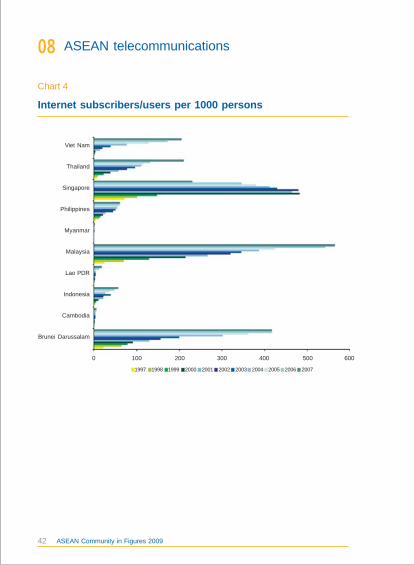
Internet subscribers/users per 1000 persons
Chart 4
Viet Nam
Thailand
Singapore
Philippines
Myanmar
Malaysia
Lao PDR
Indonesia
Cambodia
Brunei Darussalam
0 100 200 300 400 500 600
1997 1998 1999 2000 2001 2002 2003 2004 2005 2006 2007
42 ASEAN Community in Figures 2009
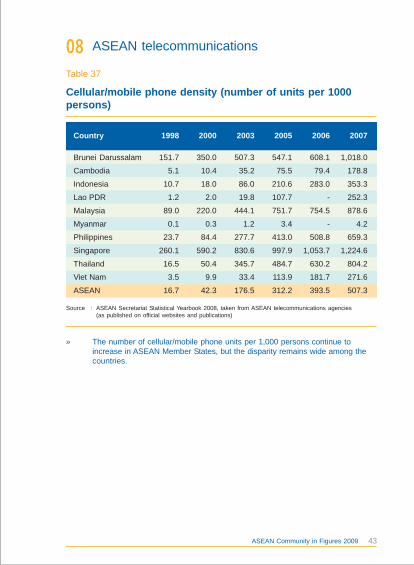
Brunei Darussalam 151.7 350.0 507.3 547.1 608.1 1,018.0
Cambodia 5.1 10.4 35.2 75.5 79.4 178.8
Indonesia 10.7 18.0 86.0 210.6 283.0 353.3
Lao PDR 1.2 2.0 19.8 107.7 - 252.3
Malaysia 89.0 220.0 444.1 751.7 754.5 878.6
Myanmar 0.1 0.3 1.2 3.4 - 4.2
Philippines 23.7 84.4 277.7 413.0 508.8 659.3
Singapore 260.1 590.2 830.6 997.9 1,053.7 1,224.6
Thailand 16.5 50.4 345.7 484.7 630.2 804.2
Viet Nam 3.5 9.9 33.4 113.9 181.7 271.6
ASEAN 16.7 42.3 176.5 312.2 393.5 507.3
ASEAN telecommunications08
Cellular/mobile phone density (number of units per 1000persons)
Table 37
» The number of cellular/mobile phone units per 1,000 persons continue toincrease in ASEAN Member States, but the disparity remains wide among thecountries.
Source : ASEAN Secretariat Statistical Yearbook 2008, taken from ASEAN telecommunications agencies(as published on official websites and publications)
Country 1998 2000 2003 2005 2006 2007
43ASEAN Community in Figures 2009

ASEAN telecommunications08
Cellular/mobile phone density (per 1000 persons)
Chart 5
Viet Nam
Thailand
Singapore
Philippines
Myanmar
Malaysia
Lao PDR
Indonesia
Cambodia
Brunei Darussalam
1997 1998 1999 2000 2001 2002 2003 2004 2005 2006 2007
0 200 400 600 800 1000 14001200
44 ASEAN Community in Figures 2009
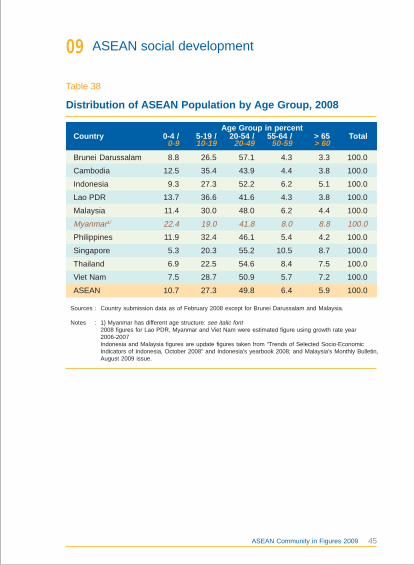
Brunei Darussalam 8.8 26.5 57.1 4.3 3.3 100.0
Cambodia 12.5 35.4 43.9 4.4 3.8 100.0
Indonesia 9.3 27.3 52.2 6.2 5.1 100.0
Lao PDR 13.7 36.6 41.6 4.3 3.8 100.0
Malaysia 11.4 30.0 48.0 6.2 4.4 100.0
Myanmar1/ 22.4 19.0 41.8 8.0 8.8 100.0Philippines 11.9 32.4 46.1 5.4 4.2 100.0
Singapore 5.3 20.3 55.2 10.5 8.7 100.0
Thailand 6.9 22.5 54.6 8.4 7.5 100.0
Viet Nam 7.5 28.7 50.9 5.7 7.2 100.0
ASEAN 10.7 27.3 49.8 6.4 5.9 100.0
ASEAN social development09
Distribution of ASEAN Population by Age Group, 2008
Table 38
Sources : Country submission data as of February 2008 except for Brunei Darussalam and Malaysia.
Notes : 1) Myanmar has different age structure: see italic font2008 figures for Lao PDR, Myanmar and Viet Nam were estimated figure using growth rate year2006-2007Indonesia and Malaysia figures are update figures taken from “Trends of Selected Socio-EconomicIndicators of Indonesia, October 2008” and Indonesia’s yearbook 2008; and Malaysia’s Monthly Bulletin,August 2009 issue.
Country 0-4 / 5-19 / 20-54 / 55-64 / > 65 Total0-9 10-19 20-49 50-59 > 60
Age Group in percent
45ASEAN Community in Figures 2009
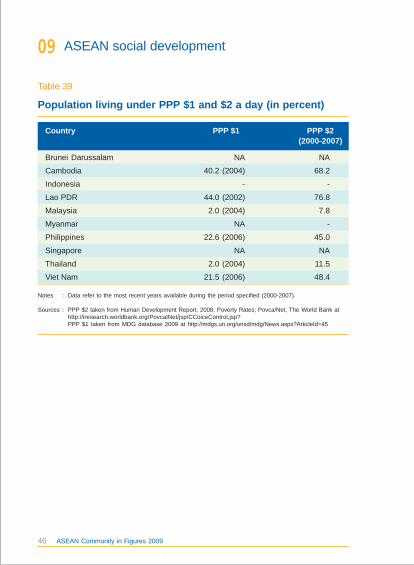
Brunei Darussalam NA NA
Cambodia 40.2 (2004) 68.2
Indonesia - -
Lao PDR 44.0 (2002) 76.8
Malaysia 2.0 (2004) 7.8
Myanmar NA -
Philippines 22.6 (2006) 45.0
Singapore NA NA
Thailand 2.0 (2004) 11.5
Viet Nam 21.5 (2006) 48.4
ASEAN social development09
Population living under PPP $1 and $2 a day (in percent)
Table 39
Notes : Data refer to the most recent years available during the period specified (2000-2007).
Sources : PPP $2 taken from Human Development Report, 2008; Poverty Rates; Povca/Net, The World Bank athttp://iresearch.worldbank.org/PovcaINet/jsp/CCoiceControl.jsp?PPP $1 taken from MDG database 2009 at http://mdgs.un.org/unsd/mdg/News.aspx?ArticleId=45
Country PPP $1 PPP $2(2000-2007)
46 ASEAN Community in Figures 2009
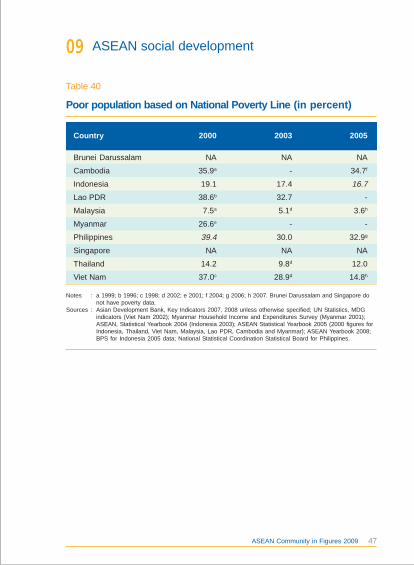
Brunei Darussalam NA NA NA
Cambodia 35.9a - 34.7f
Indonesia 19.1 17.4 16.7Lao PDR 38.6b 32.7 -
Malaysia 7.5a 5.1d 3.6h
Myanmar 26.6e - -
Philippines 39.4 30.0 32.9g
Singapore NA NA NA
Thailand 14.2 9.8d 12.0
Viet Nam 37.0c 28.9d 14.8h
Poor population based on National Poverty Line (in percent)
Table 40
ASEAN social development09
Notes : a 1999; b 1996; c 1998; d 2002; e 2001; f 2004; g 2006; h 2007. Brunei Darussalam and Singapore donot have poverty data.
Sources : Asian Development Bank, Key Indicators 2007, 2008 unless otherwise specified; UN Statistics, MDGindicators (Viet Nam 2002); Myanmar Household Income and Expenditures Survey (Myanmar 2001);ASEAN, Statistical Yearbook 2004 (Indonesia 2003); ASEAN Statistical Yearbook 2005 (2000 figures forIndonesia, Thailand, Viet Nam, Malaysia, Lao PDR, Cambodia and Myanmar); ASEAN Yearbook 2008;BPS for Indonesia 2005 data; National Statistical Coordination Statistical Board for Philippines.
Country 2000 2003 2005
47ASEAN Community in Figures 2009

Brunei Darussalam 0.413 0.413 -
Cambodia 0.403c 0.419 -
Indonesia 0.320 0.343 0.357
Lao PDR 0.326 - -
Malaysia 0.485b 0.379 -
Myanmar 0.300d - -
Philippines 0.461 0.440 0.456
Singaporea 0.460 0.470 0.476
Thailand 0.418b 0.425 0.418
Viet Nam 0.420b 0.378 -
Gini coefficient in ASEAN Member States (in percent)
Table 41
Notes : a Measures the degree of inequality in monthly income from work per household member amongemployed households; b 2002; c 2004; d 2001.
Figures in italics are revised/updated data relative to the previous edition of the ACIF.
Sources : Brunei Darussalam MDG’s 2005 (1997/98 HES); Cambodia, CSES 2004; Malaysia, Department ofStatistics; Myanmar, Household Income and Expenditure Survey, 2001; Philippines, Family Income andExpenditure Survey (FIES), National Statistics Office; Thailand, National Statistical Office; Singapore,Singapore Department of Statistics; Indonesia, Analisis Dan Penghitungan Kemiskinan 2006, BPS; LaoPDR, Lao Expenditure and Consumption Survey (LECS) 3 (2002/3), National Statistics Centre (NSC);Viet Nam, Viet Nam Households Living Standards Survey (VHLSS).
Country 2003 2005 2006
ASEAN social development09
48 ASEAN Community in Figures 2009
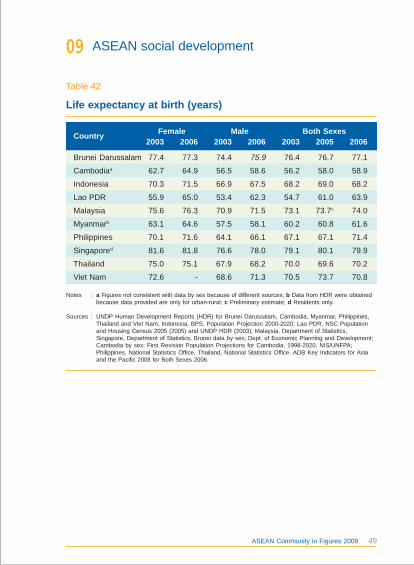
Brunei Darussalam 77.4 77.3 74.4 75.9 76.4 76.7 77.1
Cambodiaa 62.7 64.9 56.5 58.6 56.2 58.0 58.9
Indonesia 70.3 71.5 66.9 67.5 68.2 69.0 68.2
Lao PDR 55.9 65.0 53.4 62.3 54.7 61.0 63.9
Malaysia 75.6 76.3 70.9 71.5 73.1 73.7c 74.0
Myanmarb 63.1 64.6 57.5 58.1 60.2 60.8 61.6
Philippines 70.1 71.6 64.1 66.1 67.1 67.1 71.4
Singapored 81.6 81.8 76.6 78.0 79.1 80.1 79.9
Thailand 75.0 75.1 67.9 68.2 70.0 69.6 70.2
Viet Nam 72.6 - 68.6 71.3 70.5 73.7 70.8
Life expectancy at birth (years)
Table 42
Notes : a Figures not consistent with data by sex because of different sources; b Data from HDR were obtainedbecause data provided are only for urban-rural; c Preliminary estimate; d Residents only.
Sources : UNDP Human Development Reports (HDR) for Brunei Darussalam, Cambodia, Myanmar, Philippines,Thailand and Viet Nam; Indonesia, BPS, Population Projection 2000-2020; Lao PDR, NSC Populationand Housing Census 2005 (2005) and UNDP HDR (2003); Malaysia, Department of Statistics;Singapore, Department of Statistics, Brunei data by sex; Dept. of Economic Planning and Development;Cambodia by sex; First Revision Population Projections for Cambodia, 1998-2020, NIS/UNFPA;Philippines, National Statistics Office, Thailand, National Statistics Office. ADB Key Indicators for Asiaand the Pacific 2008 for Both Sexes 2006.
2003 2006 2003 2006 2003 2005 2006Country Female Male Both Sexes
ASEAN social development09
49ASEAN Community in Figures 2009
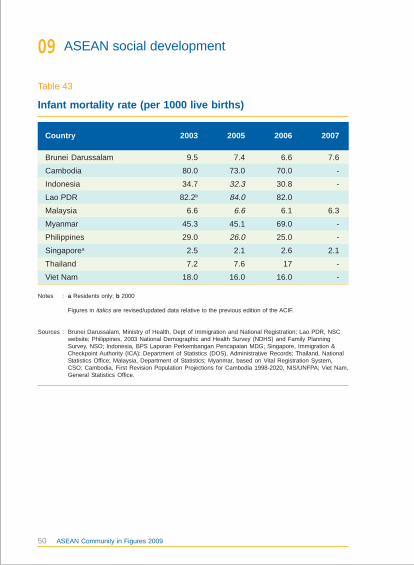
Brunei Darussalam 9.5 7.4 6.6 7.6
Cambodia 80.0 73.0 70.0 -
Indonesia 34.7 32.3 30.8 -
Lao PDR 82.2b 84.0 82.0
Malaysia 6.6 6.6 6.1 6.3
Myanmar 45.3 45.1 69.0 -
Philippines 29.0 26.0 25.0 -
Singaporea 2.5 2.1 2.6 2.1
Thailand 7.2 7.6 17 -
Viet Nam 18.0 16.0 16.0 -
Infant mortality rate (per 1000 live births)
Table 43
Notes : a Residents only; b 2000
Figures in italics are revised/updated data relative to the previous edition of the ACIF.
Sources : Brunei Darussalam, Ministry of Health, Dept of Immigration and National Registration; Lao PDR, NSCwebsite; Philippines, 2003 National Demographic and Health Survey (NDHS) and Family PlanningSurvey, NSO; Indonesia, BPS Laporan Perkembangan Pencapaian MDG; Singapore, Immigration &Checkpoint Authority (ICA); Department of Statistics (DOS), Administrative Records; Thailand, NationalStatistics Office; Malaysia, Department of Statistics; Myanmar, based on Vital Registration System,CSO; Cambodia, First Revision Population Projections for Cambodia 1998-2020, NIS/UNFPA; Viet Nam,General Statistics Office.
Country 2003 2005 2006 2007
ASEAN social development09
50 ASEAN Community in Figures 2009

Brunei Darussalam 2.50 1.70 -
Cambodia 0.90 0.90 1.00
Indonesia 0.40 - -
Lao PDR - - -
Malaysia 2.10 1.70 1.80
Myanmar - - -
Philippines 0.30 0.30 -
Singapore 1.50 0.90 -
Thailand 1.70 - -
Viet Nam - - -
Government health expenditure as percentage of GDP(in percent)
Table 44
Source : Taken from ADB Key Indicators for Asia and the Pacific, 2008
Country 2003 2005 2007
ASEAN social development09
51ASEAN Community in Figures 2009
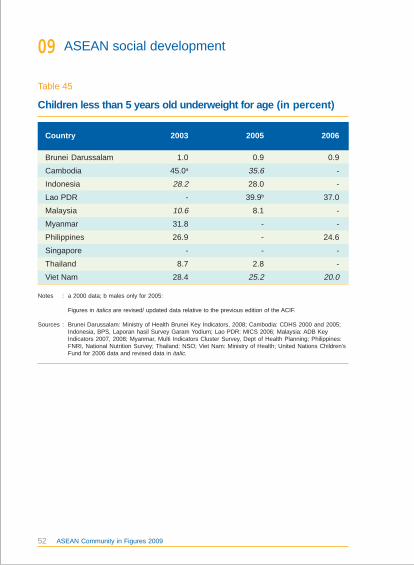
Brunei Darussalam 1.0 0.9 0.9
Cambodia 45.0a 35.6 -
Indonesia 28.2 28.0 -
Lao PDR - 39.9b 37.0
Malaysia 10.6 8.1 -
Myanmar 31.8 - -
Philippines 26.9 - 24.6
Singapore - - -
Thailand 8.7 2.8 -
Viet Nam 28.4 25.2 20.0
Children less than 5 years old underweight for age (in percent)
Table 45
Notes : a 2000 data; b males only for 2005:
Figures in italics are revised/ updated data relative to the previous edition of the ACIF.
Sources : Brunei Darussalam: Ministry of Health Brunei Key Indicators, 2008; Cambodia: CDHS 2000 and 2005;Indonesia, BPS, Laporan hasil Survey Garam Yodium; Lao PDR: MICS 2006; Malaysia: ADB KeyIndicators 2007, 2008; Myanmar, Multi Indicators Cluster Survey, Dept of Health Planning; Philippines:FNRI, National Nutrition Survey; Thailand: NSO; Viet Nam: Ministry of Health; United Nations Children’sFund for 2006 data and revised data in italic.
Country 2003 2005 2006
ASEAN social development09
52 ASEAN Community in Figures 2009
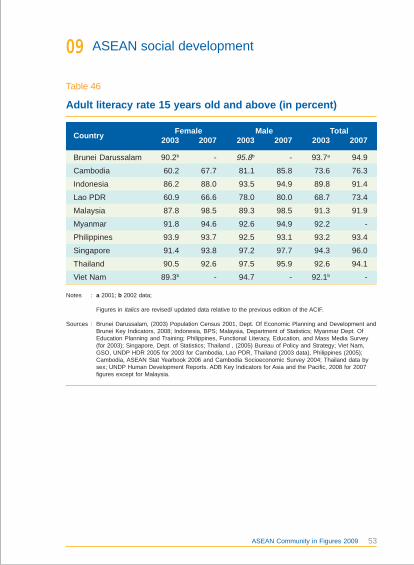
Brunei Darussalam 90.2b - 95.8b - 93.7a 94.9
Cambodia 60.2 67.7 81.1 85.8 73.6 76.3
Indonesia 86.2 88.0 93.5 94.9 89.8 91.4
Lao PDR 60.9 66.6 78.0 80.0 68.7 73.4
Malaysia 87.8 98.5 89.3 98.5 91.3 91.9
Myanmar 91.8 94.6 92.6 94.9 92.2 -
Philippines 93.9 93.7 92.5 93.1 93.2 93.4
Singapore 91.4 93.8 97.2 97.7 94.3 96.0
Thailand 90.5 92.6 97.5 95.9 92.6 94.1
Viet Nam 89.3b - 94.7 - 92.1b -
Notes : a 2001; b 2002 data;
Figures in italics are revised/ updated data relative to the previous edition of the ACIF.
Sources : Brunei Darussalam, (2003) Population Census 2001, Dept. Of Economic Planning and Development andBrunei Key Indicators, 2008; Indonesia, BPS; Malaysia, Department of Statistics; Myanmar Dept. OfEducation Planning and Training; Philippines, Functional Literacy, Education, and Mass Media Survey(for 2003); Singapore, Dept. of Statistics; Thailand , (2005) Bureau of Policy and Strategy; Viet Nam,GSO, UNDP HDR 2005 for 2003 for Cambodia, Lao PDR, Thailand (2003 data), Philippines (2005);Cambodia, ASEAN Stat Yearbook 2006 and Cambodia Socioeconomic Survey 2004; Thailand data bysex; UNDP Human Development Reports. ADB Key Indicators for Asia and the Pacific, 2008 for 2007figures except for Malaysia.
Adult literacy rate 15 years old and above (in percent)
Table 46
2003 2007 2003 2007 2003 2007Country Female Male Total
ASEAN social development09
53ASEAN Community in Figures 2009
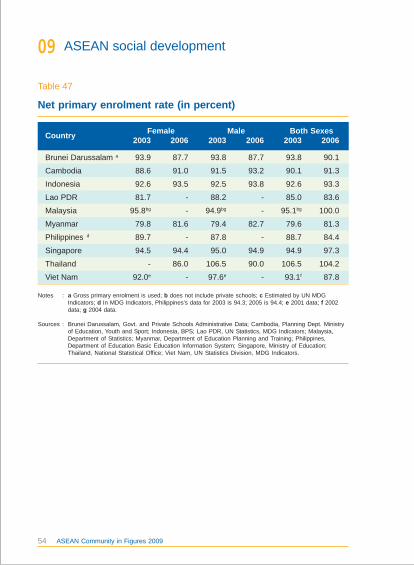
Brunei Darussalam a 93.9 87.7 93.8 87.7 93.8 90.1
Cambodia 88.6 91.0 91.5 93.2 90.1 91.3
Indonesia 92.6 93.5 92.5 93.8 92.6 93.3
Lao PDR 81.7 - 88.2 - 85.0 83.6
Malaysia 95.8bg - 94.9bg - 95.1bg 100.0
Myanmar 79.8 81.6 79.4 82.7 79.6 81.3
Philippines d 89.7 - 87.8 - 88.7 84.4
Singapore 94.5 94.4 95.0 94.9 94.9 97.3
Thailand - 86.0 106.5 90.0 106.5 104.2
Viet Nam 92.0e - 97.6e - 93.1f 87.8
Net primary enrolment rate (in percent)
Table 47
Notes : a Gross primary enrolment is used; b does not include private schools; c Estimated by UN MDGIndicators; d In MDG Indicators, Philippines’s data for 2003 is 94.3; 2005 is 94.4; e 2001 data; f 2002data; g 2004 data.
Sources : Brunei Darussalam, Govt. and Private Schools Administrative Data; Cambodia, Planning Dept. Ministryof Education, Youth and Sport; Indonesia, BPS; Lao PDR, UN Statistics, MDG Indicators; Malaysia,Department of Statistics; Myanmar, Department of Education Planning and Training; Philippines,Department of Education Basic Education Information System; Singapore, Ministry of Education;Thailand, National Statistical Office; Viet Nam, UN Statistics Division, MDG Indicators.
2003 2006 2003 2006 2003 2006Country Female Male Both Sexes
ASEAN social development09
54 ASEAN Community in Figures 2009

Brunei Darussalama 6.2 4.9 3.3 2.4 4.4 3.4 3.7
Cambodia - 2.7d - 1.9d 1.1 2.3d -
Indonesia 12.0 10.8 7.6 8.1 9.6 9.1 8.4
Lao PDR - 1.2c - 1.3c 5.1 1.3c -
Malaysia 3.6 3.4 3.6 3.1 3.6 3.2 3.6
Myanmar 4.7 4.5 3.6 3.7 4.0 4.0 -
Philippinese 10.3 6.0 10.1 6.4 10.2 6.2 6.8
Singapore b 6.2 4.3 5.7 3.7 5.9 4.0 3.2
Thailand 2.1 1.2 2.2 1.5 2.2 1.4 1.4
Viet Nam 2.6 - 1.9 - 5.8 4.6 4.7
Unemployment rate by gender (in percent)
Table 48
Female Male Both SexesCountry
Notes : a Aged 15 to 64 years; b Resident Unemployment rate (annual average) Resident refers to Singaporecitizen and Singapore Permanent Resident; c 2005 data; d 2004 data; e National Statistics Office’s(NSO) definition of unemployment for 2005 differs from that of 2003.
Figures in italics are revised/updated data relative to the previous edition of the ACIF.
Sources : Compiled from data submission; Brunei Darussalam, Dept. of Economic Planning and Development;Cambodia, Cambodia Socio-Economic Survey 2004 (CSES2004); Indonesia, Bps-Statistics Indonesia;Lao PDR Population and Housing Census 2005, NSC; Malaysia, Department of Statistics; Myanmar ,Labour Force Survey, Dept. of Labour; Philippines, Labour Force Survey (LFS) October round, PNSO;Singapore, Labour Force Survey; General Household Survey and Population Survey, Dept of Statisticsand Ministry of Manpower ; Thailand, The Labour Force Survey and Report of the Labour Force Survey,NSO, Ministry of Information and Communication Technology; Viet Nam, NGKT2006 (StatisticalYearbook 2006).
2003 2007 2003 2007 2003 2007 2008
ASEAN social development09
55ASEAN Community in Figures 2009
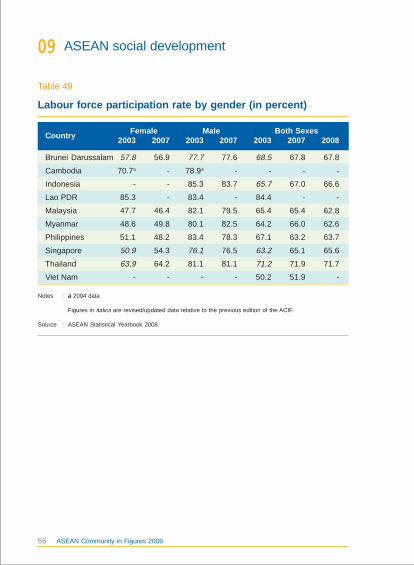
Brunei Darussalam 57.8 56.9 77.7 77.6 68.5 67.8 67.8
Cambodia 70.7a - 78.9a - - - -
Indonesia - - 85.3 83.7 65.7 67.0 66.6
Lao PDR 85.3 - 83.4 - 84.4 - -
Malaysia 47.7 46.4 82.1 79.5 65.4 65.4 62.8
Myanmar 48.6 49.8 80.1 82.5 64.2 66.0 62.6
Philippines 51.1 48.2 83.4 78.3 67.1 63.2 63.7
Singapore 50.9 54.3 76.1 76.5 63.2 65.1 65.6
Thailand 63.9 64.2 81.1 81.1 71.2 71.9 71.7
Viet Nam - - - - 50.2 51.9 -
Labour force participation rate by gender (in percent)
Table 49
Country Female Male Both Sexes
Notes : a 2004 data
Figures in italics are revised/updated data relative to the previous edition of the ACIF.
Source : ASEAN Statistical Yearbook 2008.
2003 2007 2003 2007 2003 2007 2008
ASEAN social development09
56 ASEAN Community in Figures 2009
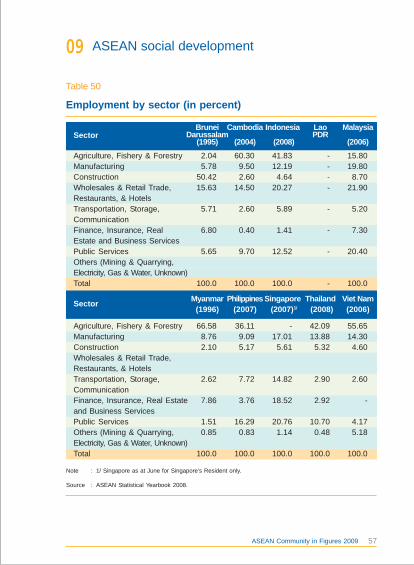
2.04 60.30 41.83 - 15.805.78 9.50 12.19 - 19.80
50.42 2.60 4.64 - 8.7015.63 14.50 20.27 - 21.90
5.71 2.60 5.89 - 5.20
6.80 0.40 1.41 - 7.30
5.65 9.70 12.52 - 20.407.95 0.40 1.24 - 0.80
100.0 100.0 100.0 - 100.0
66.58 36.11 - 42.09 55.658.76 9.09 17.01 13.88 14.302.10 5.17 5.61 5.32 4.609.72 21.03 22.13 21.71 13.51
2.62 7.72 14.82 2.90 2.60
7.86 3.76 18.52 2.92 -
1.51 16.29 20.76 10.70 4.170.85 0.83 1.14 0.48 5.18
100.0 100.0 100.0 100.0 100.0
Sector
Employment by sector (in percent)
Table 50
Note : 1/ Singapore as at June for Singapore’s Resident only.
Source : ASEAN Statistical Yearbook 2008.
Brunei Cambodia Indonesia Lao MalaysiaDarussalam PDR
(1995) (2004) (2008) (2006)Sector
Agriculture, Fishery & ForestryManufacturingConstructionWholesales & Retail Trade,Restaurants, & HotelsTransportation, Storage,CommunicationFinance, Insurance, RealEstate and Business ServicesPublic ServicesOthers (Mining & Quarrying,Electricity, Gas & Water, Unknown)Total
Agriculture, Fishery & ForestryManufacturingConstructionWholesales & Retail Trade,Restaurants, & HotelsTransportation, Storage,CommunicationFinance, Insurance, Real Estateand Business ServicesPublic ServicesOthers (Mining & Quarrying,Electricity, Gas & Water, Unknown)Total
ASEAN social development09
Myanmar Philippines Singapore Thailand Viet Nam(1996) (2007) (2007)1/ (2008) (2006)
57ASEAN Community in Figures 2009
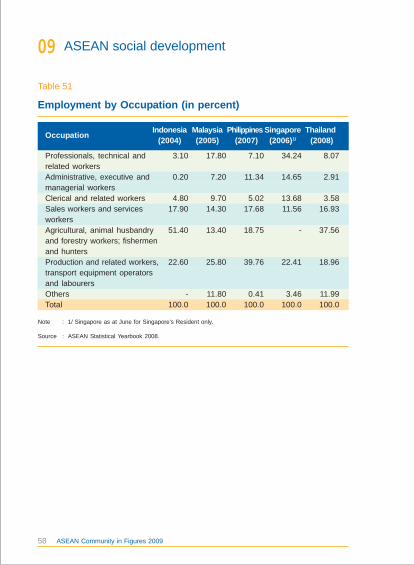
3.10 17.80 7.10 34.24 8.07
0.20 7.20 11.34 14.65 2.91
4.80 9.70 5.02 13.68 3.5817.90 14.30 17.68 11.56 16.93
51.40 13.40 18.75 - 37.56
22.60 25.80 39.76 22.41 18.96
- 11.80 0.41 3.46 11.99100.0 100.0 100.0 100.0 100.0
Employment by Occupation (in percent)
Table 51
Note : 1/ Singapore as at June for Singapore’s Resident only.
Source : ASEAN Statistical Yearbook 2008.
Indonesia Malaysia Philippines Singapore Thailand(2004) (2005) (2007) (2006)1/ (2008)
Professionals, technical andrelated workersAdministrative, executive andmanagerial workersClerical and related workersSales workers and servicesworkersAgricultural, animal husbandryand forestry workers; fishermenand huntersProduction and related workers,transport equipment operatorsand labourersOthersTotal
Occupation
ASEAN social development09
58 ASEAN Community in Figures 2009
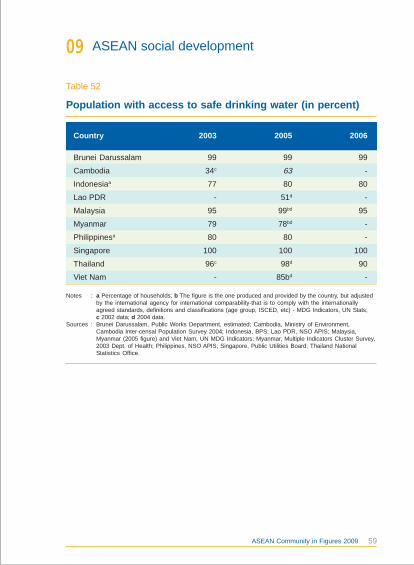
Brunei Darussalam 99 99 99
Cambodia 34c 63 -
Indonesiaa 77 80 80
Lao PDR - 51d -
Malaysia 95 99bd 95
Myanmar 79 78bd -
Philippinesa 80 80 -
Singapore 100 100 100
Thailand 96c 98d 90
Viet Nam - 85bd -
Population with access to safe drinking water (in percent)
Table 52
Notes : a Percentage of households; b The figure is the one produced and provided by the country, but adjustedby the international agency for international comparability-that is to comply with the internationallyagreed standards, definitions and classifications (age group, ISCED, etc) - MDG Indicators, UN Stats;c 2002 data; d 2004 data.
Sources : Brunei Darussalam, Public Works Department, estimated; Cambodia, Ministry of Environment,Cambodia Inter-censal Population Survey 2004; Indonesia, BPS; Lao PDR, NSO APIS; Malaysia,Myanmar (2005 figure) and Viet Nam, UN MDG Indicators; Myanmar, Multiple Indicators Cluster Survey,2003 Dept. of Health; Philippines, NSO APIS; Singapore, Public Utilities Board; Thailand NationalStatistics Office.
Country 2003 2005 2006
ASEAN social development09
59ASEAN Community in Figures 2009
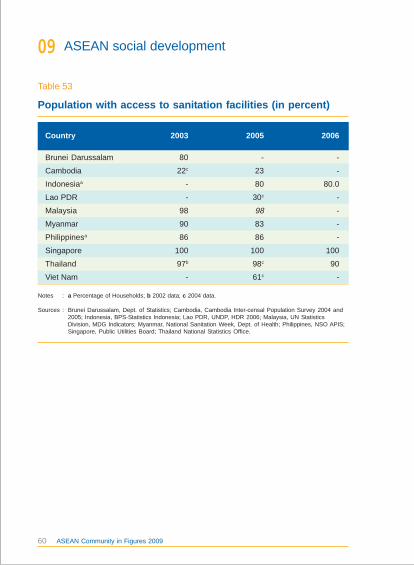
Brunei Darussalam 80 - -
Cambodia 22c 23 -
Indonesiaa - 80 80.0
Lao PDR - 30c -
Malaysia 98 98 -
Myanmar 90 83 -
Philippinesa 86 86 -
Singapore 100 100 100
Thailand 97b 98c 90
Viet Nam - 61c -
Population with access to sanitation facilities (in percent)
Table 53
Notes : a Percentage of Households; b 2002 data; c 2004 data.
Sources : Brunei Darussalam, Dept. of Statistics; Cambodia, Cambodia Inter-censal Population Survey 2004 and2005; Indonesia, BPS-Statistics Indonesia; Lao PDR, UNDP, HDR 2006; Malaysia, UN StatisticsDivision, MDG Indicators; Myanmar, National Sanitation Week, Dept. of Health; Philippines, NSO APIS;Singapore, Public Utilities Board; Thailand National Statistics Office.
Country 2003 2005 2006
ASEAN social development09
60 ASEAN Community in Figures 2009
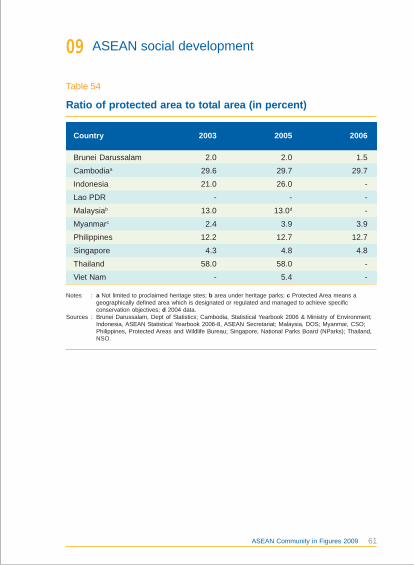
Brunei Darussalam 2.0 2.0 1.5
Cambodiaa 29.6 29.7 29.7
Indonesia 21.0 26.0 -
Lao PDR - - -
Malaysiab 13.0 13.0d -
Myanmarc 2.4 3.9 3.9
Philippines 12.2 12.7 12.7
Singapore 4.3 4.8 4.8
Thailand 58.0 58.0 -
Viet Nam - 5.4 -
Notes : a Not limited to proclaimed heritage sites; b area under heritage parks; c Protected Area means ageographically defined area which is designated or regulated and managed to achieve specificconservation objectives; d 2004 data.
Sources : Brunei Darussalam, Dept of Statistics; Cambodia, Statistical Yearbook 2006 & Ministry of Environment;Indonesia, ASEAN Statistical Yearbook 2006-8, ASEAN Secretariat; Malaysia, DOS; Myanmar, CSO;Philippines, Protected Areas and Wildlife Bureau; Singapore, National Parks Board (NParks); Thailand,NSO.
Ratio of protected area to total area (in percent)
Table 54
Country 2003 2005 2006
ASEAN social development09
61ASEAN Community in Figures 2009


One Vision, One Identity, One Communitywww.asean.org