Embed Size (px)
Citation preview

Managing integration for better jobs and shared prosperity
ASEAN Community 2015:
© 2014 International Labour Organization and Asian Development Bank
All rights reserved. Published in 2014. Printed in Thailand.
ISBN 978-92-2-128869-5 (Print), 978-92-2-128870-1 (PDF)Publication Stock No.
Cataloging-In-Publication Data
International Labour Organization and Asian Development Bank.
ASEAN community 2015: Managing integration for better jobs and shared prosperity
Bangkok, Thailand: ILO and ADB, 2014.
1. Labour market. 2. Employment. 3. Decent work. 4. Productivity. 5. Wages. 6. Labour migration. 7. Social protection. 8. Economic integration. 9. Regional cooperation. 10. ASEAN countries.I. International Labour Organization. II. Asian Development Bank.
This is a co-publication of the International Labour Organization (ILO) and the Asian Development Bank (ADB).
The views expressed in this publication are those of the authors and do not necessarily reflect the views and policies of the Asian Development Bank or its Board of Governors or the Secretariat of the United Nations or the International Labour Organization or the governments they represent.
ILO and ADB do not guarantee the accuracy of the data included in this publication and accept no responsibility for any consequence of their use.
This publication follows the International Labour Organization’s practice in references to member designations and maps. Where there are space constraints, some country names have been abbreviated. In the Asian Development Bank, China is referred to as the People's Republic of China; Kyrgyzstan is referred to as the Kyrgyz Republic; and Vietnam is referred to as Viet Nam. The designation of or reference to a particular territory or geographic area, or the use of the term “country” in this document do not imply the expression of any opinion whatsoever on the part of the Secretariat of the United Nations, ILO, ADB or its Board of Governors, or the governments they represent concerning the legal status of any country, territory, city or area, or of its authorities, or concerning the delimitation of its frontiers or boundaries.
All queries and request for permission to use the material can be addressed to the copyright administrator of this work as follows: Rights and Licensing, ILO Publications, 1211 Geneva 22, Switzerland. [email protected] Short excerpts from them may be reproduced without authorization, on condition that the source is indicated. For rights of reproduction or translation, application should be made to ILO Publications (Rights and Permissions), International Labour Office, CH-1211 Geneva 22, Switzerland, or by email: [email protected]. The International Labour Office welcomes such applications.Libraries, institutions and other users registered with reproduction rights organizations may make copies in accordance with the licences issued to them for this purpose. Visit www.ifrro.org to find the reproduction rights organization in your country.
Visit our websites: www.ilo.org/publns, www.ilo.org/asia, www.adb.org/publications, and www.adb.org
Cover photos: © ILO
ASEAN Community 2015: Managing integration for better jobs and shared prosperity i i i
The Association of Southeast Asian Nations (ASEAN) encompasses a dynamic and diverse region. It has enjoyed remarkable economic growth in recent decades but has also witnessed rising inequality and the persistence of poor quality jobs. By 2015, the ASEAN Economic Community (AEC), envisioned as a single common market and production base, will become a reality. This will lead to the freer flow of goods, services, investment capital and skilled labour in the region. Tariffs and non-tariff barriers will be reduced which will have implications for intra-regional trade and investment. New opportunities for growth and prosperity are likely to emerge, but the challenge is to ensure that growth is inclusive and prosperity is shared. To that end, understanding the impact of the AEC on labour markets will be critical in making sound policy choices that can shape the lives of the 600 million women and men in the region.
The President of the Asian Development Bank (ADB) and the Director-General of the International Labour Organization (ILO) signed a joint statement in December 2012, in which the two organizations pledged to strengthen their partnership to create decent work and address poverty, vulnerability and informal employ-ment in the region. Exemplifying the spirit of that cooperation, this publication is a joint undertaking of the ADB and the ILO Regional Office for Asia and the Pacific. It reflects the high-level commitment of both organizations to support the ASEAN Secretariat and ASEAN Member States to build a people-centred ASEAN Community through better jobs and shared prosperity.
This publication provides an overview of recent economic and labour market trends in ASEAN, based on official national and international sources. It examines the impact of the ASEAN Economic Community on labour markets through model simulations and empirical and policy analyses, with the aim of offering evidence-based policy recommendations towards fostering better jobs and inclusive and balanced growth. The report highlights key priorities to address the challenges and opportunities of the AEC in terms of strengthening regional cooperation mechanisms, facilitating structural change and improving job quality, enhancing skills development, boosting productivity and wages, and managing labour migration.
We trust that readers will be inspired by this report, which presents the first ever analysis of the AEC impact on jobs, working conditions and lives of women and men in ASEAN. The recommendations in the report provide practical strategies and policy options that can assist policy makers in promoting inclusive and sustainable growth for women and men, not just in individual countries, but in the ASEAN region as a whole.
We also hope that this report will provide the basis for further policy dialogue and ideas that will advance social progress in the region.
Bindu N. LohaniVice-President
Knowledge Management and Sustainable Development
Asian Development Bank
Yoshiteru UramotoAssistant Director-General and
Regional Director,Asia and the Pacific Region
International Labour Organization
Foreword

ASEAN Community 2015: Managing integration for better jobs and shared prosperityi v
ASEAN Community 2015: Managing integration for better jobs and shared prosperity v
Foreword . . . . . . . . . . . . . . . . . . . . . . . . . . . . . . . . . . . . . . . . . . . . . . . . . . . . . . . . . . . . . . . . . . . . . . . . . . . . . . . . . . . . iii
Table of contents . . . . . . . . . . . . . . . . . . . . . . . . . . . . . . . . . . . . . . . . . . . . . . . . . . . . . . . . . . . . . . . . . . . . . . . . . . . . . . . . . v
List of tables . . . . . . . . . . . . . . . . . . . . . . . . . . . . . . . . . . . . . . . . . . . . . . . . . . . . . . . . . . . . . . . . . . . . . . . . . . . . . . . . . . . vii
List of figures . . . . . . . . . . . . . . . . . . . . . . . . . . . . . . . . . . . . . . . . . . . . . . . . . . . . . . . . . . . . . . . . . . . . . . . . . . . . . . . . . . vii
List of boxes . . . . . . . . . . . . . . . . . . . . . . . . . . . . . . . . . . . . . . . . . . . . . . . . . . . . . . . . . . . . . . . . . . . . . . . . . . . . . . . . . . .viii
Acknowledgements . . . . . . . . . . . . . . . . . . . . . . . . . . . . . . . . . . . . . . . . . . . . . . . . . . . . . . . . . . . . . . . . . . . . . . . . . . . . . . ix
Executive summary . . . . . . . . . . . . . . . . . . . . . . . . . . . . . . . . . . . . . . . . . . . . . . . . . . . . . . . . . . . . . . . . . . . . . . . . . . . . . . xi
Abbreviations . . . . . . . . . . . . . . . . . . . . . . . . . . . . . . . . . . . . . . . . . . . . . . . . . . . . . . . . . . . . . . . . . . . . . . . . . . . . . . . . . . xv
Chapter 1 ASEAN integration in the global context . . . . . . . . . . . . . . . . . . . . . . . . . . . . . . . . . . . . . . . . . . . . . . . . . . . . .1
The ASEAN Economic Community . . . . . . . . . . . . . . . . . . . . . . . . . . . . . . . . . . . . . . . . . . . . . . . . . . . . . . . . . .1
Economic progress . . . . . . . . . . . . . . . . . . . . . . . . . . . . . . . . . . . . . . . . . . . . . . . . . . . . . . . . . . . . . . . . . . . . . .2
The social context . . . . . . . . . . . . . . . . . . . . . . . . . . . . . . . . . . . . . . . . . . . . . . . . . . . . . . . . . . . . . . . . . . . . . . .5
Demographic trends . . . . . . . . . . . . . . . . . . . . . . . . . . . . . . . . . . . . . . . . . . . . . . . . . . . . . . . . . . . . . . . . . . . . .7
The labour market . . . . . . . . . . . . . . . . . . . . . . . . . . . . . . . . . . . . . . . . . . . . . . . . . . . . . . . . . . . . . . . . . . . . . . .8
Employment trends . . . . . . . . . . . . . . . . . . . . . . . . . . . . . . . . . . . . . . . . . . . . . . . . . . . . . . . . . . . . . . . . . . . . . .9
Social protection . . . . . . . . . . . . . . . . . . . . . . . . . . . . . . . . . . . . . . . . . . . . . . . . . . . . . . . . . . . . . . . . . . . . . . .12
Labour standards . . . . . . . . . . . . . . . . . . . . . . . . . . . . . . . . . . . . . . . . . . . . . . . . . . . . . . . . . . . . . . . . . . . . . .13
Conclusion . . . . . . . . . . . . . . . . . . . . . . . . . . . . . . . . . . . . . . . . . . . . . . . . . . . . . . . . . . . . . . . . . . . . . . . . . . .15
Chapter 2 Connecting across borders . . . . . . . . . . . . . . . . . . . . . . . . . . . . . . . . . . . . . . . . . . . . . . . . . . . . . . . . . . . . . . .17
Building physical connectivity . . . . . . . . . . . . . . . . . . . . . . . . . . . . . . . . . . . . . . . . . . . . . . . . . . . . . . . . . . . . .17
ASEAN+ and other major trade agreements . . . . . . . . . . . . . . . . . . . . . . . . . . . . . . . . . . . . . . . . . . . . . . . . . . .19
Non-ASEAN subregional initiatives . . . . . . . . . . . . . . . . . . . . . . . . . . . . . . . . . . . . . . . . . . . . . . . . . . . . . . . . .22
Singapore-Johor-Riau Triangle . . . . . . . . . . . . . . . . . . . . . . . . . . . . . . . . . . . . . . . . . . . . . . . . . . . . . . . . . . . . .23
Greater Mekong Subregion . . . . . . . . . . . . . . . . . . . . . . . . . . . . . . . . . . . . . . . . . . . . . . . . . . . . . . . . . . . . . . .23
Indonesia-Malaysia-Thailand Growth Triangle . . . . . . . . . . . . . . . . . . . . . . . . . . . . . . . . . . . . . . . . . . . . . . . . .26
Brunei Darussalam-Indonesia-Malaysia-Philippines East ASEAN Growth Area . . . . . . . . . . . . . . . . . . . . . . . . .27
Conclusion . . . . . . . . . . . . . . . . . . . . . . . . . . . . . . . . . . . . . . . . . . . . . . . . . . . . . . . . . . . . . . . . . . . . . . . . . . .28
Chapter 3 Managing structural change for decent jobs. . . . . . . . . . . . . . . . . . . . . . . . . . . . . . . . . . . . . . . . . . . . . . . . . .31
The changing structure of employment . . . . . . . . . . . . . . . . . . . . . . . . . . . . . . . . . . . . . . . . . . . . . . . . . . . . . .31
Impact of ASEAN trade integration on labour markets . . . . . . . . . . . . . . . . . . . . . . . . . . . . . . . . . . . . . . . . . . .39
ASEAN economic integration and occupational demand . . . . . . . . . . . . . . . . . . . . . . . . . . . . . . . . . . . . . . . . .48
Conclusion . . . . . . . . . . . . . . . . . . . . . . . . . . . . . . . . . . . . . . . . . . . . . . . . . . . . . . . . . . . . . . . . . . . . . . . . . . .48
Chapter 4 Moving up the skills ladder . . . . . . . . . . . . . . . . . . . . . . . . . . . . . . . . . . . . . . . . . . . . . . . . . . . . . . . . . . . . . .51
Skill-intensive economies . . . . . . . . . . . . . . . . . . . . . . . . . . . . . . . . . . . . . . . . . . . . . . . . . . . . . . . . . . . . . . . .52
The demand for diverse skills . . . . . . . . . . . . . . . . . . . . . . . . . . . . . . . . . . . . . . . . . . . . . . . . . . . . . . . . . . . . .52
Sound education and training . . . . . . . . . . . . . . . . . . . . . . . . . . . . . . . . . . . . . . . . . . . . . . . . . . . . . . . . . . . . .54
Investing in education reform . . . . . . . . . . . . . . . . . . . . . . . . . . . . . . . . . . . . . . . . . . . . . . . . . . . . . . . . . . . . .58
From the classroom to the workplace . . . . . . . . . . . . . . . . . . . . . . . . . . . . . . . . . . . . . . . . . . . . . . . . . . . . . . .58
The skills gaps . . . . . . . . . . . . . . . . . . . . . . . . . . . . . . . . . . . . . . . . . . . . . . . . . . . . . . . . . . . . . . . . . . . . . . . .59
Addressing future demand . . . . . . . . . . . . . . . . . . . . . . . . . . . . . . . . . . . . . . . . . . . . . . . . . . . . . . . . . . . . . . .61
Aligning economic and workforce planning . . . . . . . . . . . . . . . . . . . . . . . . . . . . . . . . . . . . . . . . . . . . . . . . . . .62
Certifying skills . . . . . . . . . . . . . . . . . . . . . . . . . . . . . . . . . . . . . . . . . . . . . . . . . . . . . . . . . . . . . . . . . . . . . . . .63
Enhancing partnerships . . . . . . . . . . . . . . . . . . . . . . . . . . . . . . . . . . . . . . . . . . . . . . . . . . . . . . . . . . . . . . . . .63
Conclusion . . . . . . . . . . . . . . . . . . . . . . . . . . . . . . . . . . . . . . . . . . . . . . . . . . . . . . . . . . . . . . . . . . . . . . . . . . .64
Table of contents
ASEAN Community 2015: Managing integration for better jobs and shared prosperityv i
Chapter 5 Linking wages to productivity . . . . . . . . . . . . . . . . . . . . . . . . . . . . . . . . . . . . . . . . . . . . . . . . . . . . . . . . . . . . .65
Rising real wages . . . . . . . . . . . . . . . . . . . . . . . . . . . . . . . . . . . . . . . . . . . . . . . . . . . . . . . . . . . . . . . . . . . . . .65
Increasing productivity . . . . . . . . . . . . . . . . . . . . . . . . . . . . . . . . . . . . . . . . . . . . . . . . . . . . . . . . . . . . . . . . . .68
The transition to high-productivity economies . . . . . . . . . . . . . . . . . . . . . . . . . . . . . . . . . . . . . . . . . . . . . . . . .70
Strategies for higher productivity . . . . . . . . . . . . . . . . . . . . . . . . . . . . . . . . . . . . . . . . . . . . . . . . . . . . . . . . . . .70
Competing for skilled workers . . . . . . . . . . . . . . . . . . . . . . . . . . . . . . . . . . . . . . . . . . . . . . . . . . . . . . . . . . . . .72
Wage inequality . . . . . . . . . . . . . . . . . . . . . . . . . . . . . . . . . . . . . . . . . . . . . . . . . . . . . . . . . . . . . . . . . . . . . . . .73
The value of collective bargaining . . . . . . . . . . . . . . . . . . . . . . . . . . . . . . . . . . . . . . . . . . . . . . . . . . . . . . . . . .76
Setting minimum wages . . . . . . . . . . . . . . . . . . . . . . . . . . . . . . . . . . . . . . . . . . . . . . . . . . . . . . . . . . . . . . . . .77
How enterprises adapt to rising wages . . . . . . . . . . . . . . . . . . . . . . . . . . . . . . . . . . . . . . . . . . . . . . . . . . . . . . .79
Wages and economic growth . . . . . . . . . . . . . . . . . . . . . . . . . . . . . . . . . . . . . . . . . . . . . . . . . . . . . . . . . . . . . .80
Conclusion . . . . . . . . . . . . . . . . . . . . . . . . . . . . . . . . . . . . . . . . . . . . . . . . . . . . . . . . . . . . . . . . . . . . . . . . . . .81
Chapter 6 Reaping the benefits of labour mobility . . . . . . . . . . . . . . . . . . . . . . . . . . . . . . . . . . . . . . . . . . . . . . . . . . . . .83
The rise of intra-ASEAN migration . . . . . . . . . . . . . . . . . . . . . . . . . . . . . . . . . . . . . . . . . . . . . . . . . . . . . . . . . .83
Dynamics of labour migration in ASEAN . . . . . . . . . . . . . . . . . . . . . . . . . . . . . . . . . . . . . . . . . . . . . . . . . . . . .85
Structural causes of migration . . . . . . . . . . . . . . . . . . . . . . . . . . . . . . . . . . . . . . . . . . . . . . . . . . . . . . . . . . . . .86
Free mobility of professionals . . . . . . . . . . . . . . . . . . . . . . . . . . . . . . . . . . . . . . . . . . . . . . . . . . . . . . . . . . . . .89
Mobility of low-skilled workers . . . . . . . . . . . . . . . . . . . . . . . . . . . . . . . . . . . . . . . . . . . . . . . . . . . . . . . . . . . . .93
Protecting migrant workers . . . . . . . . . . . . . . . . . . . . . . . . . . . . . . . . . . . . . . . . . . . . . . . . . . . . . . . . . . . . . . .93
Ratifying and implementing international Conventions . . . . . . . . . . . . . . . . . . . . . . . . . . . . . . . . . . . . . . . . . . .96
Extending the coverage and portability of social security . . . . . . . . . . . . . . . . . . . . . . . . . . . . . . . . . . . . . . . . .96
Implementing the Cebu Declaration on Migrant Workers . . . . . . . . . . . . . . . . . . . . . . . . . . . . . . . . . . . . . . . . .99
Conclusion . . . . . . . . . . . . . . . . . . . . . . . . . . . . . . . . . . . . . . . . . . . . . . . . . . . . . . . . . . . . . . . . . . . . . . . . . . .99
Chapter 7 Policies for decent work in an integrated ASEAN . . . . . . . . . . . . . . . . . . . . . . . . . . . . . . . . . . . . . . . . . . . . .101
Main findings . . . . . . . . . . . . . . . . . . . . . . . . . . . . . . . . . . . . . . . . . . . . . . . . . . . . . . . . . . . . . . . . . . . . . . . .102
Priority actions . . . . . . . . . . . . . . . . . . . . . . . . . . . . . . . . . . . . . . . . . . . . . . . . . . . . . . . . . . . . . . . . . . . . . . .102
A. Facilitate and manage structural change. . . . . . . . . . . . . . . . . . . . . . . . . . . . . . . . . . . . . . . . . . . . . . . . . .102
B. Ensure that economic gains lead to shared prosperity. . . . . . . . . . . . . . . . . . . . . . . . . . . . . . . . . . . . . . . . .103
C. Strengthen regional cooperation . . . . . . . . . . . . . . . . . . . . . . . . . . . . . . . . . . . . . . . . . . . . . . . . . . . . . . . .104
Guiding principles . . . . . . . . . . . . . . . . . . . . . . . . . . . . . . . . . . . . . . . . . . . . . . . . . . . . . . . . . . . . . . . . . . . . .105
Annexes . . . . . . . . . . . . . . . . . . . . . . . . . . . . . . . . . . . . . . . . . . . . . . . . . . . . . . . . . . . . . . . . . . . . . . . . . . . . . . . . . . .107
Annex A: The CGE model . . . . . . . . . . . . . . . . . . . . . . . . . . . . . . . . . . . . . . . . . . . . . . . . . . . . . . . . . . . . . . .107
Annex B: Occupational Projections Model . . . . . . . . . . . . . . . . . . . . . . . . . . . . . . . . . . . . . . . . . . . . . . . . . . .113
Annex C: Survey of ASEAN employers . . . . . . . . . . . . . . . . . . . . . . . . . . . . . . . . . . . . . . . . . . . . . . . . . . . . . .114
Annex D: Using different bilateral migration estimates . . . . . . . . . . . . . . . . . . . . . . . . . . . . . . . . . . . . . . . . . .115
Annex E: Intra-ASEAN bilateral agreements on labour migration . . . . . . . . . . . . . . . . . . . . . . . . . . . . . . . . . .117
Annex F: Statistical tables and figures . . . . . . . . . . . . . . . . . . . . . . . . . . . . . . . . . . . . . . . . . . . . . . . . . . . . . .119
ASEAN Community 2015: Managing integration for better jobs and shared prosperity v i i
Table 1-1 Implementation of AEC Scorecard . . . . . . . . . . . . . . . . . . . . . . . . . . . . . . . . . . . . . . . . . . . . . . . . . . . . . . . . . .2
Table 1-2 Intra-ASEAN trade, 2012 ($ million and per cent) . . . . . . . . . . . . . . . . . . . . . . . . . . . . . . . . . . . . . . . . . . . . . .4
Table 1-3 Inequality in ASEAN, earliest year in 1990s and most recent year . . . . . . . . . . . . . . . . . . . . . . . . . . . . . . . . . .6
Table 1-4 Selected labour market indicators in ASEAN, most recent year . . . . . . . . . . . . . . . . . . . . . . . . . . . . . . . . . . . .8
Table 1-5 Ratification of core labour Conventions, year of ratification . . . . . . . . . . . . . . . . . . . . . . . . . . . . . . . . . . . . . . .14
Table 3-1 Ratio of labour productivity by subsector to that of agriculture, 2012 . . . . . . . . . . . . . . . . . . . . . . . . . . . . . . .32
Table 4-1 Selected education, training and literacy indicators, 2012 or most recent year (per cent) . . . . . . . . . . . . . . . .53
Table 4-2 Selected priority development sectors . . . . . . . . . . . . . . . . . . . . . . . . . . . . . . . . . . . . . . . . . . . . . . . . . . . . . .61
Table 5-1 Share of wage employees in total employment, 1993-2013 (per cent) . . . . . . . . . . . . . . . . . . . . . . . . . . . . . .66
Table 6-1 Employment in the seven occupations covered by ASEAN MRAs, various years . . . . . . . . . . . . . . . . . . . . . . .91
Table 6-2 Ratification of Conventions related to migrant workers . . . . . . . . . . . . . . . . . . . . . . . . . . . . . . . . . . . . . . . . . .95
Table 6-3 Coverage of migrant workers under social security by country and branch, 2014 . . . . . . . . . . . . . . . . . . . . . .98
Figure 1-1 FDI inflows to ASEAN and the world, 2006-12 (Index, 2006=100) . . . . . . . . . . . . . . . . . . . . . . . . . . . . . . . . . .4
Figure 1-2 Population by sex and age in ASEAN, 2010-25 (million) . . . . . . . . . . . . . . . . . . . . . . . . . . . . . . . . . . . . . . . . .7
Figure 1-3 Unemployment rate, total and youth, most recent year (per cent) . . . . . . . . . . . . . . . . . . . . . . . . . . . . . . . . . .9
Figure 1-4 Vulnerable employment as a share of total employment by sex, 2013 or most recent year (per cent) . . . . . . .10
Figure 1-5 Public social security expenditure, most recent year (per cent of GDP) . . . . . . . . . . . . . . . . . . . . . . . . . . . . .12
Figure 2-1 Shares of total trade volume between ASEAN and selected partner countries, 2000-12 (per cent) . . . . . . . . .18
Figure 2-2 Shares of inward net direct investment to ASEAN from selected partner countries, 2000-12 (per cent) . . . . .18
Figure 2-3 Inward and outward FDI of China and ASEAN, 1983-2012 ($ million) . . . . . . . . . . . . . . . . . . . . . . . . . . . . . .20
Figure 3-1 Employment by sector, 1992, 2003 and 2013 (per cent) . . . . . . . . . . . . . . . . . . . . . . . . . . . . . . . . . . . . . . . .32
Figure 3-2 Share of total manufacturing employment by subsector, various years (per cent) . . . . . . . . . . . . . . . . . . . . . .33
Figure 3-3 Share of vulnerable employment by subsector, various years (per cent) . . . . . . . . . . . . . . . . . . . . . . . . . . . . .35
Figure 3-4 Distribution of micro-enterprises and SMEs in Indonesia by sector, 2008 (per cent) . . . . . . . . . . . . . . . . . . . .36
Figure 3-5 Change in GDP under the AEC scenario relative to the baseline, 2010, 2020 and 2025 (per cent) . . . . . . . . .38
Figure 3-6 Change in consumption, investment, exports and imports under the AEC scenario relative to the baseline,
2025 (per cent) . . . . . . . . . . . . . . . . . . . . . . . . . . . . . . . . . . . . . . . . . . . . . . . . . . . . . . . . . . . . . . . . . . . . . .38
Figure 3-7 Change in employment under the AEC scenario relative to the baseline,
2025 (thousand and per cent of total employment) . . . . . . . . . . . . . . . . . . . . . . . . . . . . . . . . . . . . . . . . . . . .40
Figure 3-8 Vulnerable employment as a share of the additional job gains under the AEC scenario relative
to the baseline, 2025 (per cent) . . . . . . . . . . . . . . . . . . . . . . . . . . . . . . . . . . . . . . . . . . . . . . . . . . . . . . . . . .40
Figure 3-9 Change in employment by sector under the AEC scenario relative to the baseline, 2025 (thousand) . . . . . . . .42
Figure 3-10 Projected ten occupations with highest demand under the AEC scenario, by absolute change,
2010-25 (thousand) . . . . . . . . . . . . . . . . . . . . . . . . . . . . . . . . . . . . . . . . . . . . . . . . . . . . . . . . . . . . . . . . . . .46
Figure 3-11 Projected ten occupations with highest demand under the AEC scenario, by percentage change,
2010-25 (per cent) . . . . . . . . . . . . . . . . . . . . . . . . . . . . . . . . . . . . . . . . . . . . . . . . . . . . . . . . . . . . . . . . . . . .47
Figure 4-1 Share of high-skill and technology-intensive manufacturing in total manufacturing exports,
2000 and 2012 (per cent) and share of total ASEAN high-skill and technology-intensive
manufacturing export volume, 2012 (per cent) . . . . . . . . . . . . . . . . . . . . . . . . . . . . . . . . . . . . . . . . . . . . . . .52
Figure 4-2 Estimated change in employment by skill level, 2010–25 (thousand and per cent) . . . . . . . . . . . . . . . . . . . .53
Figure 4-3 Out-of-school children of primary school age, 2012 or most recent year (thousand and per cent) . . . . . . . . .54
Figure 4-4 Mean score in mathematics and science, PISA, 2012 . . . . . . . . . . . . . . . . . . . . . . . . . . . . . . . . . . . . . . . . . .57
List of tables
List of figures
ASEAN Community 2015: Managing integration for better jobs and shared prosperityv i i i
Box 1-1 The state of the AEC . . . . . . . . . . . . . . . . . . . . . . . . . . . . . . . . . . . . . . . . . . . . . . . . . . . . . . . . . . . . . . . . . . . .3
Box 1-2 The ILO and the Millennium Development Goals . . . . . . . . . . . . . . . . . . . . . . . . . . . . . . . . . . . . . . . . . . . . . .10
Box 1-3 Improving job quality through regional cooperation . . . . . . . . . . . . . . . . . . . . . . . . . . . . . . . . . . . . . . . . . . . .11
Box 1-4 Thailand’s universal health care system. . . . . . . . . . . . . . . . . . . . . . . . . . . . . . . . . . . . . . . . . . . . . . . . . . . . .13
Box 2-1 Myanmar’s opening will affect migration flows to Thailand . . . . . . . . . . . . . . . . . . . . . . . . . . . . . . . . . . . . . . .26
Box 3-1 Agricultural productivity and off-farm employment . . . . . . . . . . . . . . . . . . . . . . . . . . . . . . . . . . . . . . . . . . . . .34
Box 3-2 Strengthening capacities of SMEs to participate in global production chains . . . . . . . . . . . . . . . . . . . . . . . . .37
Box 3-3 Social protection floors . . . . . . . . . . . . . . . . . . . . . . . . . . . . . . . . . . . . . . . . . . . . . . . . . . . . . . . . . . . . . . . . .41
Box 3-4 The automobile industry in ASEAN . . . . . . . . . . . . . . . . . . . . . . . . . . . . . . . . . . . . . . . . . . . . . . . . . . . . . . . .43
Box 3-5 Industrial policy and the business process outsourcing sector in the Philippines . . . . . . . . . . . . . . . . . . . . . .45
Box 4-1 Advancing education and social policies in the Philippines . . . . . . . . . . . . . . . . . . . . . . . . . . . . . . . . . . . . . .55
Box 4-2 Strengthening technical and vocational education and training . . . . . . . . . . . . . . . . . . . . . . . . . . . . . . . . . . .56
Box 5-1 Productivity and wages in Thailand’s manufacturing sector . . . . . . . . . . . . . . . . . . . . . . . . . . . . . . . . . . . . . .68
Box 5-2 Expert views on wages, skills and competitiveness in ASEAN . . . . . . . . . . . . . . . . . . . . . . . . . . . . . . . . . . . . .73
Box 5-3 Wage inequality in Singapore and the Progressive Wage Model . . . . . . . . . . . . . . . . . . . . . . . . . . . . . . . . . . .75
Box 6-1 Indonesia: Rising formal employment for women migrants . . . . . . . . . . . . . . . . . . . . . . . . . . . . . . . . . . . . . .88
Box 6-2 Labour mobility under other regional integration agreements . . . . . . . . . . . . . . . . . . . . . . . . . . . . . . . . . . . . .90
Box 6-3 Thailand: Heading towards labour shortage - the need for more migrant workers . . . . . . . . . . . . . . . . . . . . . .92
Box 6-4 The Republic of Korea’s Employment Permit System . . . . . . . . . . . . . . . . . . . . . . . . . . . . . . . . . . . . . . . . . . .94
Box 6-5 Protecting migrant domestic workers in ASEAN . . . . . . . . . . . . . . . . . . . . . . . . . . . . . . . . . . . . . . . . . . . . . . .97
List of boxes
Figure 4-5 Share of respondents who agree that skills of secondary,
tertiary and vocational graduates match enterprise needs, 2013 (per cent) . . . . . . . . . . . . . . . . . . . . . . . . . .59
Figure 4-6 Estimated skills and educational mismatch in high-skill occupations, 2025 (thousand and per cent) . . . . . . .60
Figure 4-7 Private investment in staff training and ease of finding skilled employees . . . . . . . . . . . . . . . . . . . . . . . . . . . .64
Figure 5-1 Annual real wage growth in ASEAN, 2005-13 (per cent) . . . . . . . . . . . . . . . . . . . . . . . . . . . . . . . . . . . . . . . .66
Figure 5-2 Average monthly wages, 2012 ($) . . . . . . . . . . . . . . . . . . . . . . . . . . . . . . . . . . . . . . . . . . . . . . . . . . . . . . . . .67
Figure 5-3 Labour productivity and average monthly wages, 2012 or most recent year ($) . . . . . . . . . . . . . . . . . . . . . . .67
Figure 5-4 Growth of labour productivity and real average monthly wages in ASEAN, 2005-13 (Index, 2005=100) . . . . .70
Figure 5-5 Change in labour productivity under the AEC, 2010-25 (per cent) . . . . . . . . . . . . . . . . . . . . . . . . . . . . . . . . .71
Figure 5-6 Strategies to increase competitiveness by ASEAN enterprises, 2013 (responses in per cent) . . . . . . . . . . . . .71
Figure 5-7 Change in wages under the AEC scenario relative to the baseline, 2025 (per cent) . . . . . . . . . . . . . . . . . . . .72
Figure 5-8 Enterprise expectations on the impact of mobility on the wages of high-skilled workers,
2013 (responses in per cent) . . . . . . . . . . . . . . . . . . . . . . . . . . . . . . . . . . . . . . . . . . . . . . . . . . . . . . . . . . . .74
Figure 5-9 Wage dispersion, various years (P90/P10-ratio) . . . . . . . . . . . . . . . . . . . . . . . . . . . . . . . . . . . . . . . . . . . . . . .74
Figure 5-10 Monthly minimum wages, 2014 ($) . . . . . . . . . . . . . . . . . . . . . . . . . . . . . . . . . . . . . . . . . . . . . . . . . . . . . . . .78
Figure 5-11 Growth of the real minimum wage compared to labour productivity and average real wages in Thailand,
1995-2013 (Index, 1995=100) . . . . . . . . . . . . . . . . . . . . . . . . . . . . . . . . . . . . . . . . . . . . . . . . . . . . . . . . . . .79
Figure 5-12 Likely enterprise reactions to an increase of ten per cent in minimum wages, 2013 (responses in per cent) . .80
Figure 5-13 Contributions to additional GDP growth under the AEC scenario relative to the baseline,
2025 (percentage points of baseline GDP) . . . . . . . . . . . . . . . . . . . . . . . . . . . . . . . . . . . . . . . . . . . . . . . . . .81
Figure 6-1 Intra-ASEAN migration shares, 1990-2013 (per cent of total) . . . . . . . . . . . . . . . . . . . . . . . . . . . . . . . . . . . .84
Figure 6-2 Origins of international migrant stock in Singapore, Malaysia and Thailand, 2013 . . . . . . . . . . . . . . . . . . . . .84
Figure 6-3 Intra-ASEAN share of outflow of international migrant workers, 2006-12 (per cent of total) . . . . . . . . . . . . . . .85
Figure 6-4 Estimated share of those with lower than tertiary education among the stock of migrant workers
in Malaysia, Singapore, and Thailand, 2007 (per cent) . . . . . . . . . . . . . . . . . . . . . . . . . . . . . . . . . . . . . . . . .86
Figure 6-5 Annual inflow of migrant workers to Malaysia and Thailand by occupational skill level, 2007-12 (thousand) . .87
Figure 6-6 Projected labour force growth, 2010-15, 2015-20, and 2020-25 (per cent) . . . . . . . . . . . . . . . . . . . . . . . . . .87
ASEAN Community 2015: Managing integration for better jobs and shared prosperity i x
This report was prepared under the overall leadership of Yoshiteru Uramoto (ILO), Assistant Director-General and Regional Director for Asia and the Pacific, and Bindu N. Lohani (ADB), Vice-President for Knowledge Management and Sustainable Development.
At the ILO, Sukti Dasgupta provided technical coordination and led the core team consisting of David Cheong, Tite Habiyakare, Phu Huynh, Kee Beom Kim and Malte Luebker. Contributions and research assistance throughout the production of the report were provided by Fernanda Bárcia, Qayam Jetha, Marko Stermsek and Cuntao Xia.
At the ADB, Ramesh Subramaniam, Arjun Goswami and Myo Thant provided technical coordination and led the core team that also included Hector O. Florento and Maria Isabela Corpuz.
The chapters in this report were primarily prepared by
• Chapter1:DavidCheong,FernandaBárcia,MyoThantandMariaIsabelaCorpuz• Chapter2:MyoThantandHectorO.Florento• Chapter3:KeeBeomKim• Chapter4:PhuHuynh• Chapter5:MalteLuebker• Chapter6:SuktiDasgupta,MarkoStermsekandMyoThant• Conclusions:SuktiDasguptaandMyoThant
Tite Habiyakare (ILO) was responsible for the labour statistics compiled for this report, Jajoon Coue (ILO) advised on labour standards and Massimiliano la Marca (ILO) provided technical advice on economic modelling. The team is grateful to Sandra Polaski, ILO Deputy Director-General for Policy, and Alcestis Abrera-Mangahas, ILO Deputy Regional Director for Asia and the Pacific, for their guidance and support. The ILO Research Department, Geneva, prepared the statistical estimates of the ASEAN labour market used throughout the report. Their valuable collaboration is acknowledged.
We are grateful also to the ILO Strategic Programming and Management Department in Geneva and the ILO Regional Office for Asia and Pacific in Bangkok for providing financial support for the study.
The analysis in this report was supported by a number of background papers. In particular, we benefited from the expertise of Manolo Abella and Philip Martin (international labour migration), Monika Aring (skills development and competitiveness), Souleima El Achkar Hilal (occupational projections model), Emerging Markets Consulting (survey of ASEAN employers), Peter A. Petri, Michael G. Plummer and Fan Zhai (CGE model) and Chayanich Thamparipattra (international labour standards). Hui Weng Tat provided data on wage distribution in Singapore that was used in Chapter 5 of the report.
Various country studies on the impact of ASEAN integration were conducted by Kejian Gu and Qiao Zhang (China1), Institute of Labour Science and Social Affairs (Viet Nam), Poppy Ismalina, Muhammad
1 ADB recognizes “China” as the People’s Republic of China.
Acknowledgements
ASEAN Community 2015: Managing integration for better jobs and shared prosperityx
Ryan Sanjaya, Diyan Rasyieqa Khaeruddin, Rafiazka Hilman and Sari Wahyuni (Indonesia), Myanmar Development Resources Institute – Centre for Economic and Social Development and Myanmar Marketing Research and Development Company (Myanmar), Rajah Rasiah (Malaysia), Hitoshi Sato (Japan), Sunanda Sen (India), Kriengkrai Techakanont (Thailand) and Joseph T. Yap (the Philippines).
The report benefitted tremendously from a rigorous peer review process. We are grateful for comments and suggestions from our external peer reviewers, namely Sanchita Basu Das and Cassey Lee (Institute of Southeast Asian Studies, Singapore), Nobuya Haraguchi (UNIDO) and Zafiris Tzannatos (former Senior Advisor at the ILO).
The team of internal peer reviewers at the ILO included Pong-Sul Ahn, Emma Allen, Nilim Baruah, Maurizio Bussi, Jae-Hee Chang, Matthieu Cognac, Nelien Haspels, Manuel Imson, Jeff Johnson, Heike Lautenschlager, Ma. Lourdes Macapanpan, Steve Marshall, Makiko Matsumoto, Celine Peyron Bista, John Ritchotte, Wolfgang Schiefer, Valérie Schmitt, Gyorgy Sziraczki, Carmela Torres, Peter van Rooij and Sher Verick.
We gratefully acknowledge the support received from the Deputy Secretary-General of ASEAN, H.E. Alicia Dela Rosa Bala. Throughout the production of this report we received helpful suggestions from her and members of the ASEAN Secretariat, namely Kamal Mamat, Pitchaya Sirivunnabood, Dyah Kusumaningtyas, Mega Irena, and Ruri Narita Artiesa.
We are also grateful for the suggestions provided by the representatives of governments, and employers’ and workers’ organizations from the ten ASEAN Member States during a Tripartite Technical Consultation Workshop held in Bangkok in November 2013. Among many others, these includedSulistri Afrileston (Indonesia), Decy Arifinsjah (Indonesia), Terence Chong King Shan (Singapore), Sandra d’Amico (Cambodia), Vudthy Hou, (Cambodia), Solomon Joseph (Malaysia), Ronnie Maung Than Lwin (Myanmar), Inpeng Meunviseth (Lao People’s Democratic Republic), Leonardo Montemayor (the Philippines), Somsak Saengpao (Thailand), Hitoshi Sato (Japan), Diana M. Savitri (Indonesia), M.L. Puntrik Smiti (Thailand), Arkhom Termpittayapaisith (Thailand) and Chiam Tow Hui (Malaysia).
The study further benefitted from in-depth country consultations in Indonesia, Lao People’s Democratic Republic, Malaysia, Thailand and Viet Nam which were organized by respective ILO country offices. These consultations were led by Muji Handaya and Roostiawati (Indonesia), Baykham Khattiya (Lao People’s Democratic Republic), Mohd Sahar bin Darusman (Malaysia), M.L. Puntrik Smiti (Thailand) and Nguyen Thi Lan Huong (Viet Nam).
The draft study was presented at the ASEAN Labour Ministers’ Meeting (ALMM) and the Senior Labour Officials’Meeting (SLOM) inNayPyiTaw,Myanmar inMay2014.Comments and suggestions fromparticipants at both meetings are gratefully acknowledged.
The report was edited by Peter Stalker and the graphic design and layout were done by Masaki Matsumoto. From the ILO, Chanitda Wiwatchanon assisted with the publication process and Sophy Fisher advised on the communication strategy. Monrudee Sucharitakul provided administrative support throughout the production of the report.
Execu
tive sum
mary
ASEAN Community 2015: Managing integration for better jobs and shared prosperity x i
The ASEAN Economic Community (AEC) will create a single market and production base and new opportu-nities for prosperity for the region’s 600 million women and men…
Strong economic performance has made ASEAN one of the world’s most dynamic regions (Chapter 1). Since 2007, while annual average growth in the global economy has been 3.3 percent, in ASEAN it has been 5.1 per cent. This has boostedlivingstandards:between1991and2013,83millionworkersmovedoutofpovertyintothemiddle class. The region also has one of the world’s highest foreign investment inflows – attracted by its workforce of 300 million, growing consumermarkets and expanding networks of infrastructure.
Despite progress, challenges remain. In some countries, poverty persists and economic growth has been accompanied by rising disparities in income and opportunities. Too many workers are trapped in poor quality jobs. Approximately 179 millionworkers (or three in five) are in vulnerable employ-mentand92millionearntoolittletoescapepoverty.Securing decent employment is particularly difficult for young people and women. These labour market concerns are exacerbated by limited commitments to labour standards and social protection.
…but unless managed properly the AEC may add to existing labour market deficits and increase inequality
The AEC has the potential to accelerate growth – by increasing flows of trade and investment, enabling the freer movement of skilled workers, and by strengthening institutions. This will necessarily change the composition and distribution of jobs
across the region. Consequently, ASEAN Member States will face challenges related to job gains and losses, skills development, wages and productivity, labour migration and social protection systems. Addressing these key issues will help ensure that more women and men benefit from deeper integra-tion, and vulnerable groups are not left behind.
Building connectivity is key to the AEC vision of sustained growth and equitable development
Cross-border infrastructure has helped develop isolated areas and spread the economic benefits of integration more equitably (Chapter 2). Linking communities through physical networks facilitates the movement of goods, capital, labour and ideas and reduces overall transaction costs. Maximizing such benefits will require greater coordination among decision makers to provide the appropriate “hard” and “soft” infrastructure.
In this regard, previous integration agreements provide the momentum for further cooperation. A variety of subregional economic zones have emerged since the 1990s with the aim of transformingtransnational but contiguous areas into attractive economic platforms. In addition, ASEAN has a series of trade agreements with prominent Asian partners such as Australia, China, India, Japan, Republic of Korea and New Zealand. As a result of these initiatives, ASEAN is in a dominant position to drive economic integration further.
The AEC will accelerate the pace of structural change…
The AEC has significant potential to spur
Executive summary
Execu
tive sum
mary
ASEAN Community 2015: Managing integration for better jobs and shared prosperityx i i
structural change from lower- to higher-produc-tivity economic sectors (Chapter 3). Reaping thepotential benefits will depend on putting in place policies to manage this transformation, including employment policies for high-quality jobs, robust measures for social protection and support to smaller enterprises.
One ongoing structural change is a decline in the significance of agriculture – which accounts for 40.0 per cent of total employment, having beenovertaken by services at 40.6 per cent, with theremaining19.4percentaccountedforbyindustry.A challenge for some countries is that the bulk of job creation is taking place in sectors where levels of productivity are not significantly higher than in agriculture – and sometimes lower.
...and could generate 14 million additional jobs, but the gains will not be distributed evenly across countries or sectors, or between women and men
Model simulations suggest that implementa-tion of trade measures under the AEC could lead to a significant increase in output. By 2025, GDP in the ASEAN region could be higher relative to the baseline by 7.1 per cent, with the largest gains for lower-income ASEAN Member States. The model alsopointstoanetincreaseof14millionjobsinsixASEAN economies, accompanied by the expansion and decline of specific sectors. However, some of the expanding sectors, such as trade and transport and construction, are often associated with vulner-able employment and the informal economy.
Changes in the sectoral distribution of employ-ment in the region would lead to shifts in occupations that are in demand. The largest absolute demand will continue to be for low- and medium-skill jobs. Nevertheless the occupations projected to grow fastest in some economies are high skill.
Demand will increase rapidly for some skills, but decrease for others…
Chapter 4 examines employment growth forsix economies where the labour market impact is modelled in detail (Cambodia, Indonesia, Lao People’s Democratic Republic, Philippines, Thailand and Viet Nam). Overall, for these countries between 2010 and 2025, high-skill employment could grow by 41.0 per cent. Nearly one-half of those gainswould be in Indonesia. However, growth in low-skill employment could also remain strong – notably in Cambodia, Lao People’s Democratic Republic and Philippines – highlighting the continued importance of ensuring quality standards in basic education and training.
…which necessitates moving up the skills ladder and addressing skills gaps by strengthening education and training systems
Becoming a regional production centre driven by skills, innovation and creativity requires more relevant secondary and tertiary education and voca-tional training, particularly for young women and men from rural and poor households. Lacking job-related skills, too many young people face a difficult transition from the classroom to the workplace.
These challenges reflect broader skills shortages and mismatches throughout ASEAN. Employers are increasingly demanding a mix of technical competencies and core skills such as teamwork and communication. However, current trends indi-cate that by 2025 more than half of all high-skill employment in Cambodia, Indonesia, Lao People’s Democratic Republic, Philippines, Thailand and Viet Nam could be filled by workers with insufficient qualifications. Robust skills certification mecha-nisms and stronger partnerships with employers’ and workers’ organizations would also help ASEAN Member States to address these skills gaps.
At the same time, enterprises will need to attract and retain skilled workers by offering better wages to compete on the basis of higher productivity...
Execu
tive sum
mary
ASEAN Community 2015: Managing integration for better jobs and shared prosperity x i i i
When rising skills and productivity trans-late into higher wages, workers will want to spend their earnings – strengthening domestic demand and reducing the region’s dependency on exports (Chapter 5). Wages are also a key mechanism to ensure that growth translates into shared prosperity and equitable development. Across the ten ASEAN Member States, wages are now the main source of income for 117 million workers and their families. However, in many ASEAN Member States, while the purchasing power of wages has grown in recent years, the gaps between those at the bottom and at the top of the wage distribution have widened.
Furthermore, there are still large differences in wage levels between ASEAN Member States – ranging fromUS$119permonth inLaoPeople’sDemocratic Republic to $3,547 in Singapore.These partly reflect substantial differences in labour productivity. But in some instances, these produc-tivity gains have by-passed workers altogether.
…and stronger wage-setting institutions would help ensure that growth is inclusive and prosperity is shared
Model simulations indicate that between 2010 and 2025, productivity in a number of economies could double under the AEC. But past trends suggest that productivity increases do not translate into gains for everyone without stronger wage-set-ting institutions.
At present, in the private sector in most ASEAN Member States there is very little genuine collective bargaining between representative trade unions and employers. The main mechanism for setting wages has been the establishment of minimum wages – and if these are not adjusted regularly, industrial relations can erupt into conflict. To take due account of the interests of workers and employers alike, minimum wages should be assessed regularly through robust and evidence-based processes. By investing in their wage-setting institutions, ASEAN Member States
can counter rising inequality and encourage enter-prises to upgrade and enhance productivity.
Economic and demographic disparities are driving labour migration, which is primarily low-and medium-skilled...
Between1990and2013,intra-ASEANmigra-tion increased from 1.5 million to 6.5 million, with Malaysia, Singapore and Thailand emerging as major migration hubs (Chapter 6). Most migrant workers are low- and medium-skilled, and the main drivers are economic and demographic disparities among Member States. Some countries of origin have expanding youth populations, which places pressure on the labour market to create jobs and can lead to outmigration of young women and men. In the destination countries the demand for migrants has increased due to population ageing, which can lead to labour shortages.
…but the AEC’s provisions for free mobility of high-skilled workers are likely to have limited impact in the short term…
Although most of the region’s migrant workers are low- or medium-skilled, current AEC policies for managing migration are confined to high-skill occupations. These have established mutual recog-nition arrangements (MRAs) in eight occupational categories. But since these together account for a tiny share of total employment the AEC’s provisions on labour mobility may have limited short-term impact.
…requiring a focus on skills recognition, social protec-tion and safeguarding the rights of migrant workers
Migration of low- and medium-skilled workers is likely to continue and even increase. Policy makers could therefore make migration channels safer, and more manageable and transparent, by expanding the
Execu
tive sum
mary
ASEAN Community 2015: Managing integration for better jobs and shared prosperityx i v
scope of MRAs to encompass low- and medium-skilled workers, such as those in the construction, garment, fishing and plantation sectors.
If ASEAN Member States are to reap the benefits of labour mobility, they also will need to prioritizethreeothercriticalareas:ratifying,imple-menting and enforcing international Conventions; extending the coverage and portability of social security; and implementing the ASEAN Declaration on the Protection and Promotion of the Rights of Migrant Workers.
To realize the full potential of the AEC to deliver more and better jobs, decisive action is necessary, including better management of structural change…
As Chapter 7 highlights, Member States will need to facilitate and manage the structural change resulting from the AEC. These measures include enhancing industrial and sectoral poli-cies, supporting smaller enterprises, strengthening employment and skills policies and improving connectivity and infrastructure. At the same time, it is critical to build effective social protection systems, including for workers in vulnerable employment as well as for women and men who are at risk of losing their jobs and incomes as some economic sectors decline. This should start with the establishment of social protection floors.
…and ensuring that economic gains lead to shared prosperity…
Deeper regional integration offers immense economic prospects, but translating these gains into shared prosperity and equitable develop-ment requires robust labour market institutions. Governments can use these to make growth more inclusive and balanced. They can strengthen the productivity-wage link through appropriate mecha-nisms for minimum wage setting and collective bargaining, promote gender equality and youth
employment through access to skills training, and protect migrant workers and ensure their equal treatment.
…while also strengthening regional cooperation and tripartite dialogue
Realizing the potential of greater integration will require deeper regional partnerships. This includes implementing landmark ASEAN agreements such as the ASEAN Declaration on the Protection and Promotion of the Rights of Migrant Workers and the ASEAN Declaration on Strengthening Social Protection. Other priorities for regional cooperation include expanding mutual recognition arrange-ments, completing the ASEAN Qualifications Reference Framework and strengthening labour market information and analysis to help monitor the impact of the AEC on labour markets.
Such regional cooperation efforts will need to be consistent with national policies. Each Member State will need to identify the most appropriate sequence of policies for their own circumstances, while creating a level field for competition, such as through ratification of international labour standards.
Ultimately, the success of ASEAN regional integration will depend on how it affects the labour market – and therefore on how it improves the quality of life of women and men in the region.
ASEAN Community 2015: Managing integration for better jobs and shared prosperity x v
AANZFTA ASEAN-Australia-New Zealand Free Trade Area
ADB Asian Development Bank
AEC ASEAN Economic Community
AKFA ASEAN-Korea Free Trade Area
ALM ASEAN Labour Ministers
APSC ASEAN Political Security Community
AQRF ASEAN Qualifications Reference Framework
ASCC ASEAN Socio-Cultural Community
ASEAN Association of Southeast Asian Nations
ASEAN-6 Brunei Darussalam, Indonesia, Malaysia, Philippines, Singapore, and Thailand
BIMP-EAGA Brunei Darussalam-Indonesia-Malaysia-Philippines-East ASEAN Growth Area
BPO business process outsourcing
CAFTA China-ASEAN Free Trade Area
CARICOM Caribbean Community
CGE computable general equilibrium
CLMV Cambodia, Lao People’s Democratic Republic, Myanmar and Viet Nam
COMMIT Coordinated Mekong Ministerial Initiative against Trafficking
ECOWAS Economic Community of West African States
EPS Employment Permit System
FDI foreign direct investment
GDP gross domestic product
GMS Greater Mekong Subregion
IAI Initiative for ASEAN Integration
ICT information and communications technology
ILO International Labour Organization
IMT-GT Indonesia-Malaysia-Thailand Growth Triangle
ISCO International Standard Classification of Occupations
LFS labour force survey
Lao PDR Lao People’s Democratic Republic
MDGs Millennium Development Goals
Mercosur Common Market of the South
MNE multinational enterprise
MOU memorandum of understanding
MRA mutual recognition arrangement
NAFTA North American Free Trade Agreement
NGO non-governmental organization
Abbreviations
ASEAN Community 2015: Managing integration for better jobs and shared prosperityx v i
NWC National Wage Council / National Wages Council [of Singapore]
PISA Programme for International Student Assessment
PPP purchasing power parity
PWM Progressive Wage Model
RCEP Regional Comprehensive Economic Partnership
roro roll-on/roll-off
SADC Southern African Development Community
SIJORI Singapore-Johor-Riau
SME small and medium-sized enterprise
SRZ subregional economic zone
TPP Trans-Pacific Partnership
TVET technical and vocational education and training
UCS Universal Coverage Scheme
UNDG United Nations Development Group
UNESCO United Nations Educational, Scientific and Cultural Organization
WTO World Trade Organization
ASEAN Community 2015: Managing integration for better jobs and shared prosperity 1
1
AS
EA
N in
tegration in
the glob
al context
Strong economic performance has enabled all ten ASEAN Member States to achieve significantly higher living standards for its 600 million women and men. Nevertheless, pervasive vulnerability, gender disparities and high youth unemployment persist in the region’s labour markets. This contrasts with the overall purpose of the ASEAN Community to build a region with “sustained economic growth” accompanied by “lasting peace, security and stability as well as shared prosperity and social progress”. 1
An important part of the ASEAN Community vision is the establishment of a globally integrated and competitive single market and production base, built on the principles of equitable economic development and shared prosperity, through the ASEAN Economic Community (AEC).2 The AEC reflects the contemporary economic challenges that Member States face including building resilience to global economic volatility, maintaining
1 ASEAN Charter, Jakarta, Jan. 2008, chapter 1.
2 ASEAN Economic Community Blueprint, Singapore, Dec. 2007. The AEC represents one of three pillars of the ASEAN Community, in addition to the ASEAN Political-Security Community and the ASEAN Socio-Cultural Community.
competitiveness with the rise of China and India, promoting full and productive employment, and mitigating excessive inequality. However, ASEAN actions towards regional economic integration must not only respond to market-related changes in global and regional demand, investments, and supply chains. They must also constitute self-determined and coherent efforts in delivering on the social objectives of the ASEAN Community.
Whether or not the AEC accelerates social progress in the region will depend heavily on its labour market effects. The AEC will impact labour markets directly through the freer flow of skilled labour and indirectly through trade and investment liberalization measures. Increased openness will also have important implications for the structure of economies, jobs, skills, wages and labour mobility. Understanding this dynamic between the AEC and labour markets is critical in determining whether regional cooperation will benefit all women and men in ASEAN.
The ASEAN Economic Community The AEC is an ambitious effort at deep market
Over the past 50 years the economic landscape of Southeast Asia has been transformed
by rapid economic growth and demographic transitions. But countries in the region
have also been shaped by institutions for regional cooperation. The oldest and best
known is the Association of Southeast Asian Nations (ASEAN), which is now entering
a new era as it reaches a major milestone in 2015 – the formation of the ASEAN
Community.
ASEAN integration in the global context
ASEAN Community 2015: Managing integration for better jobs and shared prosperity2
1
AS
EA
N in
tegration in
the glob
al context
integration, characterized by the free flow of goods, services and investment, a freer flow of finan-cial capital, enhanced connectivity, and expanded opportunities for intra-regional labour migration. It can be seen as a significant step in the region’s post-1997 reorientation – away from traditionaleconomic partners, such as Japan, the United States and the European Union, and towards the region itself, as well as to emerging markets such as China and India.3
The current design of ASEAN regional economic cooperation has also been shaped by more recent global economic shocks, such as the collapse of the United States subprime mortgage market and the eurozone debt crisis. While ASEAN economies have weathered these storms, many of the world’s leading industrialized countries are struggling to shake off the effects of recession.
Each pillar of the ASEAN Community has a corresponding Blueprint that states the objectives and the planned actions to which Member States have committed. The Blueprint for the AEC is a binding Declaration containing 17 core elements and176priorityactionswhichrestonfourpillars:(i) a single market and production base; (ii) a highly competitive economic region; (iii) a region of equitable economic development; and (iv) a region fully integrated into the global economy.4 Economic integration, as envisioned in the AEC Blueprint, is not limited to liberalization of trade and investment, but is rather a comprehensive and multifaceted effort which addresses disparities within and between countries, intra- and inter-state
3 The inward orientation of ASEAN has been described asa response to external shocks and a strategy to increase resilience. SeeG.Chin: “Asian regionalism after the globalfinancial crisis”, in G. Capannelli and M. Kawai (eds.):The political economy of Asian regionalism (New York and London,Springer,2014),pp.39-58.For furtherdiscussionon increased ASEAN integration with China, see: K. Gu,and Q. Zhang: Prospects glimmer for China to be poised for CAFTA: Managing integration for shared prosperity and social progress, background paper prepared for ASEAN Community 2015: Managing integration for better jobs and shared prosperity (Bangkok, ILO, forthcoming).
4 ASEANEconomicBlueprint,Singapore,20Dec.2007.
infrastructure development, small and medium-sized enterprise development, as well as the mobility of skilled labour (Box 1-1). The AEC Blueprint also addresses new areas of regional economic integra-tion dealing with “behind-the-border” measures and domestic regulation.
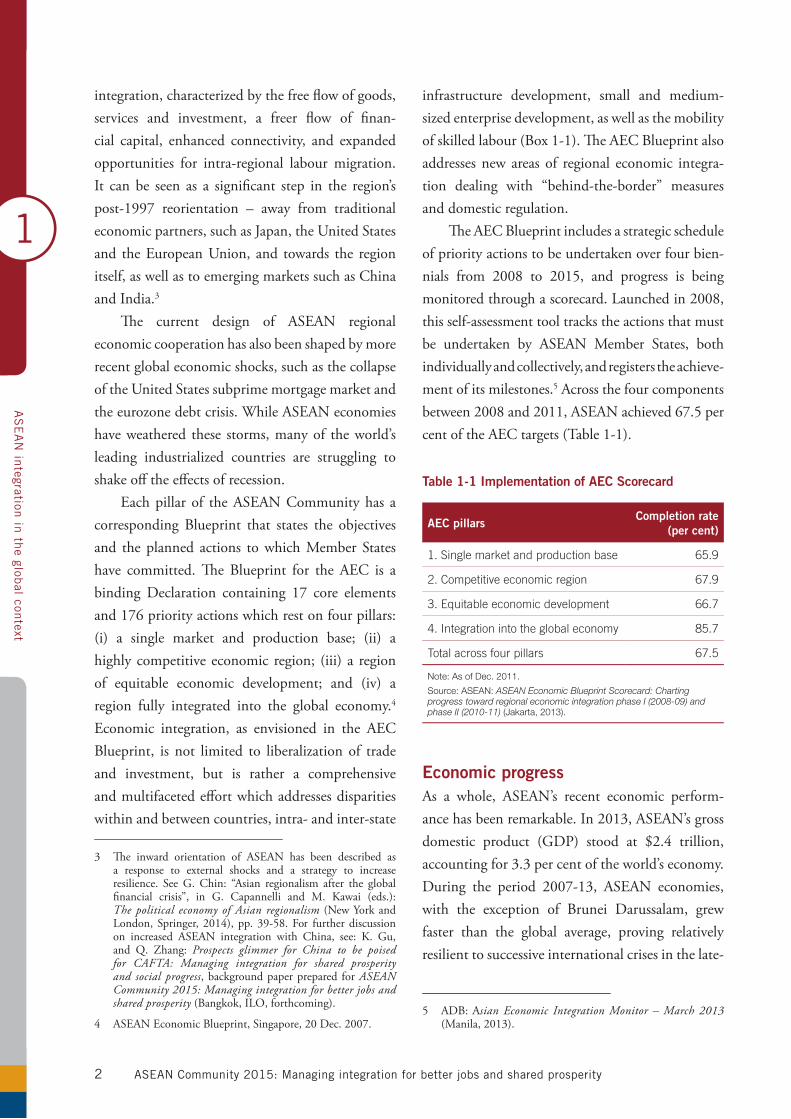
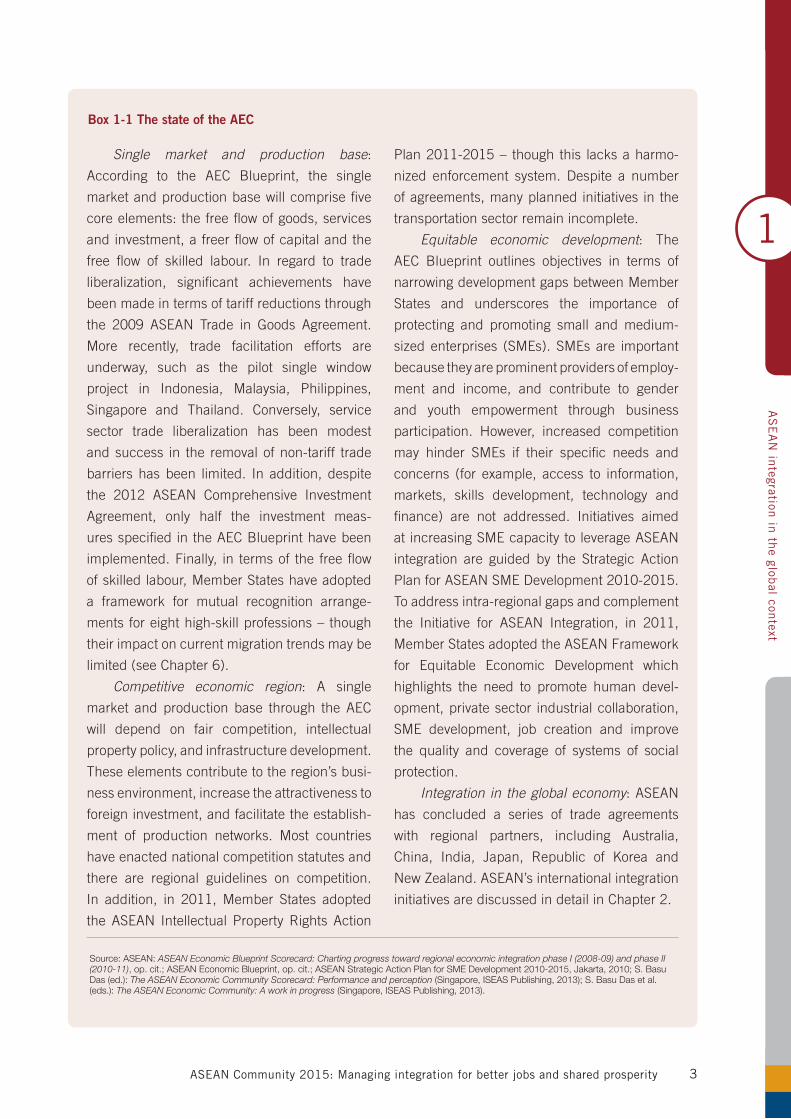
The AEC Blueprint includes a strategic schedule of priority actions to be undertaken over four bien-nials from 2008 to 2015, and progress is being monitored through a scorecard. Launched in 2008, this self-assessment tool tracks the actions that must be undertaken by ASEAN Member States, both individually and collectively, and registers the achieve-ment of its milestones.5 Across the four components between 2008 and 2011, ASEAN achieved 67.5 per cent of the AEC targets (Table 1-1).
Economic progressAs a whole, ASEAN’s recent economic perform-ancehasbeenremarkable.In2013,ASEAN’sgrossdomestic product (GDP) stood at $2.4 trillion,accountingfor3.3percentoftheworld’seconomy.During the period 2007-13, ASEAN economies,with the exception of Brunei Darussalam, grew faster than the global average, proving relatively resilient to successive international crises in the late-
5 ADB:Asian Economic Integration Monitor – March 2013 (Manila,2013).
Table 1-1 Implementation of AEC Scorecard
AEC pillarsCompletion rate
(per cent)
1. Single market and production base 65.9
2. Competitive economic region 67.9
3. Equitable economic development 66.7
4. Integration into the global economy 85.7
Total across four pillars 67.5
Note: As of Dec. 2011.
Source: ASEAN: ASEAN Economic Blueprint Scorecard: Charting progress toward regional economic integration phase I (2008-09) and phase II (2010-11) (Jakarta, 2013).
ASEAN Community 2015: Managing integration for better jobs and shared prosperity 3
1
AS
EA
N in
tegration in
the glob
al context
Single market and production base:
According to the AEC Blueprint, the single
market and production base will comprise five
core elements: the free flow of goods, services
and investment, a freer flow of capital and the
free flow of skilled labour. In regard to trade
liberalization, significant achievements have
been made in terms of tariff reductions through
the 2009 ASEAN Trade in Goods Agreement.
More recently, trade facilitation efforts are
underway, such as the pilot single window
project in Indonesia, Malaysia, Philippines,
Singapore and Thailand. Conversely, service
sector trade liberalization has been modest
and success in the removal of non-tariff trade
barriers has been limited. In addition, despite
the 2012 ASEAN Comprehensive Investment
Agreement, only half the investment meas-
ures specified in the AEC Blueprint have been
implemented. Finally, in terms of the free flow
of skilled labour, Member States have adopted
a framework for mutual recognition arrange-
ments for eight high-skill professions – though
their impact on current migration trends may be
limited (see Chapter 6).
Competitive economic region: A single
market and production base through the AEC
will depend on fair competition, intellectual
property policy, and infrastructure development.
These elements contribute to the region’s busi-
ness environment, increase the attractiveness to
foreign investment, and facilitate the establish-
ment of production networks. Most countries
have enacted national competition statutes and
there are regional guidelines on competition.
In addition, in 2011, Member States adopted
the ASEAN Intellectual Property Rights Action
Plan 2011-2015 – though this lacks a harmo-
nized enforcement system. Despite a number
of agreements, many planned initiatives in the
transportation sector remain incomplete.
Equitable economic development: The
AEC Blueprint outlines objectives in terms of
narrowing development gaps between Member
States and underscores the importance of
protecting and promoting small and medium-
sized enterprises (SMEs). SMEs are important
because they are prominent providers of employ-
ment and income, and contribute to gender
and youth empowerment through business
participation. However, increased competition
may hinder SMEs if their specific needs and
concerns (for example, access to information,
markets, skills development, technology and
finance) are not addressed. Initiatives aimed
at increasing SME capacity to leverage ASEAN
integration are guided by the Strategic Action
Plan for ASEAN SME Development 2010-2015.
To address intra-regional gaps and complement
the Initiative for ASEAN Integration, in 2011,
Member States adopted the ASEAN Framework
for Equitable Economic Development which
highlights the need to promote human devel-
opment, private sector industrial collaboration,
SME development, job creation and improve
the quality and coverage of systems of social
protection.
Integration in the global economy: ASEAN
has concluded a series of trade agreements
with regional partners, including Australia,
China, India, Japan, Republic of Korea and
New Zealand. ASEAN’s international integration
initiatives are discussed in detail in Chapter 2.
Source: ASEAN: ASEAN Economic Blueprint Scorecard: Charting progress toward regional economic integration phase I (2008-09) and phase II (2010-11), op. cit.; ASEAN Economic Blueprint, op. cit.; ASEAN Strategic Action Plan for SME Development 2010-2015, Jakarta, 2010; S. Basu Das (ed.): The ASEAN Economic Community Scorecard: Performance and perception (Singapore, ISEAS Publishing, 2013); S. Basu Das et al. (eds.): The ASEAN Economic Community: A work in progress (Singapore, ISEAS Publishing, 2013).
Box 1-1 The state of the AEC
ASEAN Community 2015: Managing integration for better jobs and shared prosperity4
1
AS
EA
N in
tegration in
the glob
al context
2000s. In 2013,GDP growth for theworld as awholewas3.0percent,butforASEANitwas4.9per cent.6
The recent lacklustre performance of the world’s largest economies – the European Union,
6 IMF:WorldEconomicOutlookDatabase,Apr.2014.
Japan and the United States – has encouraged ASEAN Member States to look for other markets, particularly in developing Asia. Between 2000 and 2012, the combined share of ASEAN total trade with the European Union and the United States fell from 29.8percentto17.9percent,whileChina’ssharerosefrom4.4percentto13.1percent.Moreover,
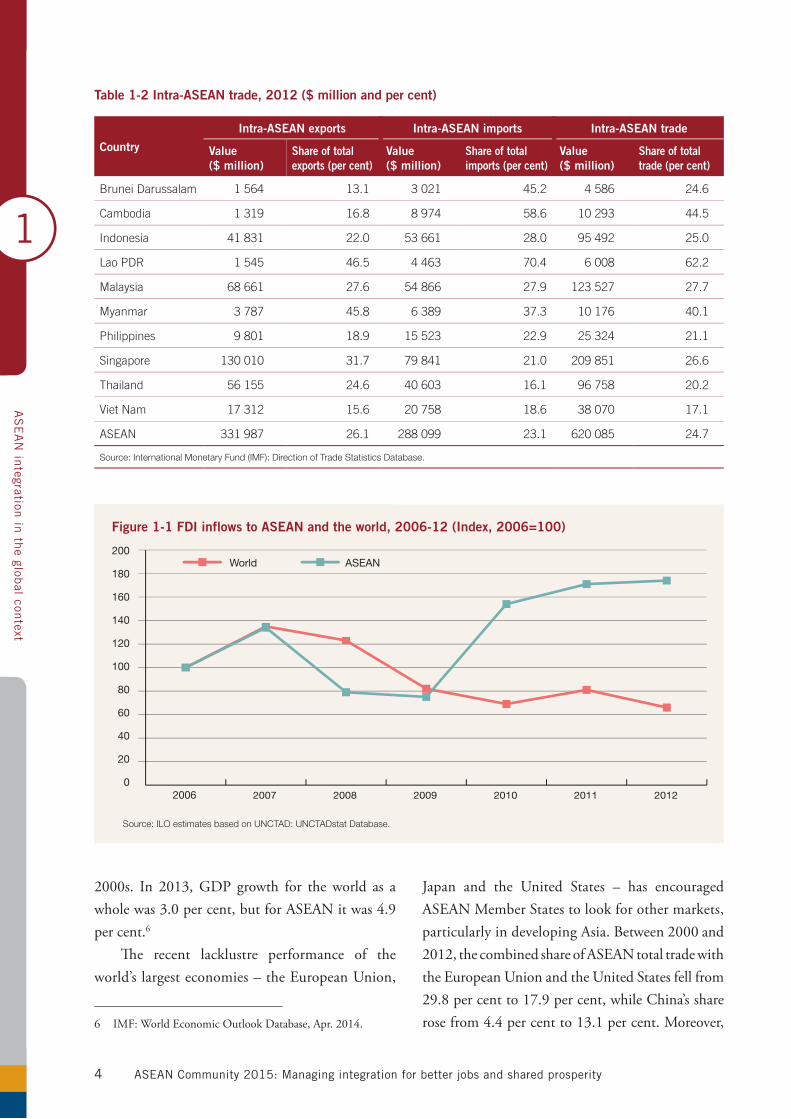
Table 1-2 Intra-ASEAN trade, 2012 ($ million and per cent)
Country
Intra-ASEAN exports Intra-ASEAN imports Intra-ASEAN trade
Value($ million)
Share of total exports (per cent)
Value($ million)
Share of total imports (per cent)
Value($ million)
Share of total trade (per cent)
Brunei Darussalam 1 564 13.1 3 021 45.2 4 586 24.6
Cambodia 1 319 16.8 8 974 58.6 10 293 44.5
Indonesia 41 831 22.0 53 661 28.0 95 492 25.0
Lao PDR 1 545 46.5 4 463 70.4 6 008 62.2
Malaysia 68 661 27.6 54 866 27.9 123 527 27.7
Myanmar 3 787 45.8 6 389 37.3 10 176 40.1
Philippines 9 801 18.9 15 523 22.9 25 324 21.1
Singapore 130 010 31.7 79 841 21.0 209 851 26.6
Thailand 56 155 24.6 40 603 16.1 96 758 20.2
Viet Nam 17 312 15.6 20 758 18.6 38 070 17.1
ASEAN 331 987 26.1 288 099 23.1 620 085 24.7
Source: International Monetary Fund (IMF): Direction of Trade Statistics Database.
Source: ILO estimates based on UNCTAD: UNCTADstat Database.
200
180
160
140
120
100
80
60
40
20
02006 2007 2008 2009 2010 2011 2012
Figure 1-1 FDI inflows to ASEAN and the world, 2006-12 (Index, 2006=100)
World ASEAN
ASEAN Community 2015: Managing integration for better jobs and shared prosperity 5
1
AS
EA
N in
tegration in
the glob
al context
while India’s share in 2012 was only 2.8 per cent it was still ASEAN’s ninth biggest trade partner. Table 1-2 shows that in 2012 intra-ASEAN trade as ashareofASEAN’stotaltradewas24.7percent–arise from 22.7 per cent in 2000. This is similar to the combined shares of other major trading part-ners:China,JapanandRepublicofKorea(29.0percent);theEuropeanUnionandUnitedStates(17.9per cent); and the rest of the world (25.6 per cent).7 Among ASEAN Member States, trade with other ASEAN partners was the most important for Lao People’s Democratic Republic but the least impor-tant for Viet Nam.
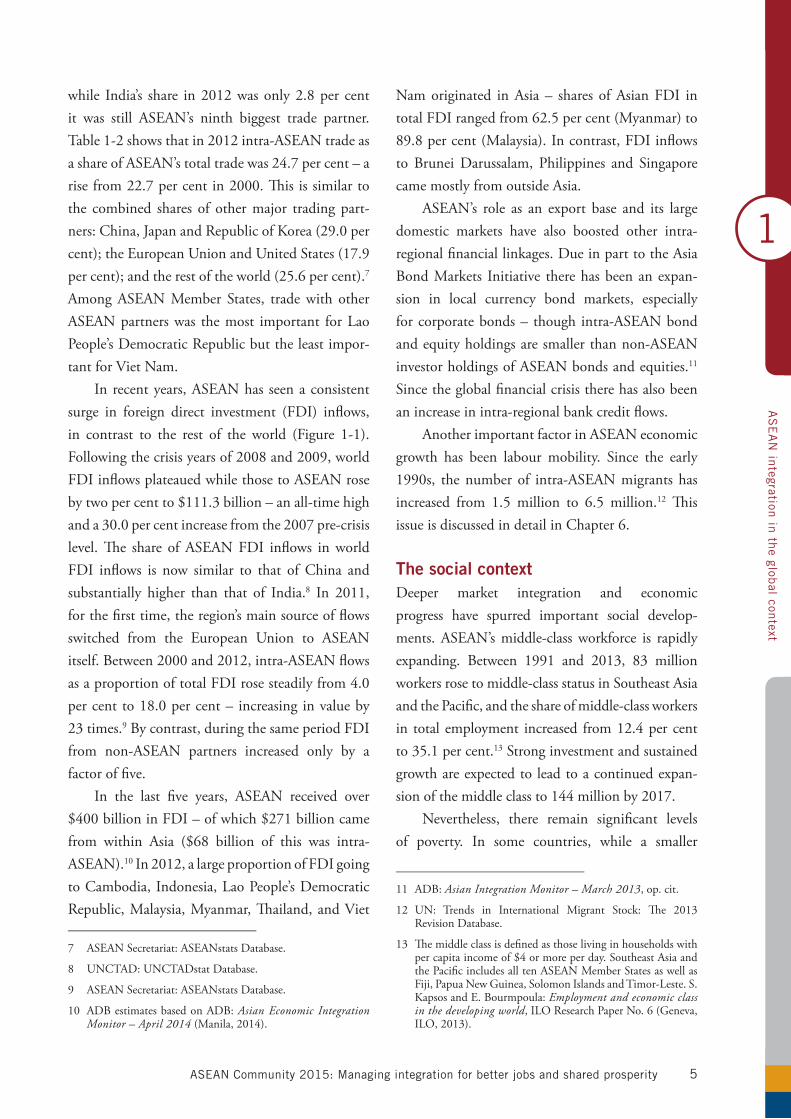
In recent years, ASEAN has seen a consistent surge in foreign direct investment (FDI) inflows, in contrast to the rest of the world (Figure 1-1). Followingthecrisisyearsof2008and2009,worldFDI inflows plateaued while those to ASEAN rose bytwopercentto$111.3billion–anall-timehighanda30.0percentincreasefromthe2007pre-crisislevel. The share of ASEAN FDI inflows in world FDI inflows is now similar to that of China and substantially higher than that of India.8 In 2011, for the first time, the region’s main source of flows switched from the European Union to ASEAN itself. Between 2000 and 2012, intra-ASEAN flows asaproportionoftotalFDIrosesteadilyfrom4.0per cent to 18.0 per cent – increasing in value by 23times.9 By contrast, during the same period FDI from non-ASEAN partners increased only by a factor of five.
In the last five years, ASEAN received over $400billioninFDI–ofwhich$271billioncamefrom within Asia ($68 billion of this was intra-ASEAN).10 In 2012, a large proportion of FDI going to Cambodia, Indonesia, Lao People’s Democratic Republic, Malaysia, Myanmar, Thailand, and Viet
7 ASEANSecretariat:ASEANstatsDatabase.
8 UNCTAD:UNCTADstatDatabase.
9 ASEANSecretariat:ASEANstatsDatabase.
10 ADBestimatesbasedonADB:Asian Economic Integration Monitor – April 2014(Manila,2014).
Nam originated in Asia – shares of Asian FDI in total FDI ranged from 62.5 per cent (Myanmar) to 89.8percent(Malaysia).Incontrast,FDIinflowsto Brunei Darussalam, Philippines and Singapore came mostly from outside Asia.
ASEAN’s role as an export base and its large domestic markets have also boosted other intra-regional financial linkages. Due in part to the Asia Bond Markets Initiative there has been an expan-sion in local currency bond markets, especially for corporate bonds – though intra-ASEAN bond and equity holdings are smaller than non-ASEAN investor holdings of ASEAN bonds and equities.11 Since the global financial crisis there has also been an increase in intra-regional bank credit flows.
Another important factor in ASEAN economic growth has been labour mobility. Since the early 1990s, thenumberof intra-ASEANmigrantshasincreased from 1.5 million to 6.5 million.12 This issue is discussed in detail in Chapter 6.
The social context Deeper market integration and economic progress have spurred important social develop-ments. ASEAN’s middle-class workforce is rapidly expanding. Between 1991 and 2013, 83 millionworkers rose to middle-class status in Southeast Asia and the Pacific, and the share of middle-class workers in total employment increased from12.4percentto35.1percent.13 Strong investment and sustained growth are expected to lead to a continued expan-sionofthemiddleclassto144millionby2017.
Nevertheless, there remain significant levels of poverty. In some countries, while a smaller
11 ADB:Asian Integration Monitor – March 2013, op. cit.
12 UN: Trends in International Migrant Stock: The 2013Revision Database.
13 The middle class is defined as those living in households with percapitaincomeof$4ormoreperday.SoutheastAsiaandthe Pacific includes all ten ASEAN Member States as well as Fiji, Papua New Guinea, Solomon Islands and Timor-Leste. S. KapsosandE.Bourmpoula:Employment and economic class in the developing world, ILO Research Paper No. 6 (Geneva, ILO,2013).
ASEAN Community 2015: Managing integration for better jobs and shared prosperity6
1
AS
EA
N in
tegration in
the glob
al context
proportion of the workforce is now living in poor households, their absolute numbers have risen. For instance, in Cambodia between 1994 and 2008the share of workers living on less than $2 per day declined from 75.3 per cent to 49.6 per cent oftotal employment, but the number of poor workers increased from3.3million to 3.7million. In thePhilippinesbetween1991 and2009, the shareoftheworkingpoorfellfrom50.0percentto37.2percent, but the number living on less than $2 per day rosefrom11.2to13million.Inaddition,therehasbeen an increase in both the share and the numbers of those living just above the poverty line, indicating that poverty alleviation gains may easily be reversed by sudden shocks and instability.
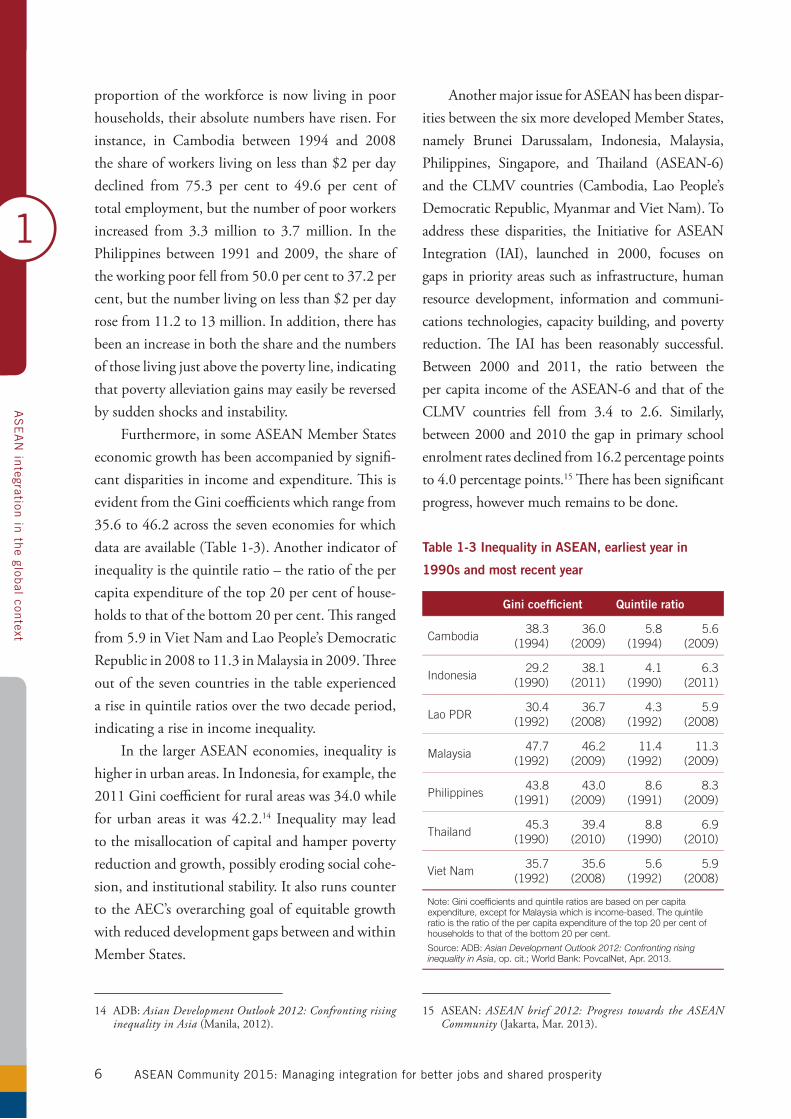
Furthermore, in some ASEAN Member States economic growth has been accompanied by signifi-cant disparities in income and expenditure. This is evident from the Gini coefficients which range from 35.6to46.2acrosstheseveneconomiesforwhichdataareavailable(Table1-3).Anotherindicatorofinequality is the quintile ratio – the ratio of the per capita expenditure of the top 20 per cent of house-holds to that of the bottom 20 per cent. This ranged from5.9inVietNamandLaoPeople’sDemocraticRepublicin2008to11.3inMalaysiain2009.Threeout of the seven countries in the table experienced a rise in quintile ratios over the two decade period, indicating a rise in income inequality.
In the larger ASEAN economies, inequality is higher in urban areas. In Indonesia, for example, the 2011Ginicoefficientforruralareaswas34.0whileforurbanareas itwas42.2.14 Inequality may lead to the misallocation of capital and hamper poverty reduction and growth, possibly eroding social cohe-sion, and institutional stability. It also runs counter to the AEC’s overarching goal of equitable growth with reduced development gaps between and within Member States.
14 ADB:Asian Development Outlook 2012: Confronting rising inequality in Asia (Manila, 2012).
Another major issue for ASEAN has been dispar-ities between the six more developed Member States, namely Brunei Darussalam, Indonesia, Malaysia, Philippines, Singapore, and Thailand (ASEAN-6) and the CLMV countries (Cambodia, Lao People’s Democratic Republic, Myanmar and Viet Nam). To address these disparities, the Initiative for ASEAN Integration (IAI), launched in 2000, focuses on gaps in priority areas such as infrastructure, human resource development, information and communi-cations technologies, capacity building, and poverty reduction. The IAI has been reasonably successful. Between 2000 and 2011, the ratio between the per capita income of the ASEAN-6 and that of the CLMV countries fell from 3.4 to 2.6. Similarly,between 2000 and 2010 the gap in primary school enrolment rates declined from 16.2 percentage points to4.0percentagepoints.15 There has been significant progress, however much remains to be done.
15 ASEAN:ASEAN brief 2012: Progress towards the ASEAN Community(Jakarta,Mar.2013).
Table 1-3 Inequality in ASEAN, earliest year in
1990s and most recent year
Gini coefficient Quintile ratio
Cambodia38.3
(1994)36.0
(2009)5.8
(1994)5.6
(2009)
Indonesia29.2
(1990)38.1
(2011)4.1
(1990)6.3
(2011)
Lao PDR30.4
(1992)36.7
(2008)4.3
(1992)5.9
(2008)
Malaysia47.7
(1992)46.2
(2009)11.4
(1992)11.3
(2009)
Philippines43.8
(1991)43.0
(2009)8.6
(1991)8.3
(2009)
Thailand45.3
(1990)39.4
(2010)8.8
(1990)6.9
(2010)
Viet Nam35.7
(1992)35.6
(2008)5.6
(1992)5.9
(2008)
Note: Gini coefficients and quintile ratios are based on per capita expenditure, except for Malaysia which is income-based. The quintile ratio is the ratio of the per capita expenditure of the top 20 per cent of households to that of the bottom 20 per cent.
Source: ADB: Asian Development Outlook 2012: Confronting rising inequality in Asia, op. cit.; World Bank: PovcalNet, Apr. 2013.
ASEAN Community 2015: Managing integration for better jobs and shared prosperity 7
1
AS
EA
N in
tegration in
the glob
al context
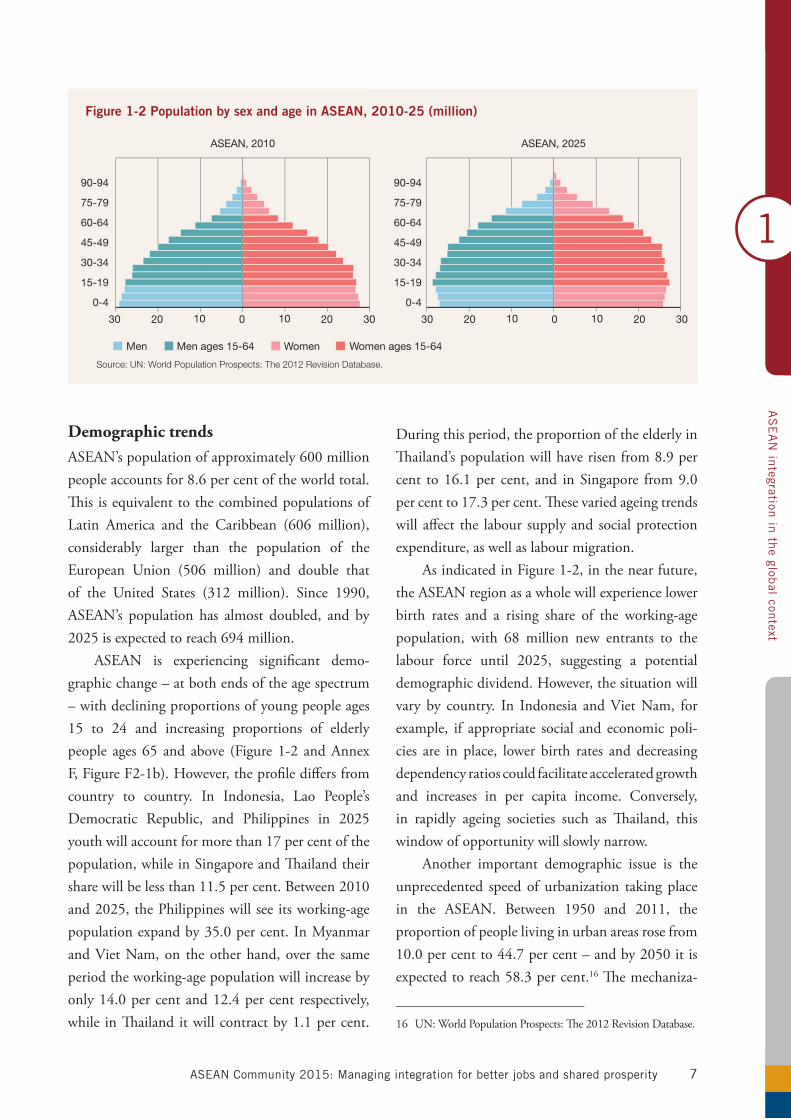
ASEAN’s population of approximately 600 million people accounts for 8.6 per cent of the world total. This is equivalent to the combined populations of Latin America and the Caribbean (606 million), considerably larger than the population of the European Union (506 million) and double that of the United States (312 million). Since 1990,ASEAN’s population has almost doubled, and by 2025isexpectedtoreach694million.
ASEAN is experiencing significant demo-graphic change – at both ends of the age spectrum – with declining proportions of young people ages 15 to 24 and increasing proportions of elderlypeople ages 65 and above (Figure 1-2 and Annex F, Figure F2-1b). However, the profile differs from country to country. In Indonesia, Lao People’s Democratic Republic, and Philippines in 2025 youth will account for more than 17 per cent of the population, while in Singapore and Thailand their share will be less than 11.5 per cent. Between 2010 and 2025, the Philippines will see its working-age populationexpandby35.0percent.InMyanmarand Viet Nam, on the other hand, over the same period the working-age population will increase by only14.0percentand12.4percent respectively,while in Thailand it will contract by 1.1 per cent.
During this period, the proportion of the elderly in Thailand’spopulationwillhaverisenfrom8.9percent to16.1per cent, and inSingapore from9.0percentto17.3percent.Thesevariedageingtrendswill affect the labour supply and social protection expenditure, as well as labour migration.
As indicated in Figure 1-2, in the near future, the ASEAN region as a whole will experience lower birth rates and a rising share of the working-age population, with 68 million new entrants to the labour force until 2025, suggesting a potential demographic dividend. However, the situation will vary by country. In Indonesia and Viet Nam, for example, if appropriate social and economic poli-cies are in place, lower birth rates and decreasing dependency ratios could facilitate accelerated growth and increases in per capita income. Conversely, in rapidly ageing societies such as Thailand, this window of opportunity will slowly narrow.
Another important demographic issue is the unprecedented speed of urbanization taking place in the ASEAN. Between 1950 and 2011, theproportion of people living in urban areas rose from 10.0percentto44.7percent–andby2050itisexpectedtoreach58.3percent.16 The mechaniza-
16 UN:WorldPopulationProspects:The2012RevisionDatabase.
Men Men ages 15-64 Women Women ages 15-64
Source: UN: World Population Prospects: The 2012 Revision Database.
Figure 1-2 Population by sex and age in ASEAN, 2010-25 (million)
90-94
75-79
60-64
45-49
30-34
15-19
0-4
90-94
75-79
60-64
45-49
30-34
15-19
0-4
ASEAN, 2010 ASEAN, 2025
010 1020 2030 30 010 1020 2030 30
Demographic trends
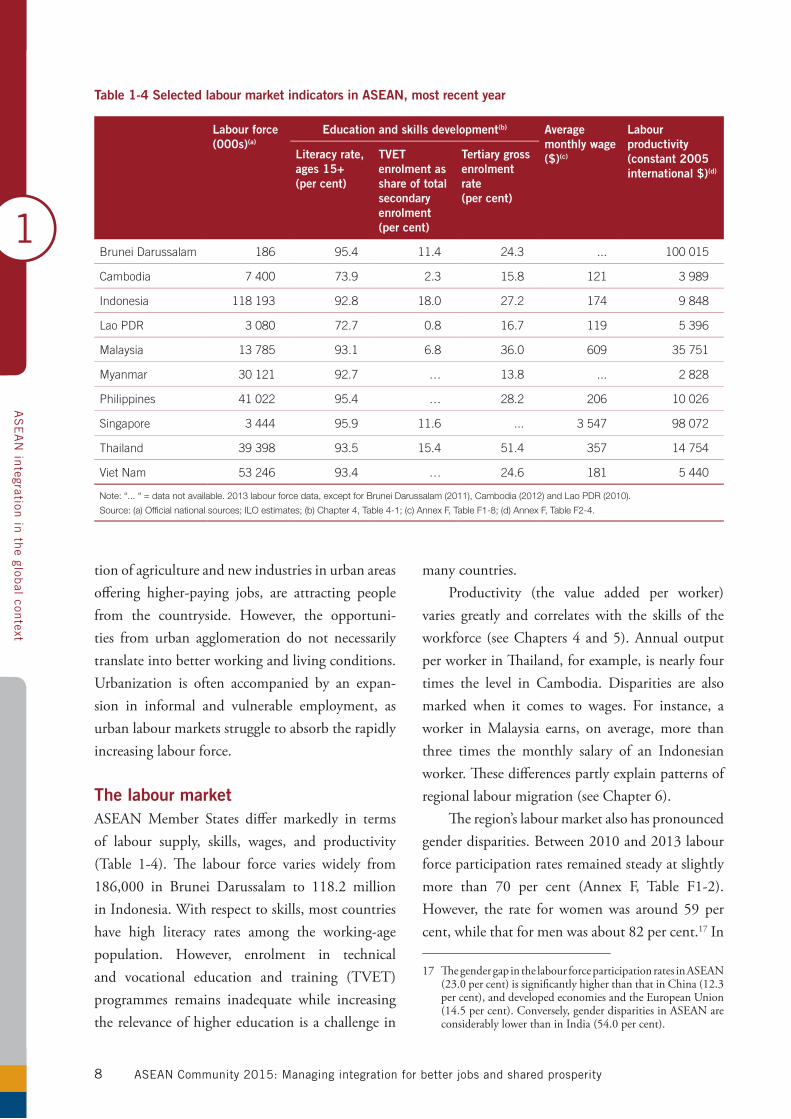
ASEAN Community 2015: Managing integration for better jobs and shared prosperity8
1
AS
EA
N in
tegration in
the glob
al context
tion of agriculture and new industries in urban areas offering higher-paying jobs, are attracting people from the countryside. However, the opportuni-ties from urban agglomeration do not necessarily translate into better working and living conditions. Urbanization is often accompanied by an expan-sion in informal and vulnerable employment, as urban labour markets struggle to absorb the rapidly increasing labour force.
The labour marketASEAN Member States differ markedly in terms of labour supply, skills, wages, and productivity (Table 1-4). The labour force varies widely from186,000 in Brunei Darussalam to 118.2 million in Indonesia. With respect to skills, most countries have high literacy rates among the working-age population. However, enrolment in technical and vocational education and training (TVET) programmes remains inadequate while increasing the relevance of higher education is a challenge in
many countries. Productivity (the value added per worker)
varies greatly and correlates with the skills of the workforce (seeChapters4and5).Annualoutputper worker in Thailand, for example, is nearly four times the level in Cambodia. Disparities are also marked when it comes to wages. For instance, a worker in Malaysia earns, on average, more than three times the monthly salary of an Indonesian worker. These differences partly explain patterns of regional labour migration (see Chapter 6).
The region’s labour market also has pronounced genderdisparities.Between2010and2013labourforce participation rates remained steady at slightly more than 70 per cent (Annex F, Table F1-2). However, the rate forwomenwas around 59 percent, while that for men was about 82 per cent.17 In
17 The gender gap in the labour force participation rates in ASEAN (23.0percent)issignificantlyhigherthanthatinChina(12.3per cent), and developed economies and the European Union (14.5percent).Conversely,genderdisparitiesinASEANareconsiderablylowerthaninIndia(54.0percent).
Table 1-4 Selected labour market indicators in ASEAN, most recent year
Labour force (000s)(a)
Education and skills development(b) Average monthly wage ($)(c)
Labour productivity (constant 2005 international $)(d)
Literacy rate, ages 15+ (per cent)
TVET enrolment as share of total secondary enrolment (per cent)
Tertiary gross enrolment rate(per cent)
Brunei Darussalam 186 95.4 11.4 24.3 ... 100 015
Cambodia 7 400 73.9 2.3 15.8 121 3 989
Indonesia 118 193 92.8 18.0 27.2 174 9 848
Lao PDR 3 080 72.7 0.8 16.7 119 5 396
Malaysia 13 785 93.1 6.8 36.0 609 35 751
Myanmar 30 121 92.7 … 13.8 ... 2 828
Philippines 41 022 95.4 … 28.2 206 10 026
Singapore 3 444 95.9 11.6 ... 3 547 98 072
Thailand 39 398 93.5 15.4 51.4 357 14 754
Viet Nam 53 246 93.4 … 24.6 181 5 440
Note: “... “ = data not available. 2013 labour force data, except for Brunei Darussalam (2011), Cambodia (2012) and Lao PDR (2010).
Source: (a) Official national sources; ILO estimates; (b) Chapter 4, Table 4-1; (c) Annex F, Table F1-8; (d) Annex F, Table F2-4.
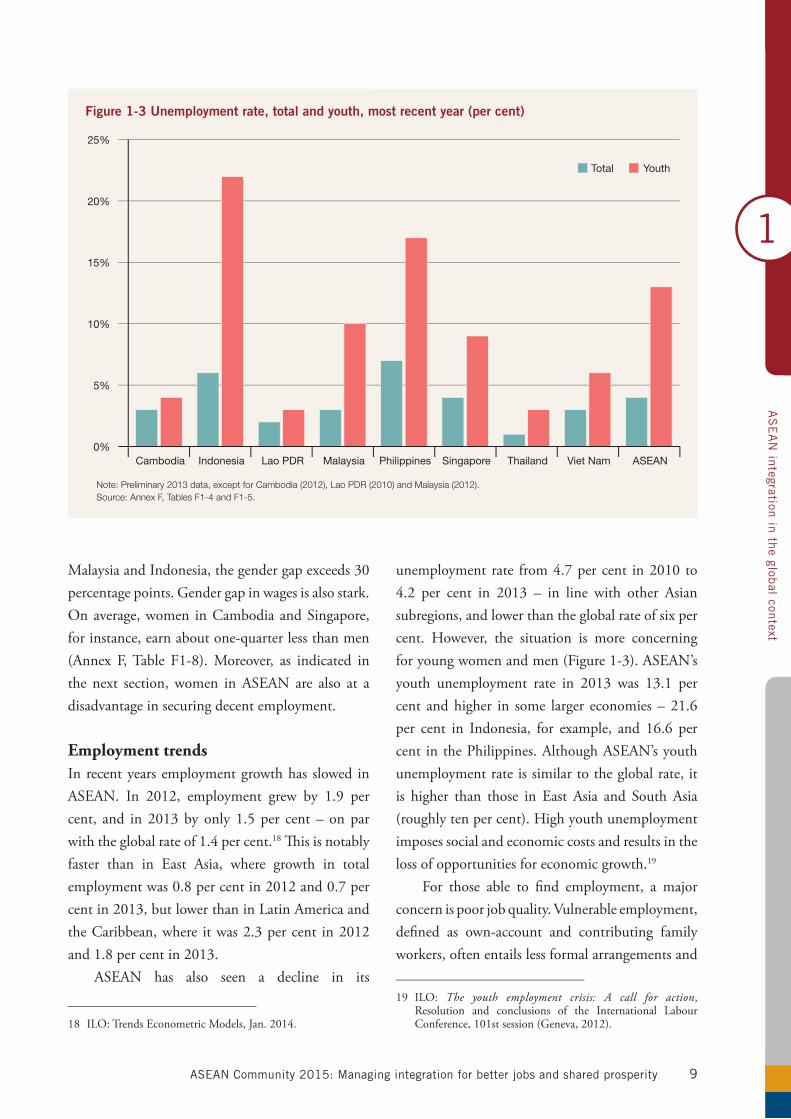
ASEAN Community 2015: Managing integration for better jobs and shared prosperity 9
1
AS
EA
N in
tegration in
the glob
al context
MalaysiaandIndonesia,thegendergapexceeds30percentage points. Gender gap in wages is also stark. On average, women in Cambodia and Singapore, for instance, earn about one-quarter less than men (Annex F, Table F1-8). Moreover, as indicated in the next section, women in ASEAN are also at a disadvantage in securing decent employment.
Employment trendsIn recent years employment growth has slowed in ASEAN. In 2012, employment grew by 1.9 percent, and in2013by only 1.5per cent – onparwiththeglobalrateof1.4percent.18 This is notably faster than in East Asia, where growth in total employment was 0.8 per cent in 2012 and 0.7 per centin2013,butlowerthaninLatinAmericaandtheCaribbean,where itwas2.3percent in2012and1.8percentin2013.
ASEAN has also seen a decline in its
18 ILO:TrendsEconometricModels,Jan.2014.
unemployment rate from4.7percent in2010to4.2 per cent in 2013 – in line with other Asiansubregions, and lower than the global rate of six per cent. However, the situation is more concerning foryoungwomenandmen(Figure1-3).ASEAN’syouth unemployment rate in 2013 was 13.1 percent and higher in some larger economies – 21.6 per cent in Indonesia, for example, and 16.6 per cent in the Philippines. Although ASEAN’s youth unemployment rate is similar to the global rate, it is higher than those in East Asia and South Asia (roughly ten per cent). High youth unemployment imposes social and economic costs and results in the loss of opportunities for economic growth.19
For those able to find employment, a major concern is poor job quality. Vulnerable employment, defined as own-account and contributing family workers, often entails less formal arrangements and
19 ILO: The youth employment crisis: A call for action, Resolution and conclusions of the International Labour Conference, 101st session (Geneva, 2012).
Note: Preliminary 2013 data, except for Cambodia (2012), Lao PDR (2010) and Malaysia (2012).Source: Annex F, Tables F1-4 and F1-5.
ASEAN
Figure 1-3 Unemployment rate, total and youth, most recent year (per cent)
Cambodia Indonesia Lao PDR Malaysia Philippines Singapore Thailand Viet Nam
Total Youth
0%
5%
10%
15%
20%
25%
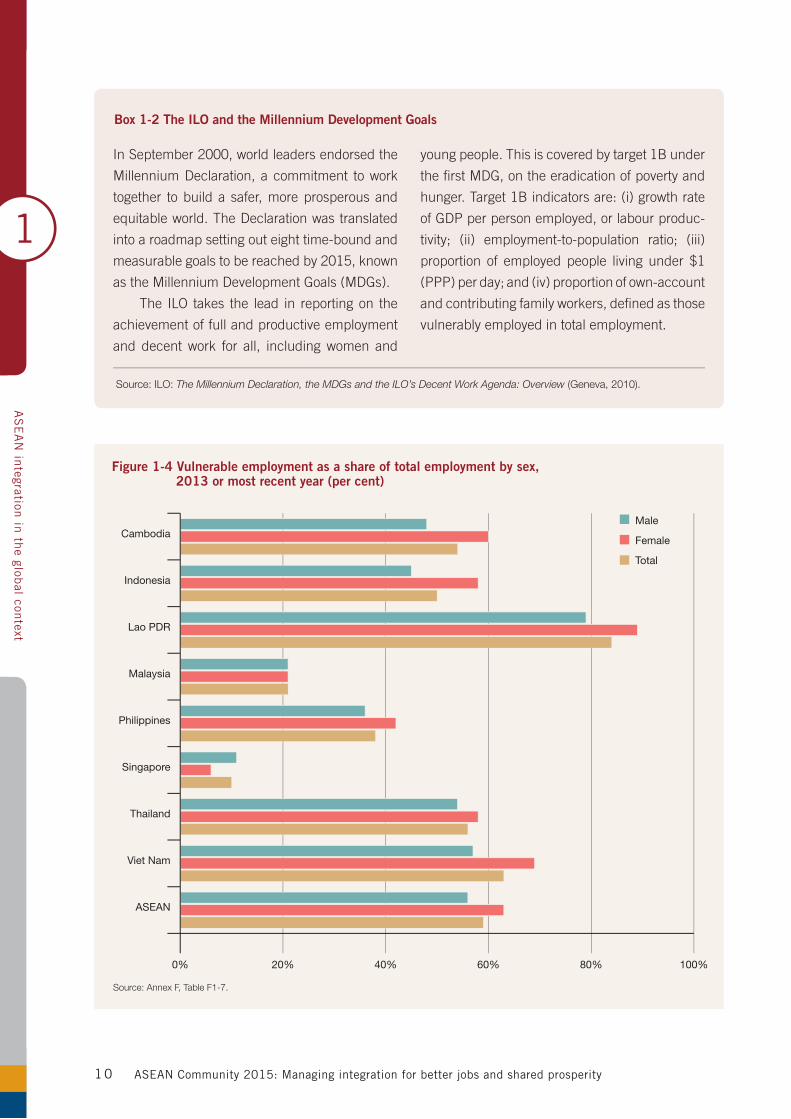
ASEAN Community 2015: Managing integration for better jobs and shared prosperity10
1
AS
EA
N in
tegration in
the glob
al context
In September 2000, world leaders endorsed the
Millennium Declaration, a commitment to work
together to build a safer, more prosperous and
equitable world. The Declaration was translated
into a roadmap setting out eight time-bound and
measurable goals to be reached by 2015, known
as the Millennium Development Goals (MDGs).
The ILO takes the lead in reporting on the
achievement of full and productive employment
and decent work for all, including women and
young people. This is covered by target 1B under
the first MDG, on the eradication of poverty and
hunger. Target 1B indicators are: (i) growth rate
of GDP per person employed, or labour produc-
tivity; (ii) employment-to-population ratio; (iii)
proportion of employed people living under $1
(PPP) per day; and (iv) proportion of own-account
and contributing family workers, defined as those
vulnerably employed in total employment.
Source: ILO: The Millennium Declaration, the MDGs and the ILO’s Decent Work Agenda: Overview (Geneva, 2010).
Box 1-2 The ILO and the Millennium Development Goals
Source: Annex F, Table F1-7.
Cambodia
Indonesia
Lao PDR
Malaysia
Philippines
Singapore
Thailand
Viet Nam
ASEAN
Figure 1-4 Vulnerable employment as a share of total employment by sex, 2013 or most recent year (per cent)
Male
Female
Total
0% 20% 40% 60% 80% 100%
ASEAN Community 2015: Managing integration for better jobs and shared prosperity 11
1
AS
EA
N in
tegration in
the glob
al context
Labour issues span all pillars of the ASEAN
Community. The labour components of the
ASEAN Socio-Cultural Community (ASCC) inter-
twine with and complement the AEC’s labour
ramifications. These components include
supporting decent work principles, ensuring
adequate protection for migrant workers, and
promoting investment in human resource and
skills upgrading, particularly of vulnerable
groups. Finally, labour issues in the ASEAN
Political-Security Community (APSC) include
the need to strengthen the criminal justice
response to trafficking persons and provide
better protection for victims of trafficking.
The ASEAN Labour Ministers’ Meeting leads
the work on regional cooperation on labour and
oversees labour-related initiatives to the AEC
and ASCC. According to the ASEAN Labour
Ministers’ (ALM) Work Programme 2010-2015,
regional cooperation in labour aims at better
equipping the labour force to benefit from and
cope with the challenges from economic inte-
gration. The work programme identifies the legal
protection of labour rights and working condi-
tions as a strategic priority, and underscores the
importance of workforce development, decent
employment opportunities and labour law,
among other areas.
In addition, ASEAN has adopted regional
Declarations in a series of critical areas. The
initiatives with labour market implications
include:
Bandar Seri Begawan Declaration on Youth
Entrepreneurship and Employment: Persistently
high youth unemployment has been a growing
concern and directly threatens the goals of
sustained growth, shared prosperity and equi-
table economic development of the ASEAN
Community. In response, Member States
adopted the Declaration at the 23rd ASEAN
Summit, which recognizes the need to secure
decent work and livelihood opportunities for
young women and men.
Declaration on the Protection and Promotion
of the Rights of Migrant Workers: In 2007,
Member States adopted the Declaration, which
determines that all countries should strengthen
the political, economic and social pillars of the
ASEAN Community by safeguarding the rights
of migrants in accordance with national laws
and regulations.
Declaration on Strengthening Social
Protection: In 2013 ASEAN leaders adopted the
Declaration, laying out concrete actions towards
improving the quality, coverage and sustain-
ability of social protection. The Declaration
also refers to the ILO Social Protection Floor
Recommendation, 2012 (No. 202), and the
universal right to social security. However, it is
important to note that the ILO Social Security
(Minimum Standards) Convention, 1952 (No.
102), has not yet been ratified by any ASEAN
Member State.
Statement on Human Resources and
Skills Development for Economic Recovery and
Sustainable Growth: Recognizing the impor-
tance of human resources and the current
global economic challenges, ASEAN leaders in
Ha Noi in 2010 adopted the Statement, which
stresses the need to foster technical coopera-
tion and capacity building to support the skill
development of workers.
Source: ASEAN Bandar Seri Begawan Declaration on Youth Entrepreneurship and Employment, Bandar Seri Begawan, Oct. 2013; ASEAN Declaration on Strengthening Social Protection, Bandar Seri Begawan, Oct. 2013; ASEAN Declaration on the Protection and Promotion of the Rights of Migrant Workers, Cebu, Jan. 2007; ASEAN Labour Ministers’ Work Programme, 2010-2015, Jakarta, Nov. 2013; ASEAN Leaders Statement on Human Resources and Skills Development for Economic Recovery and Sustainable Growth, Hanoi, Oct. 2010.
Box 1-3 Improving job quality through regional cooperation
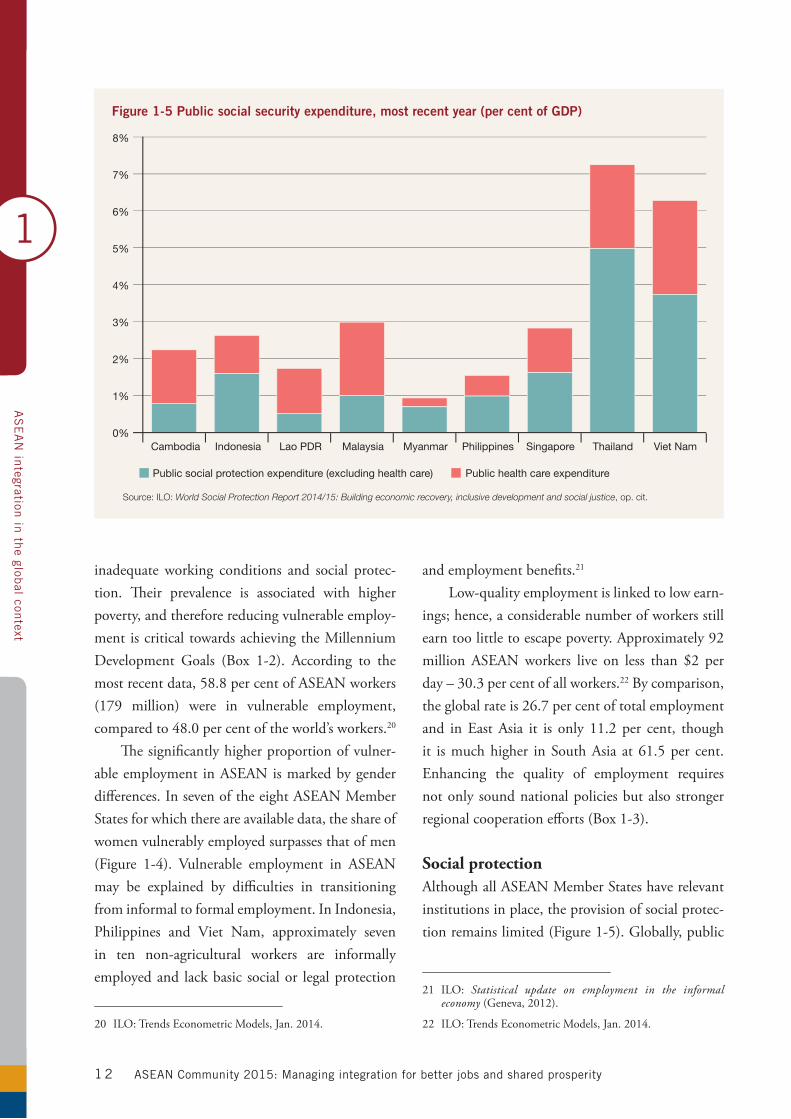
ASEAN Community 2015: Managing integration for better jobs and shared prosperity1 2
1
AS
EA
N in
tegration in
the glob
al context
inadequate working conditions and social protec-tion. Their prevalence is associated with higher poverty, and therefore reducing vulnerable employ-ment is critical towards achieving the Millennium Development Goals (Box 1-2). According to the most recent data, 58.8 per cent of ASEAN workers (179 million) were in vulnerable employment,comparedto48.0percentoftheworld’sworkers.20
The significantly higher proportion of vulner-able employment in ASEAN is marked by gender differences. In seven of the eight ASEAN Member States for which there are available data, the share of women vulnerably employed surpasses that of men (Figure 1-4). Vulnerable employment in ASEANmay be explained by difficulties in transitioning from informal to formal employment. In Indonesia, Philippines and Viet Nam, approximately seven in ten non-agricultural workers are informally employed and lack basic social or legal protection
20 ILO:TrendsEconometricModels,Jan.2014.
and employment benefits.21
Low-quality employment is linked to low earn-ings; hence, a considerable number of workers still earntoolittletoescapepoverty.Approximately92million ASEAN workers live on less than $2 per day–30.3percentofallworkers.22 By comparison, the global rate is 26.7 per cent of total employment and in East Asia it is only 11.2 per cent, though it is much higher in South Asia at 61.5 per cent. Enhancing the quality of employment requires not only sound national policies but also stronger regionalcooperationefforts(Box1-3).
Social protection Although all ASEAN Member States have relevant institutions in place, the provision of social protec-tion remains limited (Figure 1-5). Globally, public
21 ILO: Statistical update on employment in the informal economy (Geneva, 2012).
22 ILO:TrendsEconometricModels,Jan.2014.
Source: ILO: World Social Protection Report 2014/15: Building economic recovery, inclusive development and social justice, op. cit.
Myanmar
Figure 1-5 Public social security expenditure, most recent year (per cent of GDP)
Cambodia Indonesia Lao PDR Malaysia Philippines Singapore Thailand Viet Nam
Public social protection expenditure (excluding health care) Public health care expenditure
0%
1%
2%
3%
4%
5%
6%
7%
8%
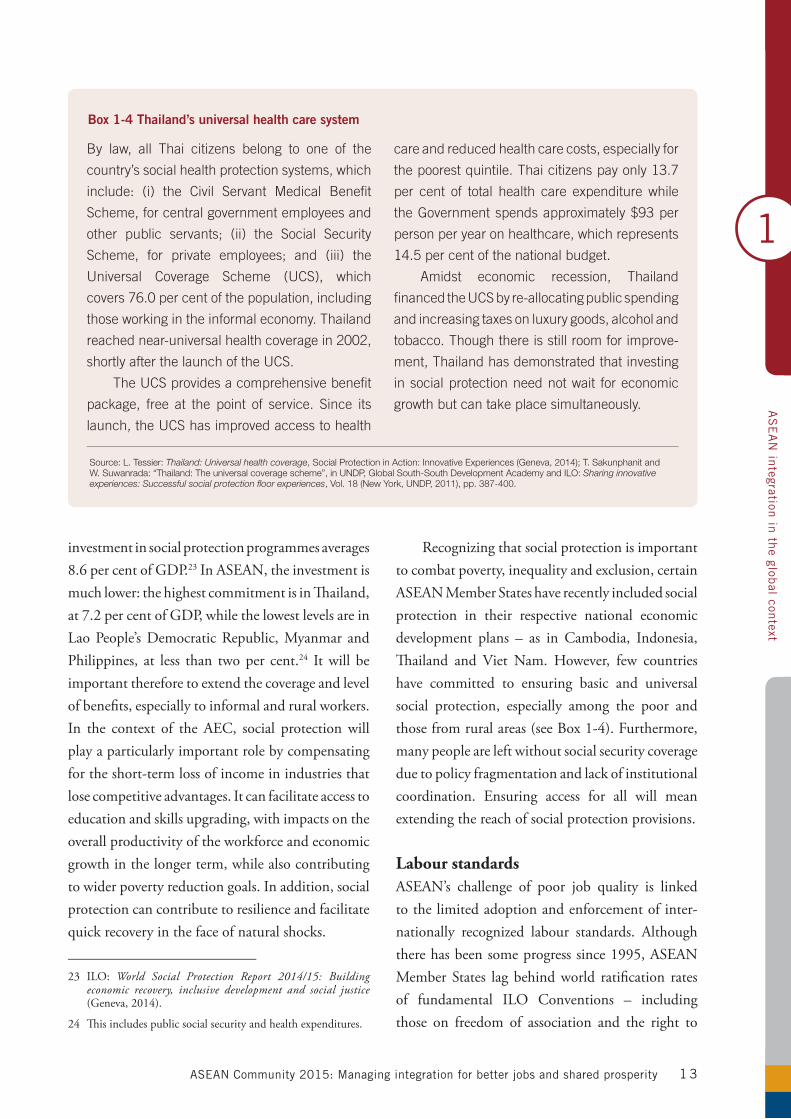
ASEAN Community 2015: Managing integration for better jobs and shared prosperity 1 3
1
AS
EA
N in
tegration in
the glob
al context
investment in social protection programmes averages 8.6 per cent of GDP.23 In ASEAN, the investment is muchlower:thehighestcommitmentisinThailand,at 7.2 per cent of GDP, while the lowest levels are in Lao People’s Democratic Republic, Myanmar and Philippines, at less than two per cent.24 It will be important therefore to extend the coverage and level of benefits, especially to informal and rural workers. In the context of the AEC, social protection will play a particularly important role by compensating for the short-term loss of income in industries that lose competitive advantages. It can facilitate access to education and skills upgrading, with impacts on the overall productivity of the workforce and economic growth in the longer term, while also contributing to wider poverty reduction goals. In addition, social protection can contribute to resilience and facilitate quick recovery in the face of natural shocks.
23 ILO: World Social Protection Report 2014/15: Building economic recovery, inclusive development and social justice (Geneva,2014).
24 This includes public social security and health expenditures.
Recognizing that social protection is important to combat poverty, inequality and exclusion, certain ASEAN Member States have recently included social protection in their respective national economic development plans – as in Cambodia, Indonesia, Thailand and Viet Nam. However, few countries have committed to ensuring basic and universal social protection, especially among the poor and thosefromruralareas(seeBox1-4).Furthermore,many people are left without social security coverage due to policy fragmentation and lack of institutional coordination. Ensuring access for all will mean extending the reach of social protection provisions.
Labour standardsASEAN’s challenge of poor job quality is linked to the limited adoption and enforcement of inter-nationally recognized labour standards. Although therehasbeensomeprogresssince1995,ASEANMember States lag behind world ratification rates of fundamental ILO Conventions – including those on freedom of association and the right to
By law, all Thai citizens belong to one of the
country’s social health protection systems, which
include: (i) the Civil Servant Medical Benefit
Scheme, for central government employees and
other public servants; (ii) the Social Security
Scheme, for private employees; and (iii) the
Universal Coverage Scheme (UCS), which
covers 76.0 per cent of the population, including
those working in the informal economy. Thailand
reached near-universal health coverage in 2002,
shortly after the launch of the UCS.
The UCS provides a comprehensive benefit
package, free at the point of service. Since its
launch, the UCS has improved access to health
care and reduced health care costs, especially for
the poorest quintile. Thai citizens pay only 13.7
per cent of total health care expenditure while
the Government spends approximately $93 per
person per year on healthcare, which represents
14.5 per cent of the national budget.
Amidst economic recession, Thailand
financed the UCS by re-allocating public spending
and increasing taxes on luxury goods, alcohol and
tobacco. Though there is still room for improve-
ment, Thailand has demonstrated that investing
in social protection need not wait for economic
growth but can take place simultaneously.
Source: L. Tessier: Thailand: Universal health coverage, Social Protection in Action: Innovative Experiences (Geneva, 2014); T. Sakunphanit and W. Suwanrada: “Thailand: The universal coverage scheme”, in UNDP, Global South-South Development Academy and ILO: Sharing innovative experiences: Successful social protection floor experiences, Vol. 18 (New York, UNDP, 2011), pp. 387-400.
Box 1-4 Thailand’s universal health care system
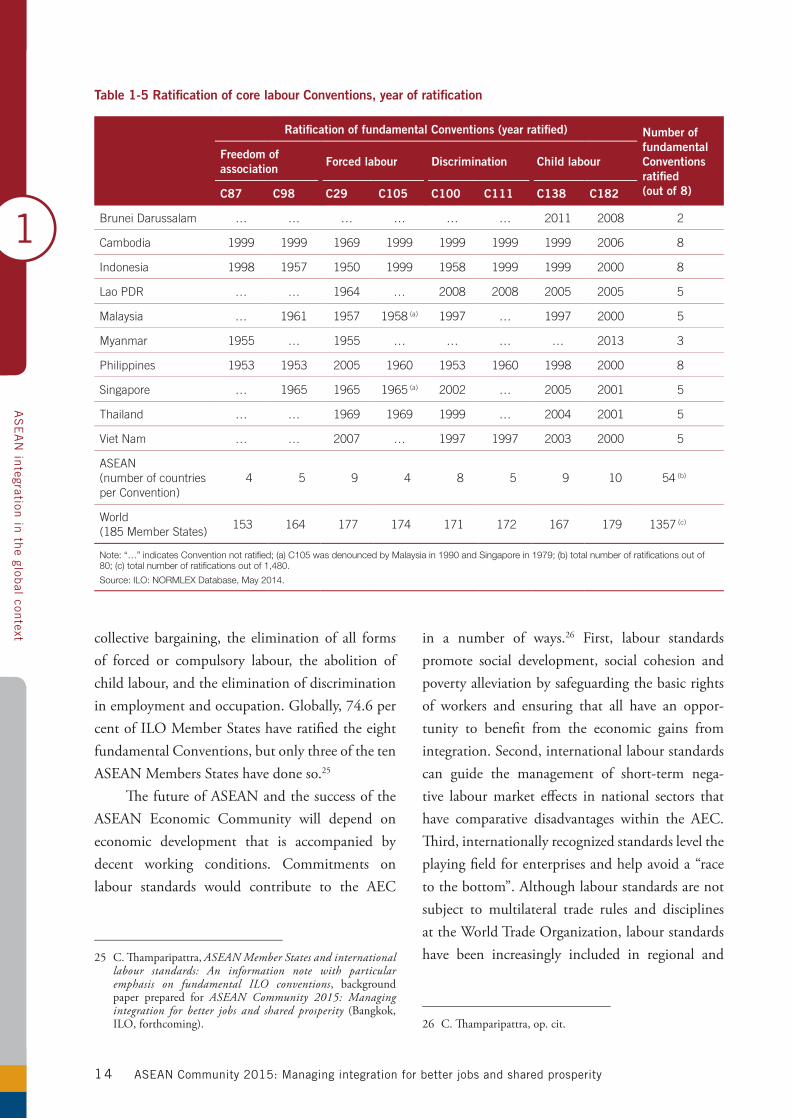
ASEAN Community 2015: Managing integration for better jobs and shared prosperity14
1
AS
EA
N in
tegration in
the glob
al context collective bargaining, the elimination of all forms
of forced or compulsory labour, the abolition of child labour, and the elimination of discrimination inemploymentandoccupation.Globally,74.6percent of ILO Member States have ratified the eight fundamental Conventions, but only three of the ten ASEAN Members States have done so.25
The future of ASEAN and the success of the ASEAN Economic Community will depend on economic development that is accompanied by decent working conditions. Commitments on labour standards would contribute to the AEC
25 C. Thamparipattra, ASEAN Member States and international labour standards: An information note with particular emphasis on fundamental ILO conventions, background paper prepared for ASEAN Community 2015: Managing integration for better jobs and shared prosperity (Bangkok, ILO, forthcoming).
in a number of ways.26 First, labour standards promote social development, social cohesion and poverty alleviation by safeguarding the basic rights of workers and ensuring that all have an oppor-tunity to benefit from the economic gains from integration. Second, international labour standards can guide the management of short-term nega-tive labour market effects in national sectors that have comparative disadvantages within the AEC. Third, internationally recognized standards level the playing field for enterprises and help avoid a “race to the bottom”. Although labour standards are not subject to multilateral trade rules and disciplines at the World Trade Organization, labour standards have been increasingly included in regional and
26 C. Thamparipattra, op. cit.
Table 1-5 Ratification of core labour Conventions, year of ratification
Ratification of fundamental Conventions (year ratified) Number of fundamental Conventions ratified(out of 8)
Freedom of association
Forced labour Discrimination Child labour
C87 C98 C29 C105 C100 C111 C138 C182
Brunei Darussalam … … … … … … 2011 2008 2
Cambodia 1999 1999 1969 1999 1999 1999 1999 2006 8
Indonesia 1998 1957 1950 1999 1958 1999 1999 2000 8
Lao PDR … … 1964 … 2008 2008 2005 2005 5
Malaysia … 1961 1957 1958 (a) 1997 … 1997 2000 5
Myanmar 1955 … 1955 … … … … 2013 3
Philippines 1953 1953 2005 1960 1953 1960 1998 2000 8
Singapore … 1965 1965 1965 (a) 2002 … 2005 2001 5
Thailand … … 1969 1969 1999 … 2004 2001 5
Viet Nam … … 2007 … 1997 1997 2003 2000 5
ASEAN (number of countries per Convention)
4 5 9 4 8 5 9 10 54 (b)
World (185 Member States)
153 164 177 174 171 172 167 179 1357 (c)
Note: “…” indicates Convention not ratified; (a) C105 was denounced by Malaysia in 1990 and Singapore in 1979; (b) total number of ratifications out of 80; (c) total number of ratifications out of 1,480.
Source: ILO: NORMLEX Database, May 2014.
ASEAN Community 2015: Managing integration for better jobs and shared prosperity 15
1
AS
EA
N in
tegration in
the glob
al context
bilateral trade agreements.27
ConclusionDespite significant progress, ASEAN may not achieve all AEC targets by the December 2015 deadline. Difficulties have arisen from structural differences among Member States and intra-re-gional conflicts, as well as from the changing global economic and political landscape.28 Nevertheless, economic integration can be seen as a longer-term process for which ASEAN leaders have estab-lished a solid base. Continued progress will require sustained political will, coordination, capacity building, and the strengthening of national and regional institutions.
As this chapter and the rest of the report make clear, the AEC is likely to have far-reaching conse-quences for ASEAN workers given the breadth and depth of economic integration that has been planned and is being implemented. The AEC is expected to precipitate national and regional trans-formation of economies, which in turn will force ASEAN Member States to confront key issues related to job gains and losses, skills development, wages, labour migration and the strengthening of social protection systems.
The true success of the AEC, however, will not be reflected in either the AEC implementation rate at the end of 2015 or the extent that the AEC increases regional trade and investment. It will ulti-mately depend on how much each ASEAN citizen prospers from deeper economic integration. While the economic and political-security domains have taken precedence in prior ASEAN initiatives, the social and labour dimensions may now be critical
27 In the 1996WorldTradeOrganization (WTO)MinisterialMeeting in Singapore, the WTO recognized the importance of labour rights and standards, rejected the utilization of these for protectionist purposes and identified the ILO as the competent body.
28 S.Y. Chia: The ASEAN Economic Community: Progress, challenges, and prospects,ADBIWorkingPaper440(Tokyo,ADBI,2013).
in determining the success of current and future ASEAN region integration efforts.

ASEAN Community 2015: Managing integration for better jobs and shared prosperity16
1
AS
EA
N in
tegration in
the glob
al context
ASEAN Community 2015: Managing integration for better jobs and shared prosperity 17
2
Con
nectin
g across bord
ers
All these extra-block regional initiatives contribute to the AEC goal of full integration in the global economy by promoting trade and investment creation and diversification as well as facilitating ASEAN’s engagement in global and regional supply chains. They also promote physical connectivity as a core strategy to lower barriers to trade and investment.
Building physical connectivityMany of the poor in the ASEAN region live
in remote or isolated areas, often in regions close to their borders. Such communities can be better linked through cross-border infrastructure. The aim should be to connect contiguous areas of neigh-bouring countries not just to commercial and industrial centres in their own countries but also to those in other countries and beyond. This kind of economic integration should however be carefully planned so as to ensure equitable distribution of the costs and benefits.
Better roads, railways, and airways as well as
telecommunications, facilitate the movement of goods, capital, labour, people and ideas among coun-tries and reduce overall transaction costs. They also increase employment – either immediately through work on the construction of physical infrastructure or through the labour required for the manufacture of core inputs such as cement, asphalt and steel. In addition, there could be more employment in agri-culture, if farmers can rely on better roads to deliver their products, and in industry if better-integrated transport infrastructure enables manufacturers to reduce delivery costs. Employment is also boosted in service industries whose workers become more productive because of access to faster broadband.
Maximizing such benefits will require coordi-nation among national- or provincial-level decision makers, in providing not just the “hard” infra-structure but also the institutions that form the appropriate “soft” infrastructure. Planning and implementation also need to involve full consulta-tions with local communities and stakeholders.
To help develop such infrastructure, in 2010,
Countries across the region have benefited from a broad range of initiatives – ASEAN,
ASEAN+ and non-ASEAN – that help share the benefits of economic growth within
the region. The previous chapter presented the rationale and objectives of ASEAN.
This chapter covers ASEAN+ trade agreements and ASEAN-led partnerships with
key regional partners as well as major non-ASEAN regional integration initiatives.
The latter includes regional cooperation programmes supported by the ADB that are
based on growth triangles or economic corridors.
Connecting across borders
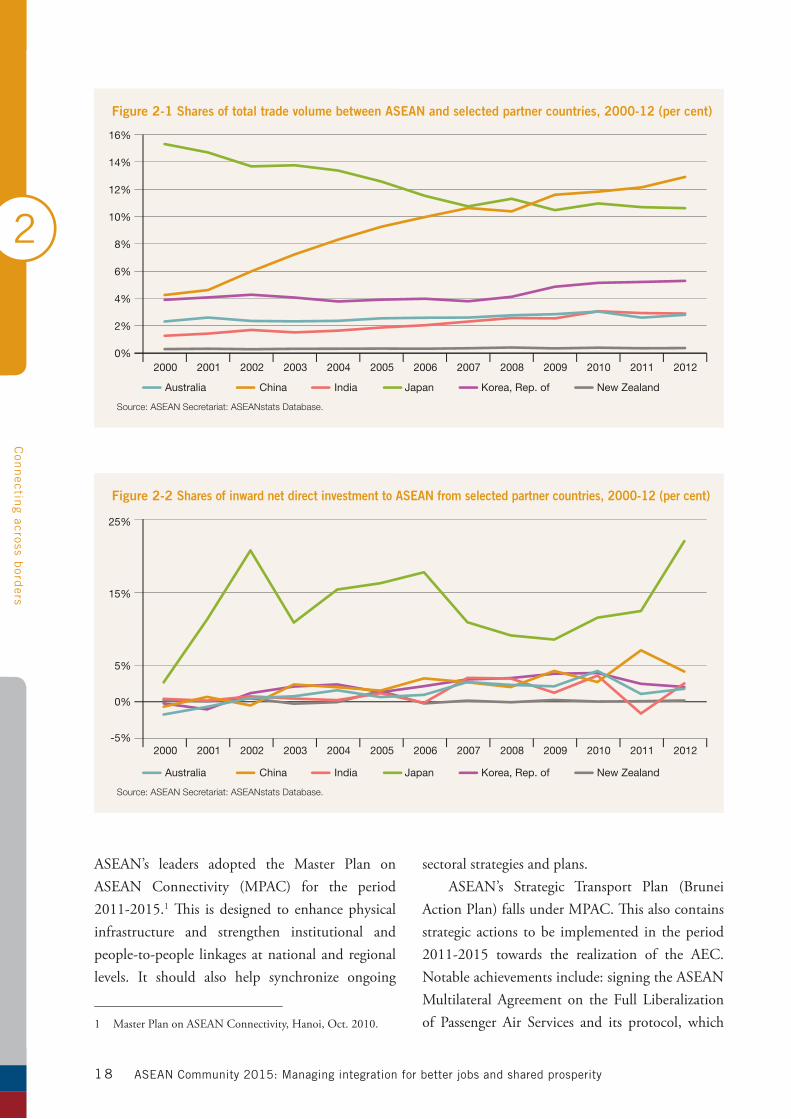
ASEAN Community 2015: Managing integration for better jobs and shared prosperity1 8
2
Con
nectin
g across bord
ers
ASEAN’s leaders adopted the Master Plan on ASEAN Connectivity (MPAC) for the period 2011-2015.1 This is designed to enhance physical infrastructure and strengthen institutional and people-to-people linkages at national and regional levels. It should also help synchronize ongoing
1 Master Plan on ASEAN Connectivity, Hanoi, Oct. 2010.
sectoral strategies and plans.ASEAN’s Strategic Transport Plan (Brunei
Action Plan) falls under MPAC. This also contains strategic actions to be implemented in the period 2011-2015 towards the realization of the AEC. Notableachievementsinclude:signingtheASEANMultilateral Agreement on the Full Liberalization of Passenger Air Services and its protocol, which
Australia China India Japan Korea, Rep. of New Zealand
Source: ASEAN Secretariat: ASEANstats Database.
Figure 2-1 Shares of total trade volume between ASEAN and selected partner countries, 2000-12 (per cent)
16%
14%
12%
10%
8%
6%
4%
2%
0%2006200520042003200220012000 2007 2008 2009 2010 2011 2012
Australia China India Japan Korea, Rep. of New Zealand
Source: ASEAN Secretariat: ASEANstats Database.
Figure 2-2 Shares of inward net direct investment to ASEAN from selected partner countries, 2000-12 (per cent)
25%
15%
5%
0%
-5%2006200520042003200220012000 2007 2008 2009 2010 2011 2012
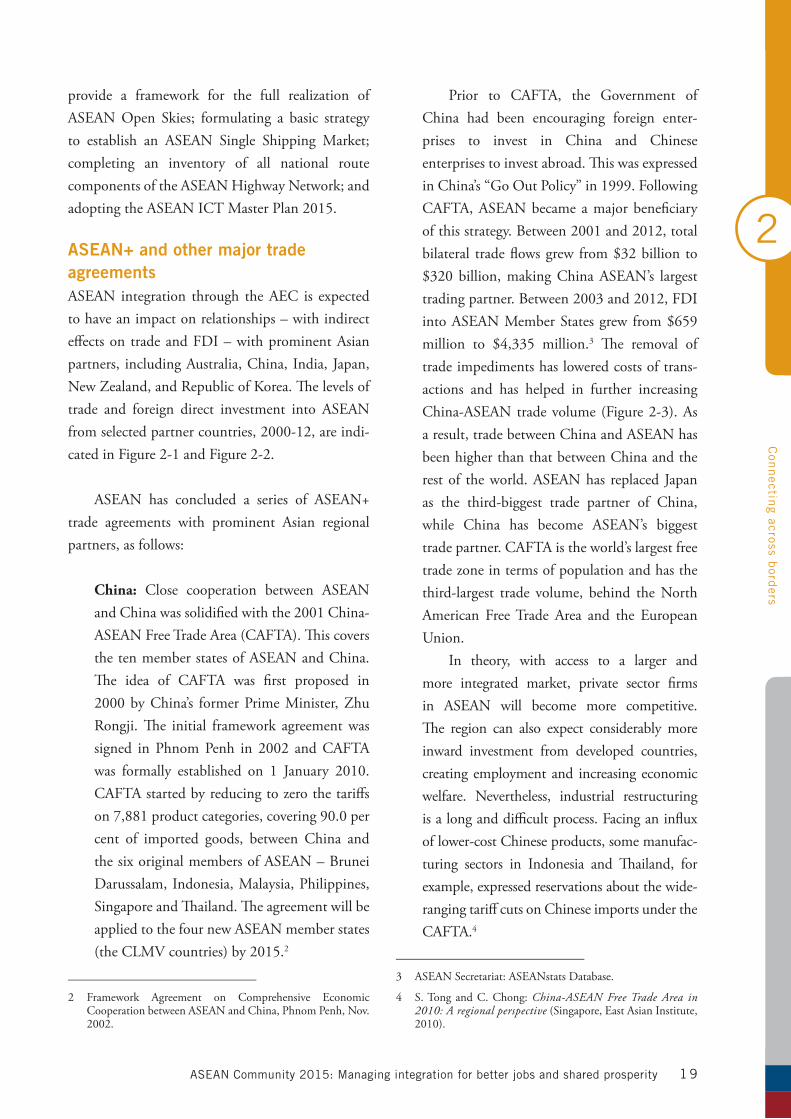
ASEAN Community 2015: Managing integration for better jobs and shared prosperity 19
2
Con
nectin
g across bord
ers
provide a framework for the full realization of ASEAN Open Skies; formulating a basic strategy to establish an ASEAN Single Shipping Market; completing an inventory of all national route components of the ASEAN Highway Network; and adopting the ASEAN ICT Master Plan 2015.
ASEAN+ and other major trade agreementsASEAN integration through the AEC is expected to have an impact on relationships – with indirect effects on trade and FDI – with prominent Asian partners, including Australia, China, India, Japan, New Zealand, and Republic of Korea. The levels of trade and foreign direct investment into ASEAN from selected partner countries, 2000-12, are indi-cated in Figure 2-1 and Figure 2-2.
ASEAN has concluded a series of ASEAN+ trade agreements with prominent Asian regional partners,asfollows:
China: Close cooperation between ASEAN and China was solidified with the 2001 China-ASEAN Free Trade Area (CAFTA). This covers the ten member states of ASEAN and China. The idea of CAFTA was first proposed in 2000 by China’s former Prime Minister, Zhu Rongji. The initial framework agreement was signed in Phnom Penh in 2002 and CAFTA was formally established on 1 January 2010. CAFTA started by reducing to zero the tariffs on7,881productcategories,covering90.0percent of imported goods, between China and the six original members of ASEAN – Brunei Darussalam, Indonesia, Malaysia, Philippines, Singapore and Thailand. The agreement will be applied to the four new ASEAN member states (the CLMV countries) by 2015.2
2 Framework Agreement on Comprehensive Economic Cooperation between ASEAN and China, Phnom Penh, Nov. 2002.
Prior to CAFTA, the Government of China had been encouraging foreign enter-prises to invest in China and Chinese enterprises to invest abroad. This was expressed inChina’s“GoOutPolicy”in1999.FollowingCAFTA, ASEAN became a major beneficiary of this strategy. Between 2001 and 2012, total bilateral tradeflowsgrewfrom$32billion to$320billion,makingChinaASEAN’s largesttradingpartner.Between2003and2012,FDIintoASEANMemberStatesgrewfrom$659million to $4,335 million.3 The removal of trade impediments has lowered costs of trans-actions and has helped in further increasing China-ASEANtradevolume (Figure2-3).Asa result, trade between China and ASEAN has been higher than that between China and the rest of the world. ASEAN has replaced Japan as the third-biggest trade partner of China, while China has become ASEAN’s biggest trade partner. CAFTA is the world’s largest free trade zone in terms of population and has the third-largest trade volume, behind the North American Free Trade Area and the European Union.
In theory, with access to a larger and more integrated market, private sector firms in ASEAN will become more competitive. The region can also expect considerably more inward investment from developed countries, creating employment and increasing economic welfare. Nevertheless, industrial restructuring is a long and difficult process. Facing an influx of lower-cost Chinese products, some manufac-turing sectors in Indonesia and Thailand, for example, expressed reservations about the wide-ranging tariff cuts on Chinese imports under the CAFTA.4
3 ASEANSecretariat:ASEANstatsDatabase.
4 S.TongandC.Chong:China-ASEAN Free Trade Area in 2010: A regional perspective (Singapore, East Asian Institute, 2010).
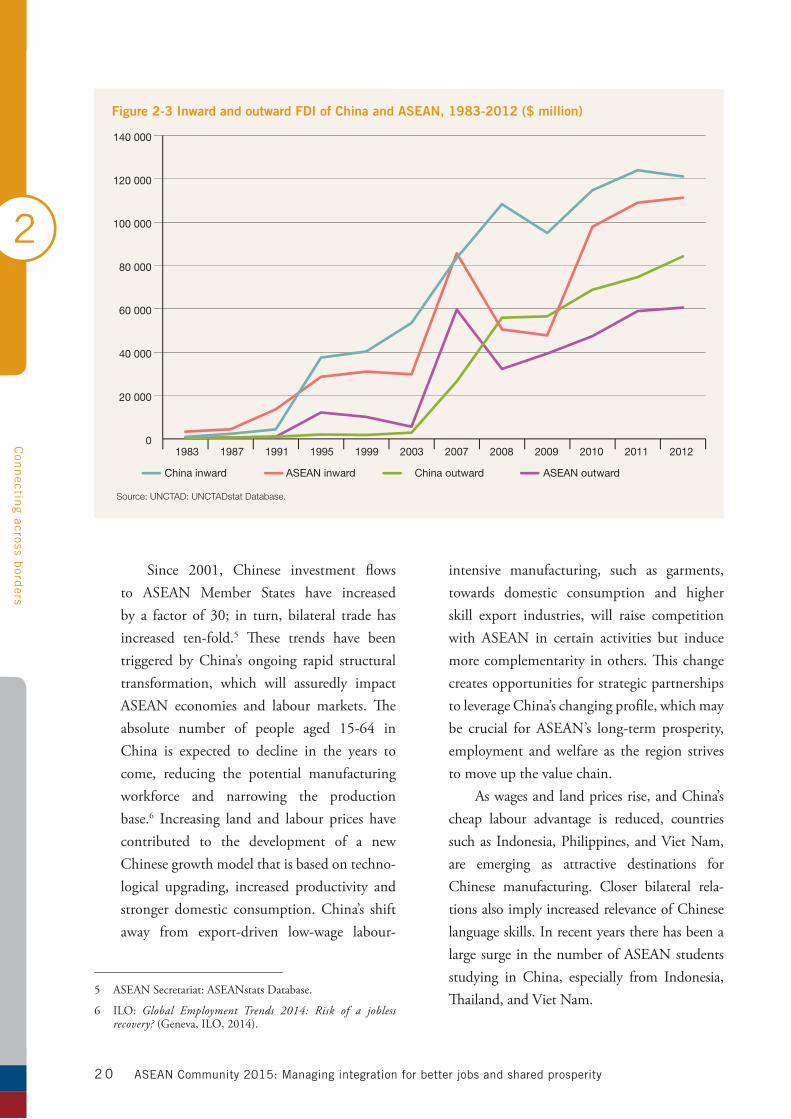
ASEAN Community 2015: Managing integration for better jobs and shared prosperity2 0
2
Con
nectin
g across bord
ers
Since 2001, Chinese investment flows to ASEAN Member States have increased by a factor of 30; in turn, bilateral trade hasincreased ten-fold.5 These trends have been triggered by China’s ongoing rapid structural transformation, which will assuredly impact ASEAN economies and labour markets. The absolute number of people aged 15-64 inChina is expected to decline in the years to come, reducing the potential manufacturing workforce and narrowing the production base.6 Increasing land and labour prices have contributed to the development of a new Chinese growth model that is based on techno-logical upgrading, increased productivity and stronger domestic consumption. China’s shift away from export-driven low-wage labour-
5 ASEANSecretariat:ASEANstatsDatabase.
6 ILO: Global Employment Trends 2014: Risk of a jobless recovery?(Geneva,ILO,2014).
intensive manufacturing, such as garments, towards domestic consumption and higher skill export industries, will raise competition with ASEAN in certain activities but induce more complementarity in others. This change creates opportunities for strategic partnerships to leverage China’s changing profile, which may be crucial for ASEAN’s long-term prosperity, employment and welfare as the region strives to move up the value chain.
As wages and land prices rise, and China’s cheap labour advantage is reduced, countries such as Indonesia, Philippines, and Viet Nam, are emerging as attractive destinations for Chinese manufacturing. Closer bilateral rela-tions also imply increased relevance of Chinese language skills. In recent years there has been a large surge in the number of ASEAN students studying in China, especially from Indonesia, Thailand, and Viet Nam.
China inward ASEAN inward China outward ASEAN outward
Figure 2-3 Inward and outward FDI of China and ASEAN, 1983-2012 ($ million)
Source: UNCTAD: UNCTADstat Database.
2003199119871983 1995 1999 2007 2008 2009 2010 2011 20120
20 000
40 000
60 000
80 000
100 000
120 000
140 000
ASEAN Community 2015: Managing integration for better jobs and shared prosperity 21
2
Con
nectin
g across bord
ers
Australia: The ASEAN-Australia-New Zealand Free Trade Area (AANZFTA) entered into force in2009,effectivelystrengtheningbilateralties.The total trade volume between Australia and ASEANexperiencedapproximately40percentgrowth(a$17billionincrease)between2009and2010. Apart from AANZFTA, Australia has also contributed to ASEAN’s economic integration through the ASEAN-Australian Development Cooperation Program. From 2002 to 2008, the programme assisted ASEAN Member States in the development of goods, services, and invest-ment markets, as well as on improvements to ASEAN labour market policies.
Japan:Beginning in the late1980s, Japanesemultinational enterprises (MNEs) aggressively invested in ASEAN Member States, effectively turning ASEAN into a production base for Japan’s multinational firms. ASEAN integra-tion will expand the region’s internal market and encourage Japanese MNEs to relocate their affiliates, resulting in gains to Japanese multi-nationals from intra-industry agglomeration. Positive externalities associated with industry agglomeration will, in turn, result in specializa-tion and enhanced competitiveness of Japanese firms. ASEAN integration is also projected to induce a resurgence of Japanese FDI in the region, as business environments in China wane and Japanese firms seek to diversify risk. Further removal of trade barriers will motivate Japanese MNEs to relocate unskilled, labour-in-tensive products to the CLMV countries which is expected to lead to technical and knowledge spillovers as well as skills upgrading.7
Republic of Korea: Economic cooperation
7 S.Hitoshi:How can ASEAN and Japan mutually benefit from ASEAN integration, background paper for ADB and ILO:ASEAN Community 2015: Managing integration for better jobs and shared prosperity (Bangkok, ILO, forthcoming).
between ASEAN and the Republic of Korea reached a milestone in 2005 in the forging of the ASEAN-Korea Free Trade Area (AKFA). In the first five-year period following the implementation of the ASEAN-Korea Trade in Goods, bilateral trade volume increased over 114 per cent, from$48 billion to $103billion. Subsequently bilateral trade volume increased over 23 per cent.8 By 2015, intra-trade and investment are projected to rise to $150 billion.9
India: Mutually beneficial cooperation can be enhanced by further removal of ASEAN external tariff rates through the Free Trade Agreement in Goods. Given the importance of greater economic connectivity, Indian policy makers have made a concerted effort to “Look East”. Of particular importance to India is its relationship with Myanmar due to the coun-try’s strategic location and its potential as a land bridge to Southeast Asia and southern China. In addition, the recent political and economic opening of Myanmar, coupled with the rela-tively low wages in the country, is likely to boost FDI inflows and technology transfers.10
New Zealand: In June 2013, responsible for13.0 per cent of merchandise trade, ASEANsurpassed the European Union and became New Zealand’s third-largest trading partner, behind only Australia and China.11 Since the beginning of the 21st century, ASEAN’s rapidly expanding middle class presents a booming
8 ASEAN Secretariat: ASEAN-Korea FreeTrade Area, 2012,http://akfta.asean.org[accessed4Apr.2014].
9 Ibid.
10 S. Sen: ASEAN-India integration, background paper for ASEAN Community 2015: Managing integration for better jobs and shared prosperity (Bangkok, ILO, forthcoming)
11 Analysis of New Zealand merchandise trade data, year ended June2013.SeeNewZealandMinistryofForeignAffairsandTrade,http://www.mfat.govt.nz/[accessed4Apr.2014].
ASEAN Community 2015: Managing integration for better jobs and shared prosperity2 2
2
Con
nectin
g across bord
ers
market for New Zealand’s high quality products and services. Concomitantly, New Zealand, as a major trading partner, can play an impor-tant role in helping Southeast Asian countries sustain their high economic growth.
Implications for non-ASEAN Member States echo to a large extent distributional effects in the ASEAN region itself. As ASEAN Member States further liberalize and integrate, non-ASEAN Member States will have a greater ability to shift production networks and manufacturing into ASEAN, especially the CLMV countries, creating winners and losers in their respective national contexts.
In addition to CAFTA and other ASEAN+ initiatives, there are two major trade agreements – the Regional Comprehensive Economic Partnership (RCEP) and the Trans-Pacific Partnership (TPP) – that stand to define the parameters of economic integrationinAsia:
The Regional Comprehensive Economic Partnership (RCEP): The RCEP initiative was announced by the ASEAN leaders in November 2011. Negotiations started in 2013 and areexpected to conclude at the end of 2015. This will be a 16-party ASEAN-led free trade agree-ment with Australia, China, India, Japan, New Zealand, and Republic of Korea. The RCEP aims at greater economic integration by supporting equitable economic development and strengthening economic cooperation. It will cover trade in goods and services, investment, economic and technical cooperation, intellec-tual property, competition, dispute settlement and other issues. To help ensure a comprehen-sive and balanced outcome, the negotiations on trade in goods, trade in services, investment and other areas will be conducted in parallel. RCEP will create a free trade and investment area comprising over three billion people, with a combined GDP of roughly $21 trillion and
27 per cent of total global trade.12
The Trans-Pacific Partnership (TPP): Launched in 2010, this is a proposed trade agreement which is still under negotiation. It has 12 members – Australia, Brunei Darussalam, Canada, Chile, Japan, Malaysia, Mexico, New Zealand, Peru, Singapore, United States, and Viet Nam. The TPP intends to enhance trade and investment, promote innovation, economic growth and development, and support the creation and retention of jobs. Through the TPP, the United States is seeking a trade and investment framework that will boost competi-tiveness, expand trade and investment with the robust economies of Asia and the Pacific, and support the creation and retention of United States jobs, while promoting core United States principles on labour rights, environmental protection, and transparency.13
Non-ASEAN subregional initiativesThe1990s saw thecreationofanumberofotherinitiatives in the form of subregional economic zones (SRZs). Although these cross national boundaries they do not cover all the territory of every participating country. Generally, they aim at maintaining competitiveness in exports by trans-forming transnational but contiguous areas into attractive platforms for enhanced economic activity. ASEAN governments have embraced SRZs as a way of promoting regional integration without having to change national trade policies or integrate entire economies. SRZs can be established at relatively low cost within a short period of time.
SRZs are most effective when the participating regions are economically complementary – with
12 GDP data based on IMF: World Economic OutlookDatabase,Apr.2014;tradedatabasedonWTO:TradeProfilesDatabase.
13 OfficeoftheUnitedStatesTradeRepresentative:TransPacificPartnership,http://www.ustr.gov/tpp[accessedApr.2014].
ASEAN Community 2015: Managing integration for better jobs and shared prosperity 2 3
2
Con
nectin
g across bord
ers
sufficiently large differentials in factor endowments. They must also be geographically close, to take advantage of cultural or linguistic affinities and have good physical connectivity so as to reduce transport and transaction costs. Participating countries must also be ready to forego some measure of sovereignty and be prepared to distribute the economic benefits as equitably as possible.14
Another form of limited integration is through economic corridors. These have most of the charac-teristics of SRZs but encompass smaller geographic spaces. In most cases, they straddle a central transport artery such as a road, railway line, or canal.15 Along the corridor there are strategic nodes, especially at border crossings, that offer scope for regional coop-eration. Corridors are more likely to be bilateral rather than multilateral and place greater emphasis on the careful spatial and physical planning of the corridor and its surrounding area, so as to concen-trate infrastructure development.
Economic corridors involve both hard and soft infrastructure. Hard infrastructure provides physical connectivity through cross-border projects in transport and telecommunications. Soft infra-structure involves, for example, effective border and customs procedures and border processing and transport agreements. It also includes laws and regulations, and systems and procedures; and the institutions to make hard infrastructure work prop-erly. Soft infrastructure should be complemented with mechanisms for involving local or provincial communities and other stakeholders.
Singapore-Johor-Riau TriangleThe first SRZ in Southeast Asia was the Singapore-Johor-Riau (SIJORI) triangle. This was based on the complementarity between Singapore, which has capital and technical capacity but very little land
14 M. Thant: Growth triangles in Asia: A new approach to regional economic cooperation(Manila,ADB,1998).
15 ADB:Preinvestment study for the Greater Mekong Subregion, East-West Economic Corridor, Vol. 1 (Manila, 2001).
or labour, and neighbouring areas in Malaysia and Indonesia which are relatively abundant in land and have ample supplies of low-wage labour. In the late-1980s, increased production costs, coupled withthe appreciation of the Singapore dollar, dimin-ished the competitiveness of Singapore’s traditional, labour-intensive manufacturing firms – pushing them to relocate to the state of Johor in Malaysia and to the islands of Batam and Bintan in the prov-ince of Riau in Indonesia. At the time, land prices were$4.3persquaremetreinSingaporeversus$2.3inBatam,andwagesforunskilledlabourwere$350permonth inSingaporeversus$90permonth inBatam.16 Some of the necessary physical infrastruc-ture was already in place, with a causeway between Johor and Singapore, and it was easy to start ferry services to the Riau islands. Riau and Johor also had the advantage of good access to natural resources, particularly stable water supplies. Another impor-tant catalyst was Indonesia’s unilateral decision in 1978tomakeBatamaduty-freezone.
In 1994, the three participating countriessigned a memorandum of understanding. But SIJORI does not have an official organization. It is viewed rather as an initiative involving two sets of adhocbilateralrelations:Singapore-IndonesiaandSingapore-Malaysia.
Nevertheless, 20 years later, the SIJORI region is one of Southeast Asia’s major growth areas. There is no doubt that spillovers from Singapore are benefiting poorer neighbouring regions. Also, Malaysia has invested heavily, especially since 2006 and the launch in southern Johor of the Iskandar Development Region – which is three times the size of Singapore, with about a third of the population.
Greater Mekong SubregionThe Greater Mekong Subregion (GMS) is a natural
16 R.PomfretandS.BasuDas:“SubregionalzonesandASEANEconomicCommunity”,inS.BasuDasetal.:The ASEAN Economic Community, A work in progress (Manila, ADB and ISEAS,2013),pp.279-320.
ASEAN Community 2015: Managing integration for better jobs and shared prosperity2 4
2
Con
nectin
g across bord
ers
economic area bounded by the Mekong River. It is made up of Cambodia, China (specifically Yunnan province and Guangxi Zhuang Autonomous Region), Lao People’s Democratic Republic, Myanmar, Thailand, and Viet Nam. The GMS has an area of 2.6 million square kilometres and a combinedpopulationofabout326million.
The GMS was established over a decade after hostilities ended in the region. It was intended to reinstate links between countries divided by conflicts and to facilitate reconstruction of infra-structure.17 In contrast to SIJORI, GMS has largely been a top-down, governmental undertaking whose key strategies are defined and implemented by a multilateral institution.
In1992,topromoteeconomicandsocialdevel-opment, the six countries of GMS, with assistance from the ADB and other development partners, launched the GMS Economic Cooperation Program (GMS Program). This aimed to link GMS countries through better infrastructure, improved competi-tiveness, and a greater sense of community – and thereby promote trade and investment and stimu-late economic growth. The countries also agreed to complement national efforts by jointly addressing, at the subregional level, other issues such as human resource development.18
In 1998, the GMS Program initiated theeconomic corridor programme – identifying five corridors along which the six participating coun-tries would coordinate improvements in hard and soft infrastructure. They also agreed to prioritize a 1,600-kilometre East-West Economic Corridor connecting Lao People’s Democratic Republic, Myanmar, Thailand and Viet Nam.
In 2002, the GMS countries prepared the GMSstrategicframework.Thishasfivethrusts:(i)strengthening infrastructure linkages; (ii) facilitating
17 Ibid.
18 ADB: Greater Mekong Subregion Economic Cooperation Program: Overview (Manila, Mar. 2012).
cross-border trade, investment, and tourism; (iii) enhancing private sector participation and compet-itiveness; (iv) developing human resources; and (v) protecting the environment and promoting the sustainable use of shared natural resources.
Subsequently, the GMS Program developed a transport sector strategy. Covering the period 2006-2015 this identified nine economic corridors along with priority infrastructure investments.19 The aim was to strengthen transport and logistics and to improve economic linkages with other coun-tries and regions. The corridors are also expected to extend the benefits of improved transport linkages to remote and landlocked locations.
After slow progress in the first decade, the economic benefits of the corridors became more apparent following the upgrading and widening of major roads. Nevertheless, progress along the corridors has been uneven. The most dynamic is the North-South Corridor in the two richest GMS nations – linking Kunming to Bangkok via Chiang Rai. Progress has been slower in the East-West Corridor, the Southern Corridor and the Northern Corridor from Nanning to Ha Noi.
Over the past two decades, the GMS Program has mobilized more than $15 billion in financing. Totalresourcesmobilizedweremorethan3.5timesgreater in the second decade than in the first. Most of this is for loan-financed projects in transport and energy. About one-third of the resources came from the ADB and the remainder from the GMS govern-ments, official sources of development support, and private sector cofinancing.20
One constraint to the GMS Program has been
19 The six GMS countries have nine Corridors as follows: 1)North-South Corridor: Kunming to Bangkok; 2) EasternCorridor: Kunming to Ca Mau; 3) East-West Corridor:Mawlamyine toDaNang;4)SouthernCorridor:Dawei toQuyNhon/VungTau;5)SouthernCoastalCorridor:BangkoktoNamCan;6)CentralCorridor:KunmingtoSihanoukville/Sattahip; 7) Northern Corridor: Fangcheng to Tamu; 8)Western Corridor:Tamu to Mawlamyine; 9) NortheasternCorridor:ThanhHoatoBangkok/LaemChabang.
20 ADB:The Greater Mekong Subregion at 20: Progress and prospects (Manila, 2012).
ASEAN Community 2015: Managing integration for better jobs and shared prosperity 2 5
2
Con
nectin
g across bord
ers
weak coordination. Although the GMS has seen major developments in physical infrastructure, improvements in trade and transport links have been hampered by bureaucratic or other restric-tions.21 More attention will be needed on soft infrastructure such as trade facilitation. This should include further strengthening of the GMS Cross Border Transport Facilitation Agreement which has been signed by all the GMS countries, although Myanmar, Thailand and Viet Nam have not fully ratified its annexes.22
The GMS has also been active in the fight against human trafficking. In 2004, ministers ofall six GMS countries signed a memorandum of understanding which established the Coordinated Mekong Ministerial Initiative against Trafficking (COMMIT). The secretariat is the United Nations Interagency Project on Human Trafficking in the Greater Mekong Subregion. In combating human trafficking, the governments have committed to meeting international standards – highlighting the need for multilateral, bilateral, and govern-ment-NGO cooperation. They have also developed a follow-up subregional action plan and established the Coordinated Mekong Ministerial Initiative Against Trafficking (the COMMIT process) whose major strength has been its strong acceptance by governments.23
Facilitating safe labour migration is a priority for the GMS. The following key issues in labour migrationinthesubregionhavebeenidentified:24
• Transitioning toward a knowledge-basedeconomy needs mechanisms to recognize the emerging skills and an environment attrac-tive to highly skilled migrants. This will help
21 R. Pomfret and S. Basu Das, op. cit.
22 ADB:Regional investment framework sector report: Transport and related services (Manila, 2012).
23 ADB: Regional investment framework sector report: Facilitating safe labor migration in the Greater Mekong Subregion (Manila, 2012).
24 ADB:Facilitating safe labor migration in the Greater Mekong Subregion(Manila,Apr.2013).
to ensure GMS competitiveness as a whole. • Irregular migration should be limited by
creating an environment in which regulariza-tion is sustainable to migrants.
• Rights and protection of migrant workersare not yet ensured, even if laws that address regular migrants exist.
• The feminization of migration should bemainstreamed into migration policies to protect women and children.
• Knowledgeonlabourmigrationisveryinad-equate. Research, including both quantitative and qualitative surveys, should be supported to gain a deeper understanding of how migra-tion works within the subregion.
The recommendations of the GMS include the following:
• increaseprotectionmechanismsformigrantsin cross-border settings;
• strengthen capacity and legal framework inmanaging labour migration;
• enhance social protection formigrants andtheir families;
• promote ethical recruitment andemployment;
• strengthen returnand reintegration supportto migrants;
• increase knowledge management mecha-nisms; and
• promoteeffectiveuseofremittances.
The GMS aims to narrow the development divide in Southeast Asia. But in this respect progress has been limited. Lao People’s Democratic Republic has benefited from the North-South Corridor, through completion of the North-South Highway and progress on the North-South Rail Link. But other than this the poorer nations have seen little practical impact.25
Another concern is that, unlike in SIJORI,
25 R. Pomfret and S. Basu Das, op. cit.
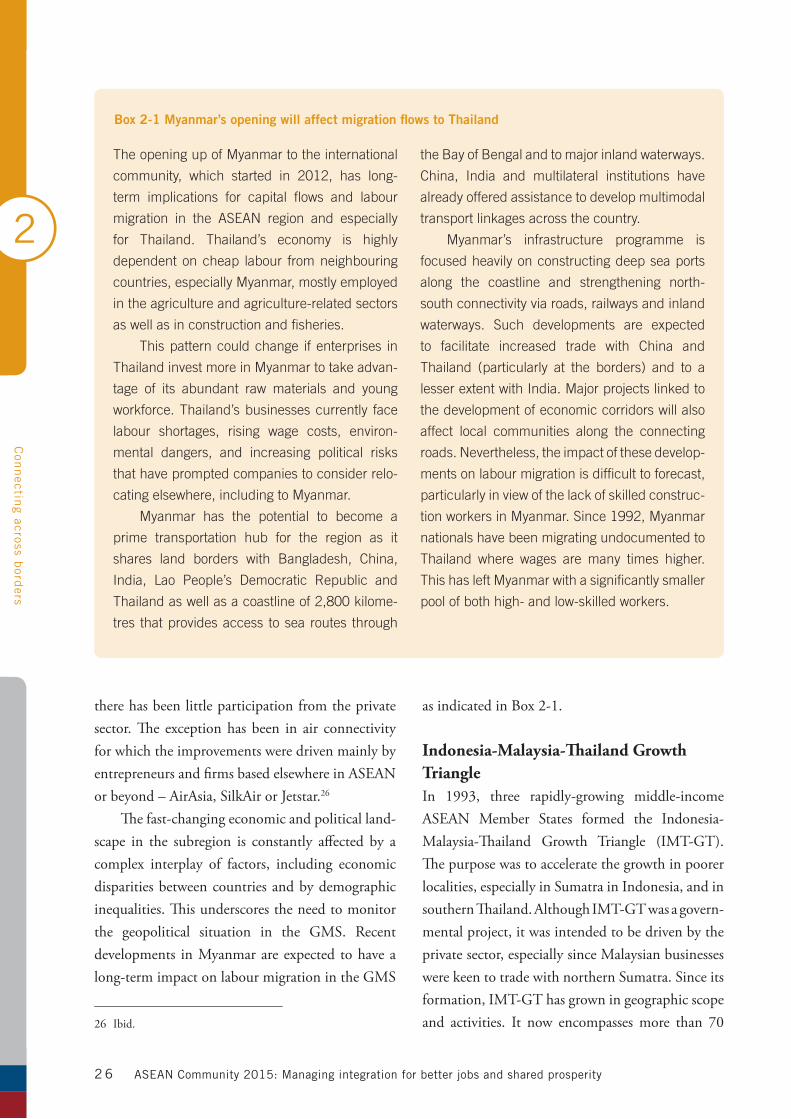
ASEAN Community 2015: Managing integration for better jobs and shared prosperity2 6
2
Con
nectin
g across bord
ers
there has been little participation from the private sector. The exception has been in air connectivity for which the improvements were driven mainly by entrepreneurs and firms based elsewhere in ASEAN or beyond – AirAsia, SilkAir or Jetstar.26
The fast-changing economic and political land-scape in the subregion is constantly affected by a complex interplay of factors, including economic disparities between countries and by demographic inequalities. This underscores the need to monitor the geopolitical situation in the GMS. Recent developments in Myanmar are expected to have a long-term impact on labour migration in the GMS
26 Ibid.
as indicated in Box 2-1.
Indonesia-Malaysia-Thailand Growth TriangleIn 1993, three rapidly-growing middle-incomeASEAN Member States formed the Indonesia-Malaysia-Thailand Growth Triangle (IMT-GT). The purpose was to accelerate the growth in poorer localities, especially in Sumatra in Indonesia, and in southern Thailand. Although IMT-GT was a govern-mental project, it was intended to be driven by the private sector, especially since Malaysian businesses were keen to trade with northern Sumatra. Since its formation, IMT-GT has grown in geographic scope and activities. It now encompasses more than 70
The opening up of Myanmar to the international
community, which started in 2012, has long-
term implications for capital flows and labour
migration in the ASEAN region and especially
for Thailand. Thailand’s economy is highly
dependent on cheap labour from neighbouring
countries, especially Myanmar, mostly employed
in the agriculture and agriculture-related sectors
as well as in construction and fisheries.
This pattern could change if enterprises in
Thailand invest more in Myanmar to take advan-
tage of its abundant raw materials and young
workforce. Thailand’s businesses currently face
labour shortages, rising wage costs, environ-
mental dangers, and increasing political risks
that have prompted companies to consider relo-
cating elsewhere, including to Myanmar.
Myanmar has the potential to become a
prime transportation hub for the region as it
shares land borders with Bangladesh, China,
India, Lao People’s Democratic Republic and
Thailand as well as a coastline of 2,800 kilome-
tres that provides access to sea routes through
the Bay of Bengal and to major inland waterways.
China, India and multilateral institutions have
already offered assistance to develop multimodal
transport linkages across the country.
Myanmar’s infrastructure programme is
focused heavily on constructing deep sea ports
along the coastline and strengthening north-
south connectivity via roads, railways and inland
waterways. Such developments are expected
to facilitate increased trade with China and
Thailand (particularly at the borders) and to a
lesser extent with India. Major projects linked to
the development of economic corridors will also
affect local communities along the connecting
roads. Nevertheless, the impact of these develop-
ments on labour migration is difficult to forecast,
particularly in view of the lack of skilled construc-
tion workers in Myanmar. Since 1992, Myanmar
nationals have been migrating undocumented to
Thailand where wages are many times higher.
This has left Myanmar with a significantly smaller
pool of both high- and low-skilled workers.
Box 2-1 Myanmar’s opening will affect migration flows to Thailand
ASEAN Community 2015: Managing integration for better jobs and shared prosperity 2 7
2
Con
nectin
g across bord
ers
millionpeoplein32provincesandstates–14prov-inces in southern Thailand, eight northern states in Peninsular Malaysia, and 10 provinces of Sumatra in Indonesia.
Setting up the IMT-GT institutions was hamperedbythe1997Asianfinancialcrisis.Interestwas renewed only after the onset of economic recovery in early 2000. At the first summit meeting in Malaysia in 2005, member governments, with the assistance of the ADB, formulated a five-year roadmap covering the period 2007-11. As a focus for major economic activities, the roadmap iden-tified IMT-GT connectivity corridors – aiming to improve transport facilities and linkages, as well as other supporting infrastructure. The roadmap stated that IMT-GT should not only be consistent with, but also contribute to, the realization of the AEC.
By 2009, however, the IMT-GT had shownonly modest progress in sustaining economic exchanges and commercial ties among the partici-pating states and provinces. The private sector had established well-functioning business networks that were helping to boost trade and investment in the subregion. But the IMT-GT participating states and provinces had achieved only zero or slow economic growth. Although the roadmap remained relevant, project implementation had been lagging.27
The roadmap identified more than 50 meas-ures, programmes and projects. Construction has started in several infrastructure projects, but some of the planned projects have been delayed by tech-nical, financial, and legal impediments. Moreover, there has been insufficient attention to the software aspects of infrastructure connectivity. While the IMT-GT subregional zone has centres of economic dynamism, it is unclear how much can be attrib-uted to the SRZ structure.
The IMT-GT roadmap has been succeeded by the Implementation Blueprint (2012-2016). This
27 ADB:Mid-term review of the Indonesia-Malaysia-Thailand Growth Triangle (IMT-GT) roadmap for development 2007-2011 (Manila, Nov. 2010).
reflects an action-oriented agenda with a more disci-plined and better-informed process for identifying projects, based on well-defined concepts and ration-ales. The Blueprint identifies 11 priority connectivity projects in the transport (toll road, ports) and power sectors, amounting to $5.2 billion.28 As regards the maritime subsector, IMT-GT promotes the devel-opment of roll-on roll-off (ro-ro) services, especially across the Straits of Melaka and for ports in Sumatra and southern Thailand. A key strategic thrust is to develop human resources and skills and enhance labour mobility.
Brunei Darussalam-Indonesia-Malaysia-Philippines East ASEAN Growth AreaIn1994,membergovernmentsestablishedtheBruneiDarussalam-Indonesia-Malaysia-Philippines-East ASEAN Growth Area (BIMP-EAGA). The purpose was to address the socioeconomic development of less developed, remote and marginalized areas, and narrow the development gaps. The subregion covers:theentireSultanateofBruneiDarussalam;nine provinces in Kalimantan and Sulawesi, the island chain of Maluku, and Papua (Indonesia); the Federal States of Sabah and Sarawak and the Federal Territory of Labuan (Malaysia); all 26 provinces of the island of Mindanao in the Philippines and the island province of Palawan in the Philippines. These areas are among the poorest in their respec-tive countries, but have a long history of trade and other economic links.
BIMP-EAGA’s long-term goal is to help local communities move away from livelihoods based on resource extraction and shift towards higher-order resource processing, as well as to non- resource-based activities. The engine of growth will be the private sector with the governments providing a conducive investment environment.
In1996,attherequestofmembergovernments,
28 Indonesia-Malaysia-Thailand Growth Triangle Implementation Blueprint 2012-2016, Phnom Penh, Apr. 2010.
ASEAN Community 2015: Managing integration for better jobs and shared prosperity2 8
2
Con
nectin
g across bord
ers
the ADB commissioned a study, following which several national policies were modified. Among others, the four governments agreed to liberalize the transport sector. This resulted in the opening of new and direct commercial air and sea links. Several airport and seaport infrastructure facilities were upgraded to accommodate the expected increase in passenger and cargo traffic.
In1997,however,thegrowthmomentumwasseriously disrupted by the Asian financial crisis as governments refocused on national issues. Interest in BIMP-EAGA cooperation was renewed only in 2001, but the programme had only a limited impact. In response, member governments, with ADB support, formulated the BIMP-EAGA Roadmap to Development 2006–2010 which established broad strategic thrusts as well as targets for implementa-tion. The roadmap identified priority sectors in agro-industry and natural resources, tourism, trans-port, infrastructure and ICT – with an emphasis on the development of small and medium-sized enter-prises. One of the key measures would be to improve infrastructure via air, sea, and land linkages.
In 2007, to complement improvements in physical infrastructure, BIMP-EAGA leaders signed MOUs to improve air linkages, sea linkages, and bus services.29 These, for example, facilitated the expansion of ro-ro ferry services between Brunei Darussalam and Sabah, enabling container trucks and buses to travel smoothly from Pontianak to Kota Kinabalu or anywhere in Sabah, with a minimum number of border-crossing controls. There was also a positive response to these reforms from the private sector, especially among airlines and travel agencies, which significantly expanded air links.
According to a mid-term review, the roadmap achieved modest progress and its targets were more or less achieved.30 However it was noted that a
29 Brunei Darussalam-Indonesia-Malaysia-Philippines East ASEAN Growth Area Roadmap to Development 2006-2010, Mar. 2012.
30 Ibid.
number of important routes still had weak trans-port links – because of the lack of viable projects, and because governments had yet to formulate some important rules and regulations, including those for cross-border movement of buses and coaches.
The Implementation Blueprint covers the period 2012–16. It sets out a framework for better project planning, and implementation in line with national and subregional objectives – taking into account the AEC in 2015 and potential benefits from establishing closer linkages between the two programmes.
Conclusion As a result of ASEAN, ASEAN+ and non-ASEAN initiatives, regional cooperation in Southeast Asia has been gathering momentum. Moreover, the fact that ASEAN Member States belong to different but related regional or subregional programmes gives ASEAN an overarching position in driving economic integration and regionalism in Asia. In many cases, such as the GMS, IMT-GT, and BIMP-EAGA, they have the support of the ADB.
Nevertheless the results of these subregional programmes have been mixed. Progress has been slow in soft infrastructure due in part to rigid insti-tutional structures and mechanisms, lack of political commitment, or inadequate overall resources at national and regional levels. To ensure that the full benefits of integration will be equitably distributed, ASEAN and the ADB must promote awareness of human resource development, particularly labour issues, as a crosscutting theme consistent with regional and national strategies and priorities.
The development of transport and ICT infra-structure has helped reduce transaction costs and strengthen overall competitiveness. However, this does not automatically benefit labour – so these initiatives must be supported by reforms in the policy and institutional frameworks at the national and regional levels. In SIJORI, regional cooperation has been driven largely by the private
ASEAN Community 2015: Managing integration for better jobs and shared prosperity 2 9
2
Con
nectin
g across bord
ers
sector. If private firms are to have similar roles in other regional integration initiatives – and provide more jobs, protection and opportunities for skills enhancement, especially for women – the roadmaps for these initiatives should include clear rationales for the involvement of the private sector and the promotion of a viable business environment.
The rapid and complex developments in Southeast Asia have long-term implications for the labour market. ASEAN and the ADB could help subregional initiatives keep pace with increasing needs for coordination by supporting mechanisms for sharing and discussing regional and subregional masterplans, roadmaps and priority projects. These initiatives will need flexible and interactive govern-ance structures that reformulate strategies and action plans in response to major events that affect the labour market. These potential effects are the subject of the next chapter.
ASEAN Community 2015: Managing integration for better jobs and shared prosperity3 0
2
Con
nectin
g across bord
ers
3
Man
aging stru
ctural ch
ange for d
ecent job
s
ASEAN Community 2015: Managing integration for better jobs and shared prosperity 31
ASEAN economic integration will change the pace of structural change, with important implications for theregion’s300millionworkersandtheirfamilies.As patterns of comparative advantage and produc-tion alter, so workers will move from one economic sector to another. Using an innovative computable general equilibrium model, this chapter assesses the potential impacts on economies and labour markets. It also uses an occupational employment projections model to identify occupations that are likely to grow as ASEAN integration progresses.
The changing structure of employmentSince1992withtheestablishmentoftheASEANFreeTradeArea, and 2003whenASEAN leadersat the 9th ASEAN Summit resolved to establishthe ASEAN Community, labour markets have undergone significant structural change. One conse-quence has been a decline in the significance of agriculture.Agriculturenowaccountsfor40.0percent of total employment, having been overtaken by services at40.6per cent–with the remaining19.4 per cent accounted for by industry (Annex
F, Table F1-6). But the regional aggregates mask considerablecross-countryvariations(Figure3-1).Agriculture is still the largest employer in half of the ASEAN Member States: Cambodia, Lao People’sDemocratic Republic, Myanmar, Thailand and Viet Nam. Moreover, the pace of change has varied among the countries, with the share of agricultural employment falling by more than 20 percentage points in Indonesia, Thailand and Viet Nam in the past two decades, whereas the Philippines experi-enced a slower pace of decline.
Some countries have seen a striking increase in employment in industry. In Viet Nam, for example, between 1996 and 2013, the share of employ-ment in industry doubled from 10.6 per cent to 21.2 per cent. On the other hand, Malaysia and Singapore experienced deindustrialization in the past two decades. In ASEAN Member States, with the exception of Lao People’s Democratic Republic, Myanmar and Philippines, industry accounts for between 18.0 per cent and 28.0 per cent of total employment.
Recent decades have also seen a striking
The ASEAN Economic Community has significant potential to spur structural change
from low- to higher-productivity sectors. This chapter models the potential labour
market impact of increased trade integration – identifying the sectors and occupations
likely to grow. Reaping the potential benefits will depend on putting in place policies
to manage structural change, including employment policies for high-quality jobs,
robust measures for social protection and support for smaller enterprises.
Managing structural change for decent jobs
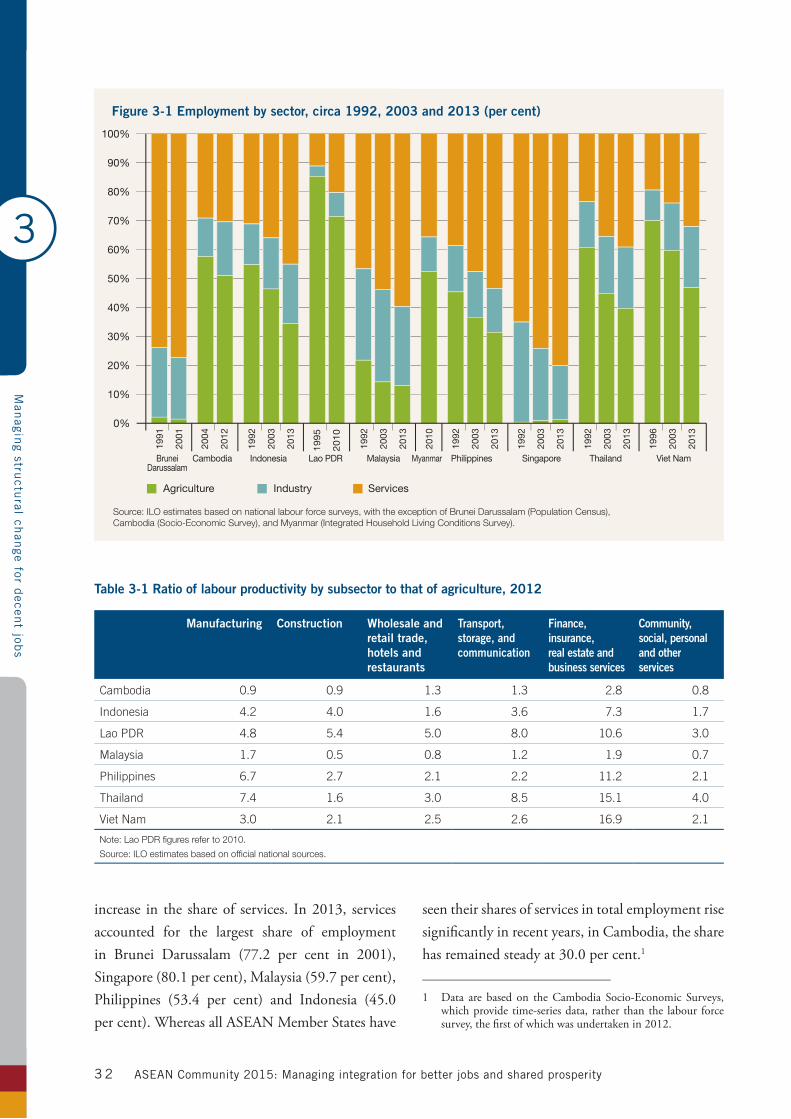
3
Man
aging stru
ctural ch
ange for d
ecent job
s
ASEAN Community 2015: Managing integration for better jobs and shared prosperity3 2
increase in the shareof services. In2013, servicesaccounted for the largest share of employment in Brunei Darussalam (77.2 per cent in 2001), Singapore(80.1percent),Malaysia(59.7percent),Philippines (53.4 per cent) and Indonesia (45.0per cent). Whereas all ASEAN Member States have
seen their shares of services in total employment rise significantly in recent years, in Cambodia, the share hasremainedsteadyat30.0percent.1
1 Data are based on the Cambodia Socio-Economic Surveys, which provide time-series data, rather than the labour force survey, the first of which was undertaken in 2012.
100%
90%
80%
70%
60%
50%
40%
30%
20%
10%
0%
1991
2001
1995
2010
2010
2004
2012
1992
2003
2013
1992
2003
2013
1992
2003
2013
1992
2003
2013
1992
2003
2013
1996
2003
2013
Source: ILO estimates based on national labour force surveys, with the exception of Brunei Darussalam (Population Census), Cambodia (Socio-Economic Survey), and Myanmar (Integrated Household Living Conditions Survey).
Figure 3-1 Employment by sector, circa 1992, 2003 and 2013 (per cent)
Agriculture Industry Services
BruneiDarussalam
Cambodia Indonesia Lao PDR Malaysia Myanmar Philippines Singapore Thailand Viet Nam
Table 3-1 Ratio of labour productivity by subsector to that of agriculture, 2012
Manufacturing Construction Wholesale and retail trade, hotels and restaurants
Transport, storage, and communication
Finance, insurance, real estate and business services
Community, social, personal and other services
Cambodia 0.9 0.9 1.3 1.3 2.8 0.8
Indonesia 4.2 4.0 1.6 3.6 7.3 1.7
Lao PDR 4.8 5.4 5.0 8.0 10.6 3.0
Malaysia 1.7 0.5 0.8 1.2 1.9 0.7
Philippines 6.7 2.7 2.1 2.2 11.2 2.1
Thailand 7.4 1.6 3.0 8.5 15.1 4.0
Viet Nam 3.0 2.1 2.5 2.6 16.9 2.1
Note: Lao PDR figures refer to 2010.
Source: ILO estimates based on official national sources.
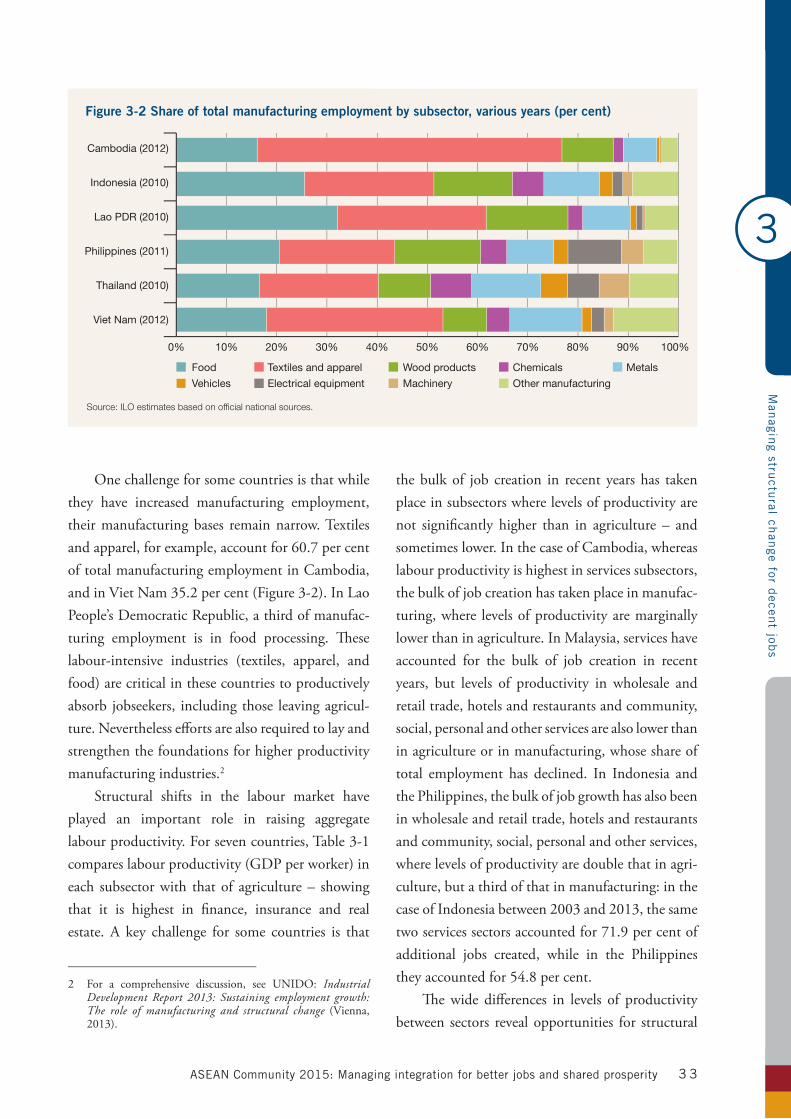
3
Man
aging stru
ctural ch
ange for d
ecent job
s
ASEAN Community 2015: Managing integration for better jobs and shared prosperity 3 3
One challenge for some countries is that while they have increased manufacturing employment, their manufacturing bases remain narrow. Textiles and apparel, for example, account for 60.7 per cent of total manufacturing employment in Cambodia, andinVietNam35.2percent(Figure3-2).InLaoPeople’s Democratic Republic, a third of manufac-turing employment is in food processing. These labour-intensive industries (textiles, apparel, and food) are critical in these countries to productively absorb jobseekers, including those leaving agricul-ture. Nevertheless efforts are also required to lay and strengthen the foundations for higher productivity manufacturing industries.2
Structural shifts in the labour market have played an important role in raising aggregate labourproductivity.Forsevencountries,Table3-1compares labour productivity (GDP per worker) in each subsector with that of agriculture – showing that it is highest in finance, insurance and real estate. A key challenge for some countries is that
2 For a comprehensive discussion, see UNIDO: Industrial Development Report 2013: Sustaining employment growth: The role of manufacturing and structural change (Vienna, 2013).
the bulk of job creation in recent years has taken place in subsectors where levels of productivity are not significantly higher than in agriculture – and sometimes lower. In the case of Cambodia, whereas labour productivity is highest in services subsectors, the bulk of job creation has taken place in manufac-turing, where levels of productivity are marginally lower than in agriculture. In Malaysia, services have accounted for the bulk of job creation in recent years, but levels of productivity in wholesale and retail trade, hotels and restaurants and community, social, personal and other services are also lower than in agriculture or in manufacturing, whose share of total employment has declined. In Indonesia and the Philippines, the bulk of job growth has also been in wholesale and retail trade, hotels and restaurants and community, social, personal and other services, where levels of productivity are double that in agri-culture,butathirdofthatinmanufacturing:inthecaseofIndonesiabetween2003and2013,thesametwoservicessectorsaccountedfor71.9percentofadditional jobs created, while in the Philippines theyaccountedfor54.8percent.
The wide differences in levels of productivity between sectors reveal opportunities for structural
Food Textiles and apparel Wood products Chemicals Metals
Vehicles Electrical equipment Machinery Other manufacturing
Source: ILO estimates based on official national sources.
Cambodia (2012)
Indonesia (2010)
Lao PDR (2010)
Philippines (2011)
Thailand (2010)
Viet Nam (2012)
Figure 3-2 Share of total manufacturing employment by subsector, various years (per cent)
0% 10% 20% 30% 40% 50% 60% 70% 80% 90% 100%
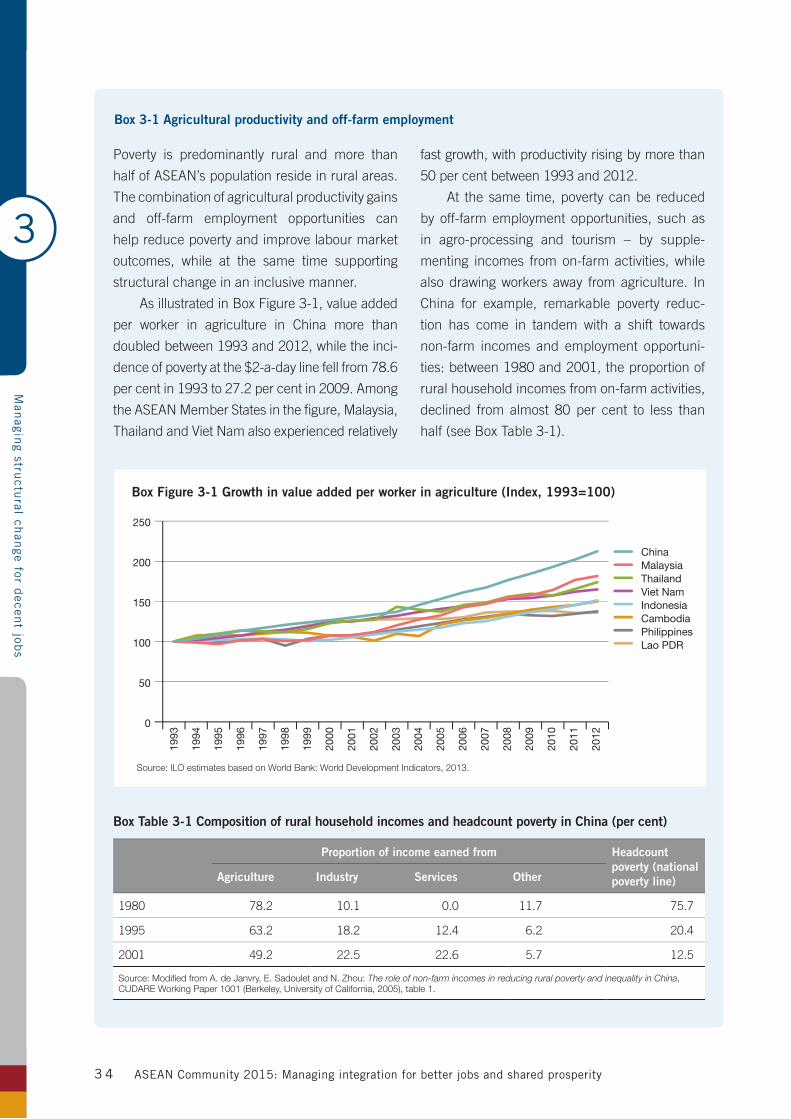
3
Man
aging stru
ctural ch
ange for d
ecent job
s
ASEAN Community 2015: Managing integration for better jobs and shared prosperity3 4
Poverty is predominantly rural and more than
half of ASEAN’s population reside in rural areas.
The combination of agricultural productivity gains
and off-farm employment opportunities can
help reduce poverty and improve labour market
outcomes, while at the same time supporting
structural change in an inclusive manner.
As illustrated in Box Figure 3-1, value added
per worker in agriculture in China more than
doubled between 1993 and 2012, while the inci-
dence of poverty at the $2-a-day line fell from 78.6
per cent in 1993 to 27.2 per cent in 2009. Among
the ASEAN Member States in the figure, Malaysia,
Thailand and Viet Nam also experienced relatively
fast growth, with productivity rising by more than
50 per cent between 1993 and 2012.
At the same time, poverty can be reduced
by off-farm employment opportunities, such as
in agro-processing and tourism – by supple-
menting incomes from on-farm activities, while
also drawing workers away from agriculture. In
China for example, remarkable poverty reduc-
tion has come in tandem with a shift towards
non-farm incomes and employment opportuni-
ties: between 1980 and 2001, the proportion of
rural household incomes from on-farm activities,
declined from almost 80 per cent to less than
half (see Box Table 3-1).
Box Table 3-1 Composition of rural household incomes and headcount poverty in China (per cent)
Proportion of income earned from Headcount poverty (national poverty line)Agriculture Industry Services Other
1980 78.2 10.1 0.0 11.7 75.7
1995 63.2 18.2 12.4 6.2 20.4
2001 49.2 22.5 22.6 5.7 12.5
Source: Modified from A. de Janvry, E. Sadoulet and N. Zhou: The role of non-farm incomes in reducing rural poverty and inequality in China, CUDARE Working Paper 1001 (Berkeley, University of California, 2005), table 1.
Box 3-1 Agricultural productivity and off-farm employment
Source: ILO estimates based on World Bank: World Development Indicators, 2013.
Box Figure 3-1 Growth in value added per worker in agriculture (Index, 1993=100)
ChinaMalaysiaThailandViet NamIndonesiaCambodiaPhilippinesLao PDR
0
50
100
150
200
250
1993
1994
1995
1996
1997
1998
1999
2000
2001
2002
2003
2004
2005
2006
2007
2008
2009
2010
2011
2012
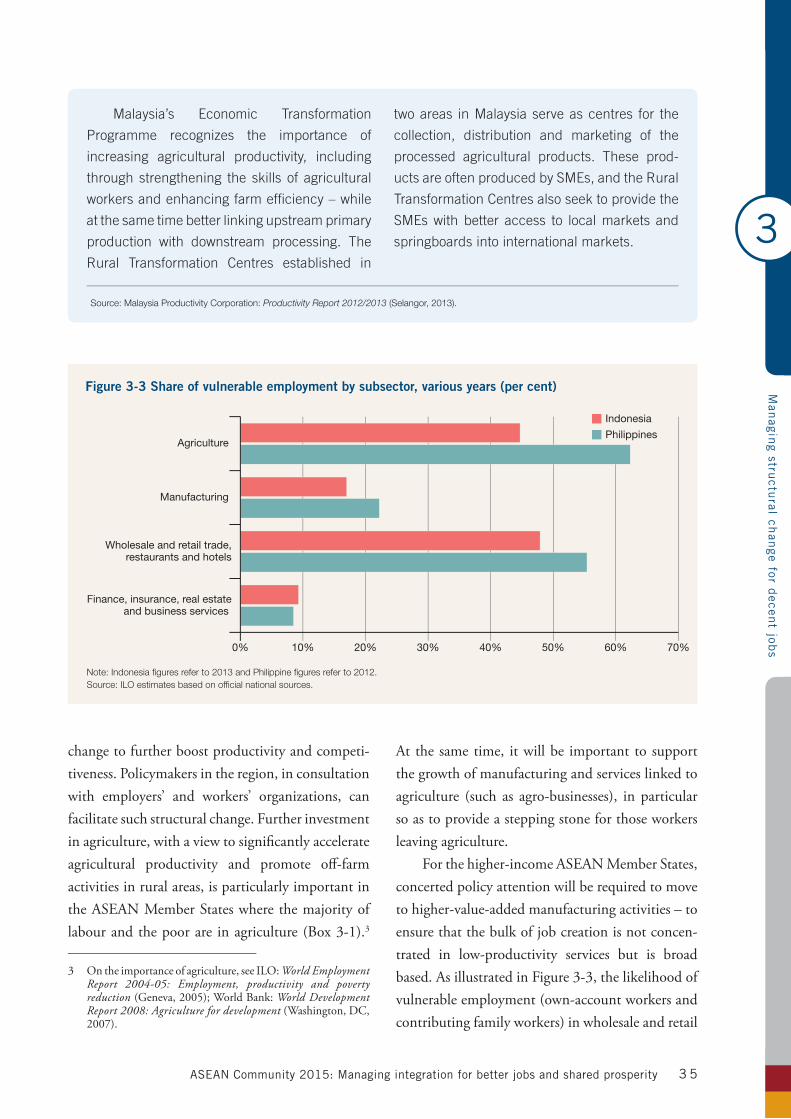
3
Man
aging stru
ctural ch
ange for d
ecent job
s
ASEAN Community 2015: Managing integration for better jobs and shared prosperity 3 5
change to further boost productivity and competi-tiveness. Policymakers in the region, in consultation with employers’ and workers’ organizations, can facilitate such structural change. Further investment in agriculture, with a view to significantly accelerate agricultural productivity and promote off-farm activities in rural areas, is particularly important in the ASEAN Member States where the majority of labourandthepoorare inagriculture(Box3-1).3
3 Ontheimportanceofagriculture,seeILO:World Employment Report 2004-05: Employment, productivity and poverty reduction(Geneva,2005);WorldBank:World Development Report 2008: Agriculture for development (Washington, DC, 2007).
At the same time, it will be important to support the growth of manufacturing and services linked to agriculture (such as agro-businesses), in particular so as to provide a stepping stone for those workers leaving agriculture.
For the higher-income ASEAN Member States, concerted policy attention will be required to move to higher-value-added manufacturing activities – to ensure that the bulk of job creation is not concen-trated in low-productivity services but is broad based.AsillustratedinFigure3-3,thelikelihoodofvulnerable employment (own-account workers and contributing family workers) in wholesale and retail
Malaysia’s Economic Transformation
Programme recognizes the importance of
increasing agricultural productivity, including
through strengthening the skills of agricultural
workers and enhancing farm efficiency – while
at the same time better linking upstream primary
production with downstream processing. The
Rural Transformation Centres established in
two areas in Malaysia serve as centres for the
collection, distribution and marketing of the
processed agricultural products. These prod-
ucts are often produced by SMEs, and the Rural
Transformation Centres also seek to provide the
SMEs with better access to local markets and
springboards into international markets.
Source: Malaysia Productivity Corporation: Productivity Report 2012/2013 (Selangor, 2013).
Note: Indonesia figures refer to 2013 and Philippine figures refer to 2012.Source: ILO estimates based on official national sources.
Finance, insurance, real estateand business services
Figure 3-3 Share of vulnerable employment by subsector, various years (per cent)
Indonesia
Philippines
0% 10% 20% 30% 40% 50% 60% 70%
Agriculture
Manufacturing
Wholesale and retail trade,restaurants and hotels
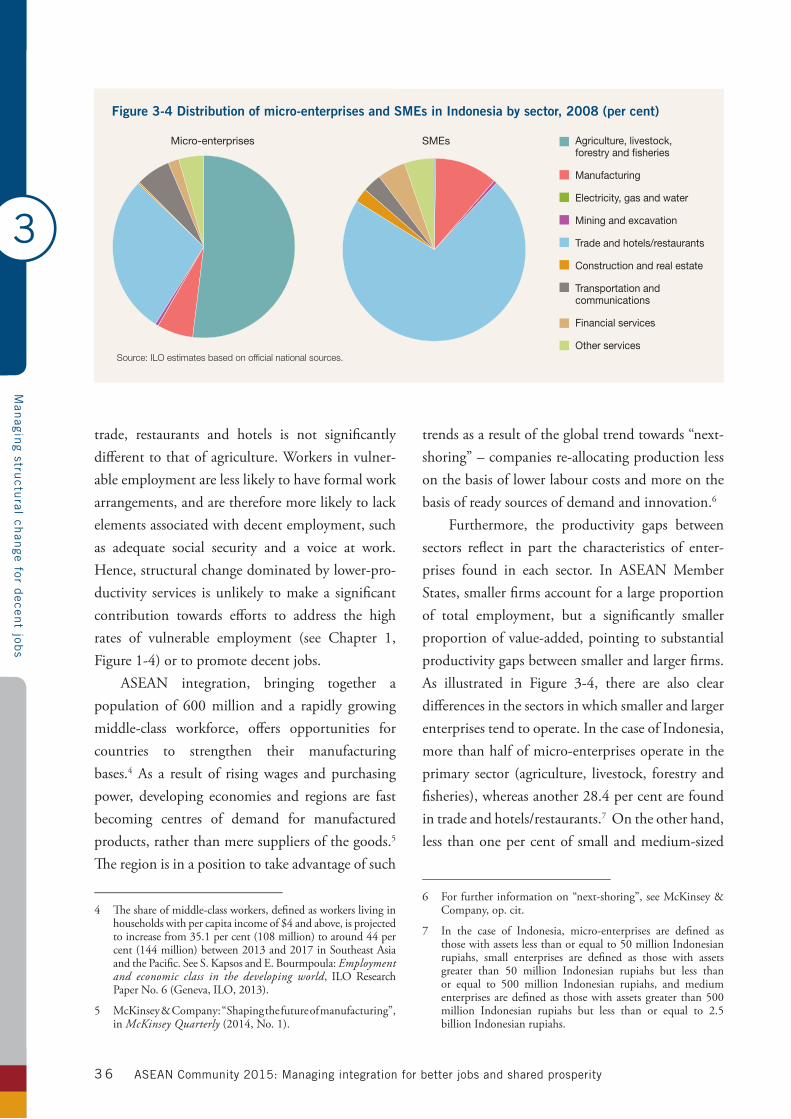
3
Man
aging stru
ctural ch
ange for d
ecent job
s
ASEAN Community 2015: Managing integration for better jobs and shared prosperity3 6
trade, restaurants and hotels is not significantly different to that of agriculture. Workers in vulner-able employment are less likely to have formal work arrangements, and are therefore more likely to lack elements associated with decent employment, such as adequate social security and a voice at work. Hence, structural change dominated by lower-pro-ductivity services is unlikely to make a significant contribution towards efforts to address the high rates of vulnerable employment (see Chapter 1, Figure1-4)ortopromotedecentjobs.
ASEAN integration, bringing together a population of 600 million and a rapidly growing middle-class workforce, offers opportunities for countries to strengthen their manufacturing bases.4 As a result of rising wages and purchasing power, developing economies and regions are fast becoming centres of demand for manufactured products, rather than mere suppliers of the goods.5 The region is in a position to take advantage of such
4 Theshareofmiddle-classworkers,definedasworkerslivinginhouseholdswithpercapitaincomeof$4andabove,isprojectedtoincreasefrom35.1percent(108million)toaround44percent(144million)between2013and2017inSoutheastAsiaandthePacific.SeeS.KapsosandE.Bourmpoula:Employment and economic class in the developing world, ILO Research PaperNo.6(Geneva,ILO,2013).
5 McKinsey&Company:“Shapingthefutureofmanufacturing”,in McKinsey Quarterly(2014,No.1).
trends as a result of the global trend towards “next-shoring” – companies re-allocating production less on the basis of lower labour costs and more on the basis of ready sources of demand and innovation.6
Furthermore, the productivity gaps between sectors reflect in part the characteristics of enter-prises found in each sector. In ASEAN Member States, smaller firms account for a large proportion of total employment, but a significantly smaller proportion of value-added, pointing to substantial productivity gaps between smaller and larger firms. As illustrated in Figure 3-4, there are also cleardifferences in the sectors in which smaller and larger enterprises tend to operate. In the case of Indonesia, more than half of micro-enterprises operate in the primary sector (agriculture, livestock, forestry and fisheries),whereasanother28.4percentarefoundintradeandhotels/restaurants.7 On the other hand, less than one per cent of small and medium-sized
6 For further information on “next-shoring”, see McKinsey & Company, op. cit.
7 In the case of Indonesia, micro-enterprises are defined as those with assets less than or equal to 50 million Indonesian rupiahs, small enterprises are defined as those with assets greater than 50 million Indonesian rupiahs but less than or equal to 500 million Indonesian rupiahs, and medium enterprises are defined as those with assets greater than 500 million Indonesian rupiahs but less than or equal to 2.5 billion Indonesian rupiahs.
Source: ILO estimates based on official national sources.
Figure 3-4 Distribution of micro-enterprises and SMEs in Indonesia by sector, 2008 (per cent)
Micro-enterprises SMEs Agriculture, livestock, forestry and fisheries
Manufacturing
Electricity, gas and water
Mining and excavation
Trade and hotels/restaurants
Construction and real estate
Transportation and communications
Financial services
Other services
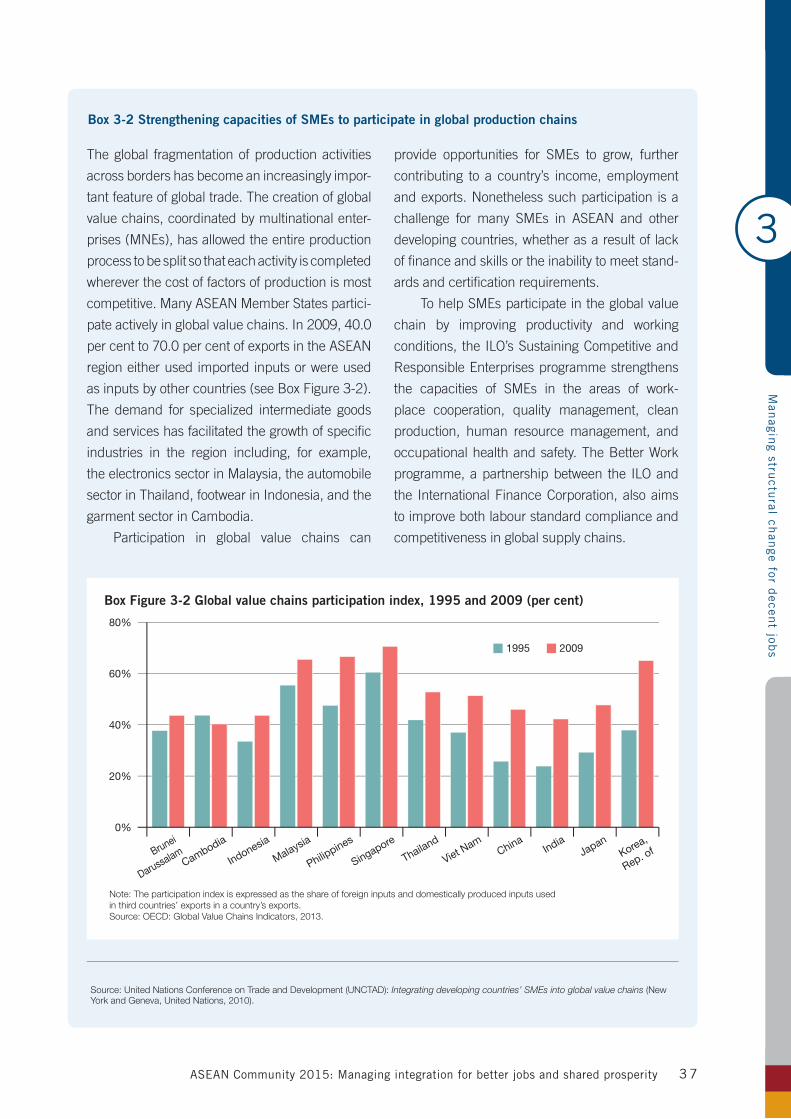
3
Man
aging stru
ctural ch
ange for d
ecent job
s
ASEAN Community 2015: Managing integration for better jobs and shared prosperity 3 7
The global fragmentation of production activities
across borders has become an increasingly impor-
tant feature of global trade. The creation of global
value chains, coordinated by multinational enter-
prises (MNEs), has allowed the entire production
process to be split so that each activity is completed
wherever the cost of factors of production is most
competitive. Many ASEAN Member States partici-
pate actively in global value chains. In 2009, 40.0
per cent to 70.0 per cent of exports in the ASEAN
region either used imported inputs or were used
as inputs by other countries (see Box Figure 3-2).
The demand for specialized intermediate goods
and services has facilitated the growth of specific
industries in the region including, for example,
the electronics sector in Malaysia, the automobile
sector in Thailand, footwear in Indonesia, and the
garment sector in Cambodia.
Participation in global value chains can
provide opportunities for SMEs to grow, further
contributing to a country’s income, employment
and exports. Nonetheless such participation is a
challenge for many SMEs in ASEAN and other
developing countries, whether as a result of lack
of finance and skills or the inability to meet stand-
ards and certification requirements.
To help SMEs participate in the global value
chain by improving productivity and working
conditions, the ILO’s Sustaining Competitive and
Responsible Enterprises programme strengthens
the capacities of SMEs in the areas of work-
place cooperation, quality management, clean
production, human resource management, and
occupational health and safety. The Better Work
programme, a partnership between the ILO and
the International Finance Corporation, also aims
to improve both labour standard compliance and
competitiveness in global supply chains.
Box 3-2 Strengthening capacities of SMEs to participate in global production chains
Note: The participation index is expressed as the share of foreign inputs and domestically produced inputs used in third countries’ exports in a country’s exports.Source: OECD: Global Value Chains Indicators, 2013.
Box Figure 3-2 Global value chains participation index, 1995 and 2009 (per cent)
0%
20%
40%
60%
80%
Brunei
DarussalamCambodia
Indonesia
Malaysia
Philippines
Singapore
Thailand
Viet Nam
ChinaIndia
JapanKorea,
Rep. of
1995 2009
Source: United Nations Conference on Trade and Development (UNCTAD): Integrating developing countries’ SMEs into global value chains (New York and Geneva, United Nations, 2010).
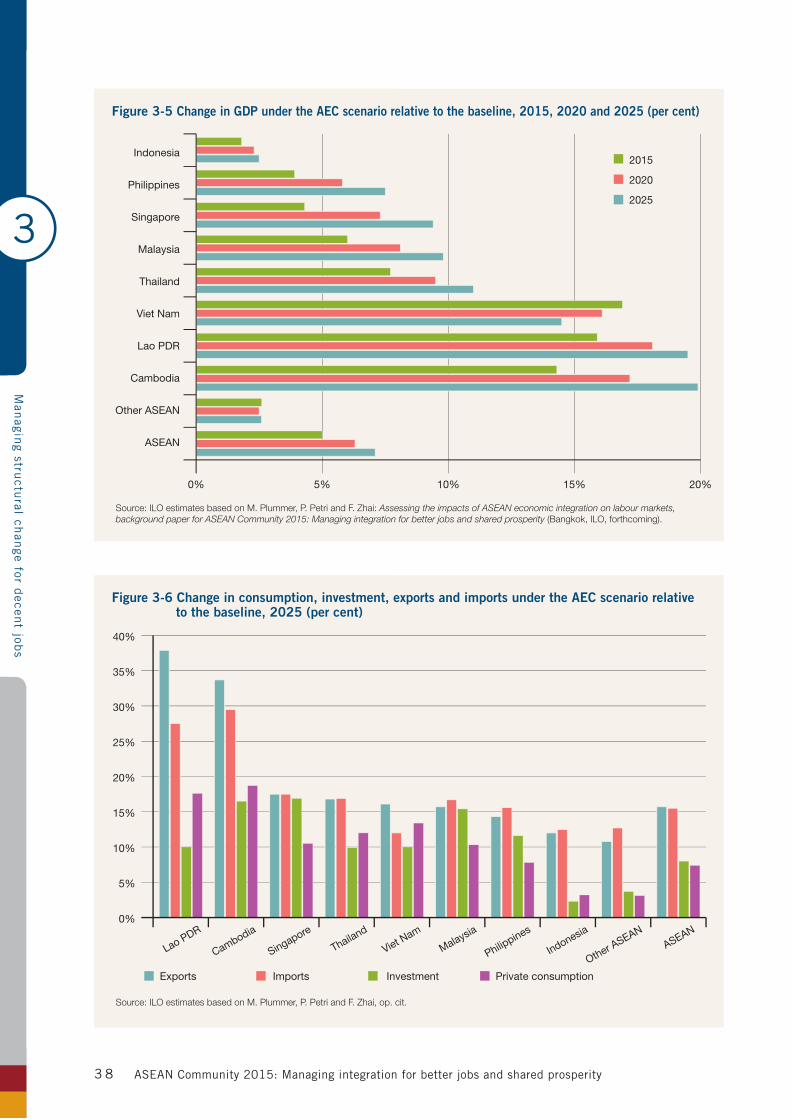
3
Man
aging stru
ctural ch
ange for d
ecent job
s
ASEAN Community 2015: Managing integration for better jobs and shared prosperity3 8
Source: ILO estimates based on M. Plummer, P. Petri and F. Zhai: Assessing the impacts of ASEAN economic integration on labour markets, background paper for ASEAN Community 2015: Managing integration for better jobs and shared prosperity (Bangkok, ILO, forthcoming).
Indonesia
Philippines
Singapore
Malaysia
Thailand
Viet Nam
Lao PDR
Cambodia
Other ASEAN
ASEAN
Figure 3-5 Change in GDP under the AEC scenario relative to the baseline, 2015, 2020 and 2025 (per cent)
2015
2020
2025
0% 5% 10% 15% 20%
Source: ILO estimates based on M. Plummer, P. Petri and F. Zhai, op. cit.
Figure 3-6 Change in consumption, investment, exports and imports under the AEC scenario relative to the baseline, 2025 (per cent)
Exports Imports Investment Private consumption
0%
5%
10%
15%
20%
25%
30%
35%
40%
ASEAN
Other ASEAN
Cambodia
Indonesia
Lao PDR
Malaysia
Philippines
Singapore
Thailand
Viet Nam
3
Man
aging stru
ctural ch
ange for d
ecent job
s
ASEAN Community 2015: Managing integration for better jobs and shared prosperity 3 9
enterprises(SMEs)areinagriculturewhile71.9percentareintradeandhotels/restaurants.Facilitatingstructural change will consequently require strength-ening the capacities of micro-firms and SMEs to seize opportunities in higher value added activities and sectors, including through good management andimprovedlabourpractices(Box3-2),facilitatedaccess to finance, tax incentives, business develop-ment services, partnerships with larger enterprises, and integration into the formal economy.
Impact of ASEAN trade integration on labour marketsASEAN Member States have made substantial progress in realizing the ASEAN Economic Community (see Chapter 1). Nonetheless, as noted by the ASEAN Community Progress Monitoring System, there remain significant barriers to integration.8 In recog-nition,ASEANleadersagreedat the23rdSummitto intensify efforts to deepen and broaden economic integration.9 They also agreed to develop a post-2015 vision for the ASEAN Community.10
What are the economic and labour market impli-cations of such deepening ASEAN trade integration? To answer this question, this report has used an innovative computable general equilibrium (CGE) model.11 This simulates the economic and labour market impact of an AEC scenario that, over time, includes:(i)removaloftheremainingintra-regionaltariffs; (ii) liberalization of non-tariff barriers for goods
8 ASEAN: ASEAN Community Progress Monitoring System: Full report 2012: Measuring progress towards the ASEAN economic community and the ASEAN Socio-Cultural Community(Jakarta,2013).
9 Chairman’sStatementofthe23rdASEANSummit:OurPeople,OurFutureTogether,BandarSeriBegawan,Oct.2013.
10 Bandar Seri Begawan Declaration on the ASEAN Community’s post2015vision,BandarSeriBegawan,Oct.2013.
11 The CGE model employed in this study was developed by Michael Plummer, Peter A. Petri and Fan Zhai in collaboration with the ILO. More detailed results of the model simulations areavailable inM.Plummer,P.Petri andF.Zhai:Assessing the impacts of ASEAN integration on Labour Markets, background paper prepared for ASEAN Community 2015: Managing integration for better jobs and shared prosperity (Bangkok, ILO, forthcoming).
and services by 50.0 per cent; and (iii) trade facilita-tion in the form of a 20.0 per cent reduction in fixed trade costs.12 The AEC scenario is then compared to a baseline scenario, which is what is expected to happen in the absence of the above policy measures. This model is novel in that it represents more realisti-cally the way labour markets in developing ASEAN Member States operate. In particular, it decomposes the supply of labour according to skill levels, sex and industry. There are varying impacts on wage rates depending on the skill level (see Annex A for details of the model, including its assumptions).
As indicated in Figure 3-5, GDP in theASEAN region would be 5.0 per cent higher than thebaselinein2015,6.3percenthigherin2020,and 7.1 per cent higher in 2025.13 Nonetheless, the gains differ substantially by country. Cambodia, for example,standstobenefitthemostby2025(19.9per cent) and Indonesia and “Other ASEAN” the least (2.5 per cent).14 The lower-income ASEAN Member States in general see the largest increases in GDP relative to the baseline – in part as consumers and producers in these countries face relatively high trade barriers and costs, and thus stand to gain most from increased international trade.
Strong export growth underpins the expansion
12 The model has been calibrated to 2007 data. For tariff rates, the status quo of applied intra-ASEAN tariffs as of 2007 has been applied. Non-tariff barriers are estimated via the disaggregated trade restrictiveness indexes constructed by the World Bank for goods and the Peterson Institute for International Economics for services, and modelled using both rent-generated tariff equivalent and “iceberg” costs approaches. Reductions are linearly implemented within the eight years of 2008-15. The policy shock induced in the model is limited to trade measures. Investment measures are also a core component of ASEAN integration but are not simulated explicitly while often there is a close nexus between trade and investment (see for example P. Athukorala and J.Menon: “AFTA and the investment-trade nexus”, inWorld Economy(1997,Vol.20,No.2),pp.159-74.
13 Measuring changes in economic welfare using the equivalent variation technique, which measures the income equivalent of the increase in utility due to change in prices, yields similar results as those of GDP.
14 Due to data limitations, Brunei Darussalam and Myanmar are grouped under “Other ASEAN”. Furthermore, GDP is simulated to decrease in some non-ASEAN Member States relative to the baseline as a result of trade diversion, notably in RepublicofKorea(by-0.3percent),China(by-0.2percent),India (by -0.2 per cent) and Japan (by -0.1 per cent).
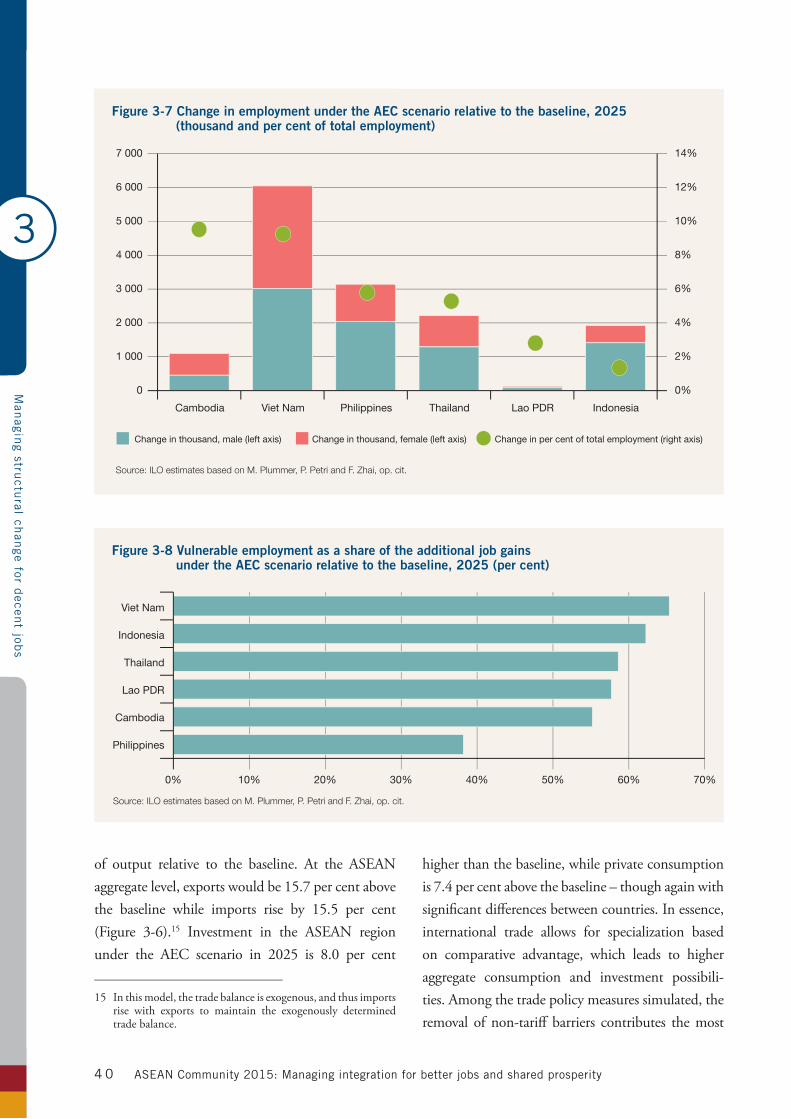
3
Man
aging stru
ctural ch
ange for d
ecent job
s
ASEAN Community 2015: Managing integration for better jobs and shared prosperity4 0
of output relative to the baseline. At the ASEAN aggregate level, exports would be 15.7 per cent above the baseline while imports rise by 15.5 per cent (Figure 3-6).15 Investment in the ASEAN region under the AEC scenario in 2025 is 8.0 per cent
15 In this model, the trade balance is exogenous, and thus imports rise with exports to maintain the exogenously determined trade balance.
higher than the baseline, while private consumption is7.4percentabovethebaseline–thoughagainwithsignificant differences between countries. In essence, international trade allows for specialization based on comparative advantage, which leads to higher aggregate consumption and investment possibili-ties. Among the trade policy measures simulated, the removal of non-tariff barriers contributes the most
Source: ILO estimates based on M. Plummer, P. Petri and F. Zhai, op. cit.
Figure 3-7 Change in employment under the AEC scenario relative to the baseline, 2025 (thousand and per cent of total employment)
Change in thousand, male (left axis) Change in thousand, female (left axis) Change in per cent of total employment (right axis)
Cambodia IndonesiaLao PDRPhilippines ThailandViet Nam
0
1 000
2 000
3 000
4 000
5 000
6 000
7 000
0%
2%
4%
6%
8%
10%
12%
14%
Source: ILO estimates based on M. Plummer, P. Petri and F. Zhai, op. cit.
Viet Nam
Indonesia
Thailand
Lao PDR
Cambodia
Philippines
Figure 3-8 Vulnerable employment as a share of the additional job gains under the AEC scenario relative to the baseline, 2025 (per cent)
0% 10% 20% 30% 40% 50% 60% 70%
3
Man
aging stru
ctural ch
ange for d
ecent job
s
ASEAN Community 2015: Managing integration for better jobs and shared prosperity 41
to the gains; excluding this factor would indicate substantially smaller gains in output.
In addition to showing improvements in output, investment and consumption, the model also points to increases in total employment in 2025 relative to thebaseline.ThisisillustratedinFigure3-7forthesix ASEAN Member States for which sufficiently detailed labour market information is available – Cambodia, Indonesia, Lao People’s Democratic Republic, Philippines, Thailand and Viet Nam.16 In Cambodia, total employment in 2025 under the AEC scenario would be 1.1 million above the baseline.Suchagainrepresents9.8percentoftotalemployment in 2025. In Viet Nam, the additional jobs over the baseline are 6.0 million, representing 9.5percentoftotalemployment.Indonesiagains
16 For the decomposition of labour in the model, micro-data files of labour force surveys are required but such files were made available to the ILO only in the six ASEAN Member States.
anadditional1.9millionjobsoverthebaseline,butthis represents only 1.3per cent of total employ-ment. An important factor behind these variations across the countries is the degree of economic and labour market dependence on international trade, given that the model is simulating the economic and labour market impact of trade measures. In Cambodia and Viet Nam, total international trade (exports and imports) accounted for 87.8 per cent and 155.0 per cent of GDP respectively in 2007 (the base year of the model), whereas in Indonesia, thecorrespondingsharewas43.8percent.17
Therearealsogenderdifferences:inCambodiaand Viet Nam women account for half or more of potential job gains, but in Indonesia, Lao People’s Democratic Republic, Philippines and Thailand
17 ASEAN: ASEAN Community in Figures (ACIF) 2010 (Jakarta, 2011).
In 2013, ASEAN leaders adopted the ASEAN
Declaration on Strengthening Social Protection,
which reiterated their commitment to accelerate
the extension of social protection. This should
start with a social protection floor for all residents
that will gradually expand towards more compre-
hensive social security systems.
The establishment of social protection floors
has increasingly been recognized by all ASEAN
Member States as an efficient approach to
combating poverty, inequality, and exclusion and
as a key element of national development strat-
egies. Social protection contributes not only to
the social dimension of sustainable development
(it contributes to reducing poverty, social exclu-
sion, and inequalities), but also to the economic
dimension (it has a positive impact on human
capital development, acts as a stabilizer in times
of crisis, and facilitates economic growth) and to
the environmental dimension (it makes people
more resilient to natural shocks and helps facili-
tate quick recovery).
The primary objective of social protection
floors is to guarantee access to necessary goods
and services (essential health care, maternity care,
nutrition, education, and child care) and provide
income security throughout the life cycle. To
achieve this, countries need to combine interven-
tions with measures to guarantee the availability,
and acceptable quality, of social services.
The social protection floor approach calls for
universal coverage of all residents and children,
but specific support may be needed for disad-
vantaged groups and people with special needs.
Once a floor has been established, countries
should seek to provide higher levels of protection
to as many people as possible, and as soon as
possible.
Box 3-3 Social protection floors
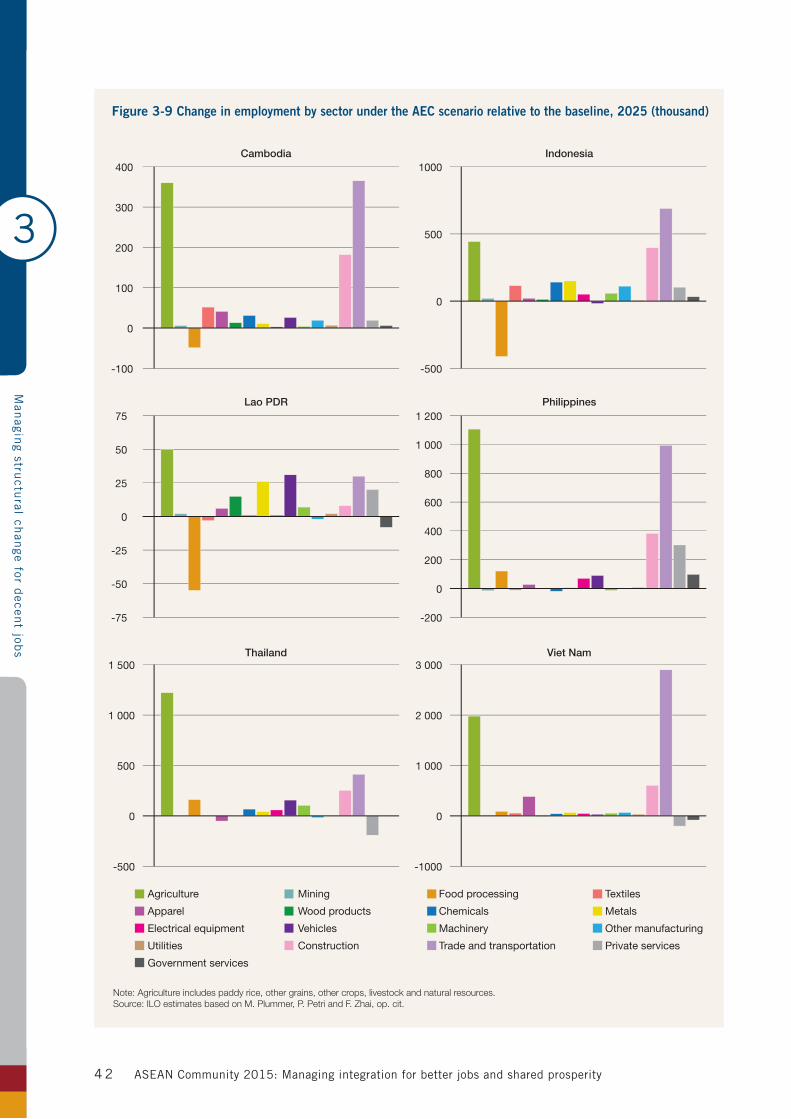
3
Man
aging stru
ctural ch
ange for d
ecent job
s
ASEAN Community 2015: Managing integration for better jobs and shared prosperity4 2
Note: Agriculture includes paddy rice, other grains, other crops, livestock and natural resources.Source: ILO estimates based on M. Plummer, P. Petri and F. Zhai, op. cit.
Agriculture Mining Food processing Textiles
Apparel Wood products Chemicals Metals
Electrical equipment Vehicles Machinery Other manufacturing
Utilities Construction Trade and transportation Private services
Government services
Figure 3-9 Change in employment by sector under the AEC scenario relative to the baseline, 2025 (thousand)
-100
0
100
200
300
400
-500
0
500
1000
-75
-50
-25
0
25
50
75
-200
0
200
400
600
800
1 000
1 200
-500
0
500
1 000
1 500
-1000
0
1 000
2 000
3 000
Cambodia Indonesia
Lao PDR Philippines
Thailand Viet Nam
3
Man
aging stru
ctural ch
ange for d
ecent job
s
ASEAN Community 2015: Managing integration for better jobs and shared prosperity 4 3
theyaccountfor40percentorless.Givenwomen’slow labour force participation rates across ASEAN Member States (see Annex F, Table F1-2), the results highlight the need to carefully monitor and manage the gender impacts of ASEAN integration and further support women’s efforts to enter and stay in the labour force. Furthermore, vulnerable employ-ment accounts for over half of the additional job gains in all six economies except in the Philippines
(Figure3-8).18 The prospect of large gains in such jobs calls for coordinated labour market poli-cies to improve working conditions and reduce vulnerability. Critical in this context is the estab-lishment of social protection floors as highlighted in the ASEAN Declaration on Strengthening Social Protection(Box3-3).
18 Results assume that the share of vulnerable employment in each specific economic subsector in the base year remains constant.
The automobile industry in ASEAN is a corner-
stone of the regional production network,
contributing significantly to value added, exports
and employment. In 2013, ASEAN’s auto assem-
blers produced 4.4 million vehicles. Perhaps more
importantly, investments and policies aimed at
linking multinational manufacturers with suppliers
have led to the development of domestic suppliers
and support industries. Further improvements of
customs and standards harmonization, transport
and logistics, and investment liberalization and
facilitation that are part of the AEC are expected
to deepen regionalization of production networks
and broaden regional supply chains, particularly
to the CLMV countries.
The adoption of an ASEAN single market,
with the entailing consolidation of production
networks, also provides opportunities for the
more developed ASEAN economies. Indonesia,
for example, can build on the knowledge transfer
between multinational enterprises, particularly
Japanese firms, and domestic firms that has
taken place in the past decades to further develop
the capacities of domestic firms to participate in
regional production networks. Malaysia will need
a new impetus in industrial upgrading and inter-
national competitiveness to nudge the industry
towards a more strategic productive coalition with
multiple stakeholders, including trade unions. The
Philippines is already involved in the production
of automotive parts and components, and further
building of capacities is required to explore the
wider market resulting from the AEC.
In Thailand, the AEC could induce suppliers
to relocate manufacturing to countries bordering
Thailand that have accessible road networks –
while Thailand becomes a regional focal point,
controlling satellite automobile production in the
CLMV and neighbouring countries. The AEC thus
presents opportunities to Thailand to produce
higher-value-added products and become
increasingly involved with process and product
engineering as well as with research and devel-
opment. Consequently, the Federation of Thai
Industries is optimistic about the future of the
automobile industry, with the Federation projecting
total production output to rise to between 3.5
million and four million units by 2020.
Box 3-4 The automobile industry in ASEAN
Source: S.Y. Chia: The ASEAN Economic Community: Progress, challenges, and prospects, ADBI Working Paper Series No. 440 (Tokyo, Oct. 2013); D. Irawati and R. Rutten: “The Indonesian automotive industry in the global–local production networks of ASEAN”, in D. Irawati and R. Rutten (ed.): Emerging knowledge economies in Asia: Current trends in ASEAN 5 (New York, Routledge, 2014), pp. 75-94; M.A.D. Rosellon and E.M. Medalla: “ASEAN+1 FTAs and global value chains in East Asia: The case of the Philippine automotive and electronics sectors”, in C. Findlay (ed.): ASEAN+1 FTAs and global value chains in East Asia (Jakarta, ERIA, 2011), pp. 275-320; K. Techakanont: ASEAN Community 2015: Managing integration for better jobs and shared prosperity: A case of Thailand’s automotive sector, background paper for ASEAN Community 2015: Managing integration for better jobs and shared prosperity (Bangkok, ILO, forthcoming). P. Wad and V.G.R. Chandran Govindaraju: “Automotive industry in Malaysia: An assessment of its development”, in International Journal of Automotive Technology and Management (2011, Vol. 11, No. 2), pp. 152–171.
3
Man
aging stru
ctural ch
ange for d
ecent job
s
ASEAN Community 2015: Managing integration for better jobs and shared prosperity4 4
The model also indicates changes in the distri-bution of employment between sectors. In general, the additional jobs relative to the baseline are in agriculture, trade and transportation, and construc-tion(Figure3-9).Tradeandtransportationaccountsfor about half the increase in Viet Nam, around a third in Cambodia, Indonesia, and Philippines and around a fifth in Lao People’s Democratic Republic and Thailand. Agriculture, on the other hand, accounts for the largest share of the job gains in Lao People’s Democratic Republic, Philippines and Thailand.19 In Cambodia and Indonesia, the construction sector accounts for a relatively large share of the job gains, at around 20 per cent.
In addition, the simulation results point to rela-tivelylargegainsoverthebaselineinothersectors:in textiles, apparel and chemicals in Cambodia; in metals, chemicals and textiles in Indonesia; in vehicles, metals and private services in Lao People’s Democratic Republic; in private services, food processing and vehicles in the Philippines; in food processing, vehicles, machinery in Thailand; and in apparel and food processing in Viet Nam (see Box 3-4foradiscussionontheautomobileindustryinASEAN). On the other hand, comparatively large job losses relative to the baseline could take place in food processing in Cambodia, Indonesia and Lao People’s Democratic Republic. Such potential job losses suggest that the upstream and downstream linkages with agriculture remain relatively weak in these countries and call for support in strengthening these ties. In Thailand and Viet Nam, job losses relative to the baseline could take place in private services, while in the Philippines losses could be seen in chemicals and mining.
The potential job gains and losses relative to the baseline have the potential to slow or accelerate
19 Furthermore, there will be redistribution of employment within a sector. For example, in the Philippines, there is a concern about the decline in the sugar subsector as a result of theAEC.SeeS.B.Tabladillo:Decent work in an integrated ASEAN context: The case of the Philippine sugarcane industry (Geneva,InstituteofLaborStudies,2013).
structural change in the six ASEAN Member States (see Annex A, Table A1). In Cambodia, for example, under the baseline scenario the share of agriculture in total employment would decline from 55.0 per cent in 2010 to 50.0 per cent in 2025, but the implemen-tation of the outlined AEC scenario measures has the potential to further reduce the share of agricultural employment to 48.3 per cent in 2025 (a furtherreduction of 1.7 percentage points). Despite the abso-lute gains in agricultural employment in 2025 in all six countries, the share of agriculture in total employ-ment declines further in Cambodia, Indonesia, Lao People’s Democratic Republic and Viet Nam – as job gains in non-agricultural employment are larger than those in agriculture. In Thailand and the Philippines, the share of agricultural employment declines between 2010 and 2025 but the implementation of the AEC trade measures is simulated to slow the pace of decline.
In Cambodia, between 2010 and 2025 under the baseline scenario, the share of industry in total employment increases from14.9percent to18.1percent,butundertheAECscenarioitrisesto19.4percent(orby1.3percentagepoints).Thisgrowthis driven primarily by construction. For services the share increases under the baseline scenario by 1.8 percentage points, driven by trade and transporta-tion;undertheAECscenarioitrisesafurther0.4percentage points.
In Indonesia and Thailand, the share of industry and services in total employment continues to increase under the baseline scenario, driven by construction and by trade and transportation. In Indonesia, the situation does not change much under the AEC scenario. In Thailand, on the other hand, under the AEC scenario the share of employ-ment in trade and transportation could decline by 0.7 percentage points, and in private services by 0.6 percentage points.
In Lao People’s Democratic Republic structural change is slower. Between 2010 and 2025 under the baseline scenario the share of industrial employment
3
Man
aging stru
ctural ch
ange for d
ecent job
s
ASEAN Community 2015: Managing integration for better jobs and shared prosperity 4 5
in total employment would increase by only 1.0 percentage point and under the AEC scenario by another half a percentage point. The largest growth is in wood products.
In both the Philippines and Viet Nam, the share of services employment continues to increase under thebaselinescenario–by5.4percentagepointsinthe Philippines and 7.8 percentage points in Viet Nam. In the Philippines, the AEC trade measures do not have a significant impact. In Viet Nam, however, they would increase the share of employ-ment in trade and transportation by 2.0 percentage points in 2025, while the share of private services would decrease by 1.0 percentage point.
Taken together, these models highlight the potential rise and decline of specific sectors as a result of trade measures. But it is important to emphasize that ASEAN Member States also have at their disposal a wide range of policies to influence patterns of structural change, including industrial policies aimed at supporting the growth of specific sectors. Box 3-5 highlights the potential role ofindustrial policies to support structural change, higher quality jobs and growth.
The business process outsourcing (BPO) sector
in the Philippines has seen remarkable growth
in the past decade. Export revenues from the
sector grew ten-fold from $1.3 billion in 2004 to
$13.3 billion in 2013, while employment in the
sector grew nine-fold from around 101,000 in
2004 to around 900,000 in 2013, representing
around three per cent of total employment. An
industrial policy aimed at supporting the growth
of the sector has played an important role in
such developments.
As the BPO sector in the Philippines began
to grow, the Philippines Government in 2001
established the Information Technology and
E-Commerce Council to develop the country as
an E-services hub. In 2005, the Government
also launched the Philippine Cyberservices
Corridor, covering a number of urban centres.
Furthermore, in 2006, the Training for Work
Scholarship Program significantly focused on
the IT industry to provide educational grants for
the training of BPO applicants. The Government
has also worked closely with the Business
Processing Association of the Philippines to
highlight the Philippines as a prime destination
for BPO investors and has provided a number
of incentives including income tax holidays, tax
and duty exemption on imported capital equip-
ment, the ability to employ foreign nationals,
and simplified export and import procedures.
The Philippine Development Plan 2011-16 has
also identified the BPO sector as one of the top
ten priority development areas with the highest
potential to contribute to both growth and job
creation.
While call centres have contributed the most
to the growth of the sector, the Government has
recognized the need to nurture higher produc-
tivity segments including back-office services,
design process delivery, and services for tran-
scription, animation, and game development.
This involves strengthening the skills base,
developing infrastructure and offering targeted
fiscal and non-fiscal incentives.
Box 3-5 Industrial policy and the business process outsourcing sector in the Philippines
Source: “Economic update: The Philippines’ revenues from BPO set to rise 15 per cent in 2014”, in Oxford Business Group, 9 Feb. 2014; N. Magtibay-Ramos, G, Estrada and J. Felipe: An analysis of the Philippine business process outsourcing industry, Economics and Research Department Working Paper Series No. 93 (Manila, ADB, 2007); Philippines Development Plan 2011-2016, Manila, May 2011.
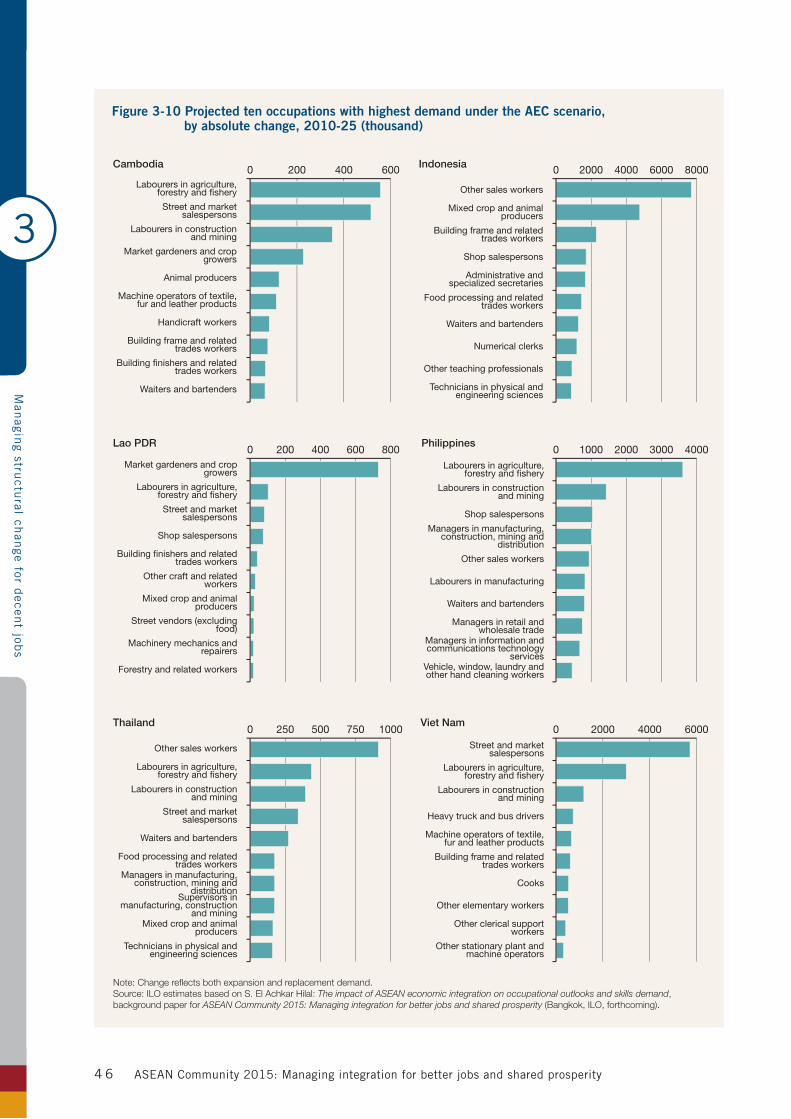
3
Man
aging stru
ctural ch
ange for d
ecent job
s
ASEAN Community 2015: Managing integration for better jobs and shared prosperity4 6
Note: Change reflects both expansion and replacement demand.Source: ILO estimates based on S. El Achkar Hilal: The impact of ASEAN economic integration on occupational outlooks and skills demand, background paper for ASEAN Community 2015: Managing integration for better jobs and shared prosperity (Bangkok, ILO, forthcoming).
Figure 3-10 Projected ten occupations with highest demand under the AEC scenario, by absolute change, 2010-25 (thousand)
Cambodia Indonesia
Lao PDR Philippines
Thailand Viet Nam
Waiters and bartenders
Building finishers and related trades workers
Building frame and related trades workers
Handicraft workers
Machine operators of textile, fur and leather products
Animal producers
Market gardeners and crop growers
Labourers in construction and mining
Street and market salespersons
Labourers in agriculture, forestry and fishery
Forestry and related workers
Machinery mechanics and repairers
Street vendors (excluding food)
Mixed crop and animal producers
Other craft and related workers
Building finishers and related trades workers
Shop salespersons
Street and market salespersons
Labourers in agriculture, forestry and fishery
Market gardeners and crop growers
Technicians in physical and engineering sciences
Mixed crop and animal producers
Supervisors in manufacturing, construction
and mining
Managers in manufacturing, construction, mining and
distribution
Food processing and related trades workers
Waiters and bartenders
Street and market salespersons
Labourers in construction and mining
Labourers in agriculture, forestry and fishery
Other sales workers
Vehicle, window, laundry and other hand cleaning workers
Managers in information and communications technology
services
Managers in retail and wholesale trade
Waiters and bartenders
Labourers in manufacturing
Other sales workers
Managers in manufacturing, construction, mining and
distribution
Shop salespersons
Labourers in construction and mining
Labourers in agriculture, forestry and fishery
Other stationary plant and machine operators
Other clerical support workers
Other elementary workers
Cooks
Building frame and related trades workers
Machine operators of textile, fur and leather products
Heavy truck and bus drivers
Labourers in construction and mining
Labourers in agriculture, forestry and fishery
Street and market salespersons
Technicians in physical and engineering sciences
Other teaching professionals
Numerical clerks
Waiters and bartenders
Food processing and related trades workers
Administrative and specialized secretaries
Shop salespersons
Building frame and related trades workers
Mixed crop and animal producers
Other sales workers
0 200 400 600 0 2000 4000 6000 8000
0 200 400 600 800 0 1000 2000 3000 4000
0 250 500 750 1000 0 2000 4000 6000
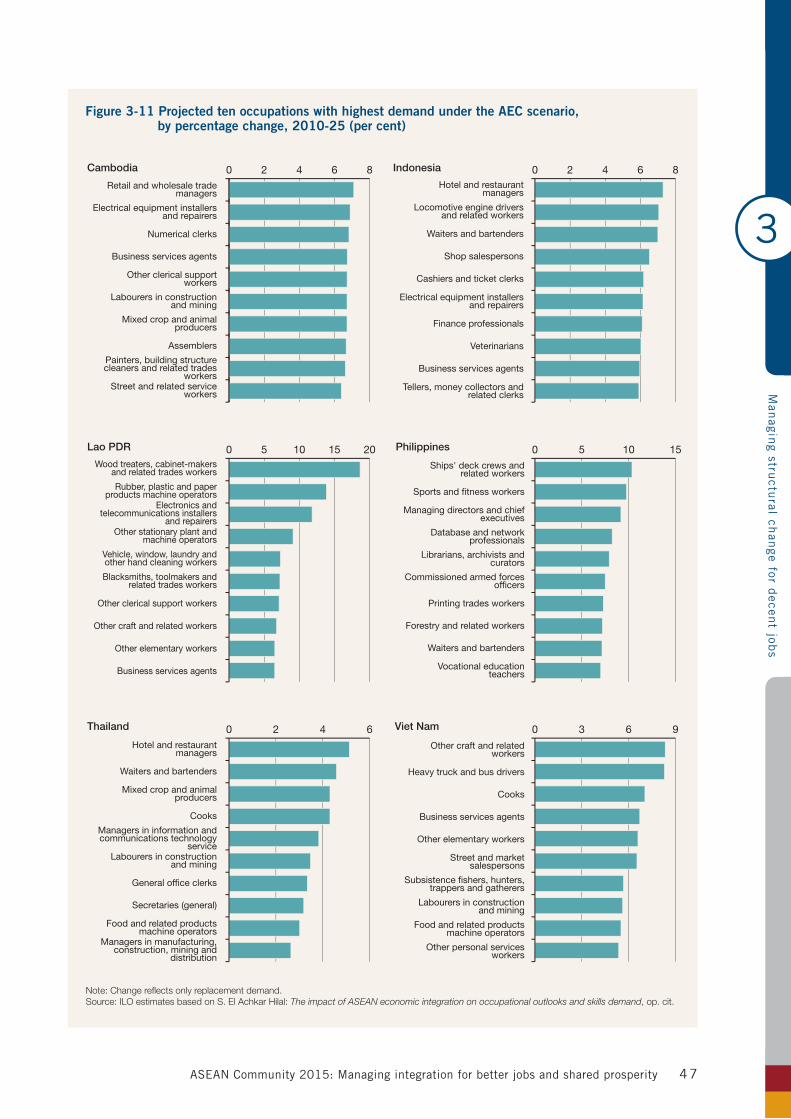
3
Man
aging stru
ctural ch
ange for d
ecent job
s
ASEAN Community 2015: Managing integration for better jobs and shared prosperity 47
Note: Change reflects only replacement demand.Source: ILO estimates based on S. El Achkar Hilal: The impact of ASEAN economic integration on occupational outlooks and skills demand, op. cit.
Figure 3-11 Projected ten occupations with highest demand under the AEC scenario, by percentage change, 2010-25 (per cent)
Street and related service workers
Painters, building structure cleaners and related trades
workers
Assemblers
Mixed crop and animal producers
Labourers in construction and mining
Other clerical support workers
Business services agents
Numerical clerks
Electrical equipment installers and repairers
Retail and wholesale trade managers
Business services agents
Other elementary workers
Other craft and related workers
Other clerical support workers
Blacksmiths, toolmakers and related trades workers
Vehicle, window, laundry and other hand cleaning workers
Other stationary plant and machine operators
Electronics and telecommunications installers
and repairers
Rubber, plastic and paper products machine operators
Wood treaters, cabinet-makers and related trades workers
Tellers, money collectors and related clerks
Business services agents
Veterinarians
Finance professionals
Electrical equipment installers and repairers
Cashiers and ticket clerks
Shop salespersons
Waiters and bartenders
Locomotive engine drivers and related workers
Hotel and restaurant managers
0 2 4 6 8
Managers in manufacturing, construction, mining and
distribution
Food and related products machine operators
Secretaries (general)
General office clerks
Labourers in construction and mining
Managers in information and communications technology
service
Cooks
Mixed crop and animal producers
Waiters and bartenders
Hotel and restaurant managers
0 2 4 6
0 5 10 15 20
Vocational education teachers
Waiters and bartenders
Forestry and related workers
Printing trades workers
Commissioned armed forces officers
Librarians, archivists and curators
Database and network professionals
Managing directors and chief executives
Sports and fitness workers
Ships' deck crews and related workers
0 5 10 15
Other personal services workers
Food and related products machine operators
Labourers in construction and mining
Subsistence fishers, hunters, trappers and gatherers
Street and market salespersons
Other elementary workers
Business services agents
Cooks
Heavy truck and bus drivers
Other craft and related workers
0 3 6 9
0 2 4 6 8Cambodia Indonesia
Lao PDR Philippines
Thailand Viet Nam
3
Man
aging stru
ctural ch
ange for d
ecent job
s
ASEAN Community 2015: Managing integration for better jobs and shared prosperity4 8
The changing structure of the labour market, spurred further by economic integration, will have an impact on the occupational composition of the labour market. Which occupations will grow or decline with the implementation of the ASEAN Economic Community? Figure 3-10 projects thepotential occupational demand in six ASEAN Member States assuming the sectoral structure of the labour market under the AEC scenario in 2025, based on an occupational employment projec-tions model developed for the report (see Annex B for details of the model).20 The largest absolute demand is generally for low- and medium-skill occupations.21
Nonetheless, as illustrated in Figure 3-11,the occupations projected to grow fastest in some countries are generally medium- and high-skilled. For example in Cambodia, retail and wholesale trade managers and electrical equipment installers and repairers are projected to grow fastest, while in Indonesia, the highest growth rate is projected for hotel and restaurant managers, and locomotive engine drivers and related workers. In Lao People’s Democratic Republic, wood treaters, cabinet makers and related trades workers and rubber, plastic and paper products machine operators are projected to be the fastest growing occupations while in the
20 The occupational employment projections model was developed by Souleima El Achkar Hilal in collaboration with the ILO.Occupational demandhas two components:expansion demand attributable to growth in sectoral output andemploymentand/orshiftsintheoccupationalstructuresof industries, and replacement demand, attributable to factors such as deaths, retirements, inter-occupational and geographical labour mobility. In this model the share of workers aged 65 years and older for each occupation is used as an estimate of replacement demand for each occupation. Detailed results of the model are available in S. El Achkar Hilal: The Impact of ASEAN Economic Integration on Occupational Outlooks and Skills Demand, background paper prepared for ASEAN Community 2015: Managing integration for better jobs and shared prosperity (Bangkok, ILO, forthcoming).
21 Skill level definitions are based on International Standard Classification of Occupations (ISCO) major groups. See Chapter4forfurtherinformation.
Philippines the top five include ships’ deck crews and related workers, sports and fitness workers, managing directors and chief executives, database and network professionals and librarians, archivists and curators. In Thailand, hotel and restaurant managers and waiters and bartenders are the two occupations that are projected to experience the fastest pace of growth while in Viet Nam, the fastest growth is for other craft and related workers and heavy truck and bus drivers.
ConclusionTrade integration is expected to change the pattern of structural transformation. If this is towards productive economic activities, structural change can help raise living standards and increase aggregate labour productivity – decreasing working poverty and the incidence of vulnerable employment, and supporting the growth of decent jobs. ASEAN Member States will want to facilitate such changes but ensure that they take place in a fair and inclu-sive manner, and respect fundamental principles and rights at work. Furthermore, although ASEAN economic integration increases welfare, wages, and employment, the benefits are distributed unevenly among countries and sectors, and between men and women. Coordinated and coherent policies will be needed at both regional and national levels to ensure inclusive and fair outcomes (see Chapter 5).
The model results presented in this chapter highlight the prospects for specific sectors and occupations. Agriculture as a share of total employ-ment is expected to decline, but agriculture will continue to be a dominant employer in some ASEAN Member States. Of particular concern is the potential of trade integration to weaken the food processing sectors in some of these countries, notably Cambodia, Indonesia and Lao People’s Democratic Republic. Concerted policy efforts will be required to strengthen the value chains associ-ated with agriculture.
Some countries will see a rise in trade,
ASEAN economic integration and occupational demand
3
Man
aging stru
ctural ch
ange for d
ecent job
s
ASEAN Community 2015: Managing integration for better jobs and shared prosperity 4 9
construction and private services as a share of total employment. In developing ASEAN Member States, these sectors, and some occupations in these sectors, are often associated with vulnerable employment and the informal economy. Continued efforts will be required to strengthen labour market policies and institutions to address informality and protect vulnerable groups of workers. To absorb those leaving agriculture, as well as the five million new entrants to ASEAN’s labour force each year, governments will need well-designed industrial and sectoral policies. These should be coordinated with employment policies and based on tripartite dialogue with a view to supporting employment growth in higher-productivity services and manu-facturing. In some countries, this has involved expanding employment in textiles and apparel, but efforts are required to diversify employment to other manufacturing subsectors.
Structural change will entail considerable churning in the labour market. This brings risks for vulnerable workers, highlighting the need for imple-mentation of the measures identified in the ASEAN Declaration on Strengthening Social Protection – to improve the quality, coverage, and sustainability of social protection, starting with the establishment of a social protection floor for all. Productive structural change will also depend on the ability of micro-firms and SMEs to seize opportunities in higher value-added activities, including in the regional and global production networks in the ASEAN region, underscoring the need to strengthen their capacities, including through good management and improved labour practices. With structural change pointing to an increase in the demand for higher skills – the fastest growing occupations are likely to be in semi- to high-skilled jobs – further investments in skills andtrainingwillberequired.Chapter4considersthe priorities as ASEAN Member States move to higher levels of skills.
3
Man
aging stru
ctural ch
ange for d
ecent job
s
ASEAN Community 2015: Managing integration for better jobs and shared prosperity5 0
4
Movin
g up th
e skills ladder
ASEAN Community 2015: Managing integration for better jobs and shared prosperity 51
The ASEAN Economic Community has numerous implications for human resource development. The structural change it encourages will increase the demand for some skills while reducing that for others.1 Countries will need labour market policies that not only ensure the relevance and quality of skills, but also offer a degree of social protection for those who lose their jobs – mitigating adjustment costs and helping sustain a dynamic development process.2
At the national level, the education and skills of the workforce are critical factors in attracting FDI, enabling structural transformation and providing a
1 In this report, unless noted otherwise, high-skill occupations are defined as International Standard Classification of Occupations (ISCO) groups 1 (managers), 2 (professionals) and3 (technicians andassociateprofessionals).Medium-skilloccupationsincludeISCOgroups4(clerks),5(serviceandsalesworkers), 6 (skilled agricultural and fishery workers), 7 (craft and related trade workers) and 8 (plant and machine operators and assemblers). Low-skill occupations consist of ISCO group 9 (elementary occupations). See ILO: International Standard Classification of Occupations: ISCO-08: Volume 1: Structure, group definitions and correspondence tables (Geneva, 2012).
2 ILO: Skills for improved productivity, employment growth and development, Report V, International Labour Conference, 97thSession(Geneva,2008).
pathway for the most vulnerable segments of the labour market to access better-quality jobs. For enter-prises, being competitive depends heavily on the ability to attract and retain skilled human resources that can accelerate the adoption of innovative business practices and sophisticated technologies, boosting both productivity and profitability.
The ASEAN Leaders Statement on Human Resources and Skills Development for Economic Recovery and Sustainable Growth, adopted in Ha Noi in October 2010, provides a sound blueprint for regional cooperation and national action for upgrading skills.3 But priorities will vary according to each country’s economic structure and goals and level of development. Some will still focus on primary education and literacy skills. Others will look to improve secondary education and vocational and technical training. And the more industrialized ASEAN Member States will aim to enhance the relevance of tertiary education and foster cognitive
3 ASEANLeadersStatementonHumanResourcesandSkillsDevelopment for Economic Recovery and Sustainable Growth, Hanoi, Oct. 2010.
The ASEAN Economic Community will increase the demand for skilled workers.
This will require stronger education and training policies, with curricula that match
national development priorities and meet the needs of the most vulnerable, women
and young people. Employers’ and workers’ organizations must be key partners in
tackling the skills challenge. But governments in the region can also cooperate to
address skills gaps by sharing best practices in the recognition of skills.
Moving up the skills ladder
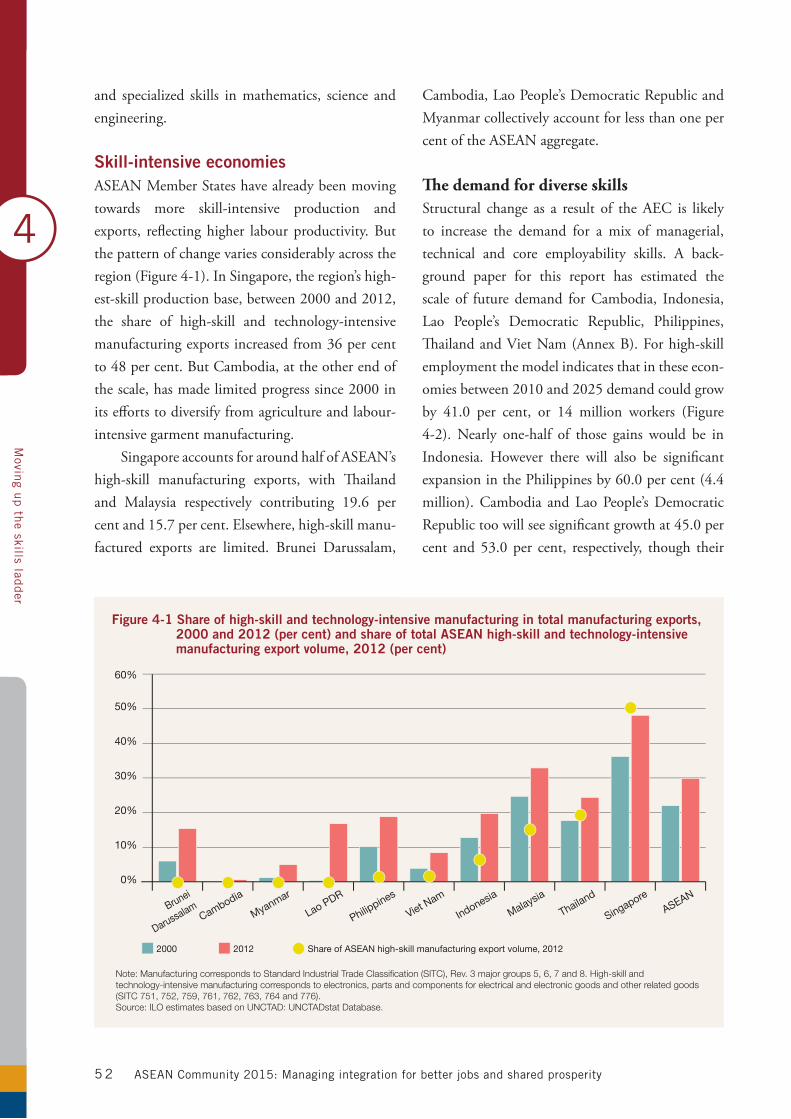
4
Movin
g up th
e skills ladder
ASEAN Community 2015: Managing integration for better jobs and shared prosperity5 2
and specialized skills in mathematics, science and engineering.
Skill-intensive economiesASEAN Member States have already been moving towards more skill-intensive production and exports, reflecting higher labour productivity. But the pattern of change varies considerably across the region(Figure4-1).InSingapore,theregion’shigh-est-skill production base, between 2000 and 2012, the share of high-skill and technology-intensive manufacturingexportsincreasedfrom36percentto48percent.ButCambodia,attheotherendofthe scale, has made limited progress since 2000 in its efforts to diversify from agriculture and labour-intensive garment manufacturing.
Singapore accounts for around half of ASEAN’s high-skill manufacturing exports, with Thailand and Malaysia respectively contributing 19.6 percent and 15.7 per cent. Elsewhere, high-skill manu-factured exports are limited. Brunei Darussalam,
Cambodia, Lao People’s Democratic Republic and Myanmar collectively account for less than one per cent of the ASEAN aggregate.
The demand for diverse skillsStructural change as a result of the AEC is likely to increase the demand for a mix of managerial, technical and core employability skills. A back-ground paper for this report has estimated the scale of future demand for Cambodia, Indonesia, Lao People’s Democratic Republic, Philippines, Thailand and Viet Nam (Annex B). For high-skill employment the model indicates that in these econ-omies between 2010 and 2025 demand could grow by 41.0 per cent, or 14 million workers (Figure4-2).Nearly one-half of those gains would be inIndonesia. However there will also be significant expansioninthePhilippinesby60.0percent(4.4million). Cambodia and Lao People’s Democratic Republictoowillseesignificantgrowthat45.0percent and53.0per cent, respectively, though their
Note: Manufacturing corresponds to Standard Industrial Trade Classification (SITC), Rev. 3 major groups 5, 6, 7 and 8. High-skill and technology-intensive manufacturing corresponds to electronics, parts and components for electrical and electronic goods and other related goods (SITC 751, 752, 759, 761, 762, 763, 764 and 776).Source: ILO estimates based on UNCTAD: UNCTADstat Database.
Figure 4-1 Share of high-skill and technology-intensive manufacturing in total manufacturing exports, 2000 and 2012 (per cent) and share of total ASEAN high-skill and technology-intensive manufacturing export volume, 2012 (per cent)
2000 2012 Share of ASEAN high-skill manufacturing export volume, 2012
0%
10%
20%
30%
40%
50%
60%
Brunei
DarussalamCambodia
Indonesia
Malaysia
Myanmar
Lao PDR
Philippines
SingaporeASEAN
Thailand
Viet Nam
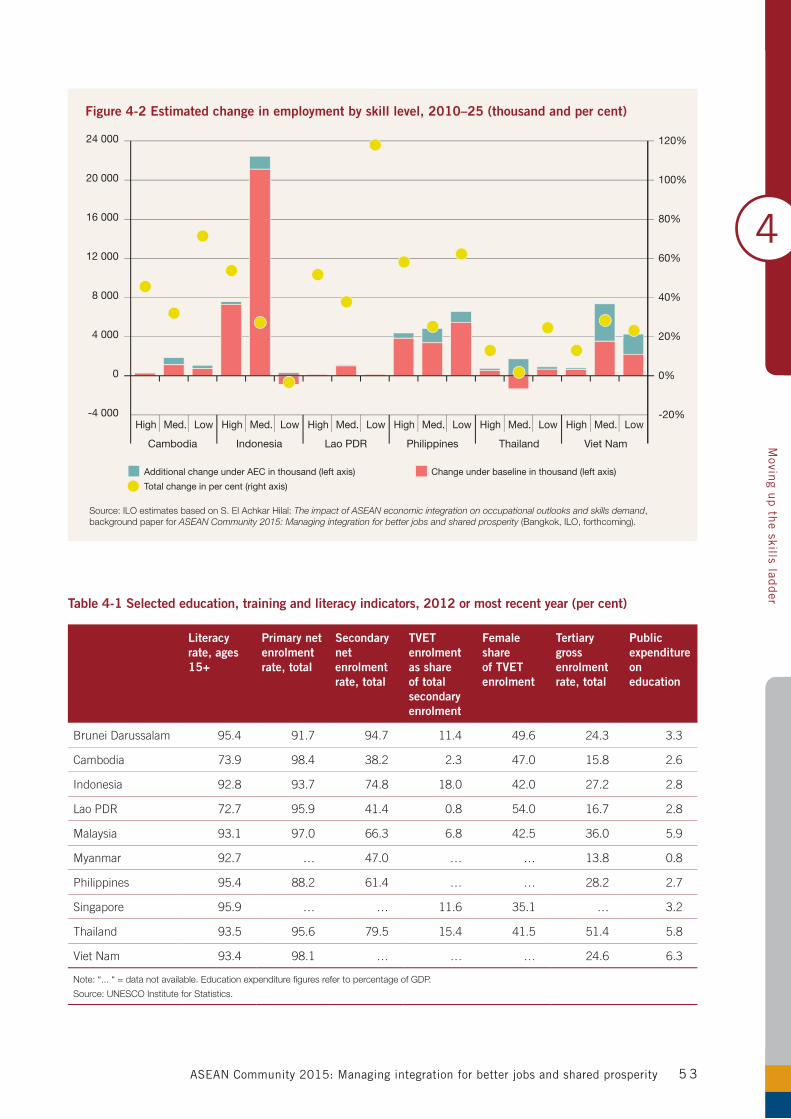
4
Movin
g up th
e skills ladder
ASEAN Community 2015: Managing integration for better jobs and shared prosperity 5 3
Source: ILO estimates based on S. El Achkar Hilal: The impact of ASEAN economic integration on occupational outlooks and skills demand, background paper for ASEAN Community 2015: Managing integration for better jobs and shared prosperity (Bangkok, ILO, forthcoming).
Figure 4-2 Estimated change in employment by skill level, 2010–25 (thousand and per cent)
Additional change under AEC in thousand (left axis) Change under baseline in thousand (left axis)
Total change in per cent (right axis)
-4 000
0
4 000
8 000
12 000
16 000
20 000
24 000
-20%
0%
20%
40%
60%
80%
100%
120%
High Med. Low High Med. Low High Med. Low High Med. Low High Med. Low High Med. Low
Cambodia Indonesia Lao PDR Philippines Thailand Viet Nam
Table 4-1 Selected education, training and literacy indicators, 2012 or most recent year (per cent)
Literacy rate, ages 15+
Primary net enrolment rate, total
Secondary net enrolment rate, total
TVET enrolment as share of total secondary enrolment
Female share of TVET enrolment
Tertiary gross enrolment rate, total
Public expenditure on education
Brunei Darussalam 95.4 91.7 94.7 11.4 49.6 24.3 3.3
Cambodia 73.9 98.4 38.2 2.3 47.0 15.8 2.6
Indonesia 92.8 93.7 74.8 18.0 42.0 27.2 2.8
Lao PDR 72.7 95.9 41.4 0.8 54.0 16.7 2.8
Malaysia 93.1 97.0 66.3 6.8 42.5 36.0 5.9
Myanmar 92.7 … 47.0 … … 13.8 0.8
Philippines 95.4 88.2 61.4 … … 28.2 2.7
Singapore 95.9 … … 11.6 35.1 … 3.2
Thailand 93.5 95.6 79.5 15.4 41.5 51.4 5.8
Viet Nam 93.4 98.1 … … … 24.6 6.3
Note: “... “ = data not available. Education expenditure figures refer to percentage of GDP.
Source: UNESCO Institute for Statistics.
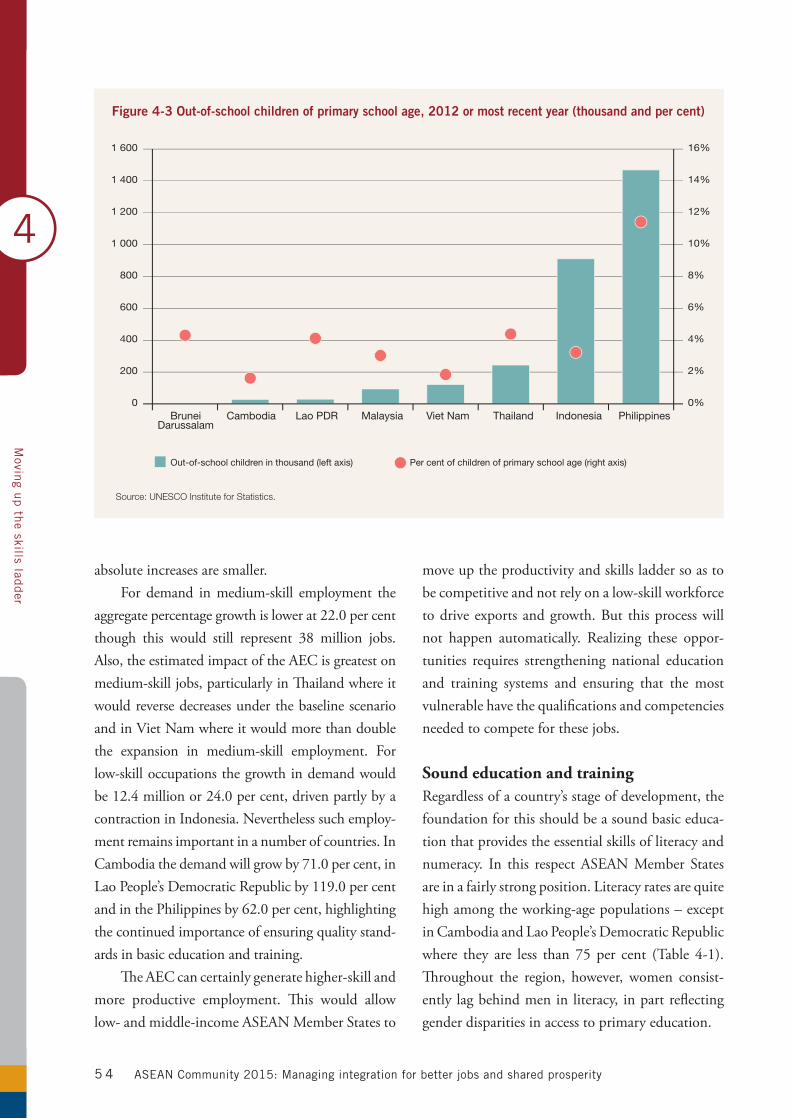
4
Movin
g up th
e skills ladder
ASEAN Community 2015: Managing integration for better jobs and shared prosperity5 4
absolute increases are smaller. For demand in medium-skill employment the
aggregate percentage growth is lower at 22.0 per cent though this would still represent 38 million jobs.Also, the estimated impact of the AEC is greatest on medium-skill jobs, particularly in Thailand where it would reverse decreases under the baseline scenario and in Viet Nam where it would more than double the expansion in medium-skill employment. For low-skill occupations the growth in demand would be12.4millionor24.0percent,drivenpartlybyacontraction in Indonesia. Nevertheless such employ-ment remains important in a number of countries. In Cambodia the demand will grow by 71.0 per cent, in LaoPeople’sDemocraticRepublicby119.0percentand in the Philippines by 62.0 per cent, highlighting the continued importance of ensuring quality stand-ards in basic education and training.
The AEC can certainly generate higher-skill and more productive employment. This would allow low- and middle-income ASEAN Member States to
move up the productivity and skills ladder so as to be competitive and not rely on a low-skill workforce to drive exports and growth. But this process will not happen automatically. Realizing these oppor-tunities requires strengthening national education and training systems and ensuring that the most vulnerable have the qualifications and competencies needed to compete for these jobs.
Sound education and trainingRegardless of a country’s stage of development, the foundation for this should be a sound basic educa-tion that provides the essential skills of literacy and numeracy. In this respect ASEAN Member States are in a fairly strong position. Literacy rates are quite high among the working-age populations – except in Cambodia and Lao People’s Democratic Republic where they are less than 75 per cent (Table 4-1).Throughout the region, however, women consist-ently lag behind men in literacy, in part reflecting gender disparities in access to primary education.
Source: UNESCO Institute for Statistics.
Figure 4-3 Out-of-school children of primary school age, 2012 or most recent year (thousand and per cent)
Out-of-school children in thousand (left axis) Per cent of children of primary school age (right axis)
Cambodia IndonesiaLao PDR PhilippinesThailandViet Nam0
200
400
600
800
1 000
1 200
1 400
1 600
0%
2%
4%
6%
8%
10%
12%
14%
16%
BruneiDarussalam
Malaysia
4
Movin
g up th
e skills ladder
ASEAN Community 2015: Managing integration for better jobs and shared prosperity 5 5
ASEAN Member States have achieved almost universal enrolment in primary education. Nevertheless in the region as a whole nearly three million children of primary school age are not in school – having never enrolled or having dropped out early (Figure 4-3). They risk becoming childlabourers and are unlikely to acquire the literacy and numeracy skills to subsequently secure decent employment. More than 80 per cent of these chil-dren are in Indonesia and the Philippines. The Philippines also has the highest proportion of chil-drenoutofschool,at11.4percent,thoughtherateis also more than four per cent in Brunei Darussalam, Lao People’s Democratic Republic and Thailand. To address the remaining gaps in universal basic educa-tion, targeting early school leavers is critical as well as vulnerable boys and girls who have been left out of the formal school system. This would not only advance social development but also create the basis forahigh-qualityworkforce(Box4-1).
Beyond primary schooling, developing the future workforce in many low- and middle-income ASEAN Member States involves greater access to secondary education, as well as to technical and voca-tional education and training (TVET). This will be particularly important for young people from rural and poor households, providing them with the core employability and cognitive skills to move success-fully from the classroom to the workplace.
The greatest secondary education deficits are in Cambodia, Lao People’s Democratic Republic and Myanmar, where net enrolment rates are less than 50 per cent. In Indonesia, Malaysia, Philippines and Thailand participation is notably higher but still not universal. Vocational education enrolment is also weak in most ASEAN Member States, particularly among young women. TVET can provide students with practical alternatives that help develop job-specific competencies and increase employability (Box4-2).
The Philippines can break intergenerational poverty
cycles by increasing access to quality basic educa-
tion and decent work. The country has had rapid
population growth, persistently high poverty rates,
and large numbers of out-of-school children and
youth, particularly from the poorest households.
Recent measures to develop human capital
will improve the education of the workforce and,
as the AEC proceeds, should increase the resil-
ience of domestic firms to external competition.
An important reform is the K-to-12 programme.
Enacted into law in July 2013, this extends basic
education from 10 to 12 years and should enhance
young people’s cognitive and analytical skills and
improve trainability upon graduation. Another
measure is the Responsible Parenthood and
Reproductive Health Act. Signed in December
2012, this bill increases access to sexual health
education, contraception and reproductive health
services, with the aim of decelerating population
growth and ultimately decreasing labour market
pressure. These two measures are comple-
mented by the Pantawid Pamilyang Pilipino
Program. Established in 2008, this conditional
cash transfer programme focuses on improving
access to health and education services for
infants and children from poor households and
has yielded positive results.
Source: ILO: Key Indicators of the Labour Market, eighth edition, 2013; World Bank: Philippines conditional cash transfer program: Impact evaluation 2012 (Washington, DC, 2013); J. Yap: ASEAN Community 2015: Managing integration for better jobs and shared prosperity: The case of the Philippines, background paper for ASEAN Community 2015: Managing integration for better jobs and shared prosperity (Bangkok, ILO, forthcoming).
Box 4-1 Advancing education and social policies in the Philippines
4
Movin
g up th
e skills ladder
ASEAN Community 2015: Managing integration for better jobs and shared prosperity5 6
In this regard, Viet Nam has increased lower secondary enrolment among ethnic minorities and girls in disadvantaged regions by building new schools and teacher housing, developing classroom materials in ethnic minority languages and piloting a school feeding programme, among other meas-ures.4 Likewise, Indonesia boosted lower secondary
4 ADB:Viet Nam: Increasing girls’ access to lower secondary education in the most disadvantaged regions – 2013, Gender andDevelopmentCaseStudies(June2013).
enrolment for girls in poor rural areas through grants managed by school committees that provided scholarships, supplementary feeding, assistance with transportation and separate sanitation facilities.5
In addition to access, it will be even more important for the future to improve the quality of education and make it relevant to fast-changing
5 ADB: Indonesia: Reaching the unreached through the decentralized basic education project – 2010, Gender and DevelopmentCaseStudies(May2013).
A responsive technical and vocational education
and training (TVET) system is critical for work-
force development and helps fill gaps in skills and
competencies not provided by tertiary education.
TVET provides pathways to develop knowledge,
attitudes and skills from a variety of courses and
training programmes that ease the transition from
secondary education to the workplace. Completion
of the more advanced technical courses can lead
to a high-skill job or provide a bridge for students
to pursue a tertiary education if they aspire to
higher-level professions.
Throughout ASEAN, however, TVET accounts
for a small share of secondary school enrolment,
from 0.8 per cent in Lao People’s Democratic
Republic to 18.0 per cent in Indonesia (Table
4-1). TVET institutions in some countries face
challenges related to the relevance of curricula,
poor-quality instruction and infrastructure and the
absence of certification frameworks that meet the
standards of employers. Also, gender stereotyping
hinders young women from choosing some voca-
tional tracks.
In this regard, a focus on improving TVET
quality and relevance through stronger linkages to
industry demand is paramount, as is expanding
access for poor and rural populations, integrating
core skills, developing tools for the recognition of
continuous and prior learning, and enhancing
the availability of reliable labour market infor-
mation and vocational guidance. Lao People’s
Democratic Republic, for instance, is developing
a Labour Market Information System and a TVET
Education Management Information System
that will enhance assessment of skills demand
and strengthen employment services for TVET
students and jobseekers.
Efforts to improve TVET would also be
bolstered by enhanced skills standards and
recognition systems. A robust quality assurance
framework can promote the development of a
transparent mechanism acceptable to private
industry which can assess, certify and recognize
prior learning and experience irrespective of where
they are acquired.1 Collectively, these measures
would help ASEAN Member States reduce skill
mismatches, facilitate mutual skills recognition
in the context of regional labour migration and
improve dialogue between employers, workers
and training providers.
1 ILO Human Resources Development Recommendation, 2004 (No. 195).
Source: S. El Achkar Hilal: Lao People’s Democratic Republic: TVET assessment (Bangkok, ILO, forthcoming); S. El Achkar Hilal: TVET in Viet Nam: Situational assessment and inputs for the legal reform process (Bangkok, ILO, forthcoming); Q. Huang: Comprehensive research on the general assessment of the current skills systems and delivery: Research study on Thailand (Bangkok, ILO, forthcoming); L. Lanzona: A review of the TVET system in the Philippines (Bangkok, ILO, forthcoming); LSE Enterprise: Assessment study of technical and vocational education and training in Myanmar (Bangkok, ILO, forthcoming); D. Lythe: Assessment of the readiness of ASEAN Member States for implementation of the commitment to the free flow of skilled labour within the AEC from 2015 (Bangkok, ILO, forthcoming).
Box 4-2 Strengthening technical and vocational education and training
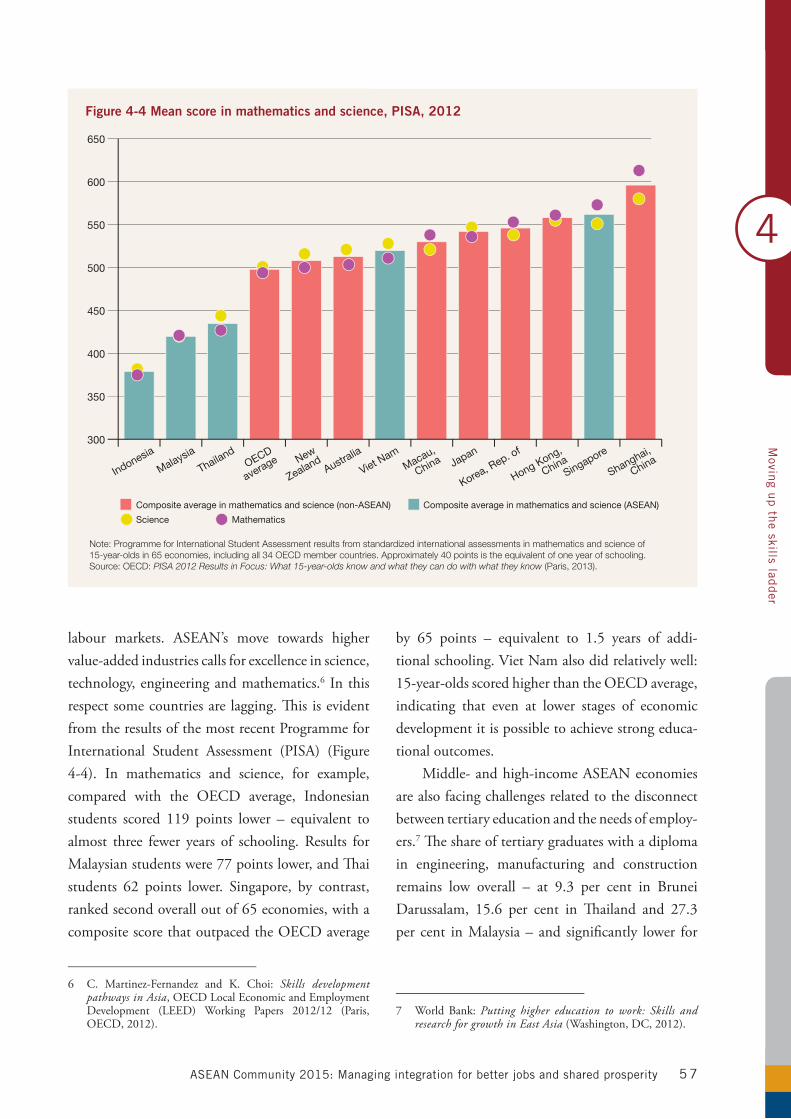
4
Movin
g up th
e skills ladder
ASEAN Community 2015: Managing integration for better jobs and shared prosperity 5 7
labour markets. ASEAN’s move towards higher value-added industries calls for excellence in science, technology, engineering and mathematics.6 In this respect some countries are lagging. This is evident from the results of the most recent Programme for International Student Assessment (PISA) (Figure 4-4). In mathematics and science, for example,compared with the OECD average, Indonesian students scored 119 points lower – equivalent toalmost three fewer years of schooling. Results for Malaysian students were 77 points lower, and Thai students 62 points lower. Singapore, by contrast, ranked second overall out of 65 economies, with a composite score that outpaced the OECD average
6 C. Martinez-Fernandez and K. Choi: Skills development pathways in Asia, OECD Local Economic and Employment Development (LEED) Working Papers 2012/12 (Paris,OECD, 2012).
by 65 points – equivalent to 1.5 years of addi-tionalschooling.VietNamalsodidrelativelywell:15-year-olds scored higher than the OECD average, indicating that even at lower stages of economic development it is possible to achieve strong educa-tional outcomes.
Middle- and high-income ASEAN economies are also facing challenges related to the disconnect between tertiary education and the needs of employ-ers.7 The share of tertiary graduates with a diploma in engineering, manufacturing and construction remains low overall – at 9.3 per cent in BruneiDarussalam, 15.6 per cent in Thailand and 27.3per cent in Malaysia – and significantly lower for
7 WorldBank:Putting higher education to work: Skills and research for growth in East Asia (Washington, DC, 2012).
Note: Programme for International Student Assessment results from standardized international assessments in mathematics and science of 15-year-olds in 65 economies, including all 34 OECD member countries. Approximately 40 points is the equivalent of one year of schooling.Source: OECD: PISA 2012 Results in Focus: What 15-year-olds know and what they can do with what they know (Paris, 2013).
Figure 4-4 Mean score in mathematics and science, PISA, 2012
Composite average in mathematics and science (non-ASEAN) Composite average in mathematics and science (ASEAN)
Science Mathematics
300
350
400
450
500
550
600
650
Shanghai,
ChinaSingapore
Hong Kong,
China
Korea, Rep. of
JapanMacau,
ChinaViet N
am
AustraliaNew
ZealandOECD
averageThailand
Malaysia
Indonesia
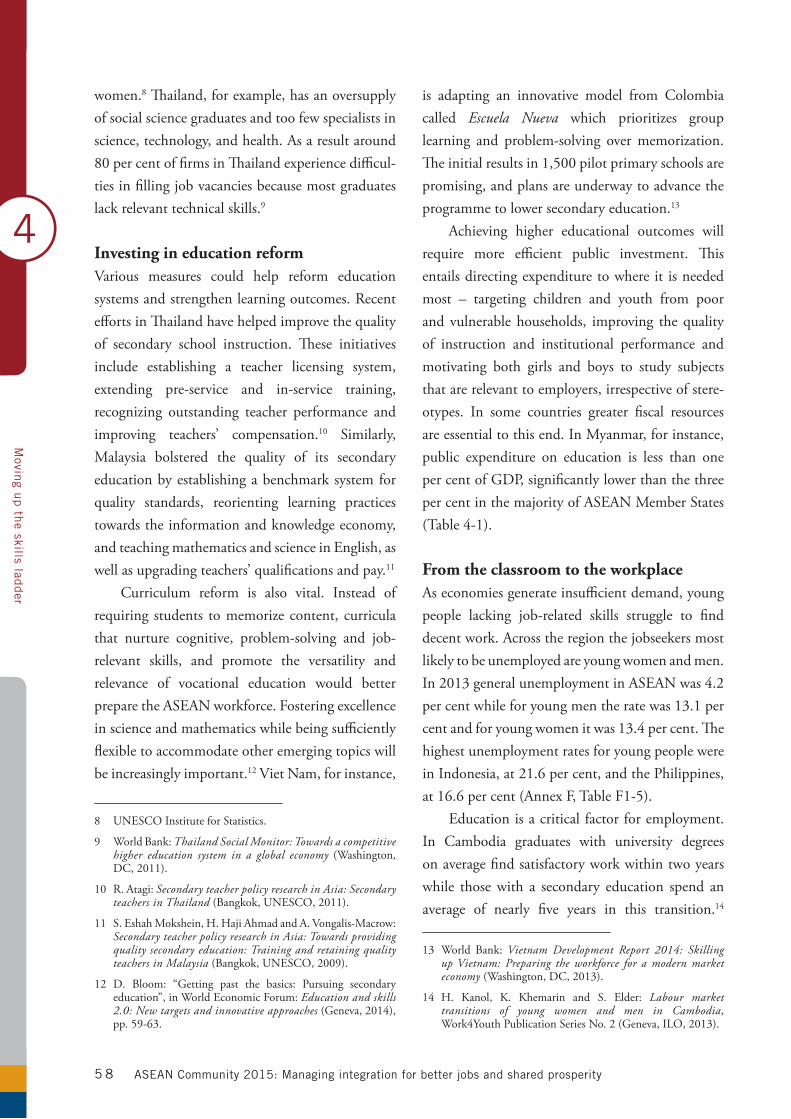
4
Movin
g up th
e skills ladder
ASEAN Community 2015: Managing integration for better jobs and shared prosperity5 8
women.8 Thailand, for example, has an oversupply of social science graduates and too few specialists in science, technology, and health. As a result around 80 per cent of firms in Thailand experience difficul-ties in filling job vacancies because most graduates lack relevant technical skills.9
Investing in education reformVarious measures could help reform education systems and strengthen learning outcomes. Recent efforts in Thailand have helped improve the quality of secondary school instruction. These initiatives include establishing a teacher licensing system, extending pre-service and in-service training, recognizing outstanding teacher performance and improving teachers’ compensation.10 Similarly, Malaysia bolstered the quality of its secondary education by establishing a benchmark system for quality standards, reorienting learning practices towards the information and knowledge economy, and teaching mathematics and science in English, as well as upgrading teachers’ qualifications and pay.11
Curriculum reform is also vital. Instead of requiring students to memorize content, curricula that nurture cognitive, problem-solving and job-relevant skills, and promote the versatility and relevance of vocational education would better prepare the ASEAN workforce. Fostering excellence in science and mathematics while being sufficiently flexible to accommodate other emerging topics will be increasingly important.12 Viet Nam, for instance,
8 UNESCO Institute for Statistics.
9 WorldBank:Thailand Social Monitor: Towards a competitive higher education system in a global economy (Washington, DC, 2011).
10 R.Atagi:Secondary teacher policy research in Asia: Secondary teachers in Thailand (Bangkok, UNESCO, 2011).
11 S.EshahMokshein,H.HajiAhmadandA.Vongalis-Macrow:Secondary teacher policy research in Asia: Towards providing quality secondary education: Training and retaining quality teachers in Malaysia(Bangkok,UNESCO,2009).
12 D. Bloom: “Getting past the basics: Pursuing secondaryeducation”,inWorldEconomicForum:Education and skills 2.0: New targets and innovative approaches(Geneva,2014),pp.59-63.
is adapting an innovative model from Colombia called Escuela Nueva which prioritizes group learning and problem-solving over memorization. The initial results in 1,500 pilot primary schools are promising, and plans are underway to advance the programme to lower secondary education.13
Achieving higher educational outcomes will require more efficient public investment. This entails directing expenditure to where it is needed most – targeting children and youth from poor and vulnerable households, improving the quality of instruction and institutional performance and motivating both girls and boys to study subjects that are relevant to employers, irrespective of stere-otypes. In some countries greater fiscal resources are essential to this end. In Myanmar, for instance, public expenditure on education is less than one per cent of GDP, significantly lower than the three per cent in the majority of ASEAN Member States (Table4-1).
From the classroom to the workplaceAs economies generate insufficient demand, young people lacking job-related skills struggle to find decent work. Across the region the jobseekers most likely to be unemployed are young women and men. In2013generalunemploymentinASEANwas4.2percentwhileforyoungmentheratewas13.1percentandforyoungwomenitwas13.4percent.Thehighest unemployment rates for young people were in Indonesia, at 21.6 per cent, and the Philippines, at 16.6 per cent (Annex F, Table F1-5).
Education is a critical factor for employment. In Cambodia graduates with university degrees on average find satisfactory work within two years while those with a secondary education spend an average of nearly five years in this transition.14
13 World Bank: Vietnam Development Report 2014: Skilling up Vietnam: Preparing the workforce for a modern market economy(Washington,DC,2013).
14 H. Kanol, K. Khemarin and S. Elder: Labour market transitions of young women and men in Cambodia, Work4YouthPublicationSeriesNo.2(Geneva,ILO,2013).
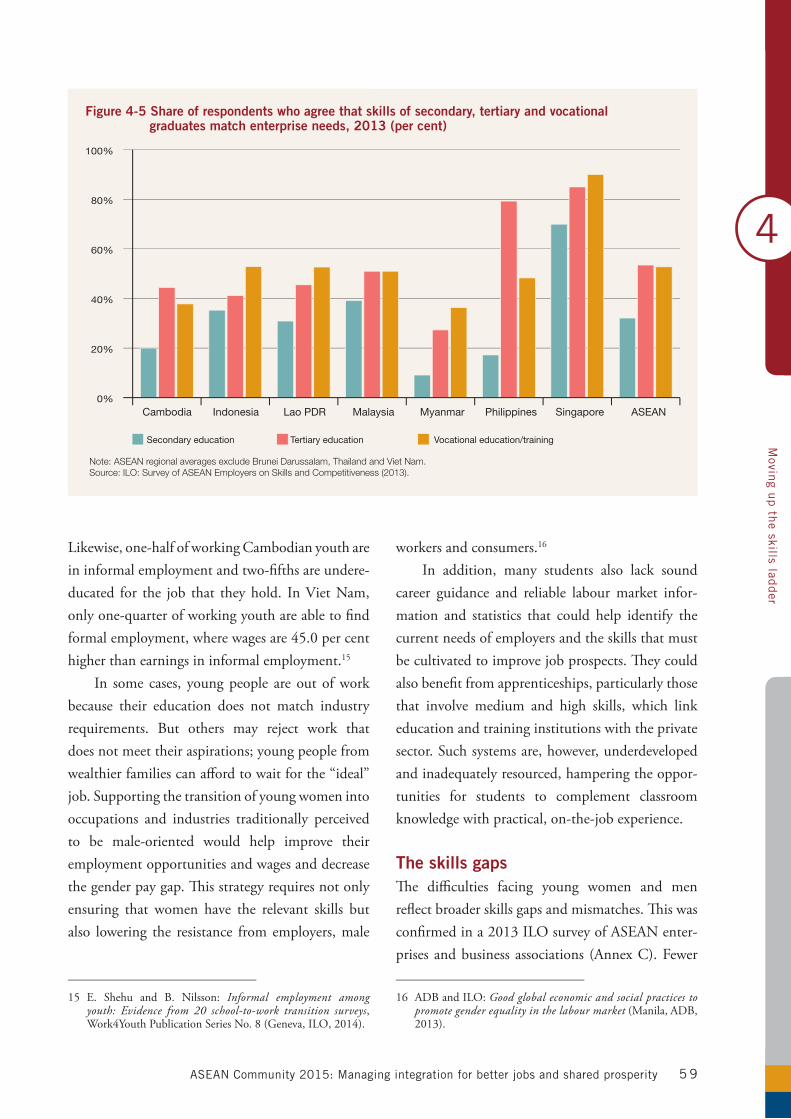
4
Movin
g up th
e skills ladder
ASEAN Community 2015: Managing integration for better jobs and shared prosperity 5 9
Likewise, one-half of working Cambodian youth are in informal employment and two-fifths are undere-ducated for the job that they hold. In Viet Nam, only one-quarter of working youth are able to find formalemployment,wherewagesare45.0percenthigher than earnings in informal employment.15
In some cases, young people are out of work because their education does not match industry requirements. But others may reject work that does not meet their aspirations; young people from wealthier families can afford to wait for the “ideal” job. Supporting the transition of young women into occupations and industries traditionally perceived to be male-oriented would help improve their employment opportunities and wages and decrease the gender pay gap. This strategy requires not only ensuring that women have the relevant skills but also lowering the resistance from employers, male
15 E. Shehu and B. Nilsson: Informal employment among youth: Evidence from 20 school-to-work transition surveys, Work4YouthPublicationSeriesNo.8(Geneva,ILO,2014).
workers and consumers.16
In addition, many students also lack sound career guidance and reliable labour market infor-mation and statistics that could help identify the current needs of employers and the skills that must be cultivated to improve job prospects. They could also benefit from apprenticeships, particularly those that involve medium and high skills, which link education and training institutions with the private sector. Such systems are, however, underdeveloped and inadequately resourced, hampering the oppor-tunities for students to complement classroom knowledge with practical, on-the-job experience.
The skills gapsThe difficulties facing young women and men reflect broader skills gaps and mismatches. This was confirmedina2013ILOsurveyofASEANenter-prises and business associations (Annex C). Fewer
16 ADBandILO:Good global economic and social practices to promote gender equality in the labour market (Manila, ADB, 2013).
Note: ASEAN regional averages exclude Brunei Darussalam, Thailand and Viet Nam.Source: ILO: Survey of ASEAN Employers on Skills and Competitiveness (2013).
Figure 4-5 Share of respondents who agree that skills of secondary, tertiary and vocational graduates match enterprise needs, 2013 (per cent)
Secondary education Tertiary education Vocational education/training
0%
20%
40%
60%
80%
100%
ASEANSingaporePhilippinesMyanmarMalaysiaLao PDRIndonesiaCambodia
4
Movin
g up th
e skills ladder
ASEAN Community 2015: Managing integration for better jobs and shared prosperity6 0
than one in three respondents agreed that secondary school graduates were equipped with the relevant skills needed by their enterprises, with scores ranging from less than one in ten in Myanmar to seven in teninSingapore(Figure4-5).Bycomparison,fortertiary graduates in ASEAN overall, the skills were viewed as better aligned with industry requirements (one in two respondents agreeing). In this case the most positive responses came from the Philippines and Singapore – around four in five. In terms of vocational education and training systems, around half the respondents felt that these met their busi-ness needs. The proportion was highest in Singapore (nine in ten) but significantly lower in Cambodia and Myanmar (fewer than two in five).
This employer survey also identified the greatest skills gaps. The training thought to be most widely neededwasinmanagementandleadership(29.0percent of responses) followed by vocational training (17.0 per cent) and customer service training (15.0 per cent). Separately, in Cambodia another survey of more than 500 enterprises found in addition to
vocation-specific competencies there were consid-erable shortages in communication and foreign language skills.17 Likewise, in Viet Nam a World Bank survey of employers identified gaps in job-related technical skills, as well as in cognitive skills such as problem solving and critical thinking, and core skills such as teamwork and communication.18 Unless these shortages are addressed, employers will face high staff turnover, recruit skilled workers from abroad and fill some hard-to-fill vacancies with less skilled professionals, which can reduce productivity.19
17 M.Bruni,L.LuchandS.Kuoch:Skills shortages and skills gaps in the Cambodian labour market: Evidence from employer skills needs survey, ILO Asia-Pacific Working Paper Series(Bangkok,ILO,2013).
18 World Bank: Vietnam Development Report 2014: Skilling up Vietnam: Preparing the workforce for a modern market economy, op. cit.
19 M. Aring: Enhancing competitiveness and employability through skill development, background paper prepared for ASEAN Community 2015: Managing integration for better jobs and shared prosperity (Bangkok, ILO, forthcoming).
Source: ILO estimates based on S. El Achkar Hilal: ASEAN occupational projections: The impact of ASEAN economic integration on occupational outlooks and skills demand, op. cit.
Figure 4-6 Estimated skills and educational mismatch in high-skill occupations, 2025 (thousand and per cent)
Additional underqualified workers under AEC in thousand (left axis) Underqualified workers under baseline in thousand (left axis)
Total underqualified workers as per cent of high-skill employment (right axis)
0
4 000
8 000
12 000
16 000
0%
20%
40%
60%
80%
IndonesiaPhilippinesThailandViet NamCambodiaLao PDR
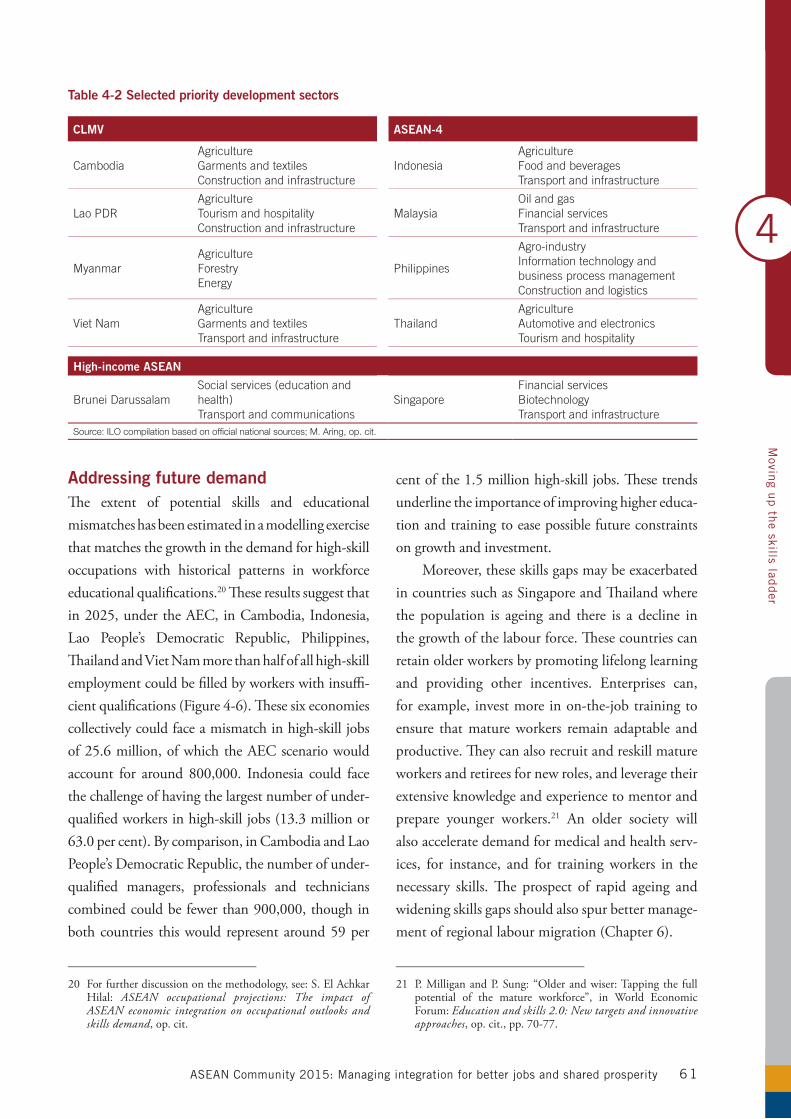
4
Movin
g up th
e skills ladder
ASEAN Community 2015: Managing integration for better jobs and shared prosperity 61
The extent of potential skills and educational mismatches has been estimated in a modelling exercise that matches the growth in the demand for high-skill occupations with historical patterns in workforce educational qualifications.20 These results suggest that in 2025, under the AEC, in Cambodia, Indonesia, Lao People’s Democratic Republic, Philippines, Thailand and Viet Nam more than half of all high-skill employment could be filled by workers with insuffi-cientqualifications(Figure4-6).Thesesixeconomiescollectively could face a mismatch in high-skill jobs of 25.6 million, of which the AEC scenario would account for around 800,000. Indonesia could face the challenge of having the largest number of under-qualifiedworkersinhigh-skilljobs(13.3millionor63.0percent).Bycomparison,inCambodiaandLaoPeople’s Democratic Republic, the number of under-qualified managers, professionals and technicians combinedcouldbefewerthan900,000,thoughinbothcountries thiswould representaround59per
20 Forfurtherdiscussiononthemethodology,see:S.ElAchkarHilal: ASEAN occupational projections: The impact of ASEAN economic integration on occupational outlooks and skills demand, op. cit.
cent of the 1.5 million high-skill jobs. These trends underline the importance of improving higher educa-tion and training to ease possible future constraints on growth and investment.
Moreover, these skills gaps may be exacerbated in countries such as Singapore and Thailand where the population is ageing and there is a decline in the growth of the labour force. These countries can retain older workers by promoting lifelong learning and providing other incentives. Enterprises can, for example, invest more in on-the-job training to ensure that mature workers remain adaptable and productive. They can also recruit and reskill mature workers and retirees for new roles, and leverage their extensive knowledge and experience to mentor and prepare younger workers.21 An older society will also accelerate demand for medical and health serv-ices, for instance, and for training workers in the necessary skills. The prospect of rapid ageing and widening skills gaps should also spur better manage-ment of regional labour migration (Chapter 6).
21 P.MilliganandP.Sung:“Olderandwiser:Tappingthe fullpotential of the mature workforce”, in World Economic Forum:Education and skills 2.0: New targets and innovative approaches, op. cit., pp. 70-77.
Table 4-2 Selected priority development sectors
CLMV ASEAN-4
CambodiaAgricultureGarments and textilesConstruction and infrastructure
IndonesiaAgricultureFood and beveragesTransport and infrastructure
Lao PDRAgricultureTourism and hospitalityConstruction and infrastructure
MalaysiaOil and gasFinancial servicesTransport and infrastructure
MyanmarAgricultureForestryEnergy
Philippines
Agro-industryInformation technology and business process managementConstruction and logistics
Viet NamAgricultureGarments and textilesTransport and infrastructure
ThailandAgricultureAutomotive and electronicsTourism and hospitality
High-income ASEAN
Brunei DarussalamSocial services (education and health)Transport and communications
SingaporeFinancial servicesBiotechnologyTransport and infrastructure
Source: ILO compilation based on official national sources; M. Aring, op. cit.
Addressing future demand
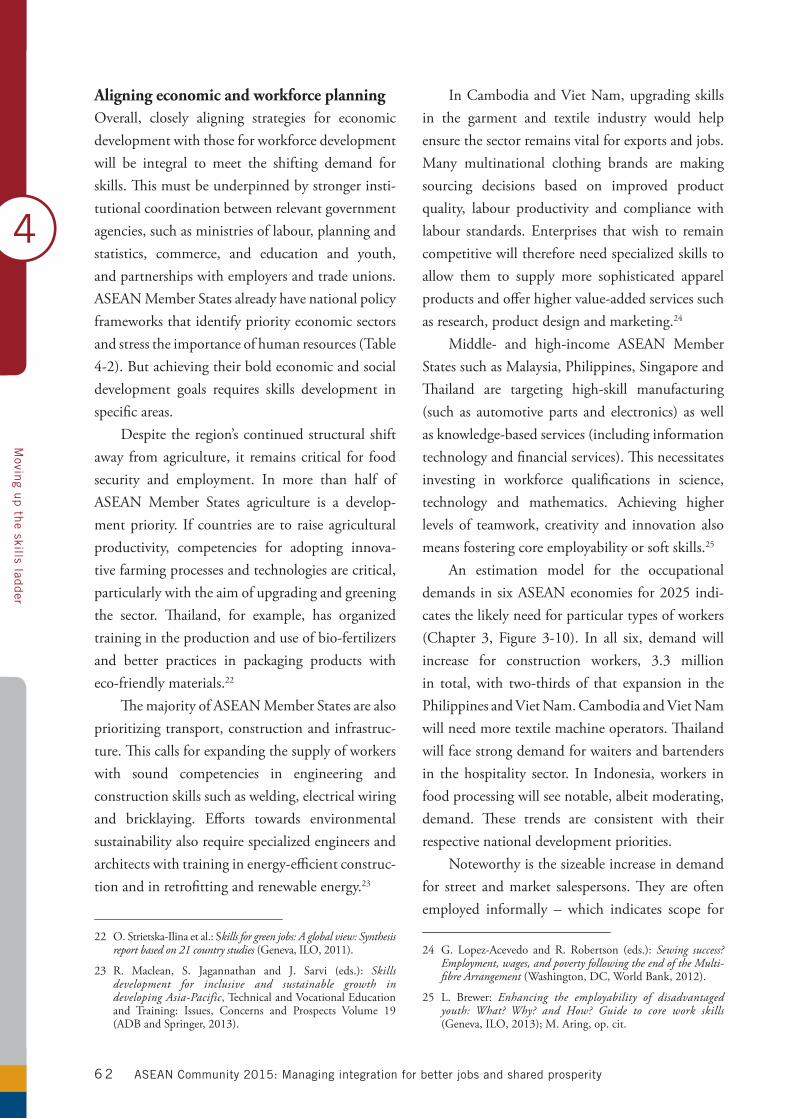
4
Movin
g up th
e skills ladder
ASEAN Community 2015: Managing integration for better jobs and shared prosperity6 2
Overall, closely aligning strategies for economic development with those for workforce development will be integral to meet the shifting demand for skills. This must be underpinned by stronger insti-tutional coordination between relevant government agencies, such as ministries of labour, planning and statistics, commerce, and education and youth, and partnerships with employers and trade unions. ASEAN Member States already have national policy frameworks that identify priority economic sectors and stress the importance of human resources (Table 4-2).Butachievingtheirboldeconomicandsocialdevelopment goals requires skills development in specific areas.
Despite the region’s continued structural shift away from agriculture, it remains critical for food security and employment. In more than half of ASEAN Member States agriculture is a develop-ment priority. If countries are to raise agricultural productivity, competencies for adopting innova-tive farming processes and technologies are critical, particularly with the aim of upgrading and greening the sector. Thailand, for example, has organized training in the production and use of bio-fertilizers and better practices in packaging products with eco-friendly materials.22
The majority of ASEAN Member States are also prioritizing transport, construction and infrastruc-ture. This calls for expanding the supply of workers with sound competencies in engineering and construction skills such as welding, electrical wiring and bricklaying. Efforts towards environmental sustainability also require specialized engineers and architects with training in energy-efficient construc-tion and in retrofitting and renewable energy.23
22 O.Strietska-Ilinaetal.:Skills for green jobs: A global view: Synthesis report based on 21 country studies (Geneva, ILO, 2011).
23 R. Maclean, S. Jagannathan and J. Sarvi (eds.): Skills development for inclusive and sustainable growth in developing Asia-Pacific, Technical and Vocational Education and Training: Issues, Concerns and Prospects Volume 19(ADBandSpringer,2013).
In Cambodia and Viet Nam, upgrading skills in the garment and textile industry would help ensure the sector remains vital for exports and jobs. Many multinational clothing brands are making sourcing decisions based on improved product quality, labour productivity and compliance with labour standards. Enterprises that wish to remain competitive will therefore need specialized skills to allow them to supply more sophisticated apparel products and offer higher value-added services such as research, product design and marketing.24
Middle- and high-income ASEAN Member States such as Malaysia, Philippines, Singapore and Thailand are targeting high-skill manufacturing (such as automotive parts and electronics) as well as knowledge-based services (including information technology and financial services). This necessitates investing in workforce qualifications in science, technology and mathematics. Achieving higher levels of teamwork, creativity and innovation also means fostering core employability or soft skills.25
An estimation model for the occupational demands in six ASEAN economies for 2025 indi-cates the likely need for particular types of workers (Chapter 3, Figure 3-10). In all six, demandwillincrease for construction workers, 3.3 millionin total, with two-thirds of that expansion in the Philippines and Viet Nam. Cambodia and Viet Nam will need more textile machine operators. Thailand will face strong demand for waiters and bartenders in the hospitality sector. In Indonesia, workers in food processing will see notable, albeit moderating, demand. These trends are consistent with their respective national development priorities.
Noteworthy is the sizeable increase in demand for street and market salespersons. They are often employed informally – which indicates scope for
24 G. Lopez-Acevedo and R. Robertson (eds.): Sewing success? Employment, wages, and poverty following the end of the Multi-fibre Arrangement (Washington, DC, World Bank, 2012).
25 L. Brewer: Enhancing the employability of disadvantaged youth: What? Why? and How? Guide to core work skills (Geneva,ILO,2013);M.Aring,op.cit.
Aligning economic and workforce planning
4
Movin
g up th
e skills ladder
ASEAN Community 2015: Managing integration for better jobs and shared prosperity 6 3
skills training and entrepreneurship education, along with improved access to finance and business support services. This would help them move into formal jobs or establish businesses that emphasize customer service. There will also be more demand for skilled and low-skilled agricultural workers; quality basic education and greater investments in rural infrastructure could improve their skills and productivity.26 Supporting the introduction of agricultural enterprise development into school curricula, as witnessed in the Republic of Korea, could help to foster entrepreneurship and career interest in the sector among young people.
Certifying skillsRobust frameworks for certifying skills and quality assurance mechanisms that can be trusted by employers are critical for enhancing training systems. Skills certification schemes validate skills and competencies regardless of how they are acquired, allow employers to compare skills across the labour market, support occupational mobility, and promote lifelong learning. At present national qualifications frameworks in ASEAN have considerable gaps espe-cially among the CLMV countries.27 In this regard, countries could draw on the experiences of Brunei Darussalam, Malaysia, Philippines and Singapore, for example, in linking technical training systems to national development priorities and establishing unified qualifications arrangements.
This can be a long and costly endeavour. Some ASEAN Member States could therefore pursue a gradual approach by first certifying key occupations and skills. To that end, the ASEAN Secretariat, with technical expertise from the ADB and the ILO, can play a prominent coordination role. The Secretariat could help ensure that qualification frameworks are benchmarked incrementally with the ASEAN
26 ILO:Skills for rural employment and development, Skills for EmploymentPolicyBrief(Geneva,2014).
27 D. Lythe, op. cit.
Qualifications Reference Framework that is under development.28 Technical assistance at the regional level should also focus on developing regional model competency standards as benchmarking tools for developing ASEAN Member States. Regional coop-eration efforts could also promote growth sectors like construction and tourism and help protect vulnerable groups such as domestic workers, while expanding mutual recognition arrangements that would help facilitate intra-regional labour migra-tion (Chapter 6).
Enhancing partnershipsAll these efforts to better prepare ASEAN’s work-force would be more effective if based on strong partnerships with employers’ and workers’ organiza-tions. Collaboration between education and training providers and the private sector would help ensure that curricula are practical and aligned with market demand, for example if based on skills needs assess-ments of enterprises. Employers can also develop complementary apprenticeship schemes through which young people can gain practical experience and job-specific skills that would ease the school-to-work transition. In this regard, Singapore’s Institute of Technical Education provides an effective model of leveraging public-private partnerships. Its governance structure is tripartite and close industry involvement in strategic planning helps enhance the relevance of curricula and integrate high-quality apprenticeships with coursework.29
Increasingly, there has been a trend in ASEAN Member States towards establishing and developing
28 The ASEAN Qualifications Reference Framework aims to provide a common reference point while accommodating the diversity of national training and qualifications systems, promote good international policies and practices in human resources development and facilitate labour migration through fair and mutual recognition of skills, among other objectives. See:D.Lythe,op.cit.
29 L.SongSeng:Case study on national policies linking TVET with economic expansion: Lessons from Singapore, Paper commissioned for the Education for All Global Monitoring Report 2012 (UNESCO, 2011); Asia-Pacific Economic Cooperation (APEC): Case study on Institute of Technical Education (ITE) Singapore (2010).
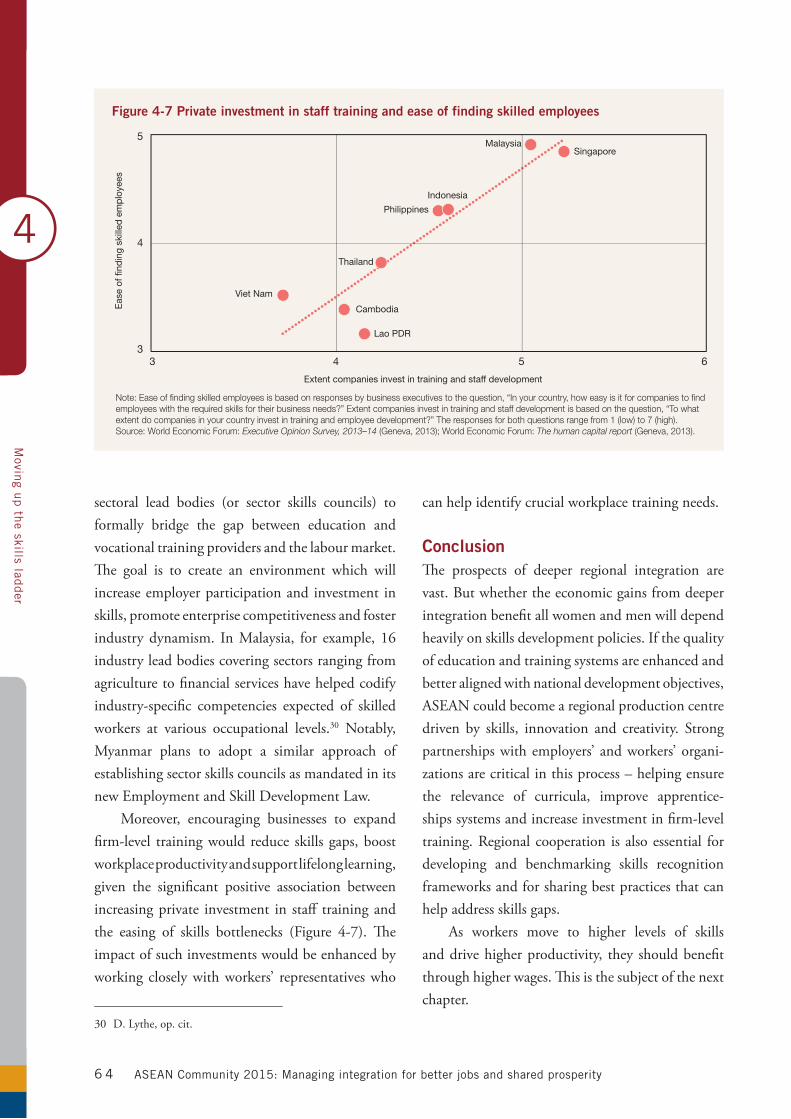
4
Movin
g up th
e skills ladder
ASEAN Community 2015: Managing integration for better jobs and shared prosperity6 4
sectoral lead bodies (or sector skills councils) to formally bridge the gap between education and vocational training providers and the labour market. The goal is to create an environment which will increase employer participation and investment in skills, promote enterprise competitiveness and foster industry dynamism. In Malaysia, for example, 16 industry lead bodies covering sectors ranging from agriculture to financial services have helped codify industry-specific competencies expected of skilled workers at various occupational levels.30 Notably, Myanmar plans to adopt a similar approach of establishing sector skills councils as mandated in its new Employment and Skill Development Law.
Moreover, encouraging businesses to expand firm-level training would reduce skills gaps, boost workplace productivity and support lifelong learning, given the significant positive association between increasing private investment in staff training and the easing of skills bottlenecks (Figure 4-7). Theimpact of such investments would be enhanced by working closely with workers’ representatives who
30 D. Lythe, op. cit.
can help identify crucial workplace training needs.
ConclusionThe prospects of deeper regional integration are vast. But whether the economic gains from deeper integration benefit all women and men will depend heavily on skills development policies. If the quality of education and training systems are enhanced and better aligned with national development objectives, ASEAN could become a regional production centre driven by skills, innovation and creativity. Strong partnerships with employers’ and workers’ organi-zations are critical in this process – helping ensure the relevance of curricula, improve apprentice-ships systems and increase investment in firm-level training. Regional cooperation is also essential for developing and benchmarking skills recognition frameworks and for sharing best practices that can help address skills gaps.
As workers move to higher levels of skills and drive higher productivity, they should benefit through higher wages. This is the subject of the next chapter.
Note: Ease of finding skilled employees is based on responses by business executives to the question, “In your country, how easy is it for companies to find employees with the required skills for their business needs?” Extent companies invest in training and staff development is based on the question, “To what extent do companies in your country invest in training and employee development?” The responses for both questions range from 1 (low) to 7 (high).Source: World Economic Forum: Executive Opinion Survey, 2013–14 (Geneva, 2013); World Economic Forum: The human capital report (Geneva, 2013).
Figure 4-7 Private investment in staff training and ease of finding skilled employees
Extent companies invest in training and staff development
SingaporeMalaysia
Philippines
Thailand
Indonesia
Lao PDR
Cambodia
Viet Nam
Eas
e of
find
ing
skill
ed e
mp
loye
es
5
4
33 4 5 6
5
Lin
king w
ages to prod
uctivity
ASEAN Community 2015: Managing integration for better jobs and shared prosperity 6 5
The economic transformation of the ASEAN region has seen millions of people migrate from the rural areas and take paid jobs in factories and the service sector. As a result, across the ten ASEAN Member States wages are now the main source of income for 116.9millionworkersandtheirfamilies.1 In Brunei Darussalam, Malaysia and Singapore, some three-quarters or more of all workers now depend on wages – a proportion typical of developed econo-mies. Meanwhile, the share of wage employees in total employment has also been growing strongly in other countries such as Cambodia, Indonesia, Philippines and Viet Nam (Table 5-1). Rising real wagesAs more people depend on wages for their liveli-hoods, wages and their purchasing power assume greater significance – for workers as a source of income, and in turn for economies across the region as a source of demand. Overall, the picture has been positive:since2005,therehasbeenmodestgrowth
1 ILO:TrendsEconometricModels,Jan.2014.
in real wages (after allowing for inflation). In the past two years, driven partly by substantial increases in minimum wages, real wage growth has acceler-ated in a number of countries, notably Indonesia, Thailand and Viet Nam. This led to wage growth in excess of three per cent in 2012 and, according to preliminaryestimates,alsoin2013(Figure5-1).
Though wages have been growing across ASEAN, there remain large differences in levels between Member States (Figure 5-2). Lao People’s Democratic Republic and Cambodia, for example, have the region’s lowest wages, with only $119and $121 respectively, while the average worker in Singaporeearns$3,547permonth.Betweentheseextremes lie Indonesia ($174),VietNam ($181),Philippines($206),Thailand($357)andMalaysia($609). Although wages in the CLMV countrieshave been growing faster than in the more advanced ASEAN Member States in recent years, this catch-up process will not bridge the gap in the near future.
Wage differences will therefore continue to encourage labour migration, for example, to Malaysia from neighbouring Indonesia, and into
ASEAN Member States will increasingly compete in the global economy on the basis
of a more productive workforce, and enterprises will need to attract and retain workers
by offering better wages. Indeed the best way to ensure equitable development and
to decrease dependency on exports is to link rises in productivity with increases in
wages. To achieve this, ASEAN Member States can strengthen their wage-setting
institutions.
Linking wages to productivity
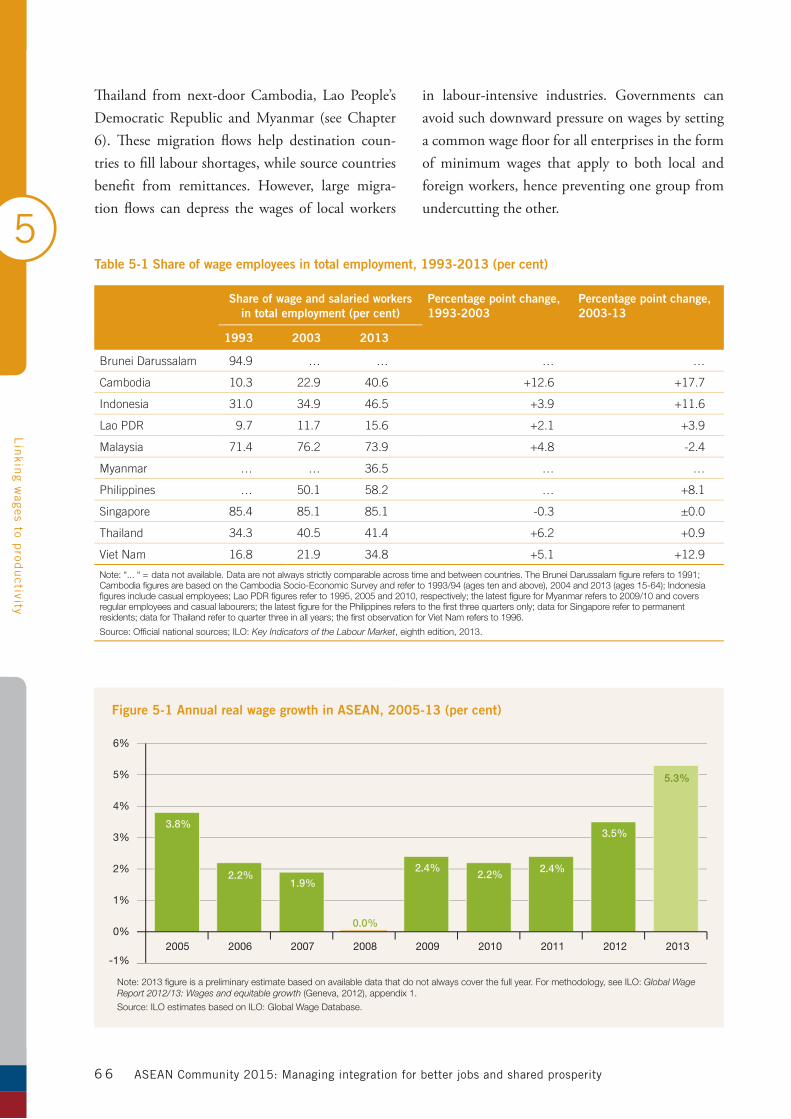
5
Lin
king w
ages to prod
uctivity
ASEAN Community 2015: Managing integration for better jobs and shared prosperity6 6
Thailand from next-door Cambodia, Lao People’s Democratic Republic and Myanmar (see Chapter 6). These migration flows help destination coun-tries to fill labour shortages, while source countries benefit from remittances. However, large migra-tion flows can depress the wages of local workers
in labour-intensive industries. Governments can avoid such downward pressure on wages by setting a common wage floor for all enterprises in the form of minimum wages that apply to both local and foreign workers, hence preventing one group from undercutting the other.
Figure 5-1 Annual real wage growth in ASEAN, 2005-13 (per cent)
0%
1%
-1%
2%
3%
4%
5%
6%
2005
3.8%
2006
2.2%
2007
1.9%
2008
0.0%
2009
2.4%
2010
2.2%
2011
2.4%
2012
3.5%
2013
5.3%
Note: 2013 figure is a preliminary estimate based on available data that do not always cover the full year. For methodology, see ILO: Global Wage Report 2012/13: Wages and equitable growth (Geneva, 2012), appendix 1.
Source: ILO estimates based on ILO: Global Wage Database.
Table 5-1 Share of wage employees in total employment, 1993-2013 (per cent)
Share of wage and salaried workersin total employment (per cent)
Percentage point change, 1993-2003
Percentage point change, 2003-13
1993 2003 2013
Brunei Darussalam 94.9 … … … …
Cambodia 10.3 22.9 40.6 +12.6 +17.7
Indonesia 31.0 34.9 46.5 +3.9 +11.6
Lao PDR 9.7 11.7 15.6 +2.1 +3.9
Malaysia 71.4 76.2 73.9 +4.8 -2.4
Myanmar … … 36.5 … …
Philippines … 50.1 58.2 … +8.1
Singapore 85.4 85.1 85.1 -0.3 ±0.0
Thailand 34.3 40.5 41.4 +6.2 +0.9
Viet Nam 16.8 21.9 34.8 +5.1 +12.9
Note: “... “ = data not available. Data are not always strictly comparable across time and between countries. The Brunei Darussalam figure refers to 1991; Cambodia figures are based on the Cambodia Socio-Economic Survey and refer to 1993/94 (ages ten and above), 2004 and 2013 (ages 15-64); Indonesia figures include casual employees; Lao PDR figures refer to 1995, 2005 and 2010, respectively; the latest figure for Myanmar refers to 2009/10 and covers regular employees and casual labourers; the latest figure for the Philippines refers to the first three quarters only; data for Singapore refer to permanent residents; data for Thailand refer to quarter three in all years; the first observation for Viet Nam refers to 1996.
Source: Official national sources; ILO: Key Indicators of the Labour Market, eighth edition, 2013.
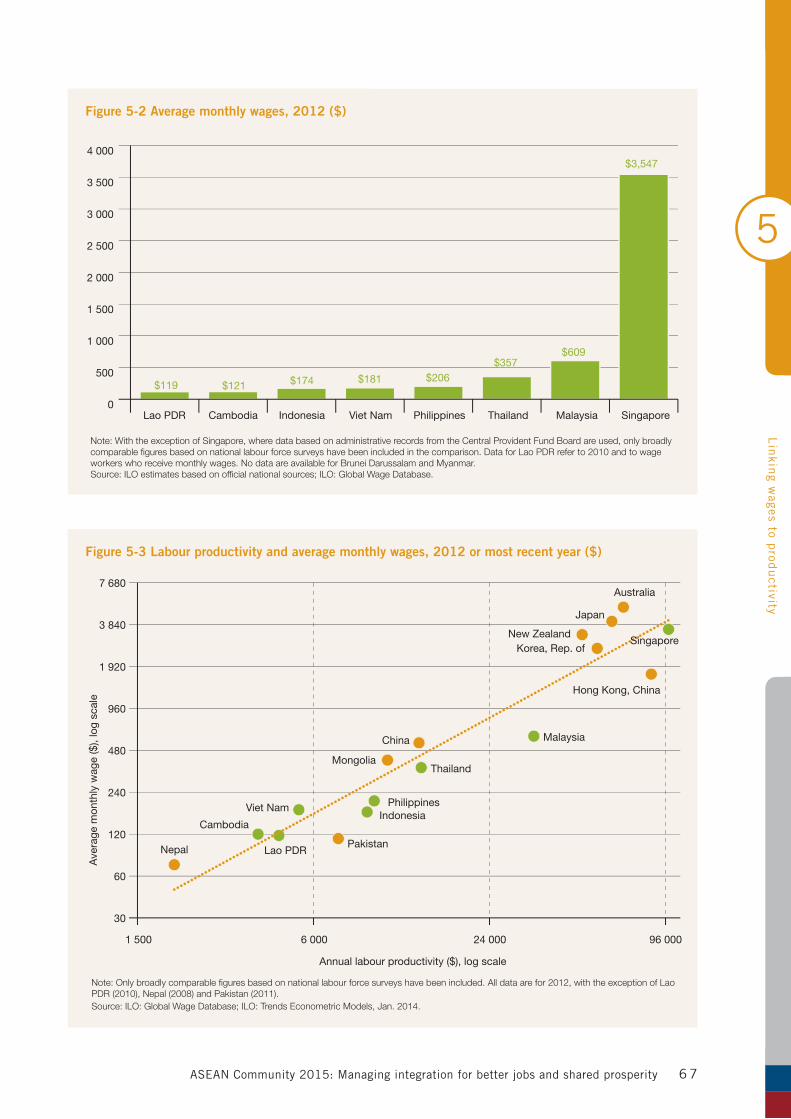
5
Lin
king w
ages to prod
uctivity
ASEAN Community 2015: Managing integration for better jobs and shared prosperity 6 7
Note: With the exception of Singapore, where data based on administrative records from the Central Provident Fund Board are used, only broadly comparable figures based on national labour force surveys have been included in the comparison. Data for Lao PDR refer to 2010 and to wage workers who receive monthly wages. No data are available for Brunei Darussalam and Myanmar.Source: ILO estimates based on official national sources; ILO: Global Wage Database.
Figure 5-2 Average monthly wages, 2012 ($)
0
500
1 000
1 500
2 000
2 500
3 000
3 500
4 000 $3,547
$609 $357
$206 $181 $174 $121 $119
SingaporeMalaysiaThailandPhilippinesViet NamIndonesiaCambodiaLao PDR
Figure 5-3 Labour productivity and average monthly wages, 2012 or most recent year ($)
7 680
3 840
1 920
960
480
240
120
60
30
1 500 6 000
Lao PDR
Australia
Japan
SingaporeNew Zealand
Korea, Rep. of
Hong Kong, China
MalaysiaChina
MongoliaThailand
PhilippinesViet NamIndonesia
Cambodia
PakistanNepal
24 000 96 000
Annual labour productivity ($), log scale
Ave
rage
mon
thly
wag
e ($
), lo
g sc
ale
Note: Only broadly comparable figures based on national labour force surveys have been included. All data are for 2012, with the exception of Lao PDR (2010), Nepal (2008) and Pakistan (2011).Source: ILO: Global Wage Database; ILO: Trends Econometric Models, Jan. 2014.
5
Lin
king w
ages to prod
uctivity
ASEAN Community 2015: Managing integration for better jobs and shared prosperity6 8
Large wage differences between ASEAN Member States partly reflect substantial differences in labour productivity – the value added per worker, or per hour worked. As countries adopt new technology, invest in infrastructure and improve the skills of their workforce, they lay the foundations for enter-prises to become more efficient – and to move into activities with a higher value added. Efficiency gains and structural transformation jointly increase labour productivity, and hence the “economic pie” grows.
A slice of these gains will be retained by enterprises through rising profits, but workers are generally compensated for their contribution in the form of better working conditions, including throughhigherwages.Figure5-3showsforaselec-tion of Asian economies a close correlation between labour productivity and wages. In the lower left-hand corner are the less-developed economies, which combine low labour productivity with low wages, while at the opposite end of the spectrum are Singapore and other advanced economies
which have high labour productivity and high wages. Several other ASEAN economies, including Thailand and Malaysia, have travelled a good part of the journey towards high-income status.
Linking wage growth to productivity growth is sound policy advice for two reasons: firstly, itensures that economic growth benefits workers in the form of rising real incomes. Secondly, it ensures that enterprises can increase their gross operating surplus in line with productivity growth. This enables them to reinvest in their operations, for instance to replace outdated machinery and expand capacity. The National Wages Council of Singapore, for instance, follows the maxim that: “To enableour workers to benefit from their share of produc-tivity improvements and at the same time allow our businesses to remain competitive, real wages should increase in line with productivity growth over the long term”.2
2 SeeNationalWagesCouncilofSingapore:NWC Guidelines 2012/2013 (Singapore, Ministry of Manpower, 2012), para. 10.
Thailand has successfully established itself as
a regional hub for several key manufacturing
industries, such as food processing and the
manufacture of cars or chemicals. Manufacturing
employed more than 5.4 million workers and in
2012 contributed 29.1 per cent of GDP – $114
billion.1 Crucial to the sector’s success was an
impressive increase in labour productivity which,
since 2001, has risen by more than 50 per cent.
However, workers in the manufacturing
sector have not seen corresponding gains: their
real wages remained flat until 2011 (see Box
Figure 5-1, Panel A). The result is a dramatic
decline in the labour share, the proportion of
value added received by workers in the form
of wages and employers’ contributions to the
social security system. Between 2001 and 2012,
it declined from 45.3 per cent to 32.7 per cent
(see Box Figure 5-1, Panel B).
Why this disconnect between productivity
and wages? One answer could be that manufac-
turing has become more capital-intensive. This
would justify a smaller share of value added going
to workers, and a greater share to the owners of
capital. However, the data do not support this
explanation. Panel B shows the trend in the net
capital stock relative to value added, indicating
that the capital-output ratio has fallen since the
late 1990s.2 Hence, manufacturing has in fact
become less capital-intensive.
Box 5-1 Productivity and wages in Thailand’s manufacturing sector
Increasing productivity
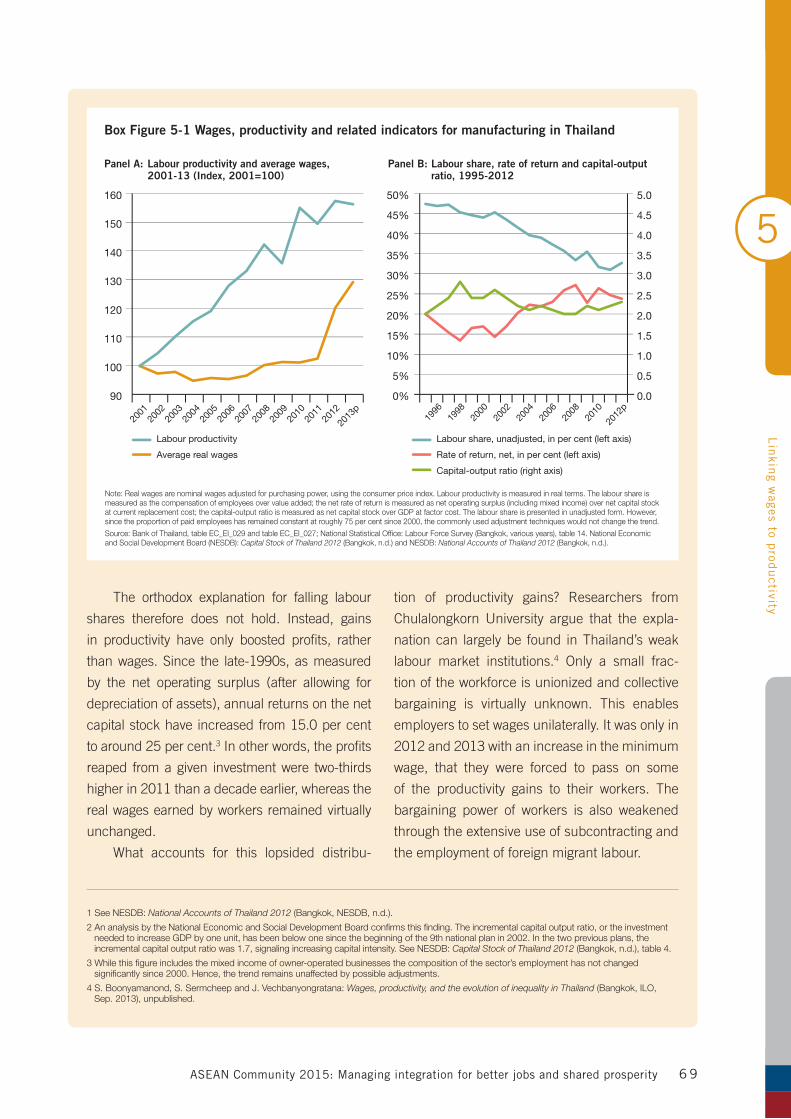
5
Lin
king w
ages to prod
uctivity
ASEAN Community 2015: Managing integration for better jobs and shared prosperity 6 9
The orthodox explanation for falling labour
shares therefore does not hold. Instead, gains
in productivity have only boosted profits, rather
than wages. Since the late-1990s, as measured
by the net operating surplus (after allowing for
depreciation of assets), annual returns on the net
capital stock have increased from 15.0 per cent
to around 25 per cent.3 In other words, the profits
reaped from a given investment were two-thirds
higher in 2011 than a decade earlier, whereas the
real wages earned by workers remained virtually
unchanged.
What accounts for this lopsided distribu-
tion of productivity gains? Researchers from
Chulalongkorn University argue that the expla-
nation can largely be found in Thailand’s weak
labour market institutions.4 Only a small frac-
tion of the workforce is unionized and collective
bargaining is virtually unknown. This enables
employers to set wages unilaterally. It was only in
2012 and 2013 with an increase in the minimum
wage, that they were forced to pass on some
of the productivity gains to their workers. The
bargaining power of workers is also weakened
through the extensive use of subcontracting and
the employment of foreign migrant labour.
Box Figure 5-1 Wages, productivity and related indicators for manufacturing in Thailand
Panel A: Labour productivity and average wages, 2001-13 (Index, 2001=100)
Panel B: Labour share, rate of return and capital-output ratio, 1995-2012
90
100
110
120
130
140
150
160
0%
5%
10%
15%
20%
25%
30%
35%
40%
45%
50%
0.0
0.5
1.0
1.5
2.0
2.5
3.0
3.5
4.0
4.5
5.0
2013
p20
1220
1120
1020
0920
0820
0720
0620
0520
0420
0320
0220
01
2012
p20
1020
0820
0620
0420
0220
0019
9819
96
Labour share, unadjusted, in per cent (left axis)
Rate of return, net, in per cent (left axis)
Capital-output ratio (right axis)
Labour productivity
Average real wages
Note: Real wages are nominal wages adjusted for purchasing power, using the consumer price index. Labour productivity is measured in real terms. The labour share is measured as the compensation of employees over value added; the net rate of return is measured as net operating surplus (including mixed income) over net capital stock at current replacement cost; the capital-output ratio is measured as net capital stock over GDP at factor cost. The labour share is presented in unadjusted form. However, since the proportion of paid employees has remained constant at roughly 75 per cent since 2000, the commonly used adjustment techniques would not change the trend.
Source: Bank of Thailand, table EC_EI_029 and table EC_EI_027; National Statistical Office: Labour Force Survey (Bangkok, various years), table 14. National Economic and Social Development Board (NESDB): Capital Stock of Thailand 2012 (Bangkok, n.d.) and NESDB: National Accounts of Thailand 2012 (Bangkok, n.d.).
1 See NESDB: National Accounts of Thailand 2012 (Bangkok, NESDB, n.d.).
2 An analysis by the National Economic and Social Development Board confirms this finding. The incremental capital output ratio, or the investment needed to increase GDP by one unit, has been below one since the beginning of the 9th national plan in 2002. In the two previous plans, the incremental capital output ratio was 1.7, signaling increasing capital intensity. See NESDB: Capital Stock of Thailand 2012 (Bangkok, n.d.), table 4.
3 While this figure includes the mixed income of owner-operated businesses the composition of the sector’s employment has not changed significantly since 2000. Hence, the trend remains unaffected by possible adjustments.
4 S. Boonyamanond, S. Sermcheep and J. Vechbanyongratana: Wages, productivity, and the evolution of inequality in Thailand (Bangkok, ILO, Sep. 2013), unpublished.
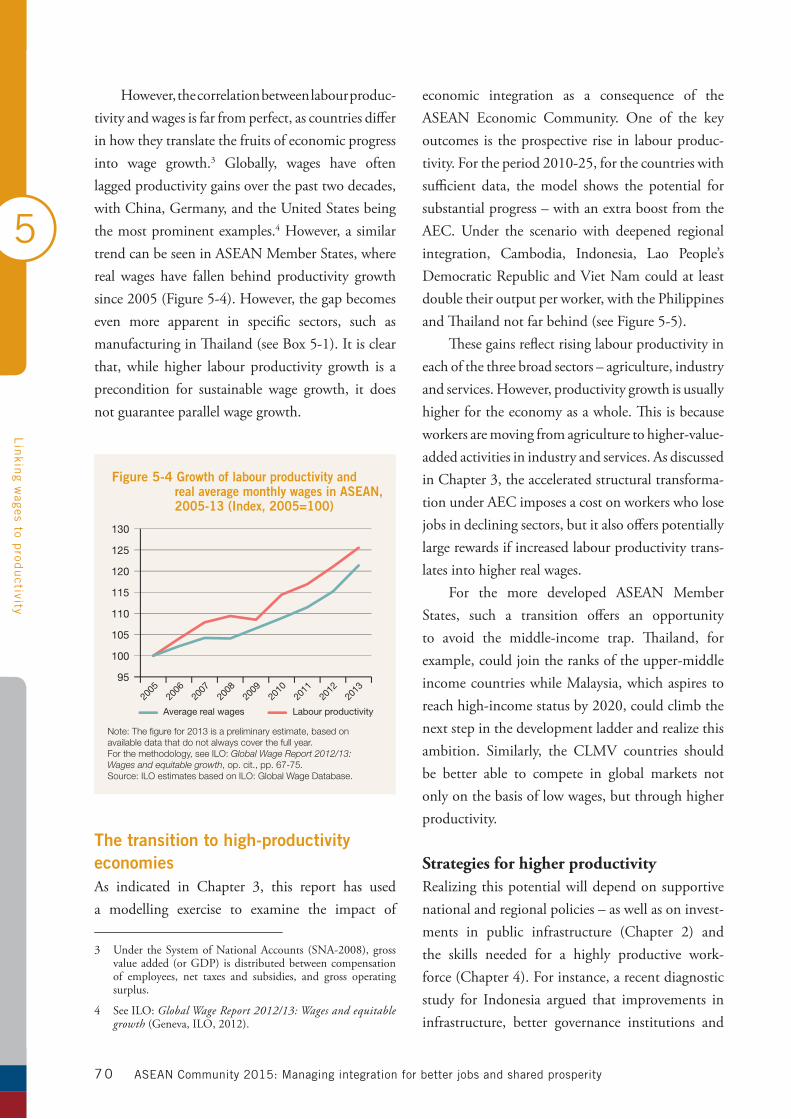
5
Lin
king w
ages to prod
uctivity
ASEAN Community 2015: Managing integration for better jobs and shared prosperity7 0
However, the correlation between labour produc-tivity and wages is far from perfect, as countries differ in how they translate the fruits of economic progress into wage growth.3 Globally, wages have often lagged productivity gains over the past two decades, with China, Germany, and the United States being the most prominent examples.4 However, a similar trend can be seen in ASEAN Member States, where real wages have fallen behind productivity growth since2005(Figure5-4).However,thegapbecomeseven more apparent in specific sectors, such as manufacturing in Thailand (see Box 5-1). It is clear that, while higher labour productivity growth is a precondition for sustainable wage growth, it does not guarantee parallel wage growth.
The transition to high-productivity economiesAs indicated in Chapter 3, this report has useda modelling exercise to examine the impact of
3 Under theSystemofNationalAccounts (SNA-2008),grossvalue added (or GDP) is distributed between compensation of employees, net taxes and subsidies, and gross operating surplus.
4 SeeILO:Global Wage Report 2012/13: Wages and equitable growth (Geneva, ILO, 2012).
economic integration as a consequence of the ASEAN Economic Community. One of the key outcomes is the prospective rise in labour produc-tivity. For the period 2010-25, for the countries with sufficient data, the model shows the potential for substantial progress – with an extra boost from the AEC. Under the scenario with deepened regional integration, Cambodia, Indonesia, Lao People’s Democratic Republic and Viet Nam could at least double their output per worker, with the Philippines and Thailand not far behind (see Figure 5-5).
These gains reflect rising labour productivity in each of the three broad sectors – agriculture, industry and services. However, productivity growth is usually higher for the economy as a whole. This is because workers are moving from agriculture to higher-value-added activities in industry and services. As discussed inChapter3,theacceleratedstructuraltransforma-tion under AEC imposes a cost on workers who lose jobs in declining sectors, but it also offers potentially large rewards if increased labour productivity trans-lates into higher real wages.
For the more developed ASEAN Member States, such a transition offers an opportunity to avoid the middle-income trap. Thailand, for example, could join the ranks of the upper-middle income countries while Malaysia, which aspires to reach high-income status by 2020, could climb the next step in the development ladder and realize this ambition. Similarly, the CLMV countries should be better able to compete in global markets not only on the basis of low wages, but through higher productivity.
Strategies for higher productivityRealizing this potential will depend on supportive national and regional policies – as well as on invest-ments in public infrastructure (Chapter 2) and the skills needed for a highly productive work-force(Chapter4).Forinstance,arecentdiagnosticstudy for Indonesia argued that improvements in infrastructure, better governance institutions and
Note: The figure for 2013 is a preliminary estimate, based on available data that do not always cover the full year. For the methodology, see ILO: Global Wage Report 2012/13: Wages and equitable growth, op. cit., pp. 67-75. Source: ILO estimates based on ILO: Global Wage Database.
Figure 5-4 Growth of labour productivity and real average monthly wages in ASEAN, 2005-13 (Index, 2005=100)
95
100
105
110
115
120
125
130
Average real wages Labour productivity
2013
2012
2011
2010
2009
2008
2007
2006
2005

5
Lin
king w
ages to prod
uctivity
ASEAN Community 2015: Managing integration for better jobs and shared prosperity 71
broader access to high-quality education could help to unlock the country’s full economic potential.5
But raising productivity will also demand
5 ADB, ILO, and IDB: Indonesia: Critical development constraints (Mandaluyong City, ADB, 2010).
investments by enterprises and profound changes in the way they operate. The ILO survey among ASEAN business leaders (see Annex C) offers some insights into their preferred strategies to compete successfullyinthisnewenvironment.Theseinclude:innovation to improve the quality of products and
Source: ILO estimates based on M. Plummer, P. Petri and F. Zhai, op. cit.
Figure 5-5 Change in labour productivity under the AEC, 2010-25 (per cent)
Agriculture, baseline
Agriculture, AEC Impact
Industry, baseline
Industry, AEC Impact
Services, baseline
Services, AEC Impact
Total, baseline
Total, AEC Impact
Viet NamThailandPhilippinesLao PDRIndonesiaCambodia0%
20%
40%
60%
80%
100%
120%
140%
160%
Note: Respondents were asked “To make your enterprise more competitive within ASEAN, how likely will your enterprise adopt the following measures?”
Source: ILO: Survey of ASEAN Employers on Skills and Competitiveness (2013).
Figure 5-6 Strategies to increase competitiveness by ASEAN enterprises, 2013 (responses in per cent)
Very likely Likely Unlikely Very unlikely
Reduce other production costs
Reduce labour costby paying lower wages
Innovate and increase quality ofproducts and services
Retain and attract skilled workersby increasing wages
Update machinery andproduction technology
Invest in better skillstraining for workers
0% 10% 20% 30% 40% 50% 60% 70% 80% 90% 100%
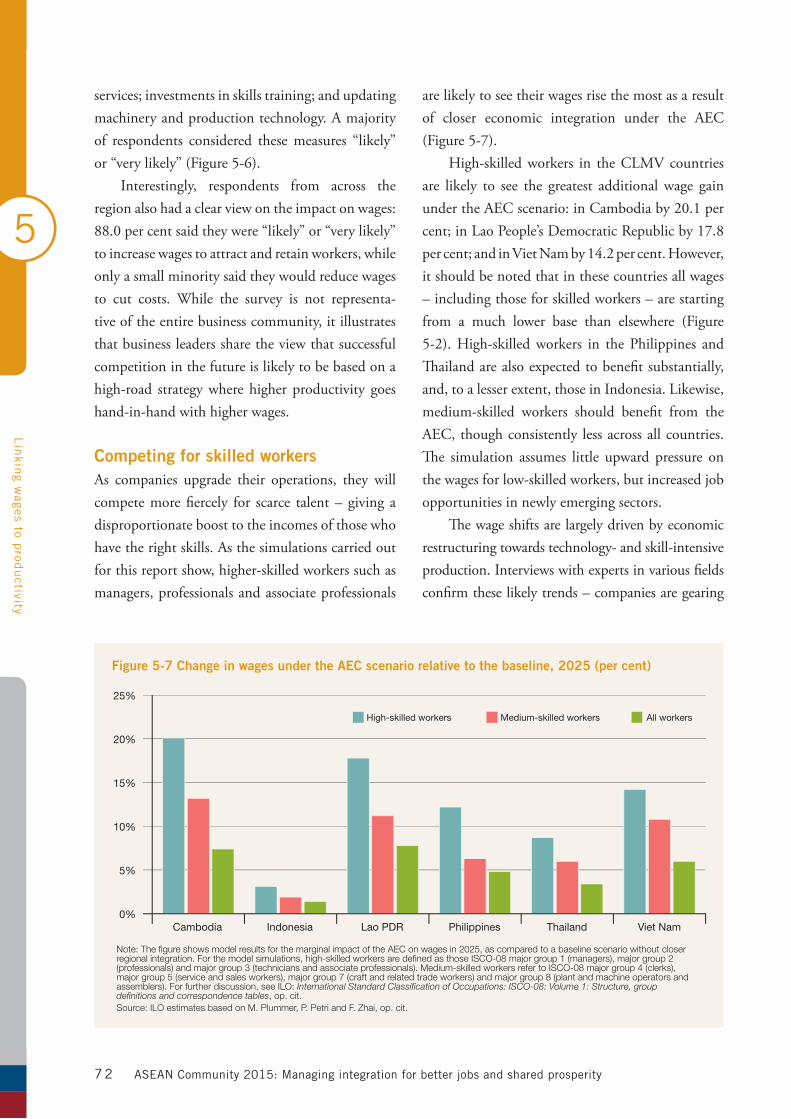
5
Lin
king w
ages to prod
uctivity
ASEAN Community 2015: Managing integration for better jobs and shared prosperity7 2
services; investments in skills training; and updating machinery and production technology. A majority of respondents considered these measures “likely” or “very likely” (Figure 5-6).
Interestingly, respondents from across the regionalsohadaclearviewontheimpactonwages:88.0 per cent said they were “likely” or “very likely” to increase wages to attract and retain workers, while only a small minority said they would reduce wages to cut costs. While the survey is not representa-tive of the entire business community, it illustrates that business leaders share the view that successful competition in the future is likely to be based on a high-road strategy where higher productivity goes hand-in-hand with higher wages.
Competing for skilled workers As companies upgrade their operations, they will compete more fiercely for scarce talent – giving a disproportionate boost to the incomes of those who have the right skills. As the simulations carried out for this report show, higher-skilled workers such as managers, professionals and associate professionals
are likely to see their wages rise the most as a result of closer economic integration under the AEC (Figure 5-7).
High-skilled workers in the CLMV countries are likely to see the greatest additional wage gain undertheAECscenario:inCambodiaby20.1percent; in Lao People’s Democratic Republic by 17.8 percent;andinVietNamby14.2percent.However,it should be noted that in these countries all wages – including those for skilled workers – are starting from a much lower base than elsewhere (Figure 5-2). High-skilled workers in the Philippines and Thailand are also expected to benefit substantially, and, to a lesser extent, those in Indonesia. Likewise, medium-skilled workers should benefit from the AEC, though consistently less across all countries. The simulation assumes little upward pressure on the wages for low-skilled workers, but increased job opportunities in newly emerging sectors.
The wage shifts are largely driven by economic restructuring towards technology- and skill-intensive production. Interviews with experts in various fields confirm these likely trends – companies are gearing
Figure 5-7 Change in wages under the AEC scenario relative to the baseline, 2025 (per cent)
Viet NamThailandPhilippinesLao PDRIndonesiaCambodia
High-skilled workers Medium-skilled workers All workers
0%
5%
10%
15%
20%
25%
Note: The figure shows model results for the marginal impact of the AEC on wages in 2025, as compared to a baseline scenario without closer regional integration. For the model simulations, high-skilled workers are defined as those ISCO-08 major group 1 (managers), major group 2 (professionals) and major group 3 (technicians and associate professionals). Medium-skilled workers refer to ISCO-08 major group 4 (clerks), major group 5 (service and sales workers), major group 7 (craft and related trade workers) and major group 8 (plant and machine operators and assemblers). For further discussion, see ILO: International Standard Classification of Occupations: ISCO-08: Volume 1: Structure, group definitions and correspondence tables, op. cit.Source: ILO estimates based on M. Plummer, P. Petri and F. Zhai, op. cit.
5
Lin
king w
ages to prod
uctivity
ASEAN Community 2015: Managing integration for better jobs and shared prosperity 7 3
up to scramble for talent (see Box 5-2). Likewise, the ILO survey among ASEAN employers found that nearly half of enterprises expect that they will have to offer higher wages to retain skilled workers and to prevent them from pursuing opportunities in other ASEANMemberStates(seeFigure5-8).Only13.0per cent anticipated that their ability to recruit skilled workers from other ASEAN Member States would result in falling wages. The remainder believed that mobility would not have a significant impact on the wages of skilled workers. Mobility is likely, however, to be limited to relatively few workers from selected occupational groups (see Chapter 6).
Wage inequalityIf the wages of skilled workers grow faster than those at the bottom end of the wage ladder, this will widen wage disparities within countries. The find-ings therefore highlight the risk of greater inequality – an outcome that would run counter to the ASEAN objective of equitable economic development and inclusive growth.6 Many ASEAN Member States are already seeing rises in wage inequality. In Singapore, for instance, the wages of those near the bottom of the distribution have hardly risen in real terms over the past decade and a half, while top earners have seensubstantialgains(seeBox5-3).
One way to measure wage inequality is to compare the monthly earnings of those near the top (90th percentile) to those near the bottom(10th percentile). This ratio has reached almost ten in Singapore, and roughly seven in Indonesia, Philippines and Thailand (see Figure 5-9). Withratios of around four, the wage distribution is still more compressed in Cambodia and Viet Nam. By comparison, earnings dispersion for full-time employees in OECD countries ranges from 2.3(Belgium) to 5.2 (Israel) under this measure.7
6 See ASEAN Framework for Equitable Economic Development, Bali, Nov. 2011.
7 SeeOECD:Divided we stand: Why inequality keeps rising (Paris, OECD, 2011).
Gender disparities are one dimension of wage inequality. With the exception of the Philippines, women earn less than men in all ASEAN Member States for which data are available. The gap is modest in Malaysia and Thailand, but reaches ten per cent in Viet Nam and roughly one-quarter in Cambodia and Singapore (see Annex F, Table F1-8).
These gaps are caused by a number of factors, including differences in education and training,
“Yes, companies will have to pay more and
offer more training and internal growth to
compete with regional companies, or go out
of business.”
Senior Education Specialist,Regional Development Bank,
the Philippines
“Companies will invest in what makes them
grow, and minimum salaries are growing all
across ASEAN. You want to capture the growth,
so you need to increase everything related to
productivity. Companies will be willing to invest
in trainings, machinery and higher wages for
talent, since these are the ones that increase
production and growth.”
Market Business Leader, Multinational Human Resources Agency,
Singapore
“Reducing wages and incentives will just
kill enterprises. Skilled people are costly, so
better invest in the people who are already in
the enterprise. Hiring people with higher skill
should apply only for a temporary period of
time to train and transfer the knowledge.”
Executive, Garment Industry Association,Lao People’s Democratic Republic
Box 5-2 Expert views on wages, skills and competitiveness in ASEAN
Source: ILO: Survey of ASEAN Employers on Skills and Competitiveness (2013).
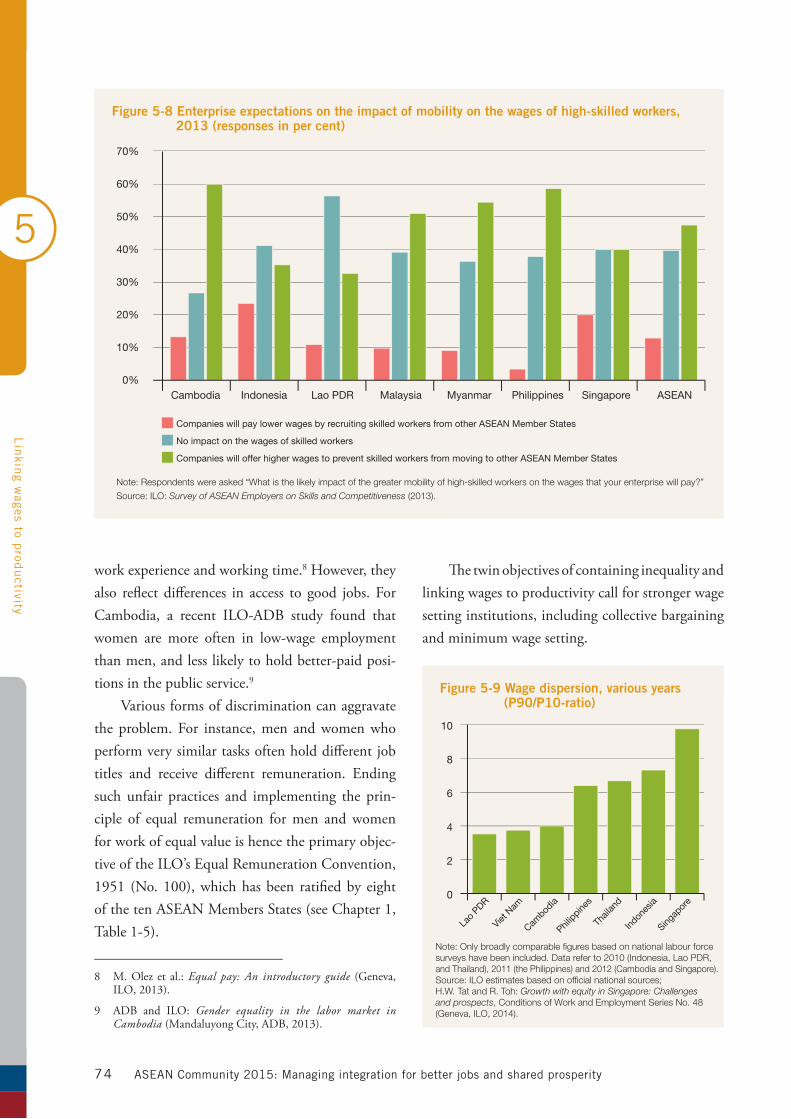
5
Lin
king w
ages to prod
uctivity
ASEAN Community 2015: Managing integration for better jobs and shared prosperity74
work experience and working time.8 However, they also reflect differences in access to good jobs. For Cambodia, a recent ILO-ADB study found that women are more often in low-wage employment than men, and less likely to hold better-paid posi-tions in the public service.9
Various forms of discrimination can aggravate the problem. For instance, men and women who perform very similar tasks often hold different job titles and receive different remuneration. Ending such unfair practices and implementing the prin-ciple of equal remuneration for men and women for work of equal value is hence the primary objec-tive of the ILO’s Equal Remuneration Convention, 1951 (No.100),whichhasbeen ratifiedbyeightof the ten ASEAN Members States (see Chapter 1, Table 1-5).
8 M.Olez et al.:Equal pay: An introductory guide (Geneva, ILO,2013).
9 ADB and ILO: Gender equality in the labor market in Cambodia(MandaluyongCity,ADB,2013).
The twin objectives of containing inequality and linking wages to productivity call for stronger wage setting institutions, including collective bargaining and minimum wage setting.
Figure 5-8 Enterprise expectations on the impact of mobility on the wages of high-skilled workers, 2013 (responses in per cent)
ASEANSingaporePhilippinesMyanmarMalaysiaLao PDRIndonesiaCambodia
Companies will pay lower wages by recruiting skilled workers from other ASEAN Member States
No impact on the wages of skilled workers
Companies will offer higher wages to prevent skilled workers from moving to other ASEAN Member States
0%
10%
20%
30%
40%
50%
60%
70%
Note: Respondents were asked “What is the likely impact of the greater mobility of high-skilled workers on the wages that your enterprise will pay?”
Source: ILO: Survey of ASEAN Employers on Skills and Competitiveness (2013).
Note: Only broadly comparable figures based on national labour force surveys have been included. Data refer to 2010 (Indonesia, Lao PDR, and Thailand), 2011 (the Philippines) and 2012 (Cambodia and Singapore).Source: ILO estimates based on official national sources; H.W. Tat and R. Toh: Growth with equity in Singapore: Challenges and prospects, Conditions of Work and Employment Series No. 48 (Geneva, ILO, 2014).
Figure 5-9 Wage dispersion, various years (P90/P10-ratio)
Singap
ore
Indon
esia
Thail
and
Philippine
s
Cambod
ia
Viet N
am
Lao
PDR0
2
4
6
8
10
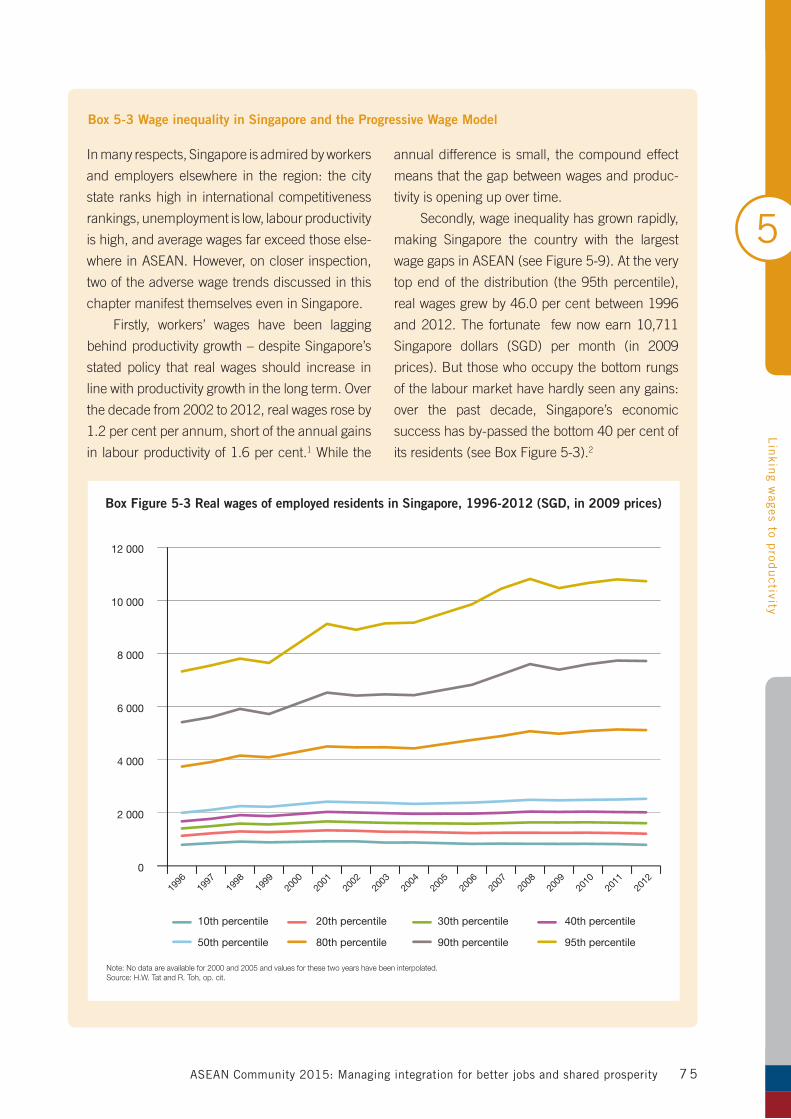
5
Lin
king w
ages to prod
uctivity
ASEAN Community 2015: Managing integration for better jobs and shared prosperity 7 5
In many respects, Singapore is admired by workers
and employers elsewhere in the region: the city
state ranks high in international competitiveness
rankings, unemployment is low, labour productivity
is high, and average wages far exceed those else-
where in ASEAN. However, on closer inspection,
two of the adverse wage trends discussed in this
chapter manifest themselves even in Singapore.
Firstly, workers’ wages have been lagging
behind productivity growth – despite Singapore’s
stated policy that real wages should increase in
line with productivity growth in the long term. Over
the decade from 2002 to 2012, real wages rose by
1.2 per cent per annum, short of the annual gains
in labour productivity of 1.6 per cent.1 While the
annual difference is small, the compound effect
means that the gap between wages and produc-
tivity is opening up over time.
Secondly, wage inequality has grown rapidly,
making Singapore the country with the largest
wage gaps in ASEAN (see Figure 5-9). At the very
top end of the distribution (the 95th percentile),
real wages grew by 46.0 per cent between 1996
and 2012. The fortunate few now earn 10,711
Singapore dollars (SGD) per month (in 2009
prices). But those who occupy the bottom rungs
of the labour market have hardly seen any gains:
over the past decade, Singapore’s economic
success has by-passed the bottom 40 per cent of
its residents (see Box Figure 5-3).2
Box 5-3 Wage inequality in Singapore and the Progressive Wage Model
10th percentile 20th percentile 30th percentile 40th percentile
50th percentile 80th percentile 90th percentile 95th percentile
Box Figure 5-3 Real wages of employed residents in Singapore, 1996-2012 (SGD, in 2009 prices)
2012
2011
2010
2009
2008
2007
2006
2005
2004
2003
2002
2001
2000
1999
1998
1997
1996
0
2 000
4 000
6 000
8 000
10 000
12 000
Note: No data are available for 2000 and 2005 and values for these two years have been interpolated. Source: H.W. Tat and R. Toh, op. cit.
5
Lin
king w
ages to prod
uctivity
ASEAN Community 2015: Managing integration for better jobs and shared prosperity76
Effective collective bargaining can help to rebalance the gains from economic growth, reduce inequality, and ensure an orderly transition towards more productive economies. At present, most ASEAN Member States have some way to go to strengthen their systems for collective negotiations between employers and workers. The pay-offs from building stronger institutions have been demonstrated in
the OECD countries, where collective bargaining has facilitated economic restructuring – helping enterprises to cope with unexpected events and strengthen training and skill formation.
Collective bargaining can also standardize employment conditions across enterprises and reduce the potential for a downward spiral of wage competition between enterprises. This danger can be addressed by negotiations between union federations
Low wages are particularly frequent in some
service occupations. Among employed resi-
dents who work as cleaners, labourers or related
workers, more than 50 per cent earned less than
SGD1,000 in 2013. Of those in other occupa-
tions, only seven per cent had such low wages.3
Given the high cost of living in Singapore, the
problem of working poverty – defined as earning
insufficient income despite having a job – has
sparked a lively debate in one of the richest
countries in the world.4
In its guidelines for 2012/13, Singapore’s
National Wages Council (NWC) therefore recom-
mended that enterprises give all workers who earn
less than SGD1,000 a wage increase of at least
SGD50 per month.5 However, the NWC’s guide-
lines are non-binding and only three out of every
ten enterprises had followed them by December
2012.6 One reason is that many enterprises in
low-wage sectors compete fiercely against each
other on the basis of low costs, especially for
outsourced services such as cleaning, security
and landscape gardening.
Championed by the National Trades Union
Congress, the Progressive Wage Model (PWM)
aims to address this by establishing a common
wage floor for enterprises in these three indus-
tries, combined with training and career
progression. Pioneered as a voluntary initiative
designed by the Tripartite Cluster for Cleaners,
the minimum monthly pay of SGD1,000 for
entry-level workers and the other elements of the
PWM became mandatory in 2014 for cleaning
companies under the licencing regime.7
By making specific wage rates compulsory
for all enterprises in a sector, the PWM breaks
with Singapore’s tradition of non-binding recom-
mendations. Hence, some commentators have
wondered whether the PWM is a sectoral minimum
wage in disguise.8 In fact, some economists have
argued that “the context of the Singapore labour
market provides a strong case for the introduc-
tion of a statutory minimum wage”, which could
help to raise productivity, lessen dependency on
foreign labour and contribute towards greater
equity at the same time.9
1 See National Wages Council of Singapore: NWC Guidelines 2013/2014 (Singapore, Ministry of Manpower, 2013), para. 8.2 For a more detailed discussion, see H.W. Tat and R. Toh, op. cit.3 Calculations based on Ministry of Manpower: Labour Force in Singapore, 2013 (Singapore, 2014), table 22. These figures exclude foreign
domestic workers and other low-paid migrant workers without residency status.4 See J. Donaldson et al.: “Measuring poverty in Singapore: Frameworks for consideration”, in Social Space (2013, Issue 6), pp. 58-66. 5 See National Wages Council of Singapore: NWC Guidelines 2012/2013 (Singapore, Ministry of Manpower, 2012).6 Ibid., para. 19.7 Higher-skilled workers, such as supervisors, attract higher wage rates of up to SGD1,700 per month.8 The mandatory nature of the pay floor in the PWM meets the ILO’s definition of minimum wage as “the minimum sum payable to a worker for
work performed or services rendered […] which may not be reduced either by individual or collective agreement”. See ILO: General Survey of the reports on the Minimum Wage Fixing Convention, 1970 (No. 131), and the Minimum Wage Fixing Recommendation, 1970 (No. 135), Report III (Part 1B), International Labour Conference, 103rd Session, Geneva, 2014, para. 53. The closest parallel to the PWM might be found in Germany, where the Government has made collective agreements mandatory for all employers in the cleaning sector.
9 See W.T. Hui: “Economic growth and inequality in Singapore: The case for a minimum wage”, in International Labour Review (2013, Vol. 152), pp. 107-123.
The value of collective bargaining
5
Lin
king w
ages to prod
uctivity
ASEAN Community 2015: Managing integration for better jobs and shared prosperity 7 7
and employers’ organizations that set minimum conditions for an entire sector (multi-employer bargaining), and to a lesser extent through agreements between individual companies and company-level trade unions (single-employer bargaining).10
In some advanced countries, collective bargaining institutions cover more than half of the workforce. Collective bargaining coverage in most ASEAN Member States lags far behind, however, and such agreements apply to far fewer workers. A statistical overview by the ILO showed that in the Philippines in 2008, for example, only 2.2 per cent of wage workers were covered by collec-tive bargaining agreements, and that in Malaysia in 2007only2.4percentofprivatesectoremployeeswere covered. By contrast, Singapore had a coverage rateof17.3percent.11
As a result of weak institutions for collective negotiations and dispute resolution, industrial rela-tions often erupt into conflict. Genuine collective bargaining between representative trade unions and employers in the private sector is practically non-existent in countries such as Viet Nam and Lao People’s Democratic Republic. In Viet Nam, workers have instead resorted to wildcat strikes to achieve improvements in wages and working conditions.12
In Indonesia, the inability of workers and employers to bargain over wages at the level of enterprises or sectors creates a strong incentive for unions to try to achieve all wage gains through the minimum wage-fixing system. The practice of most employers to link the wages of all workers to the minimum wage has added to the importance of minimum wages, and politicized industrial conflicts. In effect, the heads of local government
10 OECD:OECD Employment Outlook(Paris,1994),pp.167-188.
11 S.HayterandV.Stoevska:Social dialogue indicators: International statistical inquiry 2008-09 (Geneva, ILO, 2011).
12 Y. Yoon: A comparative study on industrial relations and collective bargaining in East Asian countries (Geneva, ILO, 2009).
have the final say about most wages. Decisions are therefore often driven by political, rather than economic and social considerations. Strengthening collective bargaining and bipartite dispute resolu-tion is an obvious option to avoid excessive reliance on minimum wage-setting.13
Cambodia offers an interesting control experi-ment. The country’s minimum wage applies only to the garment and footwear sector, which is currently the largest private sector employer. Weaknesses of the minimum wage setting institutions have led to large-scale strikes and violence in the recent past. However, in Cambodia’s large unionized hotels and airports, wages are fixed entirely through collective bargaining. The process has been largely peaceful and productive; strikes have only occurred in instances of alleged anti-union discrimination.
Setting minimum wagesIn the absence of effective collective bargaining, the main mechanism for setting wages in ASEAN Member States has been the establishment of minimum wages. The core objective of such policies should be to protect workers who lack bargaining power – and help translate the benefits of closer regional integration into shared prosperity for all. Since some of the main beneficiaries of the AEC are likely to be skilled workers, minimum wages can reduce the risk that wage disparities grow further, leaving low-skilled workers behind.
In recent years, a number of ASEAN Member States have modernized their institutions for setting minimumwages.Forexample,in2013,VietNamestablished a National Wage Council to give trade unions and employers’ representatives a direct stake in minimum wage negotiations. Also in 2013,Malaysia introduced its first national minimum wage and the National Wages Consultative Council is currently undertaking its first review. In the
13 See,forinstance,therecommendationsmadeinWorldBank:Indonesia jobs report: Towards better jobs and security for all (Washington, DC and Jakarta, 2010), p. 115.
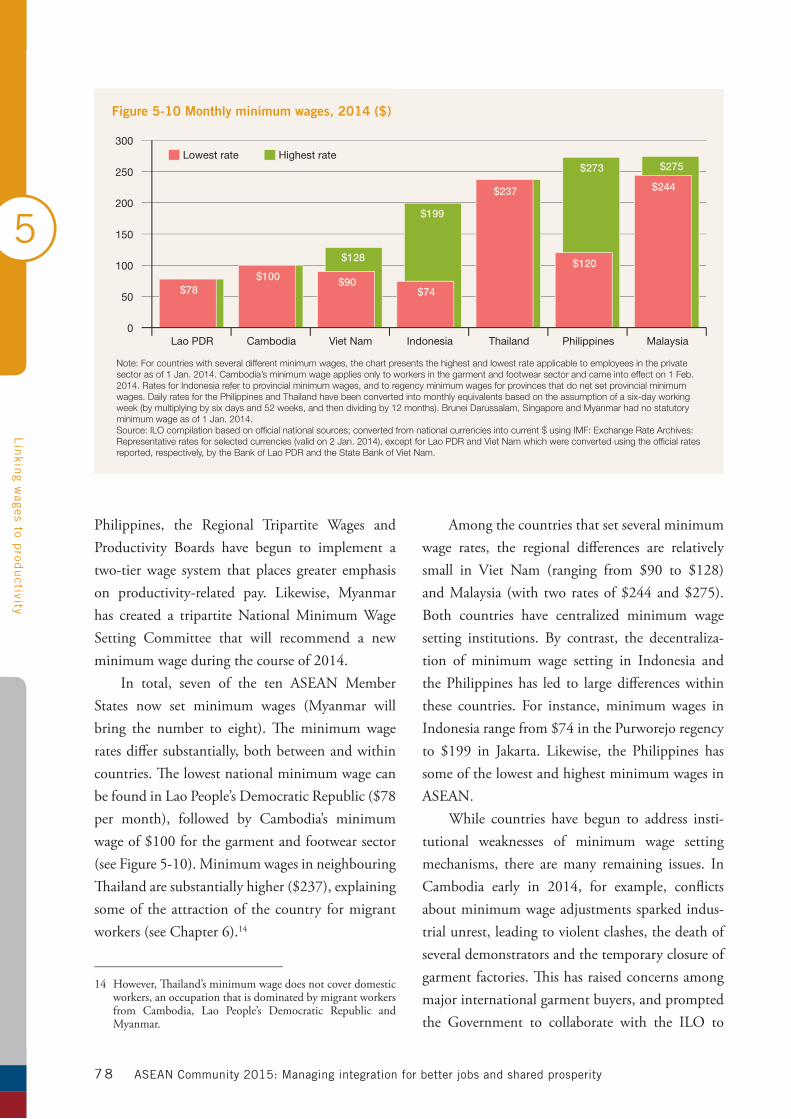
5
Lin
king w
ages to prod
uctivity
ASEAN Community 2015: Managing integration for better jobs and shared prosperity7 8
Philippines, the Regional Tripartite Wages and Productivity Boards have begun to implement a two-tier wage system that places greater emphasis on productivity-related pay. Likewise, Myanmar has created a tripartite National Minimum Wage Setting Committee that will recommend a new minimumwageduringthecourseof2014.
In total, seven of the ten ASEAN Member States now set minimum wages (Myanmar will bring the number to eight). The minimum wage rates differ substantially, both between and within countries. The lowest national minimum wage can be found in Lao People’s Democratic Republic ($78 per month), followed by Cambodia’s minimum wage of $100 for the garment and footwear sector (see Figure 5-10). Minimum wages in neighbouring Thailandaresubstantiallyhigher($237),explainingsome of the attraction of the country for migrant workers (see Chapter 6).14
14 However, Thailand’s minimum wage does not cover domestic workers, an occupation that is dominated by migrant workers from Cambodia, Lao People’s Democratic Republic and Myanmar.
Among the countries that set several minimum wage rates, the regional differences are relatively small in Viet Nam (ranging from $90 to $128)andMalaysia (with two ratesof$244and$275).Both countries have centralized minimum wage setting institutions. By contrast, the decentraliza-tion of minimum wage setting in Indonesia and the Philippines has led to large differences within these countries. For instance, minimum wages in Indonesiarangefrom$74inthePurworejoregencyto $199 in Jakarta. Likewise, the Philippines hassome of the lowest and highest minimum wages in ASEAN.
While countries have begun to address insti-tutional weaknesses of minimum wage setting mechanisms, there are many remaining issues. In Cambodia early in 2014, for example, conflictsabout minimum wage adjustments sparked indus-trial unrest, leading to violent clashes, the death of several demonstrators and the temporary closure of garment factories. This has raised concerns among major international garment buyers, and prompted the Government to collaborate with the ILO to
Figure 5-10 Monthly minimum wages, 2014 ($)
Philippines MalaysiaThailandLao PDR IndonesiaViet NamCambodia
Lowest rate Highest rate
Note: For countries with several different minimum wages, the chart presents the highest and lowest rate applicable to employees in the private sector as of 1 Jan. 2014. Cambodia’s minimum wage applies only to workers in the garment and footwear sector and came into effect on 1 Feb. 2014. Rates for Indonesia refer to provincial minimum wages, and to regency minimum wages for provinces that do net set provincial minimum wages. Daily rates for the Philippines and Thailand have been converted into monthly equivalents based on the assumption of a six-day working week (by multiplying by six days and 52 weeks, and then dividing by 12 months). Brunei Darussalam, Singapore and Myanmar had no statutory minimum wage as of 1 Jan. 2014.Source: ILO compilation based on official national sources; converted from national currencies into current $ using IMF: Exchange Rate Archives: Representative rates for selected currencies (valid on 2 Jan. 2014), except for Lao PDR and Viet Nam which were converted using the official rates reported, respectively, by the Bank of Lao PDR and the State Bank of Viet Nam.
0
50
100
150
200
250
300
$78
$244
$120
$237
$74$90
$128
$199
$273 $275
$100
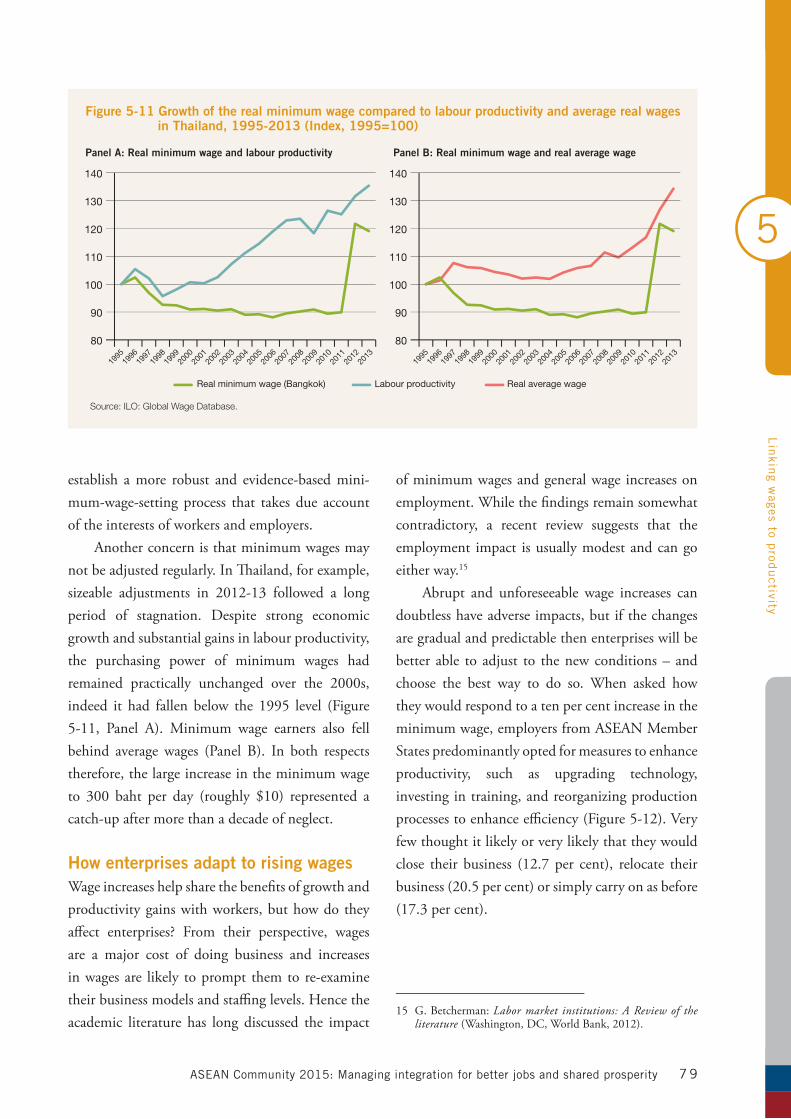
5
Lin
king w
ages to prod
uctivity
ASEAN Community 2015: Managing integration for better jobs and shared prosperity 7 9
establish a more robust and evidence-based mini-mum-wage-setting process that takes due account of the interests of workers and employers.
Another concern is that minimum wages may not be adjusted regularly. In Thailand, for example, sizeable adjustments in 2012-13 followed a longperiod of stagnation. Despite strong economic growth and substantial gains in labour productivity, the purchasing power of minimum wages had remained practically unchanged over the 2000s, indeed it had fallen below the 1995 level (Figure5-11, Panel A). Minimum wage earners also fell behind average wages (Panel B). In both respects therefore, the large increase in the minimum wage to 300 baht per day (roughly $10) represented acatch-up after more than a decade of neglect.
How enterprises adapt to rising wages Wage increases help share the benefits of growth and productivity gains with workers, but how do they affect enterprises? From their perspective, wages are a major cost of doing business and increases in wages are likely to prompt them to re-examine their business models and staffing levels. Hence the academic literature has long discussed the impact
of minimum wages and general wage increases on employment. While the findings remain somewhat contradictory, a recent review suggests that the employment impact is usually modest and can go either way.15
Abrupt and unforeseeable wage increases can doubtless have adverse impacts, but if the changes are gradual and predictable then enterprises will be better able to adjust to the new conditions – and choose the best way to do so. When asked how they would respond to a ten per cent increase in the minimum wage, employers from ASEAN Member States predominantly opted for measures to enhance productivity, such as upgrading technology, investing in training, and reorganizing production processes to enhance efficiency (Figure 5-12). Very few thought it likely or very likely that they would close their business (12.7 per cent), relocate their business (20.5 per cent) or simply carry on as before (17.3percent).
15 G.Betcherman:Labor market institutions: A Review of the literature (Washington, DC, World Bank, 2012).
Figure 5-11 Growth of the real minimum wage compared to labour productivity and average real wages in Thailand, 1995-2013 (Index, 1995=100)
Source: ILO: Global Wage Database.
Panel A: Real minimum wage and labour productivity Panel B: Real minimum wage and real average wage
80
90
100
110
120
130
140
2013
2012
2011
2010
2009
2008
2007
2006
2005
2004
2003
2002
2001
2000
1999
1998
1997
1996
1995
80
90
100
110
120
130
140
2013
2012
2011
2010
2009
2008
2007
2006
2005
2004
2003
2002
2001
2000
1999
1998
1997
1996
1995
Real minimum wage (Bangkok) Labour productivity Real average wage
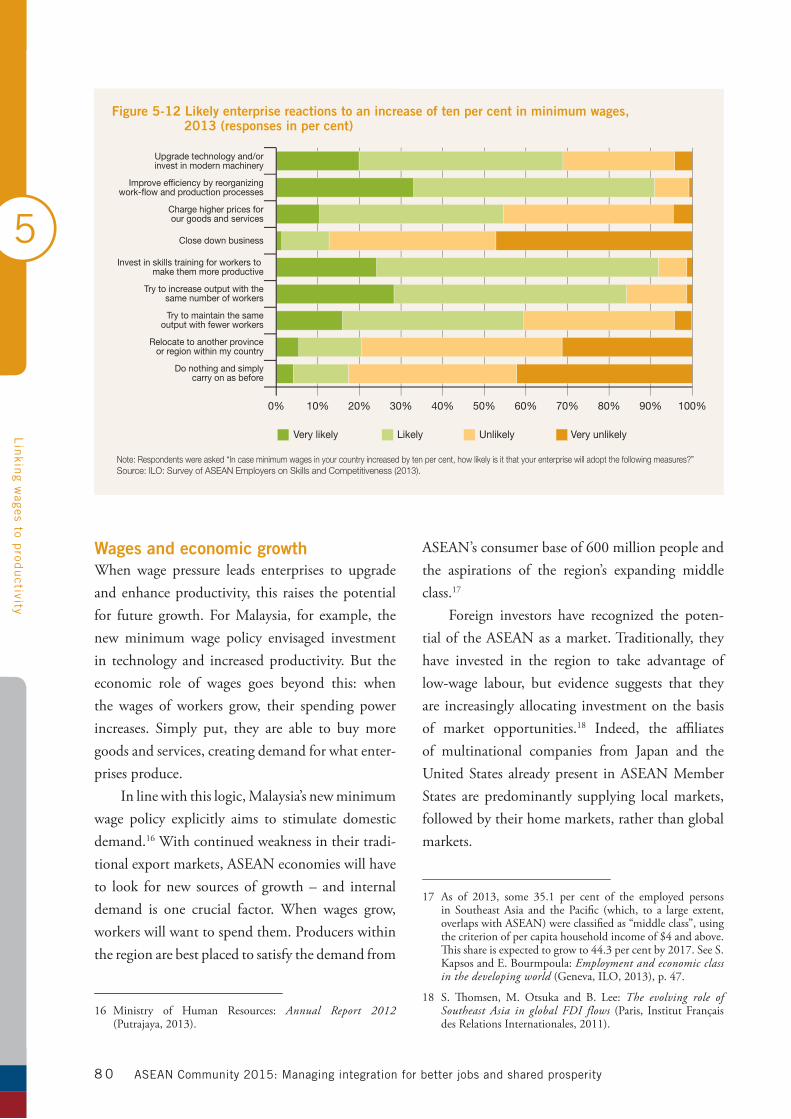
5
Lin
king w
ages to prod
uctivity
ASEAN Community 2015: Managing integration for better jobs and shared prosperity8 0
When wage pressure leads enterprises to upgrade and enhance productivity, this raises the potential for future growth. For Malaysia, for example, the new minimum wage policy envisaged investment in technology and increased productivity. But the economic role of wages goes beyond this: whenthe wages of workers grow, their spending power increases. Simply put, they are able to buy more goods and services, creating demand for what enter-prises produce.
In line with this logic, Malaysia’s new minimum wage policy explicitly aims to stimulate domestic demand.16 With continued weakness in their tradi-tional export markets, ASEAN economies will have to look for new sources of growth – and internal demand is one crucial factor. When wages grow, workers will want to spend them. Producers within the region are best placed to satisfy the demand from
16 Ministry of Human Resources: Annual Report 2012 (Putrajaya,2013).
ASEAN’s consumer base of 600 million people and the aspirations of the region’s expanding middle class.17
Foreign investors have recognized the poten-tial of the ASEAN as a market. Traditionally, they have invested in the region to take advantage of low-wage labour, but evidence suggests that they are increasingly allocating investment on the basis of market opportunities.18 Indeed, the affiliates of multinational companies from Japan and the United States already present in ASEAN Member States are predominantly supplying local markets, followed by their home markets, rather than global markets.
17 As of 2013, some 35.1 per cent of the employed personsin Southeast Asia and the Pacific (which, to a large extent, overlaps with ASEAN) were classified as “middle class”, using thecriterionofpercapitahouseholdincomeof$4andabove.Thisshareisexpectedtogrowto44.3percentby2017.SeeS.KapsosandE.Bourmpoula:Employment and economic class in the developing world(Geneva,ILO,2013),p.47.
18 S. Thomsen, M. Otsuka and B. Lee: The evolving role of Southeast Asia in global FDI flows (Paris, Institut Français des Relations Internationales, 2011).
Figure 5-12 Likely enterprise reactions to an increase of ten per cent in minimum wages, 2013 (responses in per cent)
Note: Respondents were asked “In case minimum wages in your country increased by ten per cent, how likely is it that your enterprise will adopt the following measures?”Source: ILO: Survey of ASEAN Employers on Skills and Competitiveness (2013).
Very likely Likely Unlikely Very unlikely
Do nothing and simplycarry on as before
Relocate to another provinceor region within my country
Try to maintain the sameoutput with fewer workers
Try to increase output with thesame number of workers
Invest in skills training for workers to make them more productive
Close down business
Charge higher prices forour goods and services
Improve efficiency by reorganizingwork-flow and production processes
Upgrade technology and/orinvest in modern machinery
0% 10% 20% 30% 40% 50% 60% 70% 80% 90% 100%
Wages and economic growth
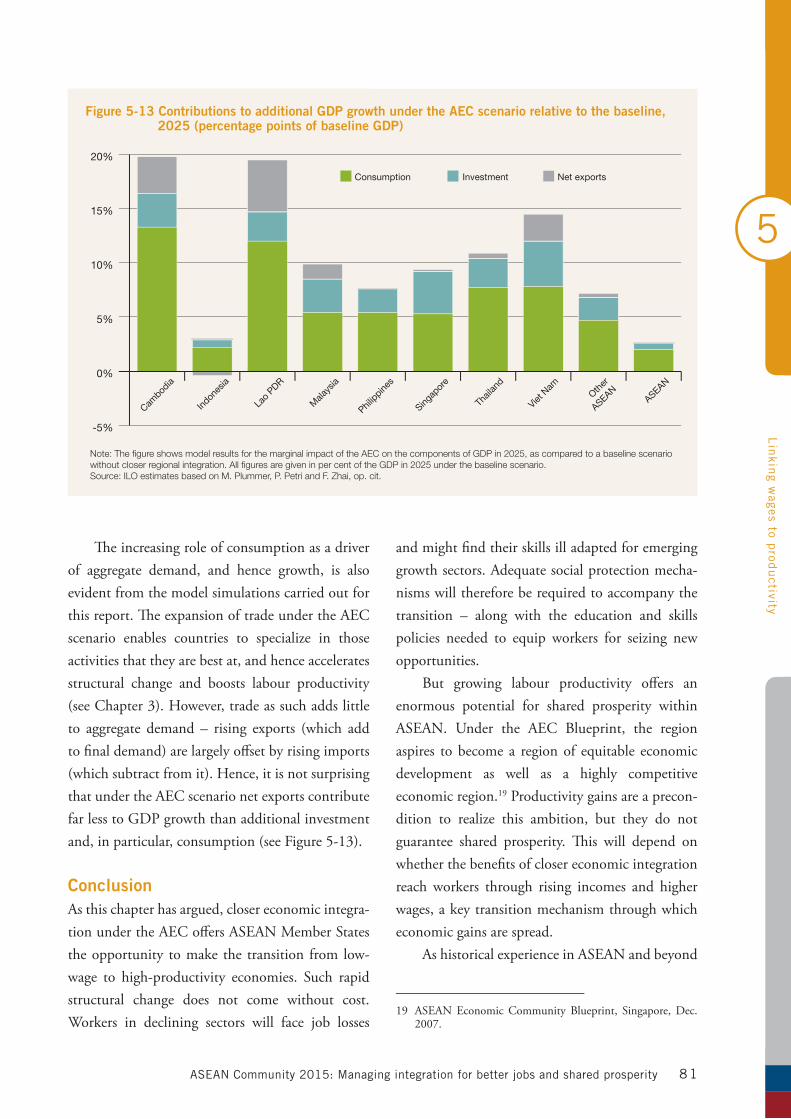
5
Lin
king w
ages to prod
uctivity
ASEAN Community 2015: Managing integration for better jobs and shared prosperity 81
The increasing role of consumption as a driver of aggregate demand, and hence growth, is also evident from the model simulations carried out for this report. The expansion of trade under the AEC scenario enables countries to specialize in those activities that they are best at, and hence accelerates structural change and boosts labour productivity (seeChapter3).However,tradeassuchaddslittleto aggregate demand – rising exports (which add to final demand) are largely offset by rising imports (which subtract from it). Hence, it is not surprising that under the AEC scenario net exports contribute far less to GDP growth than additional investment and,inparticular,consumption(seeFigure5-13).
ConclusionAs this chapter has argued, closer economic integra-tion under the AEC offers ASEAN Member States the opportunity to make the transition from low-wage to high-productivity economies. Such rapid structural change does not come without cost. Workers in declining sectors will face job losses
and might find their skills ill adapted for emerging growth sectors. Adequate social protection mecha-nisms will therefore be required to accompany the transition – along with the education and skills policies needed to equip workers for seizing new opportunities.
But growing labour productivity offers an enormous potential for shared prosperity within ASEAN. Under the AEC Blueprint, the region aspires to become a region of equitable economic development as well as a highly competitive economic region.19 Productivity gains are a precon-dition to realize this ambition, but they do not guarantee shared prosperity. This will depend on whether the benefits of closer economic integration reach workers through rising incomes and higher wages, a key transition mechanism through which economic gains are spread.
As historical experience in ASEAN and beyond
19 ASEAN Economic Community Blueprint, Singapore, Dec. 2007.
Figure 5-13 Contributions to additional GDP growth under the AEC scenario relative to the baseline, 2025 (percentage points of baseline GDP)
Consumption Investment Net exports
Note: The figure shows model results for the marginal impact of the AEC on the components of GDP in 2025, as compared to a baseline scenario without closer regional integration. All figures are given in per cent of the GDP in 2025 under the baseline scenario.Source: ILO estimates based on M. Plummer, P. Petri and F. Zhai, op. cit.
-5%
0%
5%
10%
15%
20%
ASEANOth
er
ASEAN
Viet N
am
Thail
and
Singap
ore
Philippine
s
Mala
ysia
Lao
PDR
Indon
esia
Cambod
ia
5
Lin
king w
ages to prod
uctivity
ASEAN Community 2015: Managing integration for better jobs and shared prosperity8 2
has shown, where strong institutions are missing, wage growth often falls short of its potential. In addition, there is the risk of economic integration exacerbating the trends towards rising inequality. As enterprises expect to compete more fiercely for scarce talent, high-skilled workers are positioned best to benefit from rising wages – and low-skilled workers risk being left behind.
It is therefore essential that ASEAN Member States put in place sound wage-setting institutions. Well-designed and properly enforced, statutory minimum wages can help counter rising inequality and ensure that low-paid workers receive a just share of the fruits of progress. But in setting wages of skilled workers, governments should exercise restraint and should instead facilitate collective bargaining between those concerned – employers and workers.
While enterprises will have to adapt to rising wages by investing heavily into technology and skills training, they will also benefit from the increased demand that comes with rising purchasing power. Foreign investors are already positioning themselves to take advantage of ASEAN’s consumer base of 600 million people. Workers in ASEAN can also seek opportunities to capitalize on their skills by migrating to other countries in the region. Intra-regional labour migration is the subject of the next chapter.
6
Reap
ing th
e ben
efits of labou
r mob
ility
ASEAN Community 2015: Managing integration for better jobs and shared prosperity 8 3
The ASEAN region has seen a rapid increase in migration – particularly among the Member States. Labour migration is affected by two groups of factors. One comprises differences between countries in their levels of economic and social development, and political stability. The second is connected to labour force growth and population ageing that affect the supply and demand of labour, producing additional challenges and opportunities.
Insofar as these factors are structural, not cyclical, labour migration will not diminish in the medium term and will probably continue to rise. The ASEAN region can look ahead by developing robust institutions to support labour mobility. This includes pathways for migration that are safer, more transparent and cheaper; adequate social protection to enable migrant workers to have a decent life and opportunities to upgrade their skills; and improve-ments to labour market information systems that can produce reliable and detailed data to better enumerate, profile and understand migrant stocks and flows. Developing such institutions under a long-term regional approach would benefit
destination and source countries in ASEAN alike as well as – and most crucially – current and future migrant workers themselves.
The rise of intra-ASEAN migrationSince1990,thestockofintra-ASEANmigrantshasrisen substantially. As an absolute number, intra-ASEAN migrants increased from 1.5 million to 6.5 million between 1990 and 2013.1 Over the same period, their share of ASEAN’s total migrant stock climbedfrom47.8percentto68.6percent(Figure6-1, Panel A). A corresponding rise is also observed among ASEAN nationals living abroad – for whom theintra-ASEANsharerosefrom20.3to34.6percent over the same period (Figure 6-1, Panel B).
In the key destination countries in ASEAN more than half of the migrant stock comes from other ASEAN Member States – for Singapore 52.9percent; forMalaysia61.2percent;and for
1 UN: Trends in International Migrant Stock: The 2013Revision Database. Several issues with these data and other harmonized sources attempting to provide an aggregate for the ASEAN region as a whole are discussed in Annex D.
ASEAN has become a centre for labour migration, with major countries of origin
and destination. While the ASEAN Economic Community envisages measures to
facilitate the mobility of high-skilled workers, most of the region’s migrant workers
are low skilled and many are undocumented. If ASEAN Member States are to reap
the benefits of labour mobility they will need to manage all types of migration more
effectively and provide sufficient protection for all migrant workers.
Reaping the benefits of labour mobility
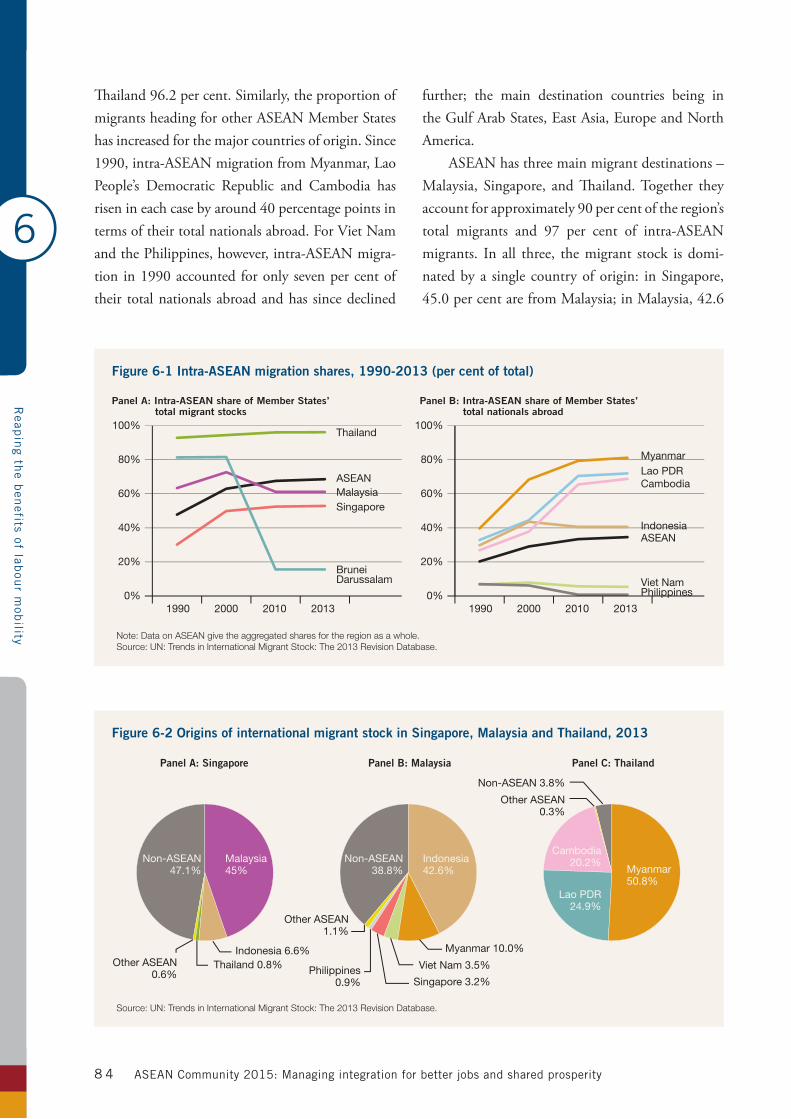
6
Reap
ing th
e ben
efits of labou
r mob
ility
ASEAN Community 2015: Managing integration for better jobs and shared prosperity8 4
Thailand96.2percent.Similarly,theproportionofmigrants heading for other ASEAN Member States has increased for the major countries of origin. Since 1990,intra-ASEANmigrationfromMyanmar,LaoPeople’s Democratic Republic and Cambodia has risenineachcasebyaround40percentagepointsinterms of their total nationals abroad. For Viet Nam and the Philippines, however, intra-ASEAN migra-tion in1990accountedforonlysevenpercentoftheir total nationals abroad and has since declined
further; the main destination countries being in the Gulf Arab States, East Asia, Europe and North America.
ASEAN has three main migrant destinations – Malaysia, Singapore, and Thailand. Together they accountforapproximately90percentoftheregion’stotal migrants and 97 per cent of intra-ASEANmigrants. In all three, the migrant stock is domi-natedbya singlecountryoforigin: inSingapore,45.0percentarefromMalaysia;inMalaysia,42.6
Figure 6-1 Intra-ASEAN migration shares, 1990-2013 (per cent of total)
Note: Data on ASEAN give the aggregated shares for the region as a whole.Source: UN: Trends in International Migrant Stock: The 2013 Revision Database.
Panel A: Intra-ASEAN share of Member States’ total migrant stocks
Panel B: Intra-ASEAN share of Member States’ total nationals abroad
ASEAN
ASEAN
Viet Nam
Thailand
Singapore
Philippines
Myanmar
Malaysia
Lao PDR
Indonesia
Cambodia
Brunei Darussalam
2013201020001990 20132010200019900%
20%
40%
60%
80%
100%
0%
20%
40%
60%
80%
100%
Figure 6-2 Origins of international migrant stock in Singapore, Malaysia and Thailand, 2013
Source: UN: Trends in International Migrant Stock: The 2013 Revision Database.
Panel A: Singapore Panel B: Malaysia Panel C: Thailand
Malaysia45%
Non-ASEAN47.1%
Other ASEAN0.6%
Non-ASEAN38.8%
Non-ASEAN 3.8%
Lao PDR24.9%
Cambodia20.2%
Other ASEAN1.1%
Other ASEAN0.3%
Philippines0.9% Singapore 3.2%
Viet Nam 3.5%
Myanmar 10.0%
Myanmar50.8%
Indonesia42.6%
Thailand 0.8%Indonesia 6.6%
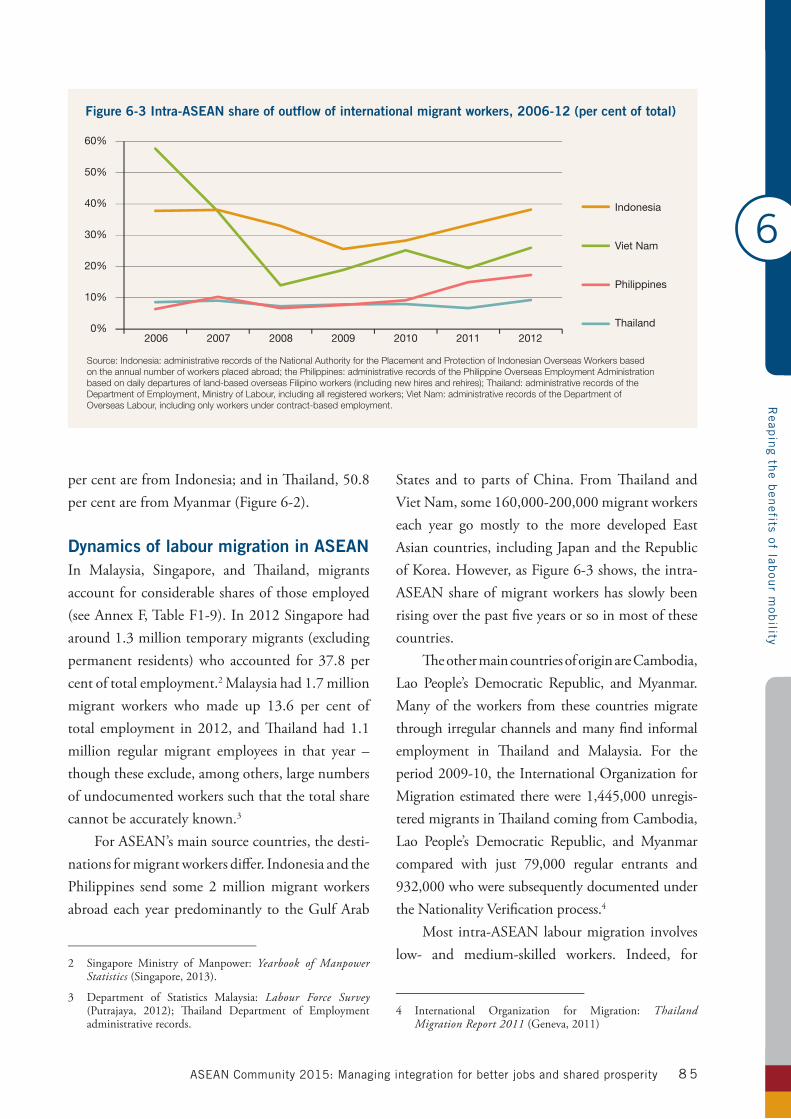
6
Reap
ing th
e ben
efits of labou
r mob
ility
ASEAN Community 2015: Managing integration for better jobs and shared prosperity 8 5
per cent are from Indonesia; and in Thailand, 50.8 per cent are from Myanmar (Figure 6-2).
Dynamics of labour migration in ASEANIn Malaysia, Singapore, and Thailand, migrants account for considerable shares of those employed (seeAnnexF,TableF1-9).In2012Singaporehadaround1.3milliontemporarymigrants(excludingpermanent residents)whoaccounted for37.8percent of total employment.2 Malaysia had 1.7 million migrant workers who made up 13.6 per cent oftotal employment in 2012, and Thailand had 1.1 million regular migrant employees in that year – though these exclude, among others, large numbers of undocumented workers such that the total share cannot be accurately known.3
For ASEAN’s main source countries, the desti-nations for migrant workers differ. Indonesia and the Philippines send some 2 million migrant workers abroad each year predominantly to the Gulf Arab
2 Singapore Ministry of Manpower: Yearbook of Manpower Statistics(Singapore,2013).
3 Department of Statistics Malaysia: Labour Force Survey (Putrajaya, 2012); Thailand Department of Employment administrative records.
States and to parts of China. From Thailand and Viet Nam, some 160,000-200,000 migrant workers each year go mostly to the more developed East Asian countries, including Japan and the Republic ofKorea.However,asFigure6-3shows,theintra-ASEAN share of migrant workers has slowly been rising over the past five years or so in most of these countries.
The other main countries of origin are Cambodia, Lao People’s Democratic Republic, and Myanmar. Many of the workers from these countries migrate through irregular channels and many find informal employment in Thailand and Malaysia. For the period2009-10,theInternationalOrganizationforMigrationestimated therewere1,445,000unregis-tered migrants in Thailand coming from Cambodia, Lao People’s Democratic Republic, and Myanmar compared with just 79,000 regular entrants and932,000whoweresubsequentlydocumentedunderthe Nationality Verification process.4
Most intra-ASEAN labour migration involves low- and medium-skilled workers. Indeed, for
4 International Organization for Migration: Thailand Migration Report 2011 (Geneva, 2011)
Figure 6-3 Intra-ASEAN share of outflow of international migrant workers, 2006-12 (per cent of total)
2012
Indonesia
Viet Nam
Philippines
Thailand201120102009200820072006
0%
10%
20%
30%
40%
50%
60%
Source: Indonesia: administrative records of the National Authority for the Placement and Protection of Indonesian Overseas Workers based on the annual number of workers placed abroad; the Philippines: administrative records of the Philippine Overseas Employment Administration based on daily departures of land-based overseas Filipino workers (including new hires and rehires); Thailand: administrative records of the Department of Employment, Ministry of Labour, including all registered workers; Viet Nam: administrative records of the Department of Overseas Labour, including only workers under contract-based employment.
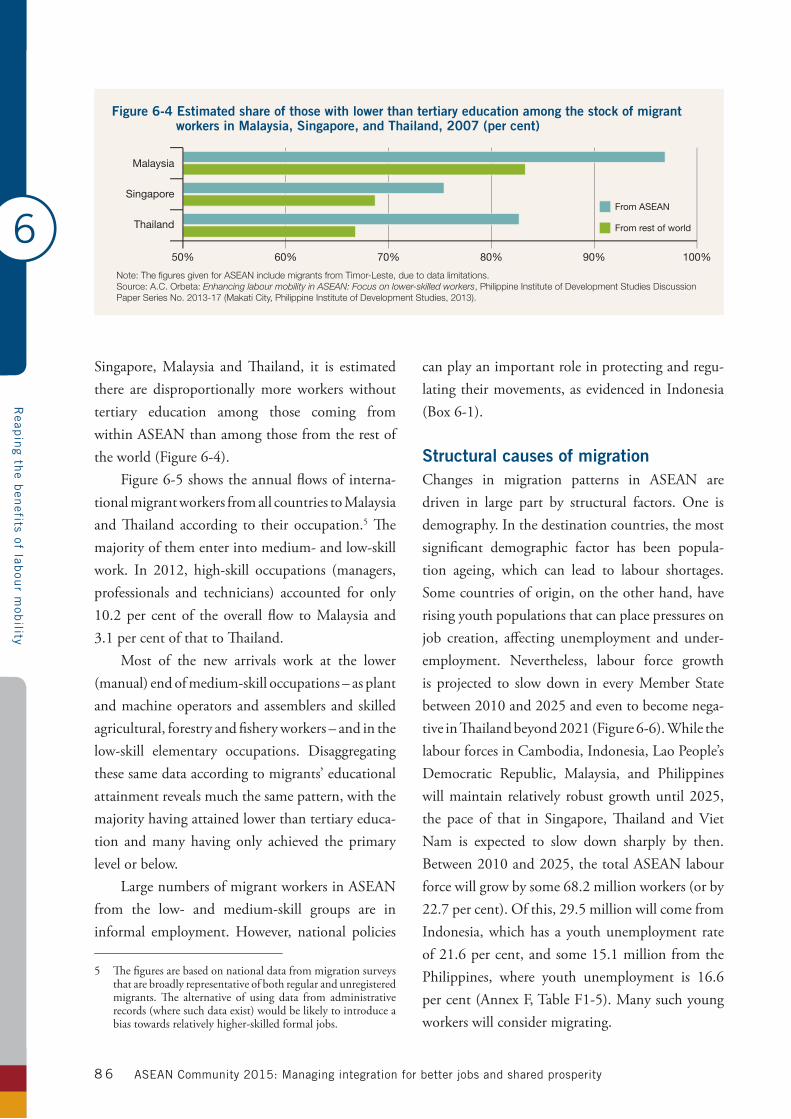
6
Reap
ing th
e ben
efits of labou
r mob
ility
ASEAN Community 2015: Managing integration for better jobs and shared prosperity8 6
Singapore, Malaysia and Thailand, it is estimated there are disproportionally more workers without tertiary education among those coming from within ASEAN than among those from the rest of theworld(Figure6-4).
Figure 6-5 shows the annual flows of interna-tional migrant workers from all countries to Malaysia and Thailand according to their occupation.5 The majority of them enter into medium- and low-skill work. In 2012, high-skill occupations (managers, professionals and technicians) accounted for only 10.2 per cent of the overall flow to Malaysia and 3.1percentofthattoThailand.
Most of the new arrivals work at the lower (manual) end of medium-skill occupations – as plant and machine operators and assemblers and skilled agricultural, forestry and fishery workers – and in the low-skill elementary occupations. Disaggregating these same data according to migrants’ educational attainment reveals much the same pattern, with the majority having attained lower than tertiary educa-tion and many having only achieved the primary level or below.
Large numbers of migrant workers in ASEAN from the low- and medium-skill groups are in informal employment. However, national policies
5 The figures are based on national data from migration surveys that are broadly representative of both regular and unregistered migrants. The alternative of using data from administrative records (where such data exist) would be likely to introduce a bias towards relatively higher-skilled formal jobs.
can play an important role in protecting and regu-lating their movements, as evidenced in Indonesia (Box 6-1).
Structural causes of migrationChanges in migration patterns in ASEAN are driven in large part by structural factors. One is demography. In the destination countries, the most significant demographic factor has been popula-tion ageing, which can lead to labour shortages. Some countries of origin, on the other hand, have rising youth populations that can place pressures on job creation, affecting unemployment and under-employment. Nevertheless, labour force growth is projected to slow down in every Member State between 2010 and 2025 and even to become nega-tive in Thailand beyond 2021 (Figure 6-6). While the labour forces in Cambodia, Indonesia, Lao People’s Democratic Republic, Malaysia, and Philippines will maintain relatively robust growth until 2025, the pace of that in Singapore, Thailand and Viet Nam is expected to slow down sharply by then. Between 2010 and 2025, the total ASEAN labour force will grow by some 68.2 million workers (or by 22.7percent).Ofthis,29.5millionwillcomefromIndonesia, which has a youth unemployment rate of 21.6 per cent, and some 15.1 million from the Philippines, where youth unemployment is 16.6 per cent (Annex F, Table F1-5). Many such young workers will consider migrating.
Figure 6-4 Estimated share of those with lower than tertiary education among the stock of migrant workers in Malaysia, Singapore, and Thailand, 2007 (per cent)
Note: The figures given for ASEAN include migrants from Timor-Leste, due to data limitations.Source: A.C. Orbeta: Enhancing labour mobility in ASEAN: Focus on lower-skilled workers, Philippine Institute of Development Studies Discussion Paper Series No. 2013-17 (Makati City, Philippine Institute of Development Studies, 2013).
50% 60% 70% 80% 90% 100%
Malaysia
Singapore
Thailand
From ASEAN
From rest of world
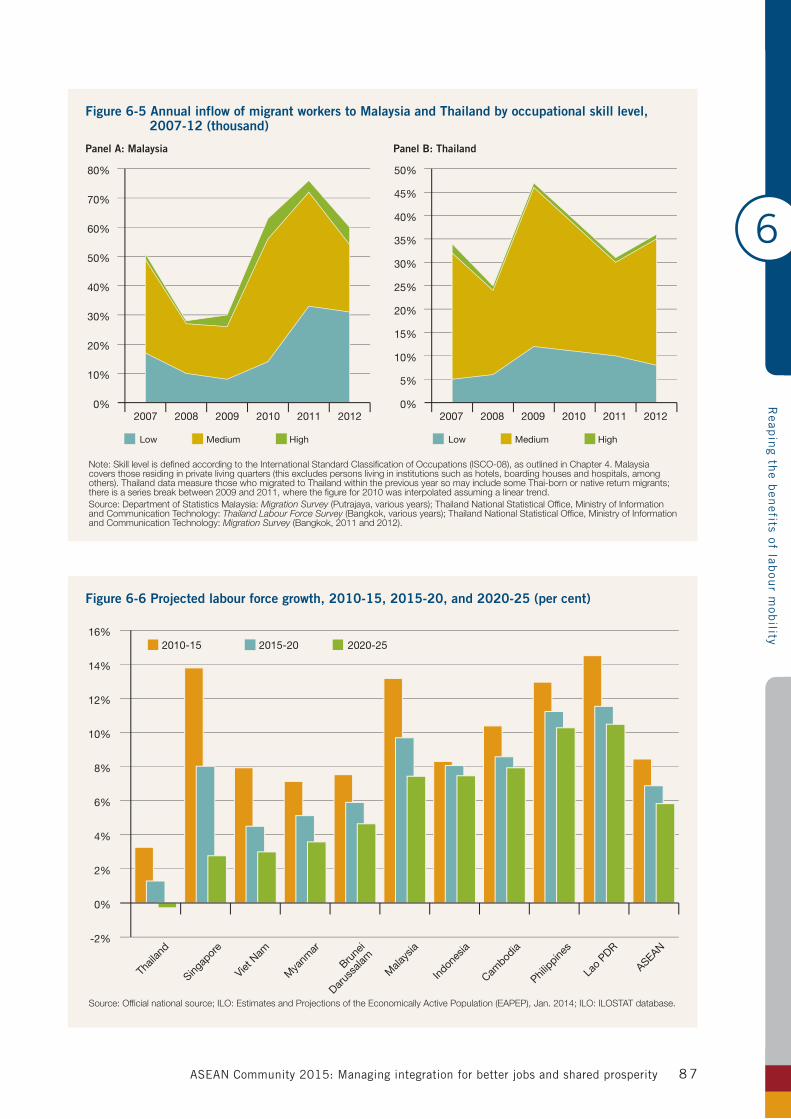
6
Reap
ing th
e ben
efits of labou
r mob
ility
ASEAN Community 2015: Managing integration for better jobs and shared prosperity 8 7
Figure 6-5 Annual inflow of migrant workers to Malaysia and Thailand by occupational skill level, 2007-12 (thousand)
Panel A: Malaysia Panel B: Thailand
201220112010200920082007 2012201120102009200820070%
10%
20%
30%
40%
50%
60%
70%
80%
0%
5%
10%
15%
20%
25%
30%
35%
40%
45%
50%
Note: Skill level is defined according to the International Standard Classification of Occupations (ISCO-08), as outlined in Chapter 4. Malaysia covers those residing in private living quarters (this excludes persons living in institutions such as hotels, boarding houses and hospitals, among others). Thailand data measure those who migrated to Thailand within the previous year so may include some Thai-born or native return migrants; there is a series break between 2009 and 2011, where the figure for 2010 was interpolated assuming a linear trend.Source: Department of Statistics Malaysia: Migration Survey (Putrajaya, various years); Thailand National Statistical Office, Ministry of Information and Communication Technology: Thailand Labour Force Survey (Bangkok, various years); Thailand National Statistical Office, Ministry of Information and Communication Technology: Migration Survey (Bangkok, 2011 and 2012).
Low Medium High Low Medium High
Figure 6-6 Projected labour force growth, 2010-15, 2015-20, and 2020-25 (per cent)
2010-15 2015-20 2020-25
-2%
0%
2%
4%
6%
8%
10%
12%
14%
16%
Source: Official national source; ILO: Estimates and Projections of the Economically Active Population (EAPEP), Jan. 2014; ILO: ILOSTAT database.
ASEAN
Lao
PDR
Philippine
s
Cambod
ia
Indon
esia
Mala
ysia
Brune
i
Darus
salam
Mya
nmar
Viet N
am
Singap
ore
Thail
and
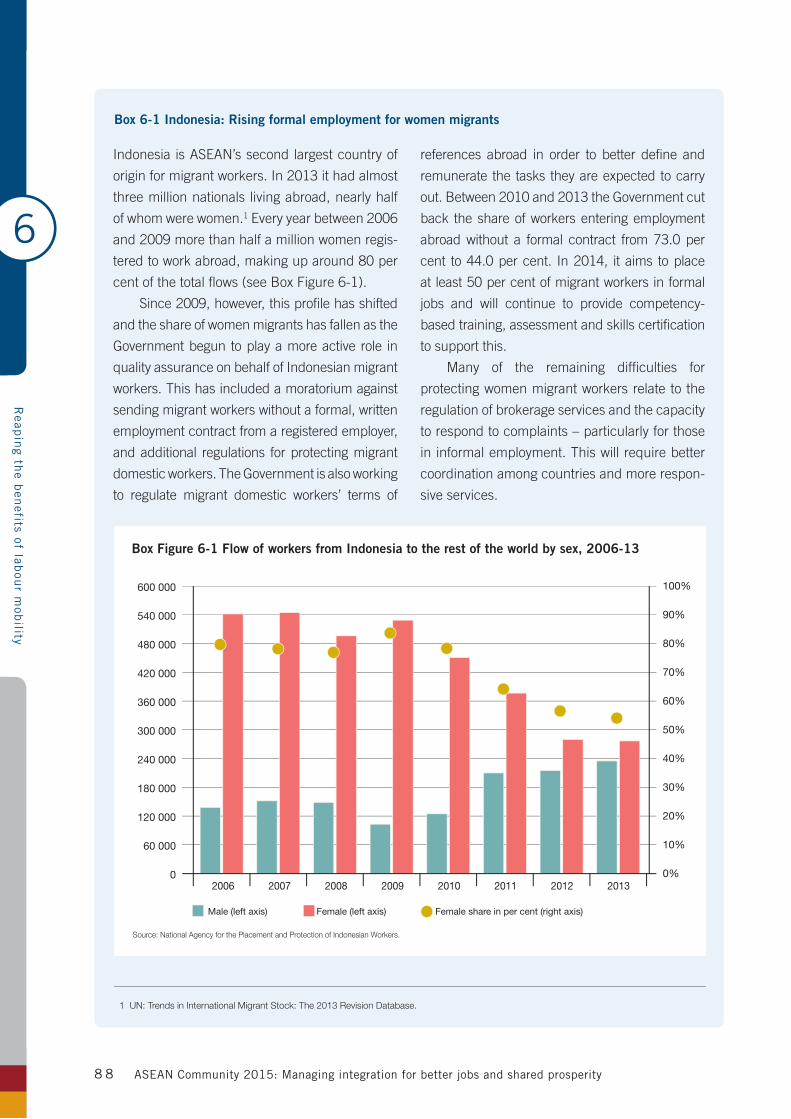
6
Reap
ing th
e ben
efits of labou
r mob
ility
ASEAN Community 2015: Managing integration for better jobs and shared prosperity8 8
Indonesia is ASEAN’s second largest country of
origin for migrant workers. In 2013 it had almost
three million nationals living abroad, nearly half
of whom were women.1 Every year between 2006
and 2009 more than half a million women regis-
tered to work abroad, making up around 80 per
cent of the total flows (see Box Figure 6-1).
Since 2009, however, this profile has shifted
and the share of women migrants has fallen as the
Government begun to play a more active role in
quality assurance on behalf of Indonesian migrant
workers. This has included a moratorium against
sending migrant workers without a formal, written
employment contract from a registered employer,
and additional regulations for protecting migrant
domestic workers. The Government is also working
to regulate migrant domestic workers’ terms of
references abroad in order to better define and
remunerate the tasks they are expected to carry
out. Between 2010 and 2013 the Government cut
back the share of workers entering employment
abroad without a formal contract from 73.0 per
cent to 44.0 per cent. In 2014, it aims to place
at least 50 per cent of migrant workers in formal
jobs and will continue to provide competency-
based training, assessment and skills certification
to support this.
Many of the remaining difficulties for
protecting women migrant workers relate to the
regulation of brokerage services and the capacity
to respond to complaints – particularly for those
in informal employment. This will require better
coordination among countries and more respon-
sive services.
Box 6-1 Indonesia: Rising formal employment for women migrants
1 UN: Trends in International Migrant Stock: The 2013 Revision Database.
20132012201120102009200820072006
Box Figure 6-1 Flow of workers from Indonesia to the rest of the world by sex, 2006-13
Source: National Agency for the Placement and Protection of Indonesian Workers.
0
60 000
120 000
180 000
240 000
300 000
360 000
420 000
480 000
540 000
600 000
0%
10%
20%
30%
40%
50%
60%
70%
80%
90%
100%
Male (left axis) Female (left axis) Female share in per cent (right axis)
6
Reap
ing th
e ben
efits of labou
r mob
ility
ASEAN Community 2015: Managing integration for better jobs and shared prosperity 8 9
As a demographic dividend continues in some of these countries in the medium term, a strong focus on education coupled with outward migration (driven by foreign demand) may provide a viable route for lowering unemployment and setting up foundations for future growth. Benefits would also come to such countries from personal remittances received, and when migrants return home with new ideas, skills and professional networks – representing a “brain gain via a brain drain”.6 Meanwhile, those countries whose demographic dividend has already expired may want to welcome and encourage inter-national migrants into particular sectors in order to sustain their current levels of output.
Other structural factors behind changing migration patterns are economic – notably the large differences in output and wages between Member States. The GDP per capita for ASEAN as a whole is$5,313in2013(inconstant2005prices,PPP),though individual country levels range from only $1,611 in Myanmar to as high as $54,139 inSingapore(AnnexF,TableF2-3).Thecontrastsaresignificant for average monthly wages, and the avail-abledatashowtheyrangefrom$119inLaoPeople’sDemocraticRepublic to$3,547 inSingapore (seeChapter 5, Figure 5-2). Average wages in Thailand are around three times those in Cambodia, while those in Malaysia are around three and a half times those in Indonesia.
Free mobility of professionalsPolicies for managing migration flows under the AEC are confined to high-skilled workers. While this is the case more often than not among regional integration initiatives, the AEC can still learn from labour mobility policies and models developed in other parts of the world (Box 6-2).
The free movement of skilled professionals under the AEC is partly driven by the requirements
6 T. Boeri, P. Garibaldi and E.R.Moen: The labour market consequences of adverse financial shocks, in IZA Discussion Papers No. 6826 (Heidelberg, 2012).
of the 1995 ASEAN Framework Agreement onServices, which includes provisions for the move-ment of natural persons. While this can in principle include any form of labour mobility, the current provisions mainly refer to business visitors for sales negotiations, natural persons on a temporary basis, and intra-company transfers of executives, managers and other high-skilled professionals accompanying FDI. Progress on labour mobility through the ASEAN Framework Agreement on Services has, however, been fairly slow.7
The main tools for achieving labour mobility under the AEC are likely to be the mutual recog-nition arrangements (MRAs). These establish the skills or experience relevant professionals need to gain certification in another country and ultimately to work abroad. In support of the MRAs, ASEAN is developing the ASEAN Qualifications Reference Framework (AQRF) that will enable qualifications to be compared across Member States while providing a coherent benchmark for current national qualifica-tions frameworks. The AQRF and its implementation strategyareduetobefinalizedin2014.
To date, MRAs have been completed for eight occupations: engineering services (signedin December 2005); nursing services (December 2006); architectural services, and surveying quali-fications (November 2007); medical practitioners, dental practitioners, and accountancy serv-ices (February 2009); and tourism professionals(November 2012). Nevertheless, the MRAs differ in the approaches they employ. The MRA on nursing, for example, explicitly promotes the exchange of expertise, experience, and best practices while those on accountancy and surveying only lay down some broad principles and frameworks for negotiating agreements. Perhaps surprisingly – given their overall aim of facilitating regional labour mobility
7 D. Nilomborirak and S. Jitdumrong: “An assessment ofservicessectorliberalizationinASEAN”,inS.BasuDas(ed.):ASEAN Economic Community Scorecard: Performance and perception(Singapore,ISEAS,2013),p.47.
6
Reap
ing th
e ben
efits of labou
r mob
ility
ASEAN Community 2015: Managing integration for better jobs and shared prosperity9 0
Box 6-2 Labour mobility under other regional integration agreements
Several regional integration agreements have
assigned different provisions to promote or stem
labour mobility of various kinds. Some examples
are provided below as comparators to the current
provisions provided under the AEC.
CARICOM – The 2006 Caribbean
Community’s Single Market and Economy
among 15 Caribbean nations and dependencies
includes the free movement of goods, services,
capital, business enterprise and certified skilled
workers in six categories: graduates of approved
universities, musicians, artists, sportspeople,
workers in media and domestic workers (added
in 2010). The agreement includes provisions on
a Regional Qualification Framework, leading to
a CARICOM Skills Recognition Certificate, the
transferability of social security for wage workers
and a register of self-employed providers of
in-demand services as well as a regional social
security agreement.
ECOWAS – The Economic Community of
West African States’ 2010 Common Market
Protocol (Article 10) includes a Protocol on the
Free Movement of Persons. On 7 December
2012, ECOWAS adopted the General Convention
on Social Security and reached a new milestone
in the implementation of regional free movement
protocols. It also adopted two action plans – one
promoting youth employment and the other
against child labour – as well as a draft supple-
mentary act to create a three-party, regional
ECOWAS Social Dialogue Forum.
European Union – The free movement
of goods, capital, workers and services were
founding principles of the European Economic
Community in 1957, including (even then) the free
movement of employees and job-seekers among
its original six Member States (Treaty of Rome,
Articles 48-51). Today, the European Union has
28 Member States whose citizens are entitled
to equal treatment in access to employment,
working conditions and all other social and tax
advantages.1 Those working abroad for up to five
consecutive years are also automatically entitled
to permanent residency. The European Union
works towards harmonization of labour regu-
lations and policies, allowing “Member States
considerable leeway in the social policy sphere,
while aiming to prevent what are perceived to be
some of the more deleterious effects of a ‘race to
the bottom’”.2
Mercosur – In 1991, Argentina, Brazil,
Paraguay, and Uruguay - later joined by
Venezuela - created the Mercosur, which aims
to achieve free trade in goods and services and
the free movement of factors of production. The
Mercosur Social and Labour Declaration, 1998,
guarantees the fundamental rights of all workers
in the region, including migrant workers. The
2002 Free Movement and Residence for State
Party Nationals grants nationals of the signatory
countries the right to reside and work in Mercosur
Member States as well as Bolivia and Chile.
NAFTA – Established in 1994, the North
American Free Trade Agreement aims to liber-
alize trade and investment between the United
States and its two main trading partners – Canada
and Mexico. It facilitates labour mobility through
temporary entry for business visitors, traders,
investors, transferees of multinational compa-
nies, and highly-educated professionals with
a job offer in one of over 70 occupations. This
latter group is able to migrate using the bespoke
Trade-NAFTA visa that is valid for up to three
years based on mutual recognition of skills and
qualifications.
SADC – The Southern African Development
Community is comprised of 15 countries which
aim to promote, among other activities, regional
cooperation through worker and student mobility,
with a focus on achieving migration manage-
ment through the harmonization of economic,
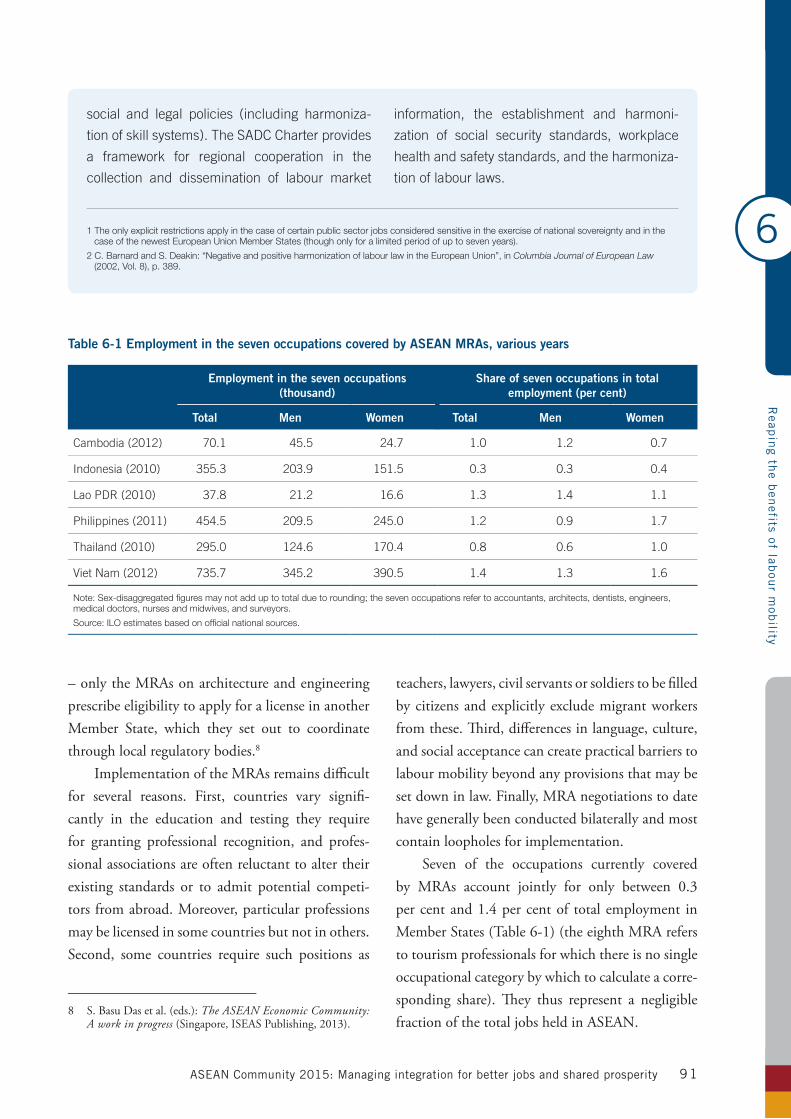
6
Reap
ing th
e ben
efits of labou
r mob
ility
ASEAN Community 2015: Managing integration for better jobs and shared prosperity 91
– only the MRAs on architecture and engineering prescribe eligibility to apply for a license in another Member State, which they set out to coordinate through local regulatory bodies.8
Implementation of the MRAs remains difficult for several reasons. First, countries vary signifi-cantly in the education and testing they require for granting professional recognition, and profes-sional associations are often reluctant to alter their existing standards or to admit potential competi-tors from abroad. Moreover, particular professions may be licensed in some countries but not in others. Second, some countries require such positions as
8 S.BasuDasetal.(eds.):The ASEAN Economic Community: A work in progress(Singapore,ISEASPublishing,2013).
teachers, lawyers, civil servants or soldiers to be filled by citizens and explicitly exclude migrant workers from these. Third, differences in language, culture, and social acceptance can create practical barriers to labour mobility beyond any provisions that may be set down in law. Finally, MRA negotiations to date have generally been conducted bilaterally and most contain loopholes for implementation.
Seven of the occupations currently covered by MRAs account jointly for only between 0.3percentand1.4percentof totalemployment inMember States (Table 6-1) (the eighth MRA refers to tourism professionals for which there is no single occupational category by which to calculate a corre-sponding share). They thus represent a negligible fraction of the total jobs held in ASEAN.
social and legal policies (including harmoniza-
tion of skill systems). The SADC Charter provides
a framework for regional cooperation in the
collection and dissemination of labour market
information, the establishment and harmoni-
zation of social security standards, workplace
health and safety standards, and the harmoniza-
tion of labour laws.
1 The only explicit restrictions apply in the case of certain public sector jobs considered sensitive in the exercise of national sovereignty and in the case of the newest European Union Member States (though only for a limited period of up to seven years).
2 C. Barnard and S. Deakin: “Negative and positive harmonization of labour law in the European Union”, in Columbia Journal of European Law (2002, Vol. 8), p. 389.
Table 6-1 Employment in the seven occupations covered by ASEAN MRAs, various years
Employment in the seven occupations (thousand)
Share of seven occupations in total employment (per cent)
Total Men Women Total Men Women
Cambodia (2012) 70.1 45.5 24.7 1.0 1.2 0.7
Indonesia (2010) 355.3 203.9 151.5 0.3 0.3 0.4
Lao PDR (2010) 37.8 21.2 16.6 1.3 1.4 1.1
Philippines (2011) 454.5 209.5 245.0 1.2 0.9 1.7
Thailand (2010) 295.0 124.6 170.4 0.8 0.6 1.0
Viet Nam (2012) 735.7 345.2 390.5 1.4 1.3 1.6
Note: Sex-disaggregated figures may not add up to total due to rounding; the seven occupations refer to accountants, architects, dentists, engineers, medical doctors, nurses and midwives, and surveyors.
Source: ILO estimates based on official national sources.
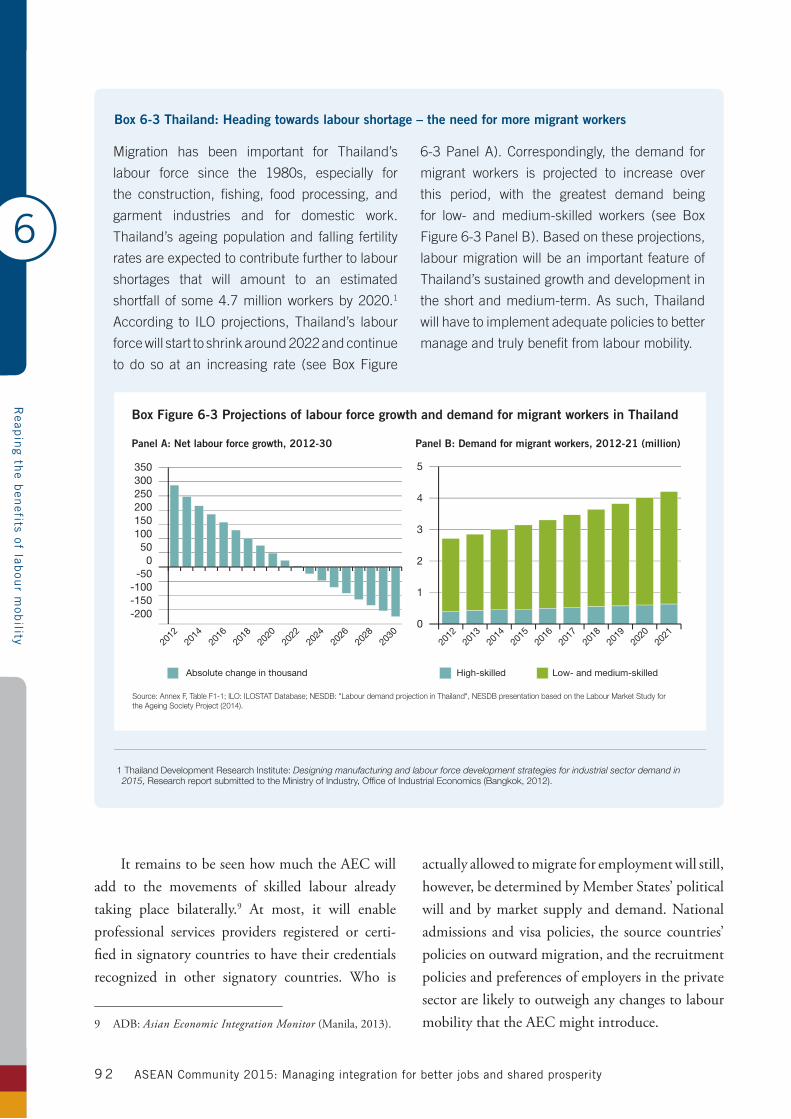
6
Reap
ing th
e ben
efits of labou
r mob
ility
ASEAN Community 2015: Managing integration for better jobs and shared prosperity9 2
It remains to be seen how much the AEC will add to the movements of skilled labour already taking place bilaterally.9 At most, it will enable professional services providers registered or certi-fied in signatory countries to have their credentials recognized in other signatory countries. Who is
9 ADB:Asian Economic Integration Monitor(Manila,2013).
actually allowed to migrate for employment will still, however, be determined by Member States’ political will and by market supply and demand. National admissions and visa policies, the source countries’ policies on outward migration, and the recruitment policies and preferences of employers in the private sector are likely to outweigh any changes to labour mobility that the AEC might introduce.
Box 6-3 Thailand: Heading towards labour shortage – the need for more migrant workers
Migration has been important for Thailand’s
labour force since the 1980s, especially for
the construction, fishing, food processing, and
garment industries and for domestic work.
Thailand’s ageing population and falling fertility
rates are expected to contribute further to labour
shortages that will amount to an estimated
shortfall of some 4.7 million workers by 2020.1
According to ILO projections, Thailand’s labour
force will start to shrink around 2022 and continue
to do so at an increasing rate (see Box Figure
6-3 Panel A). Correspondingly, the demand for
migrant workers is projected to increase over
this period, with the greatest demand being
for low- and medium-skilled workers (see Box
Figure 6-3 Panel B). Based on these projections,
labour migration will be an important feature of
Thailand’s sustained growth and development in
the short and medium-term. As such, Thailand
will have to implement adequate policies to better
manage and truly benefit from labour mobility.
Box Figure 6-3 Projections of labour force growth and demand for migrant workers in Thailand
Panel A: Net labour force growth, 2012-30 Panel B: Demand for migrant workers, 2012-21 (million)
High-skilled Low- and medium-skilled
Source: Annex F, Table F1-1; ILO: ILOSTAT Database; NESDB: "Labour demand projection in Thailand", NESDB presentation based on the Labour Market Study for the Ageing Society Project (2014).
-200-150-100-50
050
100150200250300350
0
1
2
3
4
5
Absolute change in thousand
2030
2028
2026
2024
2022
2020
2018
2016
2014
2012
2021
2020
2019
2018
2017
2016
2015
2014
2013
2012
1 Thailand Development Research Institute: Designing manufacturing and labour force development strategies for industrial sector demand in 2015, Research report submitted to the Ministry of Industry, Office of Industrial Economics (Bangkok, 2012).
6
Reap
ing th
e ben
efits of labou
r mob
ility
ASEAN Community 2015: Managing integration for better jobs and shared prosperity 9 3
In the short-term, the AEC’s provisions on labour mobility may therefore have very little impact.
Mobility of low-skilled workersThe AEC does not address movements of low-skilled workers. One justification sometimes argued is that closer economic integration can ultimately lead to more efficient production in all countries and cause wages to converge, thus removing a key incentive for migration.10 However, this “factor price equali-zation” among trading partners is seldom observed in practice and is unlikely to occur in ASEAN on any significant scale.11
Economic integration may well contribute to greater concentration of economic activity in some of the more developed Member States, leading perhaps to an initial rise in regional disparities.12 This would stimulate demand for low-skilled workers in specific sectors and create a temporary “migration hump”.13 ASEAN migration hubs such as Malaysia, Singapore, and Thailand could thus benefit early on from freer trade by employing more migrant workers. Trade and migration are thus likely to be complementary in these countries and may rise together in the short term.
Regardless of the AEC, flows of low-skilled
10 P.A.Samuelson:“Internationaltradeandtheequalizationoffactor prices”, in Economic Journal(1948,Vol.58),pp.163-184.
11 B.O. Hansen, and H. Keiding: How likely is factor price equalization?, University of Copenhagen Discussion Paper Series No. 08-10 (Copenhagen, 2008).
12 P.Krugman:“Increasingreturnsandeconomicgeography”,inJournal of Political Economy(1991,Vol.99),pp.483-499;T.VenablesandR.E.Baldwin:“Regionaleconomicintegration”,in G.M. Grossmann and K. Rogoff (eds.): Handbook of international economics (Amsterdam, Elsevier, 1995); P.Martin:“Tradeandmigration:NAFTAandagriculture”, inPolicy Analyses in International Economics(1993,Vol.38).
13 Trade can temporarily increase migration when technological and infrastructural differences between two trading countries make labour-intensive production in one uncompetitive against capital-intensive production in the other. See P. MartinandM.Abella:Reaping the economic and social benefits of labour mobility: ASEAN 2015, background paper prepared for ASEAN Community 2015: Managing integration for better jobs and shared prosperity (Bangkok, ILO, forthcoming).
migrant workers are likely to continue in the short- and medium-term because of demographic factors and existing economic disparities. In Thailand, for example, the labour force is expected to shrink by 2022 and the demand for the low- and medium-skilled migrant workers will rise. Migrant workers will be needed to sustain production and raise Thailand’s economic growth, unless productivity levelsriserapidly(seeBox6-3).Thiswillrequireastrategy to manage migration and protect migrant workers through increased and affordable access to regular migration channels, clear incentives for migrant workers to use those channels, while ensuring against labour exploitation of migrant workers and trafficking in persons.
Over time, the formulation of mutual skills recognition arrangements for medium-skill occu-pations in ASEAN – including construction workers, garment workers, fishermen, and planta-tion labourers – may provide a more manageable, transparent, and safer channel for migrant workers. Such frameworks could help to legitimize and regu-late much of the migration already taking place in ASEAN as well as to boost the overall calibre of the workers coming through. A relevant tool could be implemented under the AQRF or through indi-vidual MRAs. Such frameworks would help to address the labour mobility that is already taking place in ASEAN – in a way the current AEC largely fails to do – while promoting a more sustainable mode of managing labour mobility and helping to address future needs linked to demographic and economic disparities among Member States, as discussed above.
Protecting migrant workersEnsuring equal protection for migrant workers promotes economic equity and makes labour markets more efficient. Enforcing protection for migrant workers ensures that employers who do not comply with national labour standards cannot compete unfairly against those who do. It is
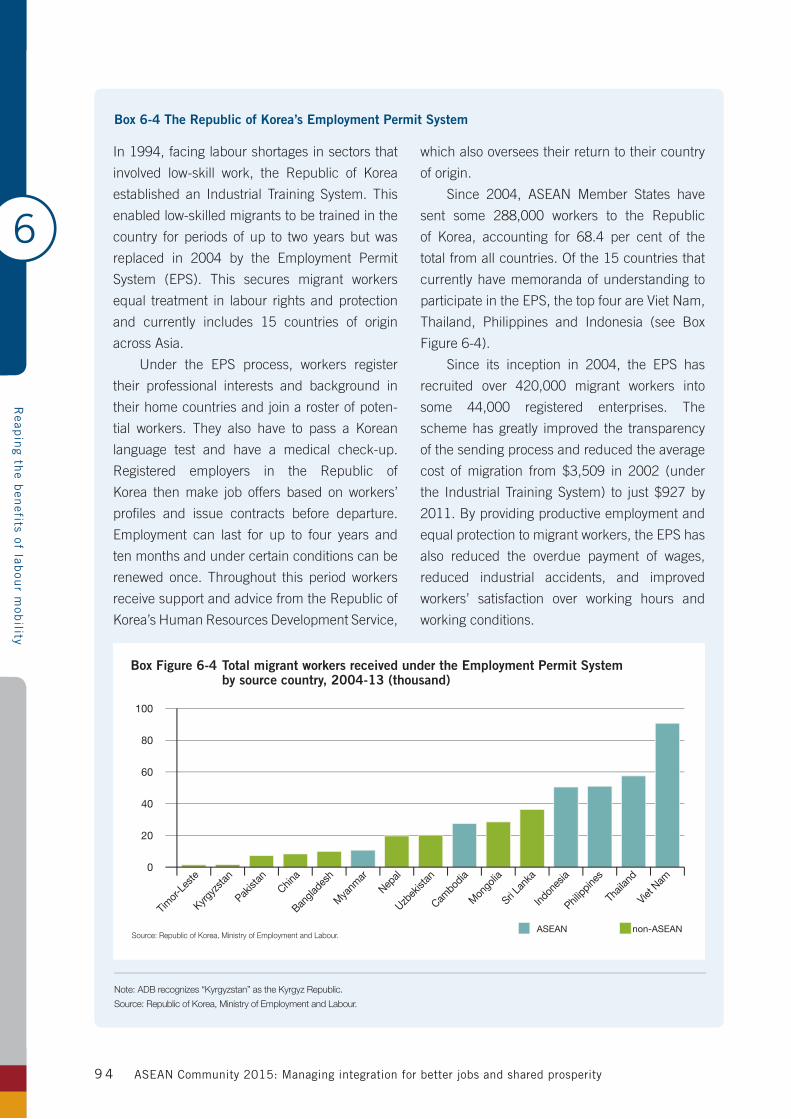
6
Reap
ing th
e ben
efits of labou
r mob
ility
ASEAN Community 2015: Managing integration for better jobs and shared prosperity9 4
Box 6-4 The Republic of Korea’s Employment Permit System
In 1994, facing labour shortages in sectors that
involved low-skill work, the Republic of Korea
established an Industrial Training System. This
enabled low-skilled migrants to be trained in the
country for periods of up to two years but was
replaced in 2004 by the Employment Permit
System (EPS). This secures migrant workers
equal treatment in labour rights and protection
and currently includes 15 countries of origin
across Asia.
Under the EPS process, workers register
their professional interests and background in
their home countries and join a roster of poten-
tial workers. They also have to pass a Korean
language test and have a medical check-up.
Registered employers in the Republic of
Korea then make job offers based on workers’
profiles and issue contracts before departure.
Employment can last for up to four years and
ten months and under certain conditions can be
renewed once. Throughout this period workers
receive support and advice from the Republic of
Korea’s Human Resources Development Service,
which also oversees their return to their country
of origin.
Since 2004, ASEAN Member States have
sent some 288,000 workers to the Republic
of Korea, accounting for 68.4 per cent of the
total from all countries. Of the 15 countries that
currently have memoranda of understanding to
participate in the EPS, the top four are Viet Nam,
Thailand, Philippines and Indonesia (see Box
Figure 6-4).
Since its inception in 2004, the EPS has
recruited over 420,000 migrant workers into
some 44,000 registered enterprises. The
scheme has greatly improved the transparency
of the sending process and reduced the average
cost of migration from $3,509 in 2002 (under
the Industrial Training System) to just $927 by
2011. By providing productive employment and
equal protection to migrant workers, the EPS has
also reduced the overdue payment of wages,
reduced industrial accidents, and improved
workers’ satisfaction over working hours and
working conditions.
Note: ADB recognizes “Kyrgyzstan” as the Kyrgyz Republic.
Source: Republic of Korea, Ministry of Employment and Labour.
Viet N
am
Thail
and
Philippine
s
Indon
esia
Sri Lan
ka
Mon
golia
Cambod
ia
Uzbek
istan
Nepal
Mya
nmar
Bangla
desh
China
Pakist
an
Kyrgyz
stan
Timor-
Leste
Box Figure 6-4 Total migrant workers received under the Employment Permit System by source country, 2004-13 (thousand)
Source: Republic of Korea, Ministry of Employment and Labour.ASEAN non-ASEAN
0
20
40
60
80
100
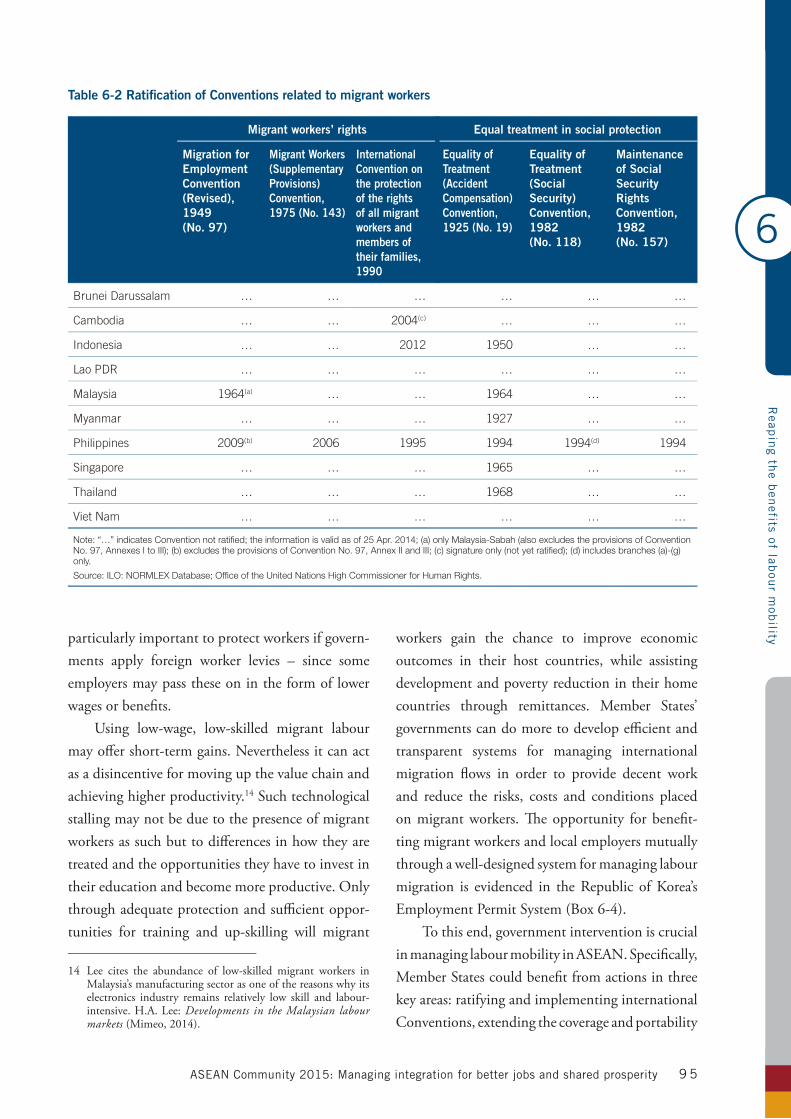
6
Reap
ing th
e ben
efits of labou
r mob
ility
ASEAN Community 2015: Managing integration for better jobs and shared prosperity 9 5
particularly important to protect workers if govern-ments apply foreign worker levies – since some employers may pass these on in the form of lower wages or benefits.
Using low-wage, low-skilled migrant labour may offer short-term gains. Nevertheless it can act as a disincentive for moving up the value chain and achieving higher productivity.14 Such technological stalling may not be due to the presence of migrant workers as such but to differences in how they are treated and the opportunities they have to invest in their education and become more productive. Only through adequate protection and sufficient oppor-tunities for training and up-skilling will migrant
14 Lee cites the abundance of low-skilled migrant workers in Malaysia’s manufacturing sector as one of the reasons why its electronics industry remains relatively low skill and labour-intensive.H.A.Lee: Developments in the Malaysian labour markets(Mimeo,2014).
workers gain the chance to improve economic outcomes in their host countries, while assisting development and poverty reduction in their home countries through remittances. Member States’ governments can do more to develop efficient and transparent systems for managing international migration flows in order to provide decent work and reduce the risks, costs and conditions placed on migrant workers. The opportunity for benefit-ting migrant workers and local employers mutually through a well-designed system for managing labour migration is evidenced in the Republic of Korea’s EmploymentPermitSystem(Box6-4).
To this end, government intervention is crucial in managing labour mobility in ASEAN. Specifically, Member States could benefit from actions in three keyareas:ratifyingandimplementinginternationalConventions, extending the coverage and portability
Table 6-2 Ratification of Conventions related to migrant workers
Migrant workers’ rights Equal treatment in social protection
Migration for Employment Convention (Revised), 1949(No. 97)
Migrant Workers (Supplementary Provisions) Convention, 1975 (No. 143)
International Convention on the protection of the rights of all migrant workers and members of their families, 1990
Equality of Treatment (Accident Compensation) Convention, 1925 (No. 19)
Equality of Treatment (Social Security) Convention, 1982(No. 118)
Maintenance of Social Security Rights Convention, 1982(No. 157)
Brunei Darussalam … … … … … …
Cambodia … … 2004(c) … … …
Indonesia … … 2012 1950 … …
Lao PDR … … … … … …
Malaysia 1964(a) … … 1964 … …
Myanmar … … … 1927 … …
Philippines 2009(b) 2006 1995 1994 1994(d) 1994
Singapore … … … 1965 … …
Thailand … … … 1968 … …
Viet Nam … … … … … …
Note: “…” indicates Convention not ratified; the information is valid as of 25 Apr. 2014; (a) only Malaysia-Sabah (also excludes the provisions of Convention No. 97, Annexes I to III); (b) excludes the provisions of Convention No. 97, Annex II and III; (c) signature only (not yet ratified); (d) includes branches (a)-(g) only.
Source: ILO: NORMLEX Database; Office of the United Nations High Commissioner for Human Rights.
6
Reap
ing th
e ben
efits of labou
r mob
ility
ASEAN Community 2015: Managing integration for better jobs and shared prosperity9 6
of social security, and implementing the ASEAN Declaration on the Protection and Promotion of the Rights of Migrant Workers (known as the Cebu Declaration on Migrant Workers).
Ratifying and implementing international ConventionsAn important starting point for protecting migrant workers would be to ratify and implement interna-tional Conventions. In ASEAN, the only countries that have ratified all eight of the Fundamental Conventions are Cambodia, Indonesia and Philippines. All are net labour-sending countries. Conversely, none of the key ASEAN destina-tion countries have ratified the Discrimination (EmploymentandOccupation)Convention,1958(No. 111), which prohibits distinctions, exclusions or preferences made on the basis of a person’s race, colour, sex, religion, political opinion, national extraction (including nationals’ place of birth, foreign origin, or ancestry) or social origin.15
Beyond the Fundamental Conventions, there are several that deal directly with migrant workers’ rights, including the Migration for Employment Convention(Revised),1949(No.97);theMigrantWorkers (Supplementary Provisions) Convention, 1975 (No. 143); and the United Nations’International Convention on the Protection of the Rights of All Migrant Workers and Members oftheirFamilies,1990,aswellasseveralotherkeylabour Conventions ensuring equal treatment for all workers in social protection (Table 6-2). Of the ASEAN Member States, only the Philippines has ratified all six; ratification remains especially weak
15 ILO:Equality and non-discrimination at work in East and South-East Asia: Guide (Bangkok, 2012).
in the main countries of destination.16
To ensure sustainable integration through labour mobility, and harmonize labour policies, ratification and enforcement of international Conventions relating to migrant workers is critical. Building trust among the ASEAN Community will require common ground for the settlement of disputes and the oversight to ensure that workers and employers fulfil their responsibilities under national laws. It is also crucial that countries ensure domestic workers – who in ASEAN include many women migrants – are recognized as workers in their own right and are protected under national labour laws (Box 6-5).
Extending the coverage and portability of social securityIn ASEAN, as elsewhere in the world, many migrant workers have no social protection – having forfeited their entitlements at home while facing highly limited and unequal protection abroad.
The right to social security is included in the Universal Declaration of Human Rights (1948),Article 22, and was recalled in the Cebu Declaration on Migrant Workers. Since the ILO’s first session in1919, therehavebeen31Conventionsand24Recommendations adopted to make social secu-rity a reality for all. The most recent instrument is the Social Protection Floor Recommendation, 2012 (No. 202), which Cambodia, Indonesia, Lao People’s Democratic Republic, Myanmar, Philippines, Thailand, and Viet Nam have already taken measures to implement.
Ensuring that migrant workers – in both formal and informal employment – enjoy equal access to social security benefits under contributory
16 Note that Malaysia’s implementation of the Equality of Treatment (Accident Compensation) Convention, 1925(No. 19), has had some longstanding inconsistenciesregardingmigrantworkersreportedbytheILO:Report of the Committee of Experts on the Application of Conventions and Recommendations, www.ilo.org/dyn/normlex/en/f?p=1000:13100:0::NO:13100:P13100_COMMENT_ID:2698038[accessed27June2014].
6
Reap
ing th
e ben
efits of labou
r mob
ility
ASEAN Community 2015: Managing integration for better jobs and shared prosperity 9 7
Box 6-5 Protecting migrant domestic workers in ASEAN
Hundreds of thousands of migrants throughout ASEAN work in private households as cleaners, cooks, drivers, gardeners, gatekeepers, and caretakers for infants, the sick and the elderly. Although their work is seldom acknowledged as such, it allows other women and men to perform their own economic roles, thus contributing greatly to economic and social outcomes. Nevertheless, many ASEAN Member States continue to disre-gard domestic workers as workers and withhold from them the most basic rights and protections. This situation is worsened by the fact that some migrant domestic workers are undocumented and that many more work informally.
Malaysia currently has around 350,000 migrant domestic workers.1 They are excluded from the Employment Act, 1955, and do not have access to basic rights including maternity provisions, termination benefits, annual and medical leave, and regular weekly rest.2 Domestic workers are also excluded from the coverage of Malaysia’s minimum wage. The Government is currently drafting a new regulation on domestic workers, but several of its elements unfortunately are not in line with the international standards set down in the Domestic Workers Convention, 2011 (No. 189).
Singapore had some 214,500 migrant domestic workers registered at the end of 2013.3 Similar to Malaysia, these workers have no coverage under the Employment Act, 2009, or the Work Injury Compensation Act, 2008, and thus have no guarantees on limits to working hours, overtime entitlements, or paid medical leave. The Government recently established a weekly day of rest for registered domestic
workers, replacing what had previously been a legal monthly day of rest.
Thailand’s official figures recorded approxi-mately 83,000 registered migrant domestic workers in 2011, though the actual figure (including undocumented migrants) is probably much higher.4 In 2012, a Ministerial Regulation extended several rights and protections to regis-tered migrant domestic workers including a weekly day of rest, traditional national holidays, paid sick leave and annual leave, provisions on termi-nation of employment, and new mechanisms to redress abuse or harassment. Nevertheless, the Regulation excludes limits on domestic workers’ working hours, minimum wage and social secu-rity coverage, rights to paid maternity leave, and job security in case of pregnancy.5
While domestic work involves a significant share of migrant workers in ASEAN – especially women – much remains to be done to protect and empower them. One starting point would be to follow the Philippines in ratifying and applying the Domestic Workers Convention, 2011 (No. 189), and the Domestic Workers Recommendation, 2011 (No. 201). Another would be to acknowl-edge undocumented migrant domestic workers and seek ways to legitimize their status and decent working conditions. Skills recognition frameworks would also help to certify domestic workers’ skills and experience in different work areas in order to better distinguish and remu-nerate them. Harmonized skills recognition on a regional scale would also facilitate labour mobility and promote formal employment within the sector.
1 P. Hangzo and A. Cook: The Domestic Workers Convention 2011: Implications for migrant domestic workers in Southeast Asia, NTS Insight (Singapore: RSIS Centre for Non-Traditional Security (NTS) Studies, Apr. 2012).
2 Asia Pacific Forum on Women, Law and Development (APWLD): The right to unite: A handbook on domestic worker rights across Asia (Chiang Mai, APWLD, 2010).
3 Singapore Ministry of Manpower: Foreign workforce numbers, http://www.mom.gov.sg/statistics-publications/others/statistics/Pages/ForeignWorkforceNumbers.aspx [accessed 27 June 2014].
4 ILO: Thailand: New Ministerial Regulation offers better protection of domestic workers’ rights (Geneva, ILO, 2013).
5 Ibid.
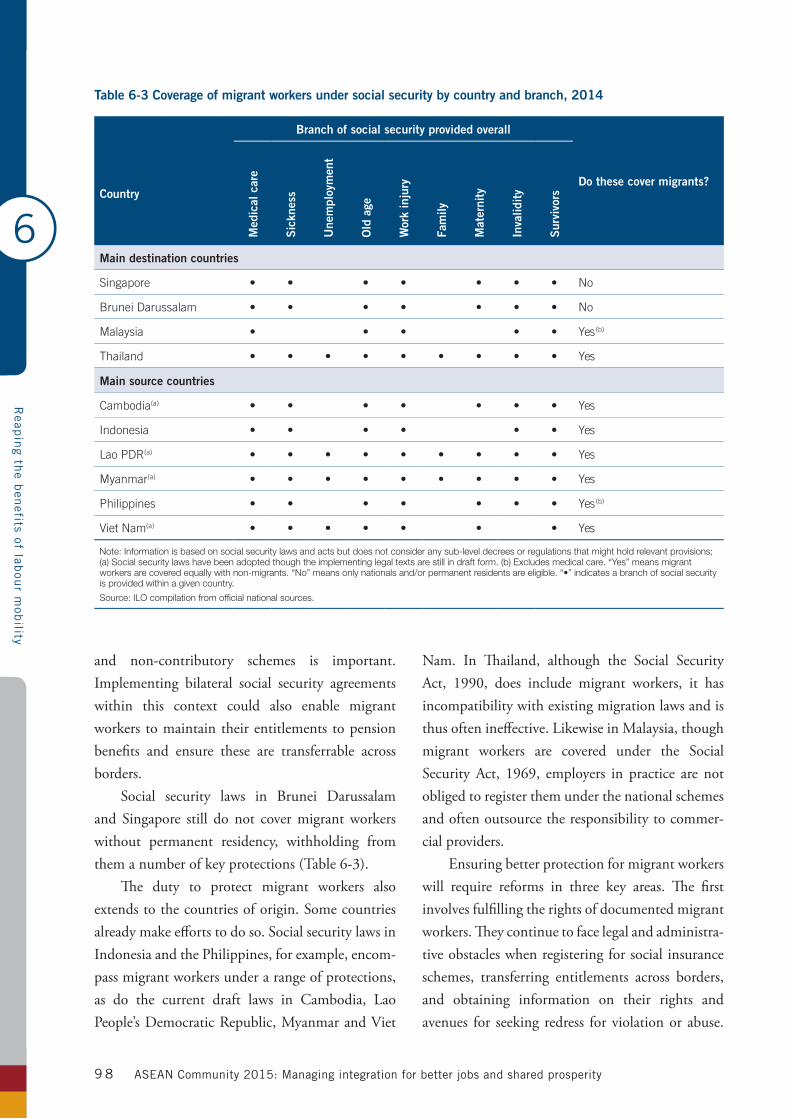
6
Reap
ing th
e ben
efits of labou
r mob
ility
ASEAN Community 2015: Managing integration for better jobs and shared prosperity9 8
and non-contributory schemes is important. Implementing bilateral social security agreements within this context could also enable migrant workers to maintain their entitlements to pension benefits and ensure these are transferrable across borders.
Social security laws in Brunei Darussalam and Singapore still do not cover migrant workers without permanent residency, withholding from themanumberofkeyprotections(Table6-3).
The duty to protect migrant workers also extends to the countries of origin. Some countries already make efforts to do so. Social security laws in Indonesia and the Philippines, for example, encom-pass migrant workers under a range of protections, as do the current draft laws in Cambodia, Lao People’s Democratic Republic, Myanmar and Viet
Nam. In Thailand, although the Social Security Act, 1990, does include migrant workers, it hasincompatibility with existing migration laws and is thus often ineffective. Likewise in Malaysia, though migrant workers are covered under the Social SecurityAct, 1969, employers in practice are notobliged to register them under the national schemes and often outsource the responsibility to commer-cial providers.
Ensuring better protection for migrant workers will require reforms in three key areas. The first involves fulfilling the rights of documented migrant workers. They continue to face legal and administra-tive obstacles when registering for social insurance schemes, transferring entitlements across borders, and obtaining information on their rights and avenues for seeking redress for violation or abuse.
Table 6-3 Coverage of migrant workers under social security by country and branch, 2014
Branch of social security provided overall
Do these cover migrants?Country
Med
ical
car
e
Sic
knes
s
Une
mpl
oym
ent
Old
age
Wor
k in
jury
Fam
ily
Mat
erni
ty
Inva
lidit
y
Sur
vivo
rs
Main destination countries
Singapore • • • • • • • No
Brunei Darussalam • • • • • • • No
Malaysia • • • • • Yes(b)
Thailand • • • • • • • • • Yes
Main source countries
Cambodia(a) • • • • • • • Yes
Indonesia • • • • • • Yes
Lao PDR(a) • • • • • • • • • Yes
Myanmar(a) • • • • • • • • • Yes
Philippines • • • • • • • Yes(b)
Viet Nam(a) • • • • • • • Yes
Note: Information is based on social security laws and acts but does not consider any sub-level decrees or regulations that might hold relevant provisions; (a) Social security laws have been adopted though the implementing legal texts are still in draft form. (b) Excludes medical care. “Yes” means migrant workers are covered equally with non-migrants. “No” means only nationals and/or permanent residents are eligible. “•” indicates a branch of social security is provided within a given country.
Source: ILO compilation from official national sources.
6
Reap
ing th
e ben
efits of labou
r mob
ility
ASEAN Community 2015: Managing integration for better jobs and shared prosperity 9 9
Even though they contribute taxes, migrant workers are often also excluded from social assistance and universal protection schemes.
Second, there is an urgent need to address the rights of undocumented migrant workers – including many seasonal workers, domestic workers, rural workers, and those in informal or hazardous work – who are excluded from social assistance and insur-ance schemes, compounding their vulnerability to exploitationandharm.InAugust2013,Thailand’sMinistry of Health announced a new social health protection scheme that covers all migrant workers (including undocumented migrant workers as well as refugees). The scheme offers the same benefit package as under the Universal Coverage Scheme but on a contributory basis. It is aimed at migrant workers who work or live in Thailand without a work permit and therefore do not contribute to the Social Security Fund.
Third, ASEAN governments can take steps to harmonize their systems for social protection and social services. At present, uneven provisions lead to opportunism and “free-riding” across borders, whereby workers from countries with weaker serv-ices might place a burden on others. Much of this danger can be avoided through equitable and cohe-sive development under the ASEAN Community, coupled with fair and equal access to social security for all through national social protection floors.
Implementing the Cebu Declaration on Migrant WorkersThe Cebu Declaration on Migrant Workers calls on both countries of origin and countries of destina-tion to promote the “full potential and dignity of migrant workers in a climate of freedom, equity, and stability” in accordance with national laws (Article 1). In destination countries, the Declaration empha-sizes “fair and appropriate employment protection, payment of wages, and adequate access to decent working and living conditions for migrant workers” (Article 8). The Declaration also mandates “the
relevantASEANbodies[…]todevelopanASEANinstrument on the protection and promotion of the rights of migrant workers” on which it moni-tors progress during the annual ASEAN Ministerial Meeting (Article 22).
The Cebu Declaration on Migrant Workers is a landmark, though non-binding, agreement. However more needs to be done to implement it and to align national policies with its principles. A coherent, functioning ASEAN labour mobility policy – with commitment from all Member States – is critical for a sustainable AEC. Coordinated action can also be targeted towards reducing the cost of migration (including employer’s recruit-ment costs) and the cost of remitting money while ensuring that the legal channels for migration are accessible and that the different responsibilities and rights associated with them are transparent, well known and clearly understood. In order to deal with labour supply bottlenecks, and respond to production demands, destination countries will need medium-skilled and low-skilled migration. Young workers from the countries of origin could take up these jobs provided there is a proper qualifi-cation framework and facilitated entry.
If the ASEAN region is to harness the full bene-fits of integration through the AEC, and transform into a single production base, Member States will need to cooperate through a continuous dialogue on labour resources and mobility.17 In this, proce-dures for implementation and enforcement should be decided upon in a time-bound and transparent manner.
ConclusionIntra-regional migration is rising throughout ASEAN as its economies become more integrated. Driven primarily by structural factors – resulting from demographic and economic disparities among
17 A comprehensive table detailing the existing bilateral agreements on labour mobility among pairs of ASEAN Member States is included in Annex E.
6
Reap
ing th
e ben
efits of labou
r mob
ility
ASEAN Community 2015: Managing integration for better jobs and shared prosperity10 0
Member States – labour mobility will most likely continue to rise after 2015. The region’s continued and shared prosperity will depend on building safer, cheaper and more transparent pathways for migrant workers. Better management of labour mobility throughout ASEAN would help to address receiving countries’ labour market needs while creating employment opportunities for migrant workers and bringing new skills, ideas and networks to sending countries.
Although the AEC provides for the free move-ment of some groups of highly-skilled professionals, its approach stands in sharp contrast with existing realities. Labour migration within ASEAN is mainly dominated by low- and medium-skilled workers in manufacturing, construction, fishing and domestic work and it is likely to remain so long into the medium term. Recognising additional occupa-tions under multilateral frameworks could provide better channels for such workers, while promoting a more sustainable and legitimate mode of managing labour mobility, offering benefits for both source and destination countries.
Protecting migrant workers on an equal footing with nationals can promote both equity and efficiency. It reduces labour market segrega-tion among national and non-national workers and ensures that some employers cannot compete unfairly. Developing adequate protections in this area requires further action on three fronts: rati-fying and implementing international Conventions, extending the coverage and portability of social security to all migrant workers, and implementing existing multilateral commitments including the Cebu Declaration on Migrant Workers.
7
Policies for decent w
ork in an integrated AS
EA
N
ASEAN Community 2015: Managing integration for better jobs and shared prosperity 101
How will the ASEAN Community change the structure of employment, the demand and supply of skills, productivity and wages, and the nature and pattern of labour mobility? How will this affect the lives of women and men through their jobs and the world of work?
These questions are particularly relevant because, despite impressive economic growth, the ASEAN region is not delivering sufficient quality jobs. These will be needed even more in the future for those workers leaving agriculture and for the new entrants to the labour force between 2010 and 2025 – estimated to be more than 68.2 million women and men, many of whom will be young, first-time job seekers.
The priorities differ from country to country. Cambodia, Indonesia, Myanmar and Philippines, for example, have expanding working-age popula-tions and young labour forces, so face pressures on the labour supply side. Others, such as Singapore and Thailand, have ageing populations and are likely to face problems on the demand side through labour shortages. The AEC will affect these pres-sures of supply and demand.
How can the region best manage its human resources, estimated to be about 370 million in2025? How can it, as noted in the AEC Blueprint, “achieve higher levels of economic dynamism, sustained prosperity, inclusive growth and inte-grated development of ASEAN”?1
The impacts of the AEC on the labour market will be conditioned by factors both inside and outside of ASEAN. ASEAN factors include rising regional connectivity through the development of infrastructure, trade facilitation, MRAs on skills and qualifications and labour mobility. Particularly important for promoting regional cooperation and integration in ASEAN are sub-regional economic zones such as the GMS, IMT-GT, and BIMP-EAGA. Key issues outside of ASEAN relate to the volatile global economic context affecting FDI and exports, and the rising competitiveness challenges from China and India. At the same time, labour markets need to be responsive to the massive oppor-tunities provided by the rapid growth of China and
1 Declaration on the ASEAN Economic Community Blueprint, Singapore, Nov. 2007.
Integration through the ASEAN Economic Community will only be successful and
sustainable if it delivers decent work to millions of workers across the region.
Transforming ASEAN into a single production base and a common market will require
corresponding adjustments and interventions in the labour market. This chapter
highlights the report’s main findings and policy conclusions.
Policies for decent work in an integrated ASEAN
7
Policies for decent w
ork in an integrated AS
EA
N
ASEAN Community 2015: Managing integration for better jobs and shared prosperity10 2
India, including the existence of regional coopera-tion agreements such as CAFTA.
Main findingsThis study assessed potential outcomes under the AEC by simulating various scenarios and analysing existing evidence. It has reviewed the AEC’s existing policies, institutions and coordination mechanisms, as well as examples from other initiatives for regional integration. The main findings of the study are as follows:• Increases in output – The AEC will accelerate
structural change, and create new opportunities and challenges. Compared to the baseline trend, closer trade integration between the ten countries under the AEC could, by 2025, lift aggregate output by as much as seven per cent.
• Job losses and gains – The distribution of these gains will not be uniform across countries, sectors, skill groups or sex.Overall, around 14millionadditional jobs could be generated by 2025, but jobs will be created in some industries and lost in others. Job gains for men could be greater than those for women. ASEAN Member States will therefore need to address existing problems of unemployment, informality and poor job quality while simultaneously dealing with challenges emerging from closer regional cooperation and integration.
• Productivity gains – Countries will witness significant productivity gains. In Cambodia, Indonesia, Lao People’s Democratic Republic, Thailand and Viet Nam, for example, output per worker could double. This would help the CLMV countries compete in global markets through higher productivity rather than on the basis of low wages. Meanwhile, Malaysia and Thailand could climb to the next rung in the development ladder and reach high-income status, avoiding a middle-income trap.
• Greater demand for skills – The AEC will accelerate the demand for skilled workers.
Governments can prioritize education and training policies and align these with national development and employment policies to ensure that gains from integration benefit the most vulnerable, including women and young people. Otherwise, ASEAN Member States risk suffering persistent skills shortages and mismatches.
• Little impact on skilled migration, but contin-uing medium- and low-skilled migration – Labour mobility will be driven primarily by demographic and economic disparities between countries. Migration in ASEAN will continue in the low- and medium-skill segments, primarily in manufacturing, construction, fishing, and domestic work – often undocumented. In prin-ciple, steps to free up the movement of skilled workers in the AEC framework could lead to significant gains. However, current agreements on migration policies do not address existing realities – being confined to a restricted list of eight occupational categories which together constitute a tiny share of total employment in ASEAN.
• The opportunity for shared prosperity – Regional integration holds great promise for shared prosperity, but could also increase inequality. Member States will need to develop policies and institutions to ensure inclusive and fair outcomes.
Priority actions To ensure that the AEC leads to greater prosperity for all women and men in ASEAN, Member States shouldprioritizethefollowingactions:
A. Facilitate and manage structural changeIn many ASEAN Member States, the AEC is likely to see increased employment in trade and transport, as well as in construction and private services. These are sectors often associated with vulnerable employ-ment and the informal economy. There is also the risk that displaced workers will be unable to gain
7
Policies for decent w
ork in an integrated AS
EA
N
ASEAN Community 2015: Managing integration for better jobs and shared prosperity 10 3
employment in more productive sectors. To this end, governments can facilitate and manage struc-tural change at both national and regional levels so as to steer the region towards equitable economic growth:1. Industrial and sectoral policies – Facilitating
the shift towards higher productivity sectors, and the diversification of employment in manu-facturing, will require well-designed industrial and sectoral policies that are coordinated and developed in tandem with employment and skills policies.
2. Education and training – ASEAN’s shift towards higher value-added industries calls for academic excellence in science, technology, engineering and mathematics, and fostering diverse career paths for young women and men. Workers need to be equipped with skills for present and future jobs and have the capacity to adapt to the requirements of fast changing tech-nology. Education and training systems need to improve access and quality. Vocational and core skills should also be promoted, particularly those relevant to fast growing sectors.
3. Social protection – Effective social protection and other labour market policies can help miti-gate the adjustment costs of structural change and address informality, especially for vulnerable groups. The extension of social protection should include building nationally defined social protec-tion floors, along with extending the coverage and scope of social security systems to include migrant workers and other vulnerable groups. A sound framework for this purpose is the ASEAN Declaration on Strengthening Social Protection, adoptedinOctober2013.
4. Small and medium enterprises – Maximizing the benefits of regional integration will mean unlocking the potential of small and medium enterprises by strengthening the productivity and competitiveness of such firms through good management and improved labour practices,
simplification of administrative procedures, facil-itated access to finance and business development services, partnerships with larger enterprises, and integration into the formal economy. SMEs in the region will also need information on the AEC and its implications, as well as on market opportunities in ASEAN. Particular attention needs to be paid to women’s enterprises.
5. Investing in infrastructure – Better infrastruc-ture would help accelerate regional connectivity and economic growth – and simultaneously reduce poverty and income disparities. This would narrow development gaps between and within ASEAN Member States by facilitating trade, building supply chains and developing financial links, which in turn can foster higher productivity. The completion of GMS economic corridors as well as the implementation of the Master Plan on ASEAN Connectivity will provide a huge boost to regional cooperation and integration.
B. Ensure that economic gains lead to shared prosperity. The AEC has the potential to lead to higher output, trade, employment and productivity. But balanced and inclusive growth will need appropriate policies and labour market institutions.1. Strengthening the productivity-wage link – If
workers can benefit from growth, this will increase household consumption and drive domestic and regional demand as well as spur inclusive and sustained economic growth. This requires effec-tive minimum wage institutions to help those at the bottom of the wage distribution, along with better mechanisms for collective bargaining – which would also minimize industrial conflict. Linking wage growth to productivity growth would ensure that workers share in the fruits of economic dynamism in ASEAN.
2. Improving opportunities for better quality jobs – Skills development initiatives should
7
Policies for decent w
ork in an integrated AS
EA
N
ASEAN Community 2015: Managing integration for better jobs and shared prosperity10 4
equip and certify workers, particularly young women and men, with the skills demanded by employers, especially in high-growth productive sectors and occupations. This would provide a ladder to higher-skill jobs with better wages and working conditions and ease the transition for young women and men from the classroom to the workplace.
3. Promoting gender equality – Without appro-priate policy action, job creation through the AEC could widen existing gender gaps in labour force participation and access to quality jobs – increasing the disadvantages faced by women. ASEAN Member States increasingly realize that it is smart economics to utilize all available human resources. It is therefore imperative to deal with the labour market discrimination faced by women. Further policy commitment is required along with practical measures based on analysis of sex-disaggregated data. This should aim to reduce gender disparities and promote gender equality in various dimensions – employment, education and training, wages and migration.
4. Protecting migrant workers – The ASEAN Multilateral Framework on Migration can guide migration policies, but the main mechanisms for facilitating labour migration are likely to be bilateral agreements. These need to be simpli-fied and strengthened to ensure that migrant workers are protected and treated fairly. Female migration in ASEAN is dominated by domestic work so it is important that governments ratify the ILO’s Domestic Workers Convention, 2011 (No.189),andextendthenecessaryrightsandprotections. It is also important to enforce labour laws based on principles of equal treatment of migrant workers. This would help reduce labour market segmentation and minimize dependence on cheap foreign workers, while creating a level playing field for enterprises.
C. Strengthen regional cooperationRealizing the potential of the AEC for better jobs and social progress will necessitate deeper regional partnerships between governments, workers and employers. Regional and bilateral mechanisms can promote knowledge exchange and technical assist-ance, and draw on international best practices and policies. The necessary coordination and facilitation can be provided by the ASEAN Secretariat.1. Implementing the Cebu Declaration on
Migrant Workers and ASEAN Declaration on Social Protection – The Cebu Declaration on Migrant Workers calls on source and destination countries to “Promote decent, humane, produc-tive, dignified and remunerative employment for migrant workers” in accordance with national laws. It is important to address the ”legitimate concerns” of receiving countries and address issues that have hampered the implementa-tion of this ASEAN Declaration while aligning national policies with its principles.2The2013ASEAN Declaration on Social Protection reaf-firms the Member States’ commitment to build an ASEAN community that is socially respon-sible and people oriented by, notably, fostering national social protection floors in the region and recognizing the rights of migrant workers and other vulnerable groups to “equitable access to social protection that is a basic human right and based on a rights-based/needs-based, life-cycle approach”.3
2. Expanding mutual recognition arrangements – ASEAN-wide understanding and manage-ment of labour migration would benefit from an expansion of mutual recognition agreements on skills and qualifications. This would also reduce irregular migration. Initially this could
2 ASEAN Declaration on the Protection and Promotion of the Rights of Migrant Workers, Cebu, Jan. 2007, art. 15 and para. 7.
3 ASEAN Declaration on Strengthening Social Protection,BandarSeriBegawan,Oct.2013,principle1.
7
Policies for decent w
ork in an integrated AS
EA
N
ASEAN Community 2015: Managing integration for better jobs and shared prosperity 10 5
involve medium-skill occupations for which there is high potential demand, with a view to managing labour mobility in the longer term. Towards this end, governments can complete the ASEAN Qualifications Reference Framework to strengthen and benchmark their national quali-fications frameworks, while developing regional model competency standards in key sectors such as construction.
3. Improving labour market information, research and analysis – Regional technical assistance should focus on ensuring regular, at least annual, production of key sex-disaggregated labour market data for all ASEAN Member States. This should involve comparative indicators based on international definitions – improving the measurement of earnings and skills differ-entials and strengthening the information base on gender, informality and inequality, youth unemployment and labour migration. Data are also needed to address the needs of private sector enterprises and must be shared between countries as well as between public and private sectors to promote evidenced-based research and analysis of the AEC labour market impacts.
4. Tripartite dialogue – Regional tripartite dialogue will help improve any AEC monitoring system and the design and implementation of labour market policies to complement economic and trade policies. This should involve coop-erating with the private sector and workers’ organizations on the potential effects of the AEC on businesses and workers. Greater consultation, more effective business councils, and increased participation of the private sector and workers organizations, including those that relate to women and youth, in decision-making processes would also be beneficial.
Guiding principlesThe AEC should help propel the region towards a prosperous and inclusive society – with positive
spillover effects on jobs and working conditions, and therefore on the quality of life of women and men. The ultimate success of regional integration in ASEAN will therefore depend very much on its effects on the labour market. The following guiding principlesarerelevantinmakingpolicydecisions:1. Fulfilling ASEAN commitments – ASEAN
leaders have met regularly over the past 40years and established mutual trust and under-standing as well as many useful programmes for cooperation. They have made landmark Declarations such as the ASEAN Declaration on the Protection and Promotion of the Rights of Migrant Workers and the ASEAN Declaration on Social Protection. Implementing these Declarations through a common understanding at the regional and national levels could be key to the AEC’s success.
2. Coherent regional and national policies – ASEAN needs to arrive at a sense of the “collec-tive” in synchronizing regional and national priorities and policies. This will be important for managing and nurturing human resources so as to boost skills and productivity – through a skills recognition framework along with measures to protect workers and enterprises. The starting point is the ratification and enforcement of international labour standards to ensure that the region creates a level playing field for all workers and enterprises, promotes fair competition as it turns into a single production base, and avoids a race to the bottom.
3. Sequencing policies and labour market inter-ventions – Member States of ASEAN differ in many respects – in terms of levels of development, demographic transitions and political systems. In particular there are sizeable disparities between the CLMV and the ASEAN-6 countries. The appropriate policy mix will therefore depend on the specific needs of each country. Furthermore, there will need to be sequencing between short-term priorities related to integration, job losses
7
Policies for decent w
ork in an integrated AS
EA
N
ASEAN Community 2015: Managing integration for better jobs and shared prosperity10 6
and enterprise sustainability and longer-term needs of building better labour market institu-tions. For the CLMV countries creating better jobs will mean increasing labour productivity in agriculture while other ASEAN Member States will aim to enhance labour productivity in services.
4. Initiating programmes and projects in newly connected areas – ASEAN may consider initi-ating pilot tests or focusing labour market programmes and initiatives in areas that are based on new economic corridors. These are tying the region together and are likely to inten-sify economic activity.
The AEC could have substantial and lasting implications for the labour market in the region. Forward thinking supported by an evaluation of the benefits and costs of labour market outcomes are needed to mitigate risks to workers and enter-prises, in both the short and long terms, especially in the CLMV countries. The ADB and the ILO could support the ASEAN Secretariat in its regional initiatives which, in the context of the AEC, will require greater coordination by supporting mech-anisms for sharing and discussing regional and national roadmaps and policy priorities and their labour market impacts. The two organizations could also provide technical assistance to countries to address their labour market concerns, supporting labour market monitoring capacity, and promoting dialogue between different stakeholders at national and regional levels.
ASEAN Community 2015: Managing integration for better jobs and shared prosperity 10 7
Annexes
Annex A: The CGE model1
The computable general equilibrium (CGE) model used in this report to assess the welfare and labour market impact of ASEAN economic integration initiatives is based on a global general equilibrium model developed by Dominique van der Mensbrugghe and Fan Zhai.2 The model has its intellectual roots in a long tradition of multi-country, applied general equilibrium models.3 A novel feature of the model is its incorporation of recent innovations in heterogeneous-firms trade theory into an empirical global CGE framework. The model features intra-industry firm heterogeneity in productivity and the fixed costs of exporting, enabling the investigation of the intra-industry reallocation of resources and the exporting decision by firms, and thereby capturing both the intensive and extensive margin of trade. The model is described in detail below.
A. Basics of the CGE model
1. Production and tradeAgriculture, mining and government services sectors are assumed to exhibit perfect competition. In each of these sectors, a representative firm operates under constant returns-to-scale technology. Trade is modelled using the Armington assumption for import demand. Manufacturing and private services are character-ized by monopolistic competition, and their structure of production and trade follows the seminal Melitz approach.4 Each sector with monopolistic competition consists of a continuum of firms that are differenti-ated by the varieties they produce and their productivity. Firms face fixed production costs, resulting in increasing returns to scale. There are also fixed costs and variable costs associated with exporting activi-ties. On the demand side, agents have Dixit-Stiglitz preference over the continuum of varieties. As each firm is a monopolist for the variety it produces, it sets the price of its product at a constant mark-up over marginal cost. A firm enters domestic or export markets if and only if the net profit generated from such sales is sufficient to cover fixed cost. This zero cut-off profit condition defines the productivity thresholds for a firm’s entering domestic and exports markets, and in turn determines the equilibrium distribution of
1 ThisannexisbasedonM.Plummer,P.PetriandF.Zhai:Assessing the impacts of ASEAN integration on labour markets, background paper for ASEAN Community 2015: Managing integration for better jobs and shared prosperity (Bangkok, ILO, forthcoming).
2 D.vanderMensbrugghe:LINKAGE Technical reference document: Version 6.0 (Washington,DC,WorldBank,2005);F.Zhai:“ArmingtonmeetsMelitz: Introducingfirmheterogeneity in aglobalCGEmodelof trade”, in Journal of Economic Integration (2008,Vol.23,No.1,Sep.),pp.575-604.
3 SeeforexampleJ.B.ShovenandJ.Whalley:Applying general equilibrium(Cambridge,CambridgeUniversityPress,1992);T.Hertel:Global trade analysis: Modeling and applications(NewYork,CambridgeUniversityPress,1997).
4 M.Melitz:“Theimpactoftradeonintra-industryreallocationsandaggregateindustryproductivity”,inEconometrica(2003,Vol.71,No.6),pp.1695-1725.
Annex A
: The C
GE
mod
el
ASEAN Community 2015: Managing integration for better jobs and shared prosperity10 8
non-exporting firms and exporting firms, as well as their average productivities. Usually, the combination of a fixed export cost and a variable (iceberg) export cost ensures that the exporting productivity threshold is higher than that for production for domestic market, so that only a fraction of firms with high productivity export. These firms supply for both domestic and export markets. The number of firms in the monopolistic sectors is assumed to be fixed.
Production technology in each sector is modelled using nested constant elasticity of substitution (CES) functions. At the top level, the output is produced as a combination of aggregate non-energy intermediate demand and a value added-energy bundle. At the second level, non-energy aggregate intermediate demand is split into each commodity according to a Leontief technology. The value added-energy bundle is produced by a capital-land-energy bundle and aggregate labour. The capital-land-energy bundle is further decomposed into capital-land bundle and aggregate energy. Finally, at the bottom level, aggregate labour is decomposed into unskilled and skilled labour, and the capital-land bundle is decomposed into capital and land (for the agriculture sector) or natural resources (for forestry, fishing and mining sectors). The energy composite good is subsequently decomposed into various fuel components (for example coal, oil, and gas) where relevant. At each level of production, there is a unit cost function that is dual to the CES aggregator function and demand functions for corresponding inputs. The top-level unit cost function defines the marginal cost of sectoral output.
In the six ASEAN Member States for which micro-data files of labour force surveys were made avail-able (Cambodia, Indonesia, Lao People’s Democratic Republic, Philippines, Thailand and Viet Nam), at the second level of the production structure, the value-added cum energy bundle is decomposed into less-skilled aggregate labour on the one hand, and a capital-land-energy bundle on the other hand. The capital bundle is split into its human (or skilled labour) and physical capital components, and the less-skilled aggregate labour is composed of semi-skilled and unskilled labour.
2. Income distribution, demand and factor marketsIncomes generated from production accrue to a single representative household in each region. A household maximizes utility using Extended Linear Expenditure System (ELES), which is derived from maximizing theStone-Gearyutilityfunction.Theconsumption/savingsdecisioniscompletelystatic.Savingsentertheutility function as a good and its price is set as equal to the average price of consumer goods. Investment demand and government consumption are specified as a Leontief function. In each sector a composite good defined by the Dixit-Stiglitz aggregator over domestic and imported varieties is used for final and interme-diate demand.
There are five primary factors of production. Capital, agricultural land and labour are fully mobile across sectors within a region. In natural resource sectors of forestry, fishing and mining, a sector-specific factor is introduced into the production function to reflect the resource constraints. In each period the aggregate capital stock is predetermined by the investment and savings decision of the previous periods. The supply of land and sector-specific factors is assumed to be elastic, with response to the changes in their respective prices.
The model differs from most other CGE approaches, including an earlier work by Peter Petri, Michael
Annex A
: The C
GE
mod
el
ASEAN Community 2015: Managing integration for better jobs and shared prosperity 10 9
Plummer and Fan Zhai, in the treatment of labour markets.5 Usually the supply of labour is assumed to be fixed and its market is cleared through wage adjustment. However, for the six ASEAN Member States, persistent unemployment for some categories of workers is assumed. The ASEAN economies are differenti-ated from other regions by distinguishing three labour supply mechanisms according to different skill levels. Specially, in the six ASEAN Member States, the supply of skilled labour is fixed in each period, given the tight markets for skilled labour in the region. For unskilled labour, infinite supply and a fixed real wage rate is assumed to reflect the persistent large-scale underemployment in this category of labour in most ASEAN Member States. Semi-skilled labour falls between these extremes; hence, a constant-elasticity supply func-tion with a unitary elasticity of labour supply with respect to its real wage is assumed.
In this specification, shocks that make ASEAN firms more competitive internationally, including the policy changes modelled, enable firms to expand with less binding labour constraints than are typically imposed by CGE models. The employment of unskilled workers can expand without limit at constant wage rates, and the employment of semi-skilled workers can grow with only moderate wage increases. Unskilled and semi-skilled workers can in turn be substituted, to some extent, for skilled workers and other inputs whose supply is subject to conventional limits. In the simulations of integration alternatives, this modelling approach typically yields solid increases in output, trade and employment, as well as overall benefits in excess of the usual gains from trade.
3. Macro closureTherearethreemacroclosuresinthemodel:thenetgovernmentbalance,thetradebalance,andtheinvest-ment and savings balance. It is assumed that government consumption and saving are exogenous in real terms. Any changes in the government budget are automatically compensated by changes in income tax rates on households.
The second closure concerns the current account balance. In each region, the foreign savings are set exogenously. With the United States GDP deflator being chosen as the numéraire of the model, equilibrium in the foreign account is achieved by changing the relative price across regions, in other words, it is the real exchange rate.
Domestic investment is the endogenous sum of household savings, government savings and foreign savings. As government and foreign savings are exogenous, changes in investment are determined by changes in the levels of household saving. This closure rule corresponds to the neoclassical macroeconomic closure in the CGE literature.
4. Recursive dynamicsThe model is recursive dynamic, beginning with the base year of 2007 and solved annually through 2025. Dynamics of the model are driven by exogenous population and labour force growth, as well as capital accu-mulation and exogenous technological progress. Population and labour force projections are based on the United Nation’s medium-variant forecast. Technological progress is assumed to be labour-augmented, so the model can reach a steady state in the long run.
5 P. Petri, M.G. Plummer and F. Zhai: The Trans-Pacific Partrership and Asia-Pacific Integration: A quantitative assessment (Washington, DC, Peterson Institute for International Economics, 2012).
Annex A
: The C
GE
mod
el
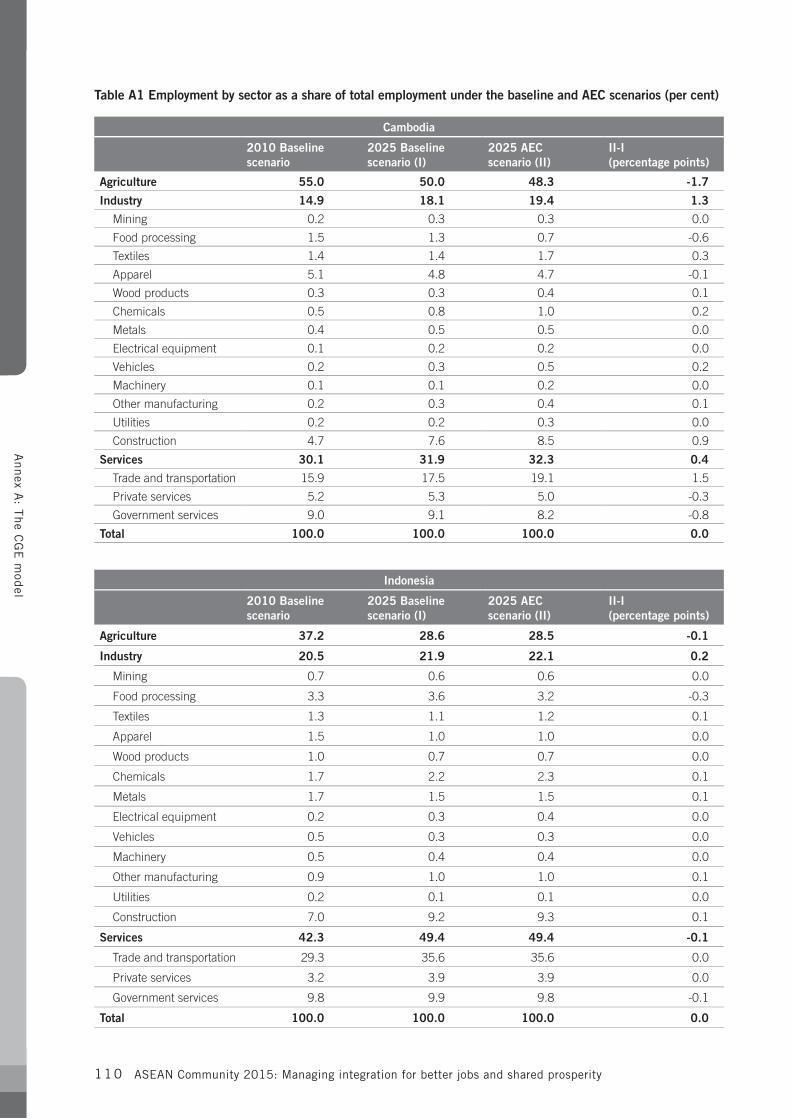
ASEAN Community 2015: Managing integration for better jobs and shared prosperity110
Table A1 Employment by sector as a share of total employment under the baseline and AEC scenarios (per cent)
Cambodia
2010 Baseline scenario
2025 Baselinescenario (I)
2025 AECscenario (II)
II-I (percentage points)
Agriculture 55.0 50.0 48.3 -1.7
Industry 14.9 18.1 19.4 1.3
Mining 0.2 0.3 0.3 0.0
Food processing 1.5 1.3 0.7 -0.6
Textiles 1.4 1.4 1.7 0.3
Apparel 5.1 4.8 4.7 -0.1
Wood products 0.3 0.3 0.4 0.1
Chemicals 0.5 0.8 1.0 0.2
Metals 0.4 0.5 0.5 0.0
Electrical equipment 0.1 0.2 0.2 0.0
Vehicles 0.2 0.3 0.5 0.2
Machinery 0.1 0.1 0.2 0.0
Other manufacturing 0.2 0.3 0.4 0.1
Utilities 0.2 0.2 0.3 0.0
Construction 4.7 7.6 8.5 0.9
Services 30.1 31.9 32.3 0.4
Trade and transportation 15.9 17.5 19.1 1.5
Private services 5.2 5.3 5.0 -0.3
Government services 9.0 9.1 8.2 -0.8
Total 100.0 100.0 100.0 0.0
Indonesia
2010 Baseline scenario
2025 Baselinescenario (I)
2025 AECscenario (II)
II-I (percentage points)
Agriculture 37.2 28.6 28.5 -0.1
Industry 20.5 21.9 22.1 0.2
Mining 0.7 0.6 0.6 0.0
Food processing 3.3 3.6 3.2 -0.3
Textiles 1.3 1.1 1.2 0.1
Apparel 1.5 1.0 1.0 0.0
Wood products 1.0 0.7 0.7 0.0
Chemicals 1.7 2.2 2.3 0.1
Metals 1.7 1.5 1.5 0.1
Electrical equipment 0.2 0.3 0.4 0.0
Vehicles 0.5 0.3 0.3 0.0
Machinery 0.5 0.4 0.4 0.0
Other manufacturing 0.9 1.0 1.0 0.1
Utilities 0.2 0.1 0.1 0.0
Construction 7.0 9.2 9.3 0.1
Services 42.3 49.4 49.4 -0.1
Trade and transportation 29.3 35.6 35.6 0.0
Private services 3.2 3.9 3.9 0.0
Government services 9.8 9.9 9.8 -0.1
Total 100.0 100.0 100.0 0.0
Annex A
: The C
GE
mod
el
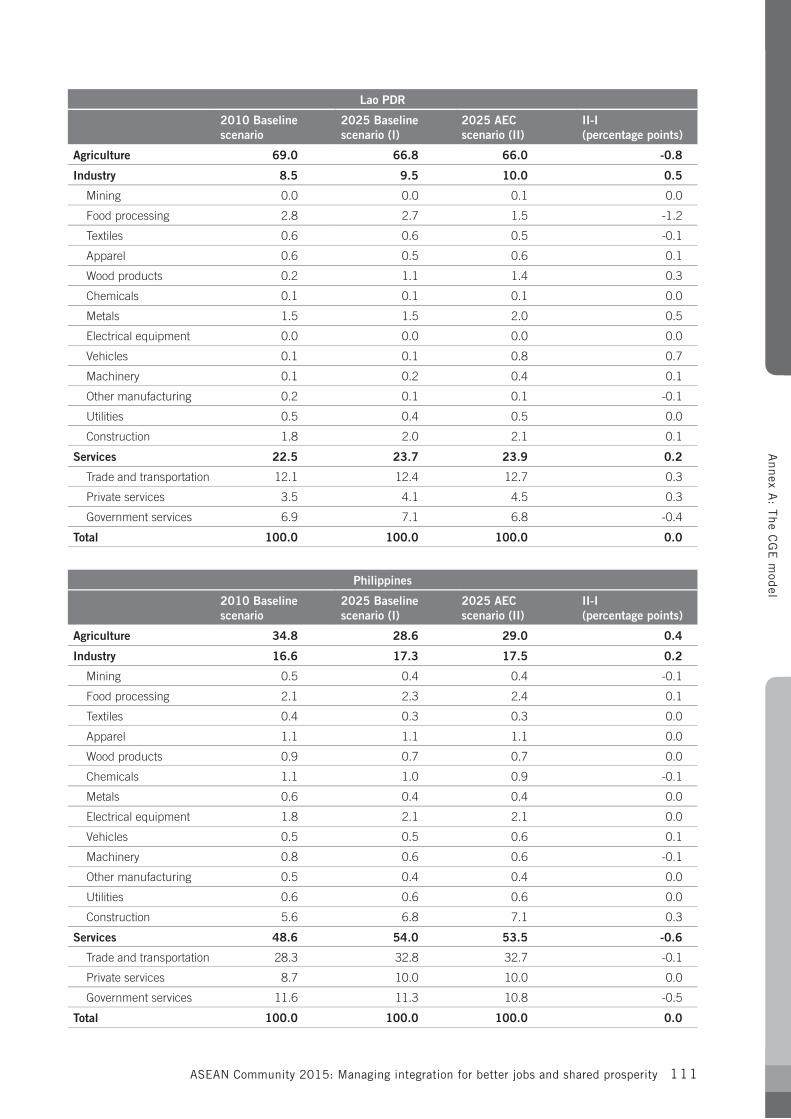
ASEAN Community 2015: Managing integration for better jobs and shared prosperity 111
Philippines
2010 Baseline scenario
2025 Baselinescenario (I)
2025 AECscenario (II)
II-I (percentage points)
Agriculture 34.8 28.6 29.0 0.4
Industry 16.6 17.3 17.5 0.2
Mining 0.5 0.4 0.4 -0.1
Food processing 2.1 2.3 2.4 0.1
Textiles 0.4 0.3 0.3 0.0
Apparel 1.1 1.1 1.1 0.0
Wood products 0.9 0.7 0.7 0.0
Chemicals 1.1 1.0 0.9 -0.1
Metals 0.6 0.4 0.4 0.0
Electrical equipment 1.8 2.1 2.1 0.0
Vehicles 0.5 0.5 0.6 0.1
Machinery 0.8 0.6 0.6 -0.1
Other manufacturing 0.5 0.4 0.4 0.0
Utilities 0.6 0.6 0.6 0.0
Construction 5.6 6.8 7.1 0.3
Services 48.6 54.0 53.5 -0.6
Trade and transportation 28.3 32.8 32.7 -0.1
Private services 8.7 10.0 10.0 0.0
Government services 11.6 11.3 10.8 -0.5
Total 100.0 100.0 100.0 0.0
Lao PDR
2010 Baseline scenario
2025 Baselinescenario (I)
2025 AECscenario (II)
II-I (percentage points)
Agriculture 69.0 66.8 66.0 -0.8
Industry 8.5 9.5 10.0 0.5
Mining 0.0 0.0 0.1 0.0
Food processing 2.8 2.7 1.5 -1.2
Textiles 0.6 0.6 0.5 -0.1
Apparel 0.6 0.5 0.6 0.1
Wood products 0.2 1.1 1.4 0.3
Chemicals 0.1 0.1 0.1 0.0
Metals 1.5 1.5 2.0 0.5
Electrical equipment 0.0 0.0 0.0 0.0
Vehicles 0.1 0.1 0.8 0.7
Machinery 0.1 0.2 0.4 0.1
Other manufacturing 0.2 0.1 0.1 -0.1
Utilities 0.5 0.4 0.5 0.0
Construction 1.8 2.0 2.1 0.1
Services 22.5 23.7 23.9 0.2
Trade and transportation 12.1 12.4 12.7 0.3
Private services 3.5 4.1 4.5 0.3
Government services 6.9 7.1 6.8 -0.4
Total 100.0 100.0 100.0 0.0
Annex A
: The C
GE
mod
el
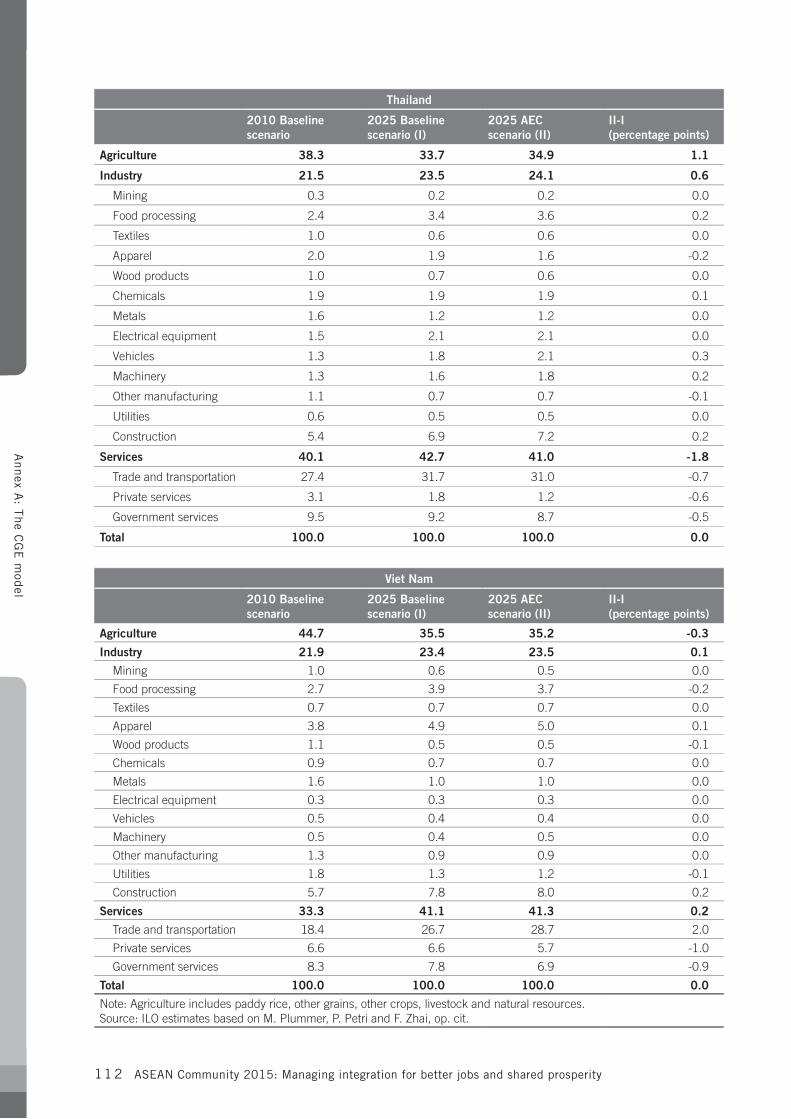
ASEAN Community 2015: Managing integration for better jobs and shared prosperity11 2
Viet Nam
2010 Baseline scenario
2025 Baselinescenario (I)
2025 AECscenario (II)
II-I (percentage points)
Agriculture 44.7 35.5 35.2 -0.3
Industry 21.9 23.4 23.5 0.1
Mining 1.0 0.6 0.5 0.0
Food processing 2.7 3.9 3.7 -0.2
Textiles 0.7 0.7 0.7 0.0
Apparel 3.8 4.9 5.0 0.1
Wood products 1.1 0.5 0.5 -0.1
Chemicals 0.9 0.7 0.7 0.0
Metals 1.6 1.0 1.0 0.0
Electrical equipment 0.3 0.3 0.3 0.0
Vehicles 0.5 0.4 0.4 0.0
Machinery 0.5 0.4 0.5 0.0
Other manufacturing 1.3 0.9 0.9 0.0
Utilities 1.8 1.3 1.2 -0.1
Construction 5.7 7.8 8.0 0.2
Services 33.3 41.1 41.3 0.2
Trade and transportation 18.4 26.7 28.7 2.0
Private services 6.6 6.6 5.7 -1.0
Government services 8.3 7.8 6.9 -0.9
Total 100.0 100.0 100.0 0.0
Note: Agriculture includes paddy rice, other grains, other crops, livestock and natural resources.Source: ILO estimates based on M. Plummer, P. Petri and F. Zhai, op. cit.
Thailand
2010 Baseline scenario
2025 Baselinescenario (I)
2025 AECscenario (II)
II-I (percentage points)
Agriculture 38.3 33.7 34.9 1.1
Industry 21.5 23.5 24.1 0.6
Mining 0.3 0.2 0.2 0.0
Food processing 2.4 3.4 3.6 0.2
Textiles 1.0 0.6 0.6 0.0
Apparel 2.0 1.9 1.6 -0.2
Wood products 1.0 0.7 0.6 0.0
Chemicals 1.9 1.9 1.9 0.1
Metals 1.6 1.2 1.2 0.0
Electrical equipment 1.5 2.1 2.1 0.0
Vehicles 1.3 1.8 2.1 0.3
Machinery 1.3 1.6 1.8 0.2
Other manufacturing 1.1 0.7 0.7 -0.1
Utilities 0.6 0.5 0.5 0.0
Construction 5.4 6.9 7.2 0.2
Services 40.1 42.7 41.0 -1.8
Trade and transportation 27.4 31.7 31.0 -0.7
Private services 3.1 1.8 1.2 -0.6
Government services 9.5 9.2 8.7 -0.5
Total 100.0 100.0 100.0 0.0
Annex A
: The C
GE
mod
el
ASEAN Community 2015: Managing integration for better jobs and shared prosperity 11 3
Annex B: Occupational Projections Model6
The occupational projections model employed in this report follows the widely used Manpower Requirements Approachtoprojectoccupationalimbalances,whichinvolvesthreestages:(i)projectingoccupationaldemand;(ii)projecting occupational supply; and (iii) comparing demand and supply to identify potential imbalances.
Therearetwocomponentstooccupationaldemand:expansiondemandattributabletogrowthinsectoraloutputandemploymentand/orshifts in theoccupational structuresof industries,andreplacementdemand,attributable to factors such as deaths, retirements, inter-occupational and geographical labour mobility, among others. To project expansion demand by occupation, trends in the occupational distribution of industries over time, obtained from the labour force survey (LFS) micro-data files, are assumed to continue into the future. Specifically, the industry-occupation coefficients are allowed to change over time using two approaches (using a linear and a log-linear regression) whereby time is used as a proxy for technological change. The result of the two approaches, as well as the coefficients of the last year of available LFS are applied to the CGE model sectoral employment results to obtain a range of projected expansion demand (stock measure) by occupation in 2025. The difference between the projected stock measure in 2025 and the corresponding occupational employment in 2010 is calculated to obtain the projected flow measure of expansion demand over the forecast period.
Replacement demand, the second component of occupational demand, is not always included in occupa-tional projections, due to difficulties in assembling the required data (labour market outflows and transitions, including retirements, occupational mobility, and others). There are methods with less restrictive data require-ments, which for instance use age-cohorts to estimate retirements by occupation and exclude transitions from one occupation to another. For the purpose of this paper, a simplistic version of these methods is used, which involves using the share of workers aged 65 years and older for each occupation as an estimate of replacement demand for this occupation. Total occupation demand is then obtained as a sum of the two components.
On the supply side, trends in educational attainment of the labour force for each demographic group are applied to the estimated labour force figures in 2025, and education-to-occupation matrix coefficients (occupa-tional share of workers for each level of educational attainment), which are also allowed to change over time using a similar approach as for the industry-occupation coefficients. This provides a range for the projected occupational supply (stock measure) in 2025. The difference between the stock measure of occupational supply in 2025 and the estimate of occupational supply stock in 2010 is obtained as a measure of the flow measure of occupational supply.
The range of projected occupational demand and supply flow measures are compared to identify occupations withprojectedlabourmarketimbalances(excesslabourdemand/supply)foreachcountry.Notethatcomparedto the baseline, the projected occupational demand under the AEC differs due to a change in expansion demand (replacement demand is assumed to stay constant), and labour supply changes only because of the change in labour force size (participation rates). Two measures of skills mismatch are also obtained, to provide complemen-tary information regarding labour imbalances.
6 ThisannexisbasedonS.ElAchkarHilal:The impact of ASEAN economic integration on occupational outlooks and skills demand, background paper for ASEAN Community 2015: Managing integration for better jobs and shared prosperity (Bangkok, ILO, forthcoming).
Annex B
: Occu
pation
al Projection
s Mod
el
ASEAN Community 2015: Managing integration for better jobs and shared prosperity114
Annex C: Survey of ASEAN employers
TheILO,throughitsBureauforEmployers’Activities(ACT/EMP),commissionedasurveyofemployers,industry leaders and development experts throughout the ASEAN region to gather insights with respect to skills, labour mobility and enterprise competitiveness associated with integration under the AEC. The survey wasconductedinOctoberandNovember2013bytheconsultingfirmEmergingMarketsConsulting.
The survey methodology consisted of two parts. First, the quantitative survey aimed at capturing the perceptions of private sector companies and employers organizations on three dimensions: (i) needs ofenterprises in terms of employee skill sets and how these needs are being met by local education providers; (ii) perceptions of ASEAN integration, in terms of their understanding of it, and of the opportunities and challenges employers believe they will face; and (iii) how enterprises think their competitiveness will change once the AEC is in place, and the strategic moves they will utilize to react to these changes.
The second part was a qualitative survey to supplement the quantitative data. The respondents of the qualitative survey included diverse experts and leaders from complementary backgrounds in the ASEAN region. The interview questions addressed the same dimensions investigated by the quantitative survey and questioned recipients on their opinions regarding primary findings extracted from the quantitative survey.
Some240businessleadersfromenterprisesandbusinessassociationsspanningalltenASEANMemberStates participated in the quantitative survey, while an additional five respondents were selected for the qualitative expert interviews. The majority of the respondents originated from Cambodia, Indonesia, Lao People’s Democratic Republic, Malaysia, Myanmar, Philippines, and Singapore. The response rates for Brunei Darussalam, Thailand, and Viet Nam were very low and therefore regional averages of survey responses do not include these countries.
Most of the respondents were active in the manufacturing industry (20.0 per cent), followed by services (17.0 per cent), finance and insurance (ten per cent) and information and communication (ten per cent). Over 80 per cent of these employers represented either privately owned domestic enterprises or wholly foreign-owned firms. The participants worked for mainly mature establishments with an average opera-tional age of 22 years. Companies were contacted via their affiliation to industry associations, chambers of commerce, business directories and country-specific business networks. These types of establishments tend tobelargerfirms.Forty-onepercentoftheorganizationssurveyedemployedover300employeesand32.0percentemployedbetween50and300staffmembers.
In sum, the survey consisted of a broad cross-section of respondents from different sectors and coun-tries across the ASEAN region. However, while the findings give important insights into the perceptions of enterprises, they are not necessarily fully representative for the entire business community in ASEAN. They should therefore be treated as indicative of the views of only those who participated in the study.
Annex C
: Survey of A
SE
AN
employers
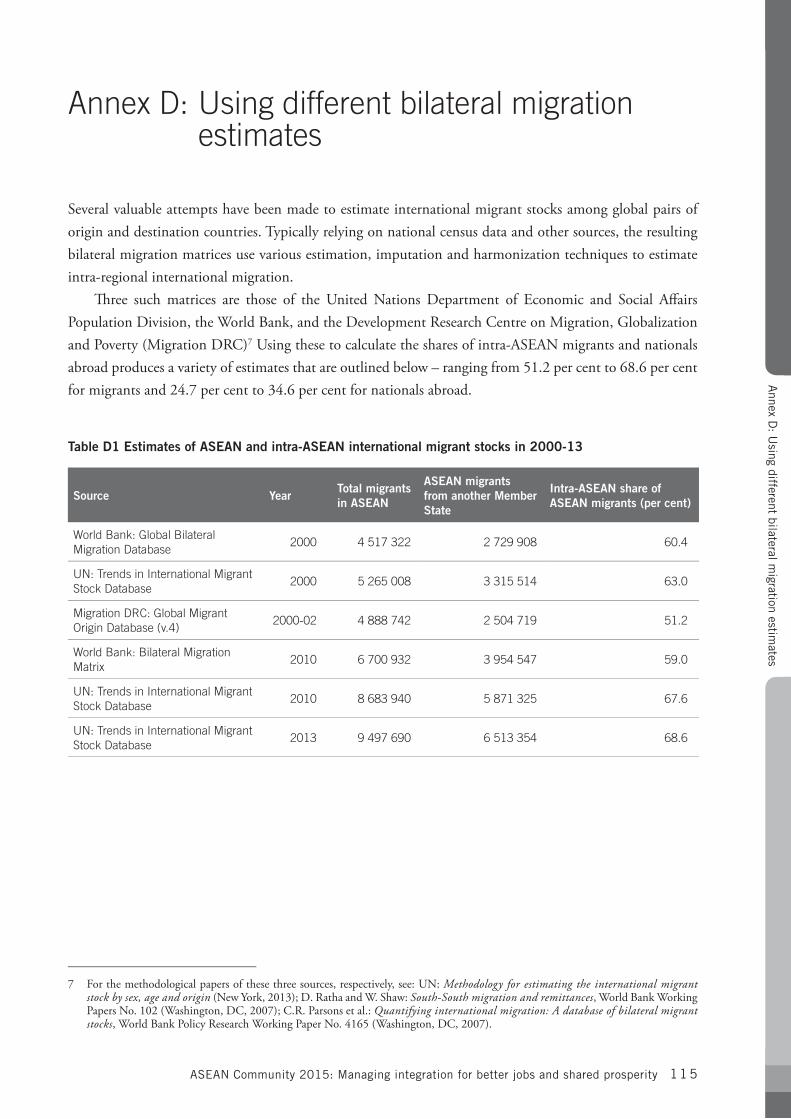
ASEAN Community 2015: Managing integration for better jobs and shared prosperity 115
Annex D: Using different bilateral migration estimates
Several valuable attempts have been made to estimate international migrant stocks among global pairs of origin and destination countries. Typically relying on national census data and other sources, the resulting bilateral migration matrices use various estimation, imputation and harmonization techniques to estimate intra-regional international migration.
Three such matrices are those of the United Nations Department of Economic and Social Affairs Population Division, the World Bank, and the Development Research Centre on Migration, Globalization and Poverty (Migration DRC)7 Using these to calculate the shares of intra-ASEAN migrants and nationals abroad produces a variety of estimates that are outlined below – ranging from 51.2 per cent to 68.6 per cent formigrantsand24.7percentto34.6percentfornationalsabroad.
Table D1 Estimates of ASEAN and intra-ASEAN international migrant stocks in 2000-13
Source YearTotal migrants in ASEAN
ASEAN migrants from another Member State
Intra-ASEAN share of ASEAN migrants (per cent)
World Bank: Global Bilateral Migration Database
2000 4 517 322 2 729 908 60.4
UN: Trends in International Migrant Stock Database
2000 5 265 008 3 315 514 63.0
Migration DRC: Global Migrant Origin Database (v.4)
2000-02 4 888 742 2 504 719 51.2
World Bank: Bilateral Migration Matrix
2010 6 700 932 3 954 547 59.0
UN: Trends in International Migrant Stock Database
2010 8 683 940 5 871 325 67.6
UN: Trends in International Migrant Stock Database
2013 9 497 690 6 513 354 68.6
7 Forthemethodologicalpapersofthesethreesources,respectively,see:UN:Methodology for estimating the international migrant stock by sex, age and origin(NewYork,2013);D.RathaandW.Shaw:South-South migration and remittances, World Bank Working PapersNo.102(Washington,DC,2007);C.R.Parsonsetal.:Quantifying international migration: A database of bilateral migrant stocks,WorldBankPolicyResearchWorkingPaperNo.4165(Washington,DC,2007).
Annex D
: Using different bilateral m
igration estimates
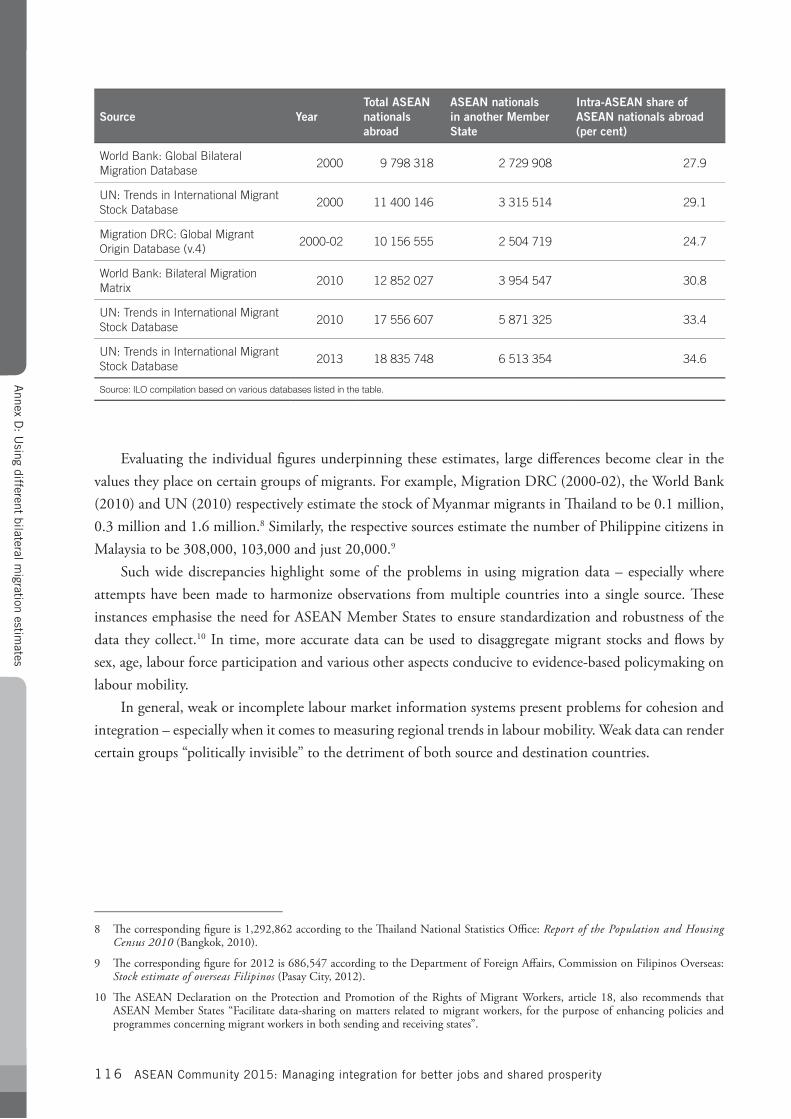
ASEAN Community 2015: Managing integration for better jobs and shared prosperity116
Source YearTotal ASEAN nationals abroad
ASEAN nationals in another Member State
Intra-ASEAN share of ASEAN nationals abroad (per cent)
World Bank: Global Bilateral Migration Database
2000 9 798 318 2 729 908 27.9
UN: Trends in International Migrant Stock Database
2000 11 400 146 3 315 514 29.1
Migration DRC: Global Migrant Origin Database (v.4)
2000-02 10 156 555 2 504 719 24.7
World Bank: Bilateral Migration Matrix
2010 12 852 027 3 954 547 30.8
UN: Trends in International Migrant Stock Database
2010 17 556 607 5 871 325 33.4
UN: Trends in International Migrant Stock Database
2013 18 835 748 6 513 354 34.6
Source: ILO compilation based on various databases listed in the table.
Evaluating the individual figures underpinning these estimates, large differences become clear in the values they place on certain groups of migrants. For example, Migration DRC (2000-02), the World Bank (2010) and UN (2010) respectively estimate the stock of Myanmar migrants in Thailand to be 0.1 million, 0.3millionand1.6million.8 Similarly, the respective sources estimate the number of Philippine citizens in Malaysiatobe308,000,103,000andjust20,000.9
Such wide discrepancies highlight some of the problems in using migration data – especially where attempts have been made to harmonize observations from multiple countries into a single source. These instances emphasise the need for ASEAN Member States to ensure standardization and robustness of the data they collect.10 In time, more accurate data can be used to disaggregate migrant stocks and flows by sex, age, labour force participation and various other aspects conducive to evidence-based policymaking on labour mobility.
In general, weak or incomplete labour market information systems present problems for cohesion and integration – especially when it comes to measuring regional trends in labour mobility. Weak data can render certain groups “politically invisible” to the detriment of both source and destination countries.
8 Thecorrespondingfigureis1,292,862accordingtotheThailandNationalStatisticsOffice:Report of the Population and Housing Census 2010 (Bangkok, 2010).
9 Thecorrespondingfigurefor2012is686,547accordingtotheDepartmentofForeignAffairs,CommissiononFilipinosOverseas:Stock estimate of overseas Filipinos (Pasay City, 2012).
10 The ASEAN Declaration on the Protection and Promotion of the Rights of Migrant Workers, article 18, also recommends that ASEAN Member States “Facilitate data-sharing on matters related to migrant workers, for the purpose of enhancing policies and programmes concerning migrant workers in both sending and receiving states”.
Annex D
: Using different bilateral m
igration estimates
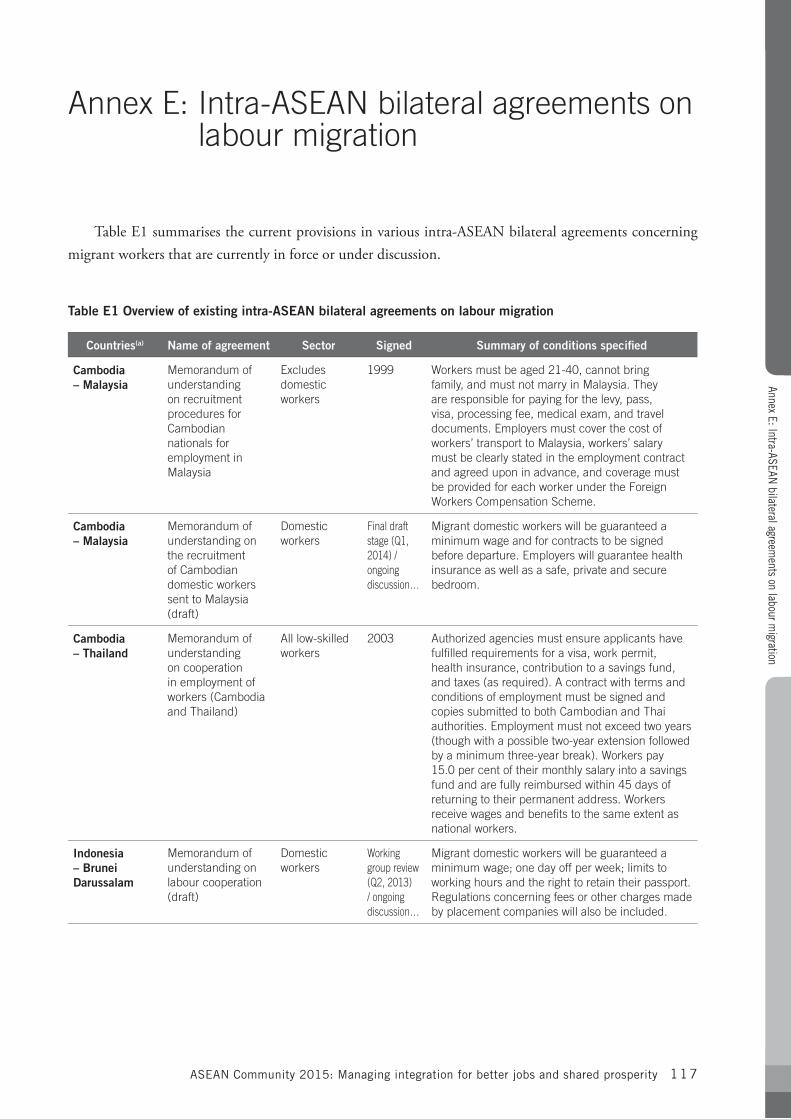
ASEAN Community 2015: Managing integration for better jobs and shared prosperity 117
Annex E: Intra-ASEAN bilateral agreements on labour migration
Table E1 summarises the current provisions in various intra-ASEAN bilateral agreements concerning migrant workers that are currently in force or under discussion.
Table E1 Overview of existing intra-ASEAN bilateral agreements on labour migration
Countries(a) Name of agreement Sector Signed Summary of conditions specified
Cambodia – Malaysia
Memorandum of understanding on recruitment procedures for Cambodian nationals for employment in Malaysia
Excludes domestic workers
1999 Workers must be aged 21-40, cannot bring family, and must not marry in Malaysia. They are responsible for paying for the levy, pass, visa, processing fee, medical exam, and travel documents. Employers must cover the cost of workers’ transport to Malaysia, workers’ salary must be clearly stated in the employment contract and agreed upon in advance, and coverage must be provided for each worker under the Foreign Workers Compensation Scheme.
Cambodia – Malaysia
Memorandum of understanding on the recruitment of Cambodian domestic workers sent to Malaysia (draft)
Domestic workers
Final draft stage (Q1, 2014) / ongoing discussion…
Migrant domestic workers will be guaranteed a minimum wage and for contracts to be signed before departure. Employers will guarantee health insurance as well as a safe, private and secure bedroom.
Cambodia – Thailand
Memorandum of understanding on cooperation in employment of workers (Cambodia and Thailand)
All low-skilled workers
2003 Authorized agencies must ensure applicants have fulfilled requirements for a visa, work permit, health insurance, contribution to a savings fund, and taxes (as required). A contract with terms and conditions of employment must be signed and copies submitted to both Cambodian and Thai authorities. Employment must not exceed two years (though with a possible two-year extension followed by a minimum three-year break). Workers pay 15.0 per cent of their monthly salary into a savings fund and are fully reimbursed within 45 days of returning to their permanent address. Workers receive wages and benefits to the same extent as national workers.
Indonesia – Brunei Darussalam
Memorandum of understanding on labour cooperation (draft)
Domestic workers
Working group review (Q2, 2013) / ongoing discussion…
Migrant domestic workers will be guaranteed a minimum wage; one day off per week; limits to working hours and the right to retain their passport. Regulations concerning fees or other charges made by placement companies will also be included.
Annex E: Intra-ASEAN bilateral agreem
ents on labour migration
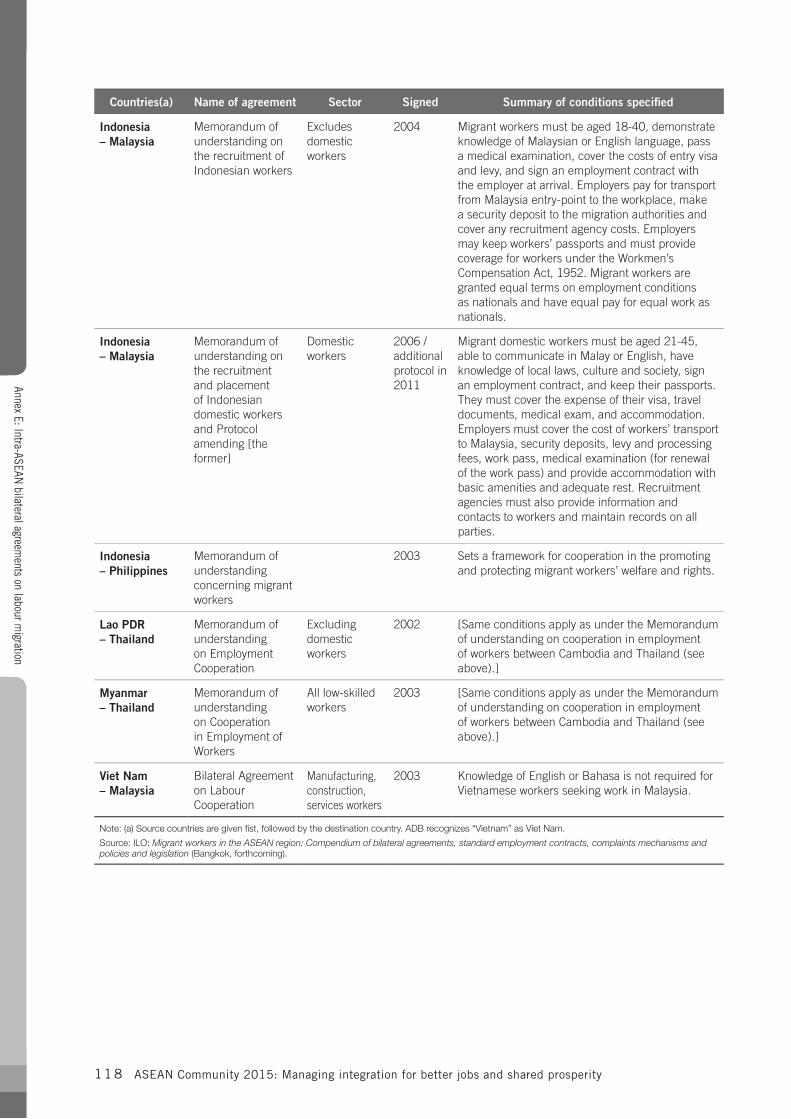
ASEAN Community 2015: Managing integration for better jobs and shared prosperity11 8
Countries(a) Name of agreement Sector Signed Summary of conditions specified
Indonesia – Malaysia
Memorandum of understanding on the recruitment of Indonesian workers
Excludes domestic workers
2004 Migrant workers must be aged 18-40, demonstrate knowledge of Malaysian or English language, pass a medical examination, cover the costs of entry visa and levy, and sign an employment contract with the employer at arrival. Employers pay for transport from Malaysia entry-point to the workplace, make a security deposit to the migration authorities and cover any recruitment agency costs. Employers may keep workers’ passports and must provide coverage for workers under the Workmen’s Compensation Act, 1952. Migrant workers are granted equal terms on employment conditions as nationals and have equal pay for equal work as nationals.
Indonesia – Malaysia
Memorandum of understanding on the recruitment and placement of Indonesian domestic workers and Protocol amending [the former]
Domestic workers
2006 / additional protocol in 2011
Migrant domestic workers must be aged 21-45, able to communicate in Malay or English, have knowledge of local laws, culture and society, sign an employment contract, and keep their passports. They must cover the expense of their visa, travel documents, medical exam, and accommodation. Employers must cover the cost of workers’ transport to Malaysia, security deposits, levy and processing fees, work pass, medical examination (for renewal of the work pass) and provide accommodation with basic amenities and adequate rest. Recruitment agencies must also provide information and contacts to workers and maintain records on all parties.
Indonesia – Philippines
Memorandum of understanding concerning migrant workers
2003 Sets a framework for cooperation in the promoting and protecting migrant workers’ welfare and rights.
Lao PDR – Thailand
Memorandum of understanding on Employment Cooperation
Excluding domestic workers
2002 [Same conditions apply as under the Memorandum of understanding on cooperation in employment of workers between Cambodia and Thailand (see above).]
Myanmar – Thailand
Memorandum of understanding on Cooperation in Employment of Workers
All low-skilled workers
2003 [Same conditions apply as under the Memorandum of understanding on cooperation in employment of workers between Cambodia and Thailand (see above).]
Viet Nam – Malaysia
Bilateral Agreement on Labour Cooperation
Manufacturing, construction, services workers
2003 Knowledge of English or Bahasa is not required for Vietnamese workers seeking work in Malaysia.
Note: (a) Source countries are given fist, followed by the destination country. ADB recognizes “Vietnam” as Viet Nam.
Source: ILO: Migrant workers in the ASEAN region: Compendium of bilateral agreements, standard employment contracts, complaints mechanisms and policies and legislation (Bangkok, forthcoming).
Annex E: Intra-ASEAN bilateral agreem
ents on labour migration
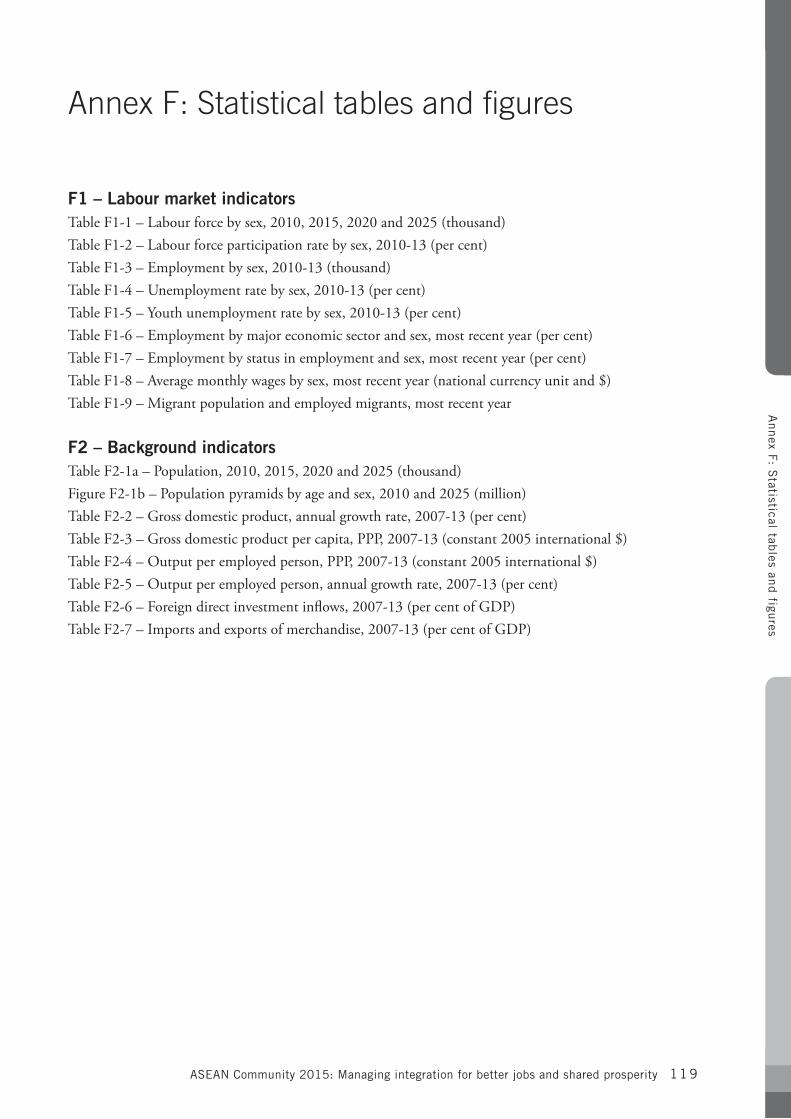
ASEAN Community 2015: Managing integration for better jobs and shared prosperity 119
Annex F: Statistical tables and figures
F1 – Labour market indicatorsTable F1-1 – Labour force by sex, 2010, 2015, 2020 and 2025 (thousand)TableF1-2–Labourforceparticipationratebysex,2010-13(percent)TableF1-3–Employmentbysex,2010-13(thousand)TableF1-4–Unemploymentratebysex,2010-13(percent)TableF1-5–Youthunemploymentratebysex,2010-13(percent)Table F1-6 – Employment by major economic sector and sex, most recent year (per cent)Table F1-7 – Employment by status in employment and sex, most recent year (per cent) Table F1-8 – Average monthly wages by sex, most recent year (national currency unit and $)TableF1-9–Migrantpopulationandemployedmigrants,mostrecentyear
F2 – Background indicatorsTable F2-1a – Population, 2010, 2015, 2020 and 2025 (thousand)Figure F2-1b – Population pyramids by age and sex, 2010 and 2025 (million)TableF2-2–Grossdomesticproduct,annualgrowthrate,2007-13(percent)TableF2-3–Grossdomesticproductpercapita,PPP,2007-13(constant2005international$)TableF2-4–Outputperemployedperson,PPP,2007-13(constant2005international$)TableF2-5–Outputperemployedperson,annualgrowthrate,2007-13(percent)TableF2-6–Foreigndirectinvestmentinflows,2007-13(percentofGDP)TableF2-7–Importsandexportsofmerchandise,2007-13(percentofGDP)
Annex F
: Statistical tab
les and figu
res
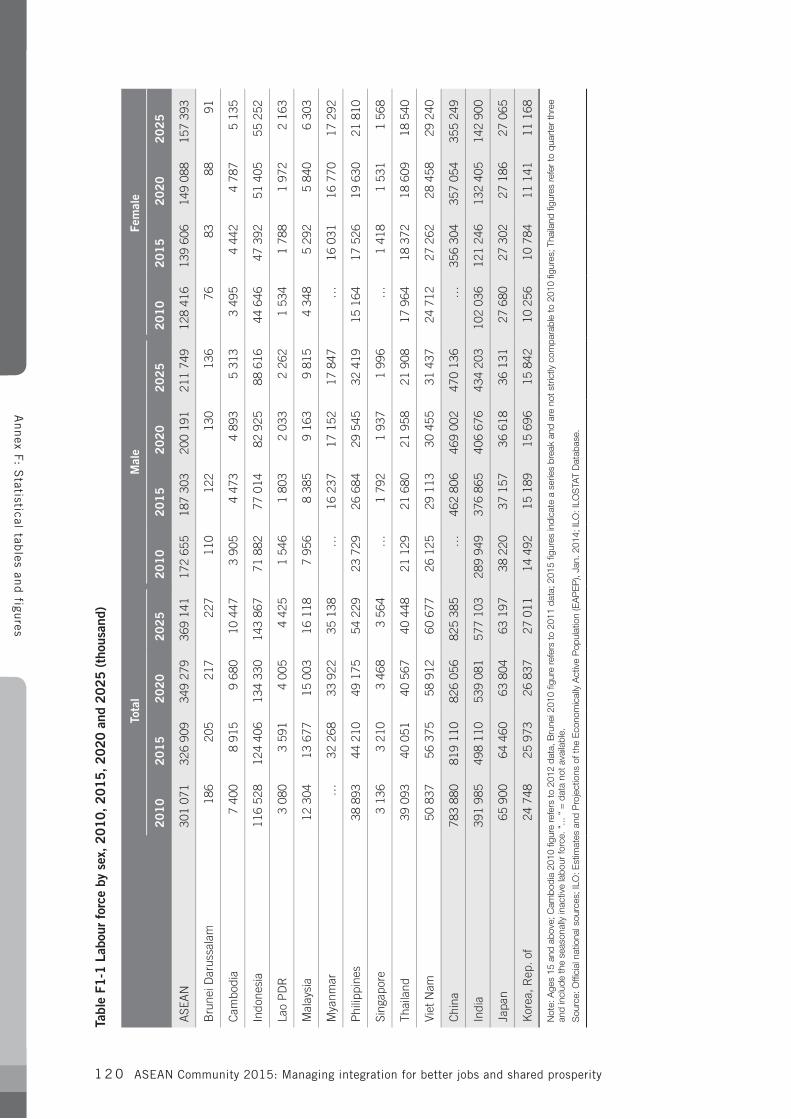
ASEAN Community 2015: Managing integration for better jobs and shared prosperity1 2 0
Tabl
e F1
-1 L
abou
r fo
rce
by s
ex, 2
010,
201
5, 2
020
and
2025
(th
ousa
nd)
Tota
lM
ale
Fem
ale
20
10
20
15
20
20
20
25
20
10
20
15
20
20
20
25
20
10
20
15
20
20
20
25
ASE
AN
301
071
326
909
349
279
369
141
172
655
187
303
200
191
211
749
128
416
139
606
149
088
157
393
Bru
nei D
arus
sala
m 1
86 2
05 2
17 2
27 1
10 1
22 1
30 1
36 7
6 8
3 8
8 9
1
Cam
bodi
a7
400
8 91
59
680
10 4
473
905
4 47
34
893
5 31
33
495
4 44
24
787
5 13
5
Indo
nesi
a11
6 52
812
4 40
613
4 33
014
3 86
771
882
77 0
1482
925
88 6
1644
646
47 3
9251
405
55 2
52
Lao
PD
R3
080
3 59
14
005
4 42
51
546
1 80
32
033
2 26
21
534
1 78
81
972
2 16
3
Mal
aysi
a12
304
13 6
7715
003
16 1
187
956
8 38
59
163
9 81
54
348
5 29
25
840
6 30
3
Mya
nmar
…32
268
33 9
2235
138
…16
237
17 1
5217
847
…16
031
16 7
7017
292
Phi
lippi
nes
38 8
9344
210
49 1
7554
229
23 7
2926
684
29 5
4532
419
15 1
6417
526
19 6
3021
810
Sing
apor
e3
136
3 21
03
468
3 56
4…
1 79
21
937
1 99
6…
1 41
81
531
1 56
8
Thai
land
39 0
9340
051
40 5
6740
448
21 1
2921
680
21 9
5821
908
17 9
6418
372
18 6
0918
540
Viet
Nam
50 8
3756
375
58 9
1260
677
26 1
2529
113
30 4
5531
437
24 7
1227
262
28 4
5829
240
Chi
na78
3 88
081
9 11
082
6 05
682
5 38
5…
46
2 80
646
9 00
247
0 13
6…
35
6 30
435
7 05
435
5 24
9
Indi
a39
1 98
549
8 11
053
9 08
157
7 10
328
9 94
937
6 86
540
6 67
643
4 20
310
2 03
612
1 24
613
2 40
514
2 90
0
Japa
n65
900
64 4
6063
804
63 1
9738
220
37 1
5736
618
36 1
3127
680
27 3
0227
186
27 0
65
Kor
ea, R
ep. o
f24
748
25 9
7326
837
27 0
1114
492
15 1
8915
696
15 8
4210
256
10 7
8411
141
11 1
68
Not
e: A
ges
15 a
nd a
bove
; Cam
bodi
a 20
10 fi
gure
refe
rs to
201
2 da
ta, B
rune
i 201
0 fig
ure
refe
rs to
201
1 da
ta; 2
015
figur
es in
dica
te a
ser
ies
brea
k an
d ar
e no
t str
ictly
com
para
ble
to 2
010
figur
es; T
haila
nd fi
gure
s re
fer
to q
uart
er th
ree
and
incl
ude
the
seas
onal
ly in
activ
e la
bour
forc
e. “
... “
= d
ata
not a
vaila
ble.
Sou
rce:
Offi
cial
nat
iona
l sou
rces
; ILO
: Est
imat
es a
nd P
roje
ctio
ns o
f the
Eco
nom
ical
ly A
ctiv
e P
opul
atio
n (E
AP
EP
), Ja
n. 2
014;
ILO
: ILO
STA
T D
atab
ase.
Annex F
: Statistical tab
les and figu
res
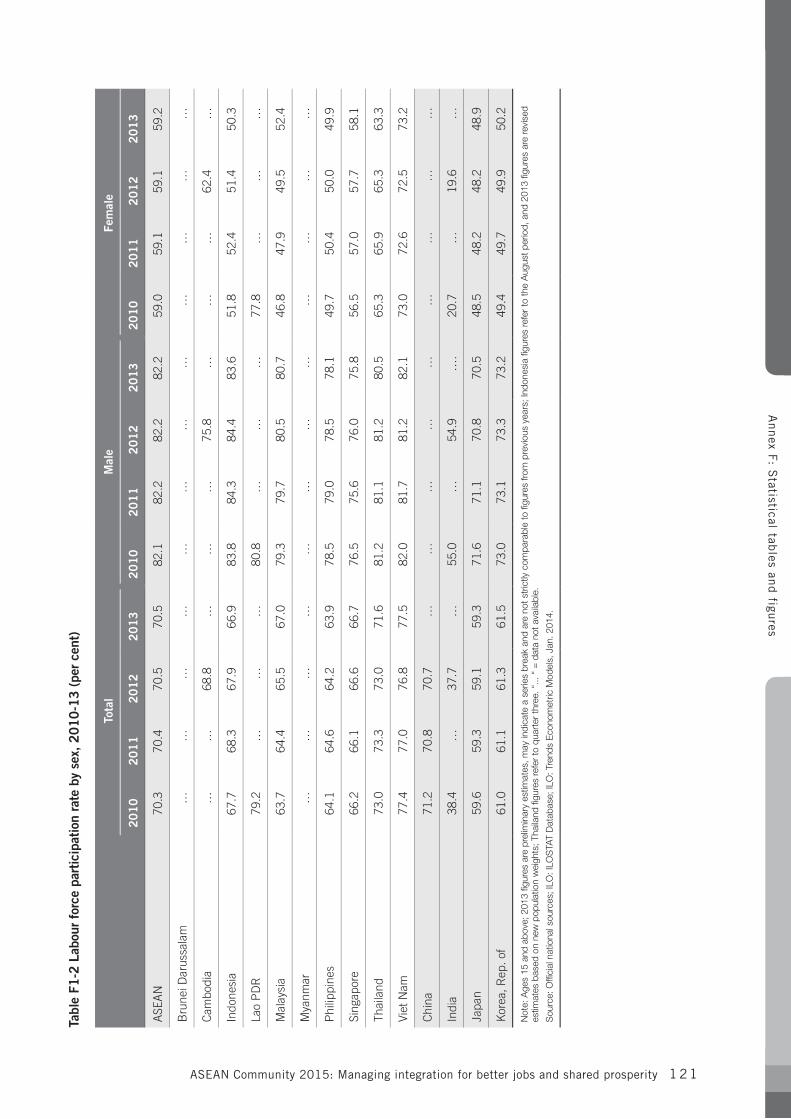
ASEAN Community 2015: Managing integration for better jobs and shared prosperity 1 21
Tabl
e F1
-2 L
abou
r fo
rce
part
icip
atio
n ra
te b
y se
x, 2
010-
13 (
per
cent
)
Tota
lM
ale
Fem
ale
20
10
20
11
20
12
20
13
20
10
20
11
20
12
20
13
20
10
20
11
20
12
20
13
ASE
AN
70.3
70
.4
70.5
70
.5
82.1
82
.2
82.2
82
.2
59.0
59
.1
59.1
59
.2
Bru
nei D
arus
sala
m…
……
……
……
……
……
…
Cam
bodi
a…
…68
.8
……
…75
.8
……
…62
.4
…
Indo
nesi
a67
.7
68.3
67
.9
66.9
83
.8
84.3
84
.4
83.6
51
.8
52.4
51
.4
50.3
Lao
PD
R79
.2
……
…80
.8
……
…77
.8
……
…
Mal
aysi
a63
.7
64.4
65
.5
67.0
79.3
79
.7
80.5
80
.746
.8
47.9
49
.5
52.4
Mya
nmar
……
……
……
……
……
……
Phi
lippi
nes
64.1
64
.6
64.2
63
.9
78.5
79
.0
78.5
78
.1
49.7
50
.4
50.0
49
.9
Sing
apor
e66
.2
66.1
66
.6
66.7
76
.5
75.6
76
.0
75.8
56
.5
57.0
57
.7
58.1
Thai
land
73.0
73
.3
73.0
71
.6
81.2
81
.1
81.2
80
.5
65.3
65
.9
65.3
63
.3
Viet
Nam
77.4
77
.0
76.8
77
.5
82.0
81
.7
81.2
82
.1
73.0
72
.6
72.5
73
.2
Chi
na71
.2
70.8
70
.7
……
……
……
……
…
Indi
a38
.4
…37
.7
…55
.0
…54
.9
….
20.7
…
19.6
…
Japa
n59
.6
59.3
59
.1
59.3
71
.6
71.1
70
.8
70.5
48
.5
48.2
48
.2
48.9
Kor
ea, R
ep. o
f61
.0
61.1
61
.3
61.5
73
.0
73.1
73
.3
73.2
49
.4
49.7
49
.9
50.2
Not
e: A
ges
15 a
nd a
bove
; 201
3 fig
ures
are
pre
limin
ary
estim
ates
, may
indi
cate
a s
erie
s br
eak
and
are
not s
tric
tly c
ompa
rabl
e to
figu
res
from
pre
viou
s ye
ars;
Indo
nesi
a fig
ures
refe
r to
the
Aug
ust p
erio
d, a
nd 2
013
figur
es a
re re
vise
d es
timat
es b
ased
on
new
pop
ulat
ion
wei
ghts
; Tha
iland
figu
res
refe
r to
qua
rter
thre
e. “
... “
= d
ata
not a
vaila
ble.
Sou
rce:
Offi
cial
nat
iona
l sou
rces
; ILO
: ILO
STA
T D
atab
ase;
ILO
: Tre
nds
Eco
nom
etric
Mod
els,
Jan
. 201
4.
Annex F
: Statistical tab
les and figu
res
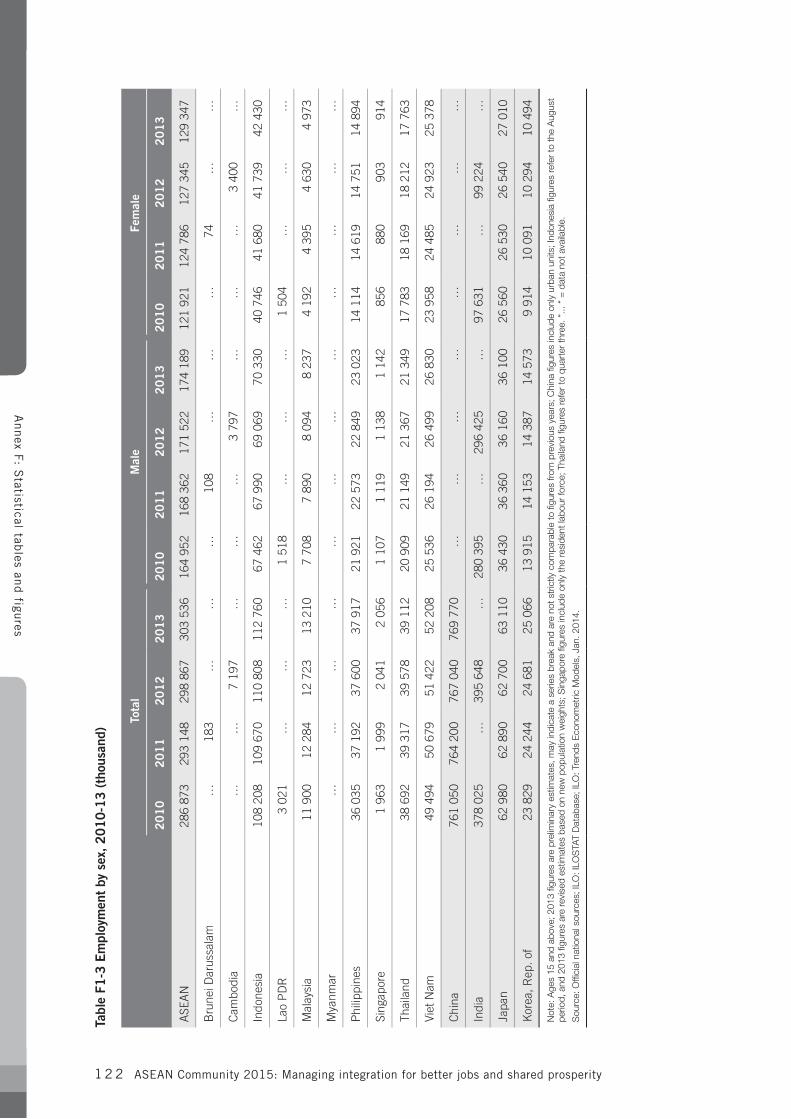
ASEAN Community 2015: Managing integration for better jobs and shared prosperity1 2 2
Tabl
e F1
-3 E
mpl
oym
ent
by s
ex, 2
010-
13 (
thou
sand
)
Tota
lM
ale
Fem
ale
20
10
20
11
20
12
20
13
20
10
20
11
20
12
20
13
20
10
20
11
20
12
20
13
ASE
AN
286
873
293
148
298
867
303
536
164
952
168
362
171
522
174
189
121
921
124
786
127
345
129
347
Bru
nei D
arus
sala
m…
1
83…
…
…
1
08…
…
…
74
…
…
Cam
bodi
a…
…7
197
…
……
3 79
7…
…
…3
400
…
Indo
nesi
a10
8 20
810
9 67
011
0 80
811
2 76
067
462
67 9
9069
069
70 3
3040
746
41 6
8041
739
42 4
30
Lao
PD
R3
021
……
…1
518
……
…1
504
……
…
Mal
aysi
a11
900
12 2
8412
723
13 2
107
708
7 89
08
094
8 23
74
192
4 39
54
630
4 97
3
Mya
nmar
…
…
…
…
…
…
…
…
…
…
…
…
Phi
lippi
nes
36 0
3537
192
37 6
0037
917
21 9
2122
573
22 8
4923
023
14 1
1414
619
14 7
5114
894
Sing
apor
e1
963
1 99
92
041
2 05
61
107
1 11
91
138
1 14
2 8
56 8
80 9
03 9
14
Thai
land
38 6
9239
317
39 5
7839
112
20 9
0921
149
21 3
6721
349
17 7
8318
169
18 2
1217
763
Viet
Nam
49 4
9450
679
51 4
2252
208
25 5
3626
194
26 4
9926
830
23 9
5824
485
24 9
2325
378
Chi
na76
1 05
076
4 20
076
7 04
076
9 77
0…
…
…
…
…
…
…
…
Indi
a37
8 02
5…
39
5 64
8…
28
0 39
5…
29
6 42
5…
97
631
…
99 2
24…
Japa
n62
980
62 8
9062
700
63 1
1036
430
36 3
6036
160
36 1
0026
560
26 5
3026
540
27 0
10
Kor
ea, R
ep. o
f23
829
24 2
4424
681
25 0
6613
915
14 1
5314
387
14 5
739
914
10 0
9110
294
10 4
94
Not
e: A
ges
15 a
nd a
bove
; 201
3 fig
ures
are
pre
limin
ary
estim
ates
, may
indi
cate
a s
erie
s br
eak
and
are
not s
tric
tly c
ompa
rabl
e to
figu
res
from
pre
viou
s ye
ars;
Chi
na fi
gure
s in
clud
e on
ly u
rban
uni
ts; I
ndon
esia
figu
res
refe
r to
the
Aug
ust
perio
d, a
nd 2
013
figur
es a
re re
vise
d es
timat
es b
ased
on
new
pop
ulat
ion
wei
ghts
; Sin
gapo
re fi
gure
s in
clud
e on
ly th
e re
side
nt la
bour
forc
e; T
haila
nd fi
gure
s re
fer
to q
uart
er th
ree.
“...
“ =
dat
a no
t ava
ilabl
e.
Sou
rce:
Offi
cial
nat
iona
l sou
rces
; ILO
: ILO
STA
T D
atab
ase;
ILO
: Tre
nds
Eco
nom
etric
Mod
els,
Jan
. 201
4.
Annex F
: Statistical tab
les and figu
res
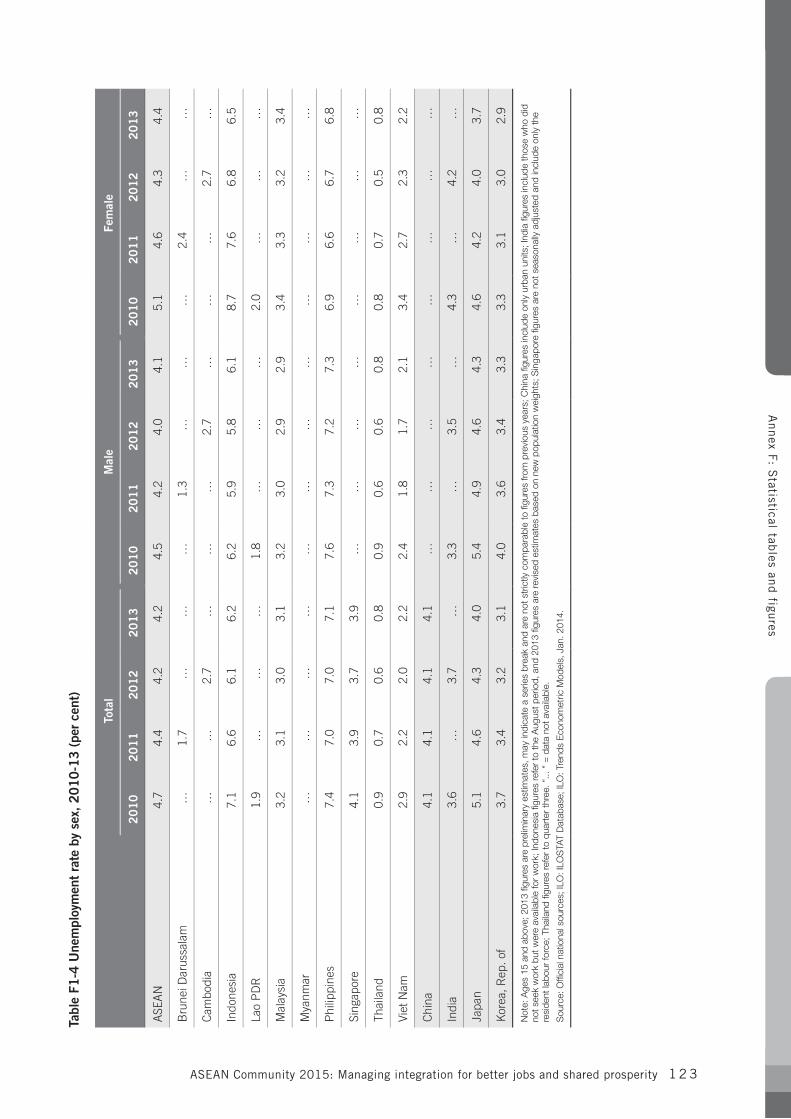
ASEAN Community 2015: Managing integration for better jobs and shared prosperity 1 2 3
Tabl
e F1
-4 U
nem
ploy
men
t ra
te b
y se
x, 2
010-
13 (
per
cent
)
Tota
lM
ale
Fem
ale
20
10
20
11
20
12
20
13
20
10
20
11
20
12
20
13
20
10
20
11
20
12
20
13
ASE
AN
4.7
4.4
4.2
4.2
4.5
4.2
4.0
4.1
5.1
4.6
4.3
4.4
Bru
nei D
arus
sala
m…
1.
7 …
…
…
1.
3 …
…
…
2.
4 …
…
Cam
bodi
a…
…
2.
7 …
…
…
2.
7 …
…
…
2.
7 …
Indo
nesi
a7.
1 6.
6 6.
1 6.
2 6.
2 5.
9 5.
8 6.
1 8.
7 7.
6 6.
8 6.
5
Lao
PD
R1.
9 …
…
…
1.
8 …
…
…
2.
0 …
…
…
Mal
aysi
a3.
2 3.
1 3.
0 3.
1 3.
2 3.
0 2.
9 2.
93.
4 3.
3 3.
2 3.
4
Mya
nmar
……
…
…
……
…
…
……
…
…
Phi
lippi
nes
7.4
7.0
7.0
7.1
7.6
7.3
7.2
7.3
6.9
6.6
6.7
6.8
Sing
apor
e4.
1 3.
9 3.
7 3.
9 …
……
……
……
…
Thai
land
0.9
0.7
0.6
0.8
0.9
0.6
0.6
0.8
0.8
0.7
0.5
0.8
Viet
Nam
2.9
2.2
2.0
2.2
2.4
1.8
1.7
2.1
3.4
2.7
2.3
2.2
Chi
na4.
1 4.
1 4.
1 4.
1 …
…
…
…
…
…
…
…
Indi
a3.
6 …
3.7
…3.
3 …
3.
5 …
4.3
…
4.2
…
Japa
n5.
1 4.
6 4.
3 4.
0 5.
4 4.
9 4.
6 4.
3 4.
6 4.
2 4.
0 3.
7
Kor
ea, R
ep. o
f3.
7 3.
4 3.
2 3.
1 4.
0 3.
6 3.
4 3.
3 3.
3 3.
1 3.
0 2.
9
Not
e: A
ges
15 a
nd a
bove
; 201
3 fig
ures
are
pre
limin
ary
estim
ates
, may
indi
cate
a s
erie
s br
eak
and
are
not s
tric
tly c
ompa
rabl
e to
figu
res
from
pre
viou
s ye
ars;
Chi
na fi
gure
s in
clud
e on
ly u
rban
uni
ts; I
ndia
figu
res
incl
ude
thos
e w
ho d
id
not s
eek
wor
k bu
t wer
e av
aila
ble
for
wor
k; In
done
sia
figur
es re
fer
to th
e A
ugus
t per
iod,
and
201
3 fig
ures
are
revi
sed
estim
ates
bas
ed o
n ne
w p
opul
atio
n w
eigh
ts; S
inga
pore
figu
res
are
not s
easo
nally
adj
uste
d an
d in
clud
e on
ly th
e re
side
nt la
bour
forc
e; T
haila
nd fi
gure
s re
fer
to q
uart
er th
ree.
“...
“ =
dat
a no
t ava
ilabl
e.
Sou
rce:
Offi
cial
nat
iona
l sou
rces
; ILO
: ILO
STA
T D
atab
ase;
ILO
: Tre
nds
Eco
nom
etric
Mod
els,
Jan
. 201
4.
Annex F
: Statistical tab
les and figu
res
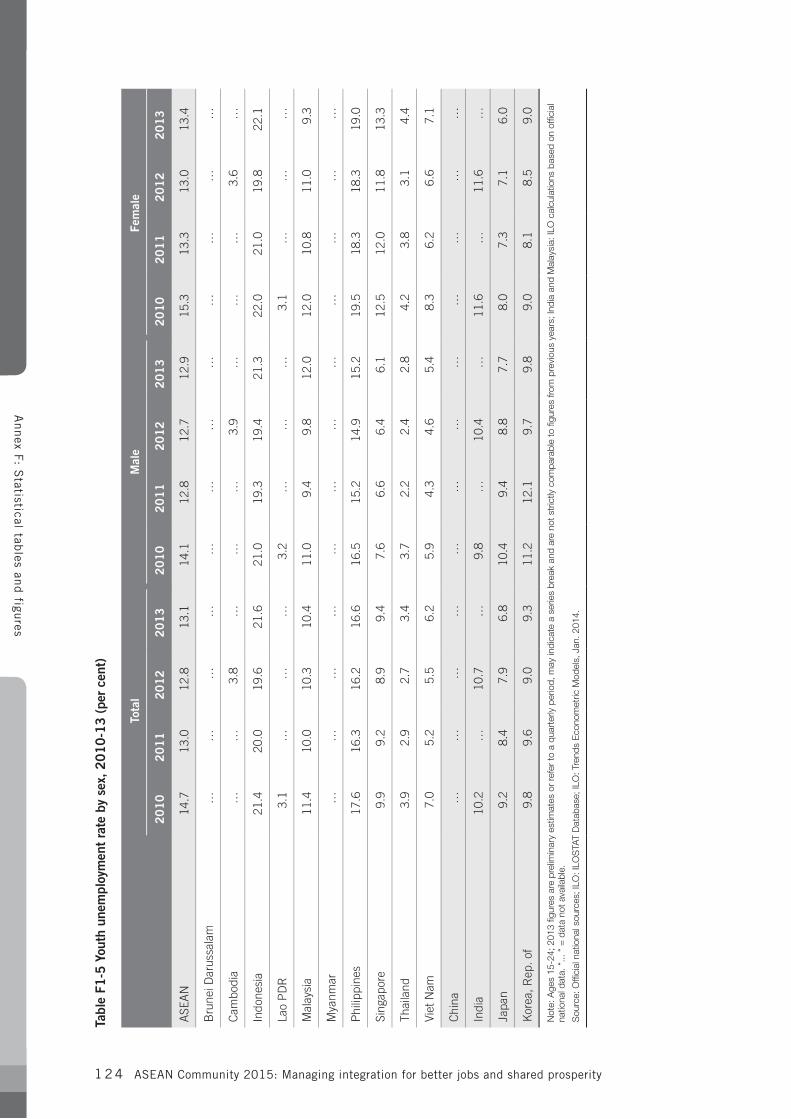
ASEAN Community 2015: Managing integration for better jobs and shared prosperity1 2 4
Tabl
e F1
-5 Y
outh
une
mpl
oym
ent
rate
by
sex,
201
0-13
(pe
r ce
nt)
Tota
lM
ale
Fem
ale
20
10
20
11
20
12
20
13
20
10
20
11
20
12
20
13
20
10
20
11
20
12
20
13
ASE
AN
14.7
13
.0
12.8
13
.1
14.1
12
.8
12.7
12
.9
15.3
13
.3
13.0
13
.4
Bru
nei D
arus
sala
m…
……
……
……
……
……
…
Cam
bodi
a…
…3.
8 …
……
3.9
……
…3.
6 …
Indo
nesi
a21
.4
20.0
19
.6
21.6
21
.0
19.3
19
.4
21.3
22
.0
21.0
19
.8
22.1
Lao
PD
R3.
1 …
……
3.2
……
…3.
1 …
……
Mal
aysi
a11
.4
10.0
10
.3
10.4
11.0
9.
4 9.
8 12
.012
.0
10.8
11
.0
9.3
Mya
nmar
……
……
……
……
……
……
Phi
lippi
nes
17.6
16
.3
16.2
16
.6
16.5
15
.2
14.9
15
.2
19.5
18
.3
18.3
19
.0
Sing
apor
e9.
9 9.
2 8.
9 9.
4 7.
6 6.
6 6.
4 6.
1 12
.5
12.0
11
.8
13.3
Thai
land
3.9
2.9
2.7
3.4
3.7
2.2
2.4
2.8
4.2
3.8
3.1
4.4
Viet
Nam
7.0
5.2
5.5
6.2
5.9
4.3
4.6
5.4
8.3
6.2
6.6
7.1
Chi
na…
…
…
…
…
…
…
…
…
…
…
…
Indi
a10
.2
…
10.7
…
9.
8 …
10
.4
…
11.6
…
11
.6
…
Japa
n9.
2 8.
4 7.
9 6.
8 10
.4
9.4
8.8
7.7
8.0
7.3
7.1
6.0
Kor
ea, R
ep. o
f9.
8 9.
6 9.
0 9.
3 11
.2
12.1
9.
7 9.
8 9.
0 8.
1 8.
5 9.
0
Not
e: A
ges
15-2
4; 2
013
figur
es a
re p
relim
inar
y es
timat
es o
r re
fer
to a
qua
rter
ly p
erio
d, m
ay in
dica
te a
ser
ies
brea
k an
d ar
e no
t str
ictly
com
para
ble
to fi
gure
s fro
m p
revi
ous
year
s; In
dia
and
Mal
aysi
a: IL
O c
alcu
latio
ns b
ased
on
offic
ial
natio
nal d
ata.
“...
“ =
dat
a no
t ava
ilabl
e.
Sou
rce:
Offi
cial
nat
iona
l sou
rces
; ILO
: ILO
STA
T D
atab
ase;
ILO
: Tre
nds
Eco
nom
etric
Mod
els,
Jan
. 201
4.
Annex F
: Statistical tab
les and figu
res
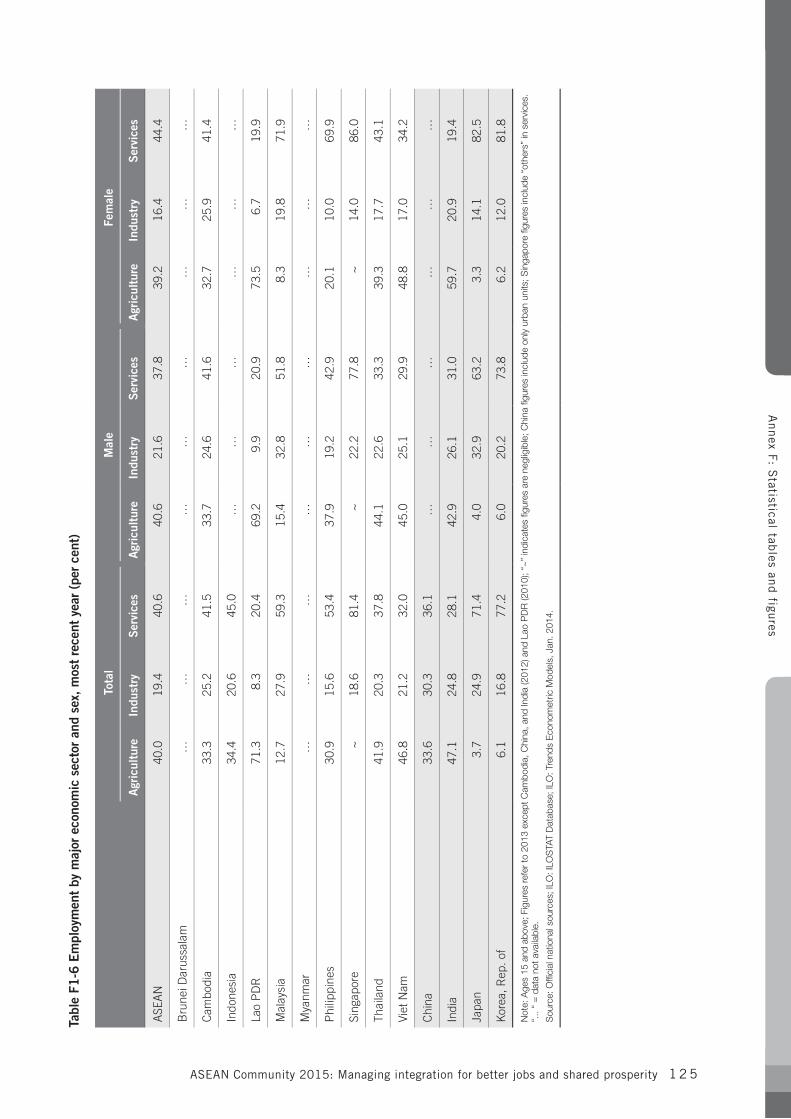
ASEAN Community 2015: Managing integration for better jobs and shared prosperity 1 2 5
Tabl
e F1
-6 E
mpl
oym
ent
by m
ajor
eco
nom
ic s
ecto
r an
d se
x, m
ost
rece
nt y
ear
(per
cen
t)
Tota
lM
ale
Fem
ale
Agr
icul
ture
Indu
stry
Ser
vice
sA
gric
ultu
reIn
dust
ryS
ervi
ces
Agr
icul
ture
Indu
stry
Ser
vice
s
ASE
AN
40.0
19
.4
40.6
40
.6
21.6
37
.8
39.2
16
.4
44.4
Bru
nei D
arus
sala
m…
……
……
……
……
Cam
bodi
a33
.3
25.2
41
.5
33.7
24
.6
41.6
32
.7
25.9
41
.4
Indo
nesi
a34
.4
20.6
45
.0
…
…
…
…
…
…
Lao
PD
R71
.3
8.3
20.4
69
.2
9.9
20.9
73
.5
6.7
19.9
Mal
aysi
a12
.727
.959
.315
.432
.851
.88.
319
.871
.9
Mya
nmar
……
……
…
…
…
…
…
Phi
lippi
nes
30.9
15.6
53
.4
37.9
19.2
42.9
20.1
10.0
69.9
Sing
apor
e~
18.6
81
.4
~22
.2
77.8
~
14.0
86
.0
Thai
land
41.9
20
.3
37.8
44
.1
22.6
33
.3
39.3
17
.7
43.1
Viet
Nam
46.8
21
.2
32.0
45
.0
25.1
29
.9
48.8
17
.0
34.2
Chi
na33
.6
30.3
36
.1
…
…
…
…
…
…
Indi
a47
.1
24.8
28
.1
42.9
26
.1
31.0
59
.7
20.9
19
.4
Japa
n3.
7 24
.9
71.4
4.
0 32
.9
63.2
3.
3 14
.1
82.5
Kor
ea, R
ep. o
f6.
1 16
.8
77.2
6.
0 20
.2
73.8
6.
2 12
.0
81.8
Not
e: A
ges
15 a
nd a
bove
; Fig
ures
refe
r to
201
3 ex
cept
Cam
bodi
a, C
hina
, and
Indi
a (2
012)
and
Lao
PD
R (2
010)
; “~
” in
dica
tes
figur
es a
re n
eglig
ible
; Chi
na fi
gure
s in
clud
e on
ly u
rban
uni
ts; S
inga
pore
figu
res
incl
ude
“oth
ers”
in s
ervi
ces.
“.
.. “
= d
ata
not a
vaila
ble.
Sou
rce:
Offi
cial
nat
iona
l sou
rces
; ILO
: ILO
STA
T D
atab
ase;
ILO
: Tre
nds
Eco
nom
etric
Mod
els,
Jan
. 201
4.
Annex F
: Statistical tab
les and figu
res
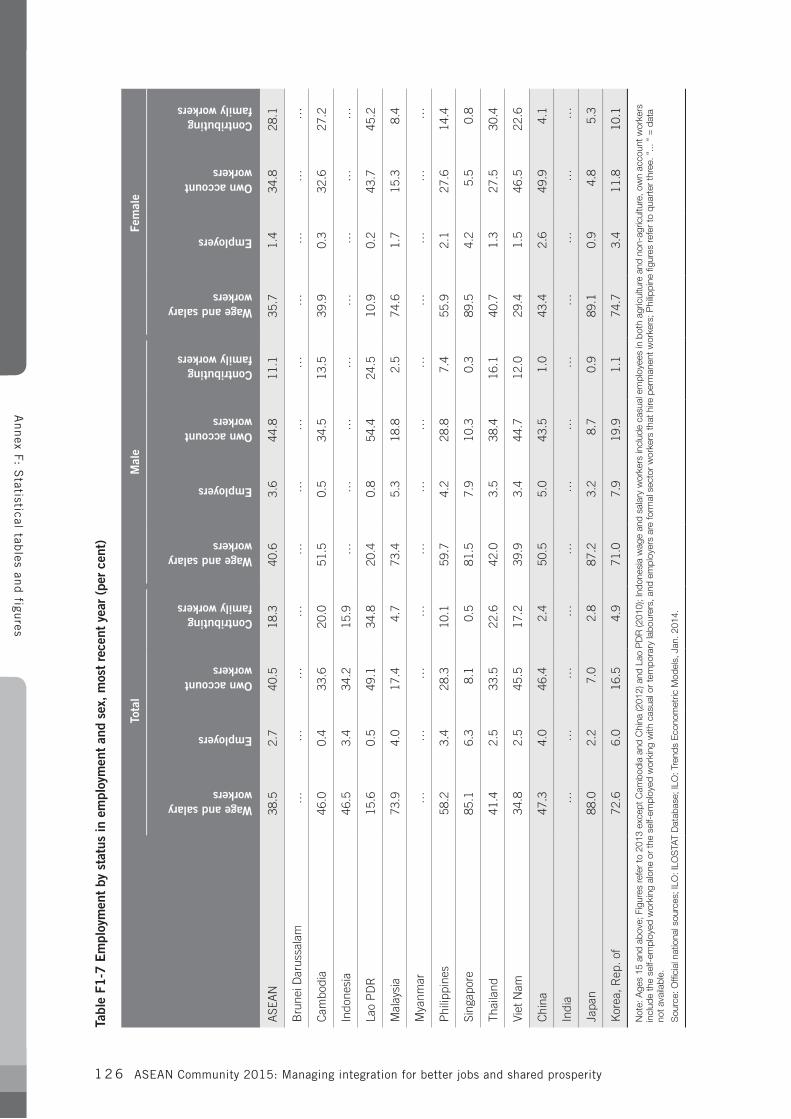
ASEAN Community 2015: Managing integration for better jobs and shared prosperity1 2 6
Tabl
e F1
-7 E
mpl
oym
ent
by s
tatu
s in
em
ploy
men
t an
d se
x, m
ost
rece
nt y
ear
(per
cen
t)
Tota
lM
ale
Fem
ale
Wage and salary workers
Employers
Own account workers
Contributing family workers
Wage and salary workers
Employers
Own account workers
Contributing family workers
Wage and salary workers
Employers
Own account workers
Contributing family workers
ASE
AN
38.5
2.
7 40
.5
18.3
40
.6
3.6
44.8
11
.1
35.7
1.
4 34
.8
28.1
Bru
nei D
arus
sala
m…
……
……
……
……
……
…
Cam
bodi
a46
.0
0.4
33.6
20
.0
51.5
0.
5 34
.5
13.5
39
.9
0.3
32.6
27
.2
Indo
nesi
a46
.5
3.4
34.2
15
.9
……
……
……
……
Lao
PD
R15
.6
0.5
49.1
34
.8
20.4
0.
8 54
.4
24.5
10
.9
0.2
43.7
45
.2
Mal
aysi
a73
.94.
017
.44.
773
.45.
318
.82.
574
.61.
715
.38.
4
Mya
nmar
……
……
……
……
……
……
Phi
lippi
nes
58.2
3.
4 28
.3
10.1
59
.7
4.2
28.8
7.
4 55
.9
2.1
27.6
14
.4
Sing
apor
e85
.1
6.3
8.1
0.5
81.5
7.
9 10
.3
0.3
89.5
4.
2 5.
5 0.
8
Thai
land
41.4
2.
5 33
.5
22.6
42
.0
3.5
38.4
16
.1
40.7
1.
3 27
.5
30.4
Viet
Nam
34.8
2.
5 45
.5
17.2
39
.9
3.4
44.7
12
.0
29.4
1.
5 46
.5
22.6
Chi
na47
.3
4.0
46.4
2.
4 50
.5
5.0
43.5
1.
0 43
.4
2.6
49.9
4.
1
Indi
a…
…
…
…
…
…
…
…
…
…
…
…
Japa
n88
.0
2.2
7.0
2.8
87.2
3.
2 8.
7 0.
9 89
.1
0.9
4.8
5.3
Kor
ea, R
ep. o
f72
.6
6.0
16.5
4.
9 71
.0
7.9
19.9
1.
1 74
.7
3.4
11.8
10
.1
Not
e: A
ges
15 a
nd a
bove
; Fig
ures
refe
r to
201
3 ex
cept
Cam
bodi
a an
d C
hina
(201
2) a
nd L
ao P
DR
(201
0); I
ndon
esia
wag
e an
d sa
lary
wor
kers
incl
ude
casu
al e
mpl
oyee
s in
bot
h ag
ricul
ture
and
non
-agr
icul
ture
, ow
n ac
coun
t wor
kers
in
clud
e th
e se
lf-em
ploy
ed w
orki
ng a
lone
or
the
self-
empl
oyed
wor
king
with
cas
ual o
r te
mpo
rary
labo
urer
s, a
nd e
mpl
oyer
s ar
e fo
rmal
sec
tor
wor
kers
that
hire
per
man
ent w
orke
rs; P
hilip
pine
figu
res
refe
r to
qua
rter
thre
e. “
... “
= d
ata
not a
vaila
ble.
Sou
rce:
Offi
cial
nat
iona
l sou
rces
; ILO
: ILO
STA
T D
atab
ase;
ILO
: Tre
nds
Eco
nom
etric
Mod
els,
Jan
. 201
4.
Annex F
: Statistical tab
les and figu
res
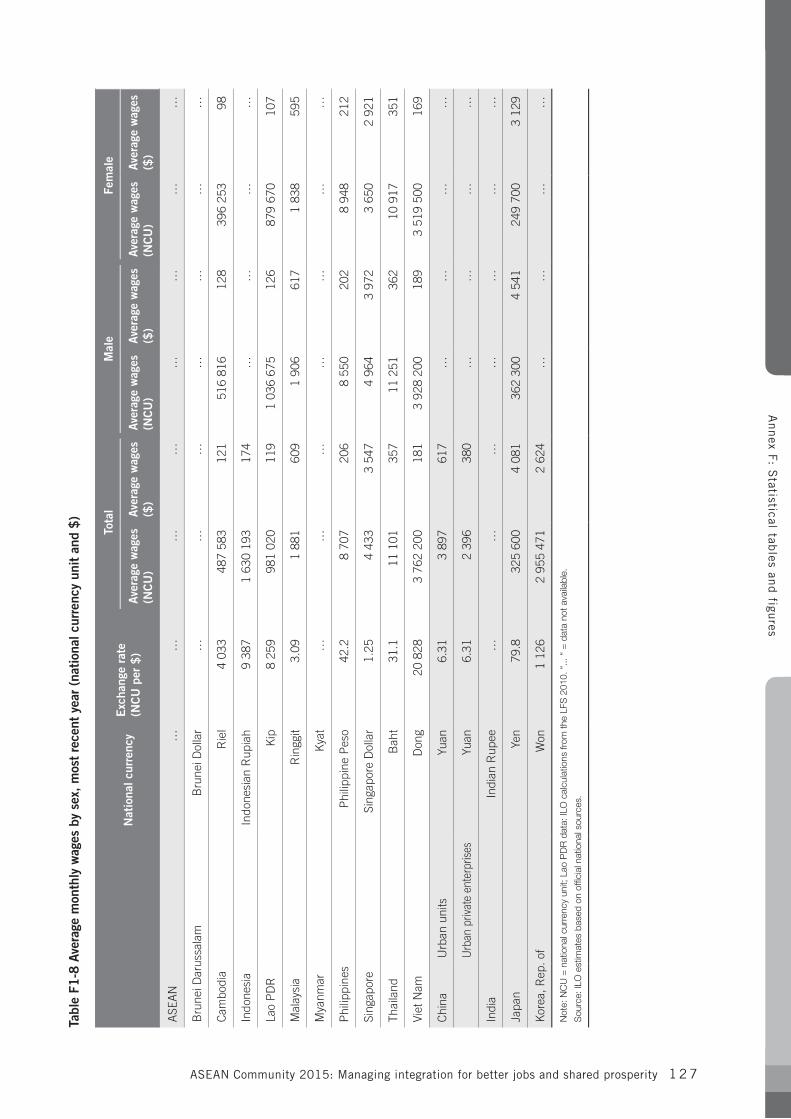
ASEAN Community 2015: Managing integration for better jobs and shared prosperity 1 2 7
Tabl
e F1
-8 A
vera
ge m
onth
ly w
ages
by
sex,
mos
t re
cent
yea
r (n
atio
nal c
urre
ncy
unit
and
$)
N
atio
nal c
urre
ncy
Exc
hang
e ra
te
(NC
U p
er $
)
Tota
lM
ale
Fem
ale
Aver
age
wag
es
(NC
U)
Aver
age
wag
es
($)
Aver
age
wag
es
(NC
U)
Aver
age
wag
es
($)
Aver
age
wag
es
(NC
U)
Aver
age
wag
es
($)
ASE
AN
……
……
……
……
Bru
nei D
arus
sala
mB
rune
i Dol
lar
……
……
……
…
Cam
bodi
aR
iel
4 0
33 4
87 5
83
121
516
816
12
8 3
96 2
53
98
Indo
nesi
aIn
done
sian
Rup
iah
9 3
871
630
193
17
4…
……
…
Lao
PD
RK
ip8
259
981
020
119
1 03
6 67
512
687
9 67
010
7
Mal
aysi
aR
ingg
it
3.09
1 8
81
609
1 9
06
617
1 8
38
595
Mya
nmar
Kya
t…
……
……
……
Phi
lippi
nes
Phi
lippi
ne P
eso
42
.2 8
707
20
6 8
550
20
2 8
948
21
2
Sing
apor
eSi
ngap
ore
Dol
lar
1.
25 4
433
3 5
47 4
964
3 9
72 3
650
2 9
21
Thai
land
Bah
t
31.1
11
101
35
7 1
1 25
1
362
10
917
35
1
Viet
Nam
Don
g 2
0 82
83
762
200
18
13
928
200
18
93
519
500
16
9
Chi
naU
rban
uni
tsYu
an
6.31
3 8
97
617
……
……
Urb
an p
rivat
e en
terp
rises
Yuan
6.
31 2
396
38
0…
……
…
Indi
aIn
dian
Rup
ee…
……
……
……
Japa
nYe
n
79.8
325
600
4 0
81 3
62 3
00 4
541
249
700
3 1
29
Kor
ea, R
ep. o
fW
on 1
126
2 95
5 47
1 2
624
……
……
Not
e: N
CU
= n
atio
nal c
urre
ncy
unit;
Lao
PD
R d
ata:
ILO
cal
cula
tions
from
the
LFS
201
0. “
... “
= d
ata
not a
vaila
ble.
Sou
rce:
ILO
est
imat
es b
ased
on
offic
ial n
atio
nal s
ourc
es.
Annex F
: Statistical tab
les and figu
res
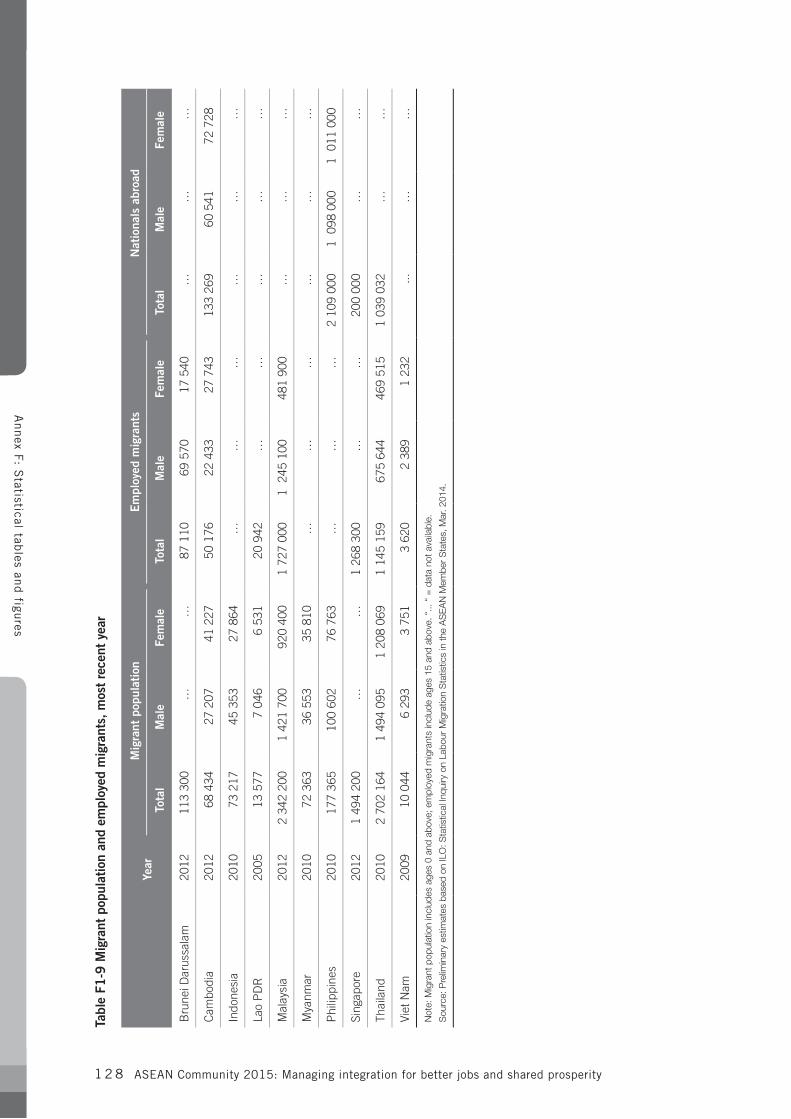
ASEAN Community 2015: Managing integration for better jobs and shared prosperity1 2 8
Tabl
e F1
-9 M
igra
nt p
opul
atio
n an
d em
ploy
ed m
igra
nts,
mos
t re
cent
yea
r
Ye
arM
igra
nt p
opul
atio
nE
mpl
oyed
mig
rant
sN
atio
nals
abr
oad
Tota
lM
ale
Fem
ale
Tota
lM
ale
Fem
ale
Tota
lM
ale
Fem
ale
Bru
nei D
arus
sala
m 2
012
113
300
……
87
110
69
570
17
540
……
…
Cam
bodi
a 2
012
68
434
27
207
41
227
50
176
22
433
27
743
133
269
60
541
72
728
Indo
nesi
a 2
010
73
217
45
353
27
864
……
……
……
Lao
PD
R 2
005
13
577
7 0
46 6
531
20
942
……
……
…
Mal
aysi
a 2
012
2 34
2 20
01
421
700
920
400
1 72
7 00
01
245
100
481
900
……
…
Mya
nmar
201
0 7
2 36
3 3
6 55
3 3
5 81
0…
……
……
…
Phi
lippi
nes
201
0 1
77 3
65 1
00 6
02 7
6 76
3…
……
2 10
9 00
01
098
000
1 0
11 0
00
Sing
apor
e 2
012
1 49
4 20
0…
…1
268
300
……
200
000
……
Thai
land
201
02
702
164
1 49
4 09
51
208
069
1 14
5 15
9 6
75 6
44 4
69 5
151
039
032
……
Viet
Nam
200
9 1
0 04
4 6
293
3 7
51 3
620
2 3
89 1
232
...…
…
Not
e: M
igra
nt p
opul
atio
n in
clud
es a
ges
0 an
d ab
ove;
em
ploy
ed m
igra
nts
incl
ude
ages
15
and
abov
e. “
... “
= d
ata
not a
vaila
ble.
Sou
rce:
Pre
limin
ary
estim
ates
bas
ed o
n IL
O: S
tatis
tical
Inqu
iry o
n La
bour
Mig
ratio
n S
tatis
tics
in th
e A
SE
AN
Mem
ber
Sta
tes,
Mar
. 201
4.
Annex F
: Statistical tab
les and figu
res
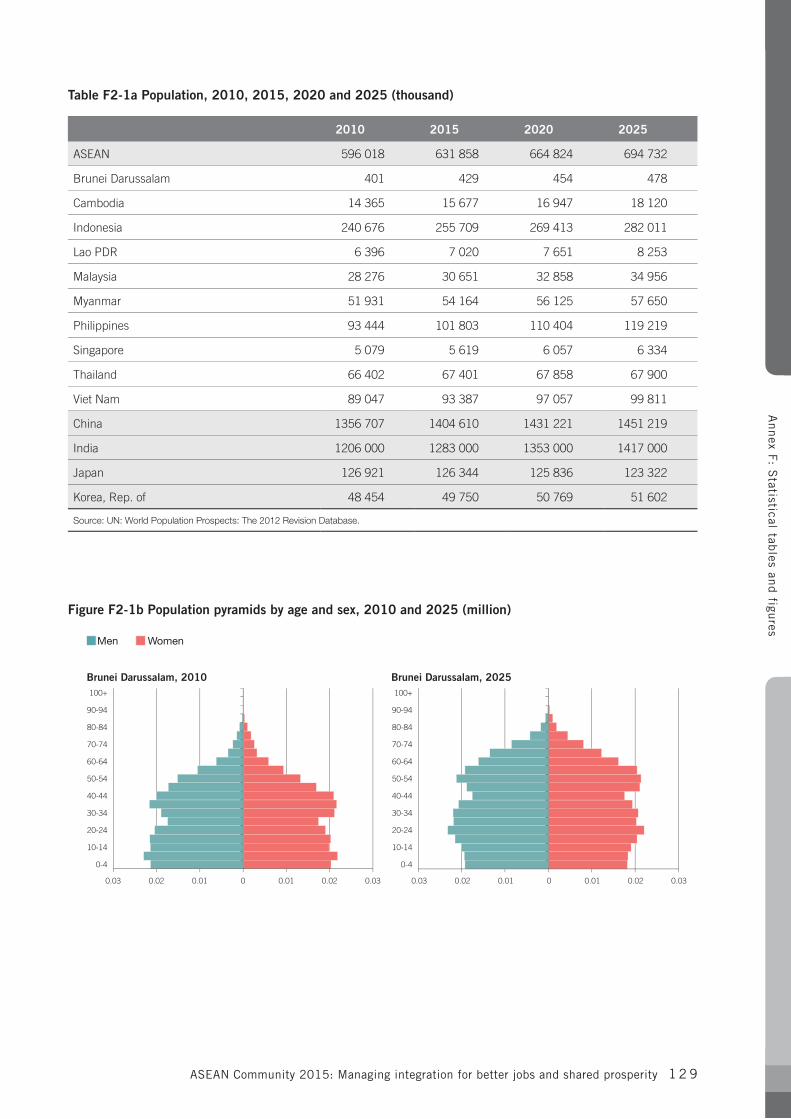
ASEAN Community 2015: Managing integration for better jobs and shared prosperity 1 2 9
Table F2-1a Population, 2010, 2015, 2020 and 2025 (thousand)
2010 2015 2020 2025
ASEAN 596 018 631 858 664 824 694 732
Brunei Darussalam 401 429 454 478
Cambodia 14 365 15 677 16 947 18 120
Indonesia 240 676 255 709 269 413 282 011
Lao PDR 6 396 7 020 7 651 8 253
Malaysia 28 276 30 651 32 858 34 956
Myanmar 51 931 54 164 56 125 57 650
Philippines 93 444 101 803 110 404 119 219
Singapore 5 079 5 619 6 057 6 334
Thailand 66 402 67 401 67 858 67 900
Viet Nam 89 047 93 387 97 057 99 811
China 1356 707 1404 610 1431 221 1451 219
India 1206 000 1283 000 1353 000 1417 000
Japan 126 921 126 344 125 836 123 322
Korea, Rep. of 48 454 49 750 50 769 51 602
Source: UN: World Population Prospects: The 2012 Revision Database.
Figure F2-1b Population pyramids by age and sex, 2010 and 2025 (million)
Brunei Darussalam, 2010 Brunei Darussalam, 2025100+
90-94
80-84
70-74
60-64
50-54
40-44
30-34
20-24
10-14
0-4
0.03 0.02 0.01 0 0.01 0.02 0.03 0.03 0.02 0.01 0 0.01 0.02 0.03
100+
90-94
80-84
70-74
60-64
50-54
40-44
30-34
20-24
10-14
0-4
Men Women
Annex F
: Statistical tab
les and figu
res
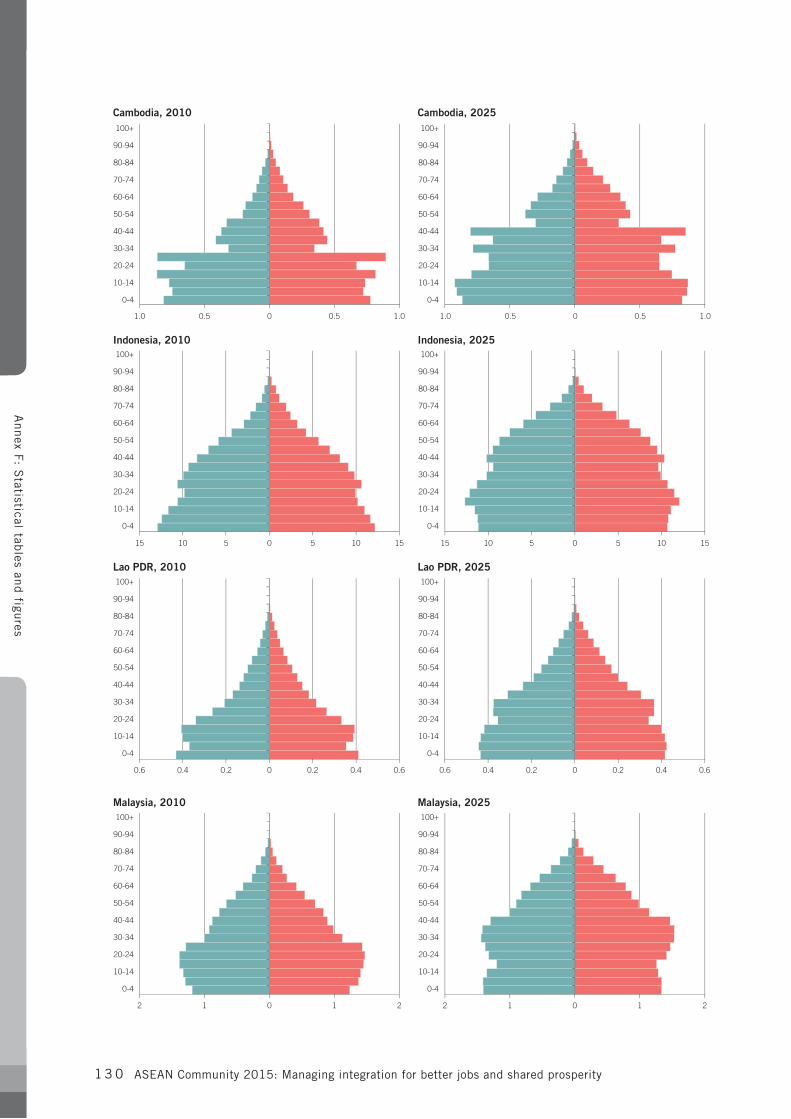
ASEAN Community 2015: Managing integration for better jobs and shared prosperity1 3 0
Cambodia, 2010 Cambodia, 2025
Indonesia, 2010 Indonesia, 2025
Lao PDR, 2010 Lao PDR, 2025
Malaysia, 2010 Malaysia, 2025
100+
90-94
80-84
70-74
60-64
50-54
40-44
30-34
20-24
10-14
0-4
100+
90-94
80-84
70-74
60-64
50-54
40-44
30-34
20-24
10-14
0-4
100+
90-94
80-84
70-74
60-64
50-54
40-44
30-34
20-24
10-14
0-4
100+
90-94
80-84
70-74
60-64
50-54
40-44
30-34
20-24
10-14
0-4
100+
90-94
80-84
70-74
60-64
50-54
40-44
30-34
20-24
10-14
0-4
100+
90-94
80-84
70-74
60-64
50-54
40-44
30-34
20-24
10-14
0-4
100+
90-94
80-84
70-74
60-64
50-54
40-44
30-34
20-24
10-14
0-4
1.0 0.5 0 0.5 1.0 1.0 0.5 0 0.5 1.0
15 10 5 0 5 10 15 15 10 5 0 5 10 15
0.6 0.4 0.2 0 0.2 0.4 0.6
2 1 0 1 2 2 1 0 1 2
0.6 0.4 0.2 0 0.2 0.4 0.6
100+
90-94
80-84
70-74
60-64
50-54
40-44
30-34
20-24
10-14
0-4
Annex F
: Statistical tab
les and figu
res
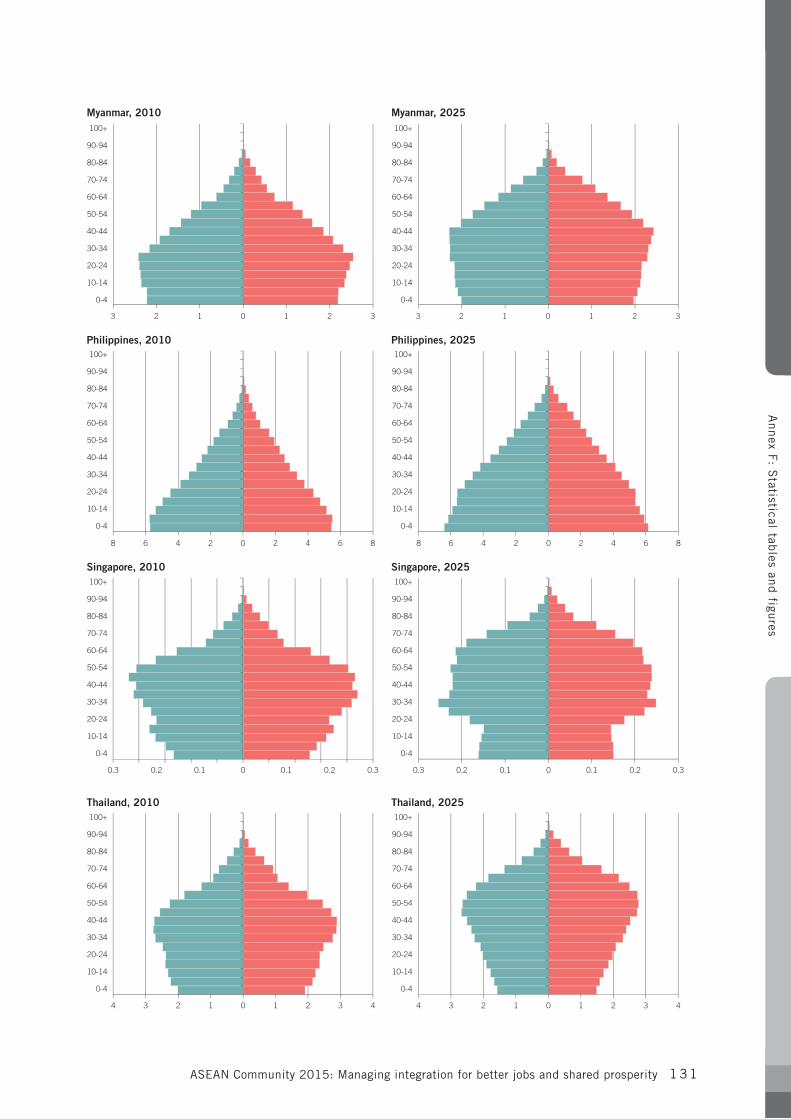
ASEAN Community 2015: Managing integration for better jobs and shared prosperity 1 31
Myanmar, 2010 Myanmar, 2025
Philippines, 2010 Philippines, 2025
Singapore, 2010 Singapore, 2025
Thailand, 2010 Thailand, 2025
100+
90-94
80-84
70-74
60-64
50-54
40-44
30-34
20-24
10-14
0-4
100+
90-94
80-84
70-74
60-64
50-54
40-44
30-34
20-24
10-14
0-4
100+
90-94
80-84
70-74
60-64
50-54
40-44
30-34
20-24
10-14
0-4
100+
90-94
80-84
70-74
60-64
50-54
40-44
30-34
20-24
10-14
0-4
100+
90-94
80-84
70-74
60-64
50-54
40-44
30-34
20-24
10-14
0-4
100+
90-94
80-84
70-74
60-64
50-54
40-44
30-34
20-24
10-14
0-4
100+
90-94
80-84
70-74
60-64
50-54
40-44
30-34
20-24
10-14
0-4
8 4 2 0 2 4 66 88 4 2 0 2 4 66 8
4 1 0 33 1 4224 1 0 33 1 422
0.3 0.2 0.1 0 0.1 0.2 0.30.3 0.2 0.1 0 0.1 0.2 0.3
100+
90-94
80-84
70-74
60-64
50-54
40-44
30-34
20-24
10-14
0-4
3 2 1 0 1 2 33 2 1 0 1 2 3
Annex F
: Statistical tab
les and figu
res
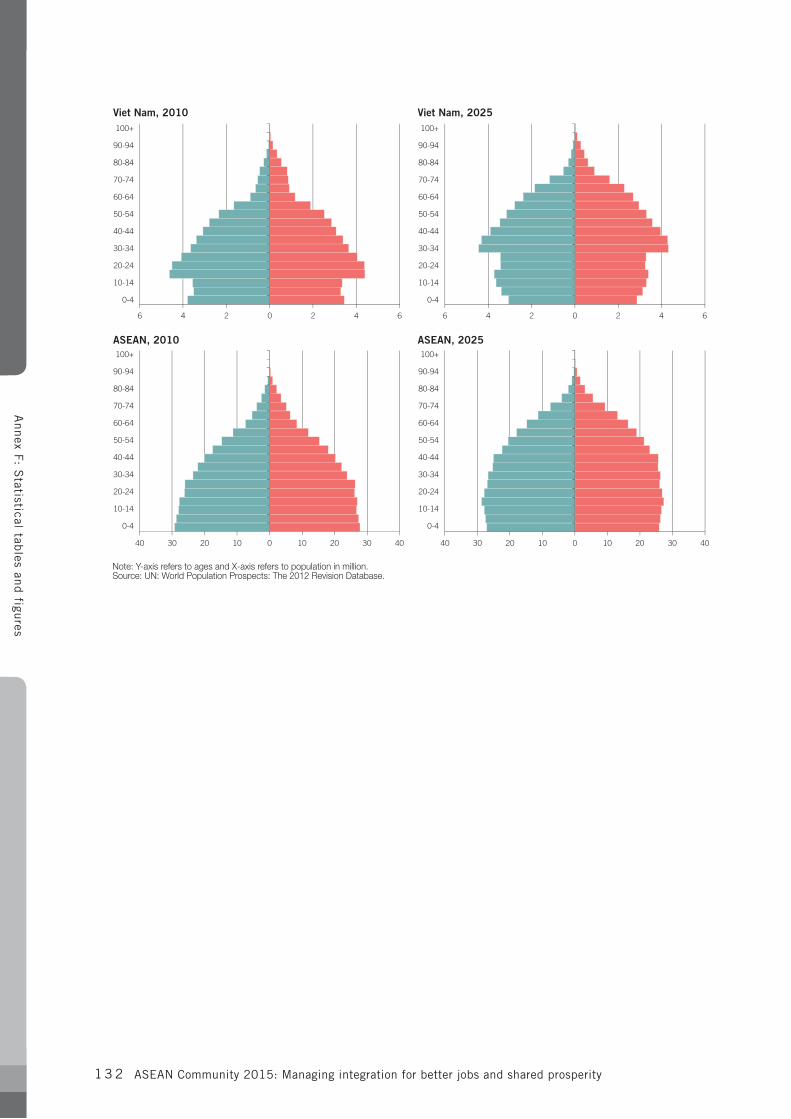
ASEAN Community 2015: Managing integration for better jobs and shared prosperity1 3 2
Viet Nam, 2010 Viet Nam, 2025
ASEAN, 2010 ASEAN, 2025
100+
90-94
80-84
70-74
60-64
50-54
40-44
30-34
20-24
10-14
0-4
100+
90-94
80-84
70-74
60-64
50-54
40-44
30-34
20-24
10-14
0-4
100+
90-94
80-84
70-74
60-64
50-54
40-44
30-34
20-24
10-14
0-4
40 20 10 0 10 20 3030 4040 20 10 0 10 20 3030 40
4 2 0 2 4 664 2 0 2 4 66
100+
90-94
80-84
70-74
60-64
50-54
40-44
30-34
20-24
10-14
0-4
Note: Y-axis refers to ages and X-axis refers to population in million.Source: UN: World Population Prospects: The 2012 Revision Database.
Annex F
: Statistical tab
les and figu
res
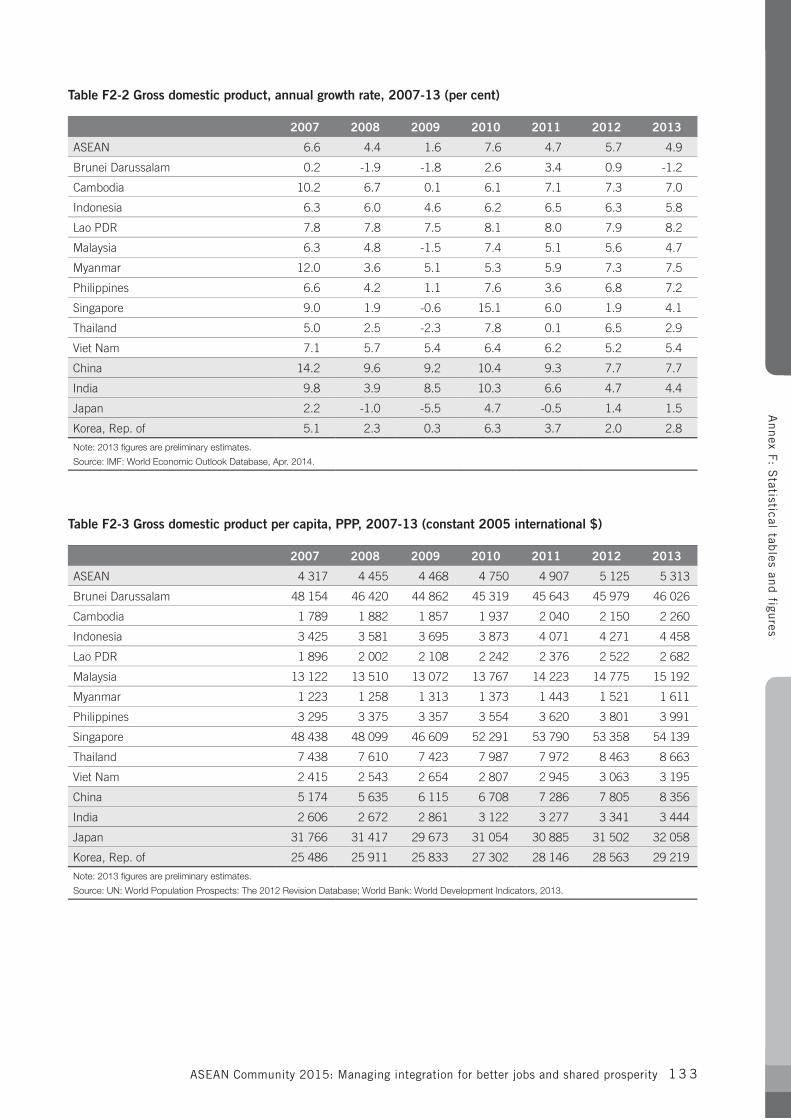
ASEAN Community 2015: Managing integration for better jobs and shared prosperity 1 3 3
Table F2-2 Gross domestic product, annual growth rate, 2007-13 (per cent)
2007 2008 2009 2010 2011 2012 2013
ASEAN 6.6 4.4 1.6 7.6 4.7 5.7 4.9
Brunei Darussalam 0.2 -1.9 -1.8 2.6 3.4 0.9 -1.2
Cambodia 10.2 6.7 0.1 6.1 7.1 7.3 7.0
Indonesia 6.3 6.0 4.6 6.2 6.5 6.3 5.8
Lao PDR 7.8 7.8 7.5 8.1 8.0 7.9 8.2
Malaysia 6.3 4.8 -1.5 7.4 5.1 5.6 4.7
Myanmar 12.0 3.6 5.1 5.3 5.9 7.3 7.5
Philippines 6.6 4.2 1.1 7.6 3.6 6.8 7.2
Singapore 9.0 1.9 -0.6 15.1 6.0 1.9 4.1
Thailand 5.0 2.5 -2.3 7.8 0.1 6.5 2.9
Viet Nam 7.1 5.7 5.4 6.4 6.2 5.2 5.4
China 14.2 9.6 9.2 10.4 9.3 7.7 7.7
India 9.8 3.9 8.5 10.3 6.6 4.7 4.4
Japan 2.2 -1.0 -5.5 4.7 -0.5 1.4 1.5
Korea, Rep. of 5.1 2.3 0.3 6.3 3.7 2.0 2.8
Note: 2013 figures are preliminary estimates.
Source: IMF: World Economic Outlook Database, Apr. 2014.
Table F2-3 Gross domestic product per capita, PPP, 2007-13 (constant 2005 international $)
2007 2008 2009 2010 2011 2012 2013
ASEAN 4 317 4 455 4 468 4 750 4 907 5 125 5 313
Brunei Darussalam 48 154 46 420 44 862 45 319 45 643 45 979 46 026
Cambodia 1 789 1 882 1 857 1 937 2 040 2 150 2 260
Indonesia 3 425 3 581 3 695 3 873 4 071 4 271 4 458
Lao PDR 1 896 2 002 2 108 2 242 2 376 2 522 2 682
Malaysia 13 122 13 510 13 072 13 767 14 223 14 775 15 192
Myanmar 1 223 1 258 1 313 1 373 1 443 1 521 1 611
Philippines 3 295 3 375 3 357 3 554 3 620 3 801 3 991
Singapore 48 438 48 099 46 609 52 291 53 790 53 358 54 139
Thailand 7 438 7 610 7 423 7 987 7 972 8 463 8 663
Viet Nam 2 415 2 543 2 654 2 807 2 945 3 063 3 195
China 5 174 5 635 6 115 6 708 7 286 7 805 8 356
India 2 606 2 672 2 861 3 122 3 277 3 341 3 444
Japan 31 766 31 417 29 673 31 054 30 885 31 502 32 058
Korea, Rep. of 25 486 25 911 25 833 27 302 28 146 28 563 29 219
Note: 2013 figures are preliminary estimates.
Source: UN: World Population Prospects: The 2012 Revision Database; World Bank: World Development Indicators, 2013.
Annex F
: Statistical tab
les and figu
res
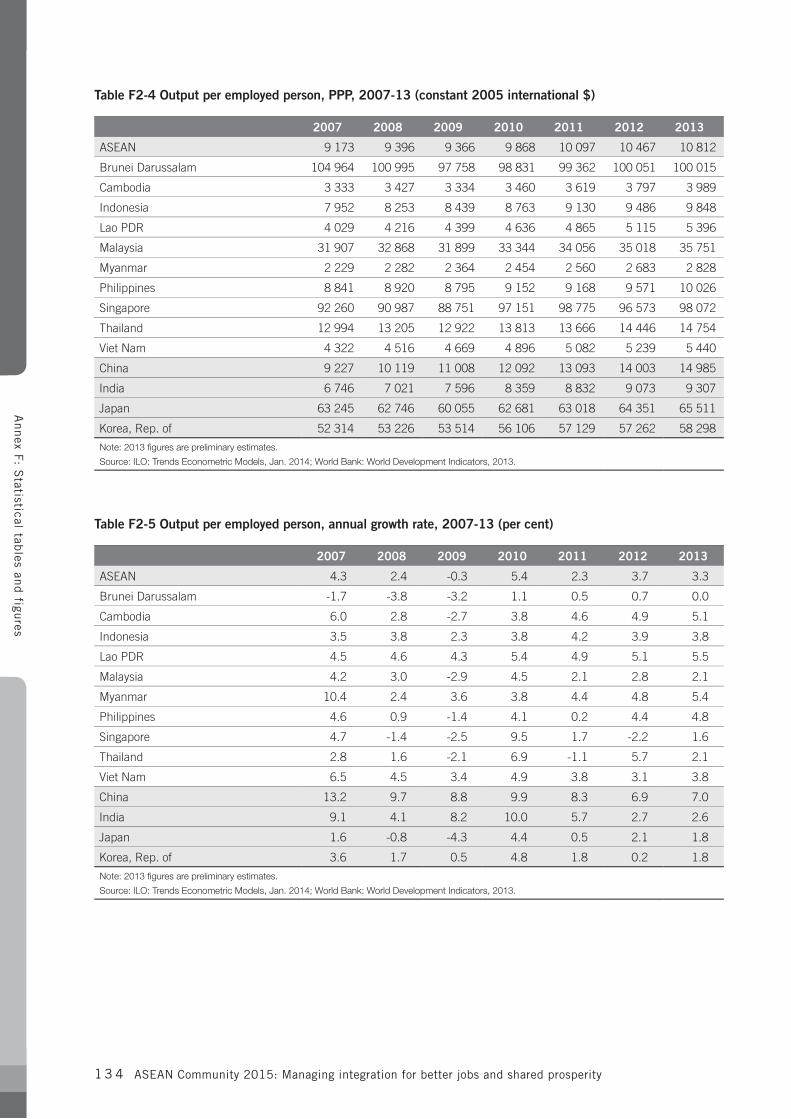
ASEAN Community 2015: Managing integration for better jobs and shared prosperity1 3 4
Table F2-4 Output per employed person, PPP, 2007-13 (constant 2005 international $)
2007 2008 2009 2010 2011 2012 2013
ASEAN 9 173 9 396 9 366 9 868 10 097 10 467 10 812
Brunei Darussalam 104 964 100 995 97 758 98 831 99 362 100 051 100 015
Cambodia 3 333 3 427 3 334 3 460 3 619 3 797 3 989
Indonesia 7 952 8 253 8 439 8 763 9 130 9 486 9 848
Lao PDR 4 029 4 216 4 399 4 636 4 865 5 115 5 396
Malaysia 31 907 32 868 31 899 33 344 34 056 35 018 35 751
Myanmar 2 229 2 282 2 364 2 454 2 560 2 683 2 828
Philippines 8 841 8 920 8 795 9 152 9 168 9 571 10 026
Singapore 92 260 90 987 88 751 97 151 98 775 96 573 98 072
Thailand 12 994 13 205 12 922 13 813 13 666 14 446 14 754
Viet Nam 4 322 4 516 4 669 4 896 5 082 5 239 5 440
China 9 227 10 119 11 008 12 092 13 093 14 003 14 985
India 6 746 7 021 7 596 8 359 8 832 9 073 9 307
Japan 63 245 62 746 60 055 62 681 63 018 64 351 65 511
Korea, Rep. of 52 314 53 226 53 514 56 106 57 129 57 262 58 298
Note: 2013 figures are preliminary estimates.
Source: ILO: Trends Econometric Models, Jan. 2014; World Bank: World Development Indicators, 2013.
Table F2-5 Output per employed person, annual growth rate, 2007-13 (per cent)
2007 2008 2009 2010 2011 2012 2013
ASEAN 4.3 2.4 -0.3 5.4 2.3 3.7 3.3
Brunei Darussalam -1.7 -3.8 -3.2 1.1 0.5 0.7 0.0
Cambodia 6.0 2.8 -2.7 3.8 4.6 4.9 5.1
Indonesia 3.5 3.8 2.3 3.8 4.2 3.9 3.8
Lao PDR 4.5 4.6 4.3 5.4 4.9 5.1 5.5
Malaysia 4.2 3.0 -2.9 4.5 2.1 2.8 2.1
Myanmar 10.4 2.4 3.6 3.8 4.4 4.8 5.4
Philippines 4.6 0.9 -1.4 4.1 0.2 4.4 4.8
Singapore 4.7 -1.4 -2.5 9.5 1.7 -2.2 1.6
Thailand 2.8 1.6 -2.1 6.9 -1.1 5.7 2.1
Viet Nam 6.5 4.5 3.4 4.9 3.8 3.1 3.8
China 13.2 9.7 8.8 9.9 8.3 6.9 7.0
India 9.1 4.1 8.2 10.0 5.7 2.7 2.6
Japan 1.6 -0.8 -4.3 4.4 0.5 2.1 1.8
Korea, Rep. of 3.6 1.7 0.5 4.8 1.8 0.2 1.8
Note: 2013 figures are preliminary estimates.
Source: ILO: Trends Econometric Models, Jan. 2014; World Bank: World Development Indicators, 2013.
Annex F
: Statistical tab
les and figu
res
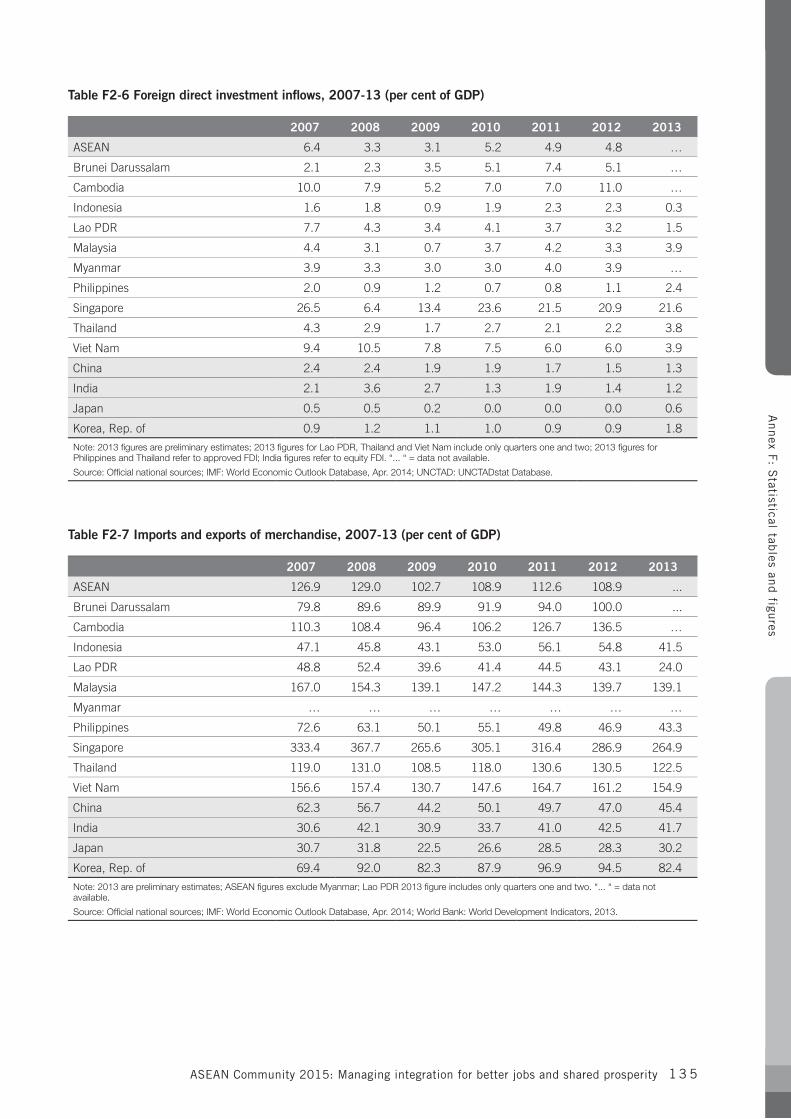
ASEAN Community 2015: Managing integration for better jobs and shared prosperity 1 3 5
Table F2-6 Foreign direct investment inflows, 2007-13 (per cent of GDP)
2007 2008 2009 2010 2011 2012 2013
ASEAN 6.4 3.3 3.1 5.2 4.9 4.8 …
Brunei Darussalam 2.1 2.3 3.5 5.1 7.4 5.1 …
Cambodia 10.0 7.9 5.2 7.0 7.0 11.0 …
Indonesia 1.6 1.8 0.9 1.9 2.3 2.3 0.3
Lao PDR 7.7 4.3 3.4 4.1 3.7 3.2 1.5
Malaysia 4.4 3.1 0.7 3.7 4.2 3.3 3.9
Myanmar 3.9 3.3 3.0 3.0 4.0 3.9 …
Philippines 2.0 0.9 1.2 0.7 0.8 1.1 2.4
Singapore 26.5 6.4 13.4 23.6 21.5 20.9 21.6
Thailand 4.3 2.9 1.7 2.7 2.1 2.2 3.8
Viet Nam 9.4 10.5 7.8 7.5 6.0 6.0 3.9
China 2.4 2.4 1.9 1.9 1.7 1.5 1.3
India 2.1 3.6 2.7 1.3 1.9 1.4 1.2
Japan 0.5 0.5 0.2 0.0 0.0 0.0 0.6
Korea, Rep. of 0.9 1.2 1.1 1.0 0.9 0.9 1.8
Note: 2013 figures are preliminary estimates; 2013 figures for Lao PDR, Thailand and Viet Nam include only quarters one and two; 2013 figures for Philippines and Thailand refer to approved FDI; India figures refer to equity FDI. “... “ = data not available.
Source: Official national sources; IMF: World Economic Outlook Database, Apr. 2014; UNCTAD: UNCTADstat Database.
Table F2-7 Imports and exports of merchandise, 2007-13 (per cent of GDP)
2007 2008 2009 2010 2011 2012 2013
ASEAN 126.9 129.0 102.7 108.9 112.6 108.9 ...
Brunei Darussalam 79.8 89.6 89.9 91.9 94.0 100.0 ...
Cambodia 110.3 108.4 96.4 106.2 126.7 136.5 …
Indonesia 47.1 45.8 43.1 53.0 56.1 54.8 41.5
Lao PDR 48.8 52.4 39.6 41.4 44.5 43.1 24.0
Malaysia 167.0 154.3 139.1 147.2 144.3 139.7 139.1
Myanmar … … … … … … …
Philippines 72.6 63.1 50.1 55.1 49.8 46.9 43.3
Singapore 333.4 367.7 265.6 305.1 316.4 286.9 264.9
Thailand 119.0 131.0 108.5 118.0 130.6 130.5 122.5
Viet Nam 156.6 157.4 130.7 147.6 164.7 161.2 154.9
China 62.3 56.7 44.2 50.1 49.7 47.0 45.4
India 30.6 42.1 30.9 33.7 41.0 42.5 41.7
Japan 30.7 31.8 22.5 26.6 28.5 28.3 30.2
Korea, Rep. of 69.4 92.0 82.3 87.9 96.9 94.5 82.4
Note: 2013 are preliminary estimates; ASEAN figures exclude Myanmar; Lao PDR 2013 figure includes only quarters one and two. “... “ = data not available.
Source: Official national sources; IMF: World Economic Outlook Database, Apr. 2014; World Bank: World Development Indicators, 2013.
Annex F
: Statistical tab
les and figu
res
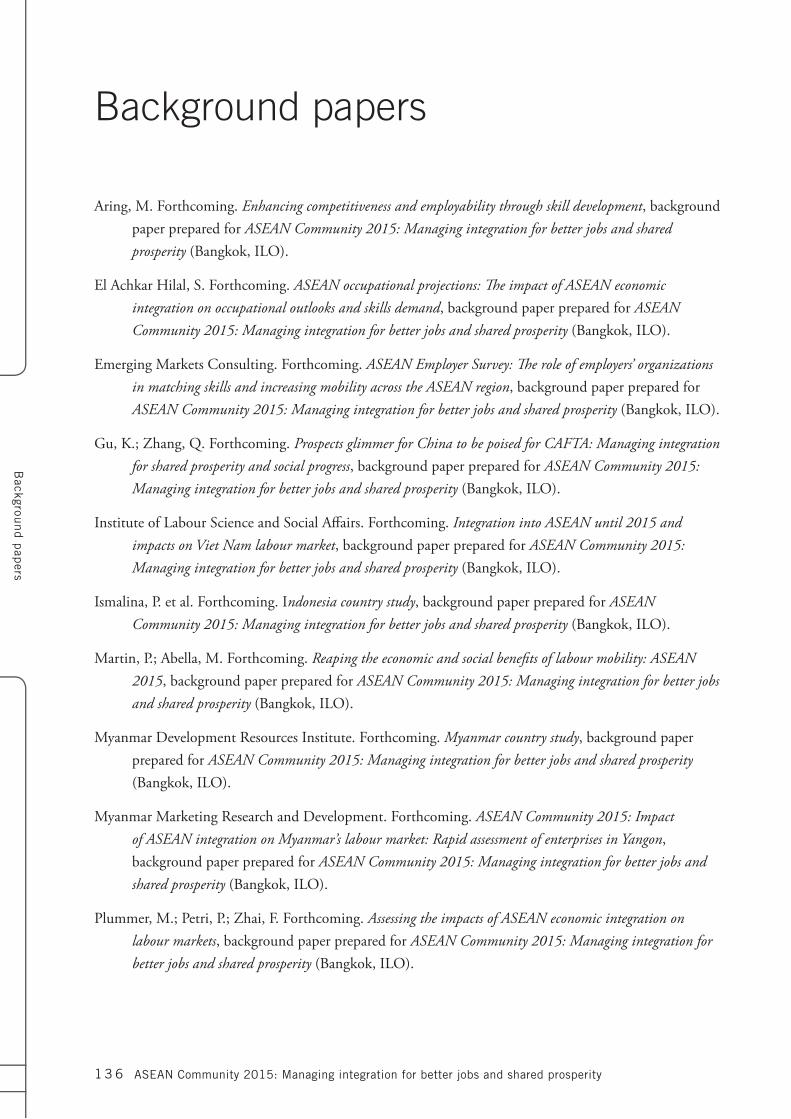
Backgrou
nd p
apers
ASEAN Community 2015: Managing integration for better jobs and shared prosperity1 3 6
Background papers
Aring, M. Forthcoming. Enhancing competitiveness and employability through skill development, background paper prepared for ASEAN Community 2015: Managing integration for better jobs and shared prosperity (Bangkok, ILO).
El Achkar Hilal, S. Forthcoming. ASEAN occupational projections: The impact of ASEAN economic integration on occupational outlooks and skills demand, background paper prepared for ASEAN Community 2015: Managing integration for better jobs and shared prosperity (Bangkok, ILO).
Emerging Markets Consulting. Forthcoming. ASEAN Employer Survey: The role of employers’ organizations in matching skills and increasing mobility across the ASEAN region, background paper prepared for ASEAN Community 2015: Managing integration for better jobs and shared prosperity (Bangkok, ILO).
Gu, K.; Zhang, Q. Forthcoming. Prospects glimmer for China to be poised for CAFTA: Managing integration for shared prosperity and social progress, background paper prepared for ASEAN Community 2015: Managing integration for better jobs and shared prosperity (Bangkok, ILO).
Institute of Labour Science and Social Affairs. Forthcoming. Integration into ASEAN until 2015 and impacts on Viet Nam labour market, background paper prepared for ASEAN Community 2015: Managing integration for better jobs and shared prosperity (Bangkok, ILO).
Ismalina, P. et al. Forthcoming. Indonesia country study, background paper prepared for ASEAN Community 2015: Managing integration for better jobs and shared prosperity (Bangkok, ILO).
Martin, P.; Abella, M. Forthcoming. Reaping the economic and social benefits of labour mobility: ASEAN 2015, background paper prepared for ASEAN Community 2015: Managing integration for better jobs and shared prosperity (Bangkok, ILO).
Myanmar Development Resources Institute. Forthcoming. Myanmar country study, background paper prepared for ASEAN Community 2015: Managing integration for better jobs and shared prosperity (Bangkok, ILO).
Myanmar Marketing Research and Development. Forthcoming. ASEAN Community 2015: Impact of ASEAN integration on Myanmar’s labour market: Rapid assessment of enterprises in Yangon, background paper prepared for ASEAN Community 2015: Managing integration for better jobs and shared prosperity (Bangkok, ILO).
Plummer, M.; Petri, P.; Zhai, F. Forthcoming. Assessing the impacts of ASEAN economic integration on labour markets, background paper prepared for ASEAN Community 2015: Managing integration for better jobs and shared prosperity (Bangkok, ILO).
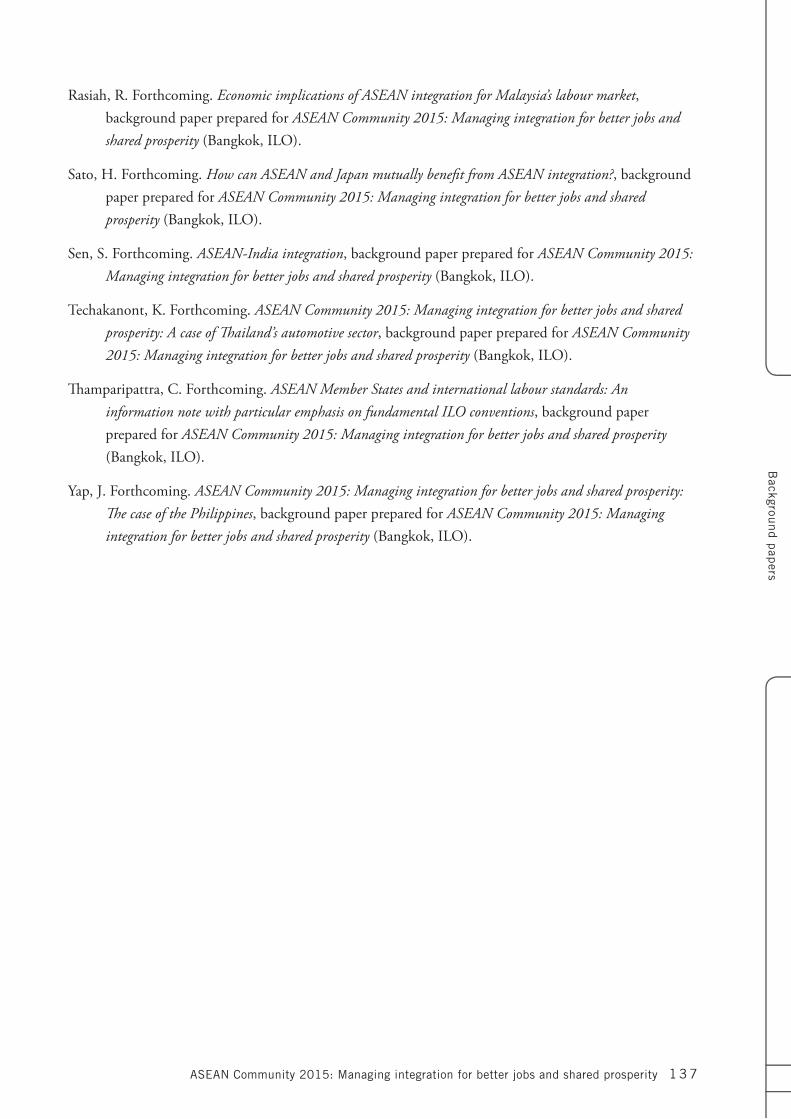
Backgrou
nd p
apers
ASEAN Community 2015: Managing integration for better jobs and shared prosperity 1 3 7
Rasiah, R. Forthcoming. Economic implications of ASEAN integration for Malaysia’s labour market, background paper prepared for ASEAN Community 2015: Managing integration for better jobs and shared prosperity (Bangkok, ILO).
Sato, H. Forthcoming. How can ASEAN and Japan mutually benefit from ASEAN integration?, background paper prepared for ASEAN Community 2015: Managing integration for better jobs and shared prosperity (Bangkok, ILO).
Sen, S. Forthcoming. ASEAN-India integration, background paper prepared for ASEAN Community 2015: Managing integration for better jobs and shared prosperity (Bangkok, ILO).
Techakanont, K. Forthcoming. ASEAN Community 2015: Managing integration for better jobs and shared prosperity: A case of Thailand’s automotive sector, background paper prepared for ASEAN Community 2015: Managing integration for better jobs and shared prosperity (Bangkok, ILO).
Thamparipattra, C. Forthcoming. ASEAN Member States and international labour standards: An information note with particular emphasis on fundamental ILO conventions, background paper prepared for ASEAN Community 2015: Managing integration for better jobs and shared prosperity (Bangkok, ILO).
Yap, J. Forthcoming. ASEAN Community 2015: Managing integration for better jobs and shared prosperity: The case of the Philippines, background paper prepared for ASEAN Community 2015: Managing integration for better jobs and shared prosperity (Bangkok, ILO).