Embed Size (px)
Citation preview
© Centre for Economics and Business Research 2015
Asda Income Tracker Report: December 2015
Released: January 2016
Centre for Economics and
Business Research ltd Unit 1, 4 Bath Street, London
EC1V 9DX
t 020 7324 2850
w www.cebr.com
M a k i n g B u s i n e s s S e n s e
© Centre for Economics and Business Research 2015
Contents
Introduction 03
Headlines 04
Constructing the Income Tracker 05
Dashboard 06
Income Tracker trends 07
Cost of living 09
Labour market 11
Regional trends 12
Contact 16
Data charts & tables 17
Method update 22
Method notes 24
Disclaimer 26
Asda Income Tracker
2
© Centre for Economics and Business Research 2015
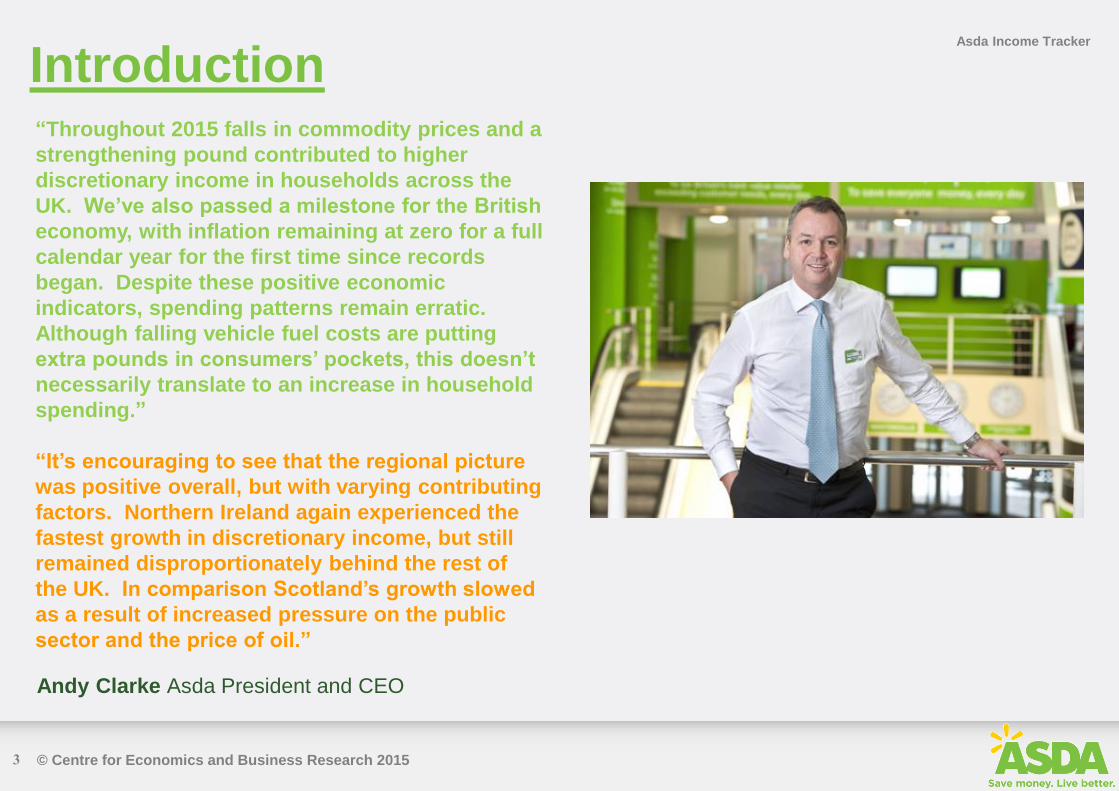
“Throughout 2015 falls in commodity prices and a
strengthening pound contributed to higher
discretionary income in households across the
UK. We’ve also passed a milestone for the British
economy, with inflation remaining at zero for a full
calendar year for the first time since records
began. Despite these positive economic
indicators, spending patterns remain erratic.
Although falling vehicle fuel costs are putting
extra pounds in consumers’ pockets, this doesn’t
necessarily translate to an increase in household
spending.”
“It’s encouraging to see that the regional picture
was positive overall, but with varying contributing
factors. Northern Ireland again experienced the
fastest growth in discretionary income, but still
remained disproportionately behind the rest of
the UK. In comparison Scotland’s growth slowed
as a result of increased pressure on the public
sector and the price of oil.”
Introduction Asda Income Tracker
Andy Clarke Asda President and CEO
3
© Centre for Economics and Business Research 2015
Headlines – Asda Income Tracker
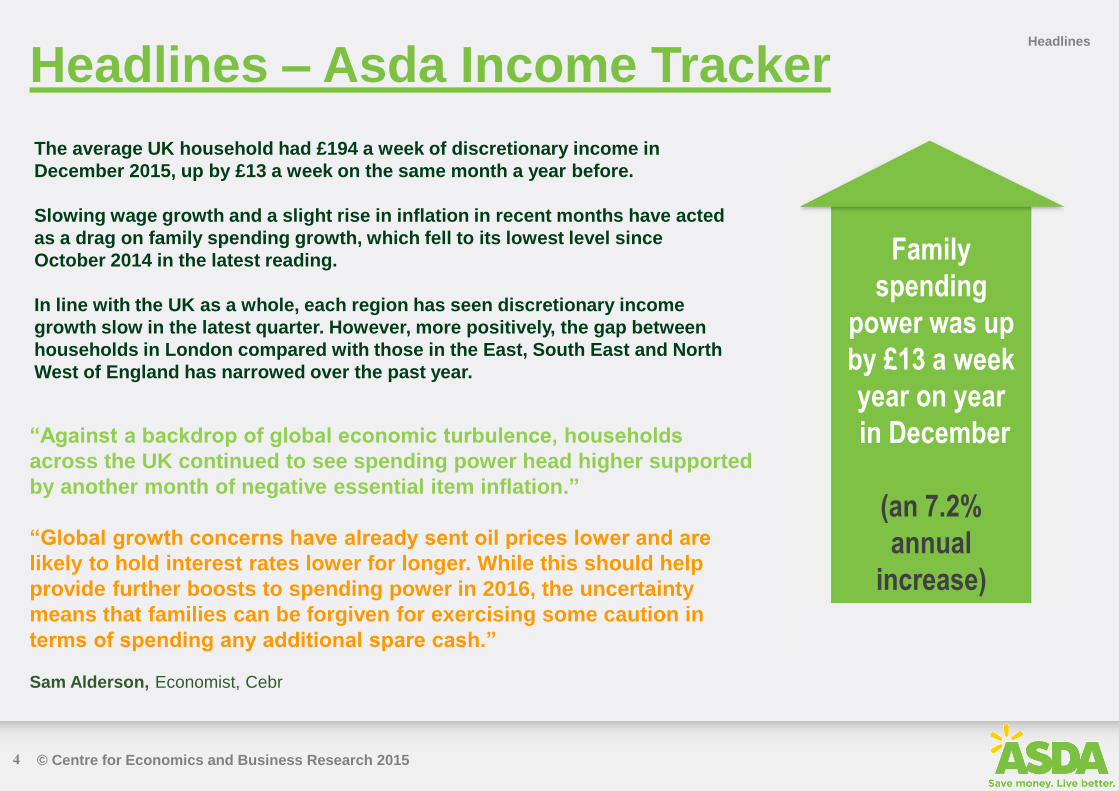
The average UK household had £194 a week of discretionary income in
December 2015, up by £13 a week on the same month a year before.
Slowing wage growth and a slight rise in inflation in recent months have acted
as a drag on family spending growth, which fell to its lowest level since
October 2014 in the latest reading.
In line with the UK as a whole, each region has seen discretionary income
growth slow in the latest quarter. However, more positively, the gap between
households in London compared with those in the East, South East and North
West of England has narrowed over the past year.
Headlines
“Against a backdrop of global economic turbulence, households
across the UK continued to see spending power head higher supported
by another month of negative essential item inflation.”
“Global growth concerns have already sent oil prices lower and are
likely to hold interest rates lower for longer. While this should help
provide further boosts to spending power in 2016, the uncertainty
means that families can be forgiven for exercising some caution in
terms of spending any additional spare cash.” Sam Alderson, Economist, Cebr
Family
spending
power was up
by £13 a week
year on year
in December
(an 7.2%
annual
increase)
4
© Centre for Economics and Business Research 2015
Constructing the Asda Income Tracker
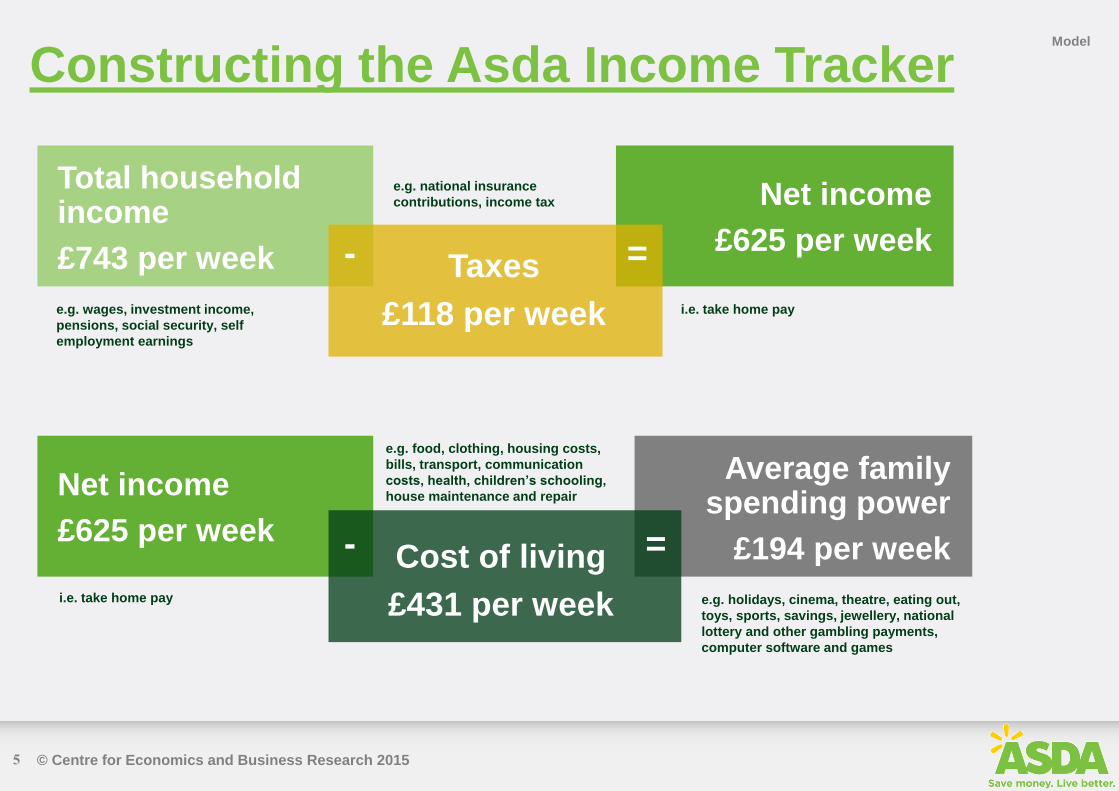
Total household income £743 per week
e.g. wages, investment income,
pensions, social security, self
employment earnings
e.g. national insurance
contributions, income tax
e.g. holidays, cinema, theatre, eating out,
toys, sports, savings, jewellery, national
lottery and other gambling payments,
computer software and games
e.g. food, clothing, housing costs,
bills, transport, communication
costs, health, children’s schooling,
house maintenance and repair
i.e. take home pay
i.e. take home pay
Taxes
£118 per week
= -
Net income
£625 per week
Cost of living
£431 per week
= -
Net income £625 per week
Average family spending power
£194 per week
Model
5

© Centre for Economics and Business Research 2015
Asda Income Tracker Dashboard: December
Annual percentage change Indicator
+1.9% (excl. bonuses) Regular earnings growth (Nov)
5.1% (-0.8 % points on year) Unemployment rate (Nov)
Recent trend
+2.4% Net income
-1.6% Mortgage costs
-2.9% Food & non-alcoholic drinks
-11.4% Vehicle fuels
-4.0% Home electricity, gas & fuel
-0.1% Essential item inflation
+7.2% Family spending power
KEY IMPROVING TREND NO SIGNIFICANT CHANGE IN TREND DETERIORATING TREND
Dashboard
+1.9% (+588,000 employment on year) Employment growth (Nov)
6
* three-month average, to month stated **unemployment rate for three months to month stated
© Centre for Economics and Business Research 2015
Annual increase in spending power
continues to slow
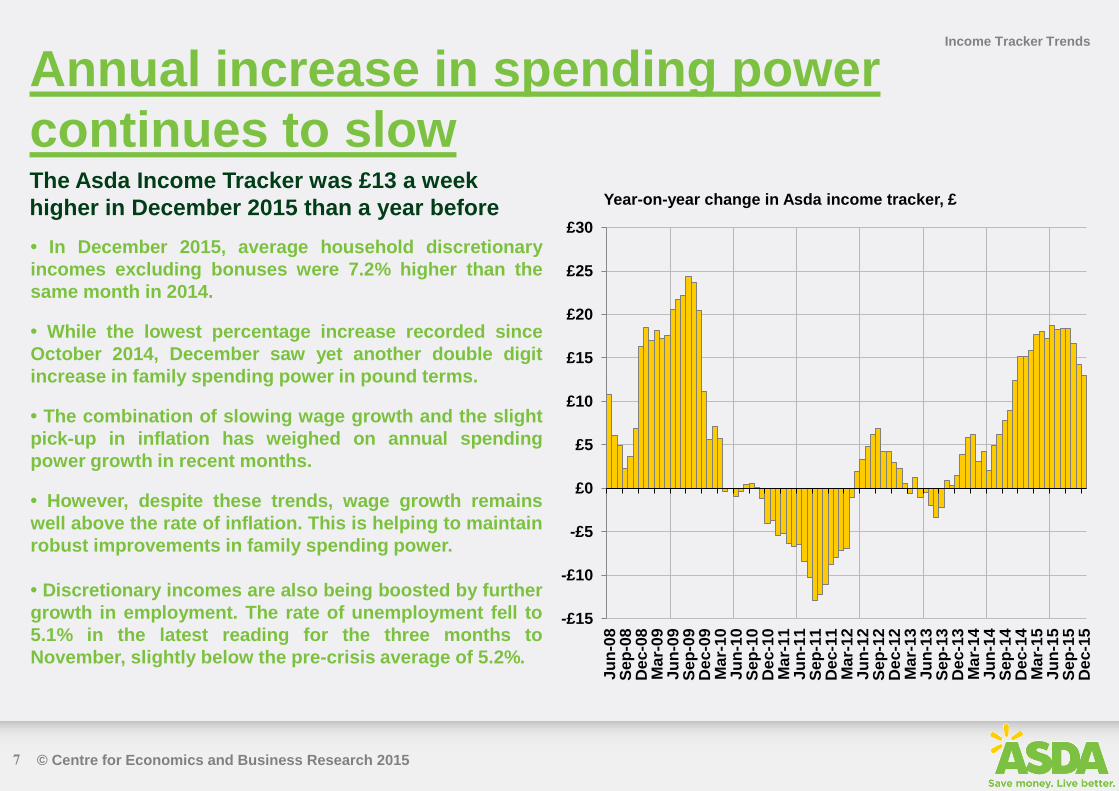
• In December 2015, average household discretionary
incomes excluding bonuses were 7.2% higher than the
same month in 2014.
• While the lowest percentage increase recorded since
October 2014, December saw yet another double digit
increase in family spending power in pound terms.
• The combination of slowing wage growth and the slight
pick-up in inflation has weighed on annual spending
power growth in recent months.
• However, despite these trends, wage growth remains
well above the rate of inflation. This is helping to maintain
robust improvements in family spending power.
• Discretionary incomes are also being boosted by further
growth in employment. The rate of unemployment fell to
5.1% in the latest reading for the three months to
November, slightly below the pre-crisis average of 5.2%.
Income Tracker Trends
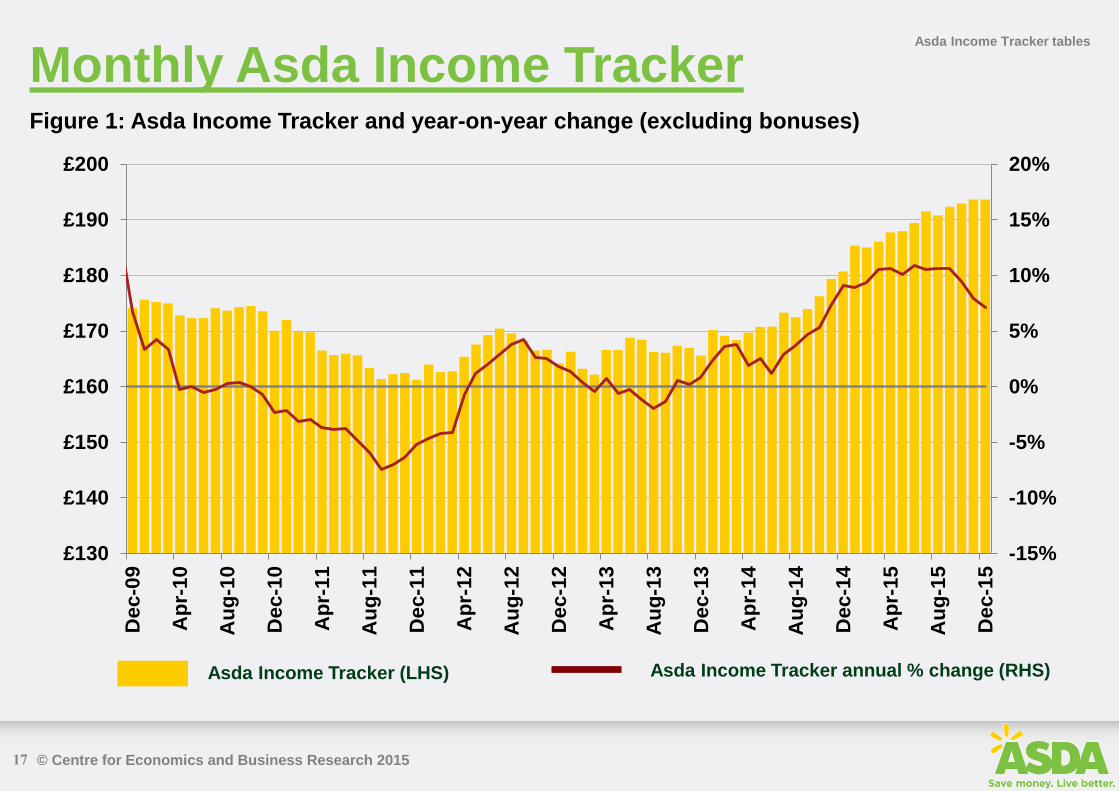
Year-on-year change in Asda income tracker, £ The Asda Income Tracker was £13 a week
higher in December 2015 than a year before
-£15
-£10
-£5
£0
£5
£10
£15
£20
£25
£30
Ju
n-0
8S
ep
-08
De
c-0
8M
ar-
09
Ju
n-0
9S
ep
-09
De
c-0
9M
ar-
10
Ju
n-1
0S
ep
-10
De
c-1
0M
ar-
11
Ju
n-1
1S
ep
-11
De
c-1
1M
ar-
12
Ju
n-1
2S
ep
-12
De
c-1
2M
ar-
13
Ju
n-1
3S
ep
-13
De
c-1
3M
ar-
14
Ju
n-1
4S
ep
-14
De
c-1
4M
ar-
15
Ju
n-1
5S
ep
-15
De
c-1
5
7
© Centre for Economics and Business Research 2015
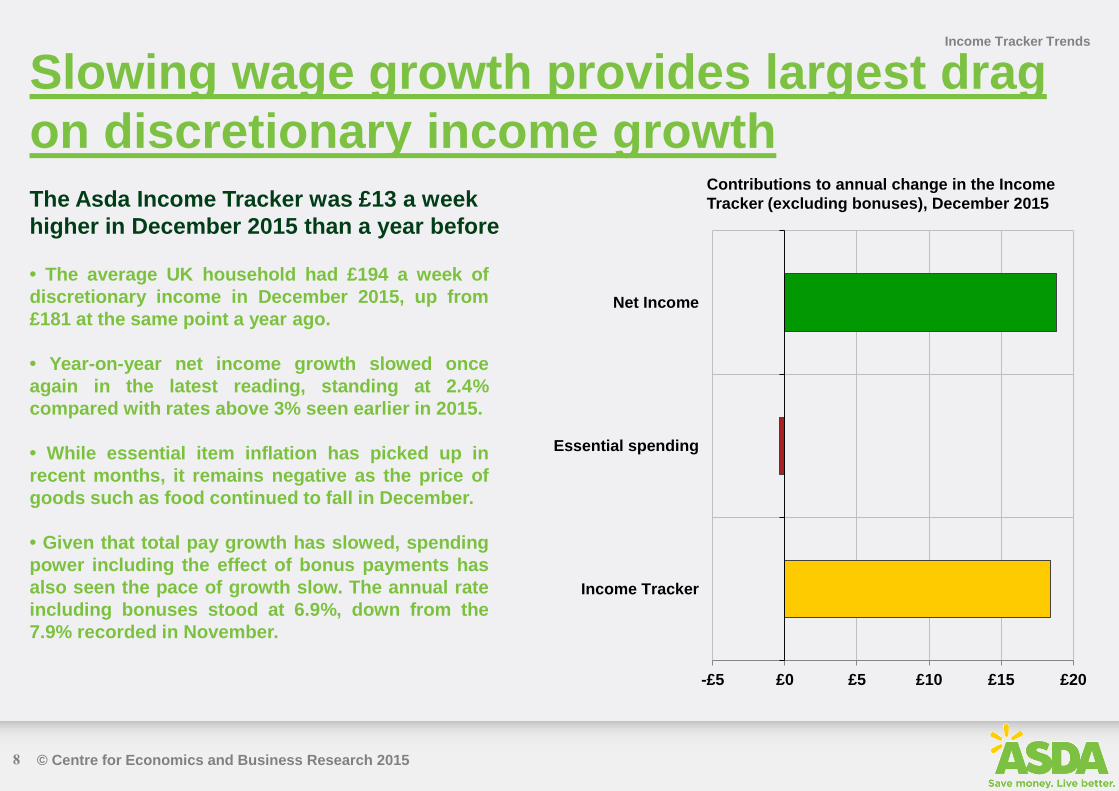
• The average UK household had £194 a week of
discretionary income in December 2015, up from
£181 at the same point a year ago.
• Year-on-year net income growth slowed once
again in the latest reading, standing at 2.4%
compared with rates above 3% seen earlier in 2015.
• While essential item inflation has picked up in
recent months, it remains negative as the price of
goods such as food continued to fall in December.
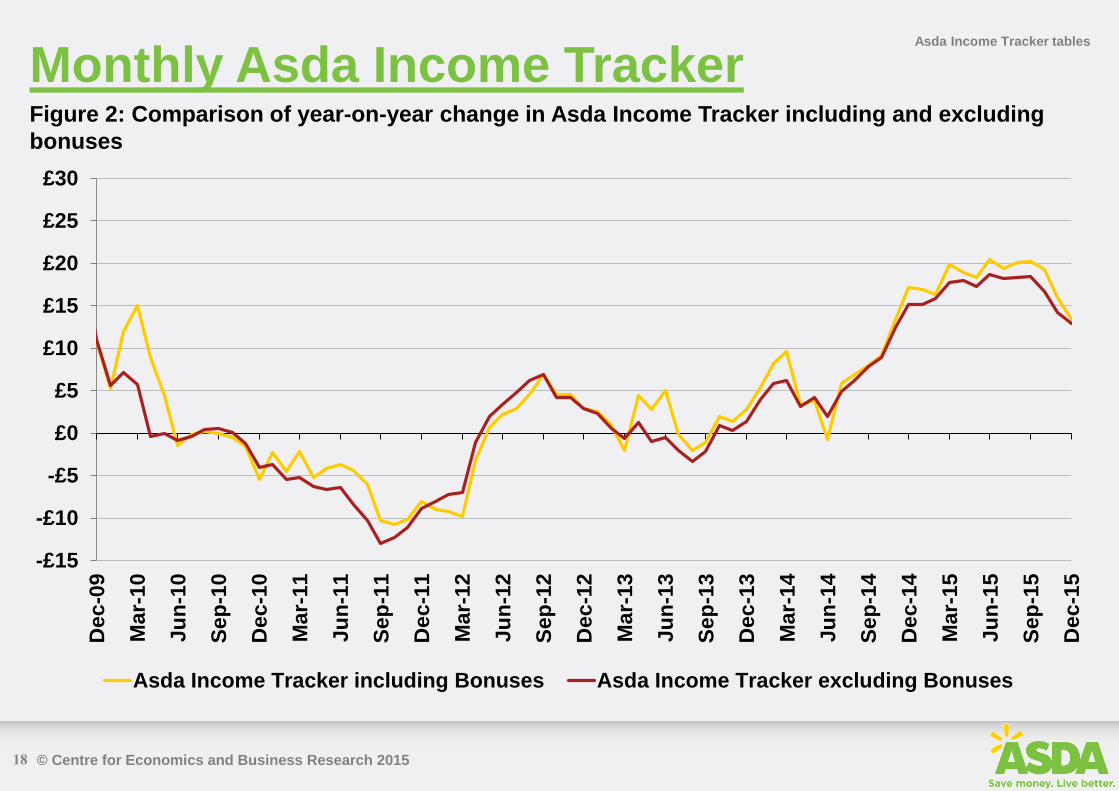
• Given that total pay growth has slowed, spending
power including the effect of bonus payments has
also seen the pace of growth slow. The annual rate
including bonuses stood at 6.9%, down from the
7.9% recorded in November.
Contributions to annual change in the Income
Tracker (excluding bonuses), December 2015
Slowing wage growth provides largest drag
on discretionary income growth
-£5 £0 £5 £10 £15 £20
Income Tracker
Essential spending
Net Income
Income Tracker Trends
8
The Asda Income Tracker was £13 a week
higher in December 2015 than a year before
© Centre for Economics and Business Research 2015
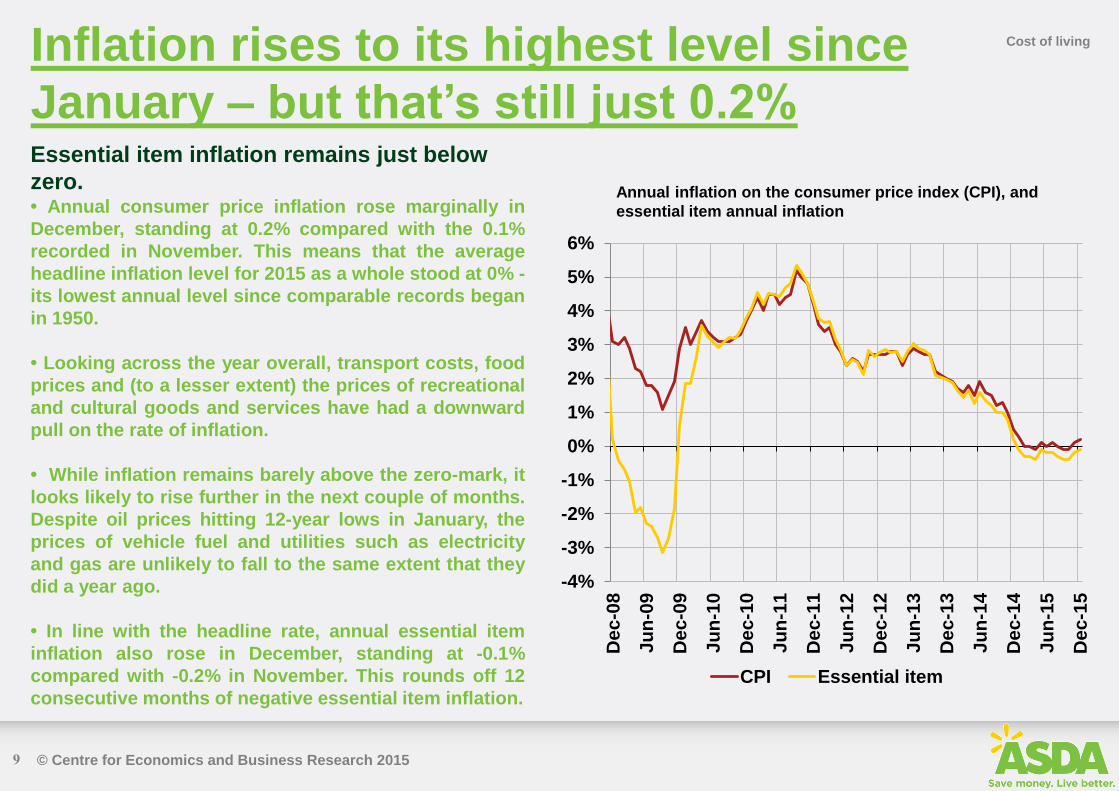
Inflation rises to its highest level since
January – but that’s still just 0.2%
• Annual consumer price inflation rose marginally in
December, standing at 0.2% compared with the 0.1%
recorded in November. This means that the average
headline inflation level for 2015 as a whole stood at 0% -
its lowest annual level since comparable records began
in 1950.
• Looking across the year overall, transport costs, food
prices and (to a lesser extent) the prices of recreational
and cultural goods and services have had a downward
pull on the rate of inflation.
• While inflation remains barely above the zero-mark, it
looks likely to rise further in the next couple of months.
Despite oil prices hitting 12-year lows in January, the
prices of vehicle fuel and utilities such as electricity
and gas are unlikely to fall to the same extent that they
did a year ago.
• In line with the headline rate, annual essential item
inflation also rose in December, standing at -0.1%
compared with -0.2% in November. This rounds off 12
consecutive months of negative essential item inflation.
Cost of living
Essential item inflation remains just below
zero. Annual inflation on the consumer price index (CPI), and
essential item annual inflation
9
-4%
-3%
-2%
-1%
0%
1%
2%
3%
4%
5%
6%
De
c-0
8
Ju
n-0
9
De
c-0
9
Ju
n-1
0
De
c-1
0
Ju
n-1
1
De
c-1
1
Ju
n-1
2
De
c-1
2
Ju
n-1
3
De
c-1
3
Ju
n-1
4
De
c-1
4
Ju
n-1
5
De
c-1
5
CPI Essential item
© Centre for Economics and Business Research 2015
Cost of living
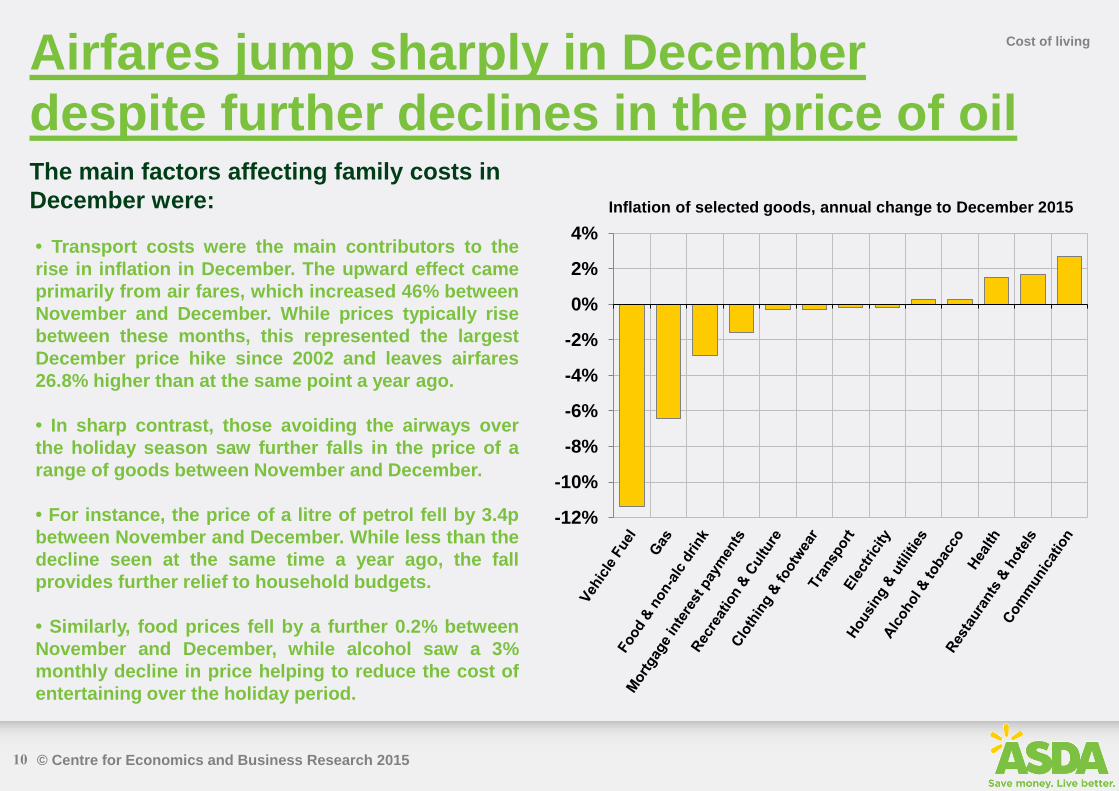
The main factors affecting family costs in
December were:
• Transport costs were the main contributors to the
rise in inflation in December. The upward effect came
primarily from air fares, which increased 46% between
November and December. While prices typically rise
between these months, this represented the largest
December price hike since 2002 and leaves airfares
26.8% higher than at the same point a year ago.
• In sharp contrast, those avoiding the airways over
the holiday season saw further falls in the price of a
range of goods between November and December.
• For instance, the price of a litre of petrol fell by 3.4p
between November and December. While less than the
decline seen at the same time a year ago, the fall
provides further relief to household budgets.
• Similarly, food prices fell by a further 0.2% between
November and December, while alcohol saw a 3%
monthly decline in price helping to reduce the cost of
entertaining over the holiday period.
Inflation of selected goods, annual change to December 2015
-12%
-10%
-8%
-6%
-4%
-2%
0%
2%
4%
10
Airfares jump sharply in December
despite further declines in the price of oil
© Centre for Economics and Business Research 2015
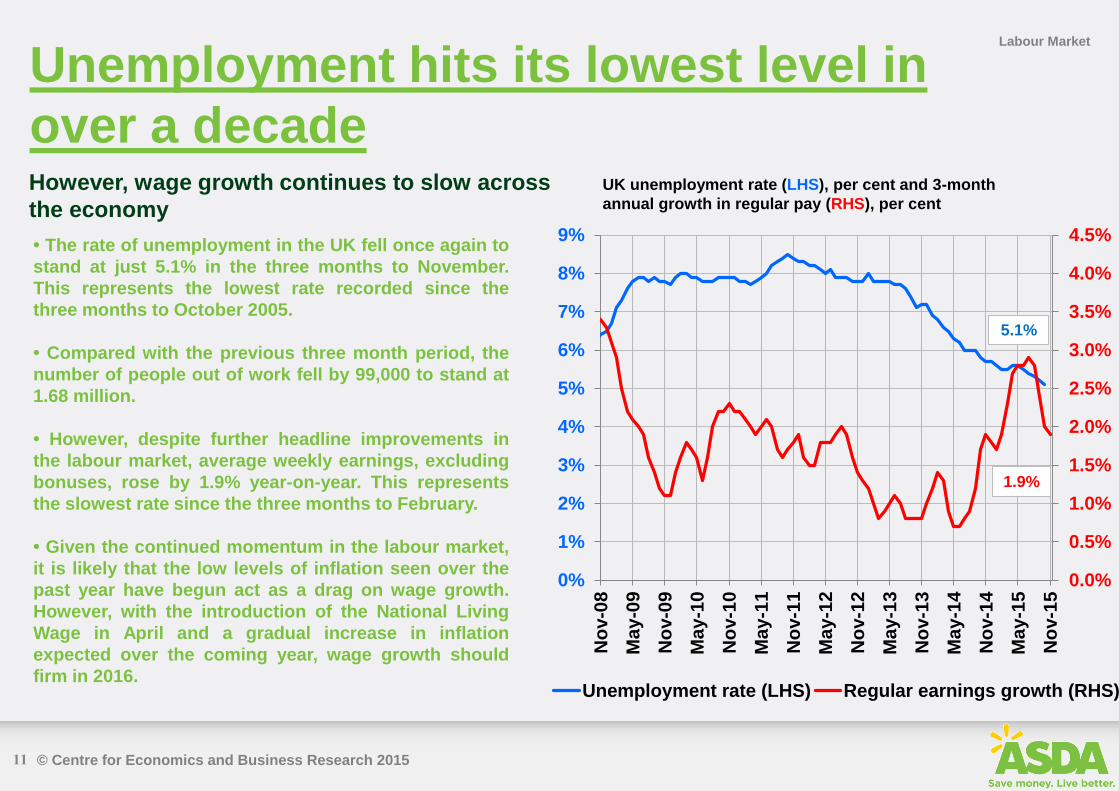
Labour Market
UK unemployment rate (LHS), per cent and 3-month
annual growth in regular pay (RHS), per cent
• The rate of unemployment in the UK fell once again to
stand at just 5.1% in the three months to November.
This represents the lowest rate recorded since the
three months to October 2005.
• Compared with the previous three month period, the
number of people out of work fell by 99,000 to stand at
1.68 million.
• However, despite further headline improvements in
the labour market, average weekly earnings, excluding
bonuses, rose by 1.9% year-on-year. This represents
the slowest rate since the three months to February.
• Given the continued momentum in the labour market,
it is likely that the low levels of inflation seen over the
past year have begun act as a drag on wage growth.
However, with the introduction of the National Living
Wage in April and a gradual increase in inflation
expected over the coming year, wage growth should
firm in 2016.
However, wage growth continues to slow across
the economy
Unemployment hits its lowest level in
over a decade
11
0.0%
0.5%
1.0%
1.5%
2.0%
2.5%
3.0%
3.5%
4.0%
4.5%
0%
1%
2%
3%
4%
5%
6%
7%
8%
9%
No
v-0
8
May-0
9
No
v-0
9
Ma
y-1
0
No
v-1
0
Ma
y-1
1
No
v-1
1
Ma
y-1
2
No
v-1
2
Ma
y-1
3
No
v-1
3
Ma
y-1
4
No
v-1
4
Ma
y-1
5
No
v-1
5
Unemployment rate (LHS) Regular earnings growth (RHS)
5.1%
1.9%
© Centre for Economics and Business Research 2015
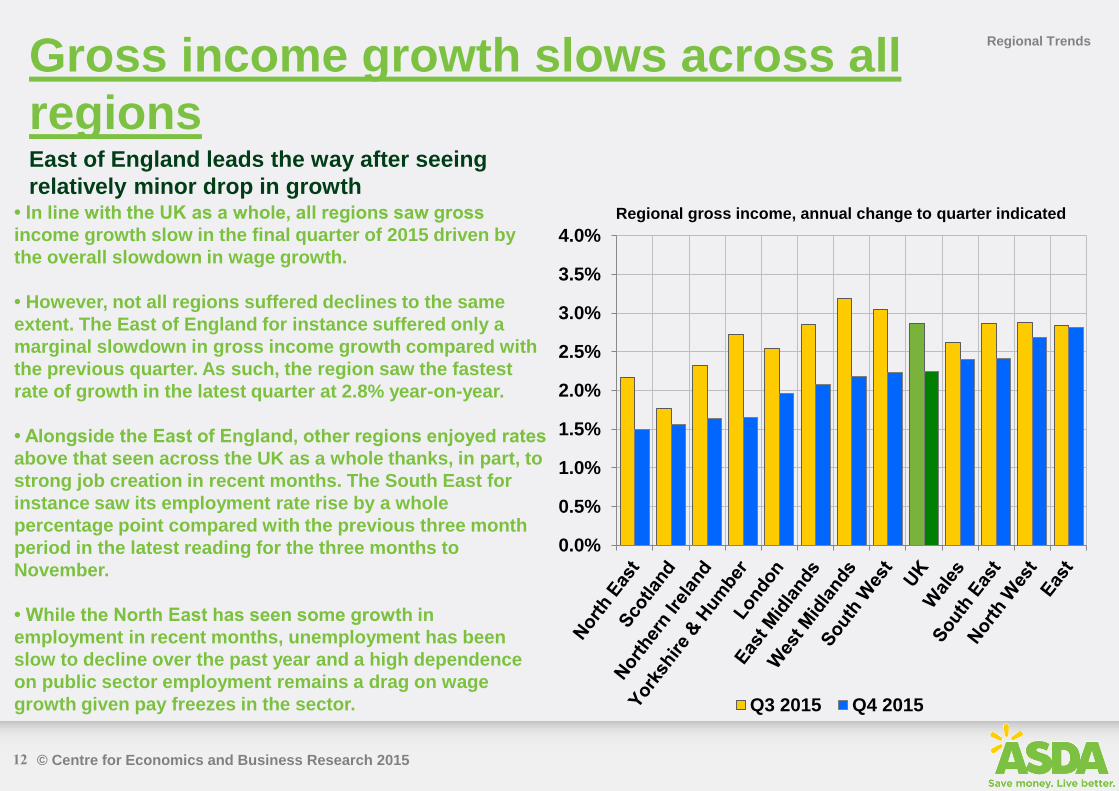
Gross income growth slows across all
regions
Regional Trends
Regional gross income, annual change to quarter indicated
East of England leads the way after seeing
relatively minor drop in growth • In line with the UK as a whole, all regions saw gross
income growth slow in the final quarter of 2015 driven by
the overall slowdown in wage growth.
• However, not all regions suffered declines to the same
extent. The East of England for instance suffered only a
marginal slowdown in gross income growth compared with
the previous quarter. As such, the region saw the fastest
rate of growth in the latest quarter at 2.8% year-on-year.
• Alongside the East of England, other regions enjoyed rates
above that seen across the UK as a whole thanks, in part, to
strong job creation in recent months. The South East for
instance saw its employment rate rise by a whole
percentage point compared with the previous three month
period in the latest reading for the three months to
November.
• While the North East has seen some growth in
employment in recent months, unemployment has been
slow to decline over the past year and a high dependence
on public sector employment remains a drag on wage
growth given pay freezes in the sector.
0.0%
0.5%
1.0%
1.5%
2.0%
2.5%
3.0%
3.5%
4.0%
Q3 2015 Q4 2015
12
© Centre for Economics and Business Research 2015
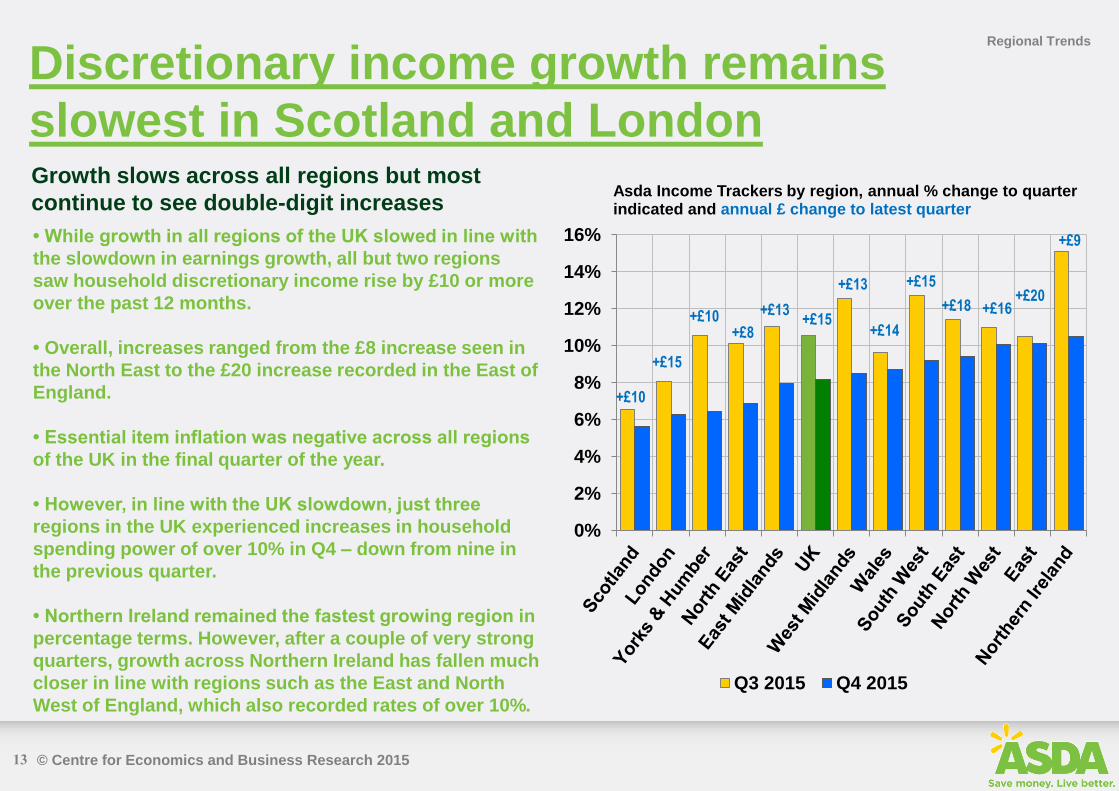
Discretionary income growth remains
slowest in Scotland and London
Regional Trends
Asda Income Trackers by region, annual % change to quarter indicated and annual £ change to latest quarter
Growth slows across all regions but most
continue to see double-digit increases
• While growth in all regions of the UK slowed in line with
the slowdown in earnings growth, all but two regions
saw household discretionary income rise by £10 or more
over the past 12 months.
• Overall, increases ranged from the £8 increase seen in
the North East to the £20 increase recorded in the East of
England.
• Essential item inflation was negative across all regions
of the UK in the final quarter of the year.
• However, in line with the UK slowdown, just three
regions in the UK experienced increases in household
spending power of over 10% in Q4 – down from nine in
the previous quarter.
• Northern Ireland remained the fastest growing region in
percentage terms. However, after a couple of very strong
quarters, growth across Northern Ireland has fallen much
closer in line with regions such as the East and North
West of England, which also recorded rates of over 10%.
0%
2%
4%
6%
8%
10%
12%
14%
16%
Q3 2015 Q4 2015
13
+£10
+£15
+£10 +£8
+£13 +£15
+£13
+£14
+£15
+£18 +£16 +£20
+£9
© Centre for Economics and Business Research 2015
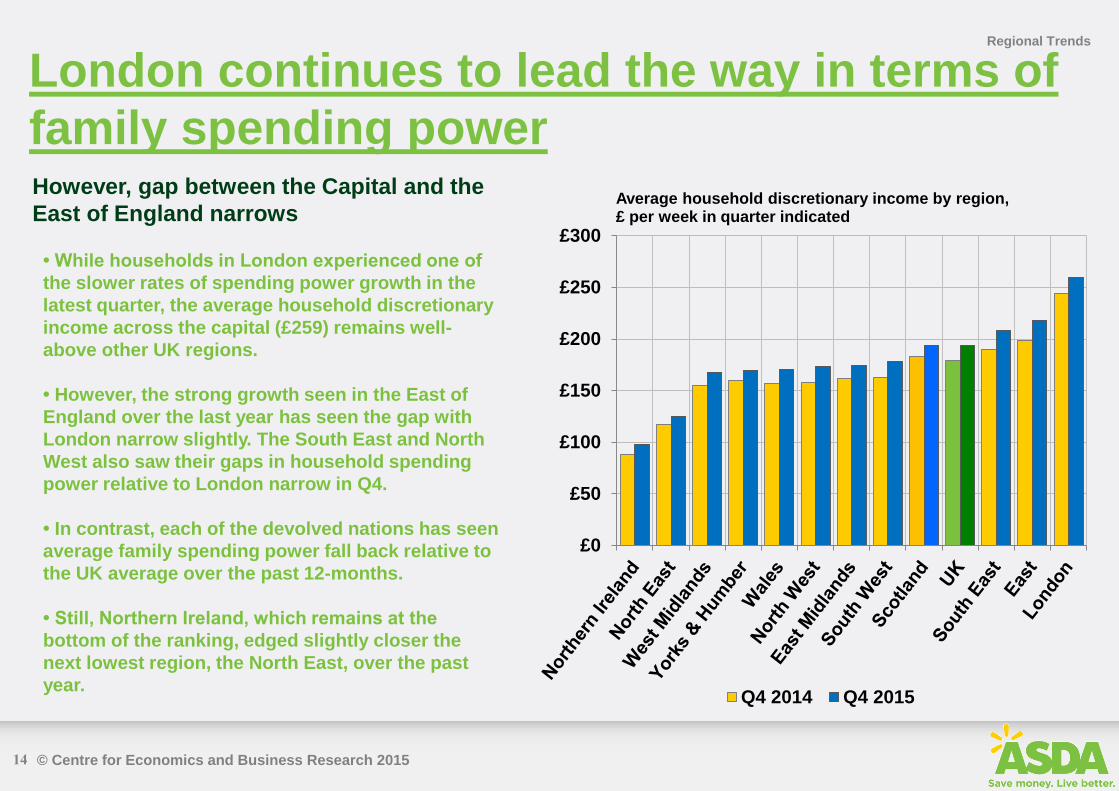
London continues to lead the way in terms of
family spending power
Regional Trends
Average household discretionary income by region, £ per week in quarter indicated
However, gap between the Capital and the
East of England narrows
• While households in London experienced one of
the slower rates of spending power growth in the
latest quarter, the average household discretionary
income across the capital (£259) remains well-
above other UK regions.
• However, the strong growth seen in the East of
England over the last year has seen the gap with
London narrow slightly. The South East and North
West also saw their gaps in household spending
power relative to London narrow in Q4.
• In contrast, each of the devolved nations has seen
average family spending power fall back relative to
the UK average over the past 12-months.
• Still, Northern Ireland, which remains at the
bottom of the ranking, edged slightly closer the
next lowest region, the North East, over the past
year.
£0
£50
£100
£150
£200
£250
£300
Q4 2014 Q4 2015
14
© Centre for Economics and Business Research 2015
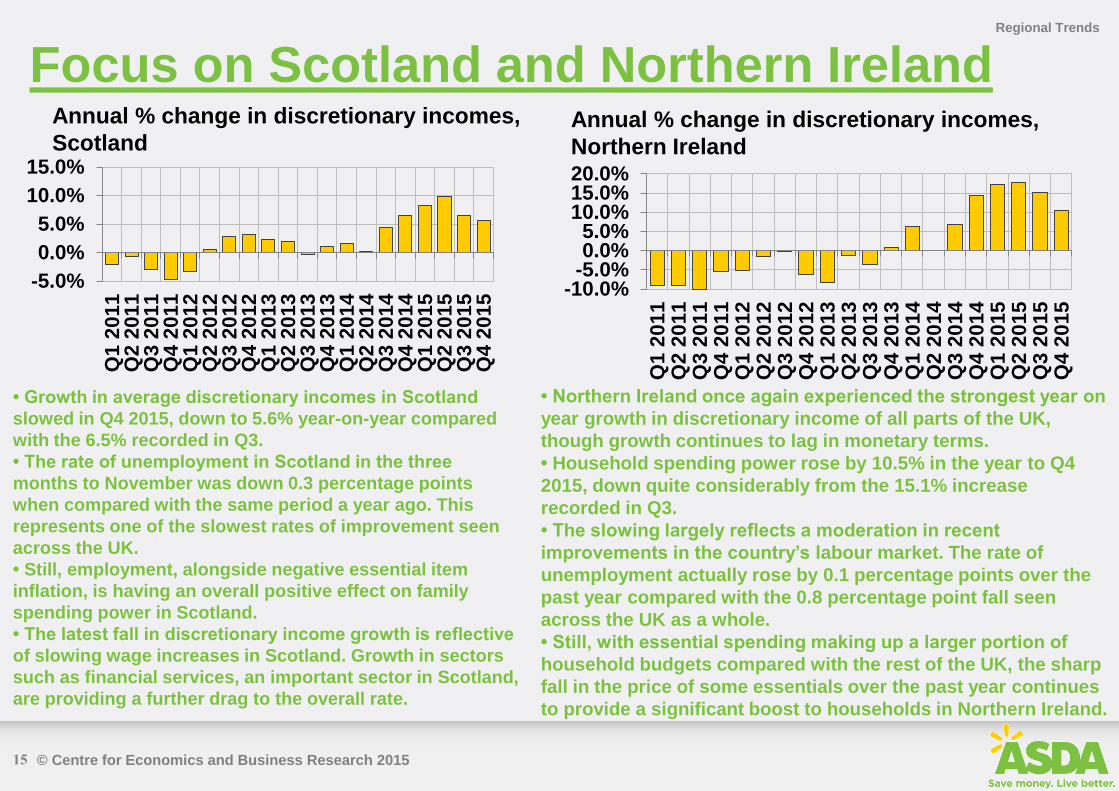
Focus on Scotland and Northern Ireland Annual % change in discretionary incomes,
Scotland
Regional Trends
15
-5.0%
0.0%
5.0%
10.0%
15.0%
Q1
20
11
Q2
20
11
Q3
20
11
Q4
20
11
Q1
20
12
Q2
20
12
Q3
20
12
Q4
20
12
Q1
20
13
Q2
20
13
Q3 2
013
Q4
20
13
Q1
20
14
Q2
20
14
Q3
20
14
Q4
20
14
Q1
20
15
Q2
20
15
Q3
20
15
Q4
20
15
Annual % change in discretionary incomes,
Northern Ireland
-10.0%-5.0%0.0%5.0%
10.0%15.0%20.0%
Q1
20
11
Q2
20
11
Q3
20
11
Q4
20
11
Q1
20
12
Q2
20
12
Q3
20
12
Q4
20
12
Q1
20
13
Q2
20
13
Q3
20
13
Q4
20
13
Q1
20
14
Q2 2
014
Q3
20
14
Q4
20
14
Q1
20
15
Q2
20
15
Q3
20
15
Q4
20
15
• Growth in average discretionary incomes in Scotland
slowed in Q4 2015, down to 5.6% year-on-year compared
with the 6.5% recorded in Q3.
• The rate of unemployment in Scotland in the three
months to November was down 0.3 percentage points
when compared with the same period a year ago. This
represents one of the slowest rates of improvement seen
across the UK.
• Still, employment, alongside negative essential item
inflation, is having an overall positive effect on family
spending power in Scotland.
• The latest fall in discretionary income growth is reflective
of slowing wage increases in Scotland. Growth in sectors
such as financial services, an important sector in Scotland,
are providing a further drag to the overall rate.
• Northern Ireland once again experienced the strongest year on
year growth in discretionary income of all parts of the UK,
though growth continues to lag in monetary terms.
• Household spending power rose by 10.5% in the year to Q4
2015, down quite considerably from the 15.1% increase
recorded in Q3.
• The slowing largely reflects a moderation in recent
improvements in the country’s labour market. The rate of
unemployment actually rose by 0.1 percentage points over the
past year compared with the 0.8 percentage point fall seen
across the UK as a whole.
• Still, with essential spending making up a larger portion of
household budgets compared with the rest of the UK, the sharp
fall in the price of some essentials over the past year continues
to provide a significant boost to households in Northern Ireland.
© Centre for Economics and Business Research 2015
Data and Method
Please find attached method notes and the tabulated date. Asda produces a
monthly income tracker report with a more comprehensive report every quarter.
For press enquiries please contact:
Andrew Devoy, Asda PR Manager,
[email protected] ; 0113 826 4823
For data enquiries please contact:
Sam Alderson, Cebr Economist,
[email protected] ; 020 7324 2874
Appendix
16
© Centre for Economics and Business Research 2015
Monthly Asda Income Tracker Asda Income Tracker tables
Asda Income Tracker (LHS) Asda Income Tracker annual % change (RHS)
Figure 1: Asda Income Tracker and year-on-year change (excluding bonuses)
17
-15%
-10%
-5%
0%
5%
10%
15%
20%
£130
£140
£150
£160
£170
£180
£190
£200
De
c-0
9
Ap
r-1
0
Au
g-1
0
De
c-1
0
Ap
r-1
1
Au
g-1
1
Dec-1
1
Ap
r-1
2
Au
g-1
2
De
c-1
2
Ap
r-1
3
Au
g-1
3
De
c-1
3
Ap
r-1
4
Au
g-1
4
De
c-1
4
Ap
r-1
5
Au
g-1
5
De
c-1
5
© Centre for Economics and Business Research 2015
Monthly Asda Income Tracker Figure 2: Comparison of year-on-year change in Asda Income Tracker including and excluding
bonuses
Asda Income Tracker tables
-£15
-£10
-£5
£0
£5
£10
£15
£20
£25
£30
Dec
-09
Mar-
10
Ju
n-1
0
Sep
-10
Dec
-10
Mar-
11
Ju
n-1
1
Sep
-11
De
c-1
1
Mar-
12
Ju
n-1
2
Sep
-12
Dec
-12
Mar-
13
Ju
n-1
3
Sep
-13
Dec
-13
Mar-
14
Ju
n-1
4
Sep
-14
Dec
-14
Mar-
15
Ju
n-1
5
Sep
-15
Dec
-15
Asda Income Tracker including Bonuses Asda Income Tracker excluding Bonuses
18
© Centre for Economics and Business Research 2015
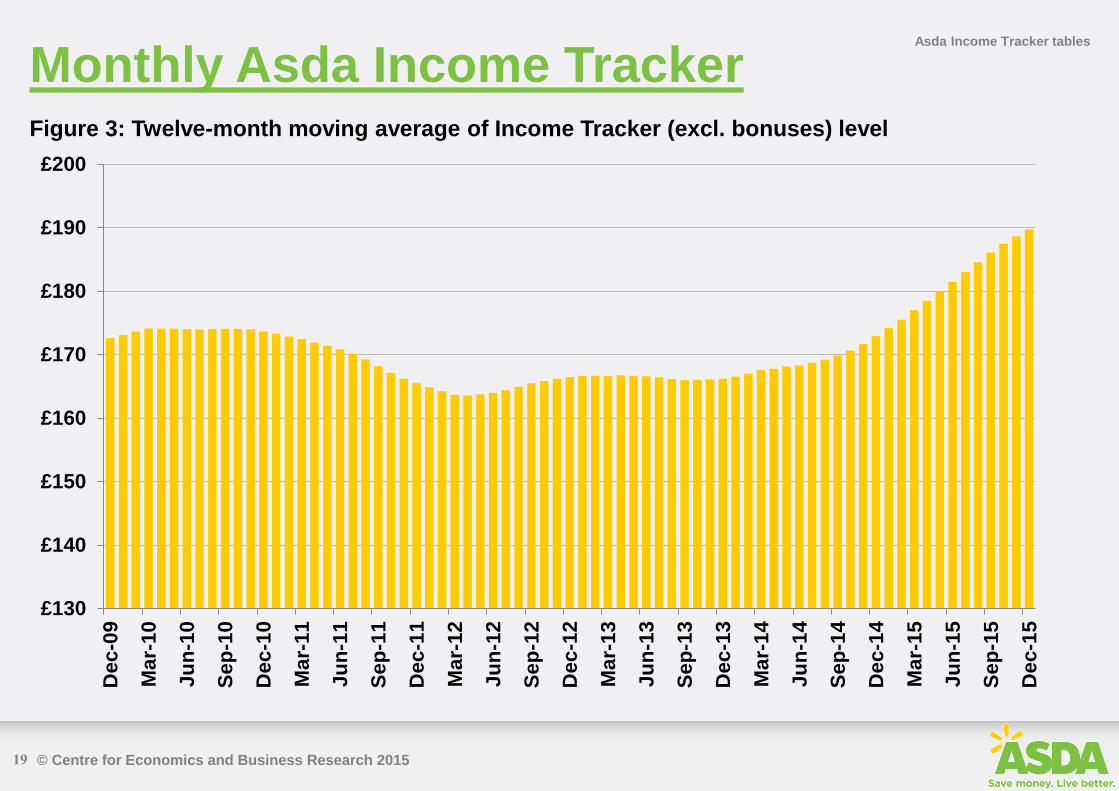
Monthly Asda Income Tracker Figure 3: Twelve-month moving average of Income Tracker (excl. bonuses) level
Asda Income Tracker tables
19
£130
£140
£150
£160
£170
£180
£190
£200
De
c-0
9
Ma
r-1
0
Ju
n-1
0
Se
p-1
0
De
c-1
0
Mar-
11
Ju
n-1
1
Se
p-1
1
De
c-1
1
Ma
r-1
2
Ju
n-1
2
Se
p-1
2
De
c-1
2
Ma
r-1
3
Ju
n-1
3
Se
p-1
3
De
c-1
3
Ma
r-1
4
Ju
n-1
4
Se
p-1
4
De
c-1
4
Ma
r-1
5
Ju
n-1
5
Se
p-1
5
De
c-1
5
© Centre for Economics and Business Research 2015
Monthly Asda Income Tracker
Month Income tracker Month Income tracker Month Income tracker Month Income tracker
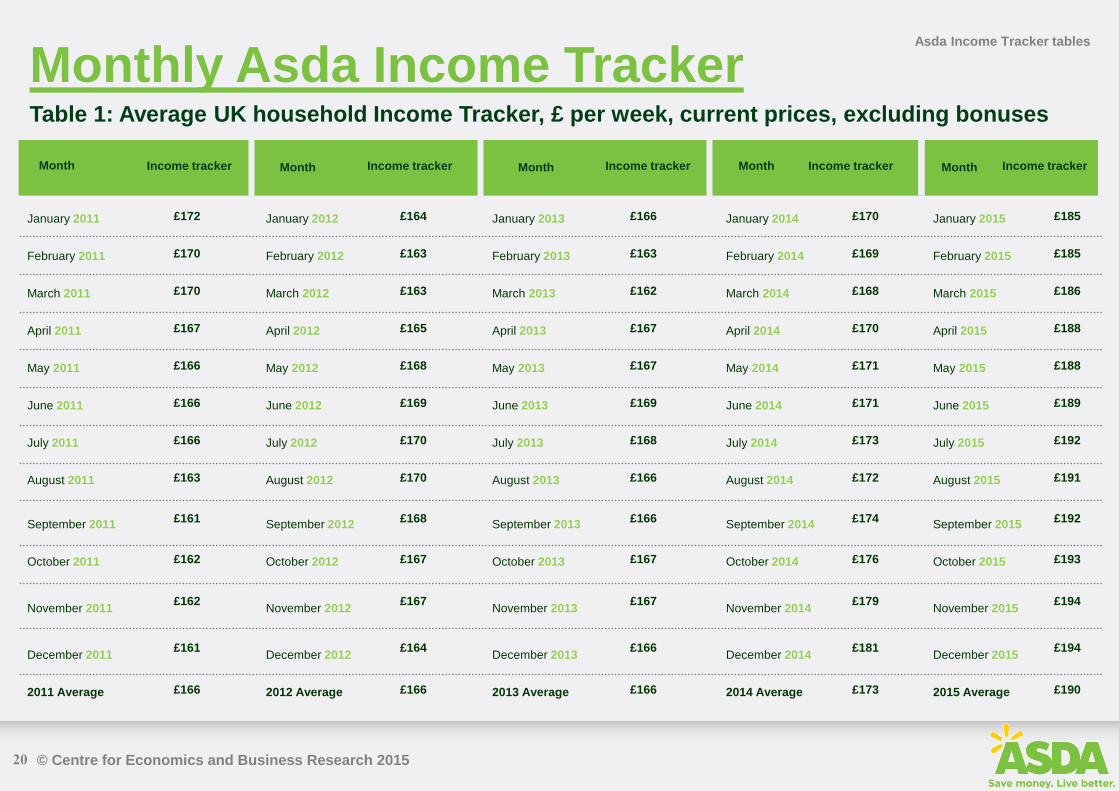
Table 1: Average UK household Income Tracker, £ per week, current prices, excluding bonuses
Income tracker Month
Asda Income Tracker tables
January 2011 £172 January 2012 £164 January 2013 £166 January 2014 £170 January 2015 £185
February 2011 £170 February 2012 £163 February 2013 £163 February 2014 £169 February 2015 £185
March 2011 £170 March 2012 £163 March 2013 £162 March 2014 £168 March 2015 £186
April 2011 £167 April 2012 £165 April 2013 £167 April 2014 £170 April 2015 £188
May 2011 £166 May 2012 £168 May 2013 £167 May 2014 £171 May 2015 £188
June 2011 £166 June 2012 £169 June 2013 £169 June 2014 £171 June 2015 £189
July 2011 £166 July 2012 £170 July 2013 £168 July 2014 £173 July 2015 £192
August 2011 £163 August 2012 £170 August 2013 £166 August 2014 £172 August 2015 £191
September 2011 £161
September 2012 £168
September 2013 £166
September 2014 £174
September 2015 £192
October 2011 £162 October 2012 £167 October 2013 £167 October 2014 £176 October 2015 £193
November 2011 £162
November 2012 £167
November 2013 £167
November 2014 £179
November 2015 £194
December 2011 £161
December 2012 £164
December 2013 £166
December 2014 £181
December 2015 £194
2011 Average £166 2012 Average £166 2013 Average £166 2014 Average £173 2015 Average £190
20
© Centre for Economics and Business Research 2015
Quarterly ASDA Income Tracker
Region Q4 2013 Q4 2014 Q4 2015
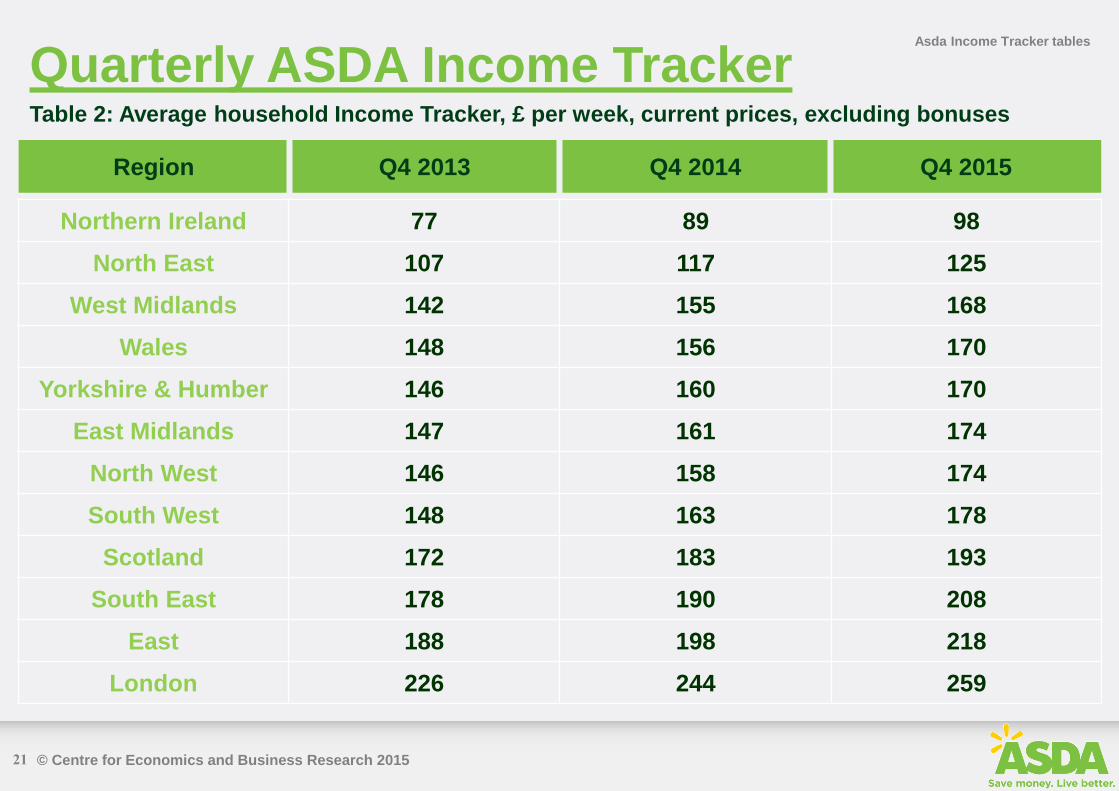
Table 2: Average household Income Tracker, £ per week, current prices, excluding bonuses
Asda Income Tracker tables
Northern Ireland 77 89 98
North East 107 117 125
West Midlands 142 155 168
Wales 148 156 170
Yorkshire & Humber 146 160 170
East Midlands 147 161 174
North West 146 158 174
South West 148 163 178
Scotland 172 183 193
South East 178 190 208
East 188 198 218
London 226 244 259
21
© Centre for Economics and Business Research 2015
Method update note
From March 2014, the base data from which the Asda Income Tracker is
derived have been updated.
This is to account for the latest release from the Office for National
Statistics of the Living Costs and Food Survey: 2013 edition. This release
gives the detailed data required to compute the spending and income
figures for the average UK household that feed into the overall discretionary
income result. These updates are conducted on an annual basis, in line with
the release of the necessary datasets.
This update is required to continue to keep the Income Tracker as relevant
as possible, with the most up-to-date data available. The update makes the
latest vintage of the Income Tracker report and associated datasets not
directly comparable with previous editions. However, the new time series
data now available (e.g. in the tables and charts pages) provide the most
complete estimates and should be used for any time series analysis.
Method notes
17
© Centre for Economics and Business Research 2015
Total household income for the United Kingdom is derived from the Living Costs
and Food Survey 2012 (released December 2013). This is updated on a monthly
basis using official statistics on average earnings, unemployment, social security
payments, interest rates and pension income. Earnings data from the Office for
National Statistics that is released in the month of the report refers to the previous
month. We forecast earnings data for the month of the report.
Taxes are subtracted from total household income to estimate the actual amount
that can be spent on goods and services, i.e. net income or disposable income.
The average amount of tax paid is calculated using the latest version of the Living
Costs and Food Survey. This is updated on a monthly basis using Office for
National Statistics data and Cebr modelling.
Method notes The Asda income tracker is calculated from the following equations:
• Total household income minus taxes
equals net income
• Net income minus basic spend equals
Asda income tracker
Method notes
23
© Centre for Economics and Business Research 2015
Method notes
Net income is calculated by deducting our tax estimate from our total household
income estimate.
Basic spend (cost of living) figures are updated using monthly consumer price
data and the trend growth rate in the volume of essential goods and services
purchased over the most recent ten year period. A full list of items constituting
basic (or ‘essential’) spending was created in collaboration between Asda and Cebr
when the income tracker concept was originally formed in 2008. This list is
available on request.
The Asda income tracker is a measure of ‘discretionary income’, reflecting the
amount remaining after the average UK household has had taxes subtracted from
their income and bought essential items such as: groceries, electricity, gas,
transport costs and mortgage interest payments or rent. The income tracker
measures the amount left over to spend on discretionary purchases such as
leisure and recreation goods and services.
These components are based on official
statistics and Cebr calculations.
Method notes
24
© Centre for Economics and Business Research 2015
Disclaimer
This report was produced by the Centre for Economics and Business
Research (Cebr), an independent economics and business research
consultancy established in 1993 providing forecasts and advice to City
institutions, government departments, local authorities and numerous
blue-chip companies throughout Europe. The main contributors to this
report are Cebr economists Sam Alderson and Scott Corfe.
Whilst every effort has been made to ensure the accuracy of the
material in this report, the authors and Cebr will not be liable for any
loss or damages incurred through the use of this report.
London, January 2016
Disclaimer
25