Embed Size (px)
Citation preview
Presentation of 1Q FY2013/14
Financial Results
7 August 2013
Ascendas Hospitality Trust Roadshow Presentation
August 2013
Ascendas Hospitality Trust 2Q FY2013/14 Financial Results
Presentation
12 November 2013

2
Important Notice This presentation on A-HTRUST’s unaudited financial results for the second quarter ended 30 September 2013 (“2Q FY2013/14”) should be read in conjunction with A-HTRUST’s full financial statements, a copy of which is available on www.sgx.com or www.a-htrust.com.
This presentation may contain forward-looking statements that involve risks and uncertainties. Actual future performance, outcomes and results may differ materially from those expressed in forward-looking statements as a result of a number of risks, uncertainties and assumptions. Representative examples of these factors include (without limitation) general industry and economic conditions, interest rate trends, cost of capital and capital availability, competition from similar developments, shifts in expected levels of average daily room rates and occupancy, changes in operating expenses, including employee wages, benefits and training, property expenses and governmental and public policy changes and the continued availability of financing in the amounts and the terms necessary to support future business. You are cautioned not to place undue reliance on these forward looking statements, which are based on the Manager’s current view of future events. The value of securities in A-HTRUST (“Securities”) and the income derived from them, if any, may fall as well as rise. Securities are not obligations of, deposits in, or guaranteed by, the Manager or any of its affiliates. An investment in Securities is subject to investment risks, including the possible loss of the principal amount invested. Investors should note that they will have no right to request the Manager to redeem or purchase their Securities for so long as the Securities are listed on the SGX-ST. It is intended that investors and security holders of A-HTRUST may only deal in their Securities through trading on the SGX-ST. Listing of the Securities on the SGX-ST does not guarantee a liquid market for the Securities. The past performance of A-HTRUST is not necessarily indicative of the future performance of A-HTRUST. Any discrepancies in the figures included herein between the individual amounts and total thereof are due to rounding.

Contents
Key Highlights
Financial Performance
Portfolio Performance
Capital Management
Outlook

4
Key Highlights
2Q FY2013/14 results included new contributions from Ibis Beijing Sanyuan and Park Hotel Clarke Quay:
Gross Revenue: S$53.1 million
Net property income (“NPI”): S$21.3 million
Distribution per unit (“DPU”): 1.41 cents
Revenue per available room (“RevPAR”) of the Australia hotels increased following completion of asset enhancement works
Latest acquired Park Hotel Clarke Quay won “Singapore’s Leading City Hotel” at the 20th Annual World Travel Awards in October 2013
In current advanced discussions on refinancing the loans of the Australia and Japan portfolio, which upon completion, will extend the debt maturity profile from 2.2 years to more than 3.0 years

Financial Performance
5
6
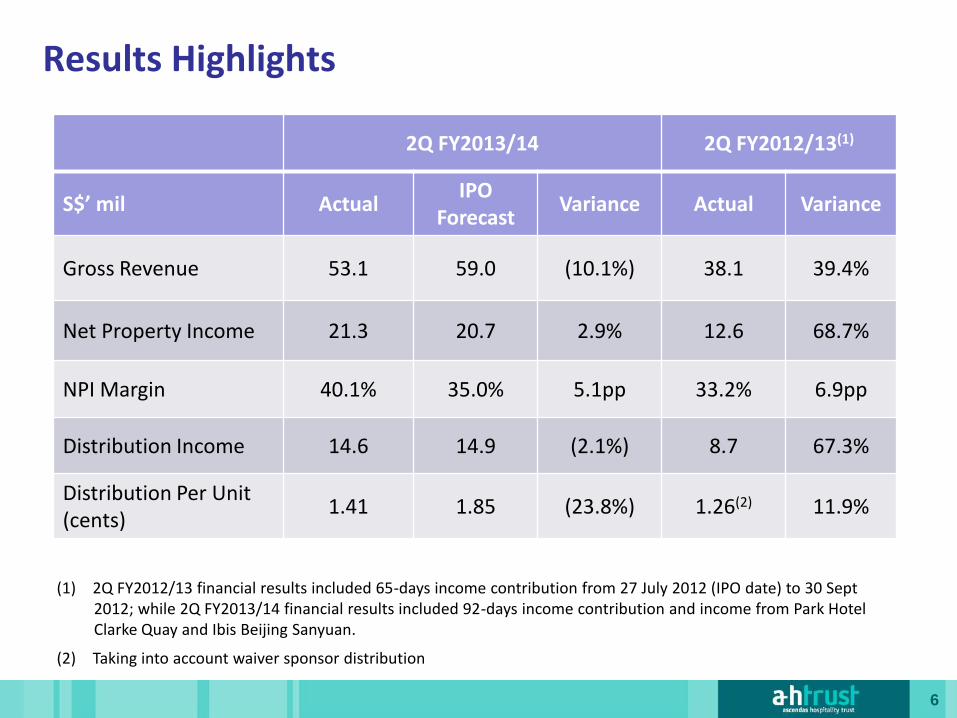
Results Highlights
2Q FY2013/14 2Q FY2012/13(1)
S$’ mil Actual IPO
Forecast Variance Actual Variance
Gross Revenue 53.1 59.0 (10.1%) 38.1 39.4%
Net Property Income 21.3 20.7 2.9% 12.6 68.7%
NPI Margin 40.1% 35.0% 5.1pp 33.2% 6.9pp
Distribution Income 14.6 14.9 (2.1%) 8.7 67.3%
Distribution Per Unit (cents)
1.41 1.85 (23.8%) 1.26(2) 11.9%
(1) 2Q FY2012/13 financial results included 65-days income contribution from 27 July 2012 (IPO date) to 30 Sept 2012; while 2Q FY2013/14 financial results included 92-days income contribution and income from Park Hotel Clarke Quay and Ibis Beijing Sanyuan.
(2) Taking into account waiver sponsor distribution

7
2Q FY2013/14 2Q FY2012/13(1)
S$’ mil Actuals IPO Forecast Variance(2) Actuals Variance(2)
Australia
Revenue 39.4 47.7 (17.4%) 31.7 24.4%
Net Property Income 13.0 15.6 (16.6%) 9.9 31.6%
China
Revenue 5.5 5.4 0.2% 2.2 146.9%
Net Property Income 1.9 1.5 23.1% 0.6 222.9%
Japan
Revenue 4.7 5.9 (20.4%) 4.2 12.4%
Net Property Income 2.9 3.6 (18.3%) 2.4 22.2%
Singapore
Revenue 3.5 - nm - nm
Net Property Income 3.5 - nm - nm
(1) Computation is based on the financials rounded to the nearest dollar. (2) 2Q FY2012/13 results included 65-days income contribution from 27 July 2012 (IPO date) to 30 Sept 2012; while 2Q
FY2013/14 results included 92-days income contribution and income from Park Hotel Clarke Quay and Ibis Beijing Sanyuan.

8
Distribution Details
Distribution Period 10 June 2013 to 30 September 2013 (1)
1Q FY2013/14 0.26 cents
2Q FY2013/14 1.41 cents
Total 1.67 cents
(1) An Advance Distribution for the period 1 April 2013 to 9 June 2013 was paid to Stapled Securityholders on 30 July 2013.
Notice of Books Closure Date 12 November 2013
Ex-Date 18 November 2013, 9.00 am
Books Closure Date 20 November 2013, 5.00 pm
Distribution Payment Date 20 December 2013
Timetable

9
Portfolio Performance

10
Foreign Exchange Impact
NPI for 2Q FY2013/14 exceeded the IPO Forecast by S$0.6 million or 2.9%, mainly due to contribution from Park Hotel Clarke Quay
Adjusting to exclude the unfavourable currency movements, NPI exceeded the IPO Forecast by S$2.2 million or 10.4%
Actual
IPO Forecast
Variance Attributable to
Assets Performance
FX Movement
S$’ mil S$’ mil S$’ mil %
S$’ mil % S$’ mil %
Australia 13.0 15.6 (2.6) (16.6%) (1.7) (11.0%) (0.9) (5.6%)
China 1.9 1.5 0.4 23.1% 0.3 18.4% 0.1 4.7%
Japan 2.9 3.6 (0.7) (18.3%) 0.1 2.9% (0.8) (21.2%)
17.8 20.7 (2.9) (14.0%) (1.3) (6.5%) (1.6) (7.5%)
Singapore 3.5 - 3.5 nm 3.5 nm - nm
Total 21.3 20.7 0.6 2.9% 2.2 10.4% (1.6) (7.5%)

-30%
-25%
-20%
-15%
-10%
-5%
0%
5%
10%
Jul- 12 Aug- 12 Sep- 12 Oct- 12 Nov- 12 Dec- 12 Jan- 13 Feb- 13 Mar- 13 Apr- 13 May- 13 Jun- 13 Jul- 13 Aug- 13 Sep- 13 Oct- 13
AUD/SGD JPY/SGD CNY/SGD
11
Foreign Exchange Movements
Exchange rate movements from IPO to 30 September 2013
AUD/SGD
JPY/SGD
RMB/SGD
9.4%
3.0%
21.3%
Source: OANDA

33.9
11.2
33.0
24.4
7.6
31.1
38.4
12.6
32.7
2Q FY2013/14
2Q FY2012/13
IPO Forecast
82.8
159 132
84.3
160 135
83.4
176 147
NPI Margin (%)
Revenue (AUD’mil)
NPI (AUD’mil)
RevPAR (AUD)
Occupancy (%)
ADR (AUD)
12
Australia Asset Performance
1.5pp
2.2% 0.6%
39.1%
47.4%
1.9pp

87.6
404
350
80.5
535
431
85.2
419
354
26.5
9.2
34.7
11.3
3.0 26.5
27.5
7.8
28.3
2Q FY2013/14
2Q FY2012/13
IPO Forecast
13
China Asset Performance
NPI Margin (%)
Revenue (RMB’mil)
NPI (RMB’mil)
RevPAR (RMB)
Occupancy (%)
ADR (RMB)
134.8%
8.2pp
207.2%
7.1pp
24.5%
18.8%
14
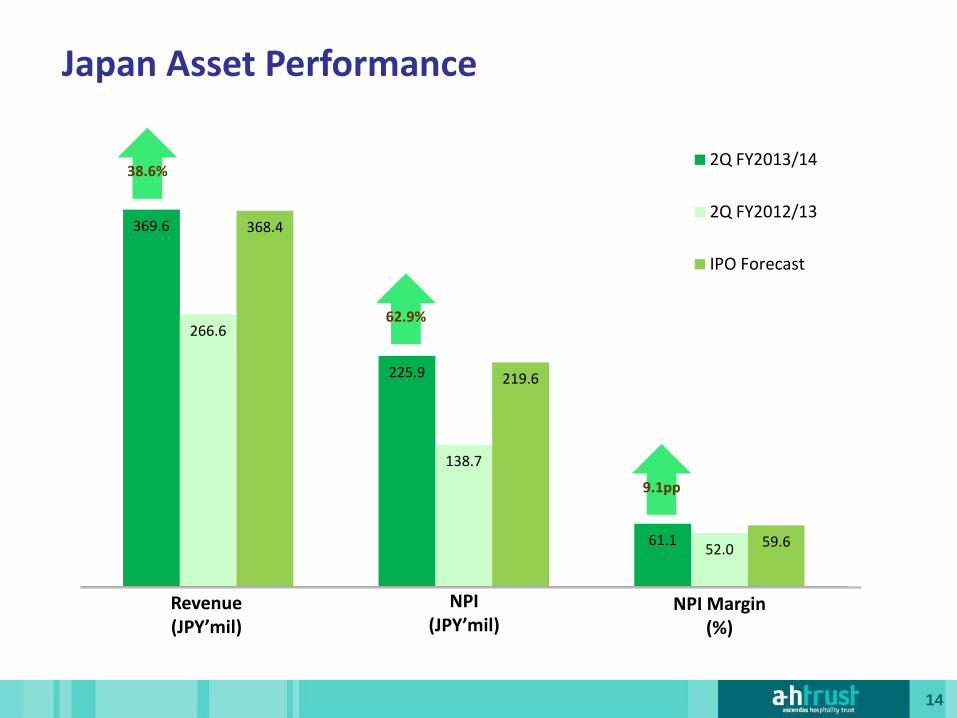
Japan Asset Performance
Revenue (JPY’mil)
NPI Margin (%)
NPI (JPY’mil)
369.6
225.9
61.1
266.6
138.7
52.0
368.4
219.6
59.6
2Q FY2013/14
2Q FY2012/13
IPO Forecast
38.6%
62.9%
9.1pp

15
A-HTRUST Asset Portfolio Net property income by segments for 2Q FY2013/14
By geography By type of contracts
Australia 61.0%
China 8.9%
Japan 13.6%
Singapore 16.5%
Master Lease 30.0%
Management Contracts 70.0%

16
A-HTRUST Asset Portfolio Valuation by property and geography(1)
Tokyo 16%
Beijing 8%
Sydney 26%
Brisbane 14%
Cairns 3%
Singapore 23%
Australia(2) 53% Courtyard by Marriott Sydney – North Ryde 4%
Pullman Sydney 9% Novotel Sydney Central 8%
Novotel Sydney Parramatta 5% Pullman and Mercure Albert Park 10%
Pullman and Mercure Brisbane KGS 14% Pullman Cairns International 3%
China(3) 8% Ibis Beijing 4%
Novotel Beijing 4%
Japan(3) 16%
Hotel Sunroute Ariake & B:Conte 16%
Singapore(4) 23%
Park Hotel Clarke Quay 23%
(1) The valuation refers to the revaluated net asset value of the properties, which includes the revaluation of land use rights of the China hotels (2) Valuation by Jones Lang LaSalle and Knight Frank as of 31 March 2013 (3) Valuation by DTZ as of 31 March 2013 (4) Valuation by Colliers International as of 31 March 2013
Melbourne 10%

Completed Asset Enhancements
17
Completed rebranding and refurbishment works of six Australia hotels
managed by Accor

Media Coverage
18
Pullman Melbourne Albert Park
“To sum up my stay at the Pullman Melbourne Albert Park all I can say is that it far surpassed my expectations and my one night stay was too short to fully appreciate all it has to offer. It is a stylish modern five-star hotel that offers the best in guest rooms, leisure facilities and dining options….It is the ideal upscale hotel for business and leisure in Melbourne.”
The Holiday & Travel Magazine
Travel Daily, 4 Sept 2013 The Holiday & Travel Magazine,
7 Oct 2013 Weekend Australian, 5 Oct 2013 Sydney Morning Herald, 5 Oct
2013 The Saturday Age, 5 Oct 2013 West Australian, 13 Oct 2013
19
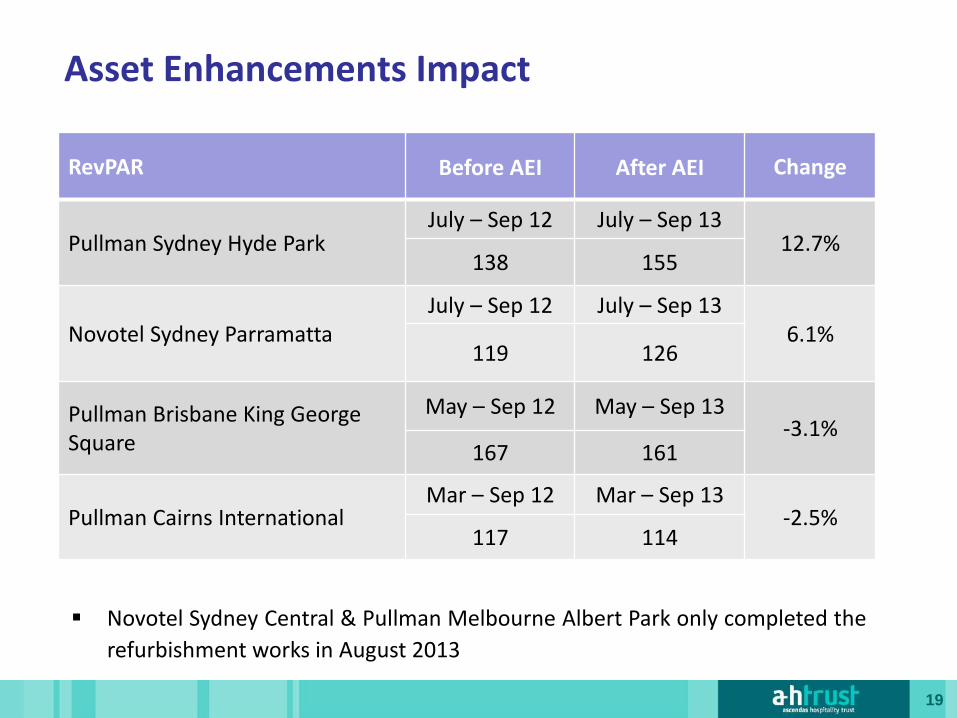
Asset Enhancements Impact
RevPAR Before AEI After AEI Change
Pullman Sydney Hyde Park July – Sep 12 July – Sep 13
12.7% 138 155
Novotel Sydney Parramatta July – Sep 12 July – Sep 13
6.1% 119 126
Pullman Brisbane King George Square
May – Sep 12 May – Sep 13 -3.1%
167 161
Pullman Cairns International Mar – Sep 12 Mar – Sep 13
-2.5% 117 114
Novotel Sydney Central & Pullman Melbourne Albert Park only completed the
refurbishment works in August 2013

Media Coverage
20
Award-winning Hotel Park Hotel Clarke Quay won “Singapore’s Leading City Hotel” at the 20th Annual World
Travel Awards in October 2013 - an award hailed as the “Oscars of the travel industry” and
recognised worldwide as the hallmark of industry excellence
World Travel Awards is hailed as the “Oscars of the travel industry” and recognised worldwide as the hallmark of industry excellence….

21
Park Hotel Clarke Quay
July – August 2013
against mid-tier market(1)
Occupancy +1.0pp
Average Daily Rate (ADR) +6.7%
Revenue per Available Room (RevPAR) +7.3%
(1) Source: STB’s survey on ‘Return of Tourist Hotel on Room Lettings and Food & Beverage Sales Turnover’ as at 26 Sep 2013.
22
Capital Management
23
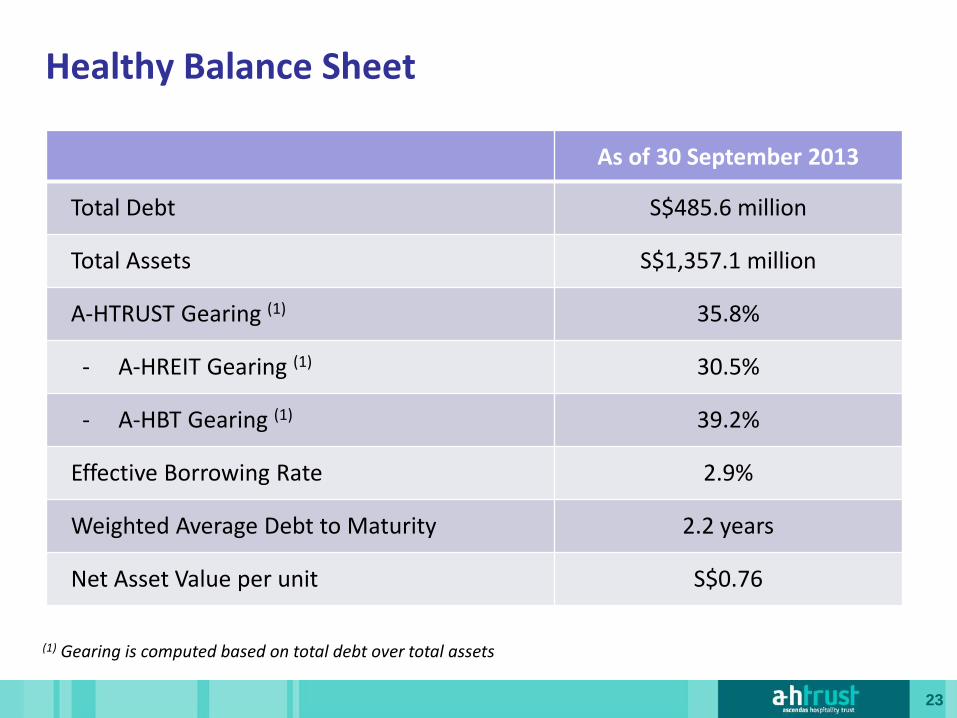
Healthy Balance Sheet
As of 30 September 2013
Total Debt S$485.6 million
Total Assets S$1,357.1 million
A-HTRUST Gearing (1) 35.8%
- A-HREIT Gearing (1) 30.5%
- A-HBT Gearing (1) 39.2%
Effective Borrowing Rate 2.9%
Weighted Average Debt to Maturity 2.2 years
Net Asset Value per unit S$0.76
(1) Gearing is computed based on total debt over total assets
1
62
13
256
49
53
53
0
50
100
150
200
250
300
2013 2014 2015 2016 2017 2018
JPY100m Bond Japan Hotel S$13m RCF
Australia Hotels China Hotels Singapore Hotel
24
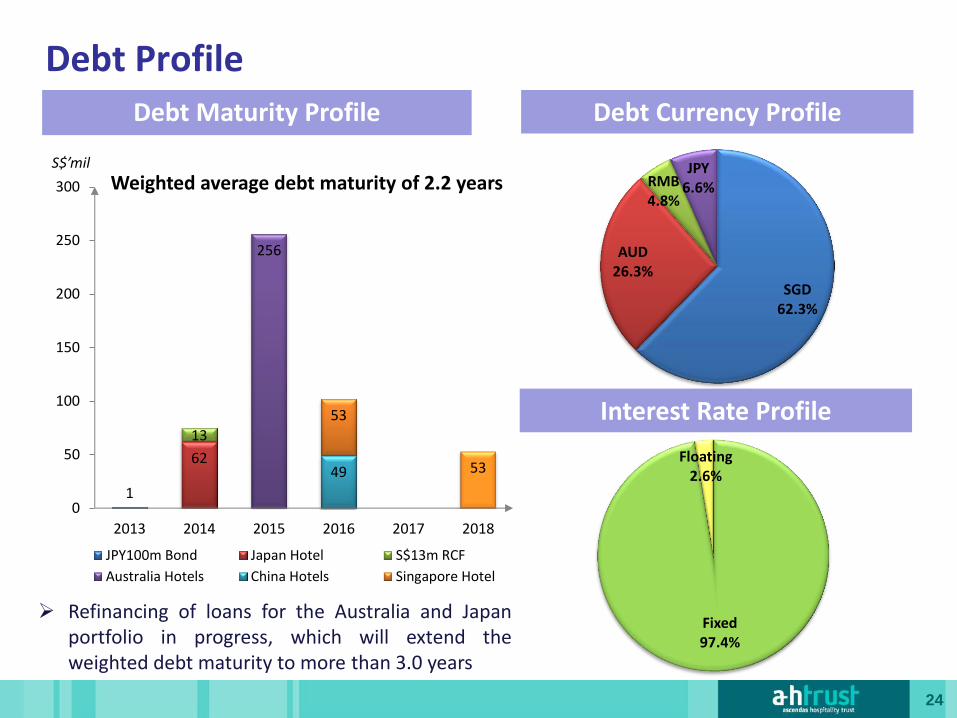
Debt Profile
Debt Maturity Profile Debt Currency Profile
Interest Rate Profile
Weighted average debt maturity of 2.2 years S$’mil
Refinancing of loans for the Australia and Japan portfolio in progress, which will extend the weighted debt maturity to more than 3.0 years
SGD 62.3%
AUD 26.3%
RMB 4.8%
JPY 6.6%
Fixed 97.4%
Floating 2.6%
25
Currency Hedging
Distributable Income
The Managers hedges 100% of A-HTRUST’s distributable income as soon as the amount has been earned from foreign assets and can be reasonably estimated.
In view of the continued volatility in foreign currency movements, the Managers have reviewed its existing income hedging strategy of hedging the earned income on a monthly basis.
Estimated distributable income is now hedged up to 15 months forward to allow a longer coverage period and reduce the exposure of A-HTRUST’s distributable income to forex risks.
Balance Sheet
The Managers do not hedge its equity.
Currently, 50% of A-HTRUST’s borrowings are in local currencies (AUD, JPY & RMB) for its foreign assets.
The Managers are currently in advanced discussions to refinance 100% of the loans for Australia and Japan assets in local currencies.

26
Outlook

27
Market Outlook
Australia economy is expected to remain soft with the continuing rise in unemployment rate and substantial drag from weaker mining investment
Managers are working closely with hotel managers on various initiatives (e.g. advertising & promotional activities) to increase revenue
Positive signs that the Japan economy is turning around Winning the bid to host the 2020 Olympics should boost
business and consumer sentiment Weaker Japanese Yen should trigger growth of domestic
and international accommodation demand
28
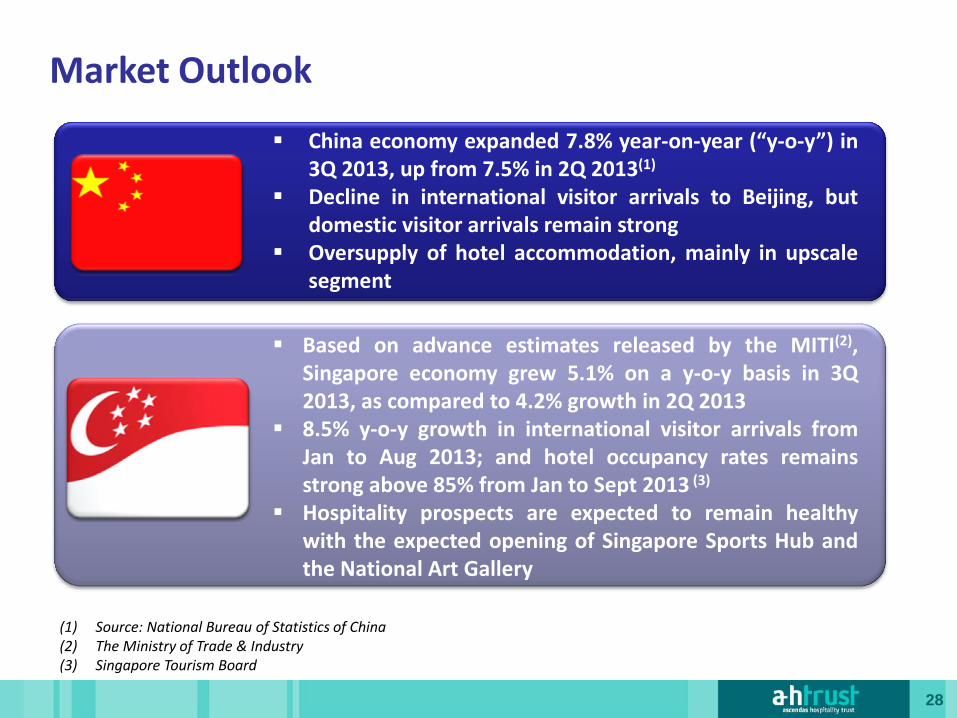
China economy expanded 7.8% year-on-year (“y-o-y”) in 3Q 2013, up from 7.5% in 2Q 2013(1)
Decline in international visitor arrivals to Beijing, but domestic visitor arrivals remain strong
Oversupply of hotel accommodation, mainly in upscale segment
Based on advance estimates released by the MITI(2), Singapore economy grew 5.1% on a y-o-y basis in 3Q 2013, as compared to 4.2% growth in 2Q 2013
8.5% y-o-y growth in international visitor arrivals from Jan to Aug 2013; and hotel occupancy rates remains strong above 85% from Jan to Sept 2013 (3)
Hospitality prospects are expected to remain healthy with the expected opening of Singapore Sports Hub and the National Art Gallery
Market Outlook
(1) Source: National Bureau of Statistics of China (2) The Ministry of Trade & Industry (3) Singapore Tourism Board

Australia RevPAR Growth by City
29
Market performance of hotels in Sydney Market performance of hotels in Melbourne
Source: STR Global, Jones Lang LaSalle
Market performance of hotels in Brisbane Market performance of hotels in Cairns
30
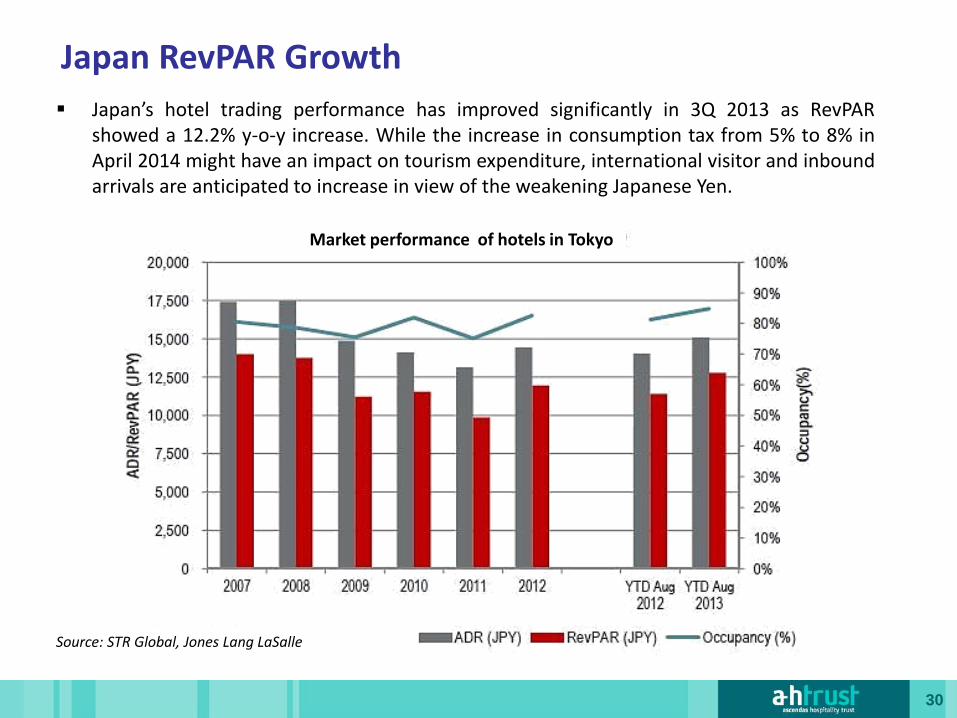
Japan RevPAR Growth
Japan’s hotel trading performance has improved significantly in 3Q 2013 as RevPAR showed a 12.2% y-o-y increase. While the increase in consumption tax from 5% to 8% in April 2014 might have an impact on tourism expenditure, international visitor and inbound arrivals are anticipated to increase in view of the weakening Japanese Yen.
Market performance of hotels in Tokyo
Source: STR Global, Jones Lang LaSalle

31
Beijing RevPAR Growth
Beijing four-star hotels’ performance recorded a decline in 3Q 2013 due to the reduction in visitor arrivals during 3Q 2013. As at YTD August 2013, occupancy declined 3.0 percentage points to 68.1%, ADR decreased 3.3% y-o-y and RevPAR decreased 7.4% y-o-y.
Market performance of four-star hotels in Beijing
Source: STR Global, Jones Lang LaSalle

32
Source: STR Global, Jones Lang LaSalle
Performance of midscale hotels in Singapore declined in 3Q 2013 due to increase in hotel supply. As at YTD August 2013, occupancy declined 0.6 percentage points to 86.6%, ADR decreased 0.7% y-o-y and RevPAR declined 3.8% y-o-y.
Market performance of midscale hotels in Singapore
Singapore RevPAR Growth

33