Embed Size (px)
Citation preview
Asbestos Content in Wall and Ceiling Plasters in Buildings Built between 1880 and 1980
Asbestos Content in Wall and Ceiling Plasters in Buildings Built between 1880 and 1980
Thomas C. Ouimet CIH CSPYale UniversityOEHS2
Roger G. Morse AIARoger G. Morse Associates
Copyright T.C. Ouimet 2000
Thomas C. Ouimet CIH CSPYale UniversityOEHS2
Roger G. Morse AIARoger G. Morse Associates
Copyright T.C. Ouimet 2000
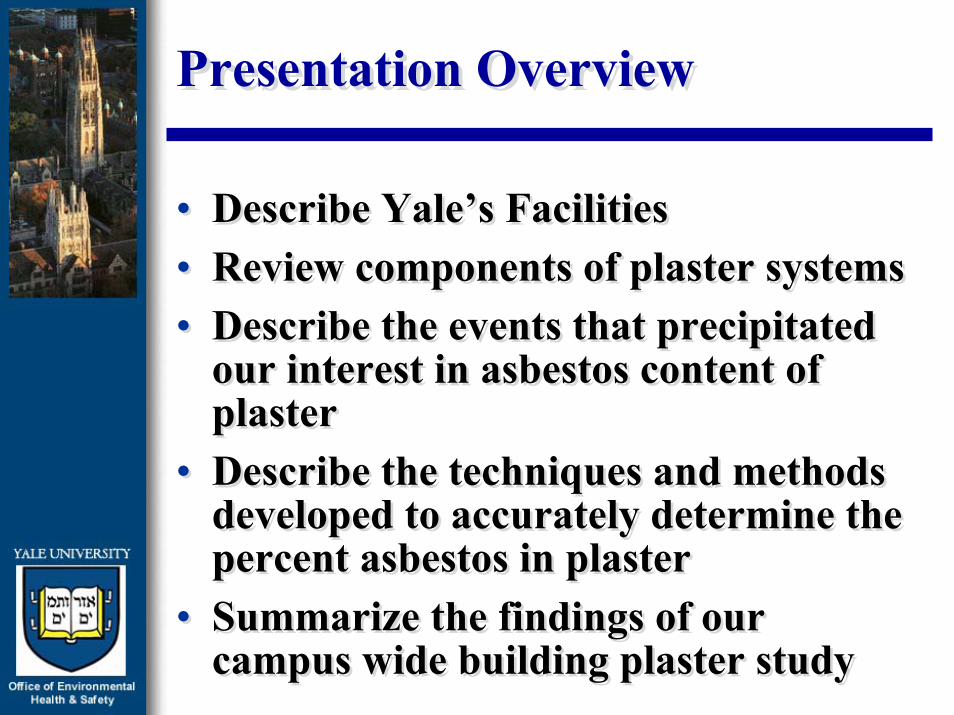
Presentation OverviewPresentation Overview
• Describe Yale’s Facilities• Review components of plaster systems• Describe the events that precipitated
our interest in asbestos content of plaster
• Describe the techniques and methods developed to accurately determine the percent asbestos in plaster
• Summarize the findings of our campus wide building plaster study
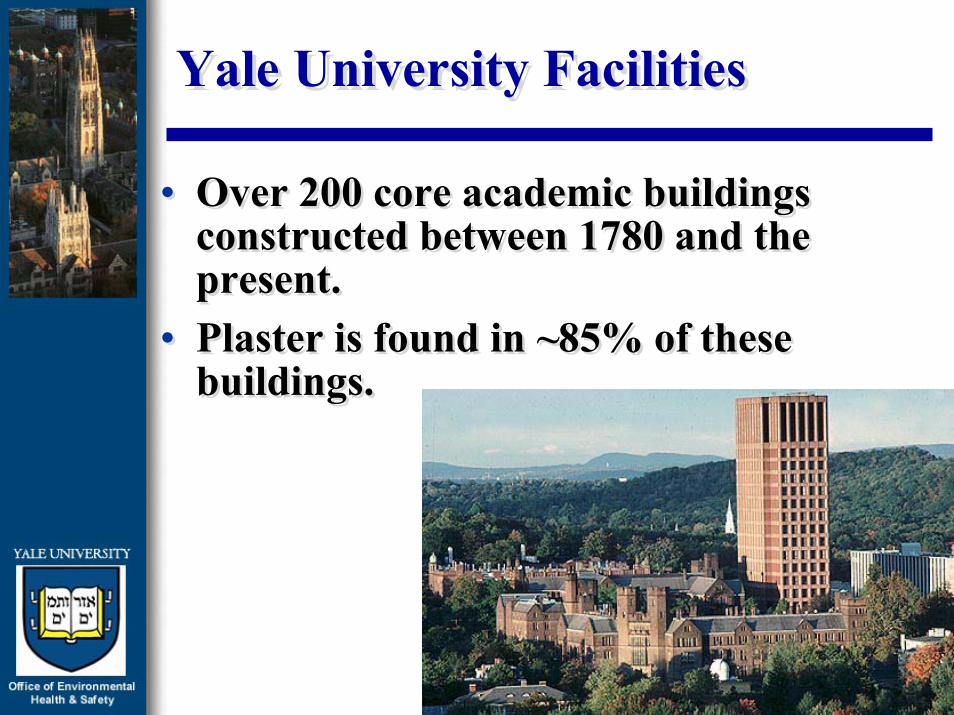
Yale University FacilitiesYale University Facilities
• Over 200 core academic buildings constructed between 1780 and the present.
• Plaster is found in ~85% of these buildings.
• Over 200 core academic buildings constructed between 1780 and the present.
• Plaster is found in ~85% of these buildings.
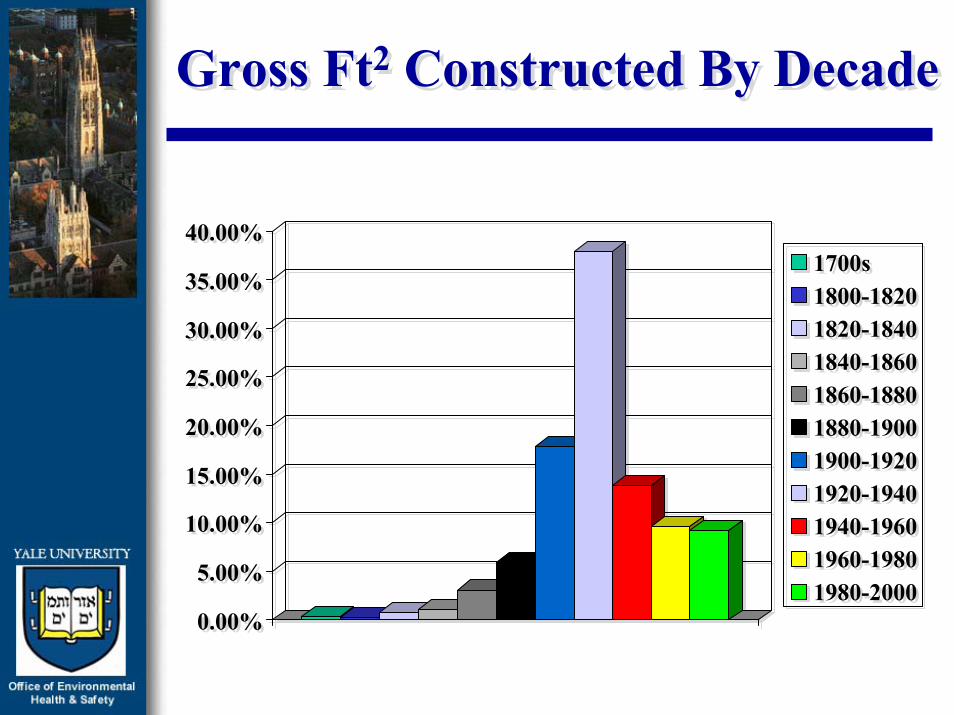
Gross Ft2 Constructed By DecadeGross Ft2 Constructed By Decade
0.00%
5.00%
10.00%
15.00%
20.00%
25.00%
30.00%
35.00%
40.00%1700s1800-18201820-18401840-18601860-18801880-19001900-19201920-19401940-19601960-19801980-2000
0.00%
5.00%
10.00%
15.00%
20.00%
25.00%
30.00%
35.00%
40.00%1700s1800-18201820-18401840-18601860-18801880-19001900-19201920-19401940-19601960-19801980-2000
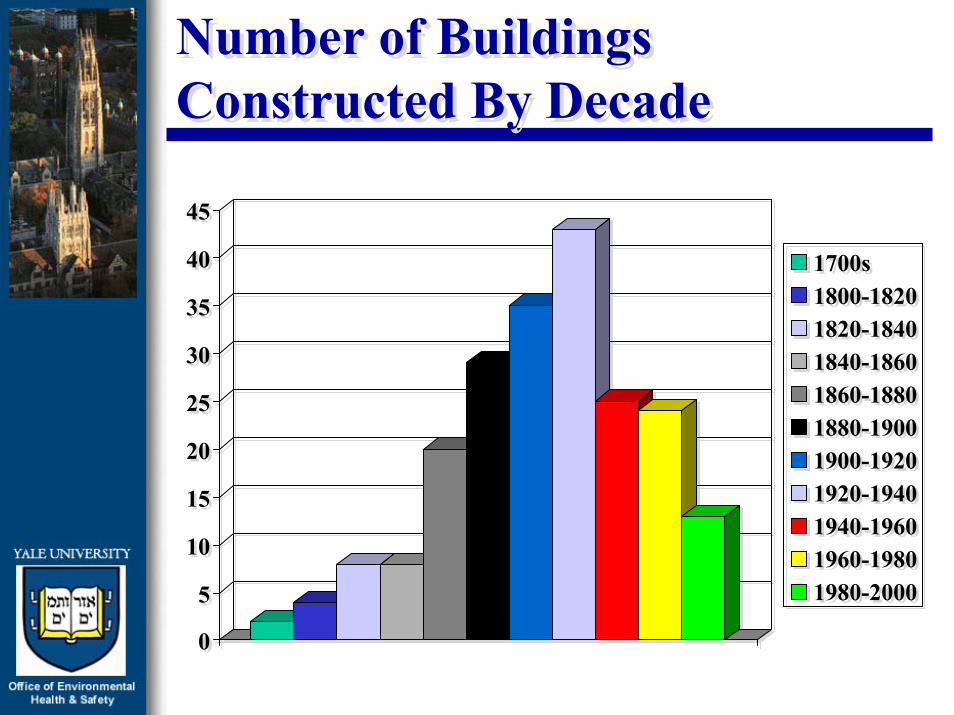
Number of Buildings Constructed By DecadeNumber of Buildings Constructed By Decade
0
5
10
15
20
25
30
35
40
45
1700s1800-18201820-18401840-18601860-18801880-19001900-19201920-19401940-19601960-19801980-2000
0
5
10
15
20
25
30
35
40
45
1700s1800-18201820-18401840-18601860-18801880-19001900-19201920-19401940-19601960-19801980-2000
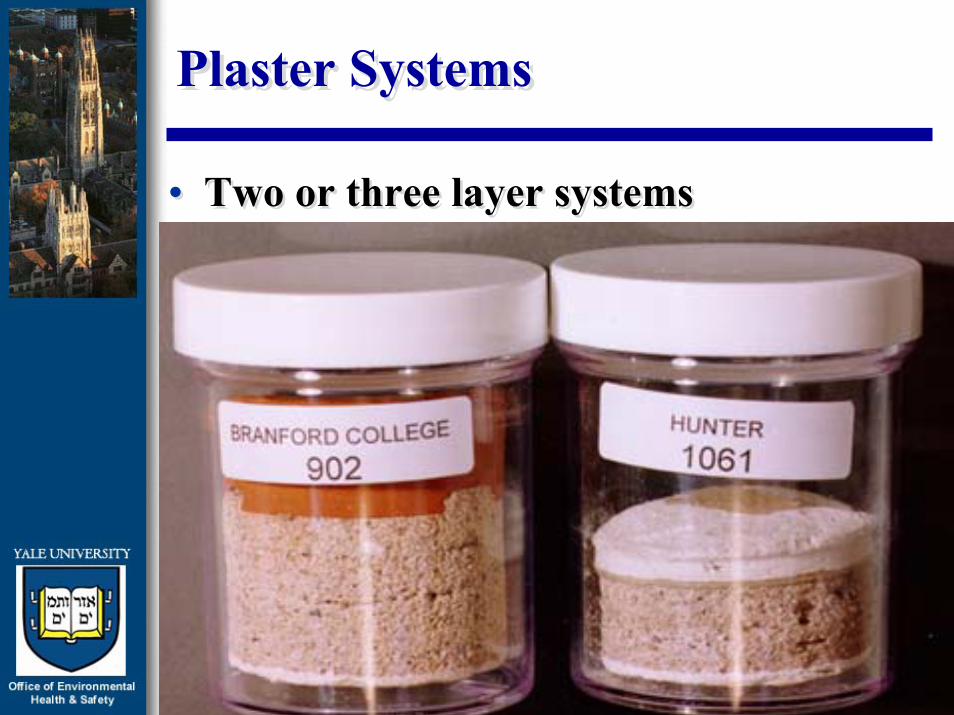
Plaster SystemsPlaster Systems
• Two or three layer systems– base coat
– brown coat
– finish coat
• Two or three layer systems– base coat
– brown coat
– finish coat
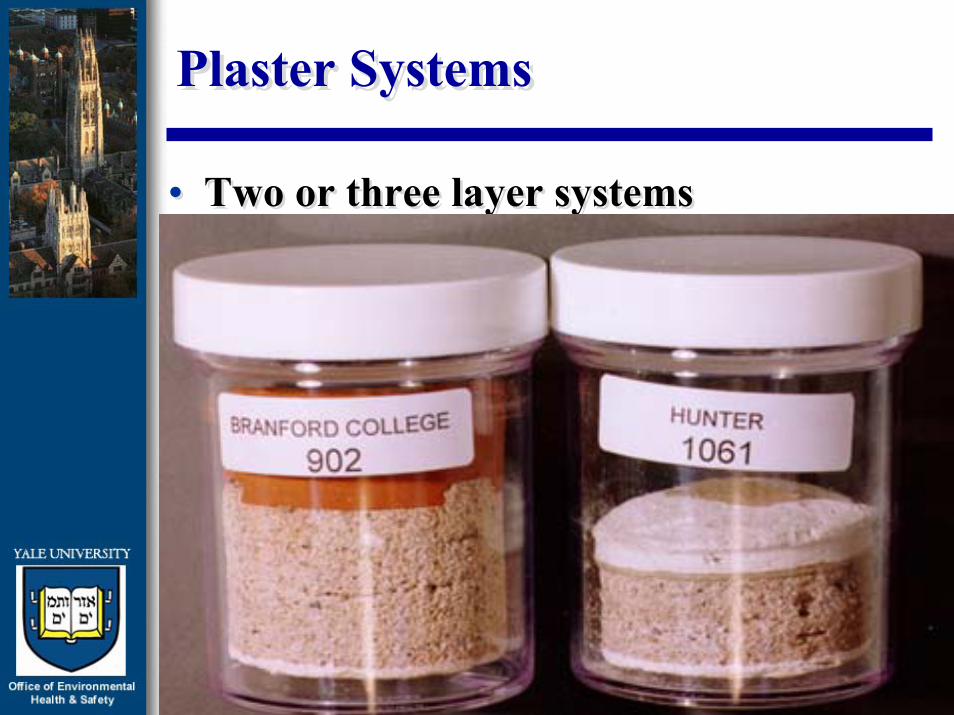
Plaster SystemsPlaster Systems
• Two or three layer systems• Two or three layer systems
Plaster SystemsPlaster Systems
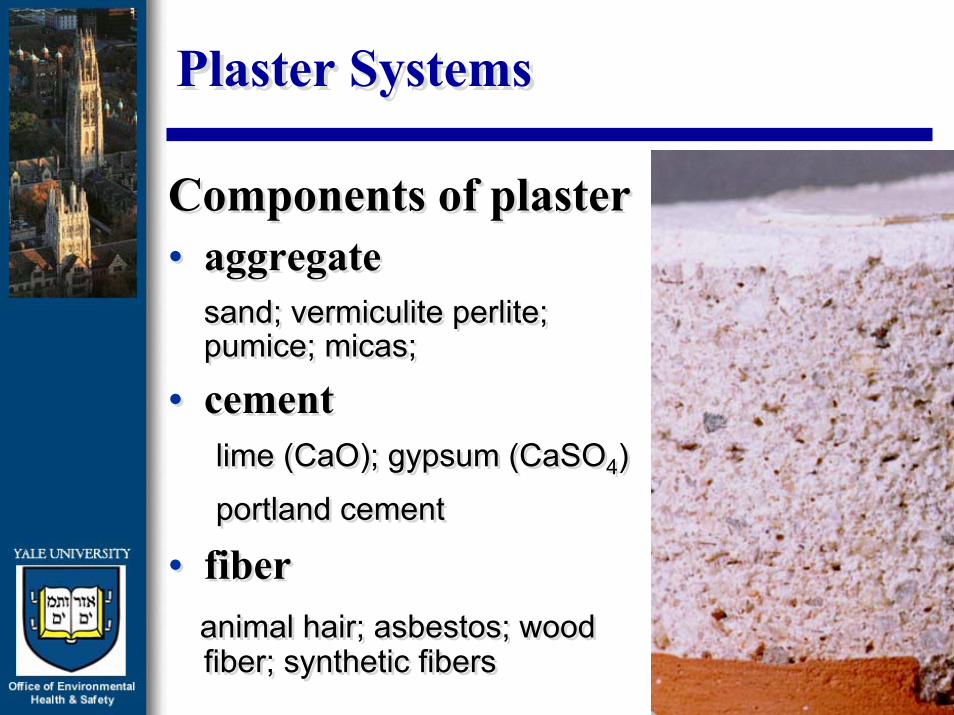
Components of plaster• aggregate
sand; vermiculite perlite; pumice; micas;
• cementlime (CaO); gypsum (CaSO4)
portland cement
• fiberanimal hair; asbestos; wood fiber; synthetic fibers
Components of plaster• aggregate
sand; vermiculite perlite; pumice; micas;
• cementlime (CaO); gypsum (CaSO4)
portland cement
• fiberanimal hair; asbestos; wood fiber; synthetic fibers
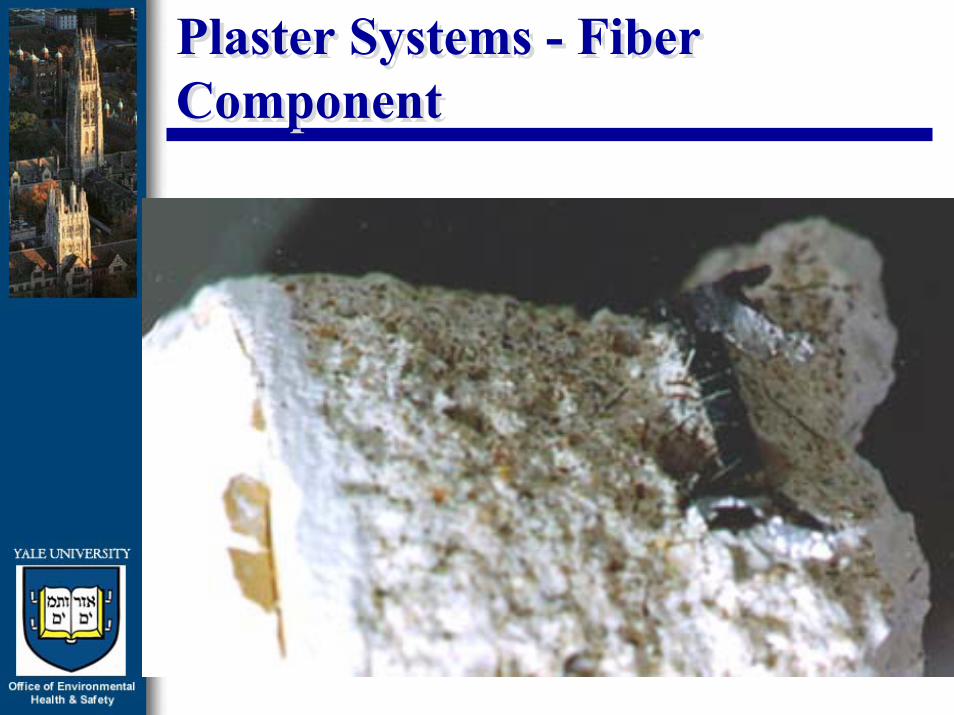
Plaster Systems - Fiber ComponentPlaster Systems - Fiber Component
Historical Plaster Bulk ResultsHistorical Plaster Bulk Results
• 1978 - 1995 plaster bulk asbestos results were typically less than 1% - but detectable
• Bathroom plaster in some areas > 1%• Sample collected with core sampler• Analysis by NAVLAP certified lab using
optical microscope and EPA procedure • After ~ 1992 used gravimetric methods
• 1978 - 1995 plaster bulk asbestos results were typically less than 1% - but detectable
• Bathroom plaster in some areas > 1%• Sample collected with core sampler• Analysis by NAVLAP certified lab using
optical microscope and EPA procedure • After ~ 1992 used gravimetric methods
Plaster Bulk Sample Results - 1996Plaster Bulk Sample Results - 1996
• 10-20% of the plaster samples collected to support three large renovations were reported to contained between 1-3% asbestos by weight.
• Results were not consistent– different labs obtained different results
with split samples
– the same lab obtained different results when sent duplicate samples
• 10-20% of the plaster samples collected to support three large renovations were reported to contained between 1-3% asbestos by weight.
• Results were not consistent– different labs obtained different results
with split samples
– the same lab obtained different results when sent duplicate samples
Potential CausesPotential Causes
• EPA’s interpretation (12/95) that each layer of a plaster system must be analyzed separately
• Flawed methodology for assessing asbestos in plaster
• EPA’s interpretation (12/95) that each layer of a plaster system must be analyzed separately
• Flawed methodology for assessing asbestos in plaster

Potential ImpactPotential Impact
• Significant cost impact on renovations– Plaster removed as asbestos abatement
– All trades impacting plaster must be trained as OSHA Class III asbestos workers
– State DPH required tasks impacting plaster to be “enclosed” or release less than 0.01 fibers/cc.
– 1.5 billion dollar capital spending program to upgrade facilities
Management DirectiveManagement Directive
• Identify why we have inconsistent results and accurately determine what the asbestos concentrations of our plasters are.– Approached the EPA (1-97)
– Retained two consultants:• Dr. Eric Chatfield, Chatfield Technical
Consultants, LTD
• Mr. Roger Morse, Roger G. Morse Associates
• Identify why we have inconsistent results and accurately determine what the asbestos concentrations of our plasters are.– Approached the EPA (1-97)
– Retained two consultants:• Dr. Eric Chatfield, Chatfield Technical
Consultants, LTD
• Mr. Roger Morse, Roger G. Morse Associates
Plaster Bulk Collection & AnalysisPlaster Bulk Collection & Analysis
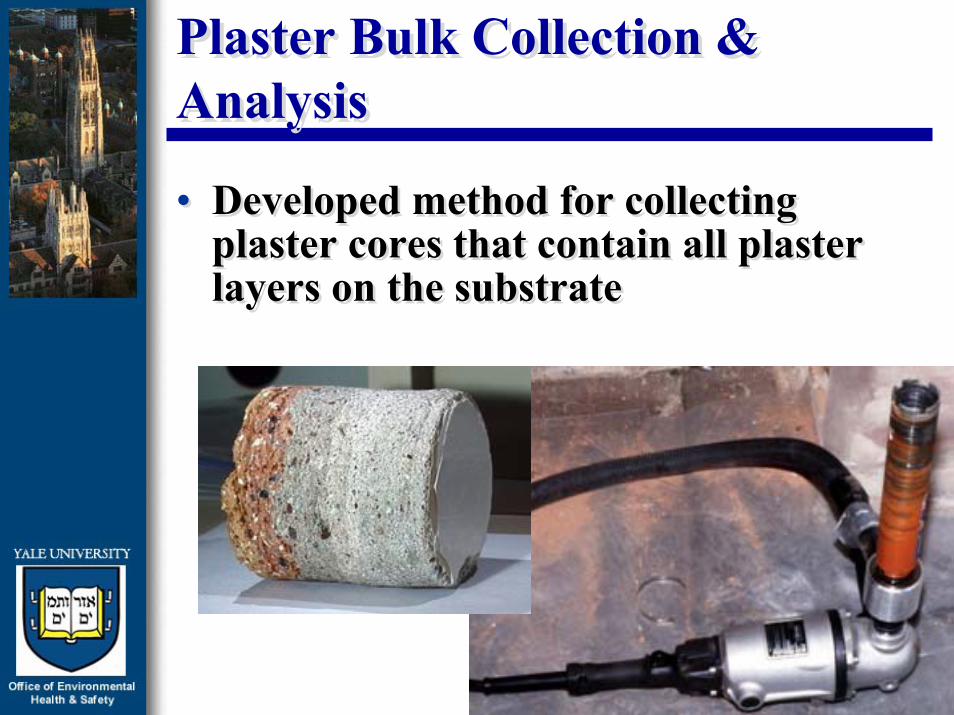
• Developed method for collecting plaster cores that contain all plaster layers on the substrate
• Developed method for collecting plaster cores that contain all plaster layers on the substrate
Plaster Bulk Collection & AnalysisPlaster Bulk Collection & Analysis
• Submitted cores to Chatfield lab and obtained consistent results
• Chatfield lab was using a modified gravimetric procedure1 (included sedimentation)
• EPA accepted analytical procedure as use of best available technology
1Reference: Chatfield, E.J., “A Validated method for Gravimetric Determination of Low Concentrations of Asbestos in Bulk Materials,” Advances in Environmenal Measurement Methods for Asbestos. ASTM STP 1342, M.E, Beard and H,L. Rook, Eds., American Society for Testing and Materials, West Conshohocken, PA, 2000
Campus Wide Plaster StudyCampus Wide Plaster Study
• Collected ~ 5,000 plaster cores out of approximately 200 buildings (25-30 per building)
• Each core was cleaned so that each layer and layer characteristics were clearly visible.
• Gross visual examination conducted of core– function; thickness; color
• Collected ~ 5,000 plaster cores out of approximately 200 buildings (25-30 per building)
• Each core was cleaned so that each layer and layer characteristics were clearly visible.
• Gross visual examination conducted of core– function; thickness; color
Campus Wide Plaster StudyCampus Wide Plaster Study
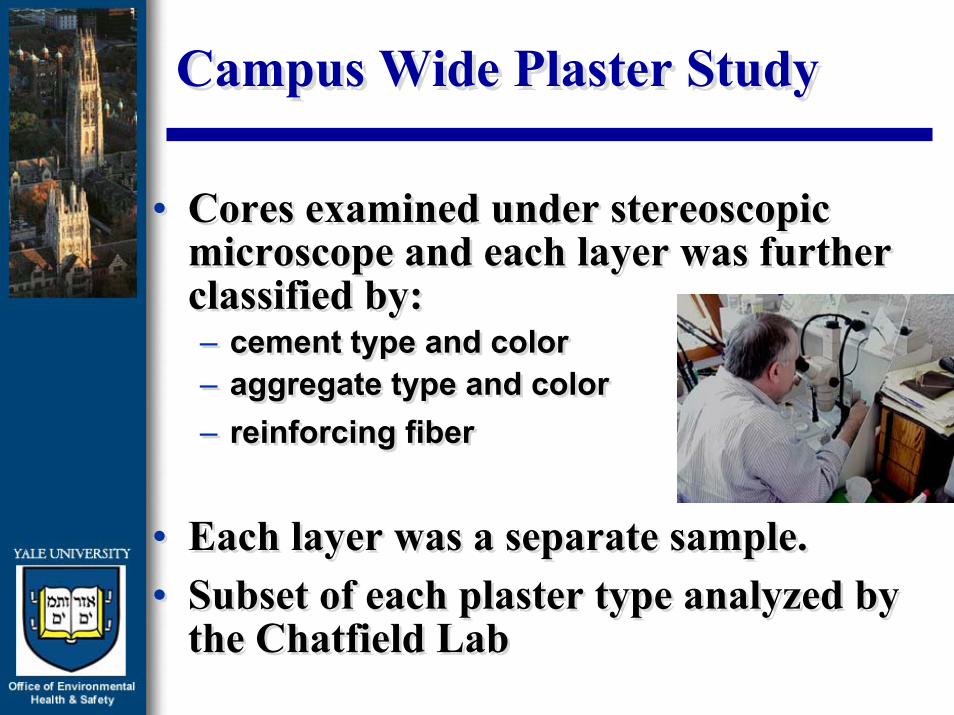
• Cores examined under stereoscopic microscope and each layer was further classified by:– cement type and color– aggregate type and color– reinforcing fiber
• Each layer was a separate sample.• Subset of each plaster type analyzed by
the Chatfield Lab
• Cores examined under stereoscopic microscope and each layer was further classified by:– cement type and color– aggregate type and color– reinforcing fiber
• Each layer was a separate sample.• Subset of each plaster type analyzed by
the Chatfield Lab

Campus Wide Plaster Study FindingsCampus Wide Plaster Study Findings
• Plaster on walls and ceilings contained less than 1% asbestos by weight and ranged from <0.01% to 0.8% with two exceptions:– acoustical plaster
– patching materials (dry wall taping compound)
• Plaster on walls and ceilings contained less than 1% asbestos by weight and ranged from <0.01% to 0.8% with two exceptions:– acoustical plaster
– patching materials (dry wall taping compound)
Campus Wide Plaster Study FindingsCampus Wide Plaster Study Findings
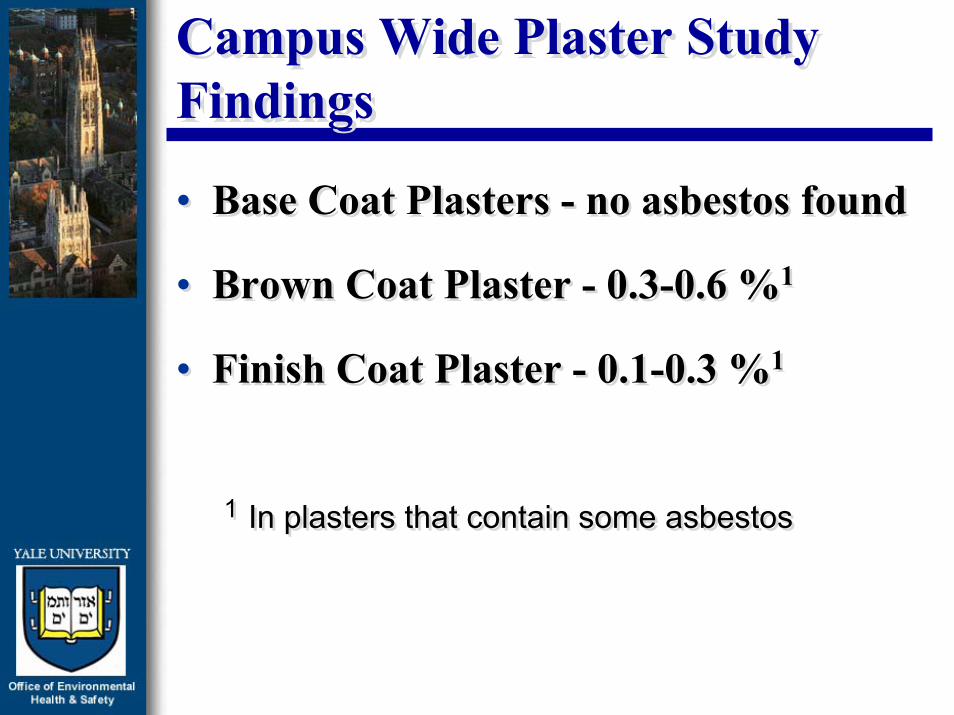
• Base Coat Plasters - no asbestos found
• Brown Coat Plaster - 0.3-0.6 %1
• Finish Coat Plaster - 0.1-0.3 %1
1 In plasters that contain some asbestos
• Base Coat Plasters - no asbestos found
• Brown Coat Plaster - 0.3-0.6 %1
• Finish Coat Plaster - 0.1-0.3 %1
1 In plasters that contain some asbestos

Campus Wide Plaster Study FindingsCampus Wide Plaster Study Findings
Grayish Beige Sand Plaster (J1)
158
1322
5841
23 166 3 1 1 0
020
406080
100120140
160180
0.01 0.1 0.2 0.3 0.4 0.5 0.6 0.7 0.8 0.9 0.95 1
% asbestos by weight
num
ber o
f cor
es
Mean asbestos content 0.18% (SD 0.203)(342 samples)
Mean asbestos content 0.18% (SD 0.203)(342 samples)
Campus Wide Plaster Study FindingsCampus Wide Plaster Study Findings
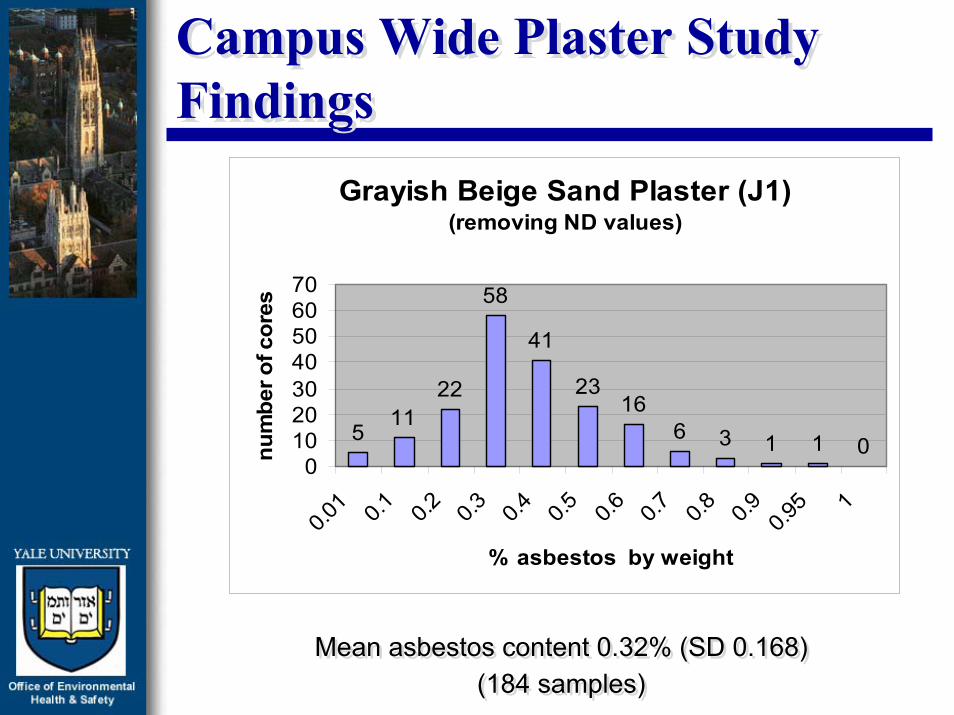
Grayish Beige Sand Plaster (J1) (removing ND values)
511
22
58
41
2316
6 3 1 1 00
10203040506070
0.01 0.1 0.2 0.3 0.4 0.5 0.6 0.7 0.8 0.9 0.95 1
% asbestos by weight
num
ber o
f cor
es
Mean asbestos content 0.32% (SD 0.168)(184 samples)
Mean asbestos content 0.32% (SD 0.168)(184 samples)
Campus Wide Plaster Study FindingsCampus Wide Plaster Study Findings
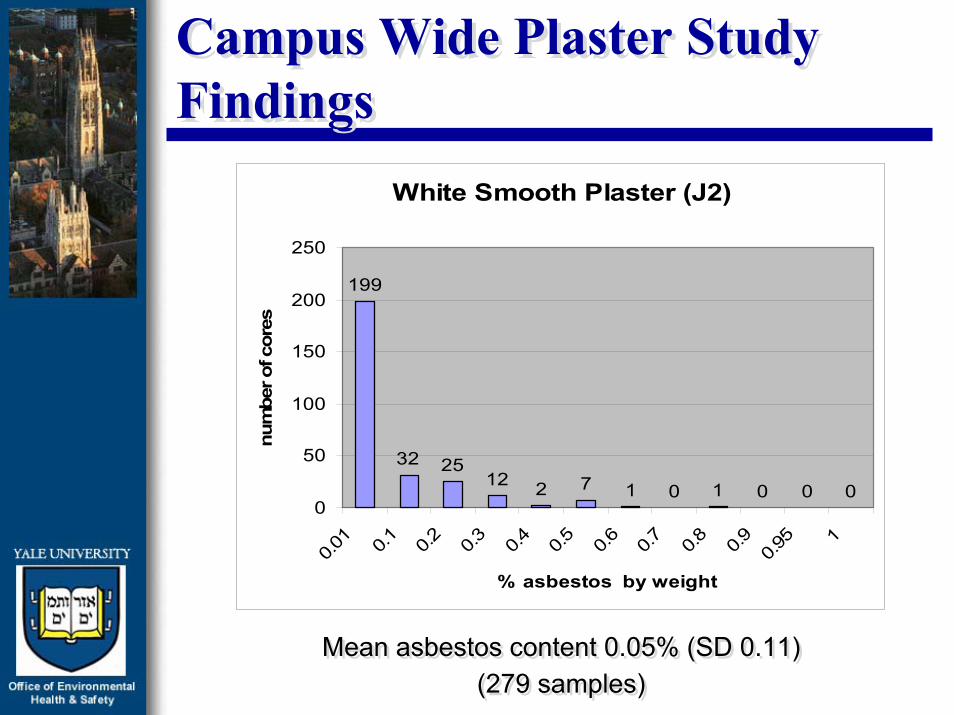
White Smooth Plaster (J2)
199
32 2512 2 7 1 0 1 0 0 0
0
50
100
150
200
250
0.01 0.1 0.2 0.3 0.4 0.5 0.6 0.7 0.8 0.9 0.95 1
% asbestos by weight
num
ber o
f cor
es
Mean asbestos content 0.05% (SD 0.11)(279 samples)
Mean asbestos content 0.05% (SD 0.11)(279 samples)
Campus Wide Plaster Study FindingsCampus Wide Plaster Study Findings
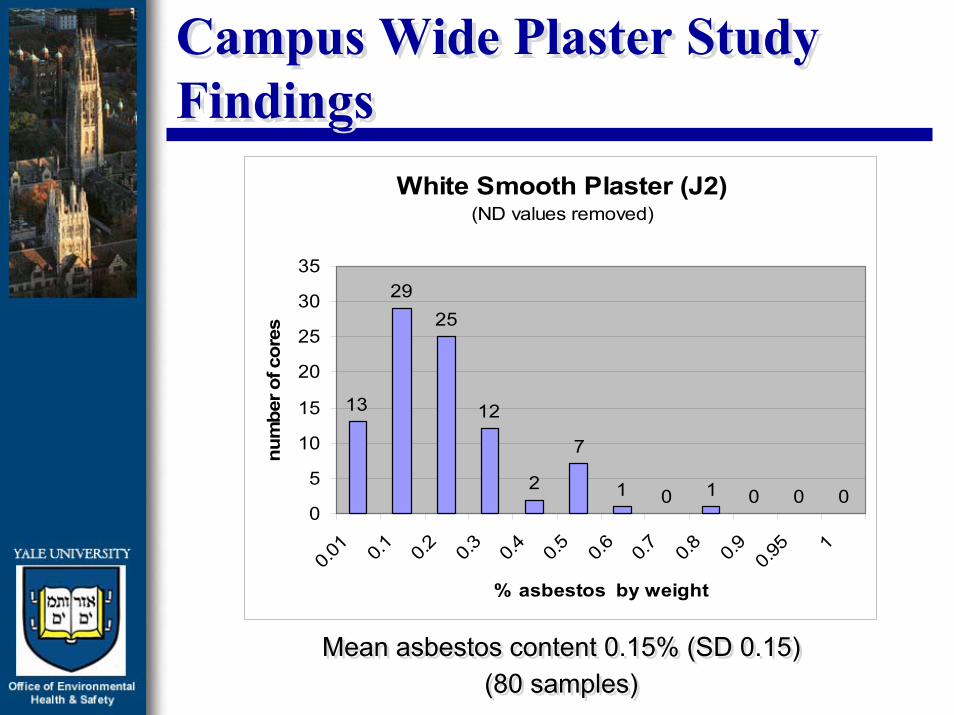
White Smooth Plaster (J2) (ND values removed)
13
2925
12
2
7
1 0 1 0 0 00
5
10
15
20
25
30
35
0.01 0.1 0.2 0.3 0.4 0.5 0.6 0.7 0.8 0.9 0.95 1
% asbestos by weight
num
ber o
f cor
es
Mean asbestos content 0.15% (SD 0.15)(80 samples)
Mean asbestos content 0.15% (SD 0.15)(80 samples)
Campus Wide Plaster Study FindingsCampus Wide Plaster Study Findings
• The presence of asbestos was not related to any characteristic of the aggregate, cement, or the presence of other fibers.
• The probability of finding asbestos in plaster was related to the time the building was constructed.
• The presence of asbestos was not related to any characteristic of the aggregate, cement, or the presence of other fibers.
• The probability of finding asbestos in plaster was related to the time the building was constructed.
Literature ReviewLiterature Review
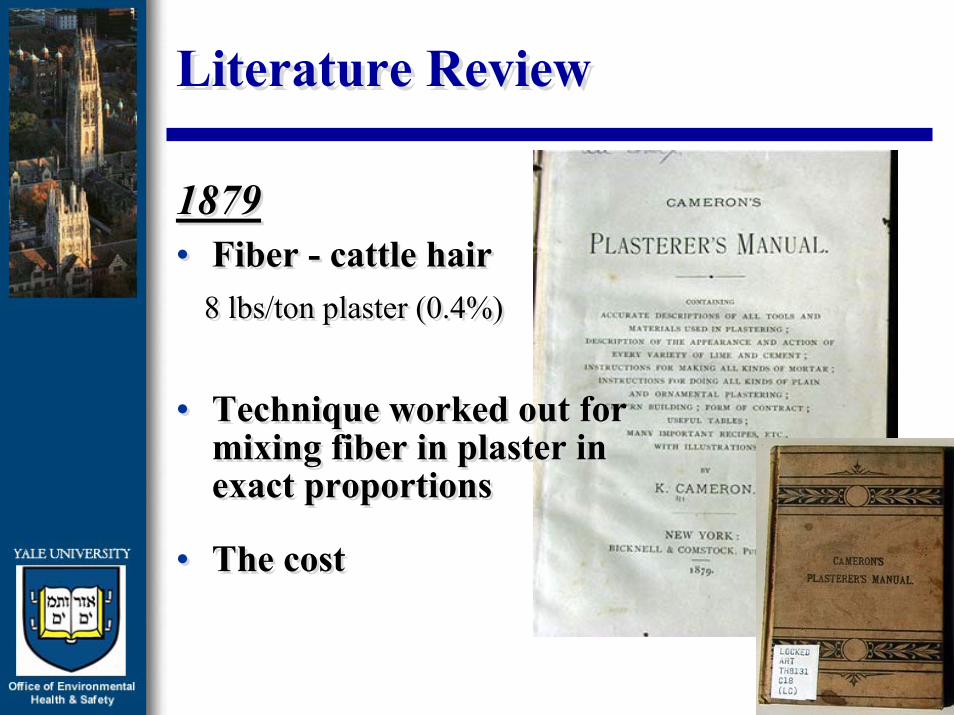
1879• Fiber - cattle hair
8 lbs/ton plaster (0.4%)
• Technique worked out for mixing fiber in plaster in exact proportions
• The cost
1879• Fiber - cattle hair
8 lbs/ton plaster (0.4%)
• Technique worked out for mixing fiber in plaster in exact proportions
• The cost

Literature ReviewLiterature Review
1928 (Eckel, E.C. “Cements, Limes and Plasters,” John Wiley & Sons, NY, 1928)
• finely picked animal hair or other fiber1.5-3 lbs/ton (0.15%)
• processed wood fiber (cottonwood) 7.5-15 lbs/ton (0.38-0.75%)
1960 (Diehl, J.R. “Manual of Lathing andPlastering,” MAC Publishers Association, 1960)
• ASTM C28 specifies 0.75% wood fiber in plaster

Take Home LessonsTake Home Lessons
• If you find plasters containing 1-3% by weight (conventional analytical technique) it is highly likely <1%.
• Asbestos commonly mixed into plaster starting approximately 1880 (~ 0.5 %) and the practice was discontinued sometime after WWII.
• Asbestos is found in greater than 1% in acoustical plaster and patching compounds.