Embed Size (px)
Citation preview
ASB Update
Analyst Briefing
8th September 2006
Disclaimer
The material that follows is general background information about ASB’s activities
current at the date of the presentation, 8 September 2006. It is information given in
summary form and does not purport to be complete. It is not intended to be relied
upon as advice.
Note all financial numbers are reported in NZD.
Agenda
• Team Introductions
• Introduction Hugh Burrett
• Financial Performance Stewart McRobie
• Retail Banking Ross McEwan
• Business & Rural Banking James Mitchell
• Q & A
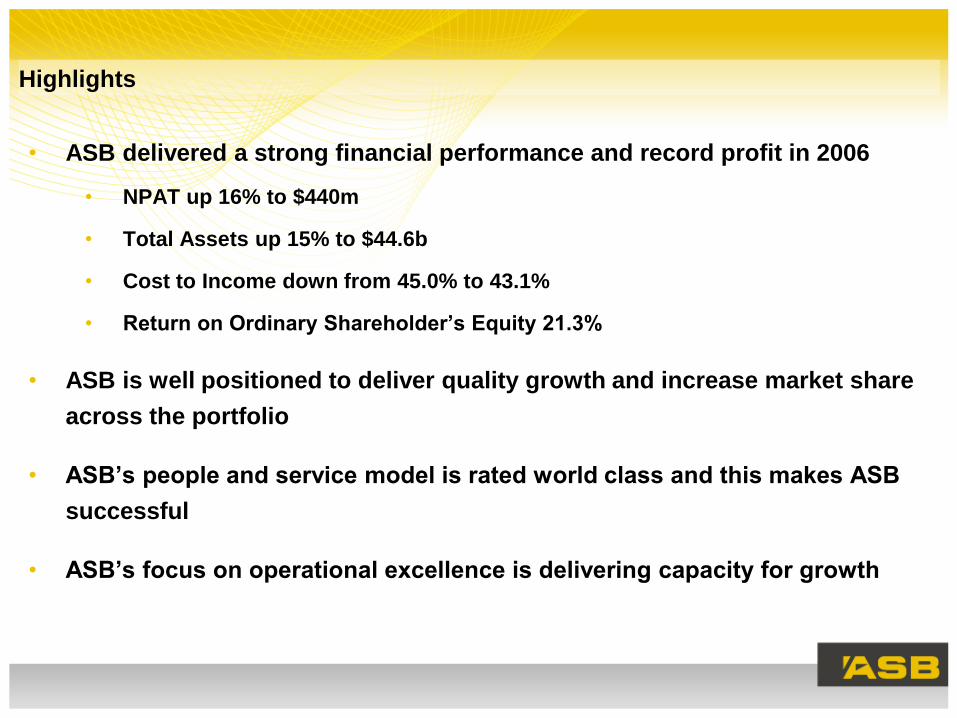
Highlights
• ASB delivered a strong financial performance and record profit in 2006
• NPAT up 16% to $440m
• Total Assets up 15% to $44.6b
• Cost to Income down from 45.0% to 43.1%
• Return on Ordinary Shareholder’s Equity 21.3%
• ASB is well positioned to deliver quality growth and increase market share
across the portfolio
• ASB’s people and service model is rated world class and this makes ASB
successful
• ASB’s focus on operational excellence is delivering capacity for growth
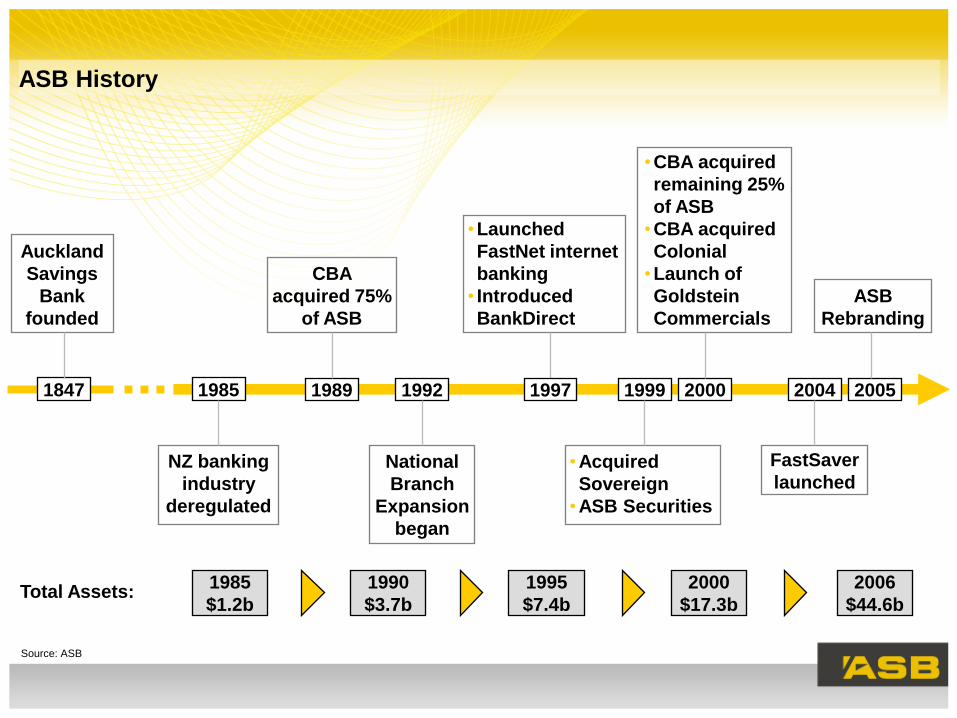
ASB History
Auckland
Savings
Bank
founded
National
Branch
Expansion
began
•Launched
FastNet internet
banking
• Introduced
BankDirect
•Acquired
Sovereign
•ASB Securities
•CBA acquired
remaining 25%
of ASB
•CBA acquired
Colonial
•Launch of
Goldstein
Commercials
ASB
Rebranding
1847 1985 1989 1992 1999 2000 20051997
CBA
acquired 75%
of ASB
FastSaver
launched
2004
1985
$1.2bTotal Assets:
2006
$44.6b
1990
$3.7b
1995
$7.4b
2000
$17.3b
NZ banking
industry
deregulated
Source: ASB
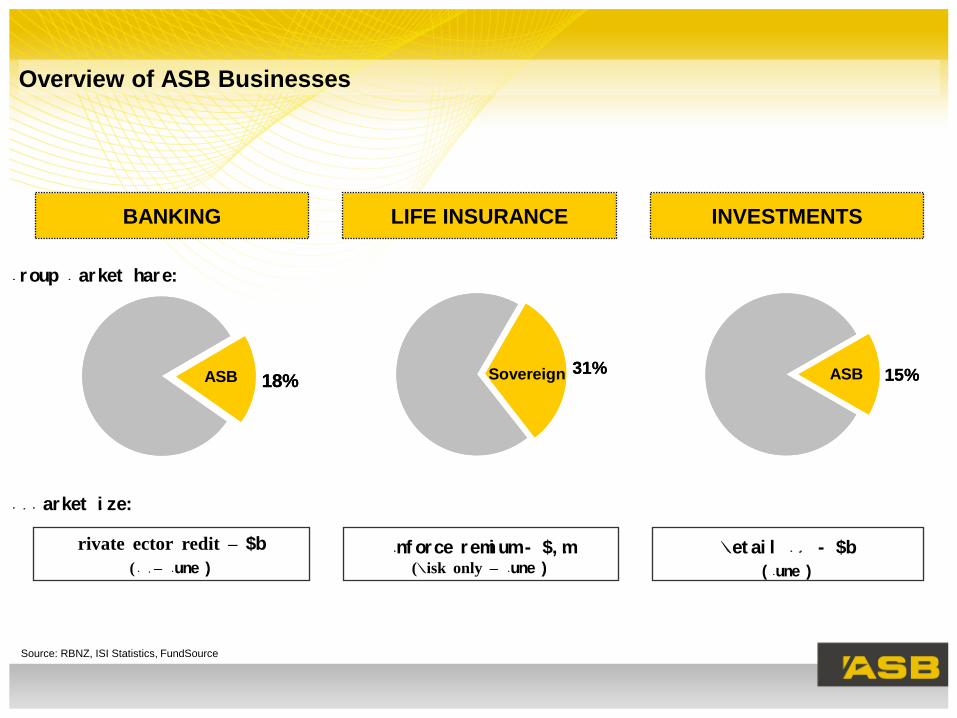
Overview of ASB Businesses
Private Sector Credit – $215b
(M3 – June 2006)
Inf orce Premi um - $1, 033m(Risk only – June 2006)
Ret ai l FUM - $22b
( June 2006)
BANKING LIFE INSURANCE INVESTMENTS
NZ Market Si ze:
Group Market Share:
Source: RBNZ, ISI Statistics, FundSource
18%ASB31%Sovereign 15%ASB18%ASB31%Sovereign 15%ASB
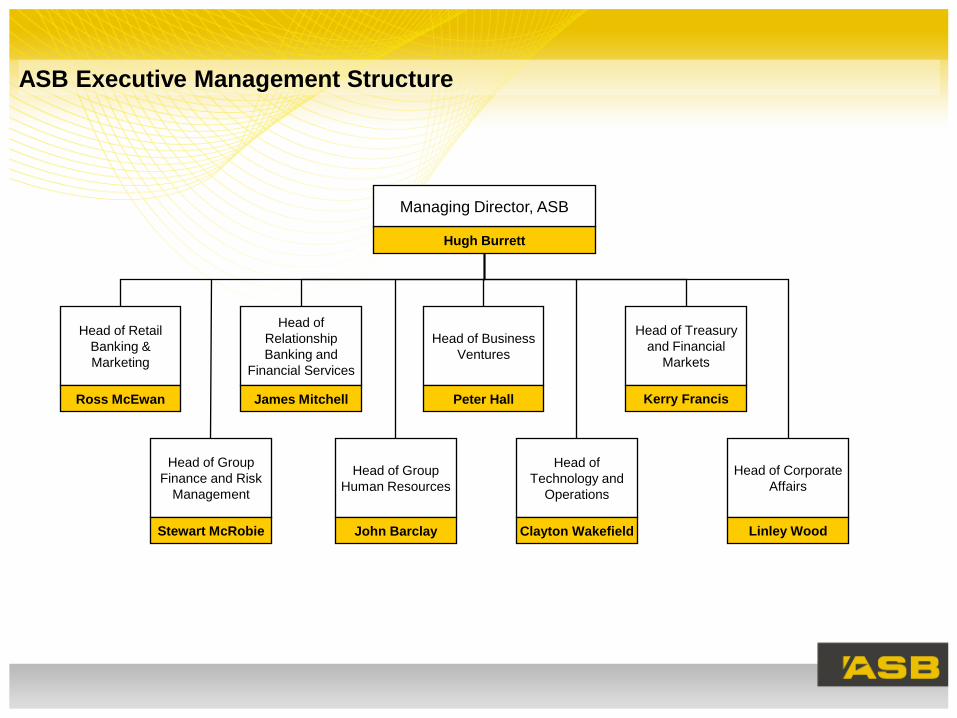
Head of Retail
Banking &
Marketing
Head of
Relationship
Banking and
Financial Services
Head of Treasury
and Financial
Markets
Head of Business
Ventures
Head of Group
Human Resources
Head of
Technology and
Operations
Head of Corporate
Affairs
Head of Group
Finance and Risk
Management
Ross McEwan James Mitchell Peter Hall
Stewart McRobie
Kerry Francis
Clayton WakefieldJohn Barclay Linley Wood
Hugh Burrett
Managing Director, ASB
ASB Executive Management Structure
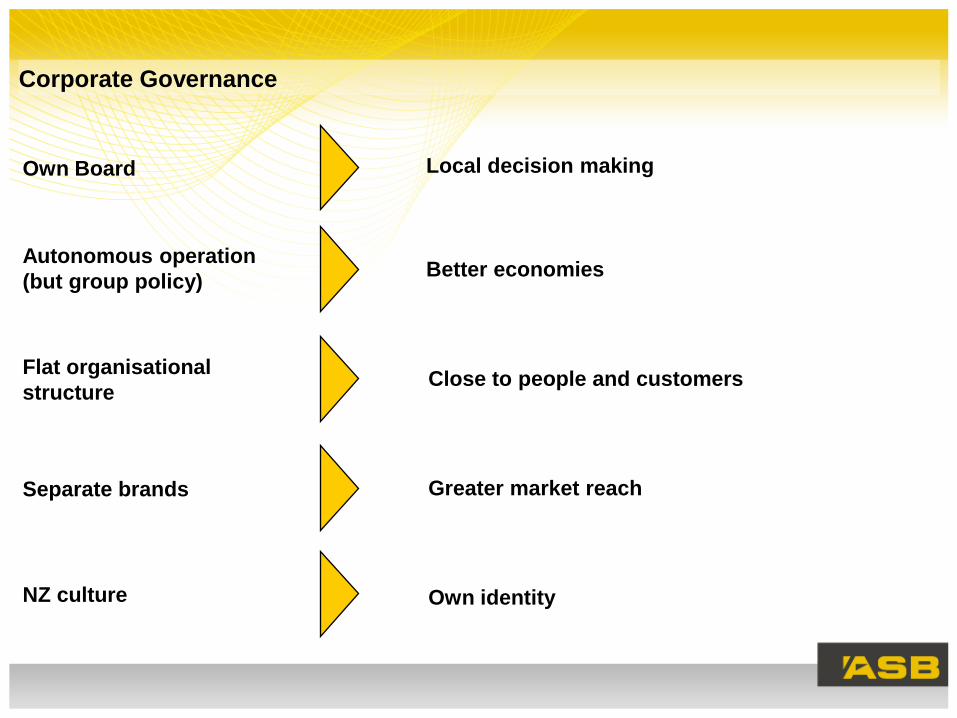
Corporate Governance
Own Board Local decision making
Autonomous operation
(but group policy)Better economies
Flat organisational
structureClose to people and customers
Separate brands Greater market reach
NZ culture Own identity
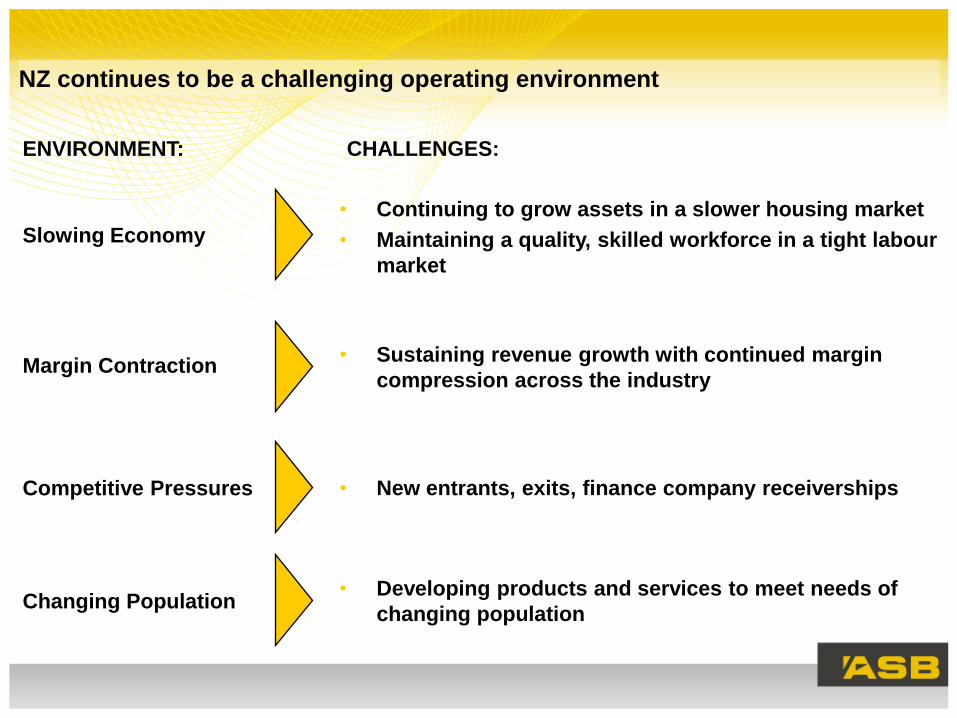
NZ continues to be a challenging operating environment
Slowing Economy
• Continuing to grow assets in a slower housing market
• Maintaining a quality, skilled workforce in a tight labour
market
Margin Contraction• Sustaining revenue growth with continued margin
compression across the industry
Competitive Pressures • New entrants, exits, finance company receiverships
Changing Population• Developing products and services to meet needs of
changing population
ENVIRONMENT: CHALLENGES:
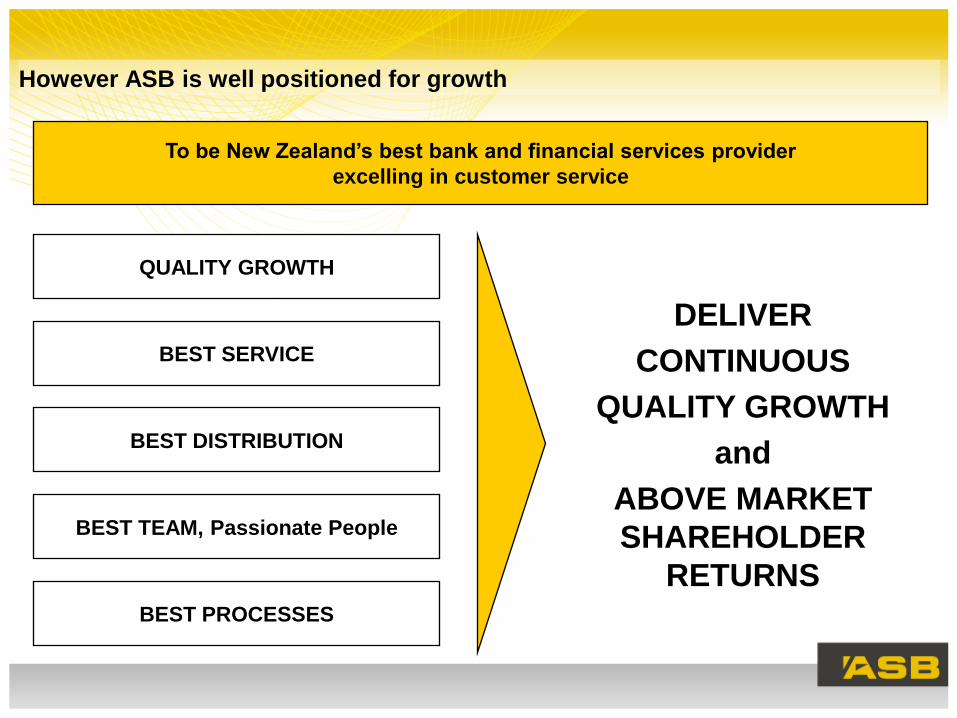
To be New Zealand’s best bank and financial services provider
excelling in customer service
BEST SERVICE
BEST PROCESSES
BEST TEAM, Passionate People
BEST DISTRIBUTION
DELIVER
CONTINUOUS
QUALITY GROWTH
and
ABOVE MARKET
SHAREHOLDER
RETURNS
QUALITY GROWTH
However ASB is well positioned for growth
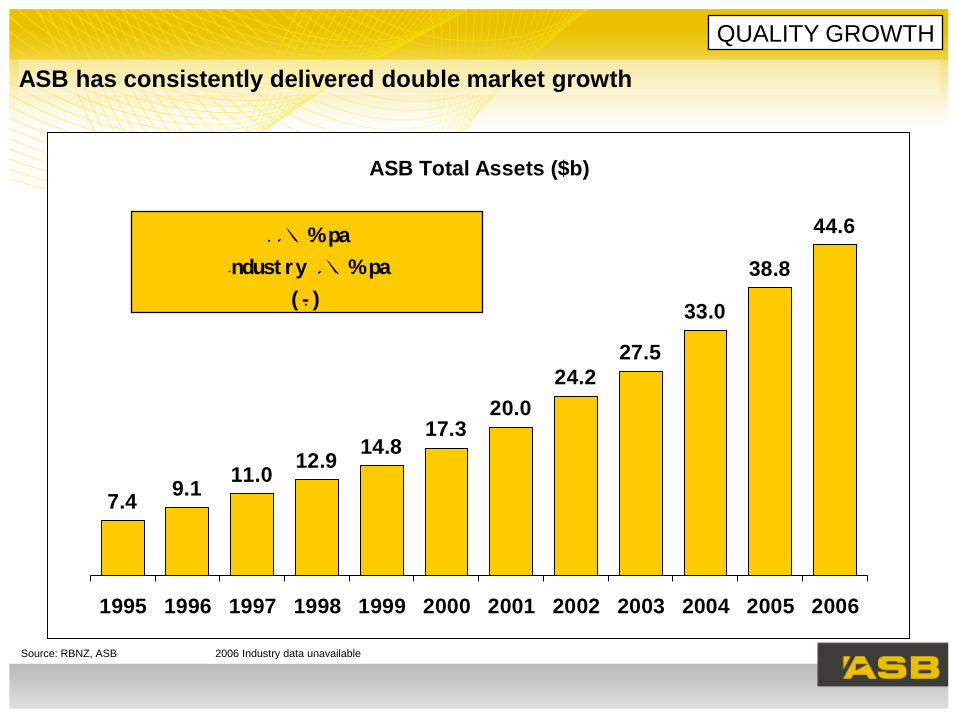
ASB Total Assets ($b)
7.49.1
11.012.9
14.817.3
20.0
24.2
27.5
33.0
38.8
44.6
1995 1996 1997 1998 1999 2000 2001 2002 2003 2004 2005 2006
ASB has consistently delivered double market growth
QUALITY GROWTH
Source: RBNZ, ASB 2006 Industry data unavailable
ASB CAGR 18% pa
Indust ry CAGR 9% pa
( 1995- 2005)
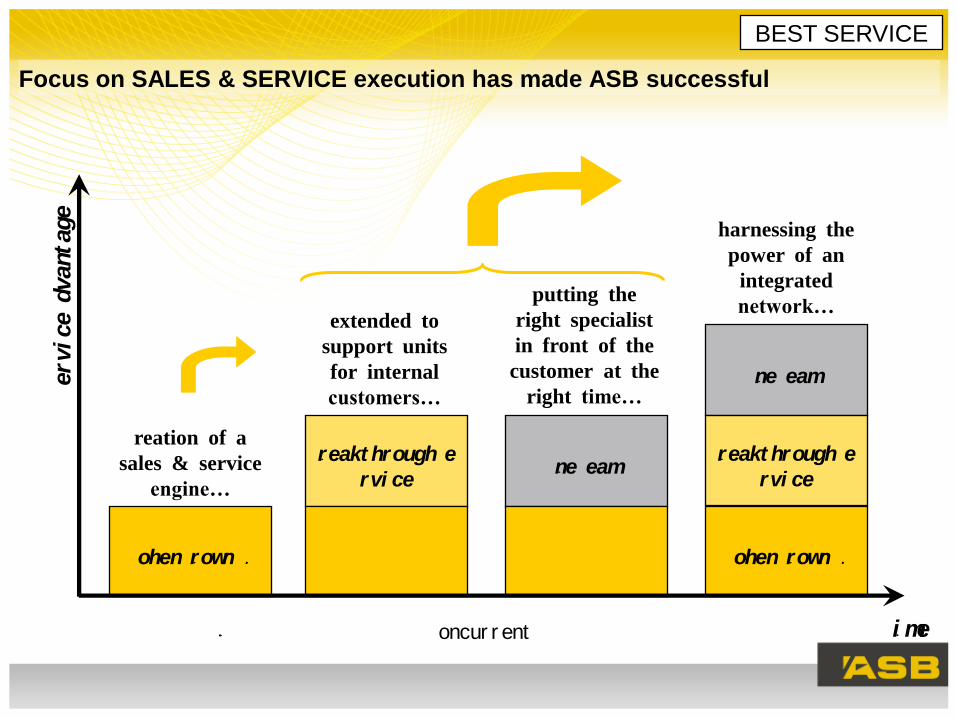
Focus on SALES & SERVICE execution has made ASB successful
BEST SERVICE
Cohen Brown SUCCESS
Service Ad
vantage
Ti me
Creation of a
sales & service
engine…
extended to
support units
for internal
customers…
putting the
right specialist
in front of the
customer at the
right time…
harnessing the
power of an
integrated
network…
Concur r ent1994
Breakt hrough Se
rvi ceOne Team
One Team
Breakt hrough Se
rvi ce
Cohen Brown SUCCESS
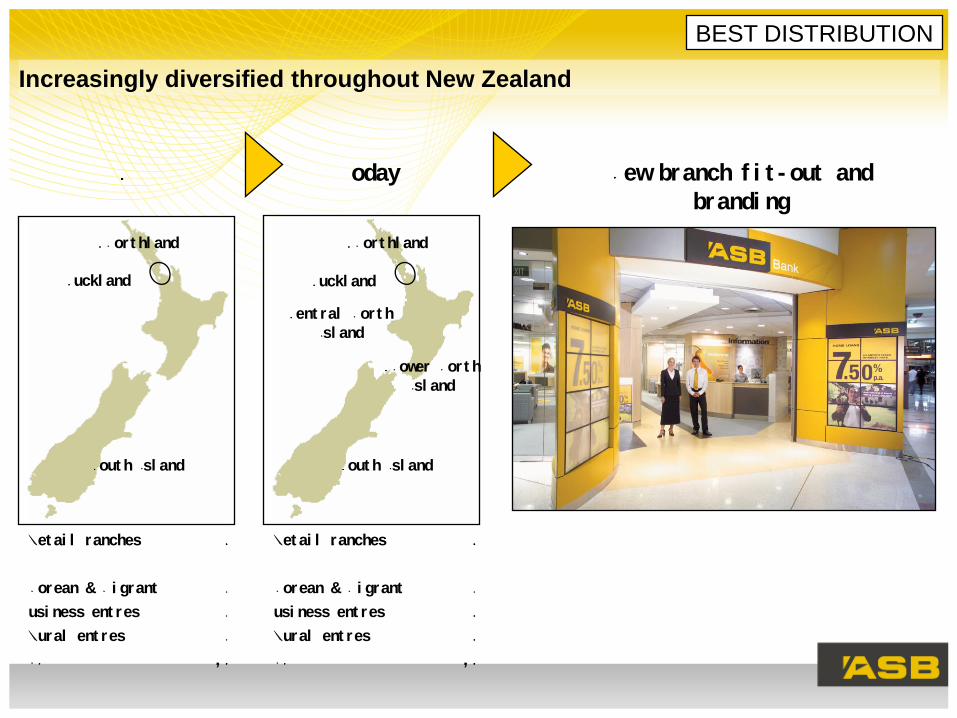
Increasingly diversified throughout New Zealand
BEST DISTRIBUTION
1990 Today New branch f i t - out and
brandi ng
84 Auckl and
17 Sout h Isl and
10 Nort hl and
71 Auckl and
14 Lower Nort h
Isl and
12 Cent ral Nort h
Isl and
14 Nort hl and
7 Sout h Isl and
Ret ai l Branches 105
Korean & Mi grant 0
Busi ness Cent res 0
Rural Cent res 0
FTE 1, 950
Ret ai l Branches 124
Korean & Mi grant 2
Busi ness Cent res 18
Rural Cent res 24
FTE 3, 868
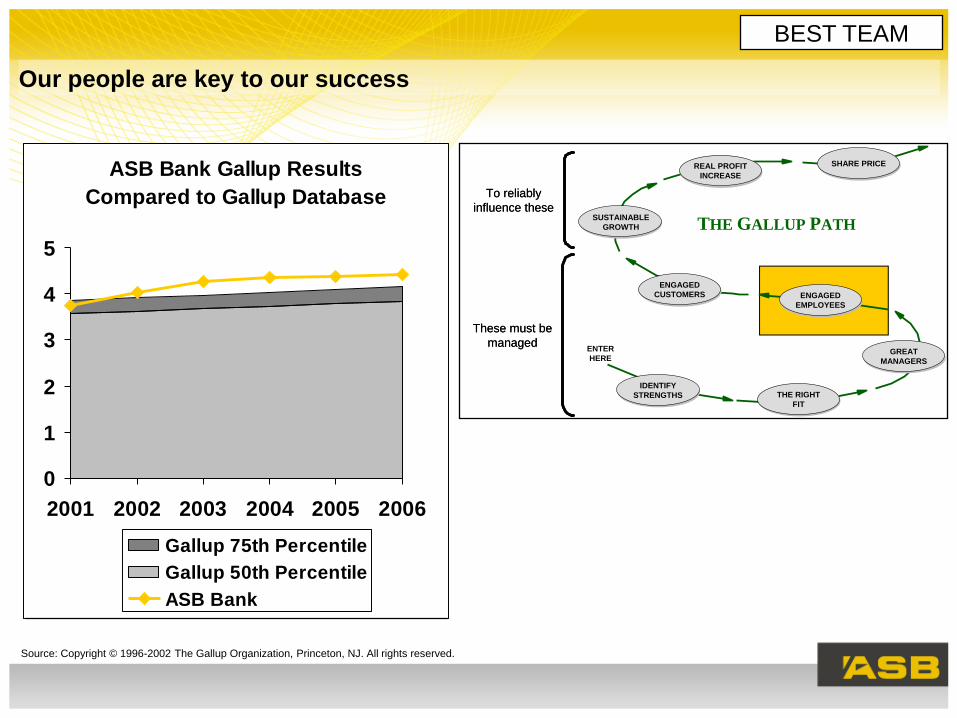
Our people are key to our success
THE GALLUP PATH
ENTER
HERE
IDENTIFY
STRENGTHS THE RIGHT
FIT
GREAT
MANAGERS
ENGAGED
EMPLOYEES
ENGAGED
CUSTOMERS
SUSTAINABLE
GROWTH
REAL PROFIT
INCREASE
SHARE PRICE
To reliably
influence these
To reliably
influence these
These must be
managed
These must be
managed
Source: Copyright © 1996-2002 The Gallup Organization, Princeton, NJ. All rights reserved.
BEST TEAM
ASB Bank Gallup Results
Compared to Gallup Database
0
1
2
3
4
5
2001 2002 2003 2004 2005 2006
Gallup 75th Percentile
Gallup 50th Percentile
ASB Bank
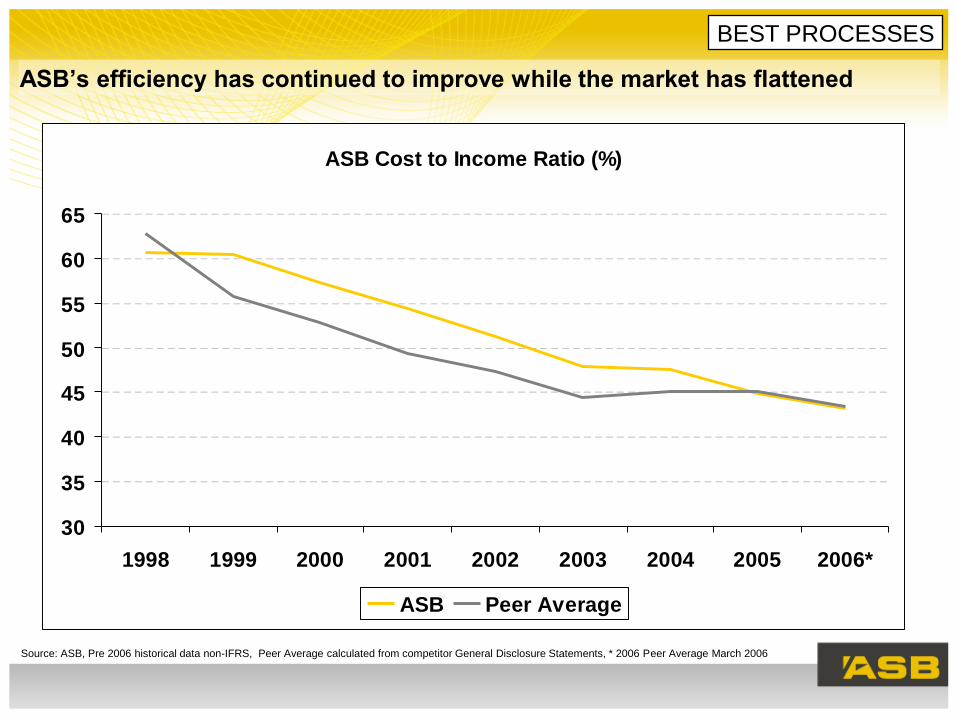
ASB’s efficiency has continued to improve while the market has flattened
Source: ASB, Pre 2006 historical data non-IFRS, Peer Average calculated from competitor General Disclosure Statements, * 2006 Peer Average March 2006
BEST PROCESSES
ASB Cost to Income Ratio (%)
30
35
40
45
50
55
60
65
1998 1999 2000 2001 2002 2003 2004 2005 2006*
ASB Peer Average
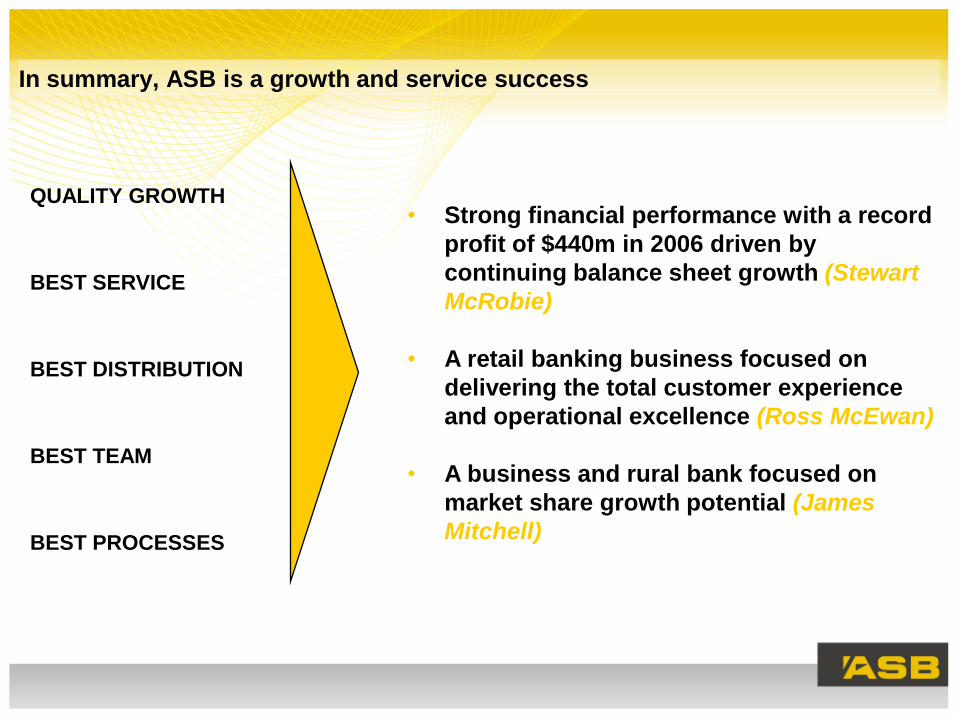
• Strong financial performance with a record
profit of $440m in 2006 driven by
continuing balance sheet growth (Stewart
McRobie)
• A retail banking business focused on
delivering the total customer experience
and operational excellence (Ross McEwan)
• A business and rural bank focused on
market share growth potential (James
Mitchell)
In summary, ASB is a growth and service success
BEST SERVICE
BEST PROCESSES
BEST TEAM
BEST DISTRIBUTION
QUALITY GROWTH
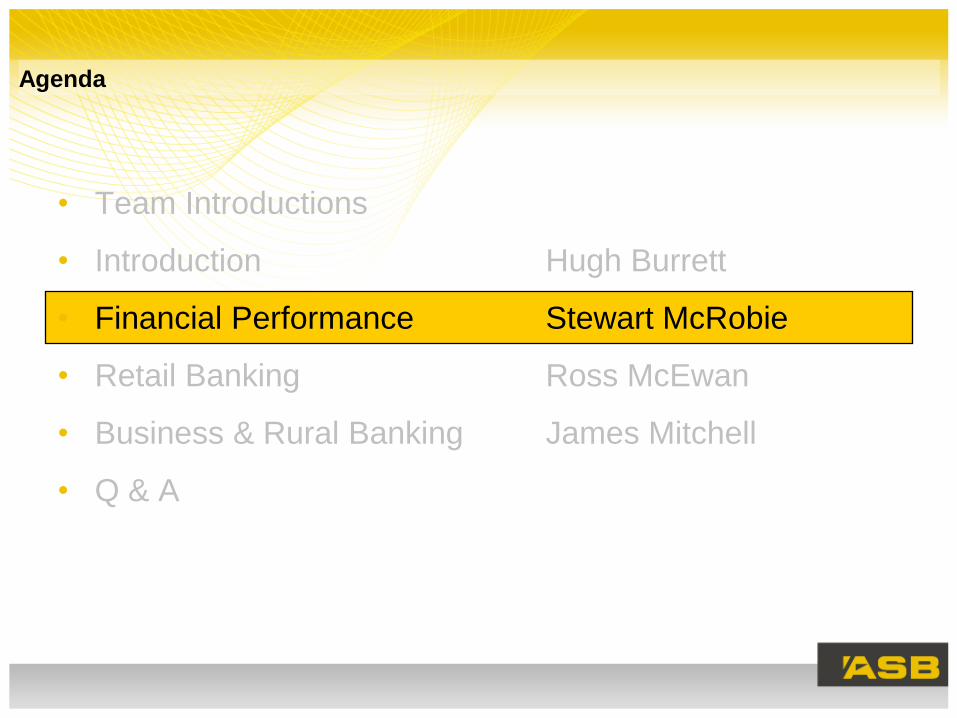
Agenda
• Team Introductions
• Introduction Hugh Burrett
• Financial Performance Stewart McRobie
• Retail Banking Ross McEwan
• Business & Rural Banking James Mitchell
• Q & A
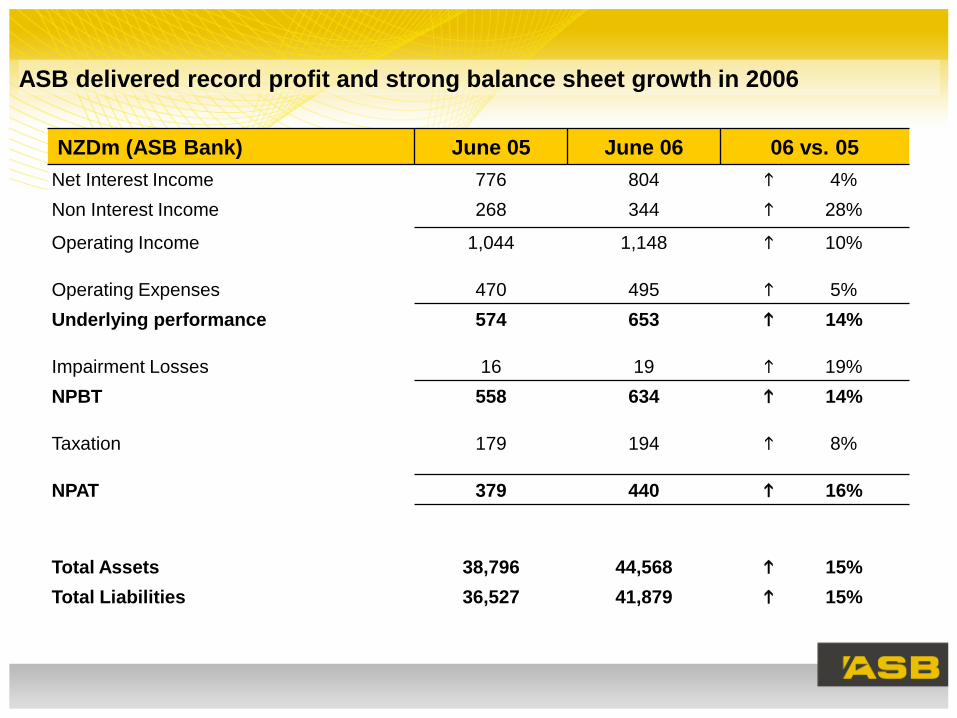
ASB delivered record profit and strong balance sheet growth in 2006
NZDm (ASB Bank) June 05 June 06 06 vs. 05
Net Interest Income 776 804 4%
Non Interest Income 268 344 28%
Operating Income 1,044 1,148 10%
Operating Expenses 470 495 5%
Underlying performance 574 653 14%
Impairment Losses 16 19 19%
NPBT 558 634 14%
Taxation 179 194 8%
NPAT 379 440 16%
Total Assets 38,796 44,568 15%
Total Liabilities 36,527 41,879 15%
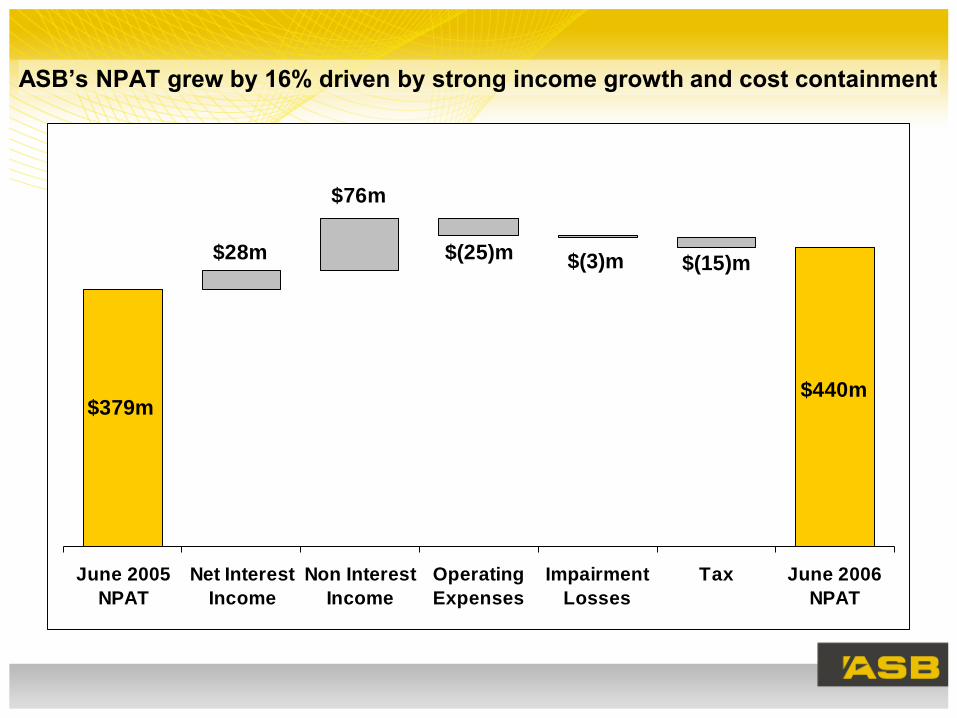
ASB’s NPAT grew by 16% driven by strong income growth and cost containment
June 2005
NPAT
Net Interest
Income
Non Interest
Income
Operating
Expenses
Impairment
Losses
Tax June 2006
NPAT
$379m
$28m
$76m
$(25)m $(3)m
)m
$(15)m
$440m
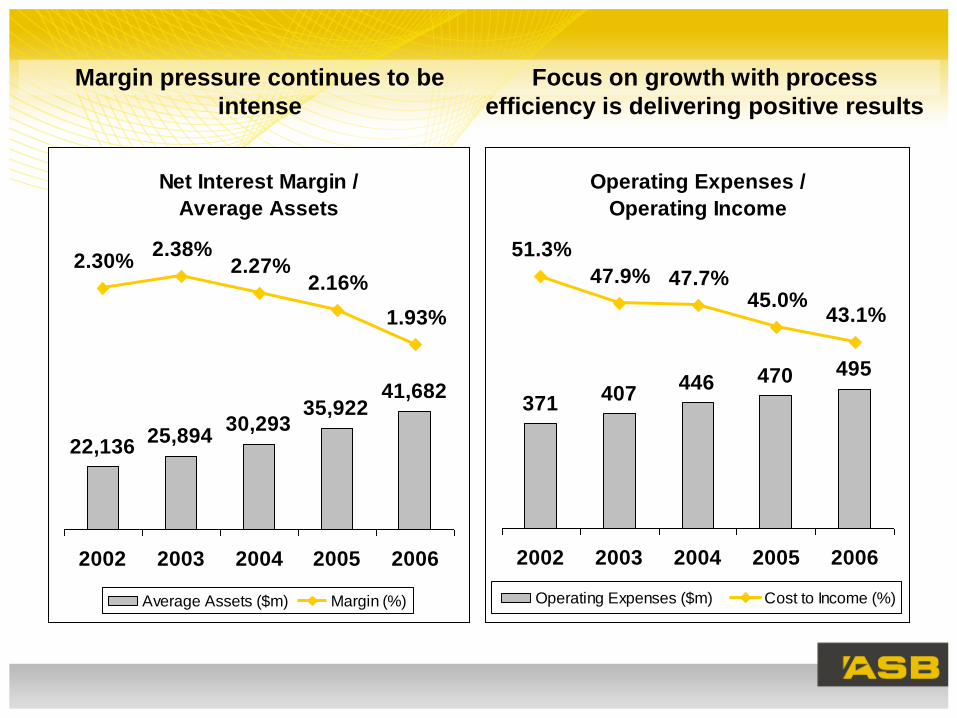
Margin pressure continues to be
intense
Focus on growth with process
efficiency is delivering positive results
Net Interest Margin /
Average Assets
22,13625,894
30,29335,922
41,682
2.30%2.38%
2.27%2.16%
1.93%
2002 2003 2004 2005 2006
Average Assets ($m) Margin (%)
Operating Expenses /
Operating Income
371407
446 470 495
51.3%
47.9% 47.7%45.0%
43.1%
2002 2003 2004 2005 2006
Operating Expenses ($m) Cost to Income (%)
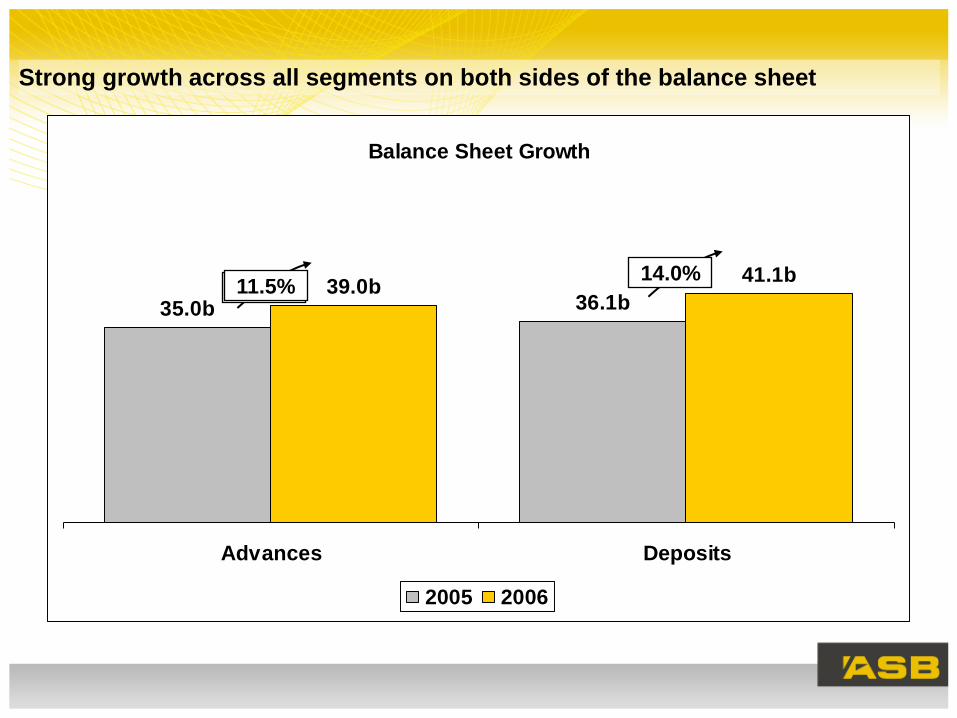
Balance Sheet Growth
36.1b35.0b
41.1b39.0b
Advances Deposits
2005 2006
Strong growth across all segments on both sides of the balance sheet
11.5%14.0%
11.5%
Underlying credit quality remains sound
• Provisions methodology has changed following the adoption of IFRS - $80m
of Collective and Specific Provisions are held as at 30 June 2006.
• Actual loan loss experience and specific provisioning levels continue to
represent only a small part of both P&L Net Impairment Loss expense and
Balance Sheet provisions for Bad Debts.
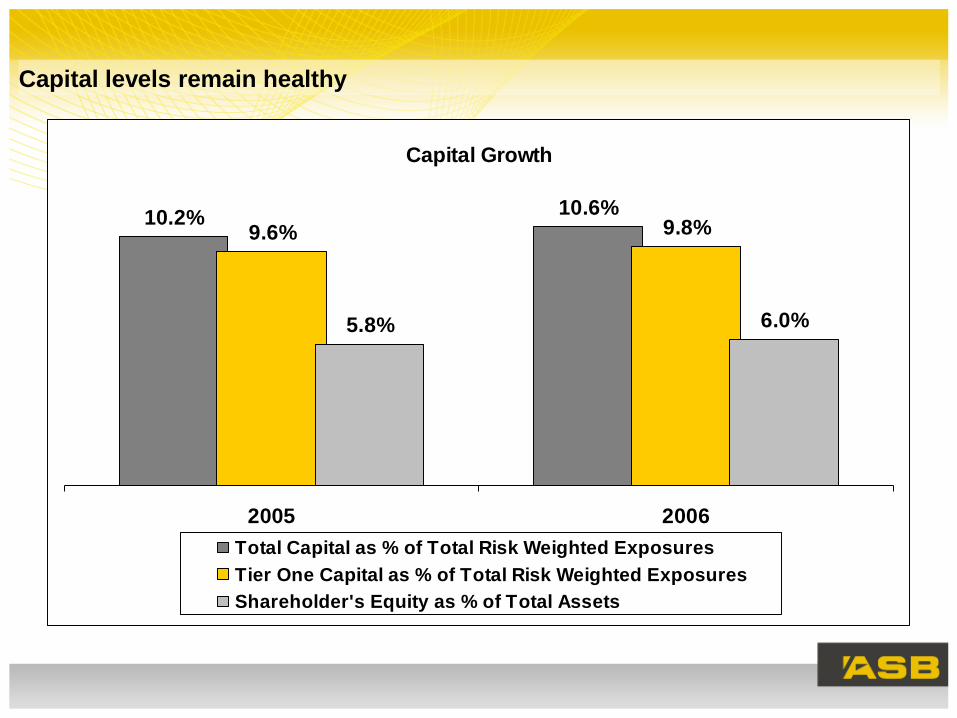
Capital levels remain healthy
Capital Growth
10.2%10.6%
9.6% 9.8%
5.8% 6.0%
2005 2006
Total Capital as % of Total Risk Weighted Exposures
Tier One Capital as % of Total Risk Weighted Exposures
Shareholder's Equity as % of Total Assets
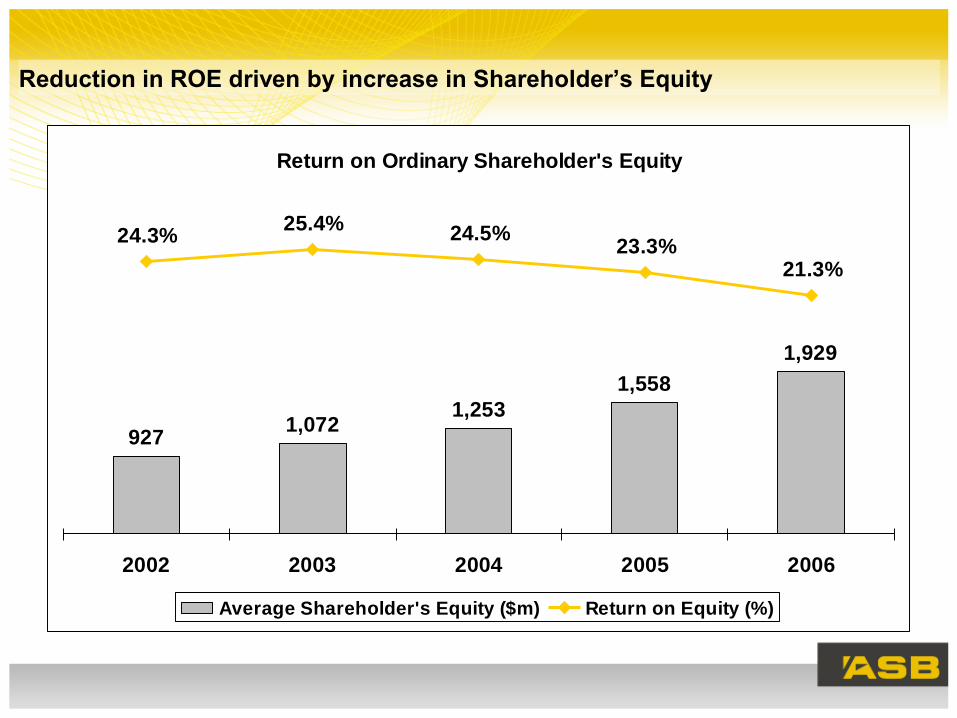
Reduction in ROE driven by increase in Shareholder’s Equity
Return on Ordinary Shareholder's Equity
9271,072
1,253
1,558
1,929
24.3%25.4% 24.5%
23.3%21.3%
2002 2003 2004 2005 2006
Average Shareholder's Equity ($m) Return on Equity (%)
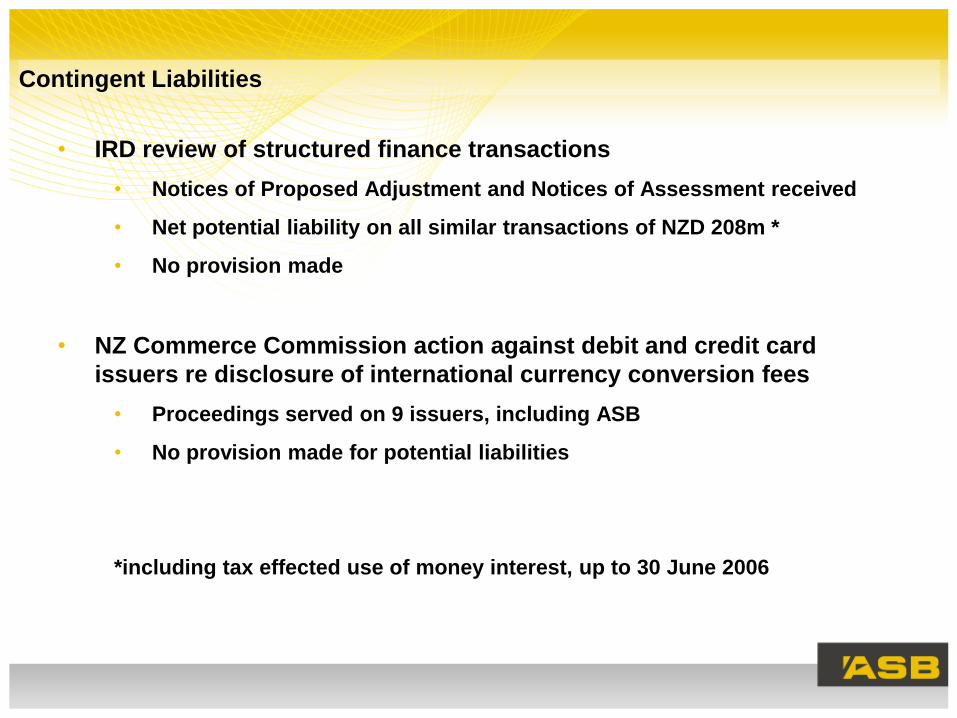
Contingent Liabilities
• IRD review of structured finance transactions
• Notices of Proposed Adjustment and Notices of Assessment received
• Net potential liability on all similar transactions of NZD 208m *
• No provision made
• NZ Commerce Commission action against debit and credit card
issuers re disclosure of international currency conversion fees
• Proceedings served on 9 issuers, including ASB
• No provision made for potential liabilities
*including tax effected use of money interest, up to 30 June 2006
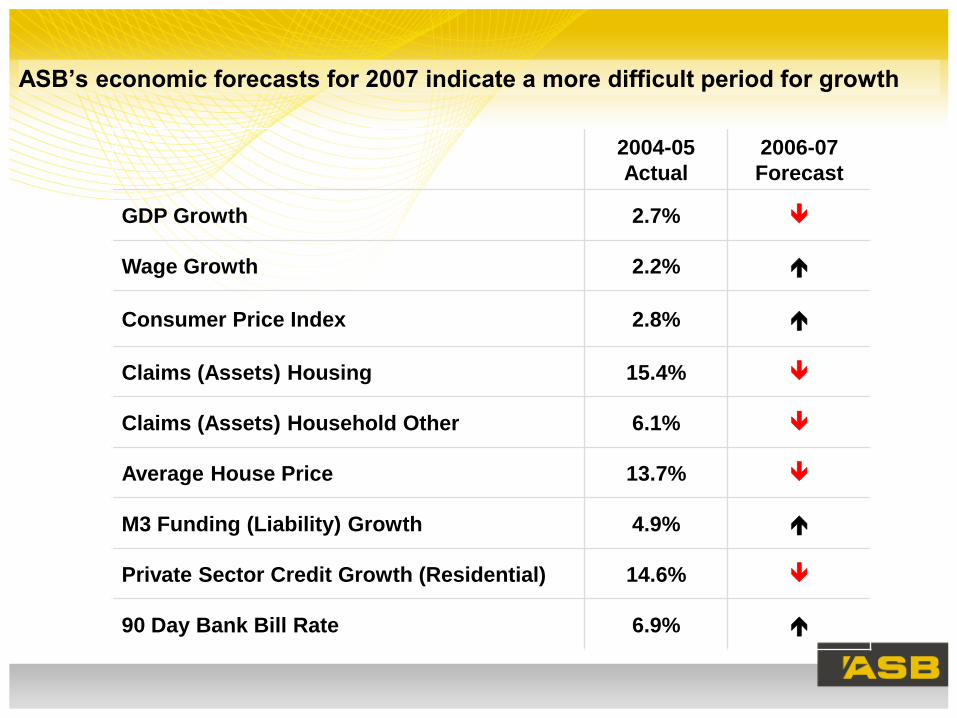
ASB’s economic forecasts for 2007 indicate a more difficult period for growth
2004-05
Actual
2006-07
Forecast
GDP Growth 2.7%
Wage Growth 2.2%
Consumer Price Index 2.8%
Claims (Assets) Housing 15.4%
Claims (Assets) Household Other 6.1%
Average House Price 13.7%
M3 Funding (Liability) Growth 4.9%
Private Sector Credit Growth (Residential) 14.6%
90 Day Bank Bill Rate 6.9%
Agenda
• Team Introductions
• Introduction Hugh Burrett
• Financial Performance Stewart McRobie
• Retail Banking Ross McEwan
• Business & Rural Banking James Mitchell
• Q & A
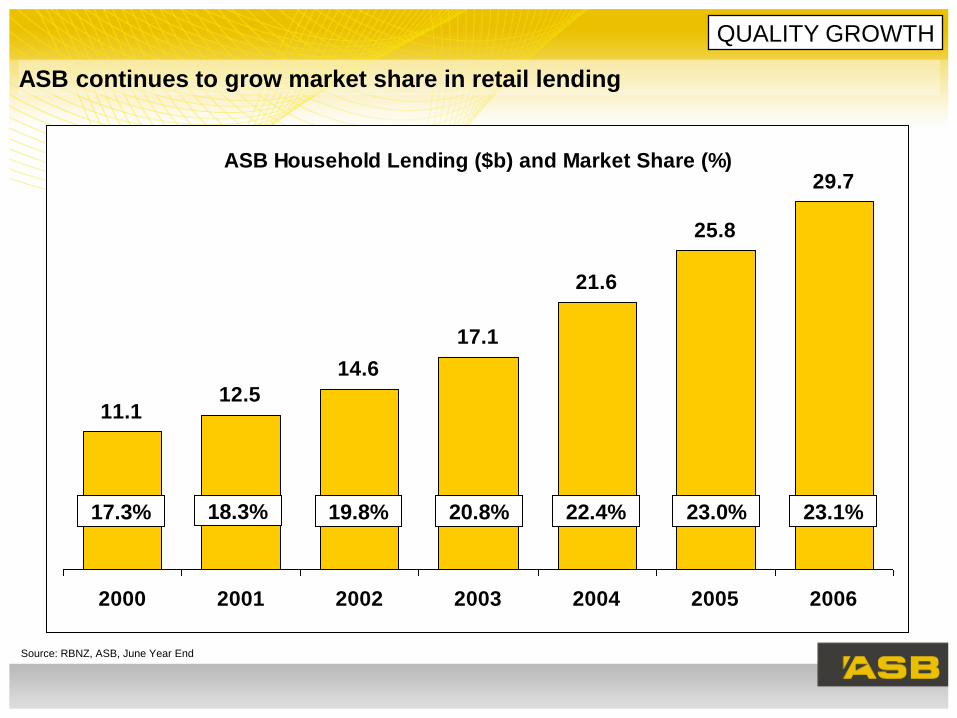
Source: RBNZ, ASB, June Year End
ASB continues to grow market share in retail lending
QUALITY GROWTH
ASB Household Lending ($b) and Market Share (%)
11.112.5
14.6
17.1
21.6
25.8
29.7
2000 2001 2002 2003 2004 2005 2006
23.1%23.0%22.4%20.8%19.8%18.3%17.3%
ASB Household Lending ($b) and Market Share (%)
11.112.5
14.6
17.1
21.6
25.8
29.7
2000 2001 2002 2003 2004 2005 2006
23.1%23.0%22.4%20.8%19.8%18.3%17.3%
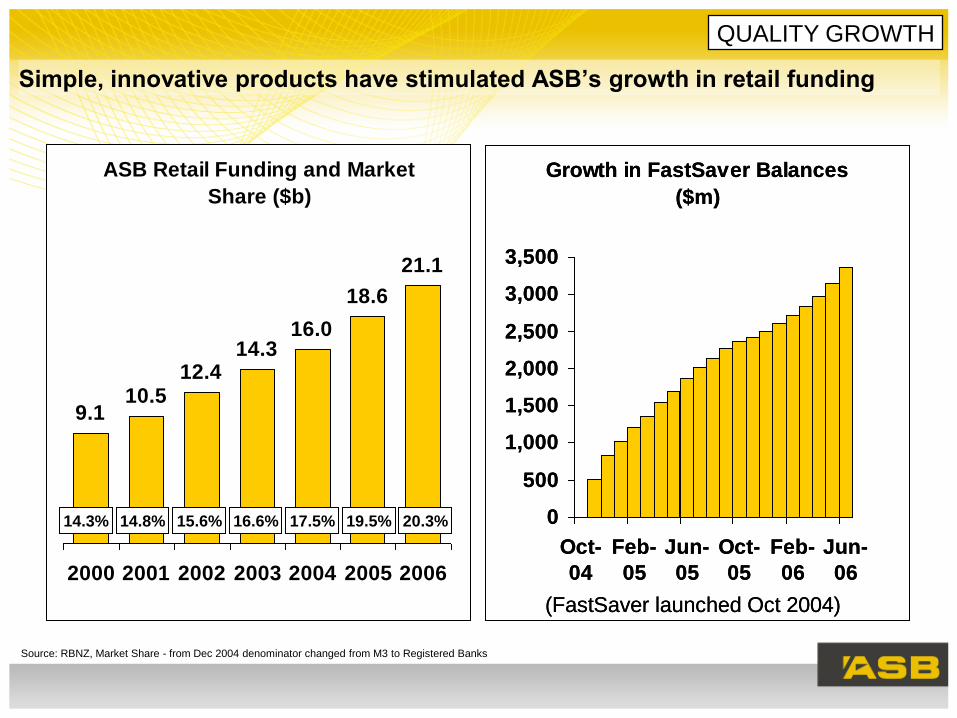
Simple, innovative products have stimulated ASB’s growth in retail funding
Source: RBNZ, Market Share - from Dec 2004 denominator changed from M3 to Registered Banks
QUALITY GROWTH
Growth in FastSaver Balances
($m)
0
500
1,000
1,500
2,000
2,500
3,000
3,500
Oct-
04
Feb-
05
Jun-
05
Oct-
05
Feb-
06
Jun-
06
(FastSaver launched Oct 2004)
ASB Retail Funding and Market
Share ($b)
9.110.5
12.414.3
16.0
18.6
21.1
2000 2001 2002 2003 2004 2005 2006
14.3% 14.8% 15.6% 16.6% 17.5% 19.5% 20.3%
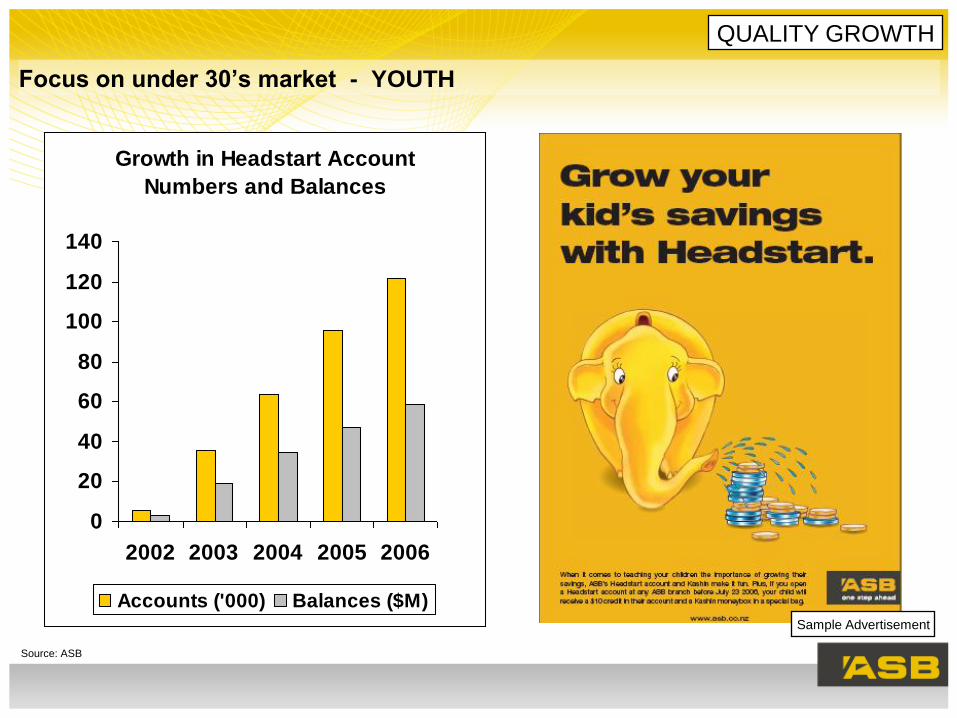
Focus on under 30’s market - YOUTH
Source: ASB
Sample Advertisement
QUALITY GROWTH
Growth in Headstart Account
Numbers and Balances
0
20
40
60
80
100
120
140
2002 2003 2004 2005 2006
Accounts ('000) Balances ($M)
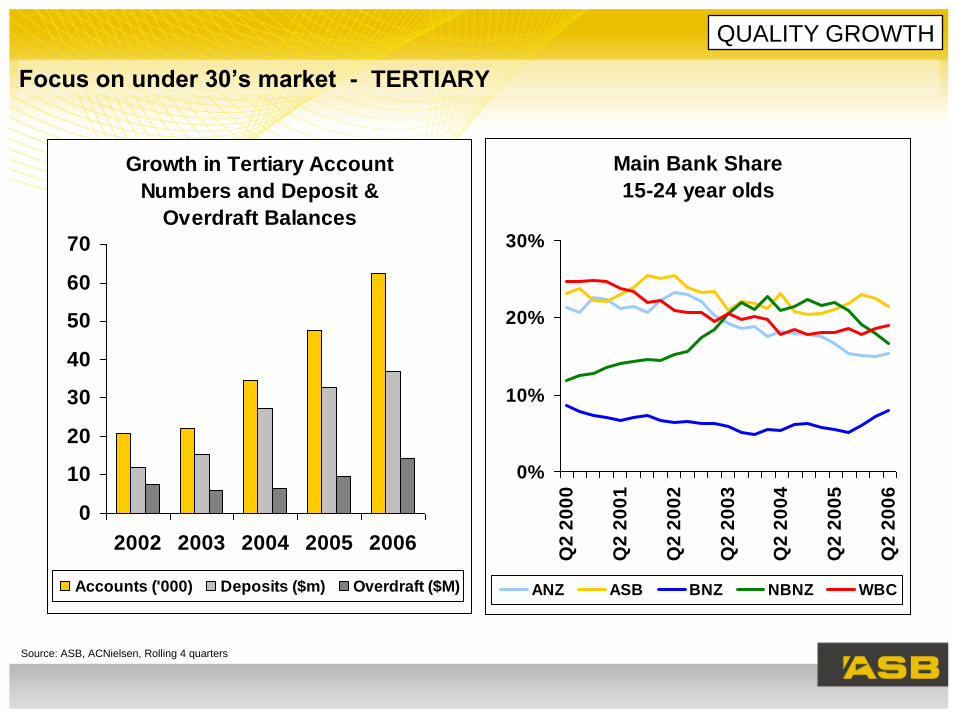
Focus on under 30’s market - TERTIARY
Source: ASB, ACNielsen, Rolling 4 quarters
QUALITY GROWTH
Growth in Tertiary Account
Numbers and Deposit &
Overdraft Balances
0
10
20
30
40
50
60
70
2002 2003 2004 2005 2006
Accounts ('000) Deposits ($m) Overdraft ($M)
Main Bank Share
15-24 year olds
0%
10%
20%
30%
Q2
20
00
Q2
20
01
Q2
20
02
Q2
20
03
Q2
20
04
Q2
20
05
Q2
20
06
ANZ ASB BNZ NBNZ WBC
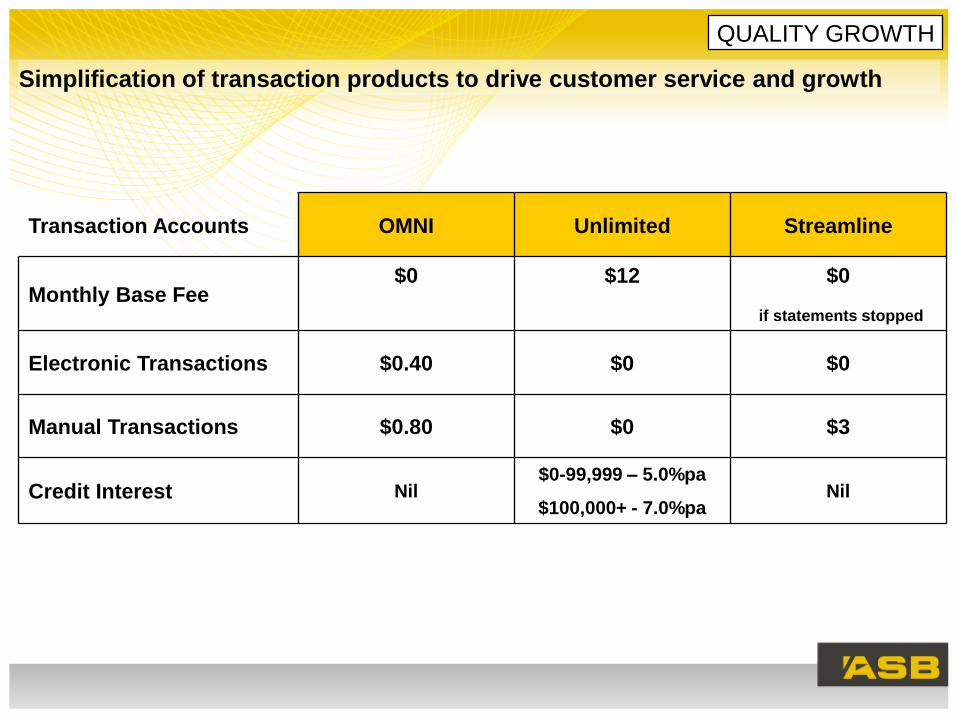
Simplification of transaction products to drive customer service and growth
Transaction Accounts OMNI Unlimited Streamline
Monthly Base Fee$0 $12 $0
if statements stopped
Electronic Transactions $0.40 $0 $0
Manual Transactions $0.80 $0 $3
Credit Interest Nil$0-99,999 – 5.0%pa
$100,000+ - 7.0%paNil
QUALITY GROWTH
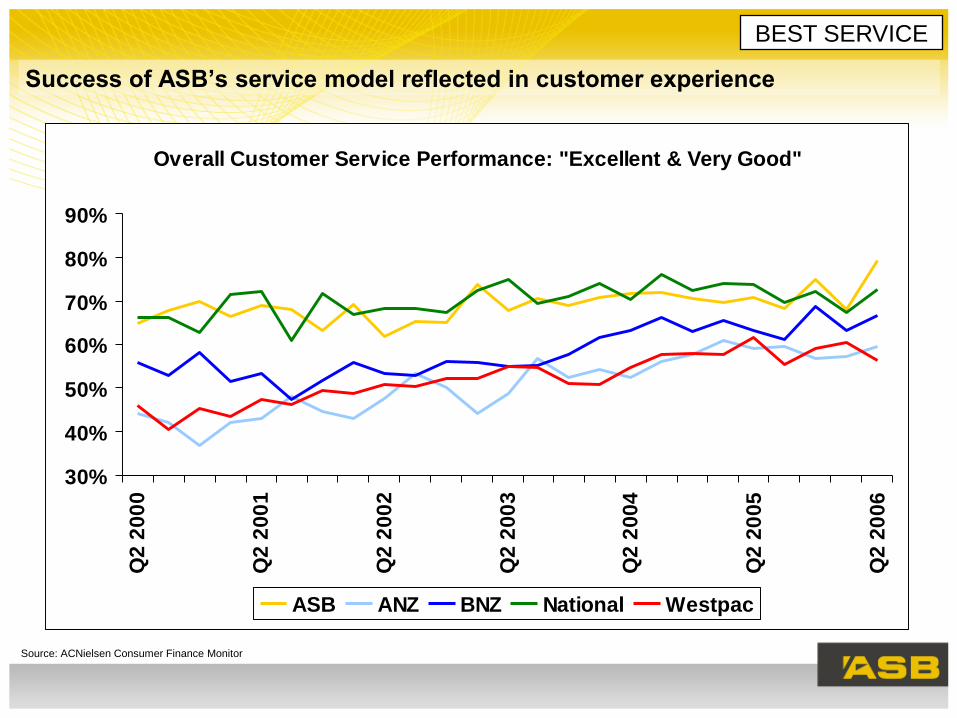
Success of ASB’s service model reflected in customer experience
BEST SERVICE
Source: ACNielsen Consumer Finance Monitor
Overall Customer Service Performance: "Excellent & Very Good"
30%
40%
50%
60%
70%
80%
90%
Q2
20
00
Q2
20
01
Q2
20
02
Q2
20
03
Q2
20
04
Q2
20
05
Q2
20
06
ASB ANZ BNZ National Westpac
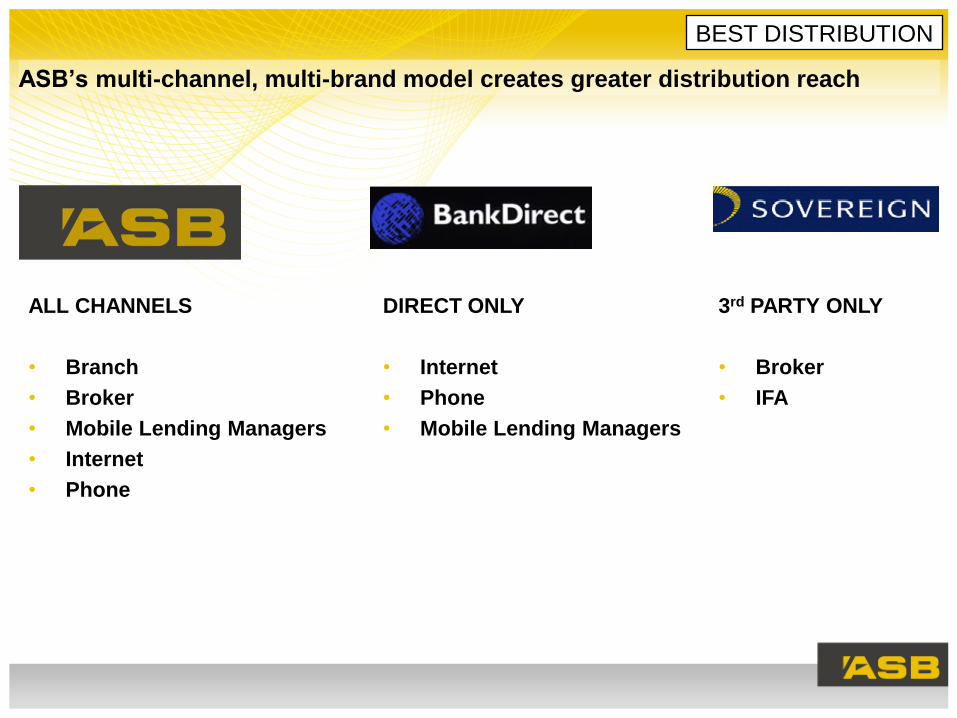
ASB’s multi-channel, multi-brand model creates greater distribution reach
BEST DISTRIBUTION
ALL CHANNELS
• Branch
• Broker
• Mobile Lending Managers
• Internet
• Phone
DIRECT ONLY
• Internet
• Phone
• Mobile Lending Managers
3rd PARTY ONLY
• Broker
• IFA
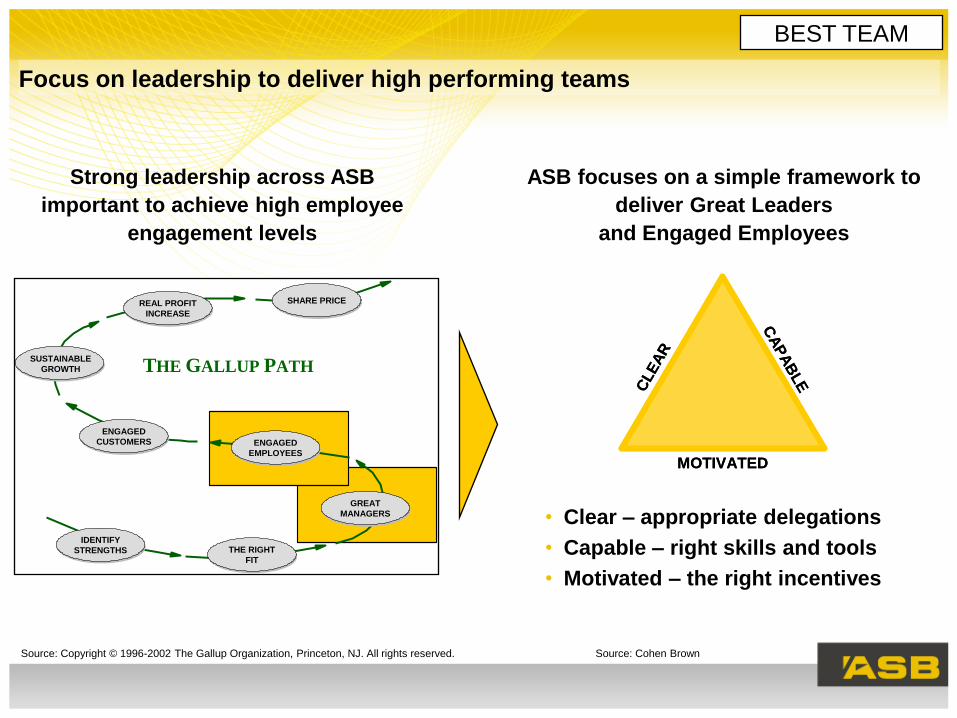
Focus on leadership to deliver high performing teams
THE GALLUP PATH
IDENTIFY
STRENGTHS THE RIGHT
FIT
GREAT
MANAGERS
ENGAGED
EMPLOYEES
ENGAGED
CUSTOMERS
SUSTAINABLE
GROWTH
REAL PROFIT
INCREASE
SHARE PRICE
BEST TEAM
Source: Copyright © 1996-2002 The Gallup Organization, Princeton, NJ. All rights reserved. Source: Cohen Brown
Strong leadership across ASB
important to achieve high employee
engagement levels
ASB focuses on a simple framework to
deliver Great Leaders
and Engaged Employees
• Clear – appropriate delegations
• Capable – right skills and tools
• Motivated – the right incentives
CLE
AR
CA
PA
BLE
MOTIVATED
CLE
AR
CA
PA
BLE
MOTIVATED
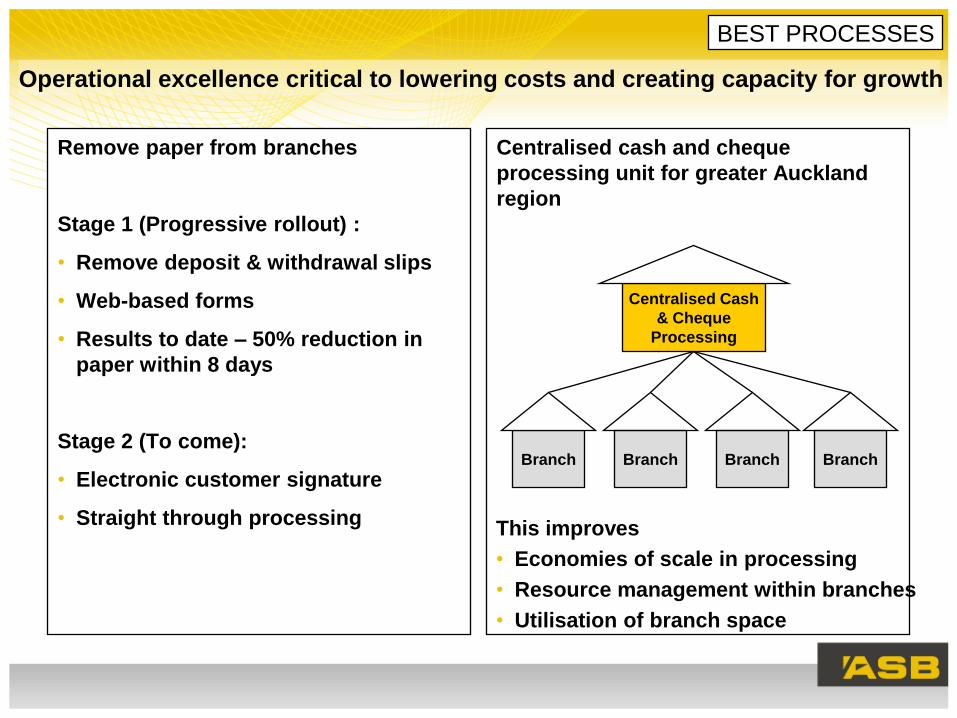
Operational excellence critical to lowering costs and creating capacity for growth
Remove paper from branches
Stage 1 (Progressive rollout) :
• Remove deposit & withdrawal slips
• Web-based forms
• Results to date – 50% reduction in
paper within 8 days
Stage 2 (To come):
• Electronic customer signature
• Straight through processing
BEST PROCESSES
Centralised Cash
& Cheque
Processing
Branch Branch Branch Branch
Centralised cash and cheque
processing unit for greater Auckland
region
This improves
• Economies of scale in processing
• Resource management within branches
• Utilisation of branch space
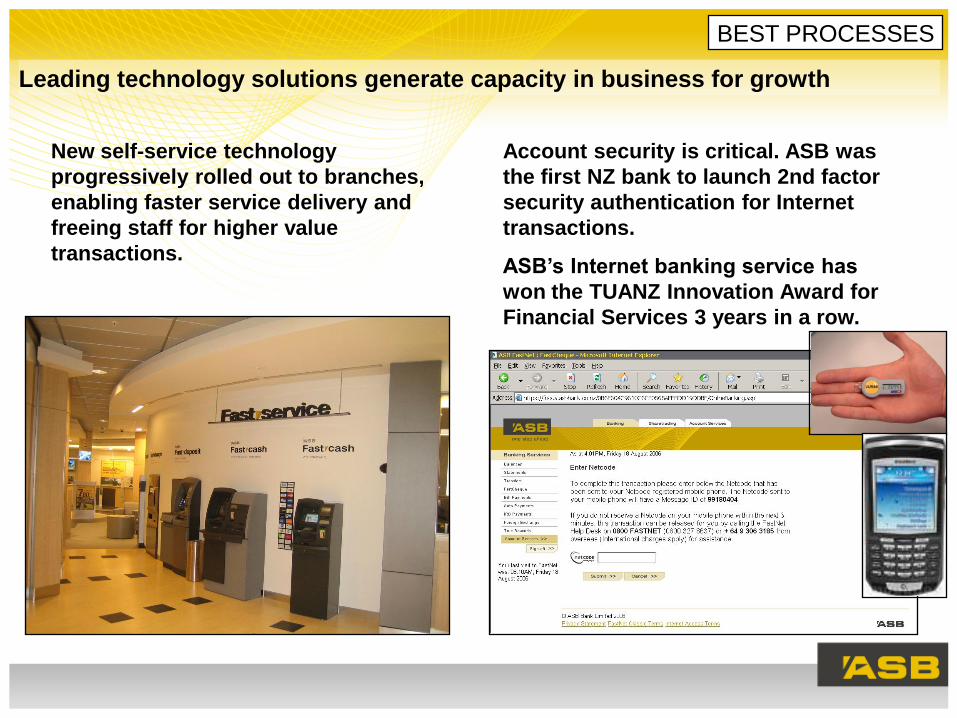
Leading technology solutions generate capacity in business for growth
New self-service technology
progressively rolled out to branches,
enabling faster service delivery and
freeing staff for higher value
transactions.
Account security is critical. ASB was
the first NZ bank to launch 2nd factor
security authentication for Internet
transactions.
ASB’s Internet banking service has
won the TUANZ Innovation Award for
Financial Services 3 years in a row.
BEST PROCESSES
BEST SERVICE
BEST PROCESSES
BEST TEAM
BEST DISTRIBUTION
QUALITY GROWTH
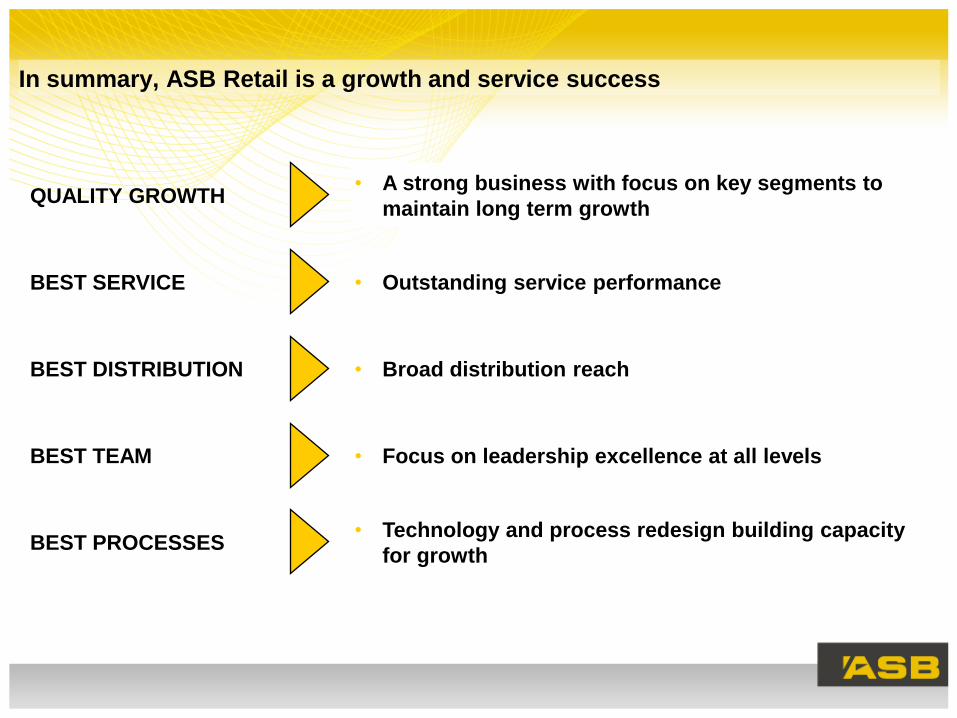
In summary, ASB Retail is a growth and service success
• Outstanding service performance
• Technology and process redesign building capacity
for growth
• Focus on leadership excellence at all levels
• Broad distribution reach
• A strong business with focus on key segments to
maintain long term growth
Agenda
• Team Introductions
• Introduction Hugh Burrett
• Financial Performance Stewart McRobie
• Retail Banking Ross McEwan
• Business & Rural Banking James Mitchell
• Q & A
Source: ASB, June Year End
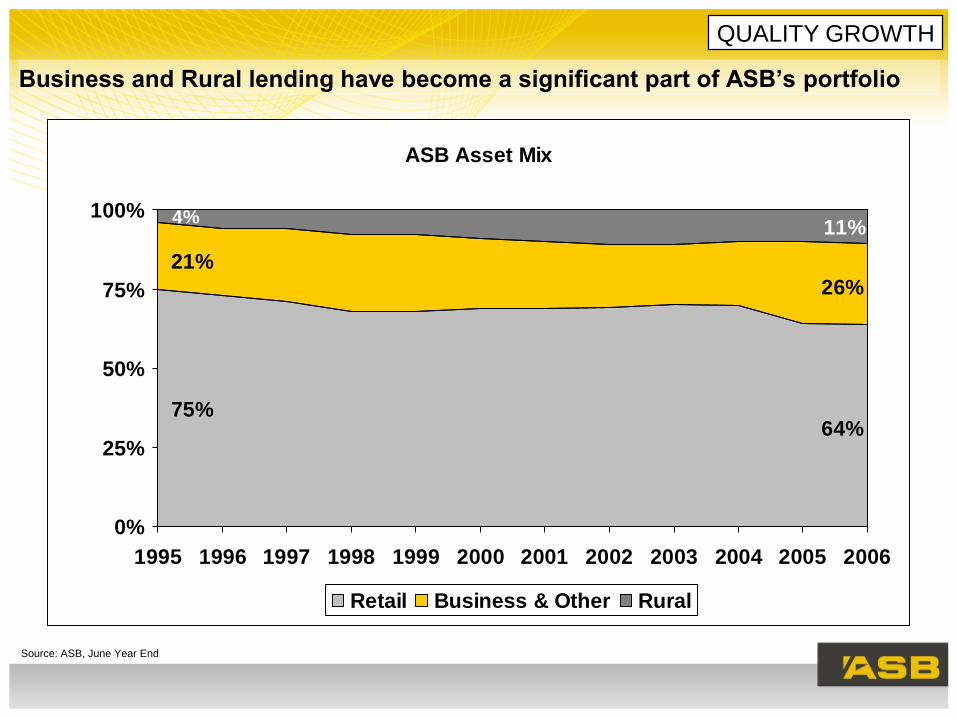
Business and Rural lending have become a significant part of ASB’s portfolio
QUALITY GROWTH
ASB Asset Mix
64%75%
26%
21%
11%4%
0%
25%
50%
75%
100%
1995 1996 1997 1998 1999 2000 2001 2002 2003 2004 2005 2006
Retail Business & Other Rural
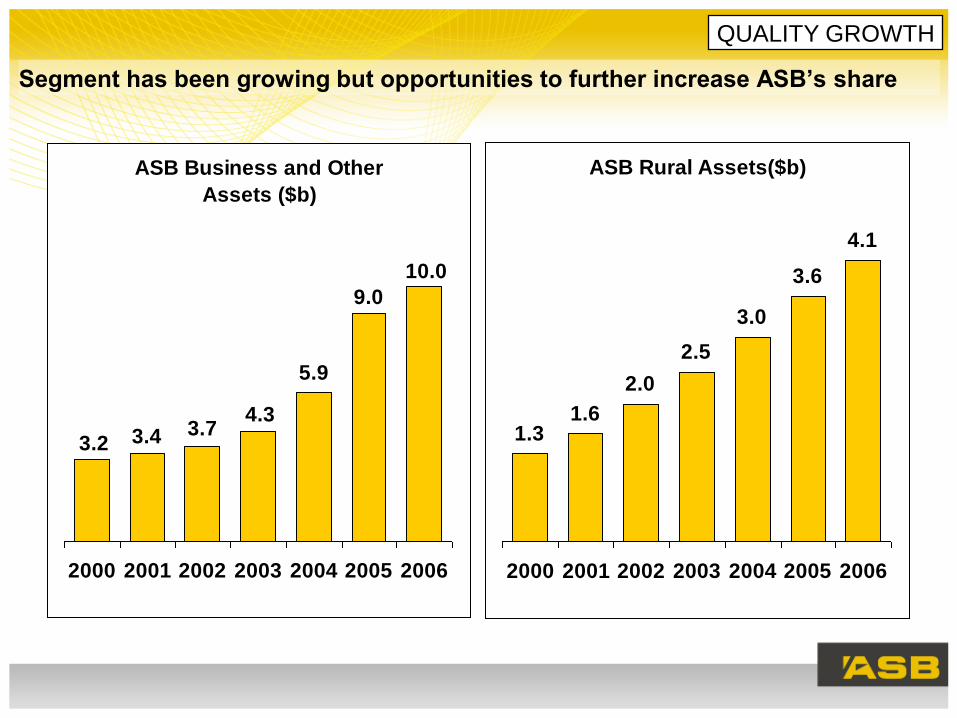
Segment has been growing but opportunities to further increase ASB’s share
QUALITY GROWTH
ASB Business and Other
Assets ($b)
10.0
9.0
5.9
4.33.73.43.2
2000 2001 2002 2003 2004 2005 2006
ASB Rural Assets($b)
1.31.6
2.0
2.5
3.0
3.6
4.1
2000 2001 2002 2003 2004 2005 2006
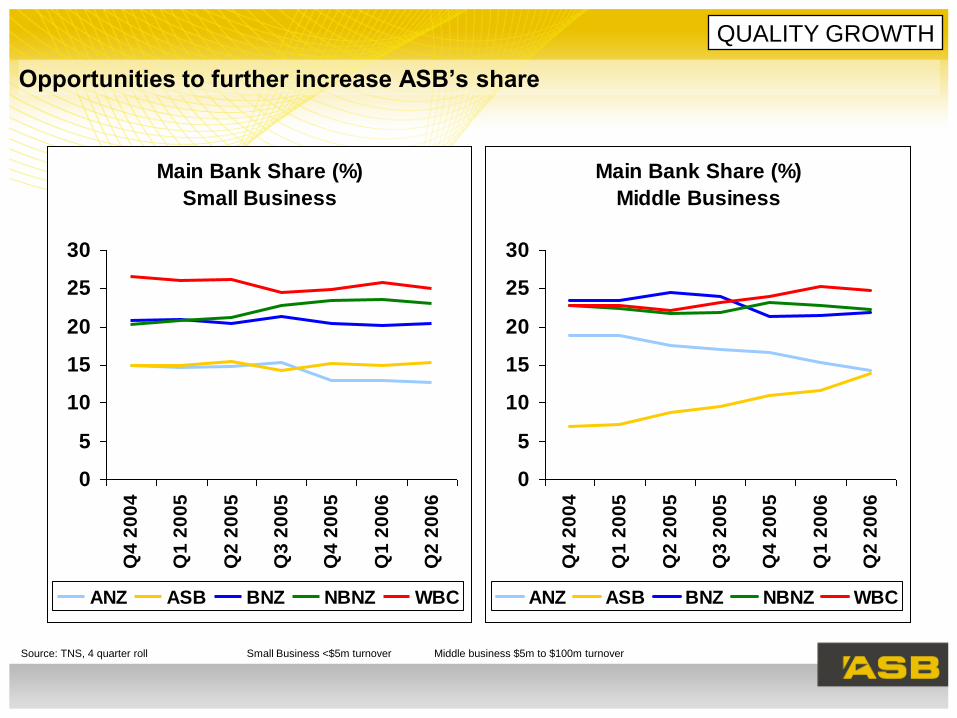
Source: TNS, 4 quarter roll Small Business <$5m turnover Middle business $5m to $100m turnover
Opportunities to further increase ASB’s share
QUALITY GROWTH
Main Bank Share (%)
Small Business
0
5
10
15
20
25
30
Q4
20
04
Q1
20
05
Q2
20
05
Q3
20
05
Q4
20
05
Q1
20
06
Q2
20
06
ANZ ASB BNZ NBNZ WBC
Main Bank Share (%)
Middle Business
0
5
10
15
20
25
30
Q4
20
04
Q1
20
05
Q2
20
05
Q3
20
05
Q4
20
05
Q1
20
06
Q2
20
06
ANZ ASB BNZ NBNZ WBC
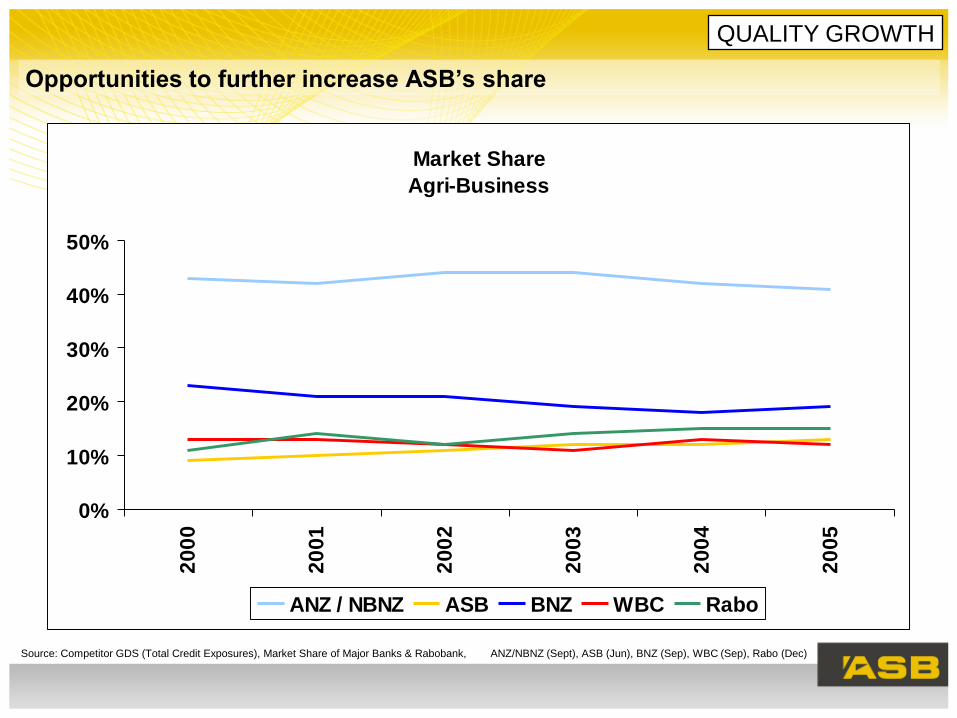
Opportunities to further increase ASB’s share
Source: Competitor GDS (Total Credit Exposures), Market Share of Major Banks & Rabobank, ANZ/NBNZ (Sept), ASB (Jun), BNZ (Sep), WBC (Sep), Rabo (Dec)
QUALITY GROWTH
Market Share
Agri-Business
0%
10%
20%
30%
40%
50%
20
00
20
01
20
02
20
03
20
04
20
05
ANZ / NBNZ ASB BNZ WBC Rabo
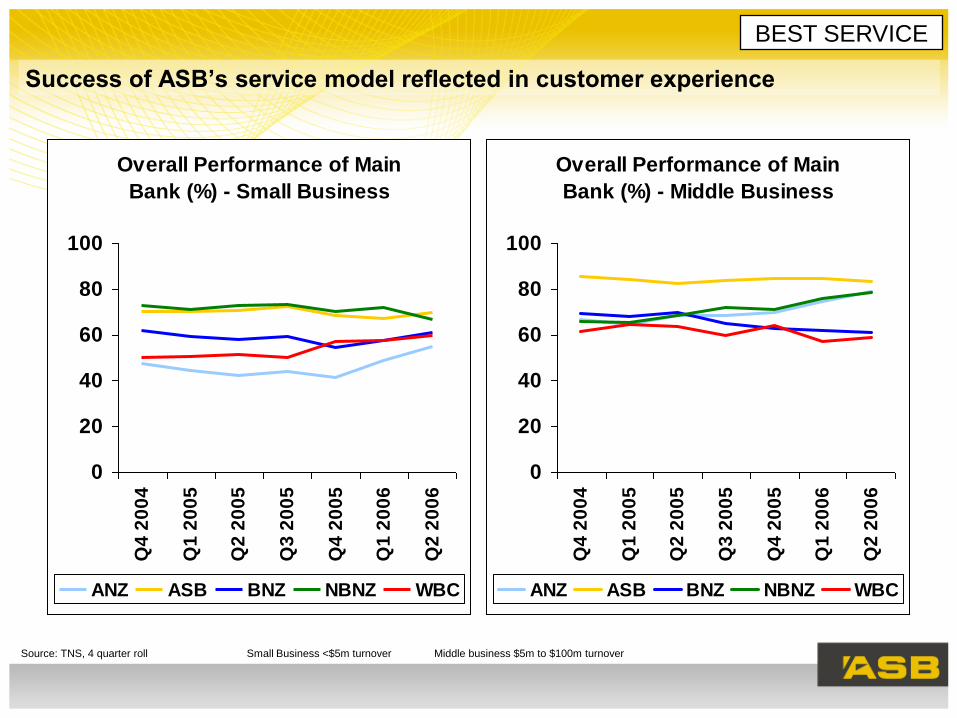
Success of ASB’s service model reflected in customer experience
BEST SERVICE
Source: TNS, 4 quarter roll Small Business <$5m turnover Middle business $5m to $100m turnover
Overall Performance of Main
Bank (%) - Small Business
0
20
40
60
80
100
Q4
20
04
Q1
20
05
Q2
20
05
Q3
20
05
Q4
20
05
Q1
20
06
Q2
20
06
ANZ ASB BNZ NBNZ WBC
Overall Performance of Main
Bank (%) - Middle Business
0
20
40
60
80
100
Q4
20
04
Q1
20
05
Q2
20
05
Q3
20
05
Q4
20
05
Q1
20
06
Q2
20
06
ANZ ASB BNZ NBNZ WBC
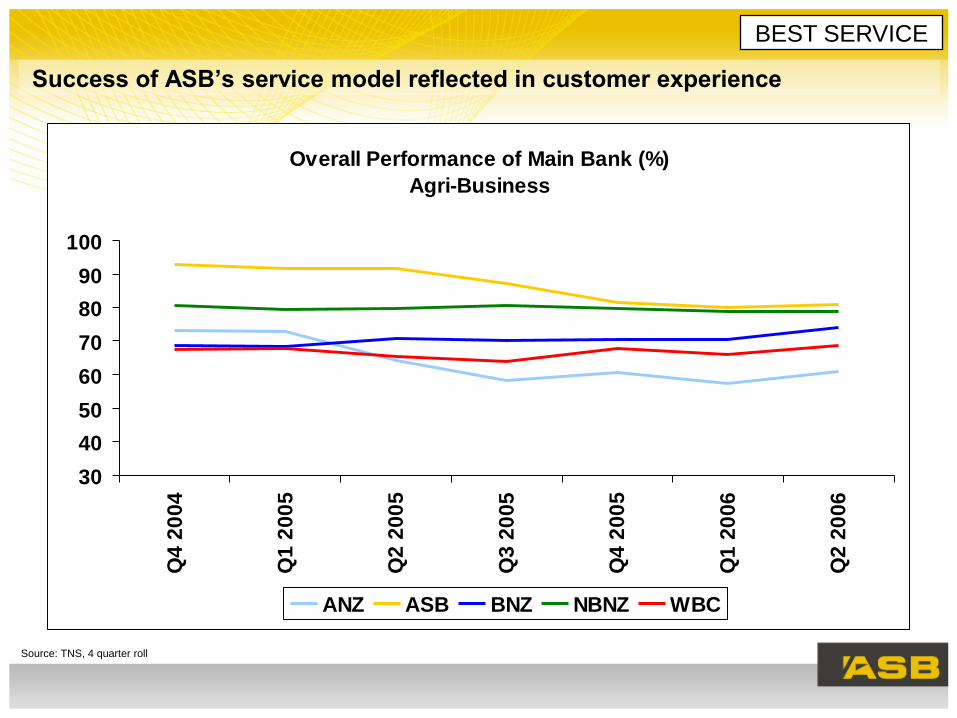
Success of ASB’s service model reflected in customer experience
BEST SERVICE
Source: TNS, 4 quarter roll
Overall Performance of Main Bank (%)
Agri-Business
30
40
50
60
70
80
90
100
Q4
20
04
Q1
20
05
Q2
20
05
Q3
20
05
Q4
20
05
Q1
20
06
Q2
20
06
ANZ ASB BNZ NBNZ WBC
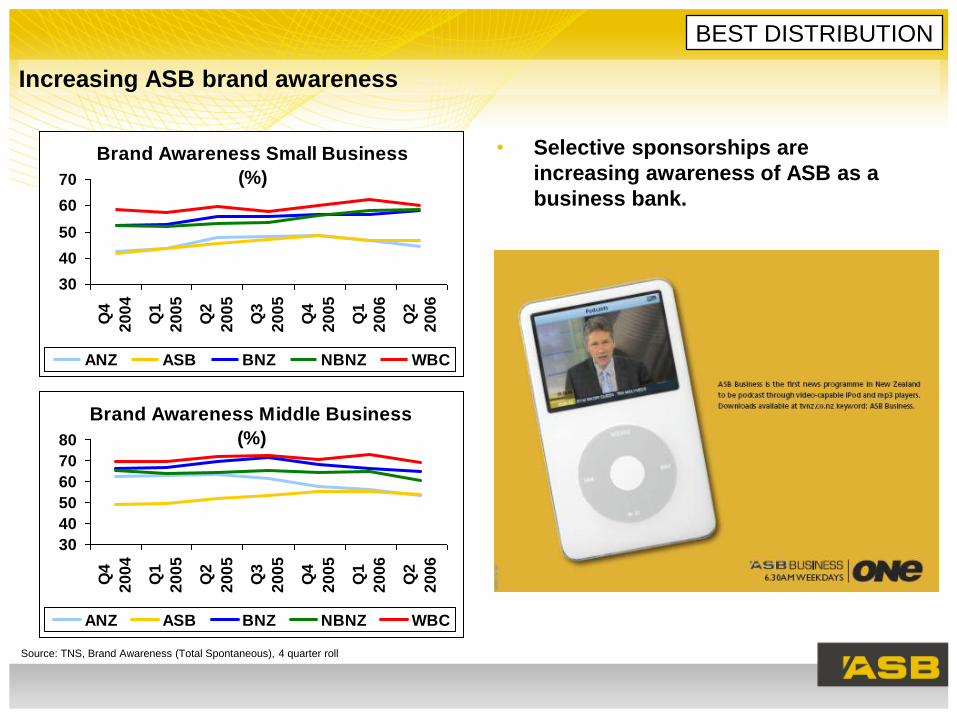
Increasing ASB brand awareness
• Selective sponsorships are
increasing awareness of ASB as a
business bank.
BEST DISTRIBUTION
Source: TNS, Brand Awareness (Total Spontaneous), 4 quarter roll
Brand Awareness Small Business
(%)
30
40
50
60
70
Q4
20
04
Q1
20
05
Q2
20
05
Q3
20
05
Q4
20
05
Q1
20
06
Q2
20
06
ANZ ASB BNZ NBNZ WBC
Brand Awareness Middle Business
(%)
30
40
50
60
70
80
Q4
20
04
Q1
20
05
Q2
20
05
Q3
20
05
Q4
20
05
Q1
20
06
Q2
20
06
ANZ ASB BNZ NBNZ WBC
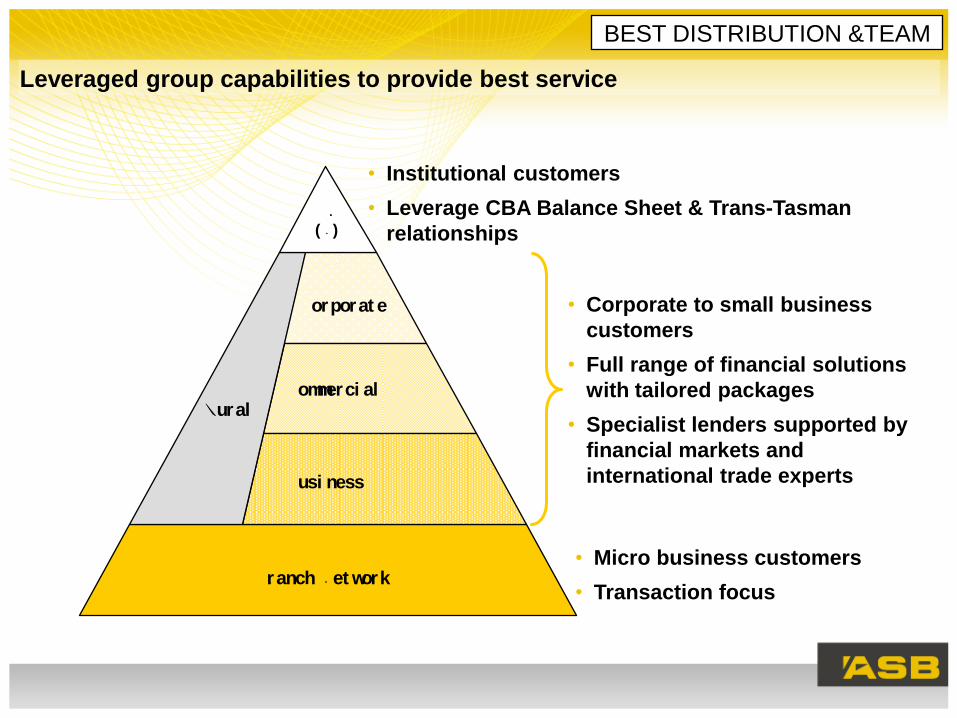
Leveraged group capabilities to provide best service
BEST DISTRIBUTION &TEAM
• Institutional customers
• Leverage CBA Balance Sheet & Trans-Tasman
relationships
• Micro business customers
• Transaction focus
• Corporate to small business
customers
• Full range of financial solutions
with tailored packages
• Specialist lenders supported by
financial markets and
international trade experts
CBA
(NZ)
Branch Net work
Corporat e
RuralCommerci al
Busi ness
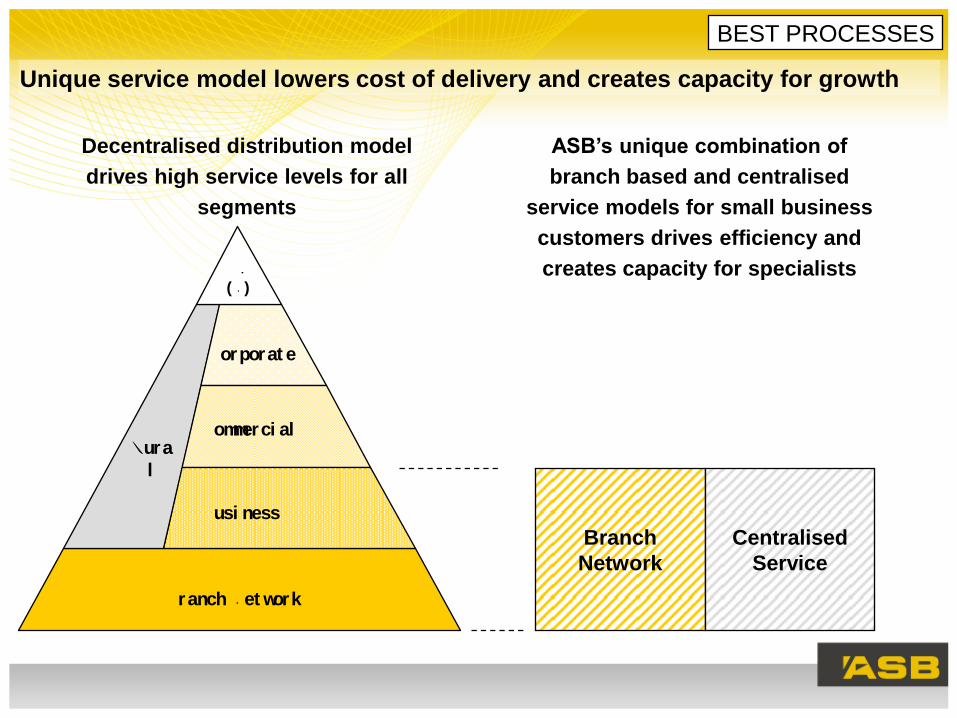
Unique service model lowers cost of delivery and creates capacity for growth
Decentralised distribution model
drives high service levels for all
segments
CBA
(NZ)
Branch Net work
Corporat e
Rura
l
Commerci al
Busi ness
ASB’s unique combination of
branch based and centralised
service models for small business
customers drives efficiency and
creates capacity for specialists
BEST PROCESSES
Branch
Network
Centralised
Service
BEST SERVICE
BEST PROCESSES
BEST TEAM
BEST DISTRIBUTION
QUALITY GROWTH
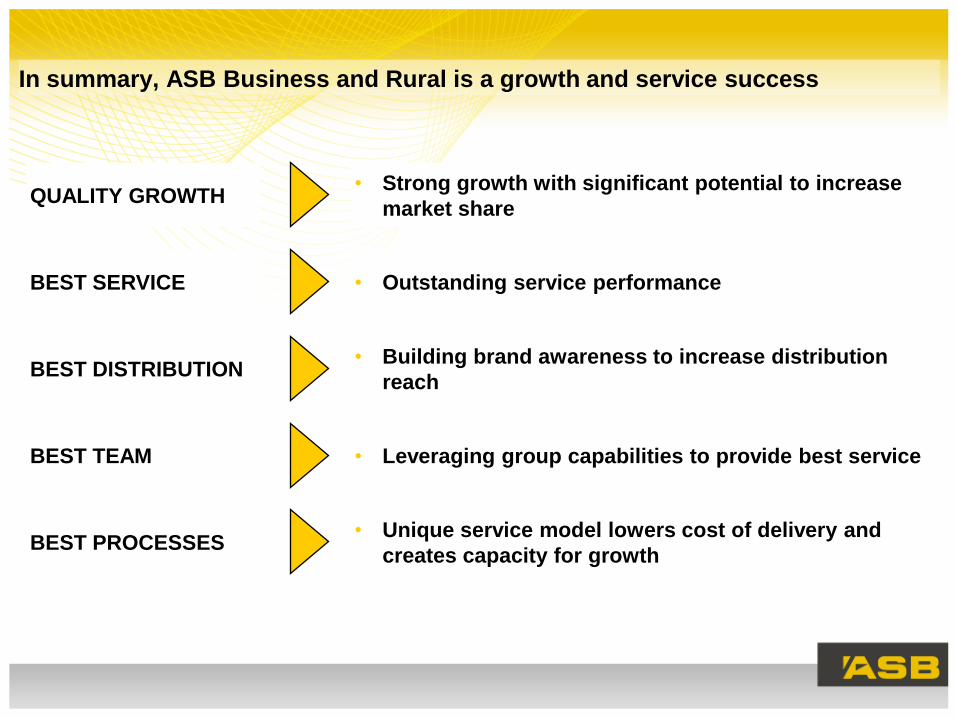
In summary, ASB Business and Rural is a growth and service success
• Outstanding service performance
• Unique service model lowers cost of delivery and
creates capacity for growth
• Leveraging group capabilities to provide best service
• Building brand awareness to increase distribution
reach
• Strong growth with significant potential to increase
market share
Agenda
• Team Introductions
• Introduction Hugh Burrett
• Financial Performance Stewart McRobie
• Retail Banking Ross McEwan
• Business & Rural Banking James Mitchell
• Q & A

ASB Update
Analyst Briefing
8th September 2006


![ASB The Changing Landscape - Chartered Institute of Housing Support/EM resources/ASB... · Recent ASB Case Law Wandsworth LBC v Maggott [2013] • ASB not found to be “in the locality”](https://img.pdfslide.us/doc/110x75/5c050c6d09d3f2133a8cde9d/asb-the-changing-landscape-chartered-institute-of-supportem-resourcesasb.jpg)