Embed Size (px)
Citation preview

ARKANSASSHORT-TERM INDUSTRY AND OCCUPATIONAL
PROJECTIONS2016-2018
Asa Hutchinson, GovernorState of Arkansas
Daryl Bassett, DirectorDepartment of Workforce Services

2
ARKANSAS SHORT-TERM INDUSTRY AND OCCUPATIONAL
PROJECTIONS2016-2018
Published By:
Department of Workforce ServicesLabor Market Information
Occupational Career Information“Equal Opportunity Employer/Program”
“Auxiliary aids and services are available upon request to individuals with disabilities.”
P.O. Box 2981Little Rock, AR 72203
Phone: (501) 682-3123Fax: (501) 682-3186
TTD/TTY Voice: 1-800-285-1121TDD: 1-800-285-1131
State of Arkansas Home Page: http://www.arkansas.govDepartment of Workforce Services Home Page: http://dws.arkansas.govLabor Market Information Web Portal: http://www.discover.arkansas.gov
We would like to give special thanks to the following people who helped with the projections process:Kurt Naumann, Arkansas Economic Development Commission
John Shelnutt, Department of Finance and Administration
Definition of Important TermsBase Employment – The average number of jobs in a particular industry or occupation during the benchmark year or quarter.Content Skills - Learned capabilities that allow workers to master and perform the specific activities of their jobs.Current Employment Statistics (CES) – A monthly survey of business establishments that provides estimates of employment, hours, and earnings data by industry for the nation as a whole, all states, and most major metropolitan areas.Employment – The number of jobs in a business or firm at any given time.Establishment – The physical location of a certain economic activity, for example, a factory, mine, store, or office. Generally, a single establishment produces a single good or provides a single service.Fastest Growing/Declining – Refers to percent growth. The higher the percent growth, the faster an industry or occupation is growing. For declining industries or occupations, the lower the percent growth, the faster it is declining.Industry – A group of establishments that produce similar products or provide similar services.Knowledge Domain – Learned sets of facts and standards required by many work situations.Metropolitan Statistical Area – A county or group of contiguous counties that contains an urban center of at least 50,000 residents and has a high degree of economic and social ties.Net Change – The difference between projected employment and base employment.North American Industry Classification System (NAICS) – A system used in assigning industry-designated code numbers to employers and/or establishments based on the nature of their activities, services rendered or products delivered; established by the U.S. Office of Management and Budget and used by all agencies for data compilation.Occupation – A set of activities that employees are paid to perform; employees who perform the same tasks are in the same occupation, whether or not they are in the same industry.Occupational Employment Statistics (OES) – A federal/state cooperative program that produces employment and wage estimates for over 700 occupations. These are estimates of the number of people employed in certain occupations and estimates of the wages paid to them. They are also used to gather occupational staffing patterns by industry that are used to project employment needs by occupation.Percent (%) Change – The rate at which an industry or occupation is expected to grow or decline.Projected Employment – The average number of jobs expected to be in an industry or occupation in the future.Quarterly Census of Employment and Wages (QCEW) – A federal/state cooperative program that produces employment and wage data for workers covered by State unemployment insurance laws and Federal workers covered by the Unemployment Compensation for Federal Employees Program; data is arranged by the type of industry according to the North American Industry Classification System (NAICS).Sector – A level of industry classification under supersector according to the NAICS structure.Standard Occupational Classification (SOC) – A coding system used by all federal statistical agencies to classify workers into occupational categories for the purpose of collecting, calculating, or disseminating data.Subsector – A level of industry classification under sector according to the NAICS structure.Supersector – The top level of industry classification according to the NAICS structure.
3
4
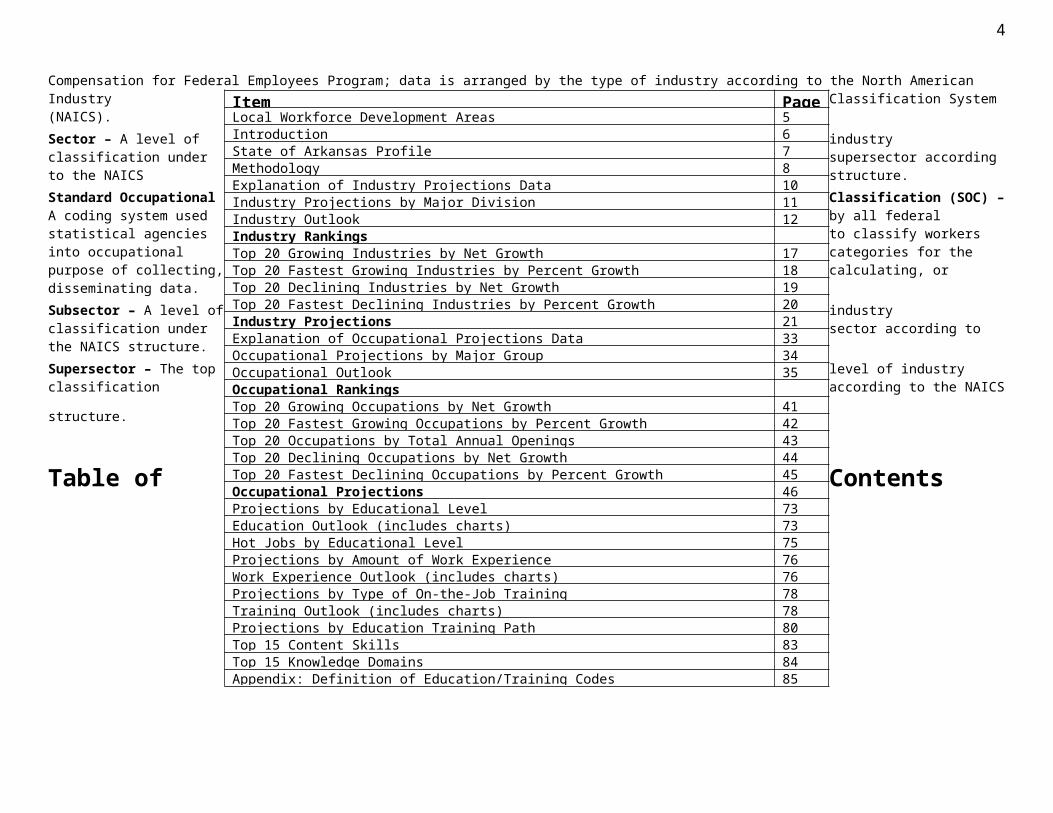
Table of ContentsItem PageLocal Workforce Development Areas 5Introduction 6State of Arkansas Profile 7Methodology 8Explanation of Industry Projections Data 10Industry Projections by Major Division 11Industry Outlook 12Industry RankingsTop 20 Growing Industries by Net Growth 17Top 20 Fastest Growing Industries by Percent Growth 18Top 20 Declining Industries by Net Growth 19Top 20 Fastest Declining Industries by Percent Growth 20Industry Projections 21Explanation of Occupational Projections Data 33Occupational Projections by Major Group 34Occupational Outlook 35Occupational RankingsTop 20 Growing Occupations by Net Growth 41Top 20 Fastest Growing Occupations by Percent Growth 42Top 20 Occupations by Total Annual Openings 43Top 20 Declining Occupations by Net Growth 44Top 20 Fastest Declining Occupations by Percent Growth 45Occupational Projections 46Projections by Educational Level 73Education Outlook (includes charts) 73Hot Jobs by Educational Level 75Projections by Amount of Work Experience 76Work Experience Outlook (includes charts) 76Projections by Type of On-the-Job Training 78Training Outlook (includes charts) 78Projections by Education Training Path 80Top 15 Content Skills 83Top 15 Knowledge Domains 84Appendix: Definition of Education/Training Codes 85

5
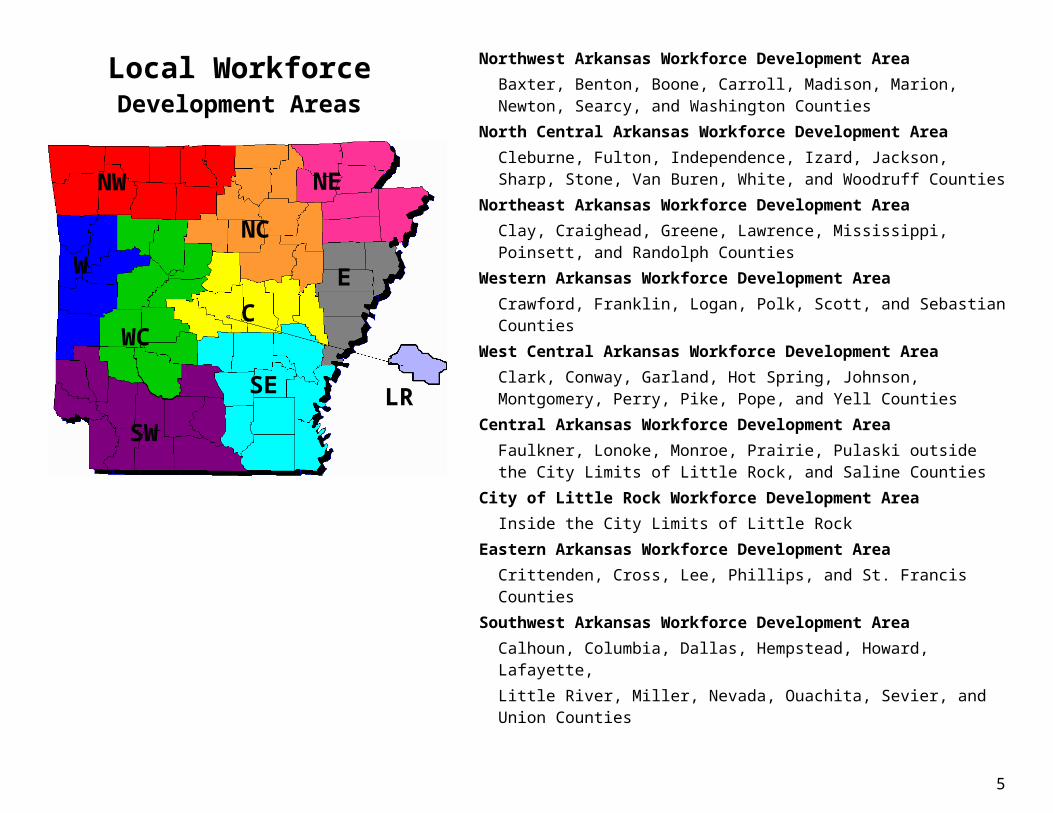
Local WorkforceDevelopment Areas
Northwest Arkansas Workforce Development AreaBaxter, Benton, Boone, Carroll, Madison, Marion, Newton, Searcy, and Washington Counties
North Central Arkansas Workforce Development AreaCleburne, Fulton, Independence, Izard, Jackson, Sharp, Stone, Van Buren, White, and Woodruff Counties
Northeast Arkansas Workforce Development Area Clay, Craighead, Greene, Lawrence, Mississippi, Poinsett, and Randolph Counties
Western Arkansas Workforce Development AreaCrawford, Franklin, Logan, Polk, Scott, and Sebastian Counties
West Central Arkansas Workforce Development AreaClark, Conway, Garland, Hot Spring, Johnson, Montgomery, Perry, Pike, Pope, and Yell Counties
Central Arkansas Workforce Development AreaFaulkner, Lonoke, Monroe, Prairie, Pulaski outside the City Limits of Little Rock, and Saline Counties
City of Little Rock Workforce Development AreaInside the City Limits of Little Rock
Eastern Arkansas Workforce Development AreaCrittenden, Cross, Lee, Phillips, and St. Francis Counties
Southwest Arkansas Workforce Development AreaCalhoun, Columbia, Dallas, Hempstead, Howard, Lafayette, Little River, Miller, Nevada, Ouachita, Sevier, and Union Counties
Southeast Arkansas Workforce Development AreaArkansas, Ashley, Bradley, Chicot, Cleveland, Desha, Drew, Grant, Jefferson, and Lincoln Counties
NW
WNC
NE
WC
SW
SE
CE
LR
5

6
IntroductionThe Arkansas Short-Term Industry and Occupational Projections publication includes an overview of where the Arkansas labor market may be heading in the near future. It contains information on the growth and decline of industries and occupations.
Industries in this publication are classified by North American Industry Classification System (NAICS) codes. NAICS was created to bring consistency and comparability to the classifying of industries and businesses across the United States, Canada, and Mexico.
This publication is divided into two main parts. The first part of the publication involves the industry projections. Several tables and graphs are used to show what is happening at the industry level in Arkansas. A written narrative highlights projections at the division level as well as key industries within that division.
The second part of this publication involves occupational projections. Several tables and graphs are used to show what is happening at the occupational level in Arkansas. A written narrative highlights projections at the division level as well as key occupations within that division. Occupations are classified by Standard Occupational Classification (SOC) codes.
Information about annual job openings is included in this publication. Job openings are classified as one of two types: replacement or growth. The more replacement openings a specific occupation has, the higher the turnover for that occupation. It is important to look at both growth annual openings and replacement annual openings when determining whether a particular occupation is right for you.
For each occupation, an education/training level is provided. Educational requirements are determined by the Bureau of Labor Statistics and recognize the educational attainment of most people in a particular occupation. Each occupation will have three categories: education, work experience, and training. Some businesses, however, may require a higher level of training. Some occupations may also have different grades or levels that require different levels of training. These various levels of training will not be reflected in this publication.
The need for workers to have certain skills has become increasingly important in the labor market. A part of the publication presents the top skills that are in demand for new jobs and for jobs being replaced. Top knowledge domains are also presented.

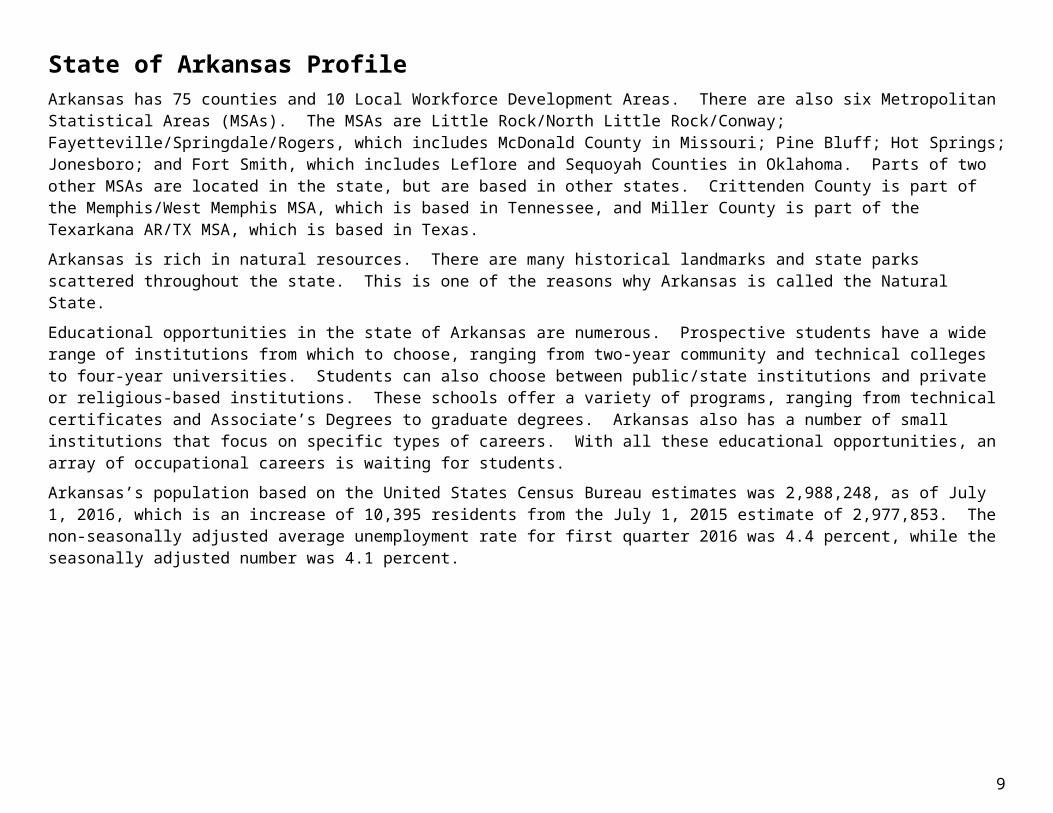
State of Arkansas ProfileArkansas has 75 counties and 10 Local Workforce Development Areas. There are also six Metropolitan Statistical Areas (MSAs). The MSAs are Little Rock/North Little Rock/Conway; Fayetteville/Springdale/Rogers, which includes McDonald County in Missouri; Pine Bluff; Hot Springs; Jonesboro; and Fort Smith, which includes Leflore and Sequoyah Counties in Oklahoma. Parts of two other MSAs are located in the state, but are based in other states. Crittenden County is part of the Memphis/West Memphis MSA, which is based in Tennessee, and Miller County is part of the Texarkana AR/TX MSA, which is based in Texas.
Arkansas is rich in natural resources. There are many historical landmarks and state parks scattered throughout the state. This is one of the reasons why Arkansas is called the Natural State.
Educational opportunities in the state of Arkansas are numerous. Prospective students have a wide range of institutions from which to choose, ranging from two-year community and technical colleges to four-year universities. Students can also choose between public/state institutions and private or religious-based institutions. These schools offer a variety of programs, ranging from technical certificates and Associate’s Degrees to graduate degrees. Arkansas also has a number of small institutions that focus on specific types of careers. With all these educational opportunities, an array of occupational careers is waiting for students.
Arkansas’s population based on the United States Census Bureau estimates was 2,988,248, as of July 1, 2016, which is an increase of 10,395 residents from the July 1, 2015 estimate of 2,977,853. The non-seasonally adjusted average unemployment rate for first quarter 2016 was 4.4 percent, while the seasonally adjusted number was 4.1 percent.
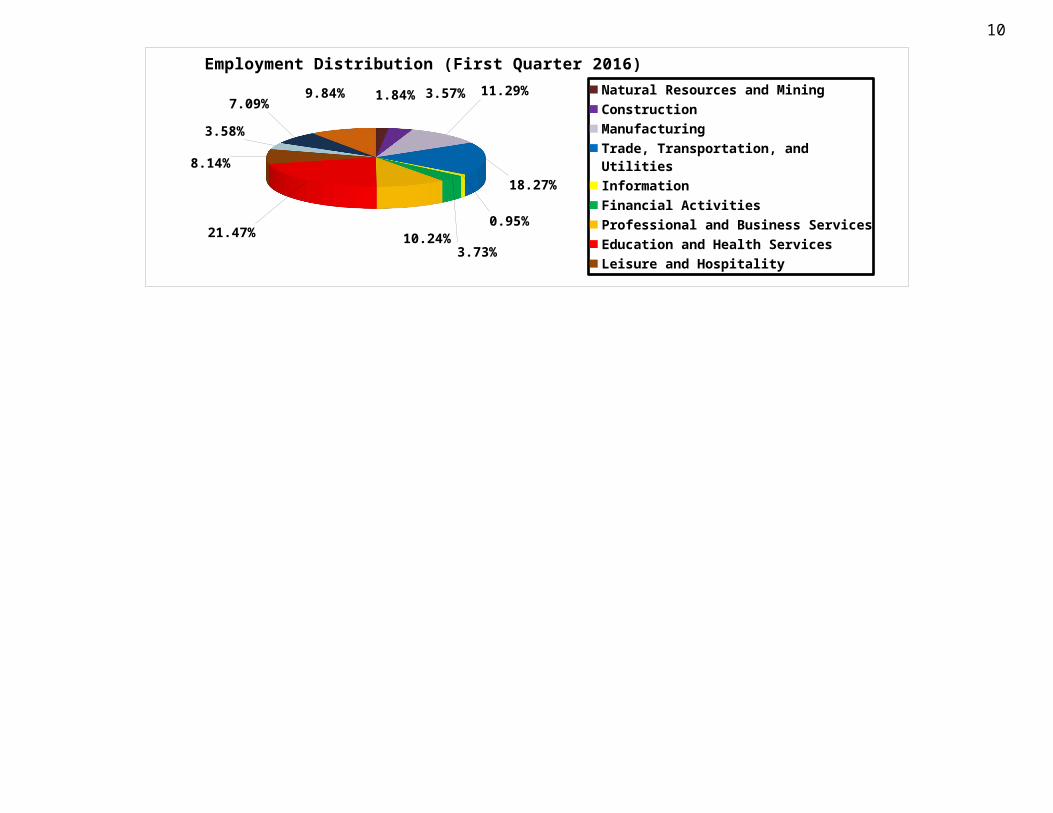
1.84% 3.57% 11.29%
18.27%
0.95%
3.73%10.24%21.47%
8.14%
3.58%
7.09%9.84%
Employment Distribution (First Quarter 2016)
Natural Resources and MiningConstructionManufacturingTrade, Transportation, and UtilitiesInformationFinancial ActivitiesProfessional and Business ServicesEducation and Health ServicesLeisure and HospitalityOther ServicesGovernmentSelf-Employed and Unpaid Family Workers
7

8
MethodologyThe following is a brief overview of the methods used to produce short-term employment projections in Arkansas.
Data DevelopmentData development is accomplished by using the following sources:
The Quarterly Census of Employment and Wages (QCEW) program. This source provides all the covered employment for Arkansas. A firm or business is considered covered if it meets the guidelines established under the Unemployment Insurance Law.
The Current Employment Statistics (CES) Survey. This source provides employment information for non-covered establishments, which are railroads, the Federal Work Study Program, churches, religious-based schools, elected officials, commissioned insurance agents, as well as other establishments not reporting to the Quarterly Census of Employment and Wages (QCEW) program.
Agriculture employment. This is obtained from the Census of Agriculture. The Census of Agriculture is taken every five years in years ending in two and seven. Information from the QCEW reports is used to make estimates for years following the Census year until the next Census. Other information from the Bureau of Economic Analysis (BEA) is used to supplement agriculture employment.
Other Non-Covered Employment. Data on other Agriculture employment, specifically NAICS 113, 114, and 115 as well as Private Households are supplemented using data from the Bureau of Economic Analysis.
Industry Projections A monthly time series is developed at the three- and four-digit NAICS level from the three sources listed above with a time period of January 1990 to March of the base year 2016. The industry projections in this publication were produced using the Projections Suite software, authorized by the U.S. Department of Labor and developed by the Utah Department of Workforce Services. The software has several components to deal with industry projections. First, it allows the analyst to choose from a list of national and state variables to determine a state leading index, which is a list of variables that when factored together, helps predict changes in the state employment figures. National economic variables are also provided. State variables are labor force data, such as civilian labor force and unemployment rate, major industry division (CES) totals, nonfarm employment, building permits, manufacturing hours, natural gas prices, air passenger data, and a composite index.
The software uses a series of statistical models to forecast employment through eight quarters. Using trend and seasonal factors, as well as business cycle patterns, a forecast is chosen based on established statistical methodology. Projections are adjusted to reflect current or near future events in the labor market such as closures, layoffs, openings, and expansions.
Occupational ProjectionsOccupational projections are produced by merging industries and occupations together into an industry-occupational matrix. This matrix is a table showing the occupational pattern of each industry (i.e., the ratios of employment by occupation in a specific industry). The statewide matrix is based
on the Bureau of Labor Statistics’ Occupational Employment Statistics (OES) survey and uses a Standard Occupational Classification (SOC) code for each occupation. It uses the May 2015 OES semiannual survey to establish state staffing patterns and is provided through the Local Employment and Wage Information System (LEWIS). National staffing patterns are used where state patterns do not exist.
The occupational employment projections contained in this publication were created using the Projections Suite software, authorized by the U.S. Department of Labor and developed by the Utah Department of Workforce Services. The software applies occupational change factors to the projected patterns to form a projected matrix. Also, using national self-employment staffing patterns, the system generates base and projected employment for self-employed workers. Patterns and projections for Unpaid Family Workers are based on Census numbers.
Data LimitationsThe projections contained in this publication are estimates based on historical data. It is important not to rely on these projections as the actual employment numbers that will occur in 2018. While every attempt is made to incorporate current and near future events, such as business closings, corporate layoffs, openings, and expansions, it’s not possible to know everything that might happen. Events that may take place after the projection period or announcements concerning closings, layoffs, openings, and expansions known after projections were completed are not reflected in the forecasts. Also, legislative policy could cause employment to change. Events such as these will likely cause the actual employment numbers to vary significantly from these projections.
It is important to look at both net growth and percent growth when looking at projections. Generally, industries or occupations with small employment will have higher growth rates than those with larger employment, but these industries may only add a few employees over the projection period. When examining occupational projections, it is important to look at both replacement and growth openings. Even if an occupation is in decline, it still may have openings to replace workers who leave the profession for various reasons.
9
10
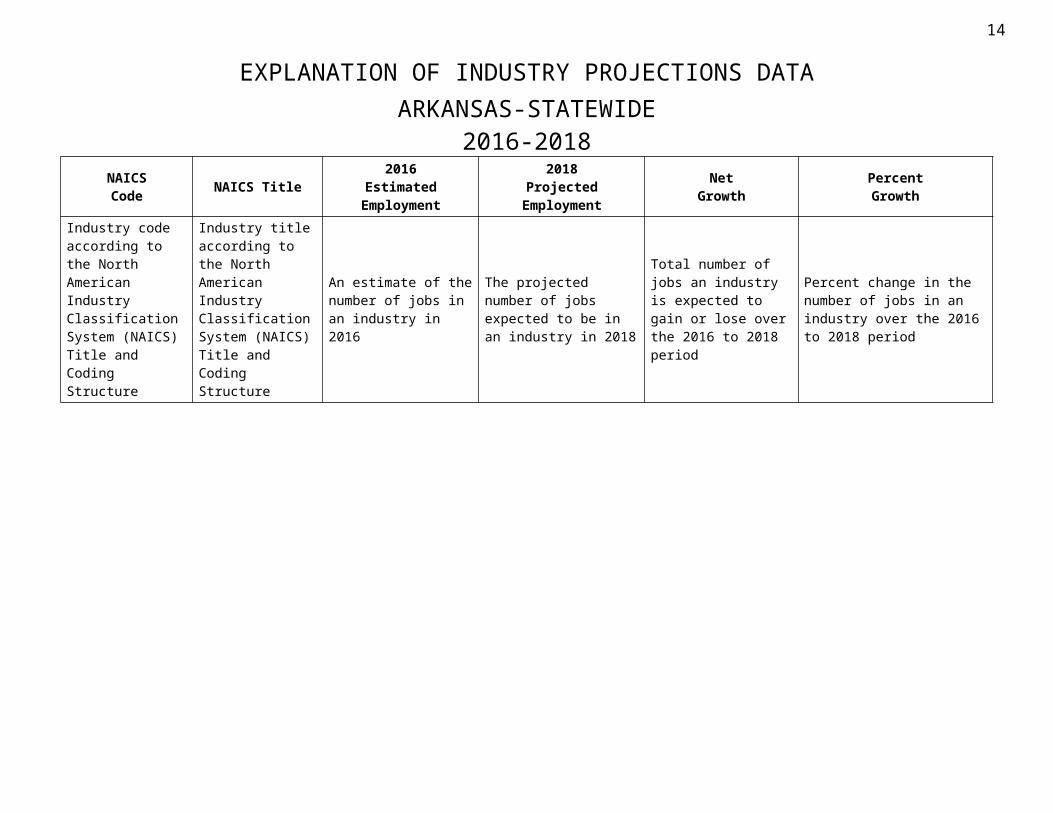
EXPLANATION OF INDUSTRY PROJECTIONS DATAARKANSAS-STATEWIDE
2016-2018NAICSCode NAICS Title
2016Estimated
Employment
2018Projected
EmploymentNet
GrowthPercentGrowth
Industry code according to the North American Industry Classification System (NAICS) Title and Coding Structure
Industry title according to the North American Industry Classification System (NAICS) Title and Coding Structure
An estimate of the number of jobs in an industry in 2016
The projected number of jobs expected to be in an industry in 2018
Total number of jobs an industry is expected to gain or lose over the 2016 to 2018 period
Percent change in the number of jobs in an industry over the 2016 to 2018 period

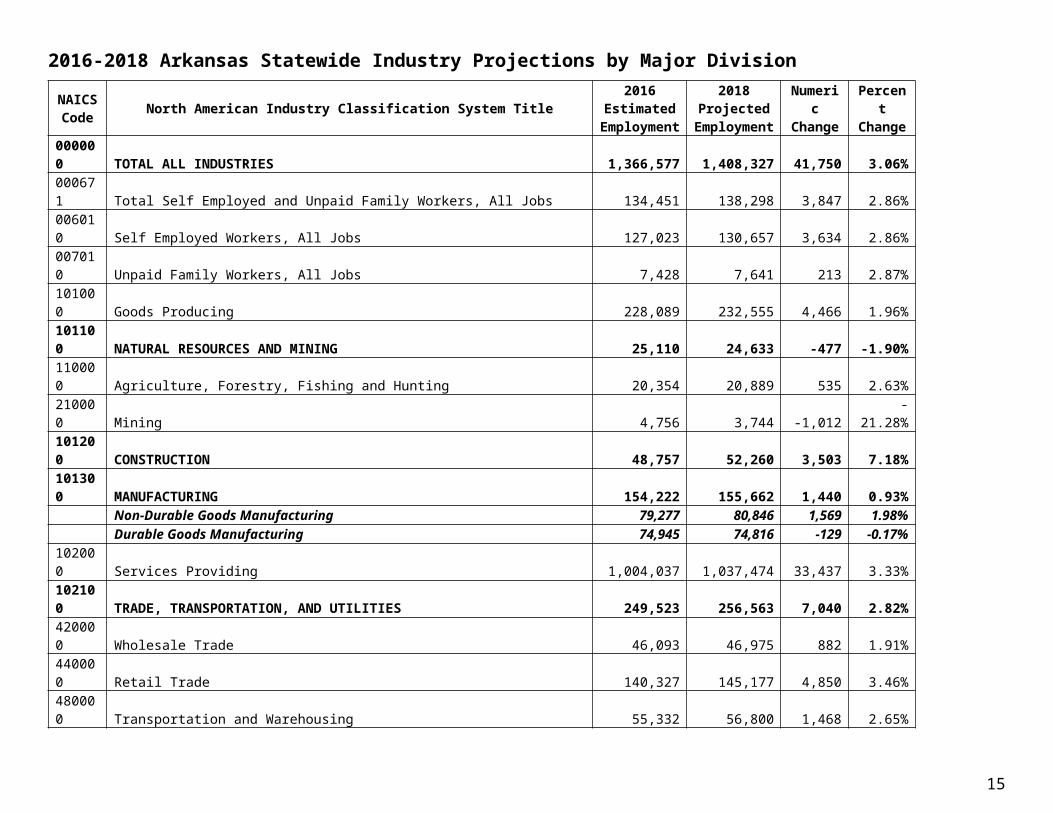
2016-2018 Arkansas Statewide Industry Projections by Major DivisionNAICSCode North American Industry Classification System Title
2016Estimated
Employment
2018Projected
EmploymentNumericChange
PercentChange
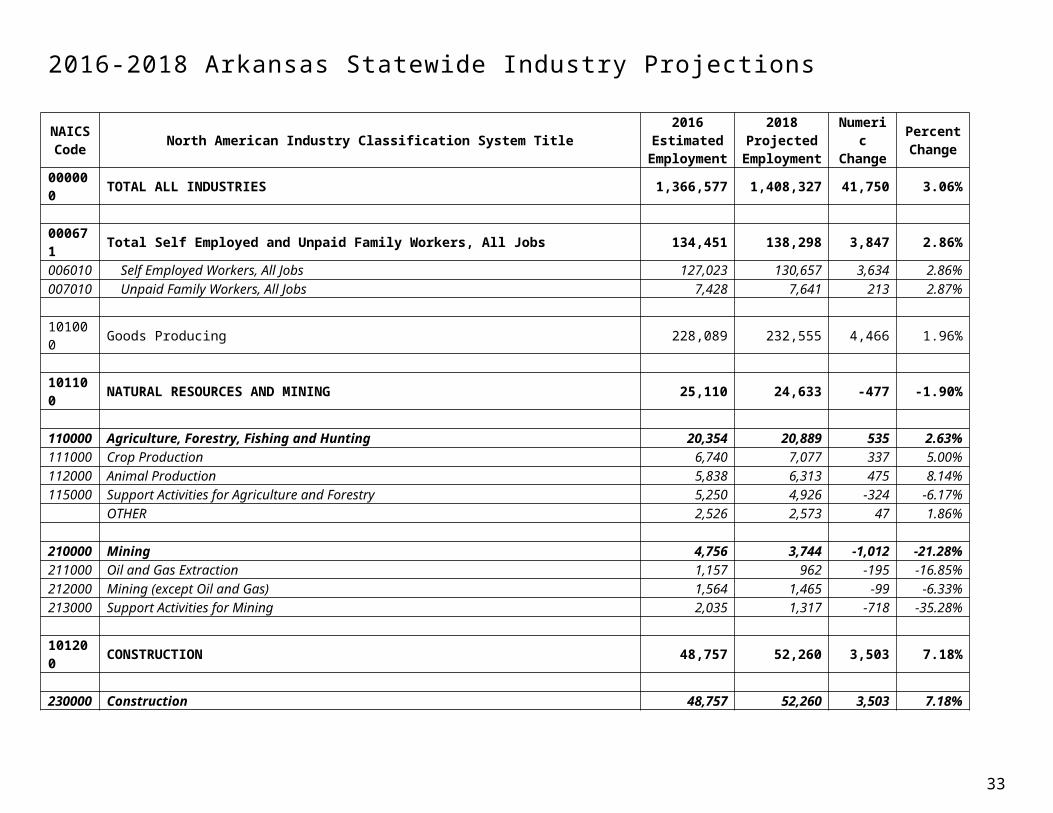
000000 TOTAL ALL INDUSTRIES 1,366,577 1,408,327 41,750 3.06%000671 Total Self Employed and Unpaid Family Workers, All Jobs 134,451 138,298 3,847 2.86%006010 Self Employed Workers, All Jobs 127,023 130,657 3,634 2.86%007010 Unpaid Family Workers, All Jobs 7,428 7,641 213 2.87%101000 Goods Producing 228,089 232,555 4,466 1.96%101100 NATURAL RESOURCES AND MINING 25,110 24,633 -477 -1.90%110000 Agriculture, Forestry, Fishing and Hunting 20,354 20,889 535 2.63%210000 Mining 4,756 3,744 -1,012 -21.28%101200 CONSTRUCTION 48,757 52,260 3,503 7.18%101300 MANUFACTURING 154,222 155,662 1,440 0.93%
Non-Durable Goods Manufacturing 79,277 80,846 1,569 1.98%Durable Goods Manufacturing 74,945 74,816 -129 -0.17%
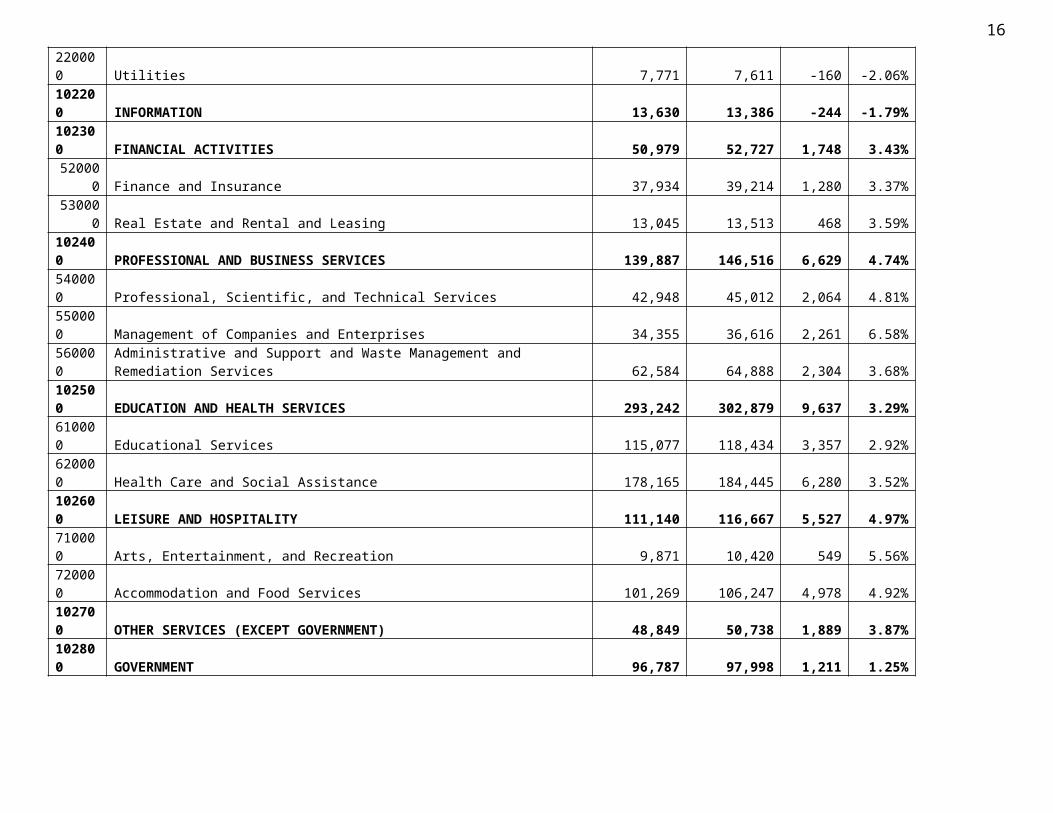
102000 Services Providing 1,004,037 1,037,474 33,437 3.33%102100 TRADE, TRANSPORTATION, AND UTILITIES 249,523 256,563 7,040 2.82%420000 Wholesale Trade 46,093 46,975 882 1.91%440000 Retail Trade 140,327 145,177 4,850 3.46%480000 Transportation and Warehousing 55,332 56,800 1,468 2.65%220000 Utilities 7,771 7,611 -160 -2.06%102200 INFORMATION 13,630 13,386 -244 -1.79%102300 FINANCIAL ACTIVITIES 50,979 52,727 1,748 3.43%520000 Finance and Insurance 37,934 39,214 1,280 3.37%530000 Real Estate and Rental and Leasing 13,045 13,513 468 3.59%102400 PROFESSIONAL AND BUSINESS SERVICES 139,887 146,516 6,629 4.74%540000 Professional, Scientific, and Technical Services 42,948 45,012 2,064 4.81%550000 Management of Companies and Enterprises 34,355 36,616 2,261 6.58%560000 Administrative and Support and Waste Management and Remediation Services 62,584 64,888 2,304 3.68%102500 EDUCATION AND HEALTH SERVICES 293,242 302,879 9,637 3.29%610000 Educational Services 115,077 118,434 3,357 2.92%620000 Health Care and Social Assistance 178,165 184,445 6,280 3.52%102600 LEISURE AND HOSPITALITY 111,140 116,667 5,527 4.97%710000 Arts, Entertainment, and Recreation 9,871 10,420 549 5.56%720000 Accommodation and Food Services 101,269 106,247 4,978 4.92%102700 OTHER SERVICES (EXCEPT GOVERNMENT) 48,849 50,738 1,889 3.87%102800 GOVERNMENT 96,787 97,998 1,211 1.25%
Industry Outlook
11

12
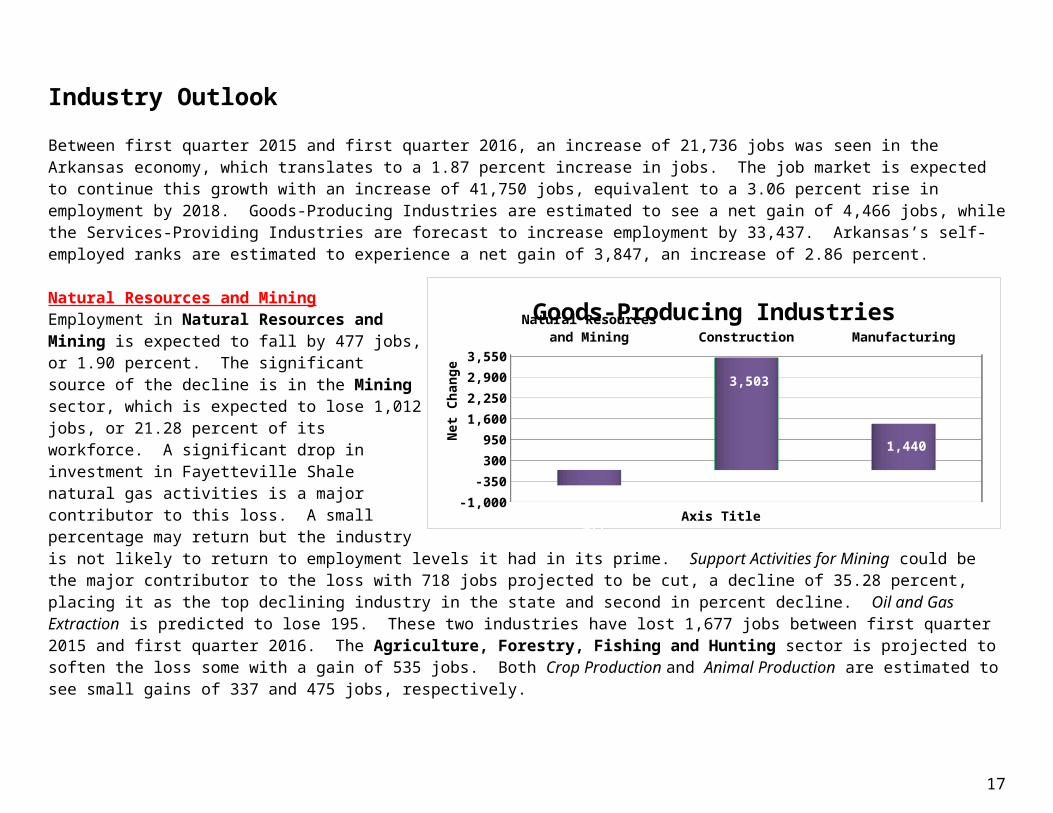
Between first quarter 2015 and first quarter 2016, an increase of 21,736 jobs was seen in the Arkansas economy, which translates to a 1.87 percent increase in jobs. The job market is expected to continue this growth with an increase of 41,750 jobs, equivalent to a 3.06 percent rise in employment by 2018. Goods-Producing Industries are estimated to see a net gain of 4,466 jobs, while the Services-Providing Industries are forecast to increase employment by 33,437. Arkansas’s self-employed ranks are estimated to experience a net gain of 3,847, an increase of 2.86 percent.
Natural Resources and MiningEmployment in Natural Resources and Mining is expected to fall by 477 jobs, or 1.90 percent. The significant source of the decline is in the Mining sector, which is expected to lose 1,012 jobs, or 21.28 percent of its workforce. A significant drop in investment in Fayetteville Shale natural gas activities is a major contributor to this loss. A small percentage may return but the industry is not likely to return to employment levels it had in its prime. Support Activities for Mining could be the major contributor to the loss with 718 jobs projected to be cut, a decline of 35.28 percent, placing it as the top declining industry in the state and second in percent decline. Oil and Gas Extraction is predicted to lose 195. These two industries have lost 1,677 jobs between first quarter 2015 and first quarter 2016. The Agriculture, Forestry, Fishing and Hunting sector is projected to soften the loss some with a gain of 535 jobs. Both Crop Production and Animal Production are estimated to see small gains of 337 and 475 jobs, respectively.
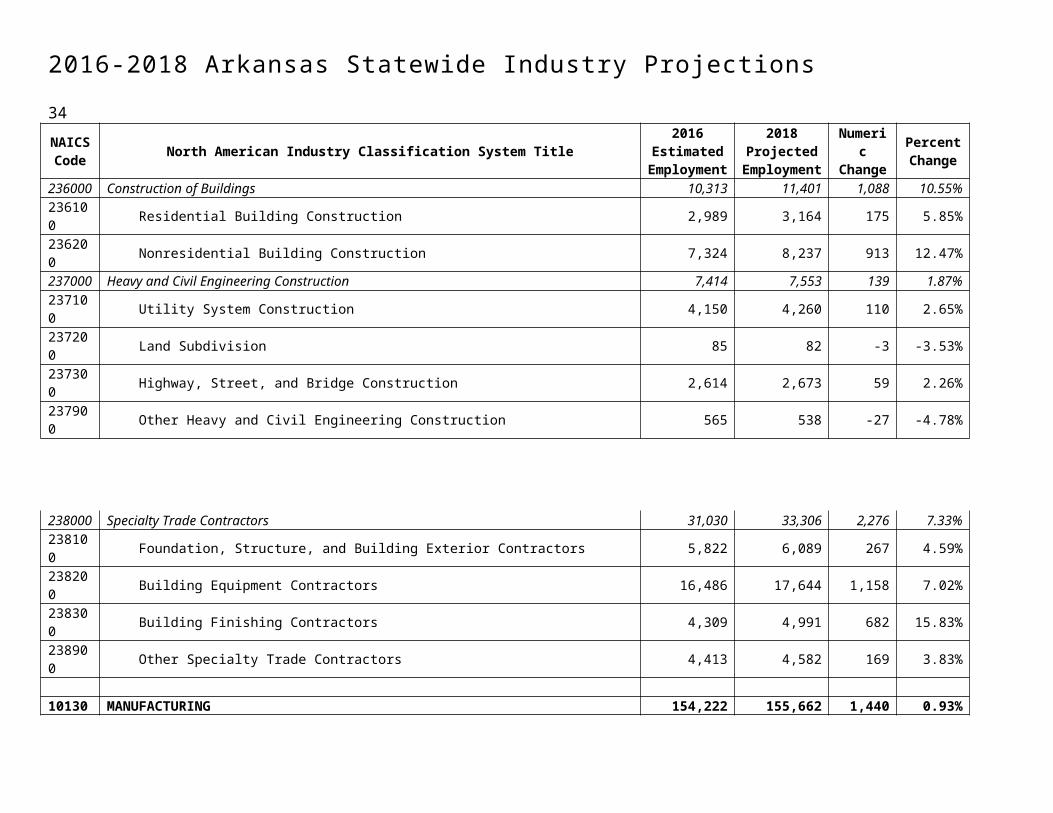
ConstructionConstruction is expected to grow by 3,503 jobs between 2016 and 2018. Its projected growth of 7.18 percent is highest in the state among the supersectors. The Specialty Trade Contractors subsector is estimated to gain 2,276 jobs during the projection period, almost 65 percent of the total growth in Construction. Building Equipment Contractors could account for 1,158 of those jobs, placing eighth in the Top 20 Growing Industries list. Building Finishing Contractors is placing sixth on the Top 20 Fastest Growing Industries list with a 15.83 percent gain. The Construction of Buildings subsector is predicted to gain 1,088 jobs, while Heavy and Civil Engineering Construction could add a modest 139 jobs. Other Heavy and Civil Engineering Construction could see a decline of 27 jobs, or 4.78 percent of its workforce.
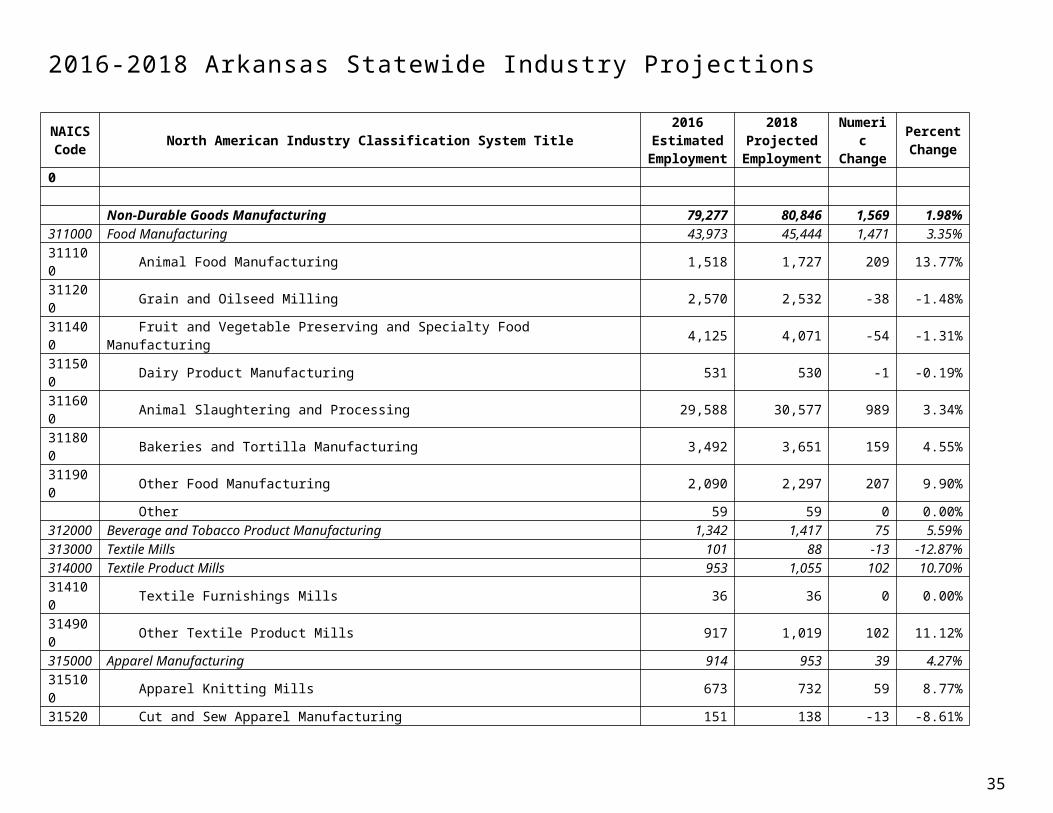
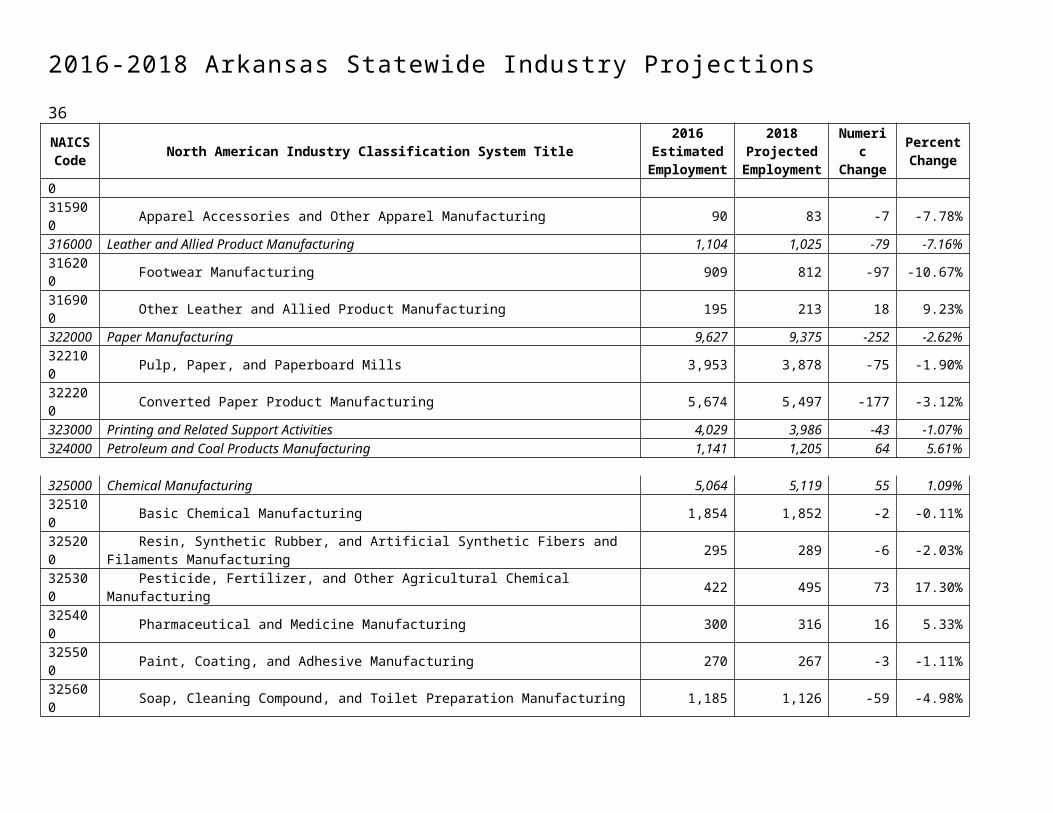
Non-Durable Goods ManufacturingNon-Durable Goods Manufacturing is projected to experience a net gain of 1,569 jobs. Food Manufacturing is estimated to have the brightest outlook among the subsectors with a gain of 1,471 jobs, more than 93 percent of the overall growth in Non-Durable Goods Manufacturing. Animal Slaughtering and Processing could see strong growth during the projection period with an anticipated increase of 989, placing it among the Top 10 on the Top 20 Growing Industries by Net Growth list. Animal Food Manufacturing is predicted to gain 13.77 percent placing the industry among the Top 10 on the Top 20 Fastest Growing Industries by Percent Growth list for the state. The Plastics and Rubber Products Manufacturing subsector is estimated to add 150 jobs to its workforce. Not all areas in Non-Durable Goods Manufacturing are seeing a favorable outlook. Paper
Natural Resources and Min-ing Construction Manufacturing
-1,000-350300950
1,6002,2502,9003,550
-477
3,503
1,440
Goods-Producing Industries
Axis Title
Net
Cha
nge

Manufacturing is estimated to lose 252 jobs, or about 2.62 percent of its workforce. Converted Paper Product Manufacturing is likely to lose the most with 177 jobs projected to be lost. Textile Mills could lose 12.87 percent of its workforce between 2016 and 2018. Durable Goods Manufacturing Durable Goods Manufacturing is forecast to see a mixed outlook between 2016 and 2018 with a net loss of 129 jobs. The brightest outlook could come in Transportation Equipment Manufacturing with a gain of 415 jobs, an increase of 3.07 percent. The top 3 fastest growing industries in the state are in Durable Goods Manufacturing with Forging and Stamping leading with an anticipated increase of 32.11 percent. Iron and Steel Mills and Ferroalloy Manufacturing places third in the Top 20 Fastest Growing Industries list with a 21.13 percent increase in jobs and also makes the Top 20 Growing Industries list. On the negative side of the economy, Furniture and Related Product Manufacturing could lose 381 jobs, or 11.08 percent of its workforce. Household and Institutional Furniture & Kitchen Cabinet Manufacturing drives this decline with a loss of 246, but Ventilation, Heating, Air-Conditioning, and Commercial Refrigeration Equipment Manufacturing could lose the most among Durable Goods industries declining by 307 jobs, or more than 10 percent of its workforce. Cutlery and Handtool Manufacturing is estimated to lose 44.11 percent of its workforce between 2016 and 2018, making it the fastest declining industry in the state. In all, 10 industries in Durable Goods Manufacturing make the Top 20 Fastest Declining Industries list. Also, Computer and Electronic Product Manufacturing is predicted to lose 333 jobs, or 14.48 percent of its workforce.
Wholesale TradeThe Wholesale Trade sector is projected to have a net gain of 882 jobs, a 1.91 percent increase. Merchant Wholesalers, Durable Goods is forecast to increase by 514 jobs, while Merchant Wholesalers, Nondurable Goods is estimated to experience a growth of 19. Wholesale Electronic Markets and Agents and Brokers is predicted to add 349 jobs to the Arkansas labor market. Motor Vehicle and Motor Vehicle Parts and Supplies Merchant Wholesalers leads all industries in Wholesale Trade with an expected gain of 239 jobs. On the negative side of the economy, Miscellaneous Nondurable Goods Merchant Wholesalers is expected to lose 119 jobs, or 3.41 percent of its workforce.
Retail TradeRetail Trade is projected to add 4,850 new jobs to the Arkansas labor market, about 69 percent of the job growth in Trade, Transportation, and Utilities. General Merchandise Stores is projected to add the most jobs with 1,083 new jobs anticipated. Furniture and Home Furnishings Stores could increase employment by 7.68 percent between 2016 and 2018. Other Motor Vehicle Dealers is projected to be the fastest growing among Retail Trade industries increasing by 14.20 percent. Most of the Retail Trade industries are expecting growth, however, Nonstore Retailers is anticipated to lose 19, or just under 1.00 percent of its workforce, and Electronics and Appliance Stores could see a slight net loss due to recent closures.
Non-Durable Goods Durable Goods
-200
100
400
700
1,000
1,300
1,6001,569
-129
Manufacturing
Axis Title
Net
Cha
nge
13
14
Transportation and Warehousing The Transportation and Warehousing sector is predicted to have a net gain of 1,468 jobs over the projection period. Warehousing and Storage could see the most jobs with 872 new jobs, an increase of 10.77 percent. Truck Transportation is projected to add an additional 303 new jobs to the labor market. Driving this growth is General Freight Trucking with a gain of 481. Nonscheduled Air Transportation is projected to be the fourth fastest growing industry increasing jobs by 20.48 percent. On the negative side of the economy, Specialized Freight Trucking could lose 178 jobs. Support Activities for Air Transportation is slated to lose 12.71 percent of its workforce.
Utilities The Utilities sector could see a drop in employment by March 2018 with a loss of 160 jobs, or 2.06 percent of its workforce. Electric Power Generation, Transmission and Distribution is estimated to take the brunt of the loss with a decline of 102 jobs, while Water, Sewage and Other Systems could add 10 new jobs to its workforce.
InformationInformation is expected to continue to struggle with an anticipated loss of 244 jobs by the first quarter of 2018. Publishing Industries (except Internet) is expected to have a net loss of 259. Newspaper, Periodical, Book, and Directory Publishers is expected to lose 290 jobs, or 9.08 percent of its workforce. The Telecommunications subsector is expected to lose 79 jobs. The bright spot in this supersector comes in Data Processing, Hosting and Related Services with a gain of 64 new jobs, a 4.87 percent increase in jobs.
Finance and InsuranceThe Finance and Insurance sector is predicted to experience a net gain of 1,280 jobs between 2016 and 2018, a 3.37 percent rise in employment. Insurance Carriers and Related Activities could see
-400
0
400
800
1,200
1,600
2,000
-244
1,7481,889
1,211
Services-Providing Industries-Chart 2
Net
Cha
nge
0
1,500
3,000
4,500
6,000
7,500
9,000
7,0406,629
9,637
5,527
Services-Providing Industries-Chart 1
Net
Cha
nge
a rise in employment over the 2016-2018 period with 703 new jobs. Increasing requirements under the Affordable Care Act may play a role in this increase. Insurance Carriers are likely to drive this growth adding 494 jobs, or 6.62 percent increase. Credit Intermediation and Related Activities could see a turnaround with a net gain of 565 new jobs. Contributing to this growth is Depository Credit Intermediation, which is predicted to add 402 jobs to its workforce.
Real Estate and Rental and Leasing The Real Estate and Rental and Leasing sector is expected to see a net gain of 468 jobs during the projection period. The Real Estate subsector is predicted to dominate the growth in the sector adding 370 new jobs to its workforce, while the Rental and Leasing Services subsector is predicted to gain 107 jobs. Activities Related to Real Estate is estimated to be the top growing industry in the sector with 162 new jobs, while Consumer Goods Rental is anticipated to increase employment by 135, or 6.89 percent. Commercial and Industrial Machinery and Equipment Rental and Leasing could offset this with a loss of 87, or 9.34 percent of its workforce. Professional, Scientific, and Technical ServicesThe Professional, Scientific, and Technical Services sector is predicted to add 2,064 new jobs, an increase of 4.81 percent. Computer Systems Design and Related Services is estimated to lead the sector in growth with 623 new jobs placing it on the Top 20 Growing Industries list. Architectural, Engineering, and Related Services is estimated to gain an additional 438 jobs, a 7.30 percent increase. Specialized Design Services could see a tough outlook with a loss of 88 jobs or 21.78 percent of its workforce.
Management of Companies and EnterprisesBetween first quarter 2015 and first quarter 2016, the Management of Companies and Enterprises sector experienced a growth of 1,760 new jobs. The industry is estimated to continue strong growth during the projection period with 2,261 new jobs, a 6.58 percent increase, the fastest among Services-Providing sectors. The industry is third in the Top 20 Growing industries list.
Administrative and Support and Waste Management and Remediation ServicesThe Administrative and Support and Waste Management and Remediation Services sector is projected to account for 2,304 new jobs, a 3.68 percent increase during the projection period. The majority of the job growth is likely to come in the Administrative and Support Services subsector, which is estimated to add 2,139 new jobs. Two industries within this subsector are forecast to be on the Top 20 Growing Industries list for the state. Employment Services is expected to be fourth in the state in net growth with 1,389 new jobs, while Services to Buildings and Dwellings is anticipated to add 562 to its workforce. Waste Management and Remediation Services is predicted to have a gain of 165 jobs between 2016 and 2018. Business Support Services, however, could see the toughest outlook losing 114 jobs during the projection period.
Educational Services The Educational Services sector is predicted to experience a net gain of 3,357 jobs during the projection period. Colleges, Universities, and Professional Schools is estimated to add 791 jobs during the projection period, while Elementary and Secondary Schools could add the most with 2,351 new jobs anticipated. Private and Charter schools could be a contributing factor of this growth in this subsector. Health Care and Social Assistance
15
16
The Health Care and Social Assistance sector is projected to add 6,280 jobs, making it the top growing industry sector in the state and more than 65 percent of the growth in Education and Health Services, which is expected to be the top growing supersector with an increase of 9,637 jobs. The Ambulatory Health Care Services subsector is estimated to add 2,981 jobs to the Arkansas labor market, while Hospitals are predicted to add a total of 1,013 to their workforce. Offices of Physicians is estimated to add 1,318 new jobs placing it among the Top 5 on the Top 20 Growing Industries list. The Social Assistance subsector is projected to have a net gain of 1,630 jobs. Individual and Family Services is second in net change in Health Care and Social Assistance and sixth overall in the state with an anticipated growth of 1,254 jobs. The only major downside in Healthcare and Social Assistance is expected in Other Residential Care Facilities with a decline of 92 jobs, an 8.46 percent drop in employment.
Arts, Entertainment, and RecreationThe Arts, Entertainment, and Recreation sector is projected to experience a net gain of 549 jobs. More than 54 percent of the growth is likely to come in Amusement, Gambling, and Recreation Industries, which is projected to gain 297 jobs between 2016 and 2018, while Performing Arts, Spectator Sports, and Related Industries is predicted to have a net gain of 170 jobs. Other Amusement and Recreation Industries is predicted to add 301 jobs to the labor force, an increase of 4.92 percent. Museums, Historical Sites, and Similar Institutions could be among the 10 fastest growing industries in the state with a 13.44 percent rise in employment. Performing Arts Companies is predicted to lose 10.15 percent of its workforce making the Top 20 Fastest Declining Industries list.
Accommodation and Food ServicesThe Accommodation and Food Services sector will likely see most of the growth that is projected to occur in the Leisure and Hospitality supersector with an increase of 4,978 jobs. The Food Services and Drinking Places subsector will likely drive the growth with a net gain of 4,769 jobs. Restaurants and Other Eating Places is projected to be the top growing industry in the state with a gain of 4,360 jobs. The industry added 4,115 jobs between March 2015 and March 2016. Accommodation, including Hotels and Motels could gain an additional 209 jobs during the projection period.
Other Services (Except Government)The Other Services (Except Government) supersector is expected to experience a net gain of 1,889 jobs between 2016 and 2018. Religious, Grantmaking, Civic, Professional, and Similar Organizations is predicted to experience a net gain of 1,294 jobs, while Repair and Maintenance is projected to see a net gain of 555 jobs. Religious Organizations is the top growing industry in Other Services (Except Government) with an anticipated 1,206 new jobs. Private Households is estimated to lose 123 jobs, or 5.71 percent of its workforce.
Government The Government supersector is projected to see a net gain of 1,211 jobs during the projection period. Local Government, Excluding Education and Hospitals is predicted to have the brightest outlook with 705 new jobs, while State Government, Excluding Education and Hospitals could add 557. Federal Government, Excluding Post Office could see a loss of 157 jobs during the projection period, while Postal Service could see an increase of 106 jobs.
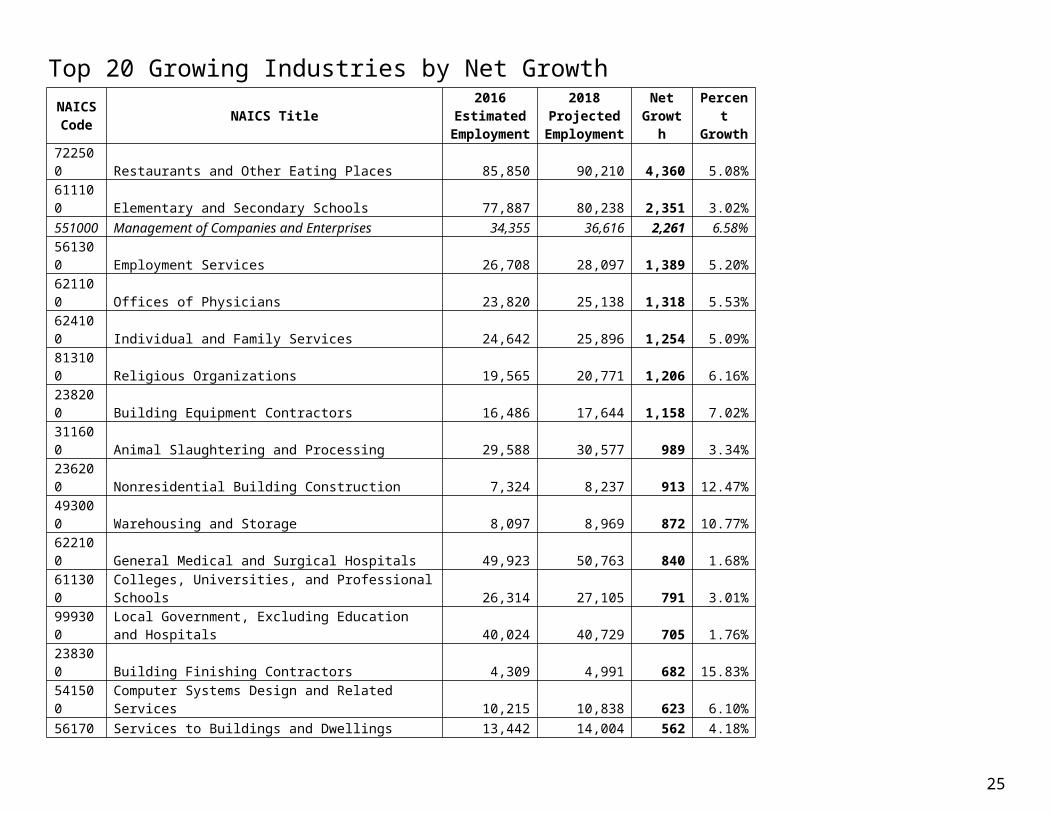
Top 20 Growing Industries by Net GrowthNAICS Code NAICS Title
2016Estimated
Employment
2018 Projected
Employment
Net Growt
hPercent Growth
722500 Restaurants and Other Eating Places 85,850 90,210 4,360 5.08%611100 Elementary and Secondary Schools 77,887 80,238 2,351 3.02%551000 Management of Companies and Enterprises 34,355 36,616 2,261 6.58%561300 Employment Services 26,708 28,097 1,389 5.20%621100 Offices of Physicians 23,820 25,138 1,318 5.53%624100 Individual and Family Services 24,642 25,896 1,254 5.09%813100 Religious Organizations 19,565 20,771 1,206 6.16%238200 Building Equipment Contractors 16,486 17,644 1,158 7.02%311600 Animal Slaughtering and Processing 29,588 30,577 989 3.34%236200 Nonresidential Building Construction 7,324 8,237 913 12.47%493000 Warehousing and Storage 8,097 8,969 872 10.77%622100 General Medical and Surgical Hospitals 49,923 50,763 840 1.68%611300 Colleges, Universities, and Professional Schools 26,314 27,105 791 3.01%999300 Local Government, Excluding Education and Hospitals 40,024 40,729 705 1.76%238300 Building Finishing Contractors 4,309 4,991 682 15.83%541500 Computer Systems Design and Related Services 10,215 10,838 623 6.10%561700 Services to Buildings and Dwellings 13,442 14,004 562 4.18%999200 State Government, Excluding Education and Hospitals 36,216 36,773 557 1.54%331100 Iron and Steel Mills and Ferroalloy Manufacturing 2,546 3,084 538 21.13%621300 Offices of Other Health Practitioners 8,063 8,583 520 6.45%
17

18
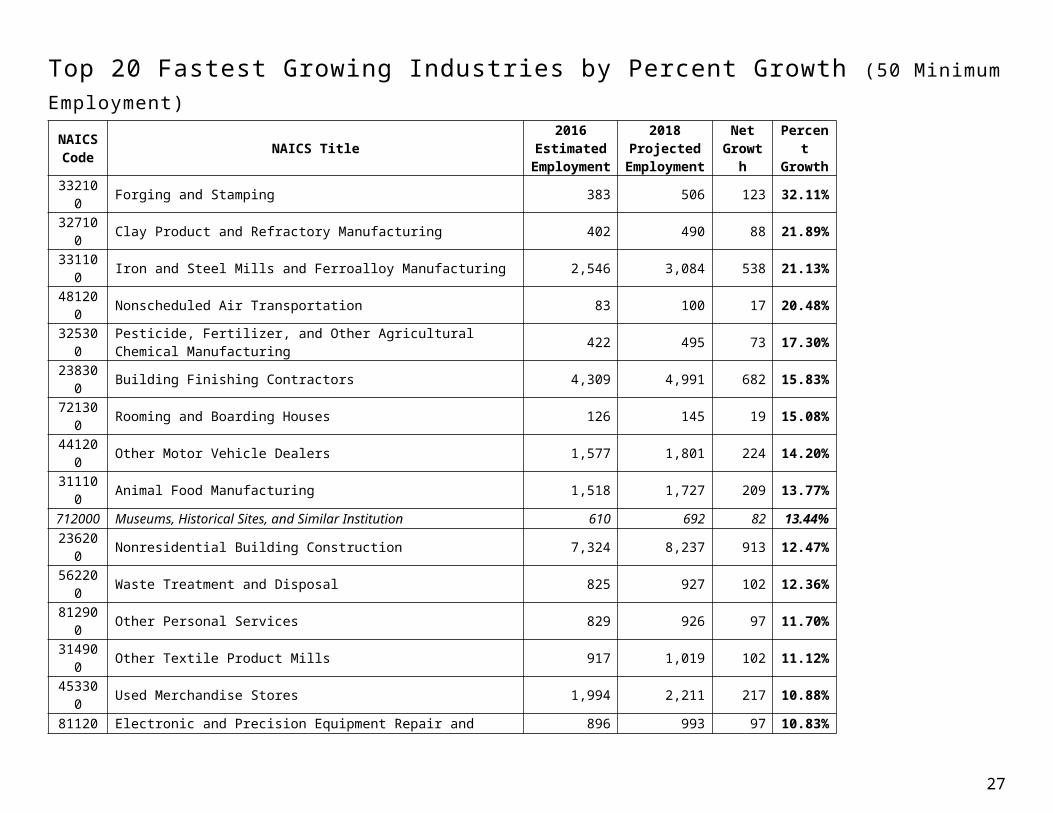
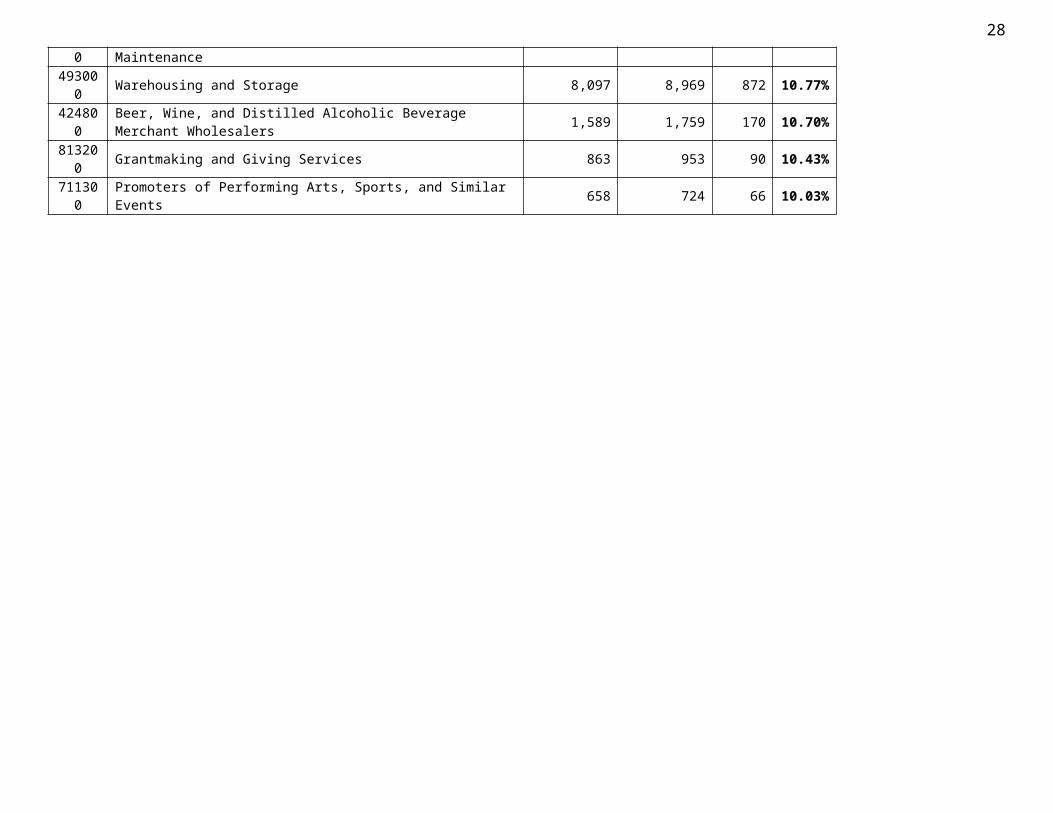
Top 20 Fastest Growing Industries by Percent Growth (50 Minimum Employment)
NAICS Code NAICS Title
2016Estimated
Employment
2018 Projected
Employment
Net Growt
hPercent Growth
332100 Forging and Stamping 383 506 123 32.11%327100 Clay Product and Refractory Manufacturing 402 490 88 21.89%331100 Iron and Steel Mills and Ferroalloy Manufacturing 2,546 3,084 538 21.13%481200 Nonscheduled Air Transportation 83 100 17 20.48%325300 Pesticide, Fertilizer, and Other Agricultural Chemical Manufacturing 422 495 73 17.30%238300 Building Finishing Contractors 4,309 4,991 682 15.83%721300 Rooming and Boarding Houses 126 145 19 15.08%441200 Other Motor Vehicle Dealers 1,577 1,801 224 14.20%311100 Animal Food Manufacturing 1,518 1,727 209 13.77%712000 Museums, Historical Sites, and Similar Institution 610 692 82 13.44%236200 Nonresidential Building Construction 7,324 8,237 913 12.47%562200 Waste Treatment and Disposal 825 927 102 12.36%812900 Other Personal Services 829 926 97 11.70%314900 Other Textile Product Mills 917 1,019 102 11.12%453300 Used Merchandise Stores 1,994 2,211 217 10.88%811200 Electronic and Precision Equipment Repair and Maintenance 896 993 97 10.83%493000 Warehousing and Storage 8,097 8,969 872 10.77%424800 Beer, Wine, and Distilled Alcoholic Beverage Merchant Wholesalers 1,589 1,759 170 10.70%813200 Grantmaking and Giving Services 863 953 90 10.43%711300 Promoters of Performing Arts, Sports, and Similar Events 658 724 66 10.03%
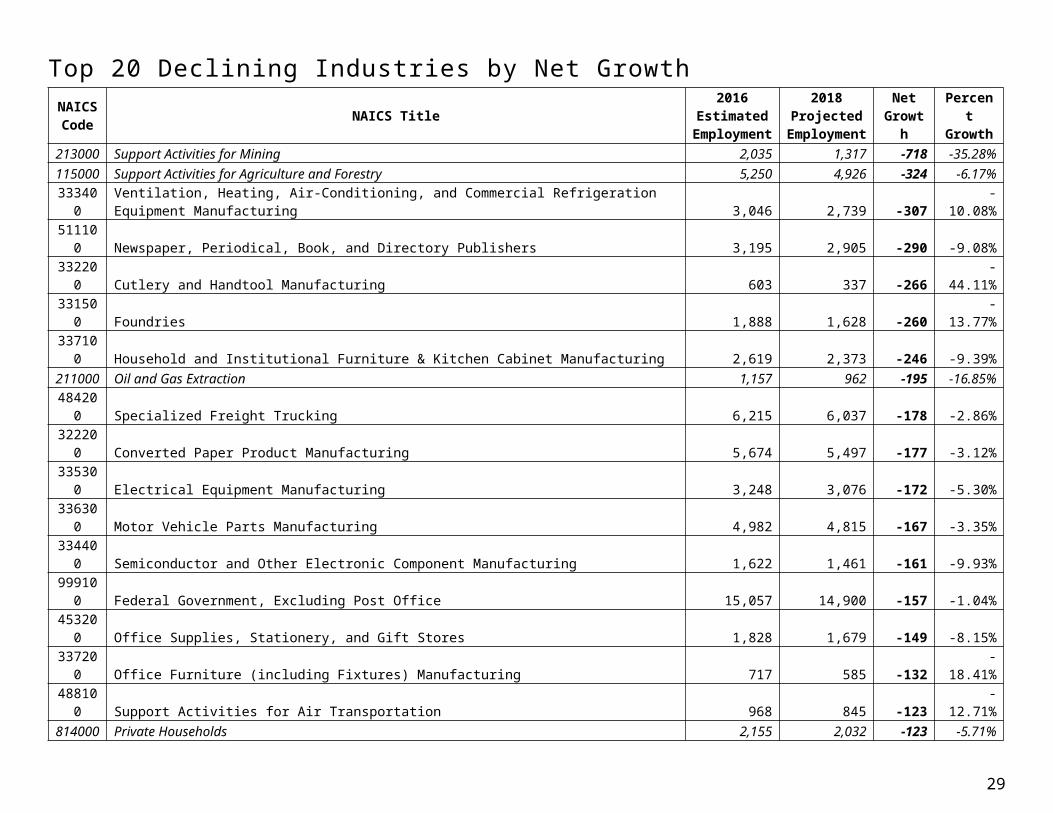
Top 20 Declining Industries by Net GrowthNAICS Code NAICS Title
2016Estimated
Employment
2018 Projected
Employment
Net Growt
hPercent Growth
213000 Support Activities for Mining 2,035 1,317 -718 -35.28%115000 Support Activities for Agriculture and Forestry 5,250 4,926 -324 -6.17%333400 Ventilation, Heating, Air-Conditioning, and Commercial Refrigeration Equipment Manufacturing 3,046 2,739 -307 -10.08%511100 Newspaper, Periodical, Book, and Directory Publishers 3,195 2,905 -290 -9.08%332200 Cutlery and Handtool Manufacturing 603 337 -266 -44.11%331500 Foundries 1,888 1,628 -260 -13.77%337100 Household and Institutional Furniture & Kitchen Cabinet Manufacturing 2,619 2,373 -246 -9.39%211000 Oil and Gas Extraction 1,157 962 -195 -16.85%484200 Specialized Freight Trucking 6,215 6,037 -178 -2.86%322200 Converted Paper Product Manufacturing 5,674 5,497 -177 -3.12%335300 Electrical Equipment Manufacturing 3,248 3,076 -172 -5.30%336300 Motor Vehicle Parts Manufacturing 4,982 4,815 -167 -3.35%334400 Semiconductor and Other Electronic Component Manufacturing 1,622 1,461 -161 -9.93%999100 Federal Government, Excluding Post Office 15,057 14,900 -157 -1.04%453200 Office Supplies, Stationery, and Gift Stores 1,828 1,679 -149 -8.15%337200 Office Furniture (including Fixtures) Manufacturing 717 585 -132 -18.41%488100 Support Activities for Air Transportation 968 845 -123 -12.71%814000 Private Households 2,155 2,032 -123 -5.71%424900 Miscellaneous Nondurable Goods Merchant Wholesalers 3,493 3,374 -119 -3.41%517100 Wired Telecommunications Carriers 3,777 3,663 -114 -3.02%561400 Business Support Services 8,181 8,067 -114 -1.39%
19

20
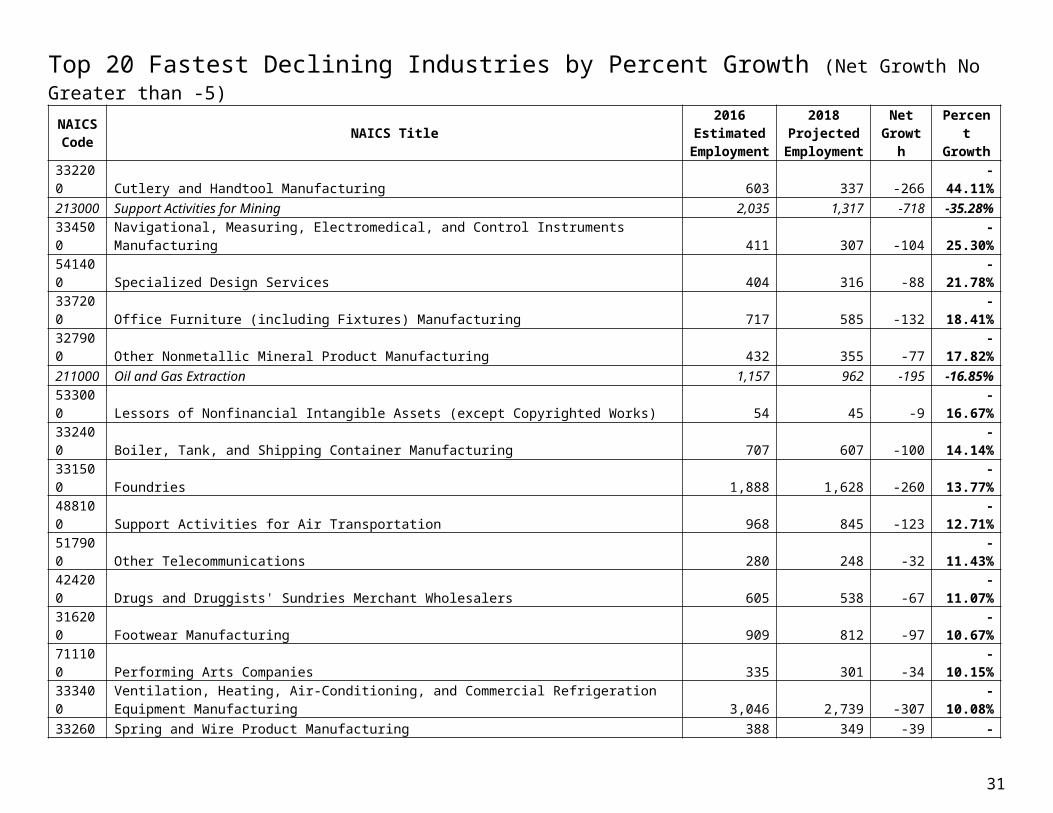
Top 20 Fastest Declining Industries by Percent Growth (Net Growth No Greater than -5)
NAICS Code NAICS Title
2016Estimated
Employment
2018 Projected
EmploymentNet
GrowthPercent Growth
332200 Cutlery and Handtool Manufacturing 603 337 -266 -44.11%213000 Support Activities for Mining 2,035 1,317 -718 -35.28%334500 Navigational, Measuring, Electromedical, and Control Instruments Manufacturing 411 307 -104 -25.30%541400 Specialized Design Services 404 316 -88 -21.78%337200 Office Furniture (including Fixtures) Manufacturing 717 585 -132 -18.41%327900 Other Nonmetallic Mineral Product Manufacturing 432 355 -77 -17.82%211000 Oil and Gas Extraction 1,157 962 -195 -16.85%533000 Lessors of Nonfinancial Intangible Assets (except Copyrighted Works) 54 45 -9 -16.67%332400 Boiler, Tank, and Shipping Container Manufacturing 707 607 -100 -14.14%331500 Foundries 1,888 1,628 -260 -13.77%488100 Support Activities for Air Transportation 968 845 -123 -12.71%517900 Other Telecommunications 280 248 -32 -11.43%424200 Drugs and Druggists' Sundries Merchant Wholesalers 605 538 -67 -11.07%316200 Footwear Manufacturing 909 812 -97 -10.67%711100 Performing Arts Companies 335 301 -34 -10.15%333400 Ventilation, Heating, Air-Conditioning, and Commercial Refrigeration Equipment Manufacturing 3,046 2,739 -307 -10.08%332600 Spring and Wire Product Manufacturing 388 349 -39 -10.05%334400 Semiconductor and Other Electronic Component Manufacturing 1,622 1,461 -161 -9.93%337100 Household and Institutional Furniture & Kitchen Cabinet Manufacturing 2,619 2,373 -246 -9.39%532400 Commercial and Industrial Machinery and Equipment Rental and Leasing 931 844 -87 -9.34%
2016-2018 Arkansas Statewide Industry Projections
NAICSCode North American Industry Classification System Title
2016Estimated
Employment
2018Projected
EmploymentNumeric Change
Percent Change
000000 TOTAL ALL INDUSTRIES 1,366,577 1,408,327 41,750 3.06%
000671 Total Self Employed and Unpaid Family Workers, All Jobs 134,451 138,298 3,847 2.86%006010 Self Employed Workers, All Jobs 127,023 130,657 3,634 2.86%007010 Unpaid Family Workers, All Jobs 7,428 7,641 213 2.87%
101000 Goods Producing 228,089 232,555 4,466 1.96%
101100 NATURAL RESOURCES AND MINING 25,110 24,633 -477 -1.90%
110000 Agriculture, Forestry, Fishing and Hunting 20,354 20,889 535 2.63%111000 Crop Production 6,740 7,077 337 5.00%112000 Animal Production 5,838 6,313 475 8.14%115000 Support Activities for Agriculture and Forestry 5,250 4,926 -324 -6.17%
OTHER 2,526 2,573 47 1.86%
210000 Mining 4,756 3,744 -1,012 -21.28%211000 Oil and Gas Extraction 1,157 962 -195 -16.85%212000 Mining (except Oil and Gas) 1,564 1,465 -99 -6.33%213000 Support Activities for Mining 2,035 1,317 -718 -35.28%
101200 CONSTRUCTION 48,757 52,260 3,503 7.18%
230000 Construction 48,757 52,260 3,503 7.18%236000 Construction of Buildings 10,313 11,401 1,088 10.55%236100 Residential Building Construction 2,989 3,164 175 5.85%236200 Nonresidential Building Construction 7,324 8,237 913 12.47%237000 Heavy and Civil Engineering Construction 7,414 7,553 139 1.87%237100 Utility System Construction 4,150 4,260 110 2.65%237200 Land Subdivision 85 82 -3 -3.53%237300 Highway, Street, and Bridge Construction 2,614 2,673 59 2.26%237900 Other Heavy and Civil Engineering Construction 565 538 -27 -4.78%
21
2016-2018 Arkansas Statewide Industry Projections 22
NAICSCode North American Industry Classification System Title
2016Estimated
Employment
2018Projected
EmploymentNumeric Change
Percent Change
238000 Specialty Trade Contractors 31,030 33,306 2,276 7.33%238100 Foundation, Structure, and Building Exterior Contractors 5,822 6,089 267 4.59%238200 Building Equipment Contractors 16,486 17,644 1,158 7.02%238300 Building Finishing Contractors 4,309 4,991 682 15.83%238900 Other Specialty Trade Contractors 4,413 4,582 169 3.83%
101300 MANUFACTURING 154,222 155,662 1,440 0.93%
Non-Durable Goods Manufacturing 79,277 80,846 1,569 1.98%311000 Food Manufacturing 43,973 45,444 1,471 3.35%311100 Animal Food Manufacturing 1,518 1,727 209 13.77%311200 Grain and Oilseed Milling 2,570 2,532 -38 -1.48%311400 Fruit and Vegetable Preserving and Specialty Food Manufacturing 4,125 4,071 -54 -1.31%311500 Dairy Product Manufacturing 531 530 -1 -0.19%311600 Animal Slaughtering and Processing 29,588 30,577 989 3.34%311800 Bakeries and Tortilla Manufacturing 3,492 3,651 159 4.55%311900 Other Food Manufacturing 2,090 2,297 207 9.90%
Other 59 59 0 0.00%312000 Beverage and Tobacco Product Manufacturing 1,342 1,417 75 5.59%313000 Textile Mills 101 88 -13 -12.87%314000 Textile Product Mills 953 1,055 102 10.70%314100 Textile Furnishings Mills 36 36 0 0.00%314900 Other Textile Product Mills 917 1,019 102 11.12%315000 Apparel Manufacturing 914 953 39 4.27%315100 Apparel Knitting Mills 673 732 59 8.77%315200 Cut and Sew Apparel Manufacturing 151 138 -13 -8.61%315900 Apparel Accessories and Other Apparel Manufacturing 90 83 -7 -7.78%316000 Leather and Allied Product Manufacturing 1,104 1,025 -79 -7.16%316200 Footwear Manufacturing 909 812 -97 -10.67%316900 Other Leather and Allied Product Manufacturing 195 213 18 9.23%322000 Paper Manufacturing 9,627 9,375 -252 -2.62%322100 Pulp, Paper, and Paperboard Mills 3,953 3,878 -75 -1.90%322200 Converted Paper Product Manufacturing 5,674 5,497 -177 -3.12%323000 Printing and Related Support Activities 4,029 3,986 -43 -1.07%324000 Petroleum and Coal Products Manufacturing 1,141 1,205 64 5.61%
2016-2018 Arkansas Statewide Industry Projections
NAICSCode North American Industry Classification System Title
2016Estimated
Employment
2018Projected
EmploymentNumeric Change
Percent Change
325000 Chemical Manufacturing 5,064 5,119 55 1.09%325100 Basic Chemical Manufacturing 1,854 1,852 -2 -0.11%325200 Resin, Synthetic Rubber, and Artificial Synthetic Fibers and Filaments Manufacturing 295 289 -6 -2.03%325300 Pesticide, Fertilizer, and Other Agricultural Chemical Manufacturing 422 495 73 17.30%325400 Pharmaceutical and Medicine Manufacturing 300 316 16 5.33%325500 Paint, Coating, and Adhesive Manufacturing 270 267 -3 -1.11%325600 Soap, Cleaning Compound, and Toilet Preparation Manufacturing 1,185 1,126 -59 -4.98%325900 Other Chemical Product and Preparation Manufacturing 738 774 36 4.88%326000 Plastics and Rubber Products Manufacturing 11,029 11,179 150 1.36%326100 Plastics Product Manufacturing 6,770 7,016 246 3.63%326200 Rubber Product Manufacturing 4,259 4,163 -96 -2.25%
Durable Goods Manufacturing 74,945 74,816 -129 -0.17%321000 Wood Product Manufacturing 9,359 9,643 284 3.03%321100 Sawmills and Wood Preservation 4,478 4,705 227 5.07%321200 Veneer, Plywood, and Engineered Wood Product Manufacturing 1,857 1,769 -88 -4.74%321900 Other Wood Product Manufacturing 3,024 3,169 145 4.79%327000 Nonmetallic Mineral Product Manufacturing 3,567 3,627 60 1.68%327100 Clay Product and Refractory Manufacturing 402 490 88 21.89%327200 Glass and Glass Product Manufacturing 352 332 -20 -5.68%327300 Cement and Concrete Product Manufacturing 2,105 2,181 76 3.61%327400 Lime and Gypsum Product Manufacturing 276 269 -7 -2.54%327900 Other Nonmetallic Mineral Product Manufacturing 432 355 -77 -17.82%331000 Primary Metal Manufacturing 8,344 8,474 130 1.56%331100 Iron and Steel Mills and Ferroalloy Manufacturing 2,546 3,084 538 21.13%331200 Steel Product Manufacturing from Purchased Steel 2,204 2,108 -96 -4.36%331300 Alumina and Aluminum Production 1,250 1,238 -12 -0.96%331400 Nonferrous Metal (except Aluminum) Production and Processing 456 416 -40 -8.77%331500 Foundries 1,888 1,628 -260 -13.77%332000 Fabricated Metal Product Manufacturing 14,932 14,917 -15 -0.10%332100 Forging and Stamping 383 506 123 32.11%332200 Cutlery and Handtool Manufacturing 603 337 -266 -44.11%332300 Architectural and Structural Metals Manufacturing 4,188 4,359 171 4.08%332400 Boiler, Tank, and Shipping Container Manufacturing 707 607 -100 -14.14%332500 Hardware Manufacturing 280 286 6 2.14%332600 Spring and Wire Product Manufacturing 388 349 -39 -10.05%
23
2016-2018 Arkansas Statewide Industry Projections 24
NAICSCode North American Industry Classification System Title
2016Estimated
Employment
2018Projected
EmploymentNumeric Change
Percent Change
332700 Machine Shops; Turned Product; and Screw, Nut, and Bolt Manufacturing 1,874 1,841 -33 -1.76%332800 Coating, Engraving, Heat Treating, and Allied Activities 661 639 -22 -3.33%332900 Other Fabricated Metal Product Manufacturing 5,848 5,993 145 2.48%333000 Machinery Manufacturing 11,059 10,936 -123 -1.11%333100 Agriculture, Construction, and Mining Machinery Manufacturing 2,748 2,813 65 2.37%333200 Industrial Machinery Manufacturing 607 596 -11 -1.81%333300 Commercial and Service Industry Machinery Manufacturing 735 737 2 0.27%
333400 Ventilation, Heating, Air-Conditioning, and Commercial Refrigeration Equipment Manufacturing 3,046 2,739 -307 -10.08%
333500 Metalworking Machinery Manufacturing 1,035 955 -80 -7.73%333600 Engine, Turbine, and Power Transmission Equipment Manufacturing 663 704 41 6.18%333900 Other General Purpose Machinery Manufacturing 2,225 2,392 167 7.51%334000 Computer and Electronic Product Manufacturing 2,300 1,967 -333 -14.48%334400 Semiconductor and Other Electronic Component Manufacturing 1,622 1,461 -161 -9.93%334500 Navigational, Measuring, Electromedical, and Control Instruments Manufacturing 411 307 -104 -25.30%
Other 267 199 -68 -25.47%335000 Electrical Equipment, Appliance, and Component Manufacturing 5,015 4,759 -256 -5.10%335100 Electric Lighting Equipment Manufacturing 366 365 -1 -0.27%335200 Household Appliance Manufacturing 43 42 -1 -2.33%335300 Electrical Equipment Manufacturing 3,248 3,076 -172 -5.30%335900 Other Electrical Equipment and Component Manufacturing 1,358 1,276 -82 -6.04%336000 Transportation Equipment Manufacturing 13,505 13,920 415 3.07%336200 Motor Vehicle Body and Trailer Manufacturing 1,839 1,867 28 1.52%336300 Motor Vehicle Parts Manufacturing 4,982 4,815 -167 -3.35%336400 Aerospace Product and Parts Manufacturing 3,405 3,644 239 7.02%336600 Ship and Boat Building 1,833 1,968 135 7.36%
Other 1,446 1,626 180 12.45%337000 Furniture and Related Product Manufacturing 3,440 3,059 -381 -11.08%337100 Household and Institutional Furniture & Kitchen Cabinet Manufacturing 2,619 2,373 -246 -9.39%337200 Office Furniture (including Fixtures) Manufacturing 717 585 -132 -18.41%337900 Other Furniture Related Product Manufacturing 104 101 -3 -2.88%339000 Miscellaneous Manufacturing 3,424 3,514 90 2.63%339100 Medical Equipment and Supplies Manufacturing 1,701 1,827 126 7.41%339900 Other Miscellaneous Manufacturing 1,723 1,687 -36 -2.09%
102000 Services Providing 1,004,037 1,037,474 33,437 3.33%
2016-2018 Arkansas Statewide Industry Projections
NAICSCode North American Industry Classification System Title
2016Estimated
Employment
2018Projected
EmploymentNumeric Change
Percent Change
102100 TRADE, TRANSPORTATION, AND UTILITIES 249,523 256,563 7,040 2.82%
420000 Wholesale Trade 46,093 46,975 882 1.91%423000 Merchant Wholesalers, Durable Goods 20,348 20,862 514 2.53%423100 Motor Vehicle and Motor Vehicle Parts and Supplies Merchant Wholesalers 2,618 2,857 239 9.13%423200 Furniture and Home Furnishing Merchant Wholesalers 446 458 12 2.69%423300 Lumber and Other Construction Materials Merchant Wholesalers 1,399 1,459 60 4.29%423400 Professional and Commercial Equipment and Supplies Merchant Wholesalers 2,396 2,453 57 2.38%423500 Metal and Mineral (except Petroleum) Merchant Wholesalers 857 840 -17 -1.98%423600 Household Appliances & Electrical and Electronic Goods Merchant Wholesalers 1,880 1,945 65 3.46%423700 Hardware, and Plumbing and Heating Equipment and Supplies Merchant Wholesalers 2,312 2,424 112 4.84%423800 Machinery, Equipment, and Supplies Merchant Wholesalers 6,644 6,656 12 0.18%423900 Miscellaneous Durable Goods Merchant Wholesalers 1,796 1,770 -26 -1.45%424000 Merchant Wholesalers, Nondurable Goods 14,522 14,541 19 0.13%424100 Paper and Paper Product Merchant Wholesalers 1,177 1,202 25 2.12%424200 Drugs and Druggists' Sundries Merchant Wholesalers 605 538 -67 -11.07%424300 Apparel, Piece Goods, and Notions Merchant Wholesalers 602 632 30 4.98%424400 Grocery and Related Product Wholesalers 4,302 4,362 60 1.39%424500 Farm Product Raw Material Merchant Wholesalers 828 814 -14 -1.69%424600 Chemical and Allied Products Merchant Wholesalers 637 597 -40 -6.28%424700 Petroleum and Petroleum Products Merchant Wholesalers 1,289 1,263 -26 -2.02%424800 Beer, Wine, and Distilled Alcoholic Beverage Merchant Wholesalers 1,589 1,759 170 10.70%424900 Miscellaneous Nondurable Goods Merchant Wholesalers 3,493 3,374 -119 -3.41%425000 Wholesale Electronic Markets and Agents and Brokers 11,223 11,572 349 3.11%
440000 Retail Trade 140,327 145,177 4,850 3.46%441000 Motor Vehicle and Parts Dealers 19,336 20,209 873 4.51%441100 Automobile Dealers 11,918 12,421 503 4.22%441200 Other Motor Vehicle Dealers 1,577 1,801 224 14.20%441300 Automotive Parts, Accessories, and Tire Stores 5,841 5,987 146 2.50%442000 Furniture and Home Furnishings Stores 3,620 3,898 278 7.68%442100 Furniture Stores 2,057 2,254 197 9.58%442200 Home Furnishings Stores 1,563 1,644 81 5.18%443000 Electronics and Appliance Stores 3,836 3,833 -3 -0.08%
25

2016-2018 Arkansas Statewide Industry Projections 26
NAICSCode North American Industry Classification System Title
2016Estimated
Employment
2018Projected
EmploymentNumeric Change
Percent Change
444000 Building Material and Garden Equipment and Supplies Dealers 11,176 11,776 600 5.37%444100 Building Material and Supplies Dealers 9,240 9,711 471 5.10%444200 Lawn and Garden Equipment and Supplies Stores 1,936 2,065 129 6.66%445000 Food and Beverage Stores 19,694 20,365 671 3.41%445100 Grocery Stores 16,978 17,464 486 2.86%445200 Specialty Food Stores 961 1,033 72 7.49%445300 Beer, Wine, and Liquor Stores 1,755 1,868 113 6.44%446000 Health and Personal Care Stores 8,431 8,848 417 4.95%447000 Gasoline Stations 12,205 12,696 491 4.02%448000 Clothing and Clothing Accessories Stores 8,840 8,903 63 0.71%448100 Clothing Stores 6,867 6,943 76 1.11%448200 Shoe Stores 1,244 1,253 9 0.72%448300 Jewelry, Luggage, and Leather Goods Stores 729 707 -22 -3.02%451000 Sporting Goods, Hobby, Book, and Music Stores 4,686 4,805 119 2.54%451100 Sporting Goods, Hobby, and Musical Instrument Stores 4,162 4,235 73 1.75%451200 Book, Periodical, and Music Stores 524 570 46 8.78%452000 General Merchandise Stores 39,337 40,420 1,083 2.75%453000 Miscellaneous Store Retailers 7,252 7,529 277 3.82%453100 Florists 722 712 -10 -1.39%453200 Office Supplies, Stationery, and Gift Stores 1,828 1,679 -149 -8.15%453300 Used Merchandise Stores 1,994 2,211 217 10.88%453900 Other Miscellaneous Store Retailers 2,708 2,927 219 8.09%454000 Nonstore Retailers 1,914 1,895 -19 -0.99%454100 Electronic Shopping and Mail Order Houses 757 744 -13 -1.72%454200 Vending Machine Operators 446 462 16 3.59%454300 Direct Selling Establishments 711 689 -22 -3.09%
480000 Transportation and Warehousing 55,332 56,800 1,468 2.65%481000 Air Transportation 645 658 13 2.02%481100 Scheduled Air Transportation 562 558 -4 -0.71%481200 Nonscheduled Air Transportation 83 100 17 20.48%483000 Water Transportation 18 20 2 11.11%484000 Truck Transportation 32,423 32,726 303 0.93%484100 General Freight Trucking 26,208 26,689 481 1.84%484200 Specialized Freight Trucking 6,215 6,037 -178 -2.86%
2016-2018 Arkansas Statewide Industry Projections
NAICSCode North American Industry Classification System Title
2016Estimated
Employment
2018Projected
EmploymentNumeric Change
Percent Change
485000 Transit and Ground Passenger Transportation 1,975 2,052 77 3.90%485300 Taxi and Limousine Service 413 424 11 2.66%485400 School and Employee Bus Transportation 473 489 16 3.38%485900 Other Transit and Ground Passenger Transportation 723 759 36 4.98%
Other 366 380 14 3.83%486000 Pipeline Transportation 474 441 -33 -6.96%488000 Support Activities for Transportation 5,035 5,056 21 0.42%488100 Support Activities for Air Transportation 968 845 -123 -12.71%488200 Support Activities for Rail Transportation 640 630 -10 -1.56%488300 Support Activities for Water Transportation 682 712 30 4.40%488400 Support Activities for Road Transportation 822 904 82 9.98%488500 Freight Transportation Arrangement 1,833 1,871 38 2.07%488900 Other Support Activities for Transportation 90 94 4 4.44%493000 Warehousing and Storage 8,097 8,969 872 10.77%
OTHER 6,665 6,878 213 3.20%
220000 Utilities 7,771 7,611 -160 -2.06%221100 Electric Power Generation, Transmission and Distribution 5,598 5,496 -102 -1.82%221200 Natural Gas Distribution 1,205 1,137 -68 -5.64%221300 Water, Sewage and Other Systems 968 978 10 1.03%
102200 INFORMATION 13,630 13,386 -244 -1.79%
511000 Publishing Industries (except Internet) 3,556 3,297 -259 -7.28%511100 Newspaper, Periodical, Book, and Directory Publishers 3,195 2,905 -290 -9.08%511200 Software Publishers 361 392 31 8.59%512000 Motion Picture and Sound Recording Industries 1,050 1,075 25 2.38%512100 Motion Picture and Video Industries 1,024 1,050 26 2.54%512200 Sound Recording Industries 26 25 -1 -3.85%515000 Broadcasting (except Internet) 1,597 1,583 -14 -0.88%515100 Radio and Television Broadcasting 1,571 1,561 -10 -0.64%515200 Cable and Other Subscription Programming 26 22 -4 -15.38%517000 Telecommunications 5,767 5,688 -79 -1.37%517100 Wired Telecommunications Carriers 3,777 3,663 -114 -3.02%517200 Wireless Telecommunications Carriers (except Satellite) 1,710 1,777 67 3.92%517900 Other Telecommunications 280 248 -32 -11.43%
27
2016-2018 Arkansas Statewide Industry Projections 28
NAICSCode North American Industry Classification System Title
2016Estimated
Employment
2018Projected
EmploymentNumeric Change
Percent Change
518000 Data Processing, Hosting and Related Services 1,314 1,378 64 4.87%519000 Other Information Services 346 365 19 5.49%
102300 FINANCIAL ACTIVITIES 50,979 52,727 1,748 3.43%
520000 Finance and Insurance 37,934 39,214 1,280 3.37%522000 Credit Intermediation and Related Activities 19,023 19,588 565 2.97%522100 Depository Credit Intermediation 16,115 16,517 402 2.49%522200 Nondepository Credit Intermediation 1,805 1,875 70 3.88%522300 Activities Related to Credit Intermediation 1,103 1,196 93 8.43%523000 Securities, Commodity Contracts, and Other Financial Investments and Related Activities 3,116 3,121 5 0.16%523100 Securities and Commodity Contracts Intermediation and Brokerage 2,184 2,164 -20 -0.92%523900 Other Financial Investment Activities 932 957 25 2.68%524000 Insurance Carriers and Related Activities 15,682 16,385 703 4.48%524100 Insurance Carriers 7,466 7,960 494 6.62%524200 Agencies, Brokerages, and Other Insurance Related Activities 8,216 8,425 209 2.54%
OTHER 113 120 7 6.19%
530000 Real Estate and Rental and Leasing 13,045 13,513 468 3.59%531000 Real Estate 8,929 9,299 370 4.14%531100 Lessors of Real Estate 4,059 4,152 93 2.29%531200 Offices of Real Estate Agents and Brokers 1,725 1,840 115 6.67%531300 Activities Related to Real Estate 3,145 3,307 162 5.15%532000 Rental and Leasing Services 4,062 4,169 107 2.63%532100 Automotive Equipment Rental and Leasing 945 994 49 5.19%532200 Consumer Goods Rental 1,959 2,094 135 6.89%532300 General Rental Centers 227 237 10 4.41%532400 Commercial and Industrial Machinery and Equipment Rental and Leasing 931 844 -87 -9.34%533000 Lessors of Nonfinancial Intangible Assets (except Copyrighted Works) 54 45 -9 -16.67%
102400 PROFESSIONAL AND BUSINESS SERVICES 139,887 146,516 6,629 4.74%
540000 Professional, Scientific, and Technical Services 42,948 45,012 2,064 4.81%541100 Legal Services 5,940 6,053 113 1.90%541200 Accounting, Tax Preparation, Bookkeeping, and Payroll Services 6,368 6,705 337 5.29%541300 Architectural, Engineering, and Related Services 6,000 6,438 438 7.30%
2016-2018 Arkansas Statewide Industry Projections
NAICSCode North American Industry Classification System Title
2016Estimated
Employment
2018Projected
EmploymentNumeric Change
Percent Change
541400 Specialized Design Services 404 316 -88 -21.78%541500 Computer Systems Design and Related Services 10,215 10,838 623 6.10%541600 Management, Scientific, and Technical Consulting Services 5,871 6,104 233 3.97%541700 Scientific Research and Development Services 855 870 15 1.75%541800 Advertising, Public Relations, and Related Services 3,560 3,753 193 5.42%541900 Other Professional, Scientific, and Technical Services 3,735 3,935 200 5.35%
550000 Management of Companies and Enterprises 34,355 36,616 2,261 6.58%
560000 Administrative and Support and Waste Management and Remediation Services 62,584 64,888 2,304 3.68%561000 Administrative and Support Services 59,628 61,767 2,139 3.59%561100 Office Administrative Services 3,919 4,080 161 4.11%561200 Facilities Support Services 1,047 1,078 31 2.96%561300 Employment Services 26,708 28,097 1,389 5.20%561400 Business Support Services 8,181 8,067 -114 -1.39%561500 Travel Arrangement and Reservation Services 369 376 7 1.90%561600 Investigation and Security Services 4,633 4,733 100 2.16%561700 Services to Buildings and Dwellings 13,442 14,004 562 4.18%561900 Other Support Services 1,329 1,332 3 0.23%562000 Waste Management and Remediation Services 2,956 3,121 165 5.58%562100 Waste Collection 1,144 1,182 38 3.32%562200 Waste Treatment and Disposal 825 927 102 12.36%562900 Remediation and Other Waste Management Services 987 1,012 25 2.53%
102500 EDUCATION AND HEALTH SERVICES 293,242 302,879 9,637 3.29%
610000 Educational Services 115,077 118,434 3,357 2.92%611100 Elementary and Secondary Schools 77,887 80,238 2,351 3.02%611200 Junior Colleges 7,290 7,287 -3 -0.04%611300 Colleges, Universities, and Professional Schools 26,314 27,105 791 3.01%611400 Business Schools and Computer and Management Training 123 121 -2 -1.63%611500 Technical and Trade Schools 1,155 1,178 23 1.99%611600 Other Schools and Instruction 1,671 1,822 151 9.04%611700 Educational Support Services 637 683 46 7.22%
29

2016-2018 Arkansas Statewide Industry Projections 30
NAICSCode North American Industry Classification System Title
2016Estimated
Employment
2018Projected
EmploymentNumeric Change
Percent Change
620000 Health Care and Social Assistance 178,165 184,445 6,280 3.52%621000 Ambulatory Health Care Services 52,545 55,526 2,981 5.67%621100 Offices of Physicians 23,820 25,138 1,318 5.53%621200 Offices of Dentists 7,086 7,360 274 3.87%621300 Offices of Other Health Practitioners 8,063 8,583 520 6.45%621400 Outpatient Care Centers 4,797 5,178 381 7.94%621500 Medical and Diagnostic Laboratories 1,116 1,174 58 5.20%621600 Home Health Care Services 5,011 5,235 224 4.47%621900 Other Ambulatory Health Care Services 2,652 2,858 206 7.77%622000 Hospitals 55,033 56,046 1,013 1.84%622100 General Medical and Surgical Hospitals 49,923 50,763 840 1.68%622200 Psychiatric and Substance Abuse Hospitals 2,787 2,752 -35 -1.26%622300 Specialty (except Psychiatric and Substance Abuse) Hospitals 2,323 2,531 208 8.95%623000 Nursing and Residential Care Facilities 31,283 31,939 656 2.10%623100 Nursing Care Facilities (Skilled Nursing Facilities) 21,995 22,253 258 1.17%
623200 Residential Intellectual & Developmental Disability, Mental Health, & Substance Abuse Facilities 4,381 4,631 250 5.71%
623300 Continuing Care Retirement Communities and Assisted Living Facilities for the Elderly 3,820 4,060 240 6.28%623900 Other Residential Care Facilities 1,087 995 -92 -8.46%624000 Social Assistance 39,304 40,934 1,630 4.15%624100 Individual and Family Services 24,642 25,896 1,254 5.09%624200 Community Food and Housing, and Emergency and Other Relief Services 1,312 1,347 35 2.67%624300 Vocational Rehabilitation Services 3,231 3,311 80 2.48%624400 Child Day Care Services 10,119 10,380 261 2.58%
102600 LEISURE AND HOSPITALITY 111,140 116,667 5,527 4.97%
710000 Arts, Entertainment, and Recreation 9,871 10,420 549 5.56%711000 Performing Arts, Spectator Sports, and Related Industries 2,832 3,002 170 6.00%711100 Performing Arts Companies 335 301 -34 -10.15%711200 Spectator Sports 1,760 1,894 134 7.61%711300 Promoters of Performing Arts, Sports, and Similar Events 658 724 66 10.03%711400 Agents and Managers for Artists, Athletes, Entertainers, and Other Public Figures 28 28 0 0.00%711500 Independent Artists, Writers, and Performers 51 55 4 7.84%712000 Museums, Historical Sites, and Similar Institutions 610 692 82 13.44%
2016-2018 Arkansas Statewide Industry Projections
NAICSCode North American Industry Classification System Title
2016Estimated
Employment
2018Projected
EmploymentNumeric Change
Percent Change
713000 Amusement, Gambling, and Recreation Industries 6,429 6,726 297 4.62%713100 Amusement Parks and Arcades 308 304 -4 -1.30%713900 Other Amusement and Recreation Industries 6,121 6,422 301 4.92%
720000 Accommodation and Food Services 101,269 106,247 4,978 4.92%721000 Accommodation, including Hotels and Motels 10,452 10,661 209 2.00%721100 Traveler Accommodation 9,957 10,145 188 1.89%721200 RV (Recreational Vehicle) Parks and Recreational Camps 369 371 2 0.54%721300 Rooming and Boarding Houses 126 145 19 15.08%722000 Food Services and Drinking Places 90,817 95,586 4,769 5.25%722300 Special Food Services 3,883 4,243 360 9.27%722400 Drinking Places (Alcoholic Beverages) 1,084 1,133 49 4.52%722500 Restaurants and Other Eating Places 85,850 90,210 4,360 5.08%
102700 OTHER SERVICES (EXCEPT GOVERNMENT) 48,849 50,738 1,889 3.87%
811000 Repair and Maintenance 10,043 10,598 555 5.53%811100 Automotive Repair and Maintenance 6,312 6,691 379 6.00%811200 Electronic and Precision Equipment Repair and Maintenance 896 993 97 10.83%
811300 Commercial and Industrial Machinery and Equipment (except Automotive and Electronic) Repair and Maintenance 2,255 2,329 74 3.28%
811400 Personal and Household Goods Repair and Maintenance 580 585 5 0.86%812000 Personal and Laundry Services 7,851 8,014 163 2.08%812100 Personal Care Services 2,981 3,114 133 4.46%812200 Death Care Services 1,623 1,663 40 2.46%812300 Drycleaning and Laundry Services 2,418 2,311 -107 -4.43%812900 Other Personal Services 829 926 97 11.70%813000 Religious, Grantmaking, Civic, Professional, and Similar Organizations 28,800 30,094 1,294 4.49%813100 Religious Organizations 19,565 20,771 1,206 6.16%813200 Grantmaking and Giving Services 863 953 90 10.43%813300 Social Advocacy Organizations 2,356 2,462 106 4.50%813400 Civic and Social Organizations 1,141 1,142 1 0.09%813900 Business, Professional, Labor, Political, and Similar Organizations 4,875 4,766 -109 -2.24%814000 Private Households 2,155 2,032 -123 -5.71%
31

2016-2018 Arkansas Statewide Industry Projections 32
NAICSCode North American Industry Classification System Title
2016Estimated
Employment
2018Projected
EmploymentNumeric Change
Percent Change
102800 GOVERNMENT 96,787 97,998 1,211 1.25%
910000 Total Federal Government Employment 20,547 20,496 -51 -0.25%491100 Postal Service 5,490 5,596 106 1.93%999100 Federal Government, Excluding Post Office 15,057 14,900 -157 -1.04%999200 State Government, Excluding Education and Hospitals 36,216 36,773 557 1.54%999300 Local Government, Excluding Education and Hospitals 40,024 40,729 705 1.76%
EXPLANATION OF OCCUPATIONAL PROJECTIONS DATAARKANSAS-STATEWIDE
SOC Code SOC Title2016
EstimatedEmployment
2018Projected
EmploymentNet
GrowthPercentGrowth
AnnualOpenings-
Growth
AnnualOpenings-
Replacement
TotalAnnual
Openings
Education/TrainingCodes
The occupational code based on the Standard Occupational Classification (SOC) Coding and Title Structure
The occupational title based on the Standard Occupational Classification (SOC) Coding and Title Structure
An estimate of the number of jobs in an occupation in 2016
The projected number of jobs expected to be in an occupation in 2018
Total number of jobs an occupation is expected to gain or lose over the 2016 to 2018 period
Percent change in the number of jobs in an occupation over the 2016 to 2018 period
Average number of annual job openings expected to be created during the projection period due to employment growth
Average number of annual jobopenings expected to be createdduring the projection period due to the need to replace workers who leave the occupation
Average number of annual job openings expected to be created during the projection period due to employment growth and replacements
Level of training needed by most workers to become fully qualified in the occupation according to the Bureau of Labor Statistics. See page 85 for definitions.
2016-2018
33
34
2016-2018 Arkansas Statewide Occupational Projections by Major GroupStandard Occupational Classification (SOC) Employment Change Annual Openings
Code Title Estimated2016
Projected
2018Net Percent Growt
h Replacements Total
00-0000 Total, All Occupations 1,366,577 1,408,327 41,750 3.06% 21,696 31,902 53,59811-0000 Management Occupations 132,670 136,551 3,881 2.93% 1,940 2,560 4,50013-0000 Business and Financial Operations Occupations 52,442 54,480 2,038 3.89% 1,022 993 2,01515-0000 Computer and Mathematical Occupations 24,483 25,604 1,121 4.58% 560 330 89017-0000 Architecture and Engineering Occupations 11,804 12,116 312 2.64% 162 282 44419-0000 Life, Physical, and Social Science Occupations 7,897 8,080 183 2.32% 96 221 31721-0000 Community and Social Service Occupations 23,125 24,164 1,039 4.49% 520 475 99523-0000 Legal Occupations 8,002 8,224 222 2.77% 111 126 23725-0000 Education, Training, and Library Occupations 77,252 79,793 2,541 3.29% 1,271 1,621 2,89227-0000 Arts, Design, Entertainment, Sports, and Media Occupations 16,065 16,444 379 2.36% 235 390 62529-0000 Healthcare Practitioners and Technical Occupations 77,976 80,781 2,805 3.60% 1,410 1,629 3,03931-0000 Healthcare Support Occupations 38,051 39,393 1,342 3.53% 672 802 1,47433-0000 Protective Service Occupations 25,899 26,419 520 2.01% 262 640 90235-0000 Food Preparation and Serving Related Occupations 103,352 108,212 4,860 4.70% 2,430 4,087 6,51737-0000 Building and Grounds Cleaning and Maintenance Occupations 43,109 44,445 1,336 3.10% 668 810 1,47839-0000 Personal Care and Service Occupations 47,444 49,307 1,863 3.93% 936 954 1,89041-0000 Sales and Related Occupations 138,191 142,558 4,367 3.16% 2,210 4,568 6,77843-0000 Office and Administrative Support Occupations 187,489 191,794 4,305 2.30% 2,196 3,864 6,06045-0000 Farming, Fishing, and Forestry Occupations 16,347 16,811 464 2.84% 239 412 65147-0000 Construction and Extraction Occupations 54,281 56,707 2,426 4.47% 1,382 863 2,24549-0000 Installation, Maintenance, and Repair Occupations 54,804 56,531 1,727 3.15% 884 1,234 2,11851-0000 Production Occupations 116,090 116,957 867 0.75% 886 2,550 3,43653-0000 Transportation and Material Moving Occupations 109,804 112,956 3,152 2.87% 1,604 2,492 4,096
Occupational Outlook
The Arkansas labor market is expected to see a growth of 41,750 jobs over the 2016-2018 projection period, an increase of 3.06 percent, with many job opportunities for recent graduates and other job seekers. Of the 53,598 total annual job openings expected during the projection period, 21,696 jobs are estimated to come from growth and expansion of businesses. The other 31,902 jobs are expected to be available due to the need to replace workers who leave their jobs for various reasons. All major occupational groups are estimated to see net gains in employment.
ManagementBusiness and Financial Operations
Computer and MathematicalArchitecture and Engineering
Life, Physical, and Social ScienceCommunity and Social Service
LegalEducation, Training, and Library
Arts, Design, Entertainment, Sports, and MediaHealthcare Practitioners and Technical
Healthcare Support
0 500 1,000 1,500 2,000 2,500 3,000 3,500 4,000 4,500
4,5002,015
890444
317
995237
2,892625
3,0391,474
Annual Job Openings by Occupational Category-Chart 1*
Replacement Total
*Numbers in black represent Total Annual Openings
Management OccupationsThe Management Occupations major group is projected to gain 3,881 jobs between 2016 and 2018, an increase of 2.93 percent. During the projection period, 4,500 job openings are expected to be available annually, of which 2,560 jobs are estimated to be for replacement and 1,940 for growth and expansion. Other Management Occupations is predicted to add 2,489 new jobs and account for 63.8 percent of the total annual openings among Management Occupations. Farmers, Ranchers, and Other Agricultural Managers could account for more than one-third of the new jobs in the major group making it the top growing occupation in the major group and third in the state on the Top 20 Growing Occupations list. Top Executives is predicted to add 777 to its workforce, while Operations Specialties Managers could experience a net gain of 416 jobs. General and Operations Managers is predicted to add an additional 705 jobs.
Business and Financial Operations
35
36
The Business and Financial Operations Occupations major group is estimated to gain 2,038 new jobs by the first quarter of 2018, an increase of 3.89 percent. Around 2,015 job openings are projected to be available each year of the projection period. The major group is one of four where growth openings could lead replacement openings with 1,022 for growth and expansion and 993 jobs for replacement. Business Operations Specialists is projected to gain the most jobs with 1,421 on the horizon, accounting for nearly 70 percent of the job growth in this major group, while Financial Specialists is predicted to gain an additional 617. Several occupations are predicted to gain over 150 new jobs during the projection period with Accountants and Auditors expected to add 324 new jobs and have 342 annual job openings.
Computer and MathematicalThe Computer and Mathematical Occupations major group is projected to add 1,121 new jobs and have 890 annual job openings. It is projected to have more growth openings than replacement openings with 560 for growth and expansion and 330 for replacement. At 4.58 percent, Computer and Mathematical Occupations is expected to be the second fastest growing major group in the state. The majority of this major group’s growth is likely to be in Computer Occupations with a gain of 1,094 new jobs and 869 annual openings. Five occupations in this group are estimated to grow by at least 100 jobs with Computer Systems Analysts leading with 203 new jobs. Web Developers could be the fastest growing occupation in the major group with an increase of 7.43 percent. The Mathematical Science Occupations occupational family is expected to add 27 new jobs to the labor market.
Architecture and EngineeringThe Architecture and Engineering Occupations major group is expected to experience a growth of 312 jobs, a 2.64 percent increase between 2016 and 2018. The major group is expected to have 444 annual job openings, of which 282 would be for replacement. A little more than half of the growth is expected to occur in the Engineers occupational family with 157 new jobs, a 2.28 percent increase. Civil Engineers is predicted to lead occupations in this major group with 59 new jobs. Cartographers and Photogrammetrists makes the Top 20 Fastest Growing Occupations list with an 8.47 percent growth. Life, Physical, and Social ScienceLife, Physical, and Social Science Occupations is projected to have 183 new jobs during the projection period, the smallest growth in the state. Life, Physical, and Social Science Technicians is estimated to add 85 to its workforce, while Social Scientists and Related Workers is forecast to have 53 new jobs. Clinical, Counseling, and School Psychologists are set to add the most in this major group with 37 new jobs anticipated between 2016 and 2018. In all, six occupations are expected to gain at least 10 new jobs. Forensic Science Technicians are estimated to increase over the 2016-2018 projection period by 6.04 percent
Community and Social ServiceThe Community and Social Service Occupations major group is expected to gain 1,039 jobs by the first quarter of 2018. Around 995 annual job openings are projected to be available with 520 for growth and expansion and 475 for replacement. Religious Workers is forecast to gain 573 new jobs with Clergy claiming 501. Counselors, Social Workers, and Other Community and Social Service Specialists is predicted to add an additional 466 jobs. Social and Human Service Assistants is predicted to add 144 jobs, while seven other occupations in this occupational group are predicted to add at least 20. Legal

The Legal Occupations major group is projected to gain 222 jobs during the projection period. This occupational group is expected to have the fewest annual openings with 237 anticipated with 111 for growth and expansion and 126 for replacement. The majority of the growth is likely to come in Lawyers, Judges, and Related Workers with an anticipated growth of 143 jobs with 133 coming among Lawyers. Legal Support Workers is estimated to add 79 new jobs with Paralegals and Legal Assistants adding 56 of those.
Education, Training, and LibraryThe Education, Training, and Library Occupations major group is forecast to add 2,541 jobs and have 2,892 annual openings each year of the projection period. Preschool, Primary, Secondary, and Special Education School Teachers is set to add 1,249 jobs to the Arkansas workforce and have 1,502 annual openings. Elementary School Teachers, Except Special Education leads all occupations in the major group with 404 new jobs. Museum Technicians and Conservators is estimated to increase by 10.34 percent and be among the 10 fastest growing occupations in the state. In all, four occupations are expected to add over 200 new jobs between 2016 and 2018.
Arts, Design, Entertainment, Sports, and Media The Arts, Design, Entertainment, Sports, and Media Occupations major group is expected to add 379 jobs between 2016 and 2018. Around 625 jobs are projected to be available each year during the projection period. The Entertainers and Performers, Sports and Related Workers family could add the most jobs with 278 on the horizon. Music Directors and Composers could lead the major group in net change with 92 new jobs. Coaches and Scouts is estimated to increase by 66. On the negative side of the labor market, Editors could lose 25 jobs, or just over 4 percent of its workforce, while Reporters and Correspondents could see a cut of 4.87 percent to its own workforce.
Healthcare Practitioners and Technical The Healthcare Practitioners and Technical Occupations major group is projected to add 2,805 jobs between 2016 and 2018. It is expected to have 3,039 job openings each year, 1,629 of which would be for replacement. Health Diagnosing and Treating Practitioners is expected to have the most new jobs with 1,740 on the horizon. Registered Nurses is estimated to add 737 and have 876 annual openings, placing it among the Top Ten on both the Top 20 Annual Openings list as well as the Top 20 Growing Occupations list. At 7.91 percent, Physician Assistants make the Top 20 Fastest Growing Occupations list. Health Technologists and Technicians is projected to increase by an additional 1,028 jobs with Licensed Practical and Licensed Vocational Nurses adding 284. Veterinary Technologists and Technicians could increase by 6.51 percent.
Healthcare Support OccupationsHealthcare Support Occupations is expected to increase employment by 3.53 percent, equivalent to 1,342 new jobs and 1,474 annual job openings between 2016 and 2018. The occupational family Nursing, Psychiatric, and Home Health Aides is estimated to gain the most new jobs with 792 on the horizon. Nursing Assistants is estimated to lead the major group in net change with a growth of 484. Other Healthcare Support Occupations could add 444 new jobs to its workforce. Medical Assistants leads this occupational family with 173 new jobs, anticipated. Occupational Therapy Assistants is forecast to be the fastest growing occupation in the Healthcare Support Occupations major group with a 7.58 percent growth.
37
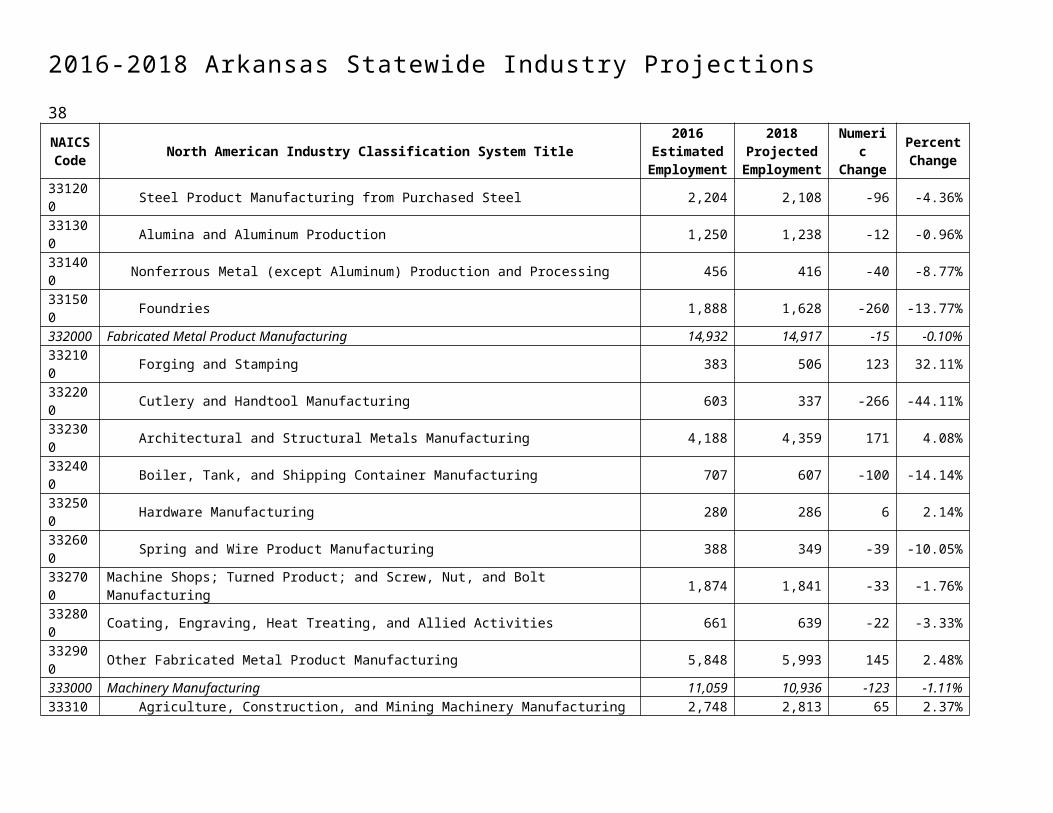
38
Protective ServiceFood Preparation and Serving Related
Building and Grounds Cleaning and MaintenancePersonal Care and Service
Sales and RelatedOffice and Administrative Support
Farming, Fishing, and ForestryConstruction and Extraction
Installation, Maintenance and RepairProduction
Transportation and Material Moving
0 1,000 2,000 3,000 4,000 5,000 6,000 7,000902
6,5171,478
1,8906,778
6,060651
2,2452,118
3,4364,096
Annual Job Openings by Occupational Category-Chart 2*
Replacement Total
*Numbers in black represent Total Annual Openings
Protective ServiceThe Protective Service Occupations major group is expected to add 520 new jobs to the Arkansas job market. This major group is predicted to have 902 annual job openings with about 640 for replacement. Law Enforcement Workers is forecast to add 207 new jobs with Police and Sheriff's Patrol Officers adding 114 and Correctional Officers and Jailers adding 85. Other Protective Service Workers is estimated to see a growth of 202 new jobs with Security Guards adding 155. Food Preparation and Serving RelatedFood Preparation and Serving Related Occupations is expected to increase employment over the next two years adding 4,860 jobs to the Arkansas labor market, an increase of 4.70 percent making it the top and fastest growing occupational major group in the state. It is projected to have 6,517 annual job openings with 4,087 of those for replacement. Food and Beverage Serving Workers is projected to have 2,751 new jobs and 3,716 annual job openings during the projection period. Combined Food Preparation and Serving Workers, Including Fast Food is estimated to be the top growing occupation in the state with 1,661 new jobs. Waiters and Waitresses is expected to add 833 to its workforce. In all, four occupations in this major group are in the Top 20 Growing Occupations list.
Building and Grounds Cleaning and MaintenanceThe Building and Grounds Cleaning and Maintenance Occupations major group is projected to add 1,336 jobs by the first quarter of 2018 as well as having 1,478 annual openings. Building Cleaning and Pest Control Workers is predicted to see 885 new jobs, 66.2 percent of this major group’s job growth. Janitors and Cleaners, Except Maids and Housekeeping Cleaners is estimated to gain 681 of those jobs, placing the occupation in the

Top 20 Growing Occupations list. Grounds Maintenance Workers is also forecast to see strong growth with a gain of 317 jobs. Landscaping and Groundskeeping Workers will likely claim the majority of those jobs with 283 on the horizon.
Personal Care and ServiceThe Personal Care and Service Occupations major group is projected to increase employment by 1,863, an increase of 3.93 percent. Around 1,890 annual openings are forecast for this major group with 954 for replacement and 936 for growth and expansion. The Other Personal Care and Service Workers occupational family could account for 74.4 percent of the new jobs in this major group with 1,386 expected. Personal Care Aides could add 865 new jobs to its workforce placing it sixth in net growth, while Childcare Workers is predicted to add 366 to its workforce. Sales and RelatedSales and Related Occupations is expected to be the second highest growing major group with an anticipated gain of 4,367 new jobs by March 2018 and have 6,778 annual openings during the projection period, the most among the major groups. Of these, 4,568 are estimated to be for replacement, while 2,210 would be for growth and expansion. The Retail Sales Workers occupational family is predicted to add 2,894 to the Arkansas job market. Retail Salespersons is predicted to add the majority of those jobs with a forecasted growth of 1,535, while Cashiers is estimated to gain an additional 1,139 jobs, placing the occupations second and fourth, respectively, among the Top 10 growing occupations. The occupations are slated to be the Top two in the number of annual openings. Supervisors of Sales Workers is anticipated to add 630 jobs between 2016 and 2018. Office and Administrative SupportThe Office and Administrative Support Occupations major group is predicted to add 4,305 new jobs and have 6,060 annual openings. Of the total annual openings, 3,864 would be for replacement and 2,196 for growth and expansion. The Information and Record Clerks family is projected to add 1,018 new jobs. Customer Service Representatives is projected to add 502 jobs to the economy, while Receptionists and Information Clerks is set to have 231 new jobs. The two occupations are predicted to have more than 1,000 openings annually between them. Secretaries and Administrative Assistants are projected to increase by 860, while Other Office and Administrative Support Workers is forecast to raise employment by 807. Office Clerks, General is expected to lead all occupations in the major group with 697 new jobs and 982 annual job openings.
Farming, Fishing, and ForestryThe Farming, Fishing, and Forestry Occupations major group is projected to see an increase over the next two years with a gain of 464, a 2.84 percent increase. It is also expected to have 651 annual job openings with 412 for replacements and 239 for growth and expansion. The majority of the jobs are likely to come in the Agricultural Workers occupational family with a gain of 416, almost 90 percent of the total growth. Farmworkers, Farm, Ranch, and Aquacultural Animals is estimated to add the most jobs with 195 on the horizon, while Farmworkers and Laborers, Crop, Nursery, and Greenhouse is estimated to grow by 168.
Construction and ExtractionThe Construction and Extraction Occupations major group is expected to experience a net gain of 2,426 jobs by March 2018. The major group is estimated to have more growth openings than those for replacements with 1,382 for growth and 863 for replacement and bringing total annual openings to 2,245. The outlook for this major group is mixed with many occupations making it on at least one of the Top 20 lists. Helpers--Painters, Paperhangers, Plasterers, and Stucco Masons is predicted to be the second fastest growing occupation in the state with a 14.98 percent growth. In all,
39
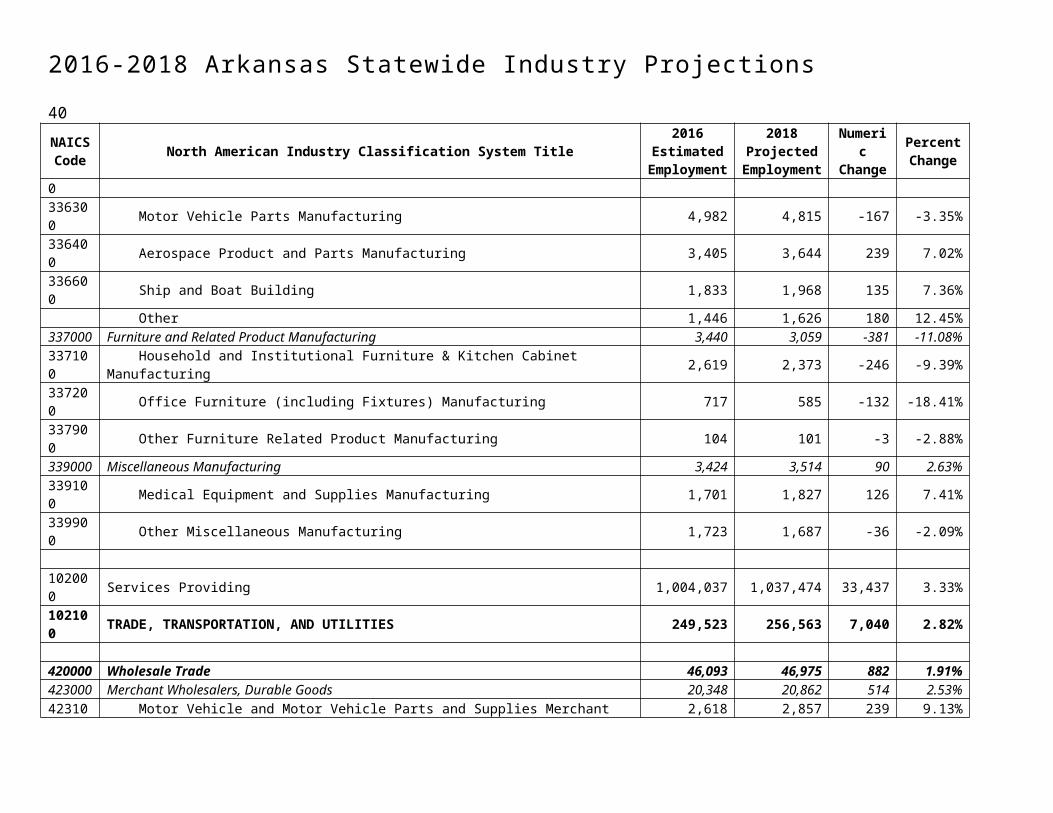
40
11 occupations in this major group are included in the Top 20 Fastest Growing occupations list. Overall, the Construction Trades Workers family is predicted to add 2,256 jobs accounting for almost 93 percent of the total growth in the major group. On the flip side of the economy, the Extraction Workers family is projected to lose 338 jobs or 18.42 percent of its workforce. A downturn in the oil and gas industry could be a contributing factor in the decline. Service Unit Operators, Oil, Gas, and Mining is forecast to be the top declining occupation in the state with a loss of 111, while Derrick Operators, Oil and Gas is projected to be the fastest declining occupation in the state with a decline of 29.49 percent. In all, four occupations in this major group are included in the Top 20 Declining Occupations list and five are included in the Top 20 Fastest Declining Occupations list.
Installation, Maintenance, and RepairThe Installation, Maintenance, and Repair Occupations major group is projected to gain 1,727 jobs over the next two years. About 2,118 job openings are forecast to be available each year during the projection period with 1,234 due to replacement. The Other Installation, Maintenance, and Repair Occupations family is predicted to see the most growth with an increase of 973 jobs. Maintenance and Repair Workers, General is projected to add 403 new jobs to its workforce, while Industrial Machinery Mechanics is predicted to add 229 jobs. The Vehicle and Mobile Equipment Mechanics, Installers, and Repairers family is expected to add an additional 555 jobs to the Arkansas labor market.
Production Occupations The Production Occupations major group is predicted to experience a net gain of 867 jobs during the projection period. Its 0.75 percent increase is the slowest among occupational major groups. Of the 3,436 annual job openings, 2,550 job openings are estimated to be for replacement and 886 for growth and expansion. The outlook in this major group is mixed with some gains and losses. Among growing occupational families, Food Processing Workers is estimated to gain 659 jobs. Meat, Poultry, and Fish Cutters and Trimmers leads all occupations in net growth with a gain of 266 new jobs. While no occupations in the Production Occupations major group made the Top 20 Growing Occupation list, two made the Top 20 Fastest Growing Occupations list, including the top growing occupation, Pourers and Casters, Metal, which is predicted to raise employment by 15.45 percent. On the negative side of the economy, twelve occupations made the Top 20 Declining Occupations list. Cutting, Punching, and Press Machine Setters, Operators, and Tenders, Metal and Plastic is leading in decline for this major group with an anticipated loss of 89 jobs. Eleven occupations made the Top 20 Fastest Declining occupations list with Layout Workers, Metal and Plastic losing the most with a decrease of 14.63 percent of its workforce.
Transportation and Material MovingThe Transportation and Material Moving Occupations major group is projected to gain 3,152 employees by the first quarter of 2018. Around 4,096 jobs are expected to be available each year of the projection period, of which 2,492 would be for replacement. Material Moving Workers is projected to add 1,569 new jobs with Laborers and Freight, Stock, and Material Movers, Hand predicted to gain 963 placing among the Top 5 on the Top 20 Growing Occupations list. Motor Vehicle Operators is expected to experience a net gain of 1,374 jobs during the projection period. Driving this growth is Heavy and Tractor-Trailer Truck Drivers, which is projected to add 714 jobs to its workforce, placing it among the Top 10 on the Top 20 Growing Occupations list. Wellhead Pumpers with a 22.84 percent decline could be among the five fastest declining occupations in the state.
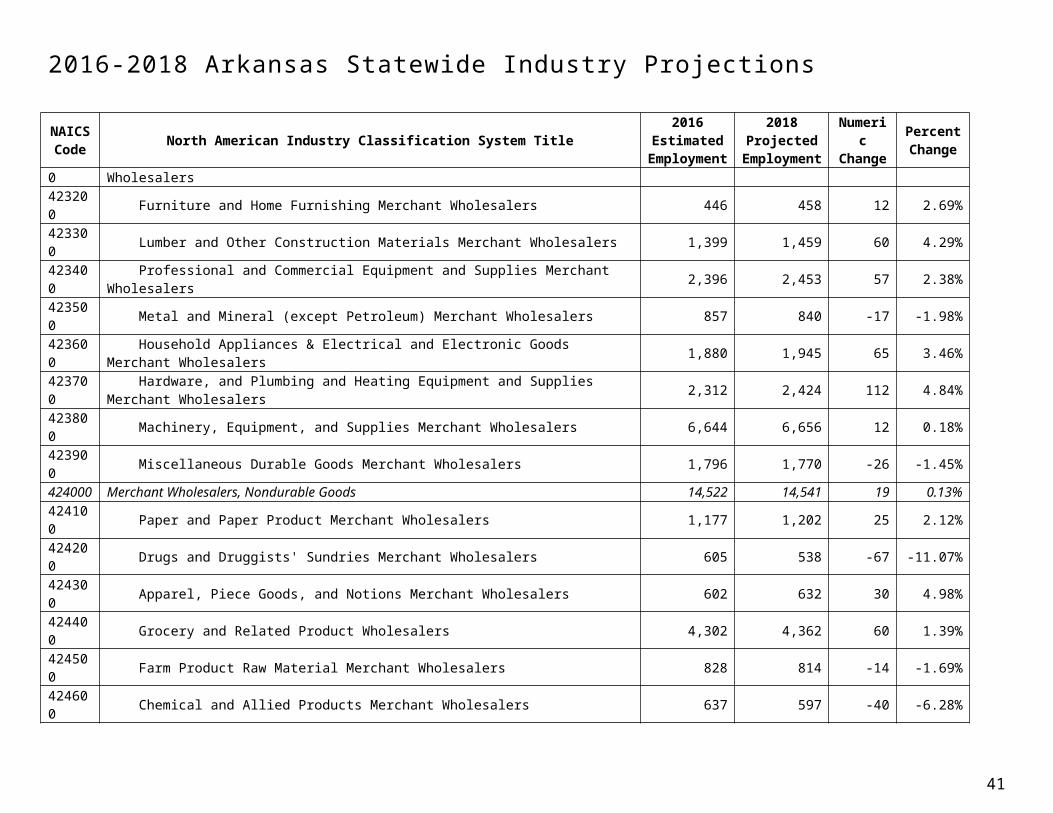
Top 20 Growing Occupations by Net GrowthSOCCode Standard Occupational Classification (SOC) Title
Estimated Employment
2016
Projected Employment
2018Net
GrowthPercen
t Growth
Annual Openings
due to Growth
Annual Openings due
to Replacements
Total Annual
Openings
35-3021 Combined Food Preparation and Serving Workers, Including Fast Food 27,172 28,833 1,661 6.11% 830 1,058 1,888
41-2031 Retail Salespersons 39,797 41,332 1,535 3.86% 768 1,488 2,25611-9013 Farmers, Ranchers, and Other Agricultural Managers 59,892 61,357 1,465 2.45% 732 992 1,72441-2011 Cashiers 34,387 35,526 1,139 3.31% 570 1,742 2,31253-7062 Laborers and Freight, Stock, and Material Movers, Hand 26,678 27,641 963 3.61% 482 824 1,30639-9021 Personal Care Aides 17,186 18,051 865 5.03% 432 110 54235-3031 Waiters and Waitresses 19,107 19,940 833 4.36% 416 998 1,41429-1141 Registered Nurses 23,040 23,777 737 3.20% 368 508 87653-3032 Heavy and Tractor-Trailer Truck Drivers 35,834 36,548 714 1.99% 357 571 92811-1021 General and Operations Managers 20,388 21,093 705 3.46% 352 479 83143-9061 Office Clerks, General 30,076 30,773 697 2.32% 348 634 982
37-2011 Janitors and Cleaners, Except Maids and Housekeeping Cleaners 19,172 19,853 681 3.55% 340 345 685
43-6014 Secretaries and Administrative Assistants, Except Legal, Medical, and Executive 24,193 24,867 674 2.79% 337 256 593
35-2014 Cooks, Restaurant 9,349 9,997 648 6.93% 324 252 57641-1011 First-Line Supervisors of Retail Sales Workers 17,472 18,012 540 3.09% 270 397 667
35-1012 First-Line Supervisors of Food Preparation and Serving Workers 9,343 9,861 518 5.54% 259 298 557
47-2061 Construction Laborers 9,942 10,459 517 5.20% 258 196 45443-4051 Customer Service Representatives 18,936 19,438 502 2.65% 251 440 69121-2011 Clergy 7,887 8,388 501 6.35% 250 166 416
43-1011 First-Line Supervisors of Office and Administrative Support Workers 15,284 15,783 499 3.26% 250 240 490
41

42
Top 20 Fastest Growing Occupations by Percent Growth (Minimum Employment of 50)
SOC Code Standard Occupational Classification (SOC) Title
EstimatedEmployment
2016
ProjectedEmployment
2018Net
GrowthPercen
tGrowth
Annual Openings
due to Growth
Annual Openings due
to Replacements
Total Annual
Openings
51-4052 Pourers and Casters, Metal 123 142 19 15.45% 10 4 14
47-3014 Helpers--Painters, Paperhangers, Plasterers, and Stucco Masons 247 284 37 14.98% 18 4 22
49-3052 Motorcycle Mechanics 206 234 28 13.59% 14 4 1847-2081 Drywall and Ceiling Tile Installers 653 738 85 13.02% 42 4 4647-2131 Insulation Workers, Floor, Ceiling, and Wall 241 270 29 12.03% 14 8 2225-4013 Museum Technicians and Conservators 87 96 9 10.34% 4 2 649-3051 Motorboat Mechanics and Service Technicians 199 219 20 10.05% 10 4 1447-2132 Insulation Workers, Mechanical 176 192 16 9.09% 8 6 1425-4012 Curators 69 75 6 8.70% 3 2 5
47-3011 Helpers--Brickmasons, Blockmasons, Stonemasons, and Tile and Marble Setters 290 315 25 8.62% 12 4 16
47-2141 Painters, Construction and Maintenance 2,082 2,261 179 8.60% 90 32 12217-1021 Cartographers and Photogrammetrists 59 64 5 8.47% 2 2 447-3012 Helpers--Carpenters 378 409 31 8.20% 16 6 2229-1071 Physician Assistants 417 450 33 7.91% 16 8 2447-4021 Elevator Installers and Repairers 64 69 5 7.81% 2 1 347-3013 Helpers--Electricians 372 401 29 7.80% 14 6 20
51-6091 Extruding and Forming Machine Setters, Operators, and Tenders, Synthetic and Glass Fibers 90 97 7 7.78% 4 1 5
47-2044 Tile and Marble Setters 143 154 11 7.69% 6 2 847-2161 Plasterers and Stucco Masons 78 84 6 7.69% 3 0 351-9081 Dental Laboratory Technicians 442 476 34 7.69% 17 12 29
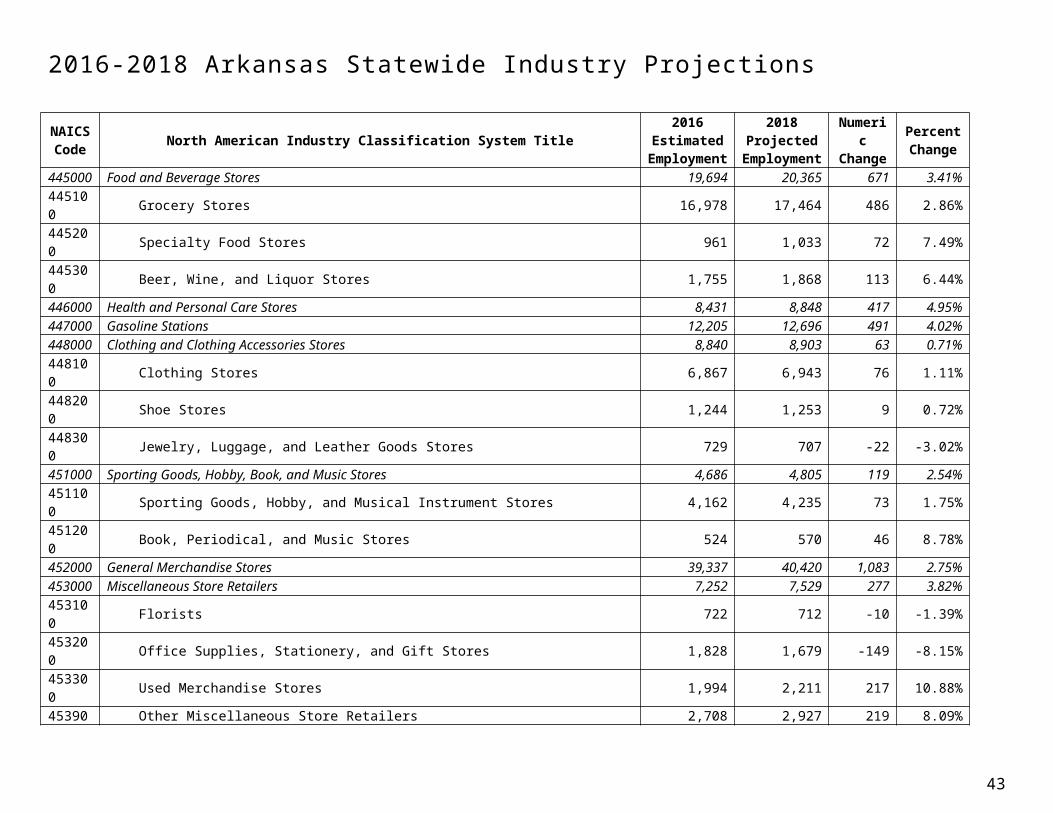
Top 20 Occupations by Total Annual OpeningsSOC Code Standard Occupational Classification (SOC) Title
Estimated Employment
2016
Projected Employment
2018Net
GrowthPercen
t Growth
Annual Openings
due to Growth
Annual Openings due
to Replacements
Total Annual
Openings
41-2011 Cashiers 34,387 35,526 1,139 3.31% 570 1,742 2,31241-2031 Retail Salespersons 39,797 41,332 1,535 3.86% 768 1,488 2,256
35-3021 Combined Food Preparation and Serving Workers, Including Fast Food 27,172 28,833 1,661 6.11% 830 1,058 1,888
11-9013 Farmers, Ranchers, and Other Agricultural Managers 59,892 61,357 1,465 2.45% 732 992 1,72435-3031 Waiters and Waitresses 19,107 19,940 833 4.36% 416 998 1,41453-7062 Laborers and Freight, Stock, and Material Movers, Hand 26,678 27,641 963 3.61% 482 824 1,30643-9061 Office Clerks, General 30,076 30,773 697 2.32% 348 634 98253-3032 Heavy and Tractor-Trailer Truck Drivers 35,834 36,548 714 1.99% 357 571 92829-1141 Registered Nurses 23,040 23,777 737 3.20% 368 508 87611-1021 General and Operations Managers 20,388 21,093 705 3.46% 352 479 83143-5081 Stock Clerks and Order Fillers 16,053 16,534 481 3.00% 240 544 78443-4051 Customer Service Representatives 18,936 19,438 502 2.65% 251 440 691
37-2011 Janitors and Cleaners, Except Maids and Housekeeping Cleaners 19,172 19,853 681 3.55% 340 345 685
41-1011 First-Line Supervisors of Retail Sales Workers 17,472 18,012 540 3.09% 270 397 66731-1014 Nursing Assistants 18,667 19,151 484 2.59% 242 394 63639-9011 Childcare Workers 13,945 14,311 366 2.62% 183 426 609
43-6014 Secretaries and Administrative Assistants, Except Legal, Medical, and Executive 24,193 24,867 674 2.79% 337 256 593
35-2014 Cooks, Restaurant 9,349 9,997 648 6.93% 324 252 576
35-1012 First-Line Supervisors of Food Preparation and Serving Workers 9,343 9,861 518 5.54% 259 298 557
39-9021 Personal Care Aides 17,186 18,051 865 5.03% 432 110 542
43
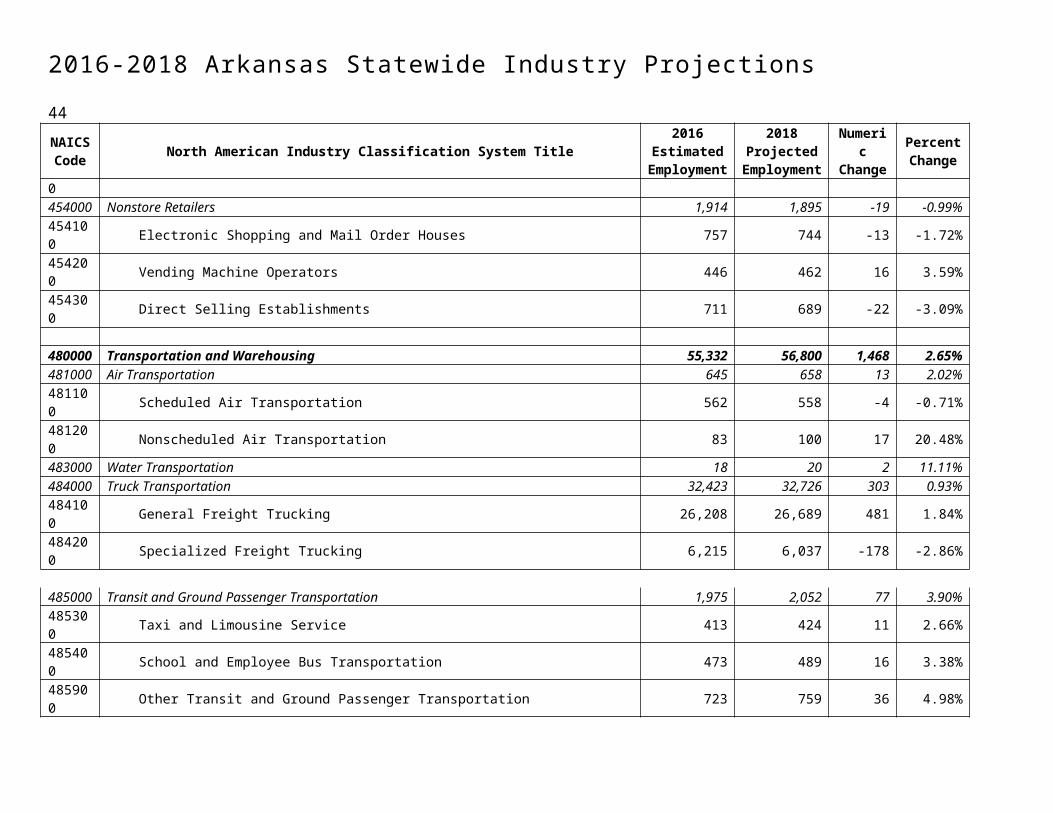
44
Top 20 Declining Occupations by Net GrowthSOC Code Standard Occupational Classification (SOC) Title
Estimated Employment
2016
Projected Employment
2018Net
GrowthPercent Growth
Annual Openings
due to Growth
Annual Openings due
to Replacement
s
Total Annual
Openings
47-5013 Service Unit Operators, Oil, Gas, and Mining 450 339 -111 -24.67% 0 15 1547-5071 Roustabouts, Oil and Gas 366 273 -93 -25.41% 0 6 6
51-4031 Cutting, Punching, and Press Machine Setters, Operators, and Tenders, Metal and Plastic 2,848 2,759 -89 -3.13% 0 39 39
51-7011 Cabinetmakers and Bench Carpenters 1,244 1,174 -70 -5.63% 0 10 1051-6042 Shoe Machine Operators and Tenders 541 486 -55 -10.17% 0 6 6
51-4122 Welding, Soldering, and Brazing Machine Setters, Operators, and Tenders 1,300 1,246 -54 -4.15% 0 36 36
51-4081 Multiple Machine Tool Setters, Operators, and Tenders, Metal and Plastic 1,503 1,453 -50 -3.33% 0 28 28
51-2022 Electrical and Electronic Equipment Assemblers 1,014 965 -49 -4.83% 0 13 1347-5011 Derrick Operators, Oil and Gas 156 110 -46 -29.49% 0 5 551-9196 Paper Goods Machine Setters, Operators, and Tenders 1,949 1,906 -43 -2.21% 0 34 3451-4111 Tool and Die Makers 535 493 -42 -7.85% 0 2 241-9041 Telemarketers 1,633 1,594 -39 -2.39% 0 36 3647-5081 Helpers--Extraction Workers 197 160 -37 -18.78% 0 2 253-7073 Wellhead Pumpers 162 125 -37 -22.84% 0 6 6
51-4072 Molding, Coremaking, and Casting Machine Setters, Operators, and Tenders, Metal and Plastic 1,678 1,643 -35 -2.09% 0 27 27
43-2011 Switchboard Operators, Including Answering Service 738 707 -31 -4.20% 0 10 1051-2021 Coil Winders, Tapers, and Finishers 531 503 -28 -5.27% 0 7 7
51-9032 Cutting and Slicing Machine Setters, Operators, and Tenders 1,478 1,450 -28 -1.89% 0 32 32
51-4121 Welders, Cutters, Solderers, and Brazers 5,058 5,032 -26 -0.51% 0 142 14227-3041 Editors 623 598 -25 -4.01% 0 22 22

Top 20 Fastest Declining Occupations by Percent Growth (Minimum Decline of 5)
SOC Code Standard Occupational Classification (SOC) Title
Estimated Employment
2016
Projected Employment
2018Net
GrowthPercent Growth
Annual Openings
due to Growth
Annual Openings due
to Replacement
s
Total Annual
Openings
47-5011 Derrick Operators, Oil and Gas 156 110 -46 -29.49% 0 5 547-5012 Rotary Drill Operators, Oil and Gas 68 48 -20 -29.41% 0 2 247-5071 Roustabouts, Oil and Gas 366 273 -93 -25.41% 0 6 647-5013 Service Unit Operators, Oil, Gas, and Mining 450 339 -111 -24.67% 0 15 1553-7073 Wellhead Pumpers 162 125 -37 -22.84% 0 6 647-5081 Helpers--Extraction Workers 197 160 -37 -18.78% 0 2 251-4192 Layout Workers, Metal and Plastic 41 35 -6 -14.63% 0 0 051-6042 Shoe Machine Operators and Tenders 541 486 -55 -10.17% 0 6 651-8092 Gas Plant Operators 137 125 -12 -8.76% 0 4 451-4111 Tool and Die Makers 535 493 -42 -7.85% 0 2 251-6062 Textile Cutting Machine Setters, Operators, and Tenders 91 85 -6 -6.59% 0 2 251-5111 Prepress Technicians and Workers 283 267 -16 -5.65% 0 4 451-7011 Cabinetmakers and Bench Carpenters 1,244 1,174 -70 -5.63% 0 10 1039-6011 Baggage Porters and Bellhops 163 154 -9 -5.52% 0 3 351-2021 Coil Winders, Tapers, and Finishers 531 503 -28 -5.27% 0 7 727-3022 Reporters and Correspondents 472 449 -23 -4.87% 0 16 1651-2022 Electrical and Electronic Equipment Assemblers 1,014 965 -49 -4.83% 0 13 1351-6021 Pressers, Textile, Garment, and Related Materials 398 380 -18 -4.52% 0 10 1043-2011 Switchboard Operators, Including Answering Service 738 707 -31 -4.20% 0 10 10
51-4193 Plating and Coating Machine Setters, Operators, and Tenders, Metal and Plastic 361 346 -15 -4.16% 0 9 9
45
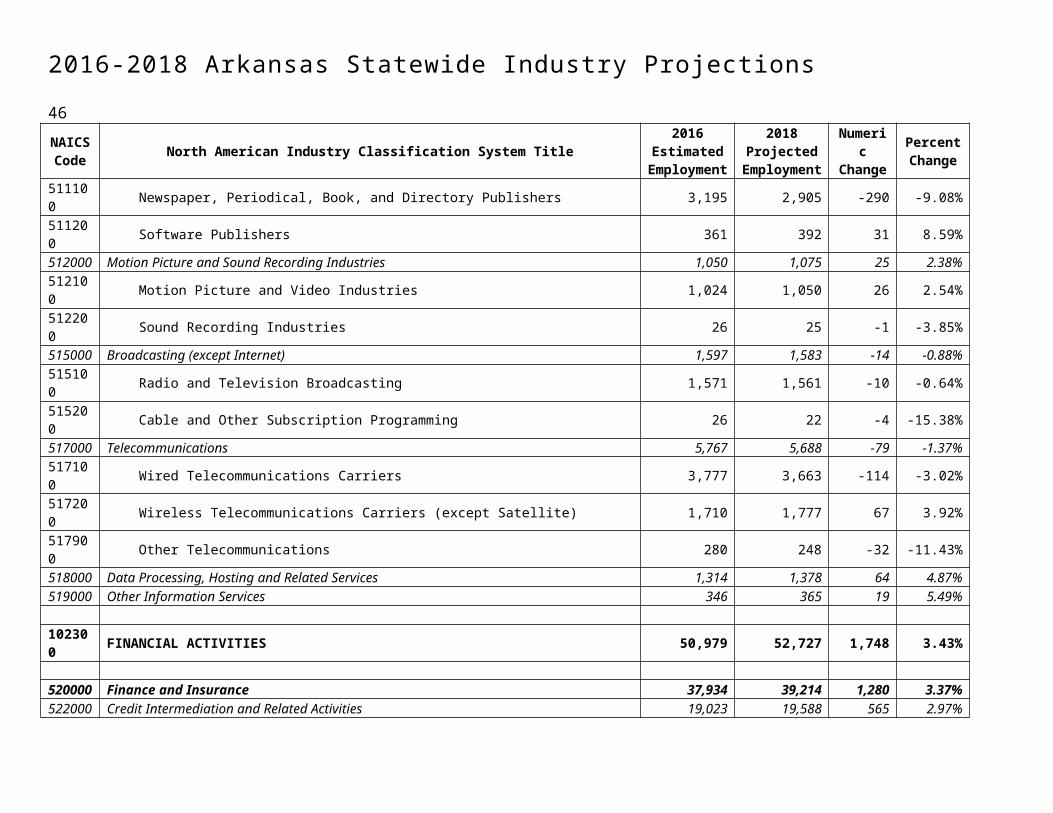
2016-2018 Arkansas Statewide Occupational Projections 46
SOC Code
Standard Occupational Classification(SOC) Title
Estimated Employment
2016
Projected Employment
2018Net
GrowthPercent Growth
Annual Openings
due to Growth
Annual Openings
due to Replacement
Total Annual
OpeningsEducation
CodeWork
Experience Code
JobTraining
Code
00-0000 TOTAL, ALL OCCUPATIONS 1,366,577 1,408,327 41,750 3.06% 21,696 31,902 53,59811-0000 MANAGEMENT OCCUPATIONS 132,670 136,551 3,881 2.93% 1,940 2,560 4,50011-1000 Top Executives 25,602 26,379 777 3.03% 388 570 95811-1021 General and Operations Managers 20,388 21,093 705 3.46% 352 479 831 3 1 6
11-2000 Advertising, Marketing, Promotions, Public Relations, and Sales Managers 5,214 5,413 199 3.82% 100 120 220
11-2011 Advertising and Promotions Managers 129 131 2 1.55% 1 4 5 3 2 611-2021 Marketing Managers 1,266 1,333 67 5.29% 34 28 62 3 1 611-2022 Sales Managers 3,468 3,585 117 3.37% 58 76 134 3 2 611-2031 Public Relations and Fundraising Managers 351 364 13 3.70% 6 12 18 3 1 611-3000 Operations Specialties Managers 12,361 12,777 416 3.37% 208 242 45011-3011 Administrative Services Managers 1,971 2,039 68 3.45% 34 32 66 3 2 611-3021 Computer and Information Systems Managers 2,142 2,251 109 5.09% 54 18 72 3 1 611-3031 Financial Managers 2,937 3,042 105 3.58% 52 64 116 3 1 611-3051 Industrial Production Managers 1,924 1,955 31 1.61% 16 50 66 3 1 611-3061 Purchasing Managers 513 527 14 2.73% 7 10 17 3 1 6
11-3071 Transportation, Storage, and Distribution Managers 1,474 1,515 41 2.78% 20 29 49 7 1 6
11-3111 Compensation and Benefits Managers 162 169 7 4.32% 4 4 8 3 1 611-3121 Human Resources Managers 859 888 29 3.38% 14 24 38 3 1 611-3131 Training and Development Managers 379 391 12 3.17% 6 10 16 3 1 611-9000 Other Management Occupations 89,493 91,982 2,489 2.78% 1,244 1,627 2,871
11-9013 Farmers, Ranchers, and Other Agricultural Managers 59,892 61,357 1,465 2.45% 732 992 1,724 7 1 6
11-9021 Construction Managers 2,713 2,841 128 4.72% 64 40 104 3 3 4
11-9031 Education Administrators, Preschool and Childcare Center/Program 682 705 23 3.37% 12 20 32 3 2 6
11-9032 Education Administrators, Elementary and Secondary School 2,363 2,444 81 3.43% 40 70 110 2 1 6
11-9033 Education Administrators, Postsecondary 1,693 1,737 44 2.60% 22 50 72 2 2 611-9039 Education Administrators, All Other 116 118 2 1.72% 1 4 5 3 2 611-9041 Architectural and Engineering Managers 554 559 5 0.90% 2 15 17 3 1 611-9051 Food Service Managers 2,335 2,435 100 4.28% 50 44 94 7 2 611-9061 Funeral Service Managers 462 475 13 2.81% 6 10 16 4 2 611-9081 Lodging Managers 514 527 13 2.53% 6 10 16 7 2 611-9111 Medical and Health Services Managers 3,415 3,533 118 3.46% 59 80 139 3 2 611-9121 Natural Sciences Managers 326 335 9 2.76% 4 6 10 3 1 6
*For training codes, refer to page 85.
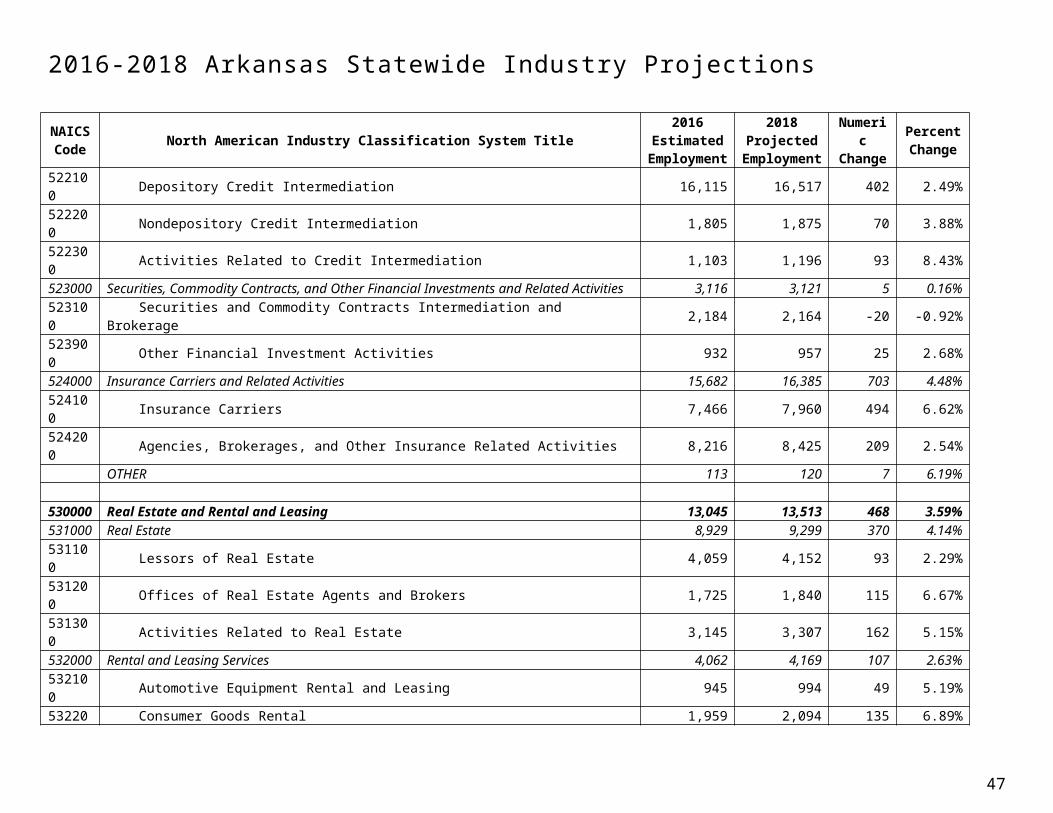
2016-2018 Arkansas Statewide Occupational ProjectionsSOC Code
Standard Occupational Classification(SOC) Title
Estimated Employment
2016
Projected Employment
2018Net
GrowthPercent Growth
Annual Openings
due to Growth
Annual Openings
due to Replacement
Total Annual
OpeningsEducation
CodeWork
Experience Code
JobTraining
Code
11-9131 Postmasters and Mail Superintendents 215 220 5 2.33% 2 4 6 7 2 4
11-9141 Property, Real Estate, and Community Association Managers 3,173 3,285 112 3.53% 56 50 106 7 2 6
11-9151 Social and Community Service Managers 1,472 1,518 46 3.13% 23 38 61 3 1 611-9161 Emergency Management Directors 116 118 2 1.72% 1 1 2 3 1 611-9199 Managers, All Other 9,452 9,775 323 3.42% 162 193 355 3 2 6
13-0000 BUSINESS AND FINANCIAL OPERATIONS OCCUPATIONS 52,442 54,480 2,038 3.89% 1,022 993 2,015
13-1000 Business Operations Specialists 36,891 38,312 1,421 3.85% 714 629 1,34313-1021 Buyers and Purchasing Agents, Farm Products 132 137 5 3.79% 2 2 4 3 3 3
13-1023 Purchasing Agents, Except Wholesale, Retail, and Farm Products 1,526 1,551 25 1.64% 12 42 54 3 3 3
13-1031 Claims Adjusters, Examiners, and Investigators 1,482 1,519 37 2.50% 18 34 52 7 3 313-1041 Compliance Officers 2,104 2,156 52 2.47% 26 27 53 3 3 413-1051 Cost Estimators 1,362 1,442 80 5.87% 40 37 77 3 3 613-1071 Human Resources Specialists 2,719 2,784 65 2.39% 32 62 94 3 3 613-1075 Labor Relations Specialists 836 830 -6 -0.72% 0 19 19 3 2 613-1081 Logisticians 997 1,039 42 4.21% 21 8 29 3 3 613-1111 Management Analysts 4,928 5,110 182 3.69% 91 58 149 3 2 613-1121 Meeting, Convention, and Event Planners 492 509 17 3.46% 8 5 13 3 3 613-1131 Fundraisers 320 336 16 5.00% 8 4 12 3 3 6
13-1141 Compensation, Benefits, and Job Analysis Specialists 685 704 19 2.77% 10 16 26 3 2 6
13-1151 Training and Development Specialists 2,850 2,923 73 2.56% 36 66 102 3 2 6
13-1161 Market Research Analysts and Marketing Specialists 2,933 3,099 166 5.66% 83 30 113 3 3 6
13-1199 Business Operations Specialists, All Other 9,692 10,107 415 4.28% 208 101 309 3 3 613-2000 Financial Specialists 15,551 16,168 617 3.97% 308 364 67213-2011 Accountants and Auditors 6,901 7,225 324 4.69% 162 180 342 3 3 613-2021 Appraisers and Assessors of Real Estate 913 937 24 2.63% 12 16 28 3 3 313-2031 Budget Analysts 472 480 8 1.69% 4 12 16 3 3 613-2041 Credit Analysts 330 347 17 5.15% 8 14 22 3 3 613-2051 Financial Analysts 868 879 11 1.27% 6 15 21 3 3 613-2052 Personal Financial Advisors 1,085 1,129 44 4.06% 22 26 48 3 3 313-2053 Insurance Underwriters 146 149 3 2.05% 2 2 4 3 3 413-2061 Financial Examiners 174 180 6 3.45% 3 4 7 3 3 413-2071 Credit Counselors 90 93 3 3.33% 2 2 4 3 3 4
*For training codes, refer to page 85. 47
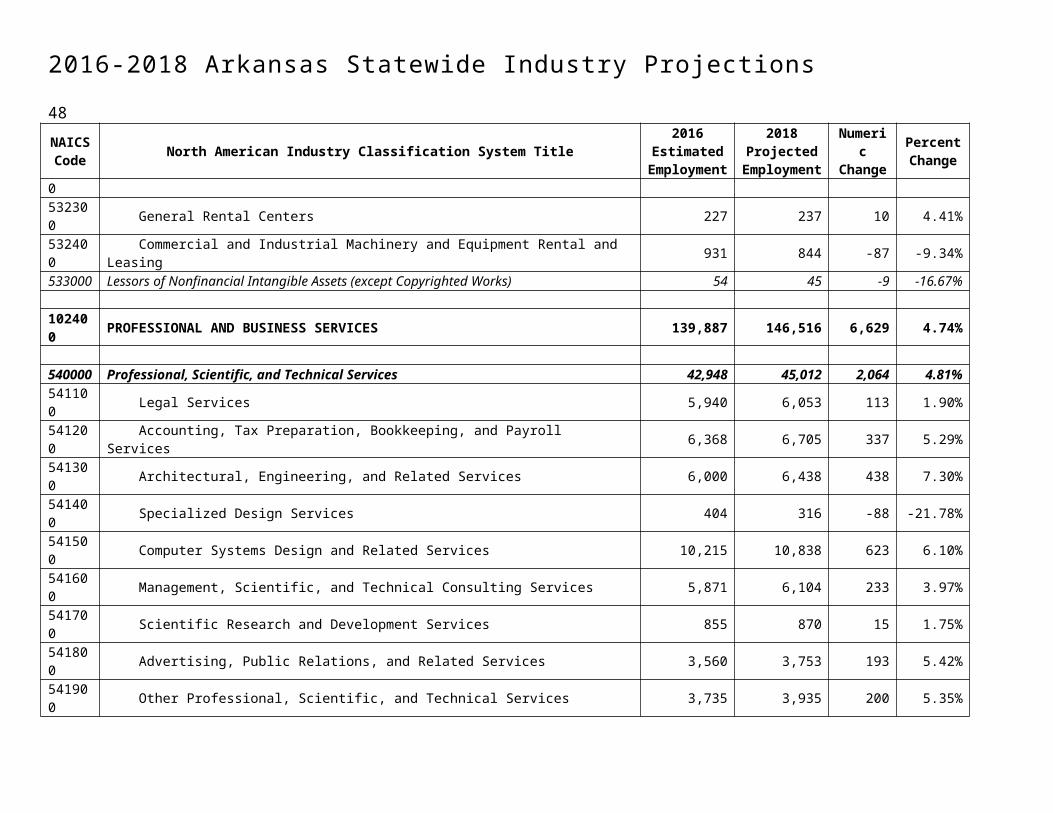
2016-2018 Arkansas Statewide Occupational Projections 48
SOC Code
Standard Occupational Classification(SOC) Title
Estimated Employment
2016
Projected Employment
2018Net
GrowthPercent Growth
Annual Openings
due to Growth
Annual Openings
due to Replacement
Total Annual
OpeningsEducation
CodeWork
Experience Code
JobTraining
Code
13-2072 Loan Officers 2,063 2,162 99 4.80% 50 35 85 3 3 4
13-2081 Tax Examiners and Collectors, and Revenue Agents 590 595 5 0.85% 2 22 24 3 3 4
13-2082 Tax Preparers 1,345 1,401 56 4.16% 28 30 58 7 3 413-2099 Financial Specialists, All Other 574 591 17 2.96% 8 4 12 3 3 4
15-0000 COMPUTER AND MATHEMATICAL OCCUPATIONS 24,483 25,604 1,121 4.58% 560 330 890
15-1100 Computer Occupations 23,961 25,055 1,094 4.57% 547 322 86915-1111 Computer and Information Research Scientists 22 22 0 0.00% 0 0 0 1 3 615-1121 Computer Systems Analysts 3,200 3,403 203 6.34% 102 36 138 3 3 615-1122 Information Security Analysts 2,283 2,446 163 7.14% 82 26 108 3 2 615-1131 Computer Programmers 3,455 3,538 83 2.40% 42 84 126 3 3 615-1132 Software Developers, Applications 2,017 2,136 119 5.90% 60 25 85 3 3 615-1133 Software Developers, Systems Software 1,051 1,063 12 1.14% 6 13 19 3 3 615-1134 Web Developers 673 723 50 7.43% 25 8 33 4 3 615-1141 Database Administrators 787 827 40 5.08% 20 14 34 3 2 615-1142 Network and Computer Systems Administrators 3,331 3,466 135 4.05% 68 37 105 3 3 615-1143 Computer Network Architects 1,424 1,496 72 5.06% 36 16 52 3 1 615-1151 Computer User Support Specialists 4,096 4,268 172 4.20% 86 46 132 6 3 615-1152 Computer Network Support Specialists 994 1,028 34 3.42% 17 11 28 4 3 615-1199 Computer Occupations, All Other 628 639 11 1.75% 6 7 13 3 3 615-2000 Mathematical Science Occupations 522 549 27 5.17% 14 8 2215-2031 Operations Research Analysts 286 298 12 4.20% 6 4 10 3 3 615-2041 Statisticians 179 189 10 5.59% 5 3 8 2 3 6
17-0000 ARCHITECTURE AND ENGINEERING OCCUPATIONS 11,804 12,116 312 2.64% 162 282 444
17-1000 Architects, Surveyors, and Cartographers 1,509 1,587 78 5.17% 39 34 7317-1011 Architects, Except Landscape and Naval 773 825 52 6.73% 26 13 39 3 3 217-1012 Landscape Architects 109 115 6 5.50% 3 2 5 3 3 217-1021 Cartographers and Photogrammetrists 59 64 5 8.47% 2 2 4 3 3 617-1022 Surveyors 568 583 15 2.64% 8 17 25 3 2 617-2000 Engineers 6,872 7,029 157 2.28% 83 183 26617-2041 Chemical Engineers 208 210 2 0.96% 1 6 7 3 3 617-2051 Civil Engineers 1,317 1,376 59 4.48% 30 38 68 3 3 617-2061 Computer Hardware Engineers 201 211 10 4.98% 5 4 9 3 3 617-2071 Electrical Engineers 769 774 5 0.65% 2 17 19 3 3 6
*For training codes, refer to page 85.
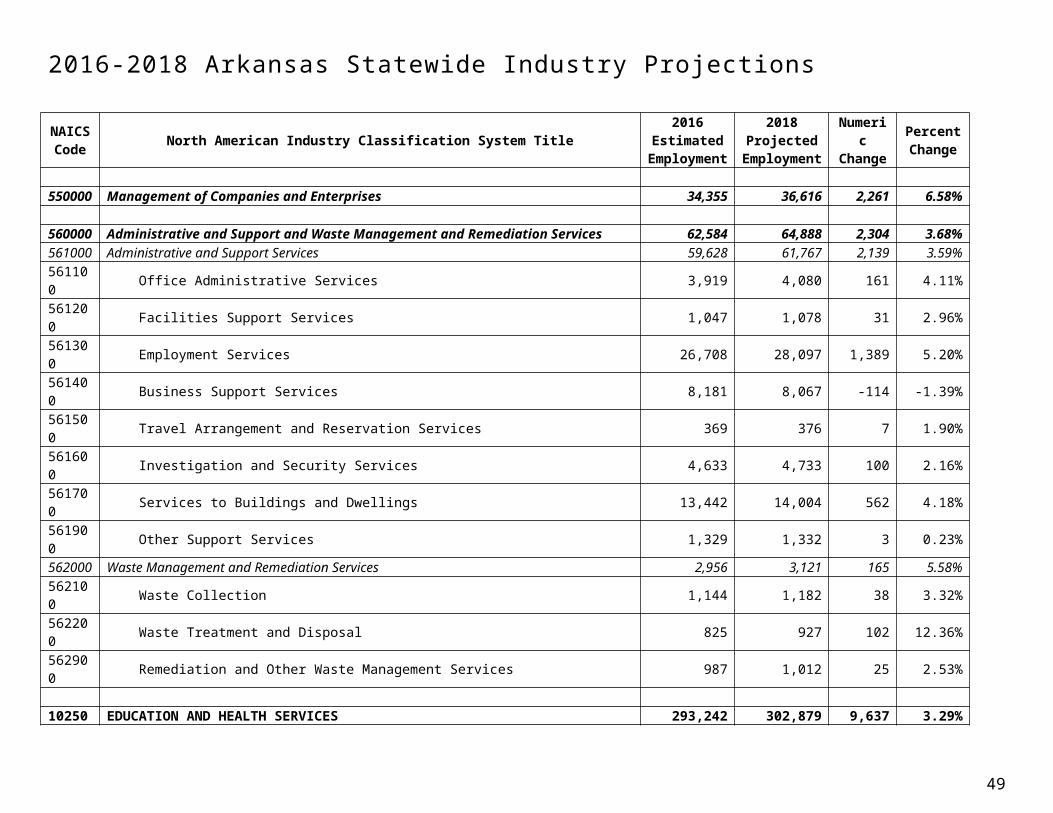
2016-2018 Arkansas Statewide Occupational ProjectionsSOC Code
Standard Occupational Classification(SOC) Title
Estimated Employment
2016
Projected Employment
2018Net
GrowthPercent Growth
Annual Openings
due to Growth
Annual Openings
due to Replacement
Total Annual
OpeningsEducation
CodeWork
Experience Code
JobTraining
Code
17-2072 Electronics Engineers, Except Computer 261 269 8 3.07% 4 6 10 3 3 617-2081 Environmental Engineers 169 179 10 5.92% 5 5 10 3 3 6
17-2111 Health and Safety Engineers, Except Mining Safety Engineers and Inspectors 103 108 5 4.85% 2 3 5 3 3 6
17-2112 Industrial Engineers 1,574 1,592 18 1.14% 9 44 53 3 3 617-2131 Materials Engineers 57 58 1 1.75% 0 2 2 3 3 617-2141 Mechanical Engineers 1,217 1,225 8 0.66% 4 38 42 3 3 617-2199 Engineers, All Other 541 568 27 4.99% 14 10 24 3 3 6
17-3000 Drafters, Engineering Technicians, and Mapping Technicians 3,423 3,500 77 2.25% 40 65 105
17-3011 Architectural and Civil Drafters 477 497 20 4.19% 10 6 16 4 3 617-3012 Electrical and Electronics Drafters 143 152 9 6.29% 4 2 6 4 3 617-3013 Mechanical Drafters 322 330 8 2.48% 4 4 8 4 3 617-3019 Drafters, All Other 66 67 1 1.52% 0 1 1 4 3 617-3022 Civil Engineering Technicians 264 279 15 5.68% 8 6 14 4 3 6
17-3023 Electrical and Electronics Engineering Technicians 550 555 5 0.91% 2 13 15 4 3 6
17-3025 Environmental Engineering Technicians 189 194 5 2.65% 2 4 6 4 3 617-3026 Industrial Engineering Technicians 315 316 1 0.32% 0 8 8 4 3 617-3027 Mechanical Engineering Technicians 217 220 3 1.38% 2 5 7 4 3 6
17-3029 Engineering Technicians, Except Drafters, All Other 339 336 -3 -0.88% 0 8 8 4 3 6
17-3031 Surveying and Mapping Technicians 460 471 11 2.39% 6 6 12 7 3 4
19-0000 LIFE, PHYSICAL, AND SOCIAL SCIENCE OCCUPATIONS 7,897 8,080 183 2.32% 96 221 317
19-1000 Life Scientists 2,247 2,271 24 1.07% 14 70 8419-1011 Animal Scientists 65 65 0 0.00% 0 2 2 3 3 619-1012 Food Scientists and Technologists 357 368 11 3.08% 6 12 18 3 3 619-1013 Soil and Plant Scientists 136 138 2 1.47% 1 4 5 3 3 619-1021 Biochemists and Biophysicists 77 80 3 3.90% 2 2 4 1 3 619-1022 Microbiologists 186 188 2 1.08% 1 4 5 3 3 619-1023 Zoologists and Wildlife Biologists 202 204 2 0.99% 1 5 6 3 3 619-1031 Conservation Scientists 253 258 5 1.98% 2 10 12 3 3 619-1032 Foresters 391 391 0 0.00% 0 15 15 3 3 619-1041 Epidemiologists 50 51 1 2.00% 0 2 2 2 3 619-1042 Medical Scientists, Except Epidemiologists 231 234 3 1.30% 2 7 9 1 3 619-2000 Physical Scientists 1,086 1,107 21 1.93% 12 26 38
*For training codes, refer to page 85. 49
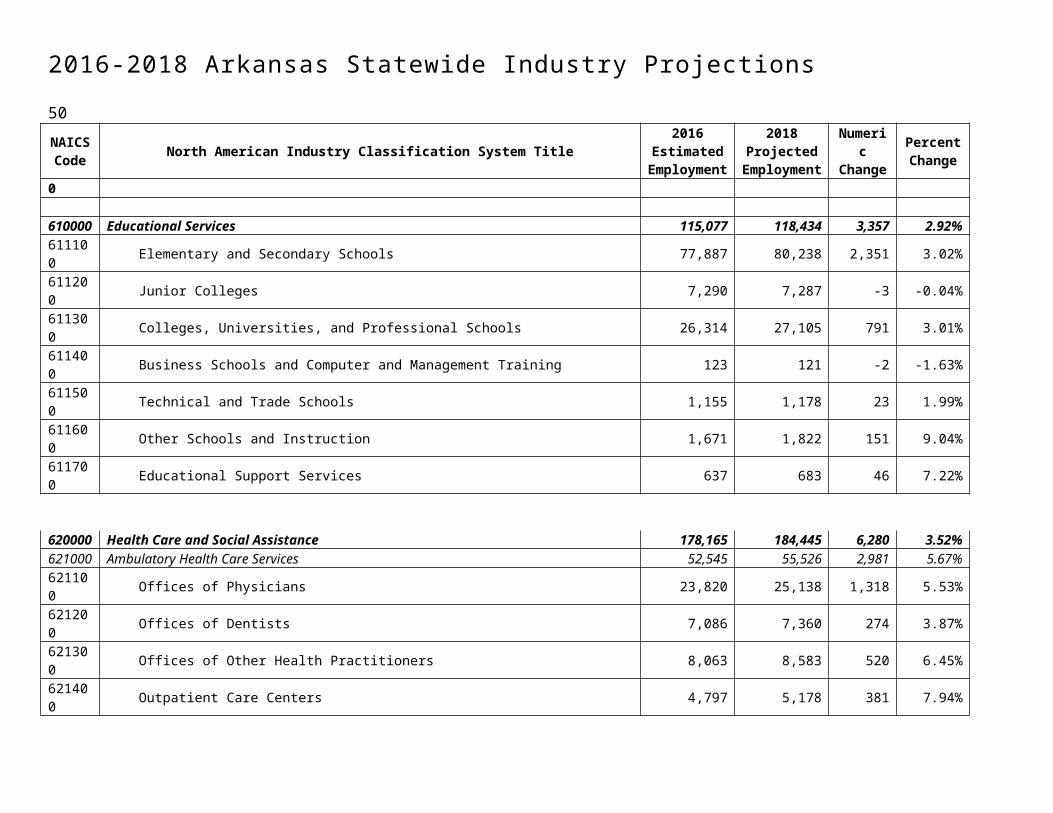
2016-2018 Arkansas Statewide Occupational Projections 50
SOC Code
Standard Occupational Classification(SOC) Title
Estimated Employment
2016
Projected Employment
2018Net
GrowthPercent Growth
Annual Openings
due to Growth
Annual Openings
due to Replacement
Total Annual
OpeningsEducation
CodeWork
Experience Code
JobTraining
Code
19-2021 Atmospheric and Space Scientists 32 32 0 0.00% 0 0 0 3 3 619-2031 Chemists 547 554 7 1.28% 4 12 16 3 3 6
19-2041 Environmental Scientists and Specialists, Including Health 312 325 13 4.17% 6 9 15 3 3 6
19-2042 Geoscientists, Except Hydrologists and Geographers 71 71 0 0.00% 0 2 2 3 3 6
19-2043 Hydrologists 27 28 1 3.70% 0 1 1 3 3 619-2099 Physical Scientists, All Other 49 47 -2 -4.08% 0 0 0 3 3 619-3000 Social Scientists and Related Workers 1,500 1,553 53 3.53% 26 26 5219-3011 Economists 95 98 3 3.16% 2 2 4 2 3 619-3022 Survey Researchers 60 64 4 6.67% 2 0 2 2 3 619-3031 Clinical, Counseling, and School Psychologists 794 831 37 4.66% 18 16 34 1 3 219-3039 Psychologists, All Other 107 108 1 0.93% 0 2 2 2 3 219-3051 Urban and Regional Planners 104 106 2 1.92% 1 2 3 2 3 619-3091 Anthropologists and Archeologists 23 24 1 4.35% 0 0 0 2 3 619-3099 Social Scientists and Related Workers, All Other 300 304 4 1.33% 2 3 5 3 3 6
19-4000 Life, Physical, and Social Science Technicians 3,064 3,149 85 2.77% 43 100 143
19-4011 Agricultural and Food Science Technicians 663 682 19 2.87% 10 17 27 4 3 419-4021 Biological Technicians 597 605 8 1.34% 4 18 22 3 3 619-4031 Chemical Technicians 675 704 29 4.30% 14 20 34 4 3 4
19-4091 Environmental Science and Protection Technicians, Including Health 169 175 6 3.55% 3 7 10 4 3 6
19-4092 Forensic Science Technicians 149 158 9 6.04% 4 6 10 3 3 419-4093 Forest and Conservation Technicians 255 255 0 0.00% 0 10 10 4 3 6
19-4099 Life, Physical, and Social Science Technicians, All Other 441 455 14 3.17% 7 18 25 4 3 6
21-0000 COMMUNITY AND SOCIAL SERVICE OCCUPATIONS 23,125 24,164 1,039 4.49% 520 475 995
21-1000 Counselors, Social Workers, and Other Community and Social Service Specialists 14,092 14,558 466 3.31% 233 283 516
21-1011 Substance Abuse and Behavioral Disorder Counselors 735 774 39 5.31% 20 14 34 3 3 6
21-1012 Educational, Guidance, School, and Vocational Counselors 2,181 2,249 68 3.12% 34 44 78 2 3 6
21-1013 Marriage and Family Therapists 77 80 3 3.90% 2 2 4 2 3 221-1014 Mental Health Counselors 697 723 26 3.73% 13 14 27 2 3 2
*For training codes, refer to page 85.
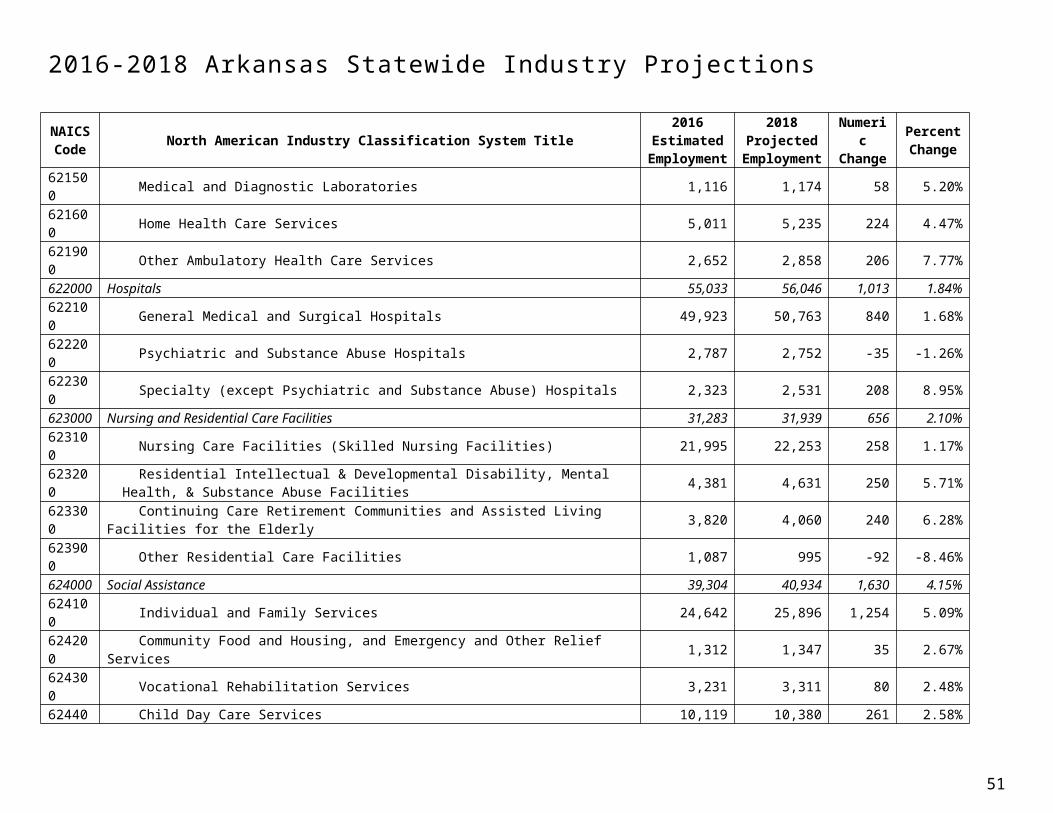
2016-2018 Arkansas Statewide Occupational ProjectionsSOC Code
Standard Occupational Classification(SOC) Title
Estimated Employment
2016
Projected Employment
2018Net
GrowthPercent Growth
Annual Openings
due to Growth
Annual Openings
due to Replacement
Total Annual
OpeningsEducation
CodeWork
Experience Code
JobTraining
Code
21-1015 Rehabilitation Counselors 278 287 9 3.24% 4 6 10 2 3 621-1019 Counselors, All Other 126 130 4 3.17% 2 2 4 2 3 621-1021 Child, Family, and School Social Workers 1,421 1,451 30 2.11% 15 33 48 3 3 621-1022 Healthcare Social Workers 1,345 1,400 55 4.09% 28 32 60 2 3 6
21-1023 Mental Health and Substance Abuse Social Workers 738 767 29 3.93% 14 17 31 3 3 6
21-1029 Social Workers, All Other 615 620 5 0.81% 2 14 16 3 3 621-1091 Health Educators 388 399 11 2.84% 6 7 13 3 3 6
21-1092 Probation Officers and Correctional Treatment Specialists 877 892 15 1.71% 8 16 24 3 3 5
21-1093 Social and Human Service Assistants 3,880 4,024 144 3.71% 72 70 142 7 3 521-1094 Community Health Workers 422 440 18 4.27% 9 8 17 7 3 5
21-1099 Community and Social Service Specialists, All Other 312 322 10 3.21% 5 6 11 2 3 6
21-2000 Religious Workers 9,033 9,606 573 6.34% 286 192 47821-2011 Clergy 7,887 8,388 501 6.35% 250 166 416 3 3 423-0000 LEGAL OCCUPATIONS 8,002 8,224 222 2.77% 111 126 23723-1000 Lawyers, Judges, and Related Workers 4,996 5,139 143 2.86% 72 66 13823-1011 Lawyers 4,130 4,263 133 3.22% 66 54 120 1 3 623-1012 Judicial Law Clerks 76 76 0 0.00% 0 2 2 1 3 6
23-1021 Administrative Law Judges, Adjudicators, and Hearing Officers 422 427 5 1.18% 2 6 8 1 1 5
23-1022 Arbitrators, Mediators, and Conciliators 38 39 1 2.63% 0 0 0 3 2 423-1023 Judges, Magistrate Judges, and Magistrates 330 334 4 1.21% 2 4 6 1 1 523-2000 Legal Support Workers 3,006 3,085 79 2.63% 40 60 10023-2011 Paralegals and Legal Assistants 1,562 1,618 56 3.59% 28 31 59 4 3 623-2091 Court Reporters 225 226 1 0.44% 0 4 4 5 3 523-2093 Title Examiners, Abstractors, and Searchers 956 973 17 1.78% 8 19 27 7 3 523-2099 Legal Support Workers, All Other 263 268 5 1.90% 2 5 7 7 3 5
25-0000 EDUCATION, TRAINING, AND LIBRARY OCCUPATIONS 77,252 79,793 2,541 3.29% 1,271 1,621 2,892
25-1000 Postsecondary Teachers 15,276 15,709 433 2.83% 217 249 46625-1011 Business Teachers, Postsecondary 866 889 23 2.66% 12 14 26 1 3 625-1021 Computer Science Teachers, Postsecondary 366 375 9 2.46% 4 6 10 1 3 625-1022 Mathematical Science Teachers, Postsecondary 544 560 16 2.94% 8 9 17 1 3 625-1031 Architecture Teachers, Postsecondary 105 108 3 2.86% 2 2 4 1 3 625-1032 Engineering Teachers, Postsecondary 366 379 13 3.55% 6 6 12 1 3 6
*For training codes, refer to page 85. 51
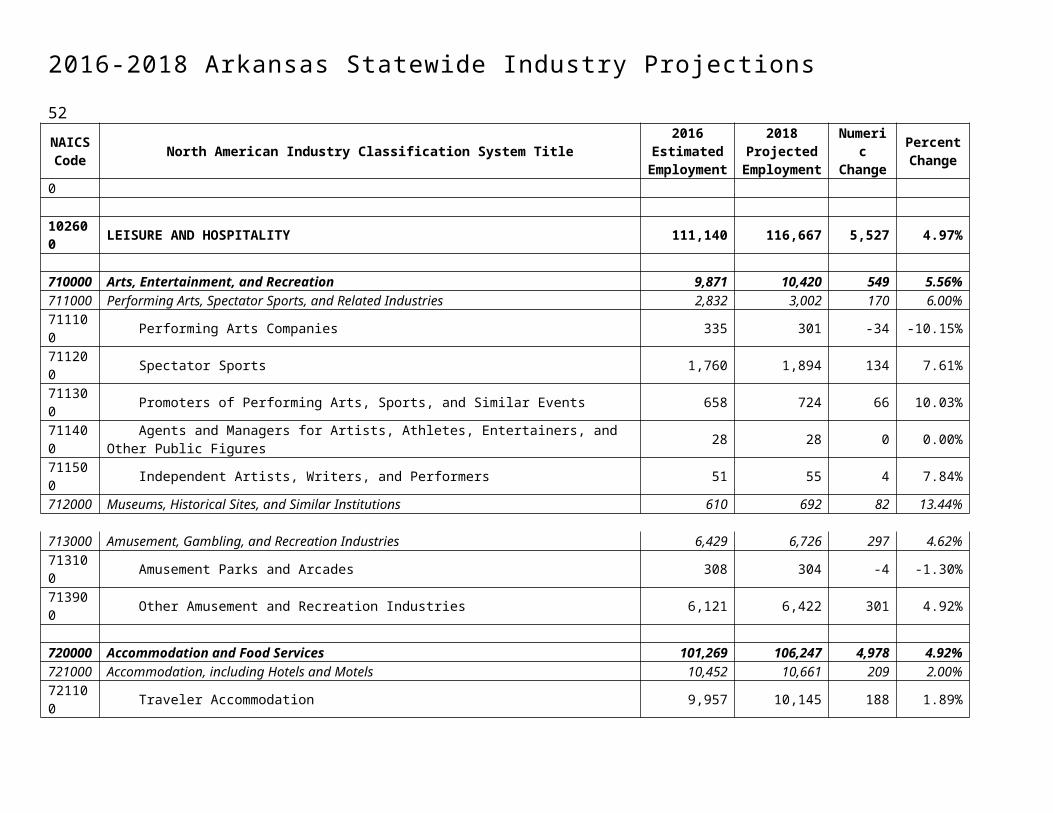
2016-2018 Arkansas Statewide Occupational Projections 52
SOC Code
Standard Occupational Classification(SOC) Title
Estimated Employment
2016
Projected Employment
2018Net
GrowthPercent Growth
Annual Openings
due to Growth
Annual Openings
due to Replacement
Total Annual
OpeningsEducation
CodeWork
Experience Code
JobTraining
Code
25-1041 Agricultural Sciences Teachers, Postsecondary 279 286 7 2.51% 4 4 8 1 3 625-1042 Biological Science Teachers, Postsecondary 449 465 16 3.56% 8 8 16 1 3 6
25-1051 Atmospheric, Earth, Marine, and Space Sciences Teachers, Postsecondary 95 96 1 1.05% 0 2 2 1 3 6
25-1052 Chemistry Teachers, Postsecondary 261 271 10 3.83% 5 4 9 1 3 6
25-1053 Environmental Science Teachers, Postsecondary 62 64 2 3.23% 1 1 2 1 3 6
25-1054 Physics Teachers, Postsecondary 132 137 5 3.79% 2 2 4 1 3 6
25-1061 Anthropology and Archeology Teachers, Postsecondary 147 151 4 2.72% 2 2 4 1 3 6
25-1062 Area, Ethnic, and Cultural Studies Teachers, Postsecondary 37 39 2 5.41% 1 0 1 1 3 6
25-1063 Economics Teachers, Postsecondary 118 121 3 2.54% 2 2 4 1 3 625-1064 Geography Teachers, Postsecondary 44 46 2 4.55% 1 0 1 1 3 625-1065 Political Science Teachers, Postsecondary 129 133 4 3.10% 2 2 4 1 3 625-1066 Psychology Teachers, Postsecondary 282 292 10 3.55% 5 4 9 1 3 625-1067 Sociology Teachers, Postsecondary 166 171 5 3.01% 2 2 4 1 3 6
25-1069 Social Sciences Teachers, Postsecondary, All Other 55 56 1 1.82% 0 1 1 1 3 6
25-1071 Health Specialties Teachers, Postsecondary 1,382 1,437 55 3.98% 28 22 50 1 2 6
25-1072 Nursing Instructors and Teachers, Postsecondary 663 689 26 3.92% 13 11 24 2 2 6
25-1081 Education Teachers, Postsecondary 888 912 24 2.70% 12 14 26 1 2 6
25-1111 Criminal Justice and Law Enforcement Teachers, Postsecondary 145 152 7 4.83% 4 2 6 1 3 6
25-1112 Law Teachers, Postsecondary 154 162 8 5.19% 4 2 6 1 3 625-1113 Social Work Teachers, Postsecondary 143 148 5 3.50% 2 2 4 1 3 625-1121 Art, Drama, and Music Teachers, Postsecondary 755 778 23 3.05% 12 12 24 2 3 625-1122 Communications Teachers, Postsecondary 368 378 10 2.72% 5 6 11 1 3 6
25-1123 English Language and Literature Teachers, Postsecondary 655 670 15 2.29% 8 10 18 1 3 6
25-1124 Foreign Language and Literature Teachers, Postsecondary 239 246 7 2.93% 4 4 8 1 3 6
25-1125 History Teachers, Postsecondary 299 306 7 2.34% 4 5 9 1 3 6
25-1126 Philosophy and Religion Teachers, Postsecondary 217 224 7 3.23% 4 4 8 1 3 6
25-1191 Graduate Teaching Assistants 1,688 1,723 35 2.07% 18 28 46 3 3 625-1192 Home Economics Teachers, Postsecondary 79 78 -1 -1.27% 0 2 2 2 3 6
*For training codes, refer to page 85.
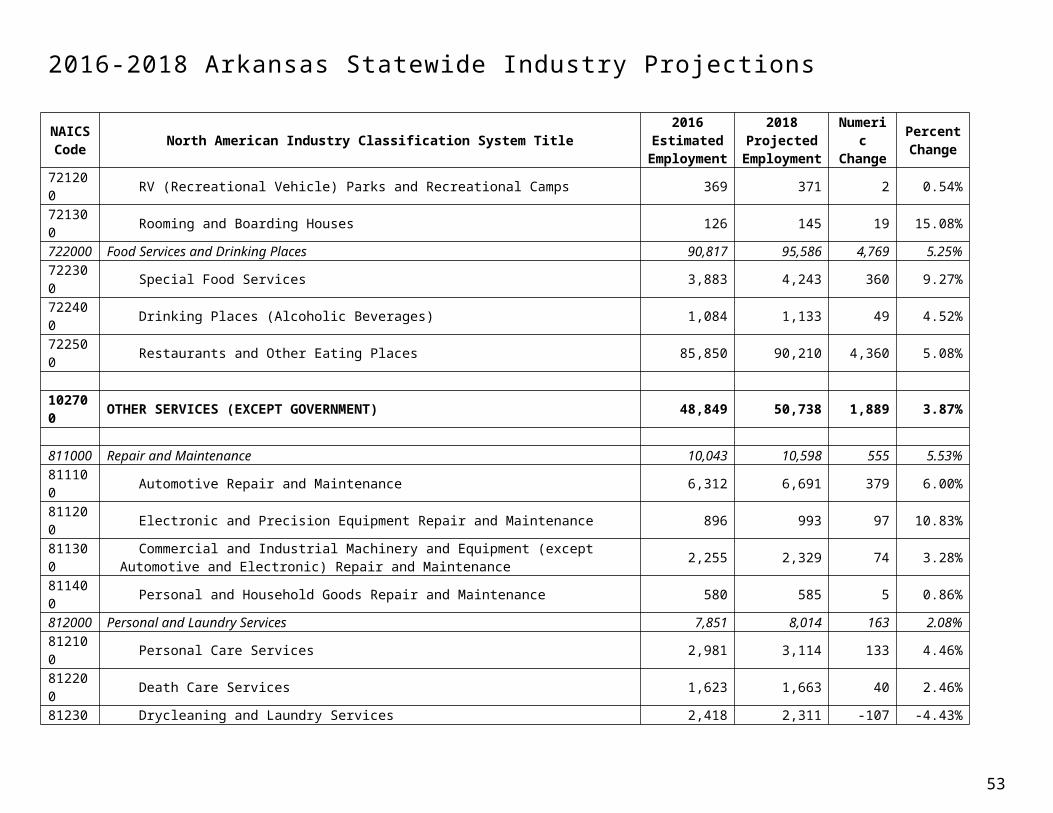
2016-2018 Arkansas Statewide Occupational ProjectionsSOC Code
Standard Occupational Classification(SOC) Title
Estimated Employment
2016
Projected Employment
2018Net
GrowthPercent Growth
Annual Openings
due to Growth
Annual Openings
due to Replacement
Total Annual
OpeningsEducation
CodeWork
Experience Code
JobTraining
Code
25-1193 Recreation and Fitness Studies Teachers, Postsecondary 231 238 7 3.03% 4 4 8 1 3 6
25-1194 Vocational Education Teachers, Postsecondary 1,368 1,389 21 1.54% 10 22 32 3 2 625-1199 Postsecondary Teachers, All Other 1,448 1,488 40 2.76% 20 24 44 1 3 6
25-2000 Preschool, Primary, Secondary, and Special Education School Teachers 37,478 38,727 1,249 3.33% 624 878 1,502
25-2011 Preschool Teachers, Except Special Education 2,514 2,590 76 3.02% 38 73 111 4 3 6
25-2012 Kindergarten Teachers, Except Special Education 2,029 2,099 70 3.45% 35 59 94 3 3 2
25-2021 Elementary School Teachers, Except Special Education 11,853 12,257 404 3.41% 202 263 465 3 3 2
25-2022 Middle School Teachers, Except Special and Career/Technical Education 6,228 6,438 210 3.37% 105 138 243 3 3 2
25-2023 Career/Technical Education Teachers, Middle School 178 184 6 3.37% 3 4 7 3 2 2
25-2031 Secondary School Teachers, Except Special and Career/Technical Education 10,233 10,574 341 3.33% 170 255 425 3 3 2
25-2032 Career/Technical Education Teachers, Secondary School 893 913 20 2.24% 10 22 32 3 2 2
25-2051 Special Education Teachers, Preschool 464 484 20 4.31% 10 8 18 3 3 2
25-2052 Special Education Teachers, Kindergarten and Elementary School 1,053 1,088 35 3.32% 18 19 37 3 3 2
25-2053 Special Education Teachers, Middle School 633 654 21 3.32% 10 12 22 3 3 225-2054 Special Education Teachers, Secondary School 1,263 1,305 42 3.33% 21 23 44 3 3 225-2059 Special Education Teachers, All Other 137 141 4 2.92% 2 2 4 3 3 225-3000 Other Teachers and Instructors 10,448 10,852 404 3.87% 202 190 392
25-3011 Adult Basic and Secondary Education and Literacy Teachers and Instructors 1,154 1,176 22 1.91% 11 21 32 3 3 2
25-3021 Self-Enrichment Education Teachers 884 931 47 5.32% 24 16 40 7 2 6
25-3097 Teachers and Instructors, All Other, Except Substitute Teachers 1,386 1,429 43 3.10% 22 25 47 3 3 2
25-4000 Librarians, Curators, and Archivists 2,434 2,495 61 2.51% 30 75 10525-4011 Archivists 87 89 2 2.30% 1 2 3 2 3 625-4012 Curators 69 75 6 8.70% 3 2 5 2 3 625-4013 Museum Technicians and Conservators 87 96 9 10.34% 4 2 6 3 3 625-4021 Librarians 1,463 1,488 25 1.71% 12 30 42 2 3 625-4031 Library Technicians 728 747 19 2.61% 10 38 48 5 3 6
25-9000 Other Education, Training, and Library Occupations 11,616 12,010 394 3.39% 197 228 425
*For training codes, refer to page 85. 53
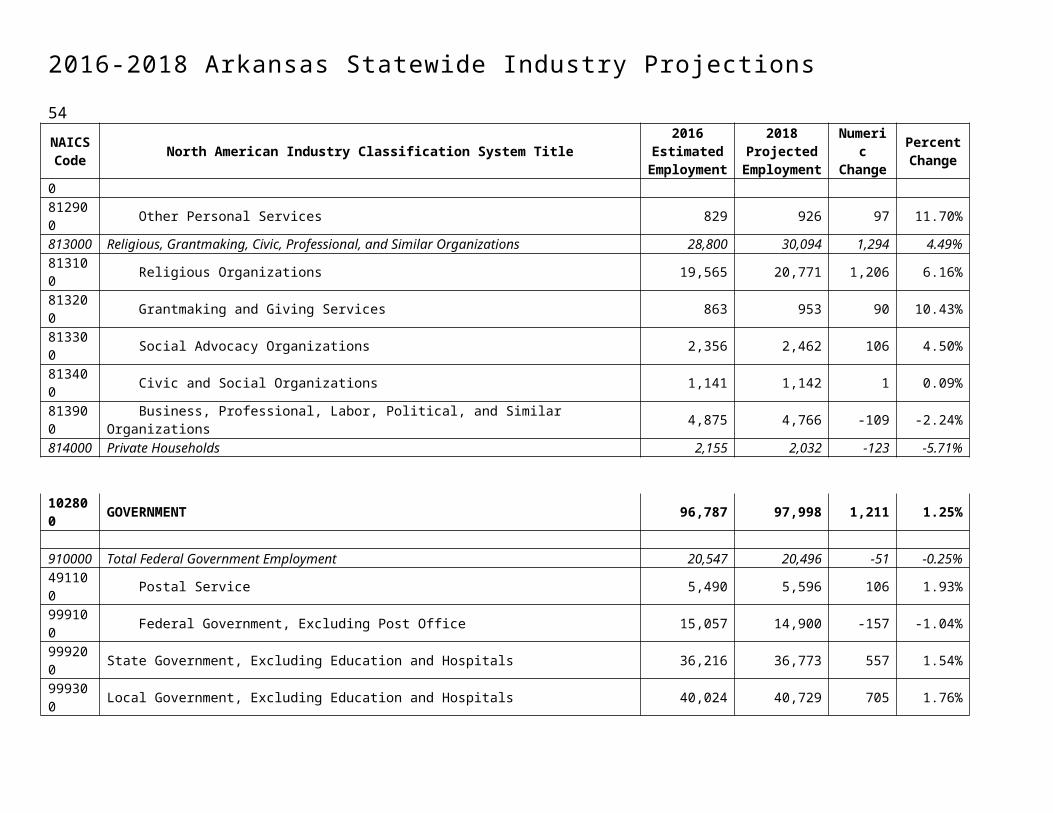
2016-2018 Arkansas Statewide Occupational Projections 54
SOC Code
Standard Occupational Classification(SOC) Title
Estimated Employment
2016
Projected Employment
2018Net
GrowthPercent Growth
Annual Openings
due to Growth
Annual Openings
due to Replacement
Total Annual
OpeningsEducation
CodeWork
Experience Code
JobTraining
Code
25-9011 Audio-Visual and Multimedia Collections Specialists 151 155 4 2.65% 2 1 3 3 2 6
25-9021 Farm and Home Management Advisors 297 310 13 4.38% 6 2 8 2 3 625-9031 Instructional Coordinators 1,651 1,705 54 3.27% 27 10 37 2 1 625-9041 Teacher Assistants 9,343 9,661 318 3.40% 159 214 373 6 3 6
25-9099 Education, Training, and Library Workers, All Other 174 179 5 2.87% 2 1 3 3 3 6
27-0000 ARTS, DESIGN, ENTERTAINMENT, SPORTS, AND MEDIA OCCUPATIONS 16,065 16,444 379 2.36% 235 390 625
27-1000 Art and Design Workers 3,515 3,547 32 0.91% 30 80 11027-1011 Art Directors 243 243 0 0.00% 0 4 4 3 1 6
27-1013 Fine Artists, Including Painters, Sculptors, and Illustrators 165 171 6 3.64% 3 3 6 3 3 3
27-1014 Multimedia Artists and Animators 151 154 3 1.99% 2 3 5 3 3 427-1019 Artists and Related Workers, All Other 23 23 0 0.00% 0 0 0 8 3 327-1021 Commercial and Industrial Designers 112 117 5 4.46% 2 2 4 3 3 627-1023 Floral Designers 425 428 3 0.71% 2 10 12 7 3 427-1024 Graphic Designers 1,279 1,258 -21 -1.64% 0 30 30 3 3 627-1025 Interior Designers 253 250 -3 -1.19% 0 6 6 3 3 627-1026 Merchandise Displayers and Window Trimmers 568 586 18 3.17% 9 14 23 7 3 4
27-2000 Entertainers and Performers, Sports and Related Workers 6,568 6,846 278 4.23% 142 194 336
27-2012 Producers and Directors 359 366 7 1.95% 4 11 15 3 2 627-2021 Athletes and Sports Competitors 177 187 10 5.65% 5 6 11 8 3 327-2022 Coaches and Scouts 1,896 1,962 66 3.48% 33 64 97 3 3 627-2041 Music Directors and Composers 1,823 1,915 92 5.05% 46 50 96 3 2 6
27-2099 Entertainers and Performers, Sports and Related Workers, All Other 25 25 0 0.00% 0 1 1 8 3 5
27-3000 Media and Communication Workers 4,337 4,368 31 0.71% 44 84 12827-3011 Radio and Television Announcers 340 332 -8 -2.35% 0 9 9 3 3 527-3021 Broadcast News Analysts 46 46 0 0.00% 0 2 2 3 3 627-3022 Reporters and Correspondents 472 449 -23 -4.87% 0 16 16 3 3 627-3031 Public Relations Specialists 1,818 1,866 48 2.64% 24 19 43 3 3 627-3041 Editors 623 598 -25 -4.01% 0 22 22 3 2 627-3042 Technical Writers 196 200 4 2.04% 2 4 6 3 2 527-3043 Writers and Authors 559 575 16 2.86% 8 8 16 3 3 427-3091 Interpreters and Translators 209 225 16 7.66% 8 2 10 3 3 5
*For training codes, refer to page 85.

2016-2018 Arkansas Statewide Occupational ProjectionsSOC Code
Standard Occupational Classification(SOC) Title
Estimated Employment
2016
Projected Employment
2018Net
GrowthPercent Growth
Annual Openings
due to Growth
Annual Openings
due to Replacement
Total Annual
OpeningsEducation
CodeWork
Experience Code
JobTraining
Code
27-4000 Media and Communication Equipment Workers 1,645 1,683 38 2.31% 20 32 52
27-4011 Audio and Video Equipment Technicians 241 248 7 2.90% 4 4 8 5 3 527-4012 Broadcast Technicians 131 131 0 0.00% 0 2 2 4 3 527-4014 Sound Engineering Technicians 42 42 0 0.00% 0 0 0 5 3 527-4021 Photographers 956 978 22 2.30% 11 23 34 7 3 3
27-4031 Camera Operators, Television, Video, and Motion Picture 99 101 2 2.02% 1 0 1 3 3 6
27-4032 Film and Video Editors 138 146 8 5.80% 4 1 5 3 3 6
29-0000 HEALTHCARE PRACTITIONERS AND TECHNICAL OCCUPATIONS 77,976 80,781 2,805 3.60% 1,410 1,629 3,039
29-1000 Health Diagnosing and Treating Practitioners 45,372 47,112 1,740 3.83% 870 995 1,86529-1011 Chiropractors 536 554 18 3.36% 9 10 19 1 3 629-1021 Dentists, General 977 1,019 42 4.30% 21 16 37 1 3 629-1029 Dentists, All Other Specialists 39 38 -1 -2.56% 0 0 0 1 3 229-1031 Dietitians and Nutritionists 592 615 23 3.89% 12 4 16 3 3 229-1041 Optometrists 451 475 24 5.32% 12 15 27 1 3 629-1051 Pharmacists 3,353 3,459 106 3.16% 53 72 125 1 3 629-1061 Anesthesiologists 192 203 11 5.73% 6 5 11 1 3 229-1062 Family and General Practitioners 1,782 1,845 63 3.54% 32 46 78 1 3 229-1063 Internists, General 364 376 12 3.30% 6 10 16 1 3 229-1064 Obstetricians and Gynecologists 144 152 8 5.56% 4 4 8 1 3 229-1065 Pediatricians, General 184 191 7 3.80% 4 4 8 1 3 229-1066 Psychiatrists 360 376 16 4.44% 8 10 18 1 3 229-1067 Surgeons 639 676 37 5.79% 18 16 34 1 3 229-1069 Physicians and Surgeons, All Other 2,733 2,828 95 3.48% 48 70 118 1 3 229-1071 Physician Assistants 417 450 33 7.91% 16 8 24 2 3 629-1081 Podiatrists 69 70 1 1.45% 0 1 1 1 3 229-1122 Occupational Therapists 970 1,021 51 5.26% 26 14 40 2 3 629-1123 Physical Therapists 2,069 2,193 124 5.99% 62 50 112 1 3 629-1124 Radiation Therapists 230 242 12 5.22% 6 5 11 4 3 629-1125 Recreational Therapists 109 111 2 1.83% 1 2 3 3 3 629-1126 Respiratory Therapists 1,094 1,124 30 2.74% 15 22 37 4 3 629-1127 Speech-Language Pathologists 1,892 1,997 105 5.55% 52 44 96 2 3 629-1128 Exercise Physiologists 103 106 3 2.91% 2 0 2 3 3 629-1129 Therapists, All Other 73 75 2 2.74% 1 0 1 3 3 629-1131 Veterinarians 673 707 34 5.05% 17 8 25 1 3 6
*For training codes, refer to page 85. 55
2016-2018 Arkansas Statewide Occupational Projections 56
SOC Code
Standard Occupational Classification(SOC) Title
Estimated Employment
2016
Projected Employment
2018Net
GrowthPercent Growth
Annual Openings
due to Growth
Annual Openings
due to Replacement
Total Annual
OpeningsEducation
CodeWork
Experience Code
JobTraining
Code
29-1141 Registered Nurses 23,040 23,777 737 3.20% 368 508 876 3 3 629-1151 Nurse Anesthetists 538 567 29 5.39% 14 12 26 2 3 629-1171 Nurse Practitioners 1,424 1,532 108 7.58% 54 32 86 2 3 629-1181 Audiologists 36 37 1 2.78% 0 1 1 1 3 6
29-1199 Health Diagnosing and Treating Practitioners, All Other 194 197 3 1.55% 2 4 6 2 3 6
29-2000 Health Technologists and Technicians 31,394 32,422 1,028 3.27% 522 616 1,13829-2011 Medical and Clinical Laboratory Technologists 1,100 1,132 32 2.91% 16 27 43 3 3 629-2012 Medical and Clinical Laboratory Technicians 1,578 1,631 53 3.36% 26 38 64 4 3 629-2021 Dental Hygienists 1,422 1,479 57 4.01% 28 20 48 4 3 629-2031 Cardiovascular Technologists and Technicians 577 602 25 4.33% 12 9 21 4 3 629-2032 Diagnostic Medical Sonographers 374 393 19 5.08% 10 6 16 4 3 629-2033 Nuclear Medicine Technologists 131 132 1 0.76% 0 2 2 4 3 629-2034 Radiologic Technologists 1,906 1,950 44 2.31% 22 30 52 4 3 629-2035 Magnetic Resonance Imaging Technologists 297 305 8 2.69% 4 4 8 4 2 6
29-2041 Emergency Medical Technicians and Paramedics 2,319 2,448 129 5.56% 64 34 98 5 3 6
29-2051 Dietetic Technicians 180 187 7 3.89% 4 2 6 4 3 629-2052 Pharmacy Technicians 3,649 3,829 180 4.93% 90 30 120 7 3 429-2053 Psychiatric Technicians 723 713 -10 -1.38% 0 6 6 5 2 529-2054 Respiratory Therapy Technicians 274 269 -5 -1.82% 0 2 2 4 3 629-2055 Surgical Technologists 920 947 27 2.93% 14 8 22 5 3 629-2056 Veterinary Technologists and Technicians 307 327 20 6.51% 10 2 12 4 3 629-2057 Ophthalmic Medical Technicians 385 404 19 4.94% 10 3 13 5 3 6
29-2061 Licensed Practical and Licensed Vocational Nurses 12,057 12,341 284 2.36% 142 338 480 5 3 6
29-2071 Medical Records and Health Information Technicians 1,908 1,984 76 3.98% 38 38 76 5 3 6
29-2081 Opticians, Dispensing 487 509 22 4.52% 11 12 23 7 3 329-2099 Health Technologists and Technicians, All Other 702 735 33 4.70% 16 6 22 7 3 6
29-9000 Other Healthcare Practitioners and Technical Occupations 1,210 1,247 37 3.06% 18 18 36
29-9011 Occupational Health and Safety Specialists 531 540 9 1.69% 4 8 12 3 3 629-9091 Athletic Trainers 220 233 13 5.91% 6 4 10 3 3 6
29-9099 Healthcare Practitioners and Technical Workers, All Other 281 288 7 2.49% 4 4 8 5 3 6
31-0000 HEALTHCARE SUPPORT OCCUPATIONS 38,051 39,393 1,342 3.53% 672 802 1,474
*For training codes, refer to page 85.
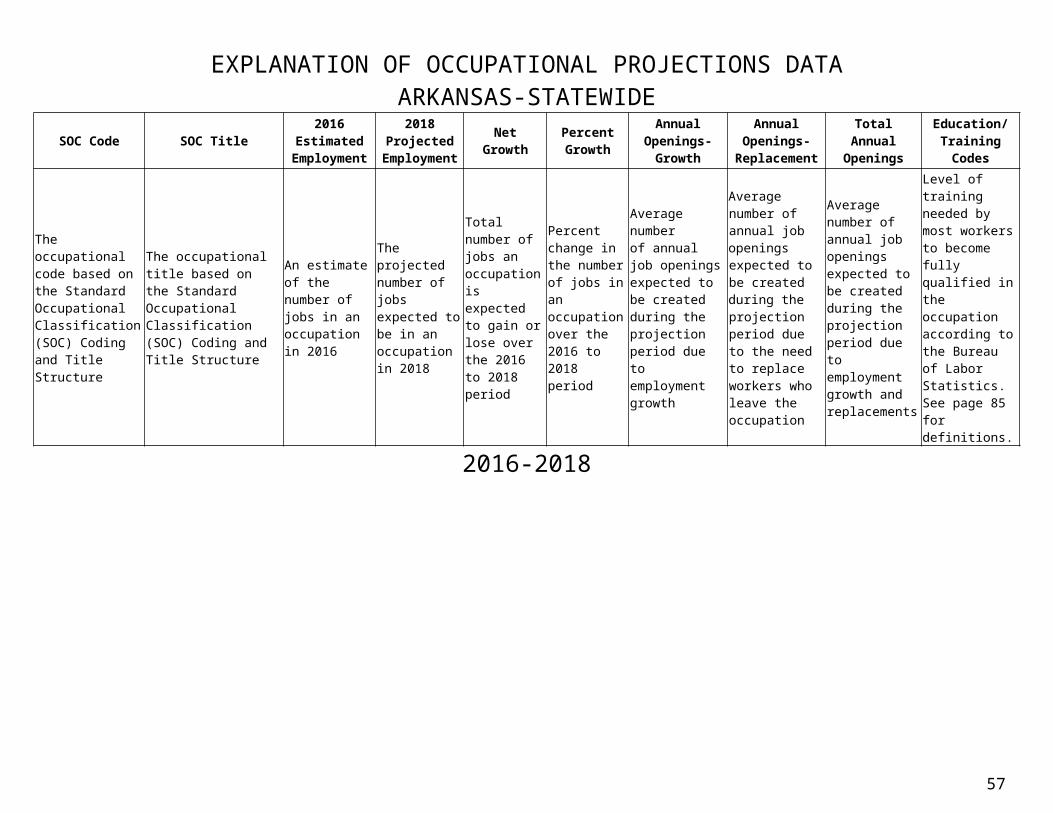
2016-2018 Arkansas Statewide Occupational ProjectionsSOC Code
Standard Occupational Classification(SOC) Title
Estimated Employment
2016
Projected Employment
2018Net
GrowthPercent Growth
Annual Openings
due to Growth
Annual Openings
due to Replacement
Total Annual
OpeningsEducation
CodeWork
Experience Code
JobTraining
Code
31-1000 Nursing, Psychiatric, and Home Health Aides 26,536 27,328 792 2.98% 396 560 95631-1011 Home Health Aides 7,485 7,776 291 3.89% 146 158 304 8 3 531-1014 Nursing Assistants 18,667 19,151 484 2.59% 242 394 636 5 3 6
31-2000 Occupational Therapy and Physical Therapist Assistants and Aides 1,647 1,753 106 6.44% 53 44 97
31-2011 Occupational Therapy Assistants 211 227 16 7.58% 8 6 14 4 3 631-2012 Occupational Therapy Aides 51 54 3 5.88% 2 2 4 7 3 531-2021 Physical Therapist Assistants 1,039 1,101 62 5.97% 31 28 59 4 3 631-2022 Physical Therapist Aides 346 371 25 7.23% 12 10 22 7 3 531-9000 Other Healthcare Support Occupations 9,868 10,312 444 4.50% 222 197 41931-9011 Massage Therapists 504 531 27 5.36% 14 3 17 5 3 631-9091 Dental Assistants 2,540 2,645 105 4.13% 52 62 114 5 3 631-9092 Medical Assistants 3,008 3,181 173 5.75% 86 58 144 5 3 631-9094 Medical Transcriptionists 750 749 -1 -0.13% 0 14 14 5 3 631-9095 Pharmacy Aides 550 568 18 3.27% 9 10 19 7 3 5
31-9096 Veterinary Assistants and Laboratory Animal Caretakers 795 837 42 5.28% 21 16 37 7 3 5
31-9097 Phlebotomists 909 964 55 6.05% 28 18 46 5 3 633-0000 PROTECTIVE SERVICE OCCUPATIONS 25,899 26,419 520 2.01% 262 640 90233-1000 Supervisors of Protective Service Workers 2,905 2,961 56 1.93% 28 96 12433-1011 First-Line Supervisors of Correctional Officers 323 329 6 1.86% 3 8 11 7 2 433-1012 First-Line Supervisors of Police and Detectives 1,328 1,355 27 2.03% 14 44 58 7 2 4
33-1021 First-Line Supervisors of Fire Fighting and Prevention Workers 751 765 14 1.86% 7 31 38 5 2 4
33-1099 First-Line Supervisors of Protective Service Workers, All Other 503 512 9 1.79% 4 12 16 7 2 6
33-2000 Fire Fighting and Prevention Workers 2,743 2,798 55 2.01% 28 76 10433-2011 Firefighters 2,531 2,579 48 1.90% 24 70 94 5 3 333-2021 Fire Inspectors and Investigators 40 41 1 2.50% 0 1 1 5 1 4
33-2022 Forest Fire Inspectors and Prevention Specialists 172 178 6 3.49% 3 5 8 7 2 4
33-3000 Law Enforcement Workers 12,058 12,265 207 1.72% 104 358 46233-3011 Bailiffs 101 103 2 1.98% 1 3 4 7 3 433-3012 Correctional Officers and Jailers 5,343 5,428 85 1.59% 42 148 190 7 3 433-3021 Detectives and Criminal Investigators 490 495 5 1.02% 2 10 12 7 2 433-3031 Fish and Game Wardens 180 183 3 1.67% 2 6 8 3 3 433-3051 Police and Sheriff's Patrol Officers 5,900 6,014 114 1.93% 57 190 247 7 3 4
*For training codes, refer to page 85. 57
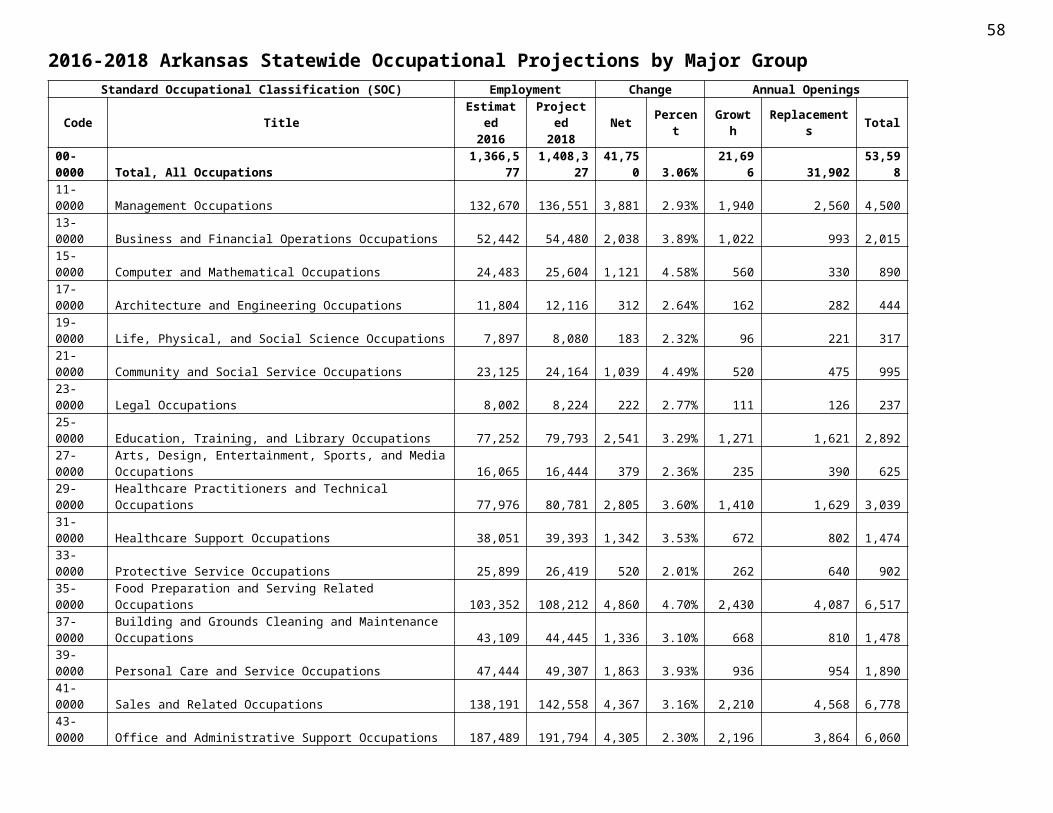
2016-2018 Arkansas Statewide Occupational Projections 58
SOC Code
Standard Occupational Classification(SOC) Title
Estimated Employment
2016
Projected Employment
2018Net
GrowthPercent Growth
Annual Openings
due to Growth
Annual Openings
due to Replacement
Total Annual
OpeningsEducation
CodeWork
Experience Code
JobTraining
Code
33-9000 Other Protective Service Workers 8,193 8,395 202 2.47% 102 110 21233-9011 Animal Control Workers 189 193 4 2.12% 2 4 6 7 3 433-9021 Private Detectives and Investigators 174 177 3 1.72% 2 4 6 7 2 433-9032 Security Guards 6,399 6,554 155 2.42% 78 82 160 7 3 533-9091 Crossing Guards 135 139 4 2.96% 2 2 4 8 3 5
33-9092 Lifeguards, Ski Patrol, and Other Recreational Protective Service Workers 544 557 13 2.39% 6 7 13 8 3 5
33-9099 Protective Service Workers, All Other 538 560 22 4.09% 11 7 18 7 3 5
35-0000 FOOD PREPARATION AND SERVING RELATED OCCUPATIONS 103,352 108,212 4,860 4.70% 2,430 4,087 6,517
35-1000 Supervisors of Food Preparation and Serving Workers 10,060 10,616 556 5.53% 278 308 586
35-1011 Chefs and Head Cooks 717 755 38 5.30% 19 10 29 7 1 6
35-1012 First-Line Supervisors of Food Preparation and Serving Workers 9,343 9,861 518 5.54% 259 298 557 7 2 6
35-2000 Cooks and Food Preparation Workers 34,052 35,334 1,282 3.76% 641 950 1,59135-2011 Cooks, Fast Food 8,634 8,708 74 0.86% 37 232 269 8 3 535-2012 Cooks, Institution and Cafeteria 7,106 7,273 167 2.35% 84 192 276 8 3 535-2013 Cooks, Private Household 158 161 3 1.90% 2 4 6 5 2 635-2014 Cooks, Restaurant 9,349 9,997 648 6.93% 324 252 576 8 2 435-2015 Cooks, Short Order 865 891 26 3.01% 13 24 37 8 3 535-2019 Cooks, All Other 121 127 6 4.96% 3 4 7 8 3 435-2021 Food Preparation Workers 7,819 8,177 358 4.58% 179 242 421 8 3 535-3000 Food and Beverage Serving Workers 52,160 54,911 2,751 5.27% 1,376 2,340 3,71635-3011 Bartenders 2,116 2,235 119 5.62% 60 78 138 8 3 5
35-3021 Combined Food Preparation and Serving Workers, Including Fast Food 27,172 28,833 1,661 6.11% 830 1,058 1,888 8 3 5
35-3022 Counter Attendants, Cafeteria, Food Concession, and Coffee Shop 1,680 1,756 76 4.52% 38 156 194 8 3 5
35-3031 Waiters and Waitresses 19,107 19,940 833 4.36% 416 998 1,414 8 3 535-3041 Food Servers, Nonrestaurant 2,085 2,147 62 2.97% 31 49 80 8 3 5
35-9000 Other Food Preparation and Serving Related Workers 7,080 7,351 271 3.83% 136 489 625
35-9021 Dishwashers 3,471 3,566 95 2.74% 48 192 240 8 3 5
35-9031 Hosts and Hostesses, Restaurant, Lounge, and Coffee Shop 1,922 2,016 94 4.89% 47 190 237 8 3 6
37-0000 BUILDING AND GROUNDS CLEANING AND MAINTENANCE OCCUPATIONS 43,109 44,445 1,336 3.10% 668 810 1,478
*For training codes, refer to page 85.
2016-2018 Arkansas Statewide Occupational ProjectionsSOC Code
Standard Occupational Classification(SOC) Title
Estimated Employment
2016
Projected Employment
2018Net
GrowthPercent Growth
Annual Openings
due to Growth
Annual Openings
due to Replacement
Total Annual
OpeningsEducation
CodeWork
Experience Code
JobTraining
Code
37-1000 Supervisors of Building and Grounds Cleaning and Maintenance Workers 4,288 4,422 134 3.13% 67 64 131
37-1011 First-Line Supervisors of Housekeeping and Janitorial Workers 2,370 2,441 71 3.00% 36 36 72 7 2 6
37-1012 First-Line Supervisors of Landscaping, Lawn Service, and Groundskeeping Workers 1,918 1,981 63 3.28% 32 28 60 7 2 6
37-2000 Building Cleaning and Pest Control Workers 30,174 31,059 885 2.93% 442 594 1,036
37-2011 Janitors and Cleaners, Except Maids and Housekeeping Cleaners 19,172 19,853 681 3.55% 340 345 685 8 3 5
37-2012 Maids and Housekeeping Cleaners 9,828 9,995 167 1.70% 84 222 306 8 3 537-3000 Grounds Maintenance Workers 8,647 8,964 317 3.67% 158 152 31037-3011 Landscaping and Groundskeeping Workers 7,152 7,435 283 3.96% 142 126 268 8 3 537-3013 Tree Trimmers and Pruners 820 840 20 2.44% 10 14 24 7 3 5
39-0000 PERSONAL CARE AND SERVICE OCCUPATIONS 47,444 49,307 1,863 3.93% 936 954 1,890
39-1000 Supervisors of Personal Care and Service Workers 1,933 2,006 73 3.78% 36 34 70
39-1011 Gaming Supervisors 94 99 5 5.32% 2 3 5 7 2 6
39-1021 First-Line Supervisors of Personal Service Workers 1,839 1,907 68 3.70% 34 32 66 7 2 6
39-2000 Animal Care and Service Workers 2,869 3,032 163 5.68% 82 66 14839-2011 Animal Trainers 819 845 26 3.17% 13 29 42 7 3 439-2021 Nonfarm Animal Caretakers 2,050 2,187 137 6.68% 68 37 105 7 3 5
39-3000 Entertainment Attendants and Related Workers 1,998 2,069 71 3.55% 36 107 143
39-3021 Motion Picture Projectionists 147 146 -1 -0.68% 0 6 6 8 3 539-3031 Ushers, Lobby Attendants, and Ticket Takers 470 489 19 4.04% 10 36 46 8 3 539-3091 Amusement and Recreation Attendants 1,051 1,087 36 3.43% 18 52 70 8 3 539-4000 Funeral Service Workers 892 915 23 2.58% 12 19 3139-4011 Embalmers 88 89 1 1.14% 0 2 2 5 3 539-4021 Funeral Attendants 411 419 8 1.95% 4 9 13 7 3 539-4031 Morticians, Undertakers, and Funeral Directors 393 407 14 3.56% 7 8 15 4 3 339-5000 Personal Appearance Workers 3,765 3,907 142 3.77% 71 87 15839-5012 Hairdressers, Hairstylists, and Cosmetologists 3,399 3,527 128 3.77% 64 85 149 5 3 639-5092 Manicurists and Pedicurists 255 265 10 3.92% 5 2 7 5 3 639-5094 Skincare Specialists 105 109 4 3.81% 2 0 2 5 3 639-6000 Baggage Porters, Bellhops, and Concierges 188 180 -8 -4.26% 0 4 439-6011 Baggage Porters and Bellhops 163 154 -9 -5.52% 0 3 3 7 3 5
*For training codes, refer to page 85. 59
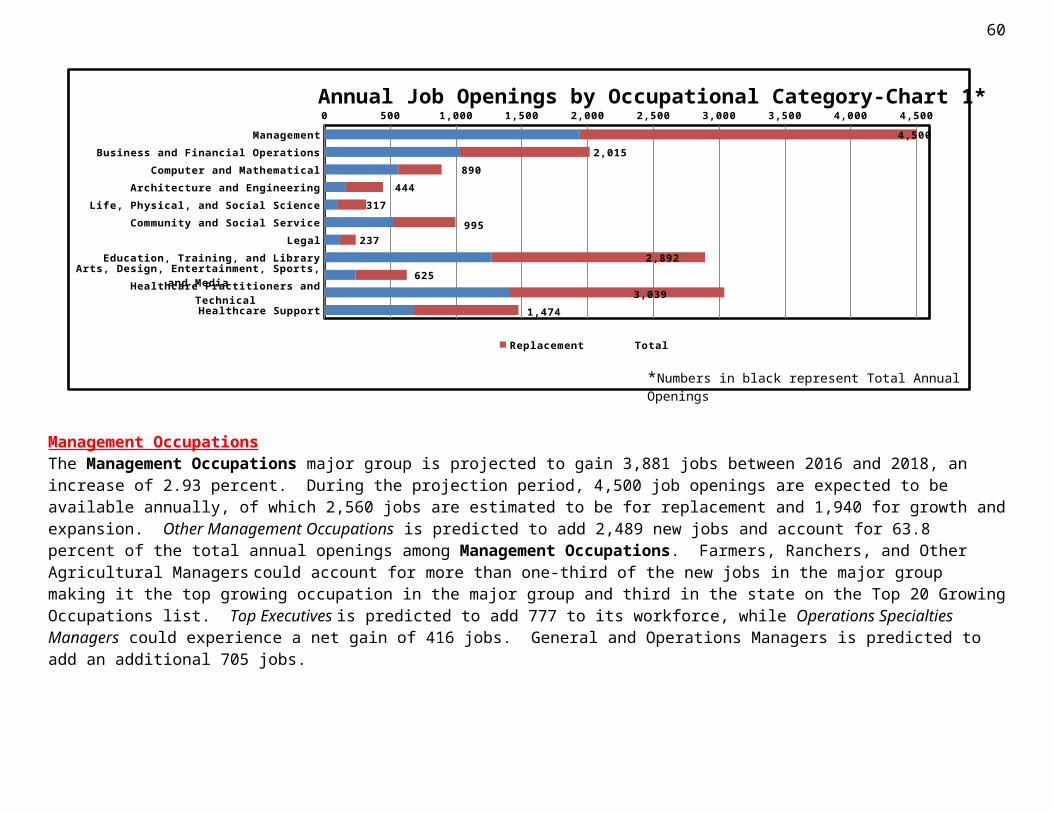
2016-2018 Arkansas Statewide Occupational Projections 60
SOC Code
Standard Occupational Classification(SOC) Title
Estimated Employment
2016
Projected Employment
2018Net
GrowthPercent Growth
Annual Openings
due to Growth
Annual Openings
due to Replacement
Total Annual
OpeningsEducation
CodeWork
Experience Code
JobTraining
Code
39-6012 Concierges 25 26 1 4.00% 0 0 0 7 3 439-7000 Tour and Travel Guides 210 223 13 6.19% 6 8 1439-9000 Other Personal Care and Service Workers 35,589 36,975 1,386 3.89% 693 629 1,32239-9011 Childcare Workers 13,945 14,311 366 2.62% 183 426 609 7 3 539-9021 Personal Care Aides 17,186 18,051 865 5.03% 432 110 542 8 3 539-9031 Fitness Trainers and Aerobics Instructors 1,349 1,427 78 5.78% 39 24 63 7 3 539-9032 Recreation Workers 1,916 1,966 50 2.61% 25 34 59 7 3 539-9041 Residential Advisors 893 908 15 1.68% 8 30 38 7 3 539-9099 Personal Care and Service Workers, All Other 300 312 12 4.00% 6 7 13 7 3 541-0000 SALES AND RELATED OCCUPATIONS 138,191 142,558 4,367 3.16% 2,210 4,568 6,77841-1000 Supervisors of Sales Workers 21,572 22,202 630 2.92% 315 445 76041-1011 First-Line Supervisors of Retail Sales Workers 17,472 18,012 540 3.09% 270 397 667 7 2 6
41-1012 First-Line Supervisors of Non-Retail Sales Workers 4,100 4,190 90 2.20% 45 48 93 7 2 6
41-2000 Retail Sales Workers 80,648 83,542 2,894 3.59% 1,447 3,384 4,83141-2011 Cashiers 34,387 35,526 1,139 3.31% 570 1,742 2,312 8 3 541-2021 Counter and Rental Clerks 3,288 3,385 97 2.95% 48 86 134 8 3 541-2031 Retail Salespersons 39,797 41,332 1,535 3.86% 768 1,488 2,256 8 3 541-3000 Sales Representatives, Services 12,148 12,463 315 2.59% 158 286 44441-3011 Advertising Sales Agents 1,155 1,153 -2 -0.17% 0 32 32 7 3 441-3021 Insurance Sales Agents 5,445 5,665 220 4.04% 110 140 250 7 3 4
41-3031 Securities, Commodities, and Financial Services Sales Agents 1,295 1,303 8 0.62% 4 24 28 3 3 4
41-3041 Travel Agents 218 220 2 0.92% 1 4 5 7 3 441-3099 Sales Representatives, Services, All Other 4,035 4,122 87 2.16% 44 86 130 7 3 4
41-4000 Sales Representatives, Wholesale and Manufacturing 16,252 16,577 325 2.00% 168 326 494
41-4011 Sales Representatives, Wholesale and Manufacturing, Technical and Scientific Products 2,310 2,299 -11 -0.48% 0 46 46 3 3 4
41-4012Sales Representatives, Wholesale and Manufacturing, Except Technical and Scientific Products
13,942 14,278 336 2.41% 168 280 448 7 3 4
41-9000 Other Sales and Related Workers 7,571 7,774 203 2.68% 121 128 24941-9021 Real Estate Brokers 157 165 8 5.10% 4 1 5 7 2 641-9022 Real Estate Sales Agents 2,521 2,631 110 4.36% 55 18 73 7 3 441-9031 Sales Engineers 137 137 0 0.00% 0 4 4 3 3 441-9041 Telemarketers 1,633 1,594 -39 -2.39% 0 36 36 8 3 5
*For training codes, refer to page 85.

2016-2018 Arkansas Statewide Occupational ProjectionsSOC Code
Standard Occupational Classification(SOC) Title
Estimated Employment
2016
Projected Employment
2018Net
GrowthPercent Growth
Annual Openings
due to Growth
Annual Openings
due to Replacement
Total Annual
OpeningsEducation
CodeWork
Experience Code
JobTraining
Code
41-9091 Door-to-Door Sales Workers, News and Street Vendors, and Related Workers 567 572 5 0.88% 2 5 7 8 3 5
41-9099 Sales and Related Workers, All Other 823 852 29 3.52% 14 10 24 7 3 6
43-0000 OFFICE AND ADMINISTRATIVE SUPPORT OCCUPATIONS 187,489 191,794 4,305 2.30% 2,196 3,864 6,060
43-1000 Supervisors of Office and Administrative Support Workers 15,284 15,783 499 3.26% 250 240 490
43-1011 First-Line Supervisors of Office and Administrative Support Workers 15,284 15,783 499 3.26% 250 240 490 7 2 6
43-2000 Communications Equipment Operators 761 729 -32 -4.20% 0 11 11
43-2011 Switchboard Operators, Including Answering Service 738 707 -31 -4.20% 0 10 10 7 3 5
43-3000 Financial Clerks 27,829 28,179 350 1.26% 175 596 77143-3011 Bill and Account Collectors 1,875 1,896 21 1.12% 10 46 56 7 3 443-3021 Billing and Posting Clerks 4,023 4,184 161 4.00% 80 76 156 7 3 443-3031 Bookkeeping, Accounting, and Auditing Clerks 13,241 13,304 63 0.48% 32 129 161 6 3 443-3051 Payroll and Timekeeping Clerks 1,509 1,525 16 1.06% 8 38 46 7 3 443-3061 Procurement Clerks 605 607 2 0.33% 1 20 21 7 3 443-3071 Tellers 6,496 6,578 82 1.26% 41 286 327 7 3 543-4000 Information and Record Clerks 40,178 41,196 1,018 2.53% 510 971 1,48143-4011 Brokerage Clerks 228 226 -2 -0.88% 0 6 6 7 3 443-4021 Correspondence Clerks 147 146 -1 -0.68% 0 4 4 7 3 543-4031 Court, Municipal, and License Clerks 1,162 1,184 22 1.89% 11 8 19 7 3 443-4041 Credit Authorizers, Checkers, and Clerks 115 118 3 2.61% 2 1 3 7 3 443-4051 Customer Service Representatives 18,936 19,438 502 2.65% 251 440 691 7 3 543-4061 Eligibility Interviewers, Government Programs 1,732 1,758 26 1.50% 13 15 28 7 3 443-4071 File Clerks 647 651 4 0.62% 2 13 15 7 3 543-4081 Hotel, Motel, and Resort Desk Clerks 2,448 2,501 53 2.17% 26 135 161 7 3 543-4111 Interviewers, Except Eligibility and Loan 1,052 1,071 19 1.81% 10 22 32 7 3 543-4121 Library Assistants, Clerical 683 700 17 2.49% 8 21 29 7 3 543-4131 Loan Interviewers and Clerks 1,630 1,711 81 4.97% 40 26 66 7 3 543-4141 New Accounts Clerks 561 568 7 1.25% 4 14 18 7 3 443-4151 Order Clerks 1,055 1,079 24 2.27% 12 28 40 7 3 5
43-4161 Human Resources Assistants, Except Payroll and Timekeeping 1,405 1,428 23 1.64% 12 13 25 4 3 6
43-4171 Receptionists and Information Clerks 6,863 7,094 231 3.37% 116 194 310 7 3 5
43-4181 Reservation and Transportation Ticket Agents and Travel Clerks 475 479 4 0.84% 2 6 8 7 3 5
*For training codes, refer to page 85. 61

2016-2018 Arkansas Statewide Occupational Projections 62
SOC Code
Standard Occupational Classification(SOC) Title
Estimated Employment
2016
Projected Employment
2018Net
GrowthPercent Growth
Annual Openings
due to Growth
Annual Openings
due to Replacement
Total Annual
OpeningsEducation
CodeWork
Experience Code
JobTraining
Code
43-4199 Information and Record Clerks, All Other 1,039 1,044 5 0.48% 2 25 27 7 3 5
43-5000 Material Recording, Scheduling, Dispatching, and Distributing Workers 33,954 34,757 803 2.36% 412 930 1,342
43-5011 Cargo and Freight Agents 687 699 12 1.75% 6 20 26 7 3 543-5021 Couriers and Messengers 624 646 22 3.53% 11 8 19 7 3 543-5031 Police, Fire, and Ambulance Dispatchers 1,133 1,137 4 0.35% 2 28 30 7 3 443-5032 Dispatchers, Except Police, Fire, and Ambulance 1,697 1,741 44 2.59% 22 43 65 7 3 443-5041 Meter Readers, Utilities 630 609 -21 -3.33% 0 14 14 7 3 543-5051 Postal Service Clerks 1,116 1,141 25 2.24% 12 14 26 7 3 543-5052 Postal Service Mail Carriers 3,012 3,078 66 2.19% 33 58 91 7 3 5
43-5053 Postal Service Mail Sorters, Processors, and Processing Machine Operators 585 585 0 0.00% 0 8 8 7 3 5
43-5061 Production, Planning, and Expediting Clerks 2,926 3,015 89 3.04% 44 80 124 7 3 443-5071 Shipping, Receiving, and Traffic Clerks 4,546 4,606 60 1.32% 30 90 120 7 3 543-5081 Stock Clerks and Order Fillers 16,053 16,534 481 3.00% 240 544 784 8 3 5
43-5111 Weighers, Measurers, Checkers, and Samplers, Recordkeeping 945 966 21 2.22% 10 24 34 7 3 5
43-6000 Secretaries and Administrative Assistants 32,022 32,882 860 2.69% 430 338 768
43-6011 Executive Secretaries and Executive Administrative Assistants 3,210 3,246 36 1.12% 18 34 52 7 2 6
43-6012 Legal Secretaries 1,316 1,329 13 0.99% 6 14 20 7 3 443-6013 Medical Secretaries 3,303 3,440 137 4.15% 68 35 103 7 3 4
43-6014 Secretaries and Administrative Assistants, Except Legal, Medical, and Executive 24,193 24,867 674 2.79% 337 256 593 7 3 5
43-9000 Other Office and Administrative Support Workers 37,461 38,268 807 2.15% 420 778 1,198
43-9011 Computer Operators 1,031 1,038 7 0.68% 4 8 12 7 3 443-9021 Data Entry Keyers 1,186 1,200 14 1.18% 7 16 23 7 3 443-9031 Desktop Publishers 72 70 -2 -2.78% 0 2 2 4 3 543-9041 Insurance Claims and Policy Processing Clerks 971 1,014 43 4.43% 22 24 46 7 3 4
43-9051 Mail Clerks and Mail Machine Operators, Except Postal Service 483 470 -13 -2.69% 0 10 10 7 3 5
43-9061 Office Clerks, General 30,076 30,773 697 2.32% 348 634 982 7 3 543-9071 Office Machine Operators, Except Computer 256 251 -5 -1.95% 0 6 6 7 3 543-9081 Proofreaders and Copy Markers 101 97 -4 -3.96% 0 2 2 3 3 6
43-9199 Office and Administrative Support Workers, All Other 2,725 2,803 78 2.86% 39 72 111 7 3 5
45-0000 FARMING, FISHING, AND FORESTRY 16,347 16,811 464 2.84% 239 412 651
*For training codes, refer to page 85.
2016-2018 Arkansas Statewide Occupational ProjectionsSOC Code
Standard Occupational Classification(SOC) Title
Estimated Employment
2016
Projected Employment
2018Net
GrowthPercent Growth
Annual Openings
due to Growth
Annual Openings
due to Replacement
Total Annual
OpeningsEducation
CodeWork
Experience Code
JobTraining
CodeOCCUPATIONS
45-2000 Agricultural Workers 13,454 13,870 416 3.09% 212 344 55645-2011 Agricultural Inspectors 413 416 3 0.73% 2 10 12 3 3 445-2041 Graders and Sorters, Agricultural Products 1,715 1,706 -9 -0.52% 0 22 22 8 3 545-2091 Agricultural Equipment Operators 1,018 1,061 43 4.22% 22 28 50 8 3 5
45-2092 Farmworkers and Laborers, Crop, Nursery, and Greenhouse 6,559 6,727 168 2.56% 84 180 264 8 3 5
45-2093 Farmworkers, Farm, Ranch, and Aquacultural Animals 3,163 3,358 195 6.17% 98 87 185 8 3 5
45-4000 Forest, Conservation, and Logging Workers 2,081 2,119 38 1.83% 22 50 7245-4022 Logging Equipment Operators 1,364 1,395 31 2.27% 16 33 49 7 3 445-4023 Log Graders and Scalers 231 240 9 3.90% 4 6 10 7 3 4
47-0000 CONSTRUCTION AND EXTRACTION OCCUPATIONS 54,281 56,707 2,426 4.47% 1,382 863 2,245
47-1000 Supervisors of Construction and Extraction Workers 5,948 6,201 253 4.25% 126 52 178
47-1011 First-Line Supervisors of Construction Trades and Extraction Workers 5,948 6,201 253 4.25% 126 52 178 7 1 6
47-2000 Construction Trades Workers 40,870 43,126 2,256 5.52% 1,128 658 1,78647-2011 Boilermakers 23 24 1 4.35% 0 0 0 7 3 147-2021 Brickmasons and Blockmasons 613 651 38 6.20% 19 6 25 7 3 147-2022 Stonemasons 62 66 4 6.45% 2 0 2 7 3 147-2031 Carpenters 6,722 7,123 401 5.97% 200 80 280 7 3 147-2041 Carpet Installers 289 311 22 7.61% 11 4 15 8 3 547-2044 Tile and Marble Setters 143 154 11 7.69% 6 2 8 8 3 347-2051 Cement Masons and Concrete Finishers 1,121 1,190 69 6.16% 34 14 48 8 3 447-2061 Construction Laborers 9,942 10,459 517 5.20% 258 196 454 8 3 5
47-2071 Paving, Surfacing, and Tamping Equipment Operators 1,263 1,289 26 2.06% 13 28 41 7 3 4
47-2073 Operating Engineers and Other Construction Equipment Operators 3,614 3,711 97 2.68% 48 60 108 7 3 4
47-2081 Drywall and Ceiling Tile Installers 653 738 85 13.02% 42 4 46 8 3 447-2111 Electricians 5,923 6,262 339 5.72% 170 90 260 7 3 147-2121 Glaziers 454 466 12 2.64% 6 8 14 7 3 147-2131 Insulation Workers, Floor, Ceiling, and Wall 241 270 29 12.03% 14 8 22 8 3 547-2132 Insulation Workers, Mechanical 176 192 16 9.09% 8 6 14 7 3 147-2141 Painters, Construction and Maintenance 2,082 2,261 179 8.60% 90 32 122 8 3 447-2142 Paperhangers 68 72 4 5.88% 2 1 3 8 3 3
*For training codes, refer to page 85. 63
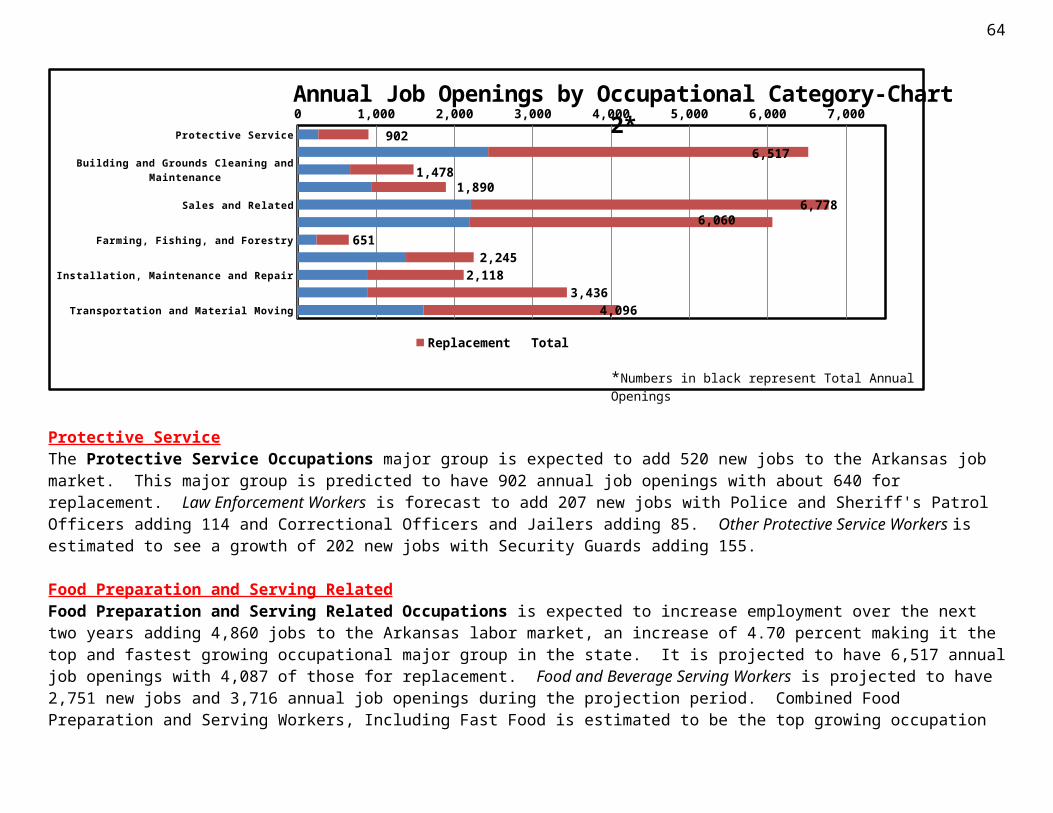
2016-2018 Arkansas Statewide Occupational Projections 64
SOC Code
Standard Occupational Classification(SOC) Title
Estimated Employment
2016
Projected Employment
2018Net
GrowthPercent Growth
Annual Openings
due to Growth
Annual Openings
due to Replacement
Total Annual
OpeningsEducation
CodeWork
Experience Code
JobTraining
Code
47-2151 Pipelayers 500 514 14 2.80% 7 6 13 8 3 547-2152 Plumbers, Pipefitters, and Steamfitters 3,511 3,711 200 5.70% 100 47 147 7 3 147-2161 Plasterers and Stucco Masons 78 84 6 7.69% 3 0 3 8 3 347-2171 Reinforcing Iron and Rebar Workers 23 24 1 4.35% 0 0 0 7 3 147-2181 Roofers 855 895 40 4.68% 20 13 33 8 3 447-2211 Sheet Metal Workers 1,456 1,530 74 5.08% 37 30 67 7 3 147-2221 Structural Iron and Steel Workers 867 919 52 6.00% 26 17 43 7 3 147-3000 Helpers, Construction Trades 2,261 2,433 172 7.61% 86 36 122
47-3011 Helpers--Brickmasons, Blockmasons, Stonemasons, and Tile and Marble Setters 290 315 25 8.62% 12 4 16 8 3 5
47-3012 Helpers--Carpenters 378 409 31 8.20% 16 6 22 8 3 547-3013 Helpers--Electricians 372 401 29 7.80% 14 6 20 7 3 5
47-3014 Helpers--Painters, Paperhangers, Plasterers, and Stucco Masons 247 284 37 14.98% 18 4 22 8 3 5
47-3015 Helpers--Pipelayers, Plumbers, Pipefitters, and Steamfitters 451 480 29 6.43% 14 8 22 7 3 5
47-3016 Helpers--Roofers 208 218 10 4.81% 5 4 9 8 3 547-3019 Helpers, Construction Trades, All Other 315 326 11 3.49% 6 5 11 8 3 547-4000 Other Construction and Related Workers 3,367 3,450 83 2.47% 42 74 11647-4011 Construction and Building Inspectors 618 638 20 3.24% 10 16 26 7 1 447-4021 Elevator Installers and Repairers 64 69 5 7.81% 2 1 3 7 3 147-4041 Hazardous Materials Removal Workers 146 148 2 1.37% 1 2 3 7 3 447-4051 Highway Maintenance Workers 1,816 1,851 35 1.93% 18 43 61 7 3 4
47-4061 Rail-Track Laying and Maintenance Equipment Operators 107 108 1 0.93% 0 2 2 7 3 4
47-4071 Septic Tank Servicers and Sewer Pipe Cleaners 111 117 6 5.41% 3 2 5 8 3 447-5000 Extraction Workers 1,835 1,497 -338 -18.42% 0 42 4247-5011 Derrick Operators, Oil and Gas 156 110 -46 -29.49% 0 5 5 8 3 547-5012 Rotary Drill Operators, Oil and Gas 68 48 -20 -29.41% 0 2 2 8 3 447-5013 Service Unit Operators, Oil, Gas, and Mining 450 339 -111 -24.67% 0 15 15 8 3 4
47-5031 Explosives Workers, Ordnance Handling Experts, and Blasters 138 135 -3 -2.17% 0 2 2 7 2 3
47-5041 Continuous Mining Machine Operators 187 181 -6 -3.21% 0 3 3 8 3 447-5071 Roustabouts, Oil and Gas 366 273 -93 -25.41% 0 6 6 8 3 447-5081 Helpers--Extraction Workers 197 160 -37 -18.78% 0 2 2 7 3 4
49-0000 INSTALLATION, MAINTENANCE, AND REPAIR OCCUPATIONS 54,804 56,531 1,727 3.15% 884 1,234 2,118
*For training codes, refer to page 85.
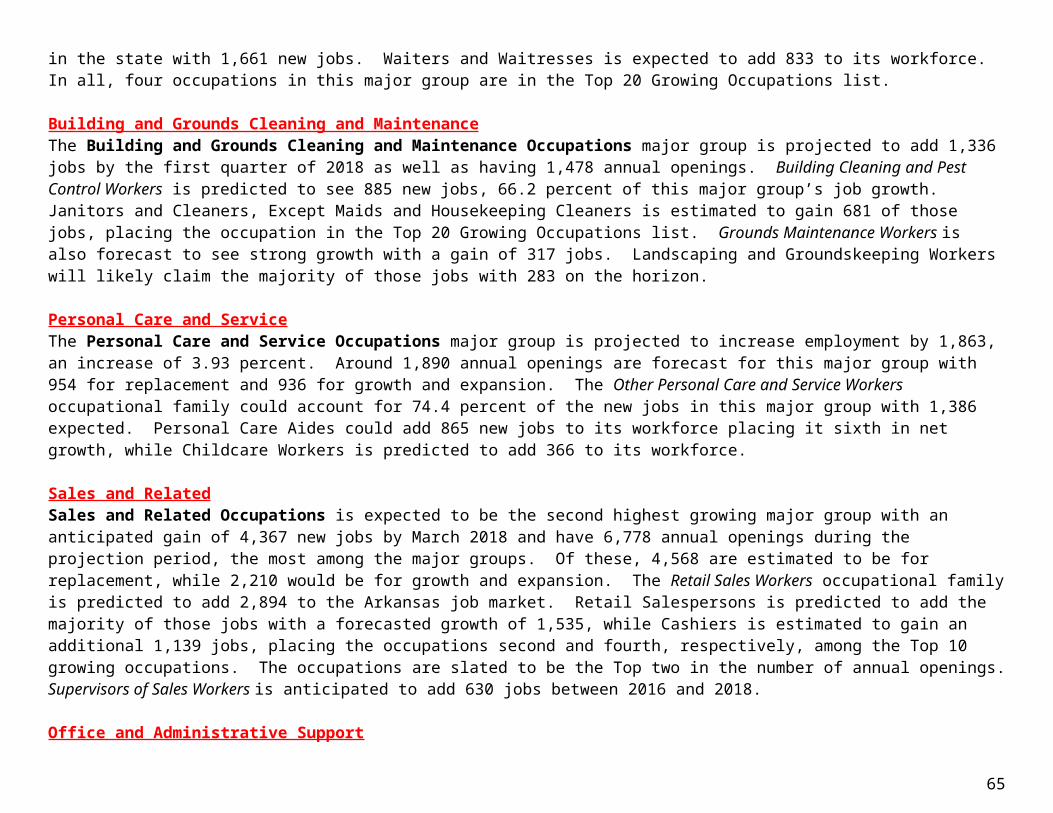
2016-2018 Arkansas Statewide Occupational ProjectionsSOC Code
Standard Occupational Classification(SOC) Title
Estimated Employment
2016
Projected Employment
2018Net
GrowthPercent Growth
Annual Openings
due to Growth
Annual Openings
due to Replacement
Total Annual
OpeningsEducation
CodeWork
Experience Code
JobTraining
Code
49-1000 Supervisors of Installation, Maintenance, and Repair Workers 4,811 4,928 117 2.43% 58 92 150
49-1011 First-Line Supervisors of Mechanics, Installers, and Repairers 4,811 4,928 117 2.43% 58 92 150 7 2 6
49-2000 Electrical and Electronic Equipment Mechanics, Installers, and Repairers 5,438 5,520 82 1.51% 48 86 134
49-2011 Computer, Automated Teller, and Office Machine Repairers 1,042 1,073 31 2.98% 16 20 36 6 3 5
49-2022 Telecommunications Equipment Installers and Repairers, Except Line Installers 2,281 2,299 18 0.79% 9 24 33 5 3 4
49-2091 Avionics Technicians 128 131 3 2.34% 2 2 4 4 3 6
49-2092 Electric Motor, Power Tool, and Related Repairers 365 368 3 0.82% 2 10 12 5 3 3
49-2094 Electrical and Electronics Repairers, Commercial and Industrial Equipment 446 435 -11 -2.47% 0 8 8 5 3 3
49-2095 Electrical and Electronics Repairers, Powerhouse, Substation, and Relay 88 88 0 0.00% 0 2 2 5 3 3
49-2097 Electronic Home Entertainment Equipment Installers and Repairers 290 299 9 3.10% 4 4 8 5 3 5
49-2098 Security and Fire Alarm Systems Installers 507 531 24 4.73% 12 10 22 7 3 4
49-3000 Vehicle and Mobile Equipment Mechanics, Installers, and Repairers 15,785 16,340 555 3.52% 284 378 662
49-3011 Aircraft Mechanics and Service Technicians 768 759 -9 -1.17% 0 17 17 5 3 649-3021 Automotive Body and Related Repairers 1,326 1,396 70 5.28% 35 30 65 7 3 349-3022 Automotive Glass Installers and Repairers 211 222 11 5.21% 6 3 9 7 3 449-3023 Automotive Service Technicians and Mechanics 5,690 5,910 220 3.87% 110 148 258 5 3 5
49-3031 Bus and Truck Mechanics and Diesel Engine Specialists 3,263 3,386 123 3.77% 62 58 120 7 3 3
49-3041 Farm Equipment Mechanics and Service Technicians 960 976 16 1.67% 8 23 31 7 3 3
49-3042 Mobile Heavy Equipment Mechanics, Except Engines 964 970 6 0.62% 3 23 26 7 3 3
49-3043 Rail Car Repairers 333 329 -4 -1.20% 0 8 8 7 3 349-3051 Motorboat Mechanics and Service Technicians 199 219 20 10.05% 10 4 14 7 3 349-3052 Motorcycle Mechanics 206 234 28 13.59% 14 4 18 5 3 5
49-3053 Outdoor Power Equipment and Other Small Engine Mechanics 406 425 19 4.68% 10 8 18 7 3 4
49-3093 Tire Repairers and Changers 1,257 1,290 33 2.63% 16 45 61 7 3 5
49-9000 Other Installation, Maintenance, and Repair Occupations 28,770 29,743 973 3.38% 493 678 1,171
*For training codes, refer to page 85. 65
2016-2018 Arkansas Statewide Occupational Projections 66
SOC Code
Standard Occupational Classification(SOC) Title
Estimated Employment
2016
Projected Employment
2018Net
GrowthPercent Growth
Annual Openings
due to Growth
Annual Openings
due to Replacement
Total Annual
OpeningsEducation
CodeWork
Experience Code
JobTraining
Code
49-9012 Control and Valve Installers and Repairers, Except Mechanical Door 435 423 -12 -2.76% 0 14 14 7 3 4
49-9021 Heating, Air Conditioning, and Refrigeration Mechanics and Installers 2,839 3,016 177 6.23% 88 44 132 5 3 3
49-9031 Home Appliance Repairers 287 290 3 1.05% 2 7 9 7 3 449-9041 Industrial Machinery Mechanics 4,581 4,810 229 5.00% 114 108 222 7 3 349-9043 Maintenance Workers, Machinery 682 712 30 4.40% 15 13 28 7 3 449-9044 Millwrights 606 630 24 3.96% 12 14 26 7 3 149-9051 Electrical Power-Line Installers and Repairers 1,551 1,552 1 0.06% 0 60 60 7 3 3
49-9052 Telecommunications Line Installers and Repairers 1,031 1,047 16 1.55% 8 19 27 7 3 3
49-9062 Medical Equipment Repairers 429 432 3 0.70% 2 6 8 4 3 449-9063 Musical Instrument Repairers and Tuners 42 42 0 0.00% 0 0 0 7 3 1
49-9069 Precision Instrument and Equipment Repairers, All Other 53 55 2 3.77% 1 1 2 7 3 3
49-9071 Maintenance and Repair Workers, General 13,068 13,471 403 3.08% 202 314 516 7 3 3
49-9091 Coin, Vending, and Amusement Machine Servicers and Repairers 306 315 9 2.94% 4 4 8 7 3 5
49-9094 Locksmiths and Safe Repairers 116 115 -1 -0.86% 0 5 5 7 3 349-9096 Riggers 95 102 7 7.37% 4 2 6 7 3 549-9097 Signal and Track Switch Repairers 142 142 0 0.00% 0 2 2 7 3 4
49-9098 Helpers--Installation, Maintenance, and Repair Workers 1,171 1,231 60 5.12% 30 40 70 7 3 5
49-9099 Installation, Maintenance, and Repair Workers, All Other 1,023 1,028 5 0.49% 2 16 18 7 3 4
51-0000 PRODUCTION OCCUPATIONS 116,090 116,957 867 0.75% 886 2,550 3,43651-1000 Supervisors of Production Workers 8,123 8,218 95 1.17% 48 128 176
51-1011 First-Line Supervisors of Production and Operating Workers 8,123 8,218 95 1.17% 48 128 176 7 2 6
51-2000 Assemblers and Fabricators 19,341 19,527 186 0.96% 138 394 53251-2021 Coil Winders, Tapers, and Finishers 531 503 -28 -5.27% 0 7 7 7 3 451-2022 Electrical and Electronic Equipment Assemblers 1,014 965 -49 -4.83% 0 13 13 7 3 451-2023 Electromechanical Equipment Assemblers 46 44 -2 -4.35% 0 0 0 7 3 451-2041 Structural Metal Fabricators and Fitters 1,602 1,670 68 4.24% 34 28 62 7 3 451-2091 Fiberglass Laminators and Fabricators 847 898 51 6.02% 26 18 44 7 3 451-2092 Team Assemblers 13,189 13,313 124 0.94% 62 284 346 7 3 451-2099 Assemblers and Fabricators, All Other 1,540 1,555 15 0.97% 8 33 41 7 3 4
*For training codes, refer to page 85.
2016-2018 Arkansas Statewide Occupational ProjectionsSOC Code
Standard Occupational Classification(SOC) Title
Estimated Employment
2016
Projected Employment
2018Net
GrowthPercent Growth
Annual Openings
due to Growth
Annual Openings
due to Replacement
Total Annual
OpeningsEducation
CodeWork
Experience Code
JobTraining
Code
51-3000 Food Processing Workers 17,856 18,515 659 3.69% 330 334 66451-3011 Bakers 1,205 1,264 59 4.90% 30 24 54 8 3 351-3021 Butchers and Meat Cutters 1,161 1,203 42 3.62% 21 21 42 8 3 351-3022 Meat, Poultry, and Fish Cutters and Trimmers 7,607 7,873 266 3.50% 133 138 271 8 3 551-3023 Slaughterers and Meat Packers 2,128 2,203 75 3.52% 38 38 76 8 3 5
51-3091 Food and Tobacco Roasting, Baking, and Drying Machine Operators and Tenders 192 205 13 6.77% 6 4 10 8 3 4
51-3092 Food Batchmakers 1,829 1,874 45 2.46% 22 38 60 7 3 451-3093 Food Cooking Machine Operators and Tenders 848 900 52 6.13% 26 16 42 7 3 451-3099 Food Processing Workers, All Other 2,886 2,993 107 3.71% 54 54 108 8 3 451-4000 Metal Workers and Plastic Workers 20,713 20,466 -247 -1.19% 66 490 556
51-4011 Computer-Controlled Machine Tool Operators, Metal and Plastic 1,473 1,529 56 3.80% 28 40 68 7 3 4
51-4012 Computer Numerically Controlled Machine Tool Programmers, Metal and Plastic 167 172 5 2.99% 2 4 6 7 3 3
51-4021 Extruding and Drawing Machine Setters, Operators, and Tenders, Metal and Plastic 628 615 -13 -2.07% 0 16 16 7 3 4
51-4022 Forging Machine Setters, Operators, and Tenders, Metal and Plastic 90 95 5 5.56% 2 2 4 7 3 4
51-4023 Rolling Machine Setters, Operators, and Tenders, Metal and Plastic 162 167 5 3.09% 2 4 6 7 3 4
51-4031 Cutting, Punching, and Press Machine Setters, Operators, and Tenders, Metal and Plastic 2,848 2,759 -89 -3.13% 0 39 39 7 3 4
51-4032 Drilling and Boring Machine Tool Setters, Operators, and Tenders, Metal and Plastic 111 112 1 0.90% 0 2 2 7 3 4
51-4033Grinding, Lapping, Polishing, and Buffing Machine Tool Setters, Operators, and Tenders, Metal and Plastic
685 662 -23 -3.36% 0 28 28 7 3 4
51-4034 Lathe and Turning Machine Tool Setters, Operators, and Tenders, Metal and Plastic 165 161 -4 -2.42% 0 4 4 7 3 4
51-4035 Milling and Planing Machine Setters, Operators, and Tenders, Metal and Plastic 169 171 2 1.18% 1 3 4 7 3 4
51-4041 Machinists 2,834 2,858 24 0.85% 12 81 93 7 3 351-4051 Metal-Refining Furnace Operators and Tenders 253 266 13 5.14% 6 8 14 7 3 451-4052 Pourers and Casters, Metal 123 142 19 15.45% 10 4 14 7 3 451-4062 Patternmakers, Metal and Plastic 39 35 -4 -10.26% 0 0 0 7 3 4
51-4072Molding, Coremaking, and Casting Machine Setters, Operators, and Tenders, Metal and Plastic
1,678 1,643 -35 -2.09% 0 27 27 7 3 4
51-4081 Multiple Machine Tool Setters, Operators, and 1,503 1,453 -50 -3.33% 0 28 28 7 3 4
*For training codes, refer to page 85. 67
2016-2018 Arkansas Statewide Occupational Projections 68
SOC Code
Standard Occupational Classification(SOC) Title
Estimated Employment
2016
Projected Employment
2018Net
GrowthPercent Growth
Annual Openings
due to Growth
Annual Openings
due to Replacement
Total Annual
OpeningsEducation
CodeWork
Experience Code
JobTraining
CodeTenders, Metal and Plastic
51-4111 Tool and Die Makers 535 493 -42 -7.85% 0 2 2 7 3 351-4121 Welders, Cutters, Solderers, and Brazers 5,058 5,032 -26 -0.51% 0 142 142 7 3 4
51-4122 Welding, Soldering, and Brazing Machine Setters, Operators, and Tenders 1,300 1,246 -54 -4.15% 0 36 36 7 3 4
51-4191 Heat Treating Equipment Setters, Operators, and Tenders, Metal and Plastic 224 217 -7 -3.13% 0 4 4 7 3 4
51-4192 Layout Workers, Metal and Plastic 41 35 -6 -14.63% 0 0 0 7 3 4
51-4193 Plating and Coating Machine Setters, Operators, and Tenders, Metal and Plastic 361 346 -15 -4.16% 0 9 9 7 3 4
51-4194 Tool Grinders, Filers, and Sharpeners 153 154 1 0.65% 0 4 4 7 3 451-4199 Metal Workers and Plastic Workers, All Other 73 66 -7 -9.59% 0 2 2 7 3 451-5100 Printing Workers 2,368 2,336 -32 -1.35% 0 36 3651-5111 Prepress Technicians and Workers 283 267 -16 -5.65% 0 4 4 5 3 651-5112 Printing Press Operators 1,759 1,747 -12 -0.68% 0 26 26 7 3 451-5113 Print Binding and Finishing Workers 326 322 -4 -1.23% 0 5 5 7 3 551-6000 Textile, Apparel, and Furnishings Workers 5,123 5,018 -105 -2.05% 10 80 9051-6011 Laundry and Dry-Cleaning Workers 1,758 1,754 -4 -0.23% 0 26 26 8 3 5
51-6021 Pressers, Textile, Garment, and Related Materials 398 380 -18 -4.52% 0 10 10 8 3 5
51-6031 Sewing Machine Operators 959 939 -20 -2.09% 0 6 6 8 3 551-6041 Shoe and Leather Workers and Repairers 32 29 -3 -9.38% 0 0 0 7 3 451-6042 Shoe Machine Operators and Tenders 541 486 -55 -10.17% 0 6 6 7 3 551-6052 Tailors, Dressmakers, and Custom Sewers 286 288 2 0.70% 1 10 11 8 3 4
51-6062 Textile Cutting Machine Setters, Operators, and Tenders 91 85 -6 -6.59% 0 2 2 7 3 4
51-6063 Textile Knitting and Weaving Machine Setters, Operators, and Tenders 194 194 0 0.00% 0 3 3 7 3 5
51-6091Extruding and Forming Machine Setters, Operators, and Tenders, Synthetic and Glass Fibers
90 97 7 7.78% 4 1 5 7 3 4
51-6093 Upholsterers 574 555 -19 -3.31% 0 14 14 7 3 4
51-6099 Textile, Apparel, and Furnishings Workers, All Other 55 57 2 3.64% 1 0 1 7 3 5
51-7000 Woodworkers 3,924 3,909 -15 -0.38% 30 74 10451-7011 Cabinetmakers and Bench Carpenters 1,244 1,174 -70 -5.63% 0 10 10 7 3 451-7041 Sawing Machine Setters, Operators, and 1,364 1,420 56 4.11% 28 40 68 7 3 5
*For training codes, refer to page 85.

2016-2018 Arkansas Statewide Occupational ProjectionsSOC Code
Standard Occupational Classification(SOC) Title
Estimated Employment
2016
Projected Employment
2018Net
GrowthPercent Growth
Annual Openings
due to Growth
Annual Openings
due to Replacement
Total Annual
OpeningsEducation
CodeWork
Experience Code
JobTraining
CodeTenders, Wood
51-7042 Woodworking Machine Setters, Operators, and Tenders, Except Sawing 1,006 1,002 -4 -0.40% 0 18 18 7 3 5
51-8000 Plant and System Operators 3,813 3,772 -41 -1.08% 24 104 12851-8012 Power Distributors and Dispatchers 161 158 -3 -1.86% 0 6 6 7 3 351-8013 Power Plant Operators 429 423 -6 -1.40% 0 16 16 7 3 351-8021 Stationary Engineers and Boiler Operators 325 326 1 0.31% 0 8 8 7 3 3
51-8031 Water and Wastewater Treatment Plant and System Operators 1,843 1,882 39 2.12% 20 38 58 7 3 3
51-8091 Chemical Plant and System Operators 204 206 2 0.98% 1 7 8 7 3 351-8092 Gas Plant Operators 137 125 -12 -8.76% 0 4 4 7 3 351-8099 Plant and System Operators, All Other 124 129 5 4.03% 2 4 6 7 3 351-9000 Other Production Occupations 34,829 35,196 367 1.05% 242 908 1,15051-9011 Chemical Equipment Operators and Tenders 1,180 1,201 21 1.78% 10 34 44 7 3 4
51-9012Separating, Filtering, Clarifying, Precipitating, and Still Machine Setters, Operators, and Tenders
482 479 -3 -0.62% 0 14 14 7 3 4
51-9021 Crushing, Grinding, and Polishing Machine Setters, Operators, and Tenders 443 441 -2 -0.45% 0 9 9 7 3 4
51-9022 Grinding and Polishing Workers, Hand 84 82 -2 -2.38% 0 2 2 8 3 4
51-9023 Mixing and Blending Machine Setters, Operators, and Tenders 1,605 1,638 33 2.06% 16 32 48 7 3 4
51-9032 Cutting and Slicing Machine Setters, Operators, and Tenders 1,478 1,450 -28 -1.89% 0 32 32 7 3 5
51-9041 Extruding, Forming, Pressing, and Compacting Machine Setters, Operators, and Tenders 1,061 1,061 0 0.00% 0 38 38 7 3 4
51-9051 Furnace, Kiln, Oven, Drier, and Kettle Operators and Tenders 454 462 8 1.76% 4 12 16 7 3 4
51-9061 Inspectors, Testers, Sorters, Samplers, and Weighers 6,112 6,220 108 1.77% 54 151 205 7 3 4
51-9071 Jewelers and Precious Stone and Metal Workers 204 199 -5 -2.45% 0 3 3 7 3 351-9081 Dental Laboratory Technicians 442 476 34 7.69% 17 12 29 7 3 451-9082 Medical Appliance Technicians 143 153 10 6.99% 5 4 9 7 3 351-9083 Ophthalmic Laboratory Technicians 406 424 18 4.43% 9 11 20 7 3 4
51-9111 Packaging and Filling Machine Operators and Tenders 3,926 4,025 99 2.52% 50 134 184 7 3 4
51-9121 Coating, Painting, and Spraying Machine Setters, Operators, and Tenders 1,044 1,035 -9 -0.86% 0 20 20 7 3 4
51-9122 Painters, Transportation Equipment 964 989 25 2.59% 12 18 30 7 3 4
*For training codes, refer to page 85. 69
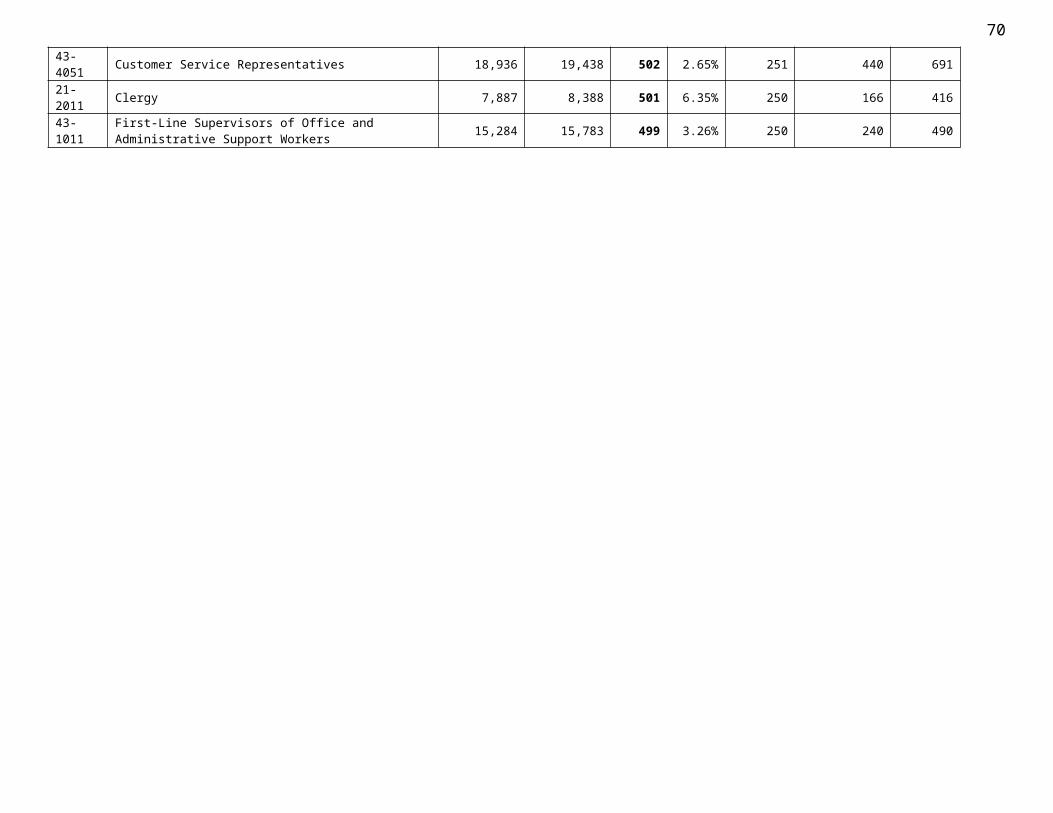
2016-2018 Arkansas Statewide Occupational Projections 70
SOC Code
Standard Occupational Classification(SOC) Title
Estimated Employment
2016
Projected Employment
2018Net
GrowthPercent Growth
Annual Openings
due to Growth
Annual Openings
due to Replacement
Total Annual
OpeningsEducation
CodeWork
Experience Code
JobTraining
Code
51-9151 Photographic Process Workers and Processing Machine Operators 67 64 -3 -4.48% 0 2 2 7 3 5
51-9191 Adhesive Bonding Machine Operators and Tenders 388 376 -12 -3.09% 0 10 10 7 3 4
51-9192 Cleaning, Washing, and Metal Pickling Equipment Operators and Tenders 364 378 14 3.85% 7 10 17 8 3 4
51-9193 Cooling and Freezing Equipment Operators and Tenders 686 703 17 2.48% 8 13 21 7 3 4
51-9194 Etchers and Engravers 20 21 1 5.00% 0 0 0 7 3 4
51-9195 Molders, Shapers, and Casters, Except Metal and Plastic 372 374 2 0.54% 1 12 13 7 3 3
51-9196 Paper Goods Machine Setters, Operators, and Tenders 1,949 1,906 -43 -2.21% 0 34 34 7 3 4
51-9198 Helpers--Production Workers 7,106 7,112 6 0.08% 3 224 227 8 3 551-9199 Production Workers, All Other 3,197 3,281 84 2.63% 42 60 102 7 3 4
53-0000 TRANSPORTATION AND MATERIAL MOVING OCCUPATIONS 109,804 112,956 3,152 2.87% 1,604 2,492 4,096
53-1000 Supervisors of Transportation and Material Moving Workers 4,052 4,166 114 2.81% 57 122 179
53-1011 Aircraft Cargo Handling Supervisors 39 39 0 0.00% 0 1 1 7 2 6
53-1021 First-Line Supervisors of Helpers, Laborers, and Material Movers, Hand 1,348 1,405 57 4.23% 28 41 69 7 2 6
53-1031 First-Line Supervisors of Transportation and Material-Moving Machine and Vehicle Operators 2,665 2,722 57 2.14% 28 80 108 7 2 6
53-2011 Airline Pilots, Copilots, and Flight Engineers 123 123 0 0.00% 0 2 2 3 2 453-2012 Commercial Pilots 582 594 12 2.06% 6 12 18 7 3 453-2021 Air Traffic Controllers 99 95 -4 -4.04% 0 3 3 4 3 353-3000 Motor Vehicle Operators 53,665 55,039 1,374 2.56% 687 834 1,52153-3022 Bus Drivers, School or Special Client 5,876 6,037 161 2.74% 80 70 150 7 3 553-3031 Driver/Sales Workers 2,799 2,895 96 3.43% 48 44 92 7 3 553-3032 Heavy and Tractor-Trailer Truck Drivers 35,834 36,548 714 1.99% 357 571 928 5 3 553-3033 Light Truck or Delivery Services Drivers 6,496 6,760 264 4.06% 132 104 236 7 3 553-3041 Taxi Drivers and Chauffeurs 2,064 2,186 122 5.91% 61 35 96 8 3 553-3099 Motor Vehicle Operators, All Other 147 152 5 3.40% 2 4 6 8 3 553-6000 Other Transportation Workers 1,942 2,008 66 3.40% 35 83 11853-6021 Parking Lot Attendants 227 241 14 6.17% 7 14 21 8 3 553-6031 Automotive and Watercraft Service Attendants 1,124 1,176 52 4.63% 26 49 75 8 3 553-6041 Traffic Technicians 35 36 1 2.86% 0 2 2 7 3 4
*For training codes, refer to page 85.
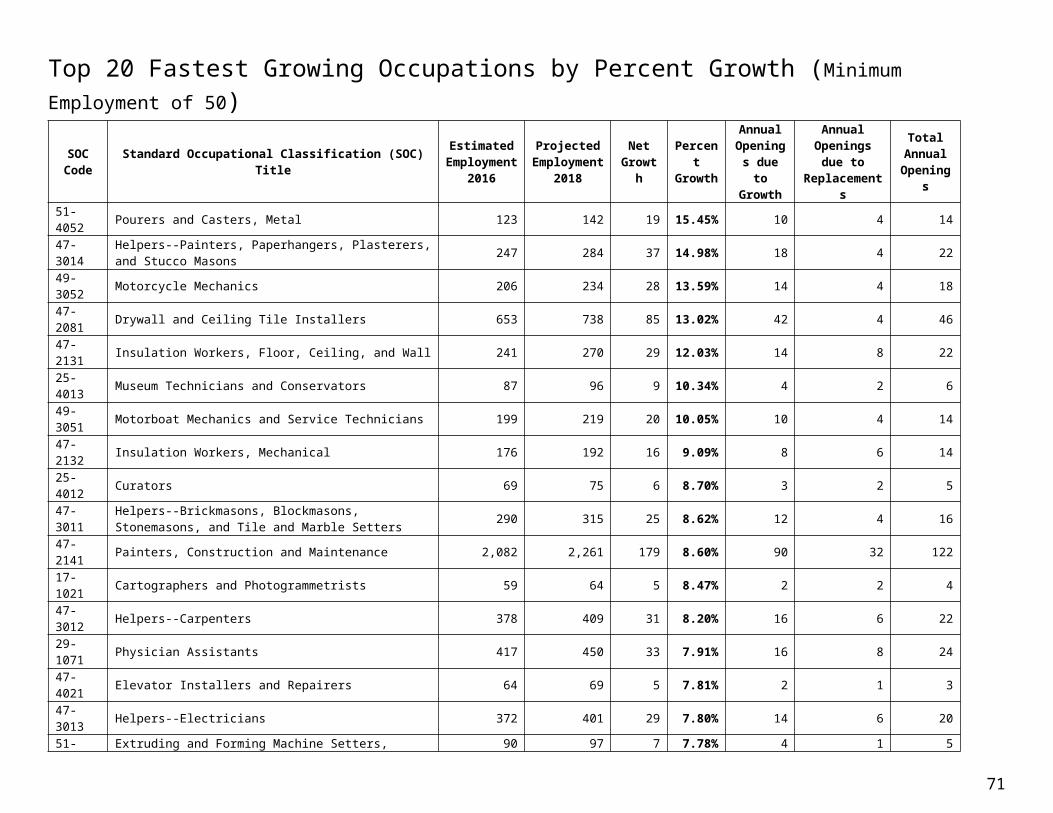
2016-2018 Arkansas Statewide Occupational ProjectionsSOC Code
Standard Occupational Classification(SOC) Title
Estimated Employment
2016
Projected Employment
2018Net
GrowthPercent Growth
Annual Openings
due to Growth
Annual Openings
due to Replacement
Total Annual
OpeningsEducation
CodeWork
Experience Code
JobTraining
Code
53-6061 Transportation Attendants, Except Flight Attendants 127 124 -3 -2.36% 0 2 2 7 3 5
53-6099 Transportation Workers, All Other 206 208 2 0.97% 1 9 10 7 3 553-7000 Material Moving Workers 47,349 48,918 1,569 3.31% 806 1,362 2,16853-7011 Conveyor Operators and Tenders 626 640 14 2.24% 7 18 25 8 3 553-7021 Crane and Tower Operators 654 697 43 6.57% 22 22 44 7 2 4
53-7032 Excavating and Loading Machine and Dragline Operators 541 553 12 2.22% 6 7 13 7 2 4
53-7051 Industrial Truck and Tractor Operators 6,493 6,700 207 3.19% 104 156 260 8 3 553-7061 Cleaners of Vehicles and Equipment 3,186 3,328 142 4.46% 71 114 185 8 3 5
53-7062 Laborers and Freight, Stock, and Material Movers, Hand 26,678 27,641 963 3.61% 482 824 1,306 8 3 5
53-7063 Machine Feeders and Offbearers 1,711 1,759 48 2.81% 24 39 63 8 3 553-7064 Packers and Packagers, Hand 5,131 5,239 108 2.10% 54 128 182 8 3 553-7073 Wellhead Pumpers 162 125 -37 -22.84% 0 6 6 7 2 453-7081 Refuse and Recyclable Material Collectors 1,883 1,945 62 3.29% 31 40 71 8 3 553-7121 Tank Car, Truck, and Ship Loaders 81 83 2 2.47% 1 2 3 8 3 553-7199 Material Moving Workers, All Other 96 98 2 2.08% 1 3 4 8 3 5
*For training codes, refer to page 85. 71
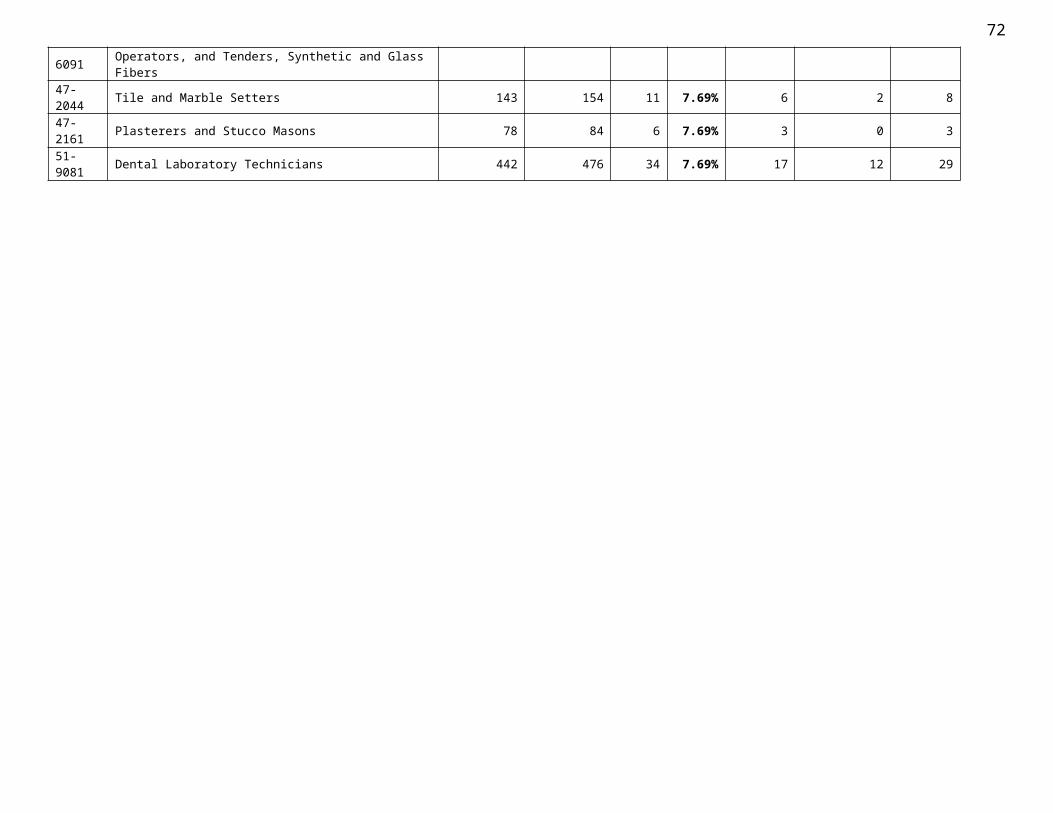
2016-2018 Arkansas Statewide Occupational Projections 72
2016-2018 Projections by Education LevelEducation Title
2016 Estimated
Employment
2018 Projected
EmploymentNet
ChangePercent Change
Annual Openings-
Growth
Annual Openings-
Replacement
Annual Openings-
TotalDoctoral or Professional Degree 31,545 32,663 1,118 3.54% 561 602 1,163Master's Degree 20,254 21,058 804 3.97% 400 422 822Bachelor's Degree 244,082 252,499 8,417 3.45% 4,266 5,049 9,315Associate's Degree 23,834 24,587 753 3.16% 382 479 861Postsecondary Non-Degree Award 103,176 105,938 2,762 2.68% 1,407 2,070 3,477Some College, No Degree 27,800 28,383 583 2.10% 293 411 704High School Diploma or Equivalent 549,996 563,639 13,643 2.48% 7,349 11,302 18,651No Formal Educational Credential 365,890 379,560 13,670 3.74% 7,026 11,540 18,566
Education Outlook Every education category is projected to see positive net growth between 2016 and 2018. Occupations needing a high school diploma or equivalent are expected to add 13,643 new jobs and 18,651 annual job openings, while those that do not require formal education are estimated to add 13,670 jobs and have 18,566 annual job openings. At 3.97 percent, occupations requiring a Master’s Degree are growing the fastest. Occupations requiring a college degree are forecast to add 11,092 jobs into the Arkansas job market and have a combined 12,161 annual openings.
*For training codes, refer to page 85.
0.00%
0.50%
1.00%
1.50%
2.00%
2.50%
3.00%
3.50%
4.00% 3.54%
3.97%
3.45%3.16%
2.68%
2.10%2.48%
3.74%
Percent Growth by Education Level
Doctoral or Professional Degree Master's DegreeBachelor's Degree Associate's DegreePostsecondary Non-Degree Award Some College, No DegreeHigh School Diploma or Equivalent No Formal Education
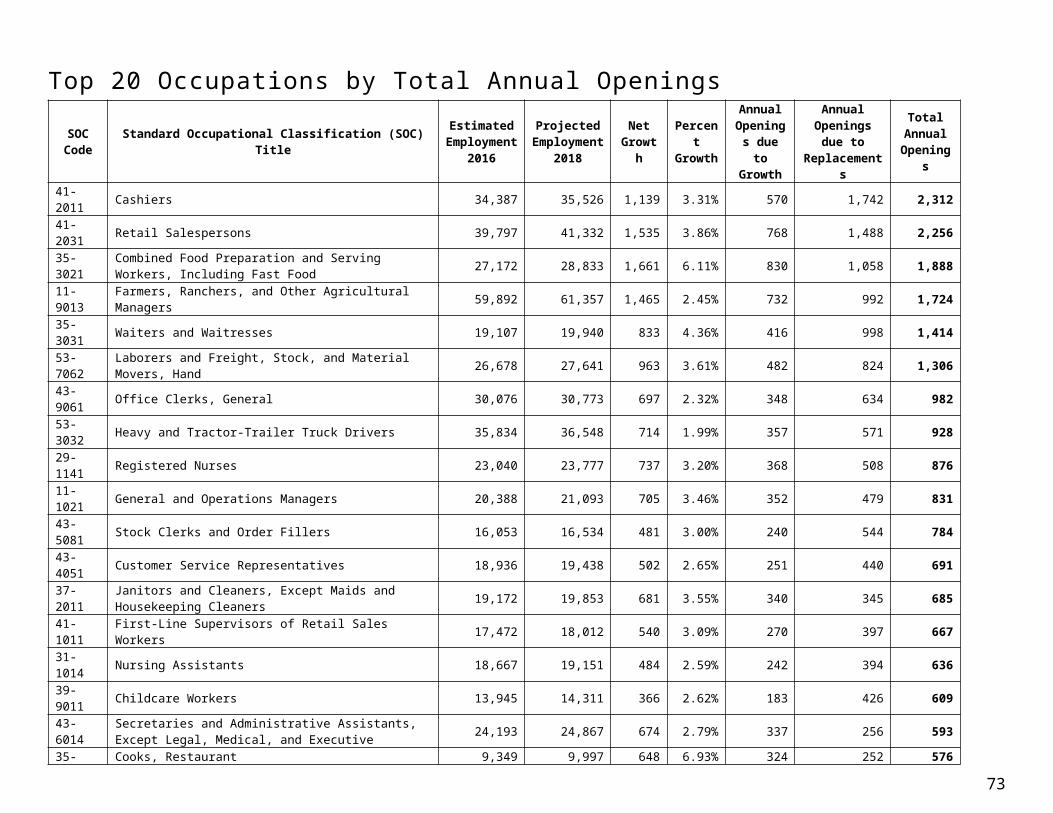
2016-2018 Arkansas Statewide Occupational Projections
Doctoral or Professional Degree
Master's Degree
Bachelor's Degree
Associate's Degree
Postsecondary Non-Degree Award
Some College, No Degree
High School Diploma or Equivalent
No Formal Education
0 3,000 6,000 9,000 12,000 15,000 18,000
1,163
822
9,315
861
3,477
704
18,651
18,566
Annual Openings by Education Level
Annual Openings-Replacement Total
Educ
atio
n Le
vel
*For training codes, refer to page 85. 73
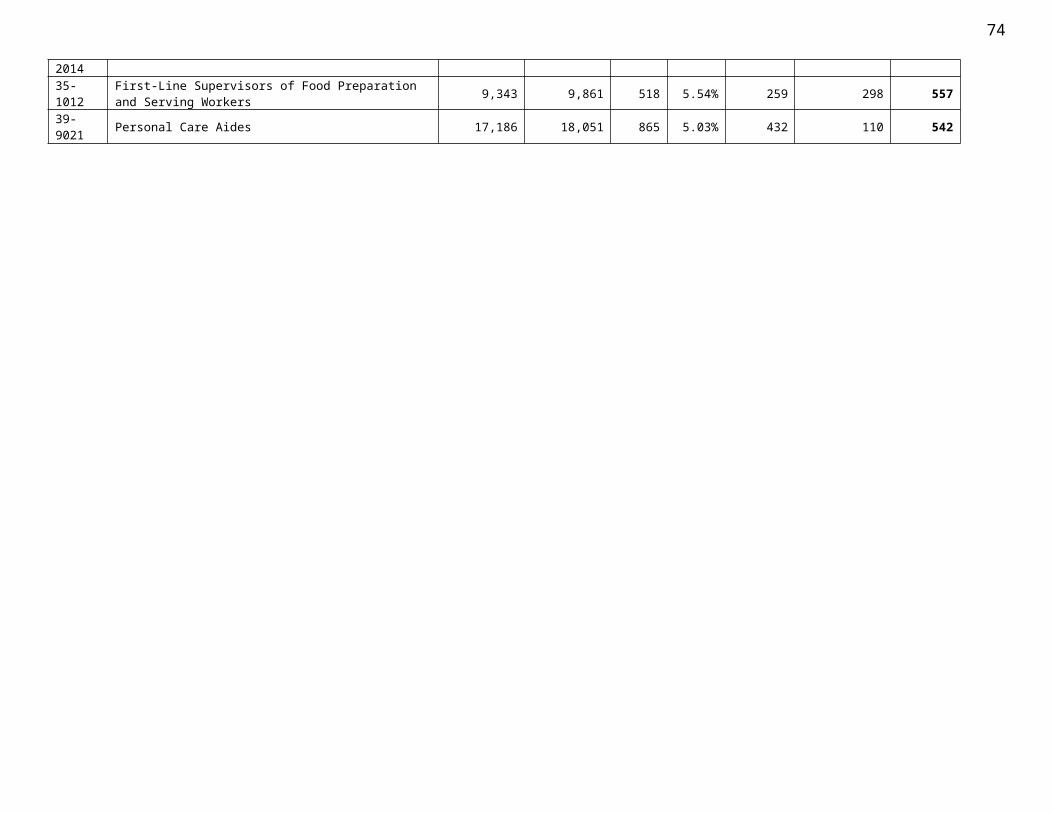
2016-2018 Arkansas Statewide Occupational Projections 74Hot Jobs by Educational Level (Ordered by Education Type and Total Annual Openings)
SOC Code Standard Occupational Classification Titles2016 2018
Net Growth
Percent
Growth
Annual Openings
due to Growth
Annual Openings
due to Replacement
Total Annual
Openings
WorkTrainingEstimated
EmploymentProjected
Employment Experience
Doctoral or Professional Degree29-1051 Pharmacists 3,353 3,459 106 3.16% 53 72 125 None None23-1011 Lawyers 4,130 4,263 133 3.22% 66 54 120 None None29-1123 Physical Therapists 2,069 2,193 124 5.99% 62 50 112 None None
Master’s Degree11-9032 Education Administrators, Elementary and Secondary School 2,363 2,444 81 3.43% 40 70 110 5 years or more None29-1127 Speech-Language Pathologists 1,892 1,997 105 5.55% 52 44 96 None None29-1171 Nurse Practitioners 1,424 1,532 108 7.58% 54 32 86 None None
Bachelor’s Degree29-1141 Registered Nurses 23,040 23,777 737 3.20% 368 508 876 None None11-1021 General and Operations Managers 20,388 21,093 705 3.46% 352 479 831 5 years or more None
25-2021 Elementary School Teachers, Except Special Education 11,853 12,257 404 3.41% 202 263 465 None Internship/Residency
Associate’s Degree25-2011 Preschool Teachers, Except Special Education 2,514 2,590 76 3.02% 38 73 111 None None29-2012 Medical and Clinical Laboratory Technicians 1,578 1,631 53 3.36% 26 38 64 None None23-2011 Paralegals and Legal Assistants 1,562 1,618 56 3.59% 28 31 59 None None31-2021 Physical Therapist Assistants 1,039 1,101 62 5.97% 31 28 59 None None
Postsecondary Non-Degree Award/Some College, No Degree53-3032 Heavy and Tractor-Trailer Truck Drivers 35,834 36,548 714 1.99% 357 571 928 None Short-Term OJT31-1014 Nursing Assistants 18,667 19,151 484 2.59% 242 394 636 None None29-2061 Licensed Practical and Licensed Vocational Nurses 12,057 12,341 284 2.36% 142 338 480 None None
High School Diploma or Equivalent11-9013 Farmers, Ranchers, and Other Agricultural Managers 59,892 61,357 1,465 2.45% 732 992 1,724 5 years or more None
43-9061 Office Clerks, General 30,076 30,773 697 2.32% 348 634 982 None Short-Term OJT43-4051 Customer Service Representatives 18,936 19,438 502 2.65% 251 440 691 None Short-Term OJT
No Formal Education Required41-2011 Cashiers 34,387 35,526 1,139 3.31% 570 1742 2,312 None Short-Term OJT
41-2031 Retail Salespersons 39,797 41,332 1,535 3.86% 768 1,488 2,256 None Short-Term OJT
35-3021 Combined Food Preparation and Serving Workers, Including Fast Food 27,172 28,833 1,661 6.11% 830 1,058 1,888 None Short-Term OJT
*For training codes, refer to page 85.

2016-2018 Arkansas Statewide Occupational ProjectionsWhile formal education training is important, other factors are important or required by employers to receive competency in a particular job or to even be considered for certain jobs. One factor is work experience. Many occupations require some work experience in the line of work, especially those in career ladder occupations. For example, to become a manager, most employees need experience working in the line of work they will be managing. The following table shows projections by length of experience generally recommended or required.
2016-2018 Projections by Amount of Work Experience
Work Experience Title2016
Estimated Employment
2018 Projected
EmploymentNet
ChangePercent Change
Annual Openings-
Growth
Annual Openings-
Replacement
Annual Openings-
Total
5 years or more 112,638 115,894 3,256 2.89% 1,623 2,039 3,662Less than 5 years 142,153 146,904 4,751 3.34% 2,418 2,958 5,376None 1,111,786 1,145,529 33,743 3.04% 17,643 26,878 44,521
Work Experience Outlook
*For training codes, refer to page 85.
2.60%
2.70%
2.80%
2.90%
3.00%
3.10%
3.20%
3.30%
3.40%
2.89%
3.34%3.04%
Percent Growth by Amount of Work Experience
5 or More Years Less than 5 Years None
75
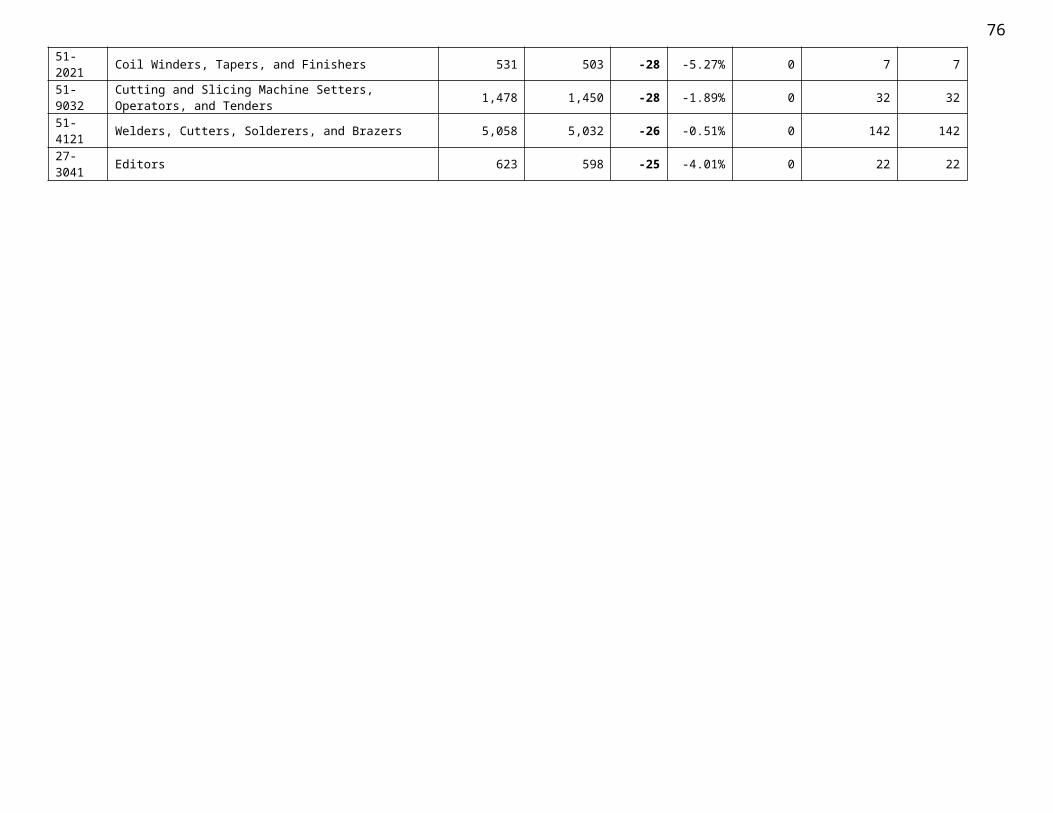
2016-2018 Arkansas Statewide Occupational Projections 76
More than 5 Years
Less than 5 Years
None
0 5,000 10,000 15,000 20,000 25,000 30,000 35,000 40,000
3,662
5,376
Annual Openings by Amount of Work Experience
Annual Openings-Replacement Total
Am
ount
of W
ork
Expe
rienc
e
*For training codes, refer to page 85.

2016-2018 Arkansas Statewide Occupational ProjectionsAnother factor in determining full competency in an occupation is on-the-job training. Many occupations require additional training beyond formal education. Many jobs in education and the medical field require internships or residency. Many skills-trade occupations recommend or require apprenticeship programs. The following table shows projections by type of training needed.
2016-2018 Projections by Type of On-the-Job TrainingJob Training Title
2016 Estimated
Employment
2018 Projected
EmploymentNet
ChangePercent Change
Annual Openings-
Growth
Annual Openings-
Replacement
Annual Openings-
TotalApprenticeship 20,568 21,738 1,170 5.69% 584 299 883Internship/Residency 54,326 56,261 1,935 3.56% 969 1,200 2,169Long-Term On-the-Job Training 58,640 60,396 1,756 2.99% 959 1,413 2,372Moderate-Term On-the-Job Training 225,722 230,414 4,692 2.08% 2,836 4,698 7,534Short-Term On-the-Job Training 559,510 577,318 17,808 3.18% 9,078 15,332 24,410None 447,811 462,200 14,389 3.21% 7,258 8,933 16,191
Training Outlook
*For training codes, refer to page 85.
0.00%
1.00%
2.00%
3.00%
4.00%
5.00%
6.00%
5.69%
3.56% 2.99%2.08%
3.18% 3.21%
Percent Growth by Type of On-the-Job Training
Apprenticeship Internship/Residency Long-Term OJTModerate-Term OJT Short-Term OJT None
77
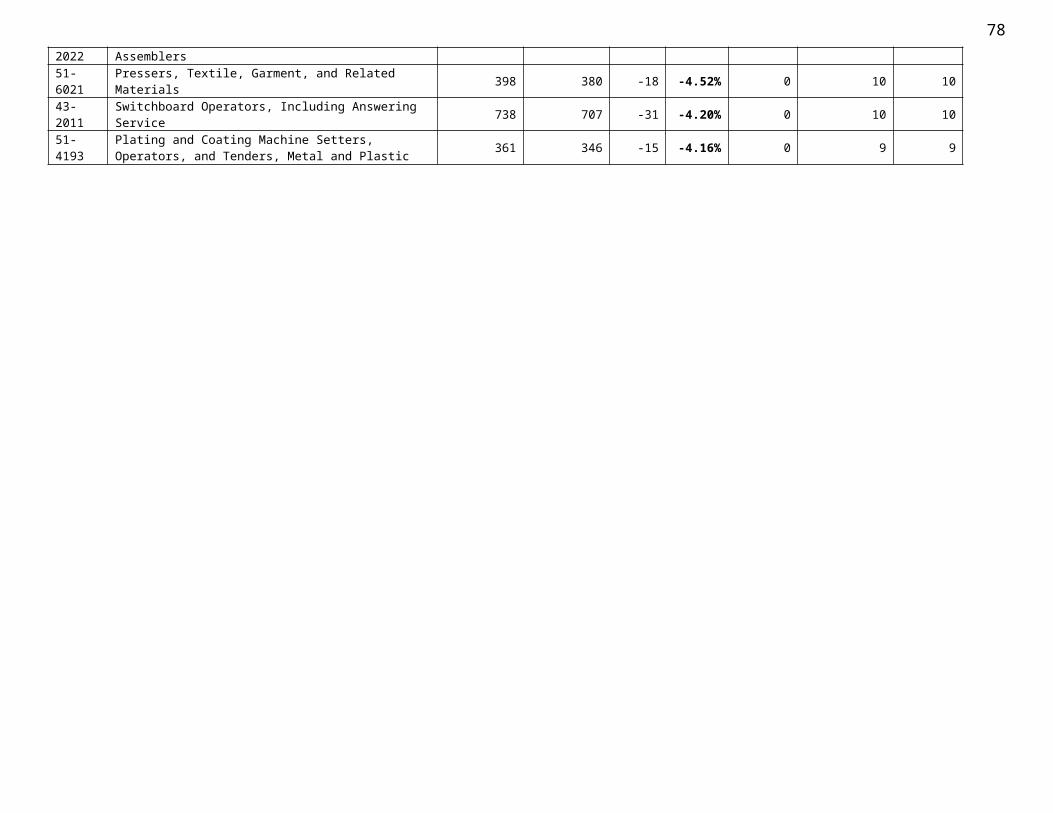
2016-2018 Arkansas Statewide Occupational Projections 78
What matters most when looking for a job is not necessarily education alone or even your experience or additional on-the-job training, but it’s the total package. Each occupation has a recommended path to become competent in that field. Each contains the recommended level of education, the length of work experience generally needed, and any additional on-the-job training needed. However, keep in mind that some employers may have more requirements and some may even have less. The following table shows projections by education/training path.
2016-2018 Projections by Education Training PathEducation Work
ExperienceAdditional
Training2016
Estimated Employment
2018 Projected
EmploymentNet
ChangePercen
t Change
Annual Openings-
Growth
Annual Openings-
Replacement
Annual Openings-
TotalDoctoral or
Professional Degree5 years or
moreShort-Term On-the-Job Training 752 761 9 1.20% 4 10 14
Doctoral or Professional Degree
Less than 5 years None 2,270 2,349 79 3.48% 40 36 76
Doctoral or Professional Degree None Internship/
Residency 7,395 7,685 290 3.92% 146 184 330
Doctoral or Professional Degree None None 21,128 21,868 740 3.50% 371 372 743
Master's Degree 5 years or more None 4,014 4,149 135 3.36% 67 80 147
Master's Degree Less than 5 years None 2,356 2,426 70 2.97% 35 61 96
Master's Degree None Internship/Residency 929 963 34 3.66% 17 18 35
Master's Degree None None 12,955 13,520 565 4.36% 281 263 544
Bachelor's Degree 5 years or more None 39,122 40,410 1,288 3.29% 642 847 1,489
Bachelor's Degree Less than 5 years
Internship/Residency 1,071 1,097 26 2.43% 13 26 39
Bachelor's Degree Less than 5 years
Moderate-Term On-the-Job
Training161 162 1 0.62% 0 2 2
*For training codes, refer to page 85.

2016-2018 Arkansas Statewide Occupational ProjectionsEducation Work
ExperienceAdditional
Training2016
Estimated Employment
2018 Projected
EmploymentNet
ChangePercen
t Change
Annual Openings-
Growth
Annual Openings-
Replacement
Annual Openings-
Total
Bachelor's Degree Less than 5 years None 38,458 39,756 1,298 3.38% 666 775 1,441
Bachelor's Degree Less than 5 years
Short-Term On-the-Job Training 196 200 4 2.04% 2 4 6
Bachelor's Degree None Internship/Residency 44,931 46,516 1,585 3.53% 793 972 1,765
Bachelor's Degree None Long-Term On-the-Job Training 7,602 7,940 338 4.45% 167 206 373
Bachelor's Degree NoneModerate-Term
On-the-Job Training
21,535 22,380 845 3.92% 429 409 838
Bachelor's Degree None None 89,580 92,589 3,009 3.36% 1,538 1,781 3,319
Bachelor's Degree None Short-Term On-the-Job Training 1,426 1,449 23 1.61% 16 27 43
Associate's Degree Less than 5 years None 759 780 21 2.77% 10 14 24
Associate's Degree None Long-Term On-the-Job Training 554 566 12 2.17% 8 12 20
Associate's Degree NoneModerate-Term
On-the-Job Training
1,891 1,944 53 2.80% 26 45 71
Associate's Degree None None 20,427 21,096 669 3.28% 338 404 742
Associate's Degree None Short-Term On-the-Job Training 203 201 -2 -0.99% 0 4 4
Postsecondary Non-Degree Award
5 years or more
Moderate-Term On-the-Job
Training40 41 1 2.50% 0 1 1
Postsecondary Non-Degree Award
Less than 5 years
Moderate-Term On-the-Job
Training751 765 14 1.86% 7 31 38
Postsecondary Non-Degree Award
Less than 5 years None 367 380 13 3.54% 7 10 17
Postsecondary Non-Degree Award
Less than 5 years
Short-Term On-the-Job Training 723 713 -10 -1.38% 0 6 6
Postsecondary Non-Degree Award None Long-Term On-
the-Job Training 6,463 6,688 225 3.48% 118 138 256
Postsecondary Non-Degree Award None
Moderate-Term On-the-Job
Training2,379 2,401 22 0.92% 11 26 37
Postsecondary Non- None None 49,792 51,313 1,521 3.05% 775 1,120 1,895
*For training codes, refer to page 85. 79
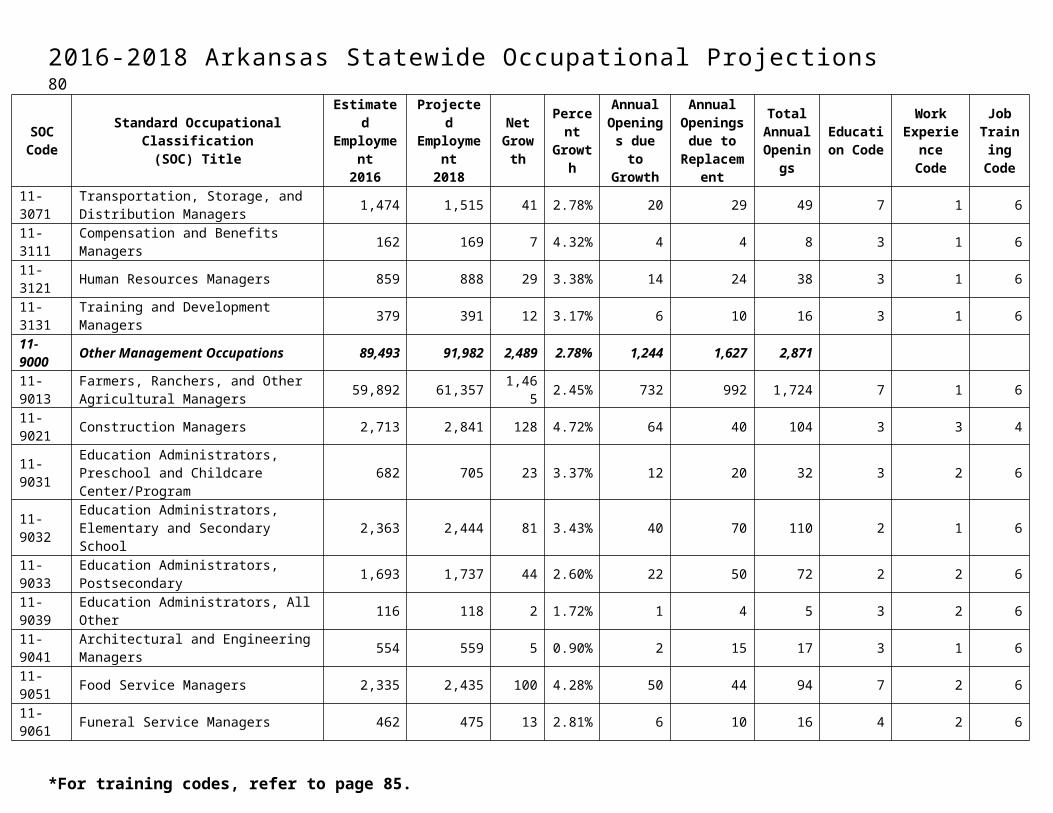
2016-2018 Arkansas Statewide Occupational Projections 80
Education Work Experience
Additional Training
2016 Estimated
Employment
2018 Projected
EmploymentNet
ChangePercen
t Change
Annual Openings-
Growth
Annual Openings-
Replacement
Annual Openings-
TotalDegree Award
Postsecondary Non-Degree Award None Short-Term On-
the-Job Training 42,661 43,637 976 2.29% 489 738 1,227
Some College, No Degree None Long-Term On-
the-Job Training 78 77 -1 -1.28% 0 2 2
Some College, No Degree None
Moderate-Term On-the-Job
Training13,241 13,304 63 0.48% 32 129 161
Some College, No Degree None None 13,439 13,929 490 3.65% 245 260 505
Some College, No Degree None Short-Term On-
the-Job Training 1,042 1,073 31 2.98% 16 20 36
High School Diploma Or Equivalent
5 years or more
Long-Term On-the-Job Training 61 67 6 9.84% 3 2 5
High School Diploma Or Equivalent
5 years or more
Moderate-Term On-the-Job
Training618 638 20 3.24% 10 16 26
High School Diploma Or Equivalent
5 years or more None 68,031 69,828 1,797 2.64% 897 1,083 1,980
High School Diploma Or Equivalent
Less than 5 years
Long-Term On-the-Job Training 138 135 -3 -2.17% 0 2 2
High School Diploma Or Equivalent
Less than 5 years
Moderate-Term On-the-Job
Training4,561 4,636 75 1.64% 57 130 187
High School Diploma Or Equivalent
Less than 5 years None 80,993 83,508 2,515 3.11% 1,257 1,609 2,866
High School Diploma Or Equivalent None Apprenticeship 20,568 21,738 1,170 5.69% 584 299 883
High School Diploma Or Equivalent None Long-Term On-
the-Job Training 38,619 39,553 934 2.42% 536 937 1,473
High School Diploma Or Equivalent None
Moderate-Term On-the-Job
Training157,499 160,009 2,510 1.59% 1,604 3,407 5,011
High School Diploma Or Equivalent None None 2,184 2,269 85 3.89% 42 28 70
High School Diploma Or Equivalent None Short-Term On-
the-Job Training 176,724 181,258 4,534 2.57% 2,359 3,789 6,148
No Formal Educational
Less than 5 years
Moderate-Term On-the-Job
9,349 9,997 648 6.93% 324 252 576
*For training codes, refer to page 85.
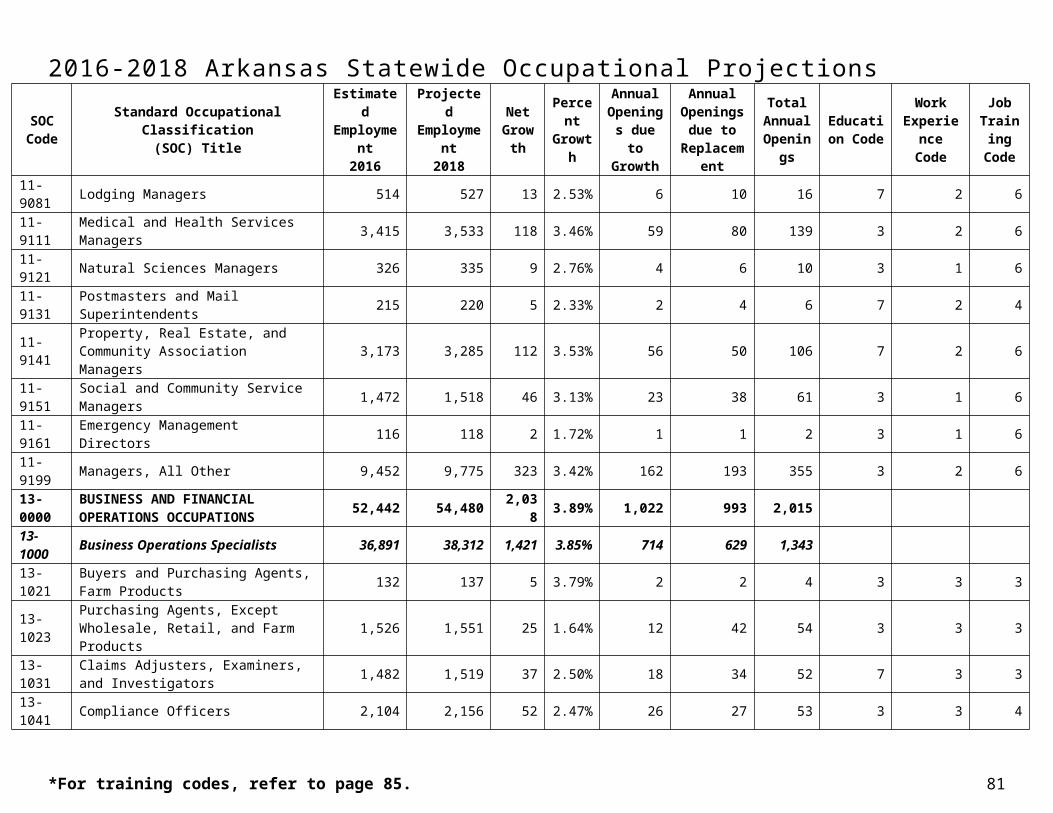
2016-2018 Arkansas Statewide Occupational ProjectionsEducation Work
ExperienceAdditional
Training2016
Estimated Employment
2018 Projected
EmploymentNet
ChangePercen
t Change
Annual Openings-
Growth
Annual Openings-
Replacement
Annual Openings-
TotalCredential TrainingNo Formal
Educational Credential
None Long-Term On-the-Job Training 5,125 5,370 245 4.78% 127 114 241
No Formal Educational Credential
NoneModerate-Term
On-the-Job Training
13,697 14,137 440 3.21% 336 250 586
No Formal Educational Credential
None None 1,936 2,030 94 4.86% 47 190 237
No Formal Educational Credential
None Short-Term On-the-Job Training 335,783 348,026 12,243 3.65% 6,192 10,734 16,926
*For training codes, refer to page 85. 81
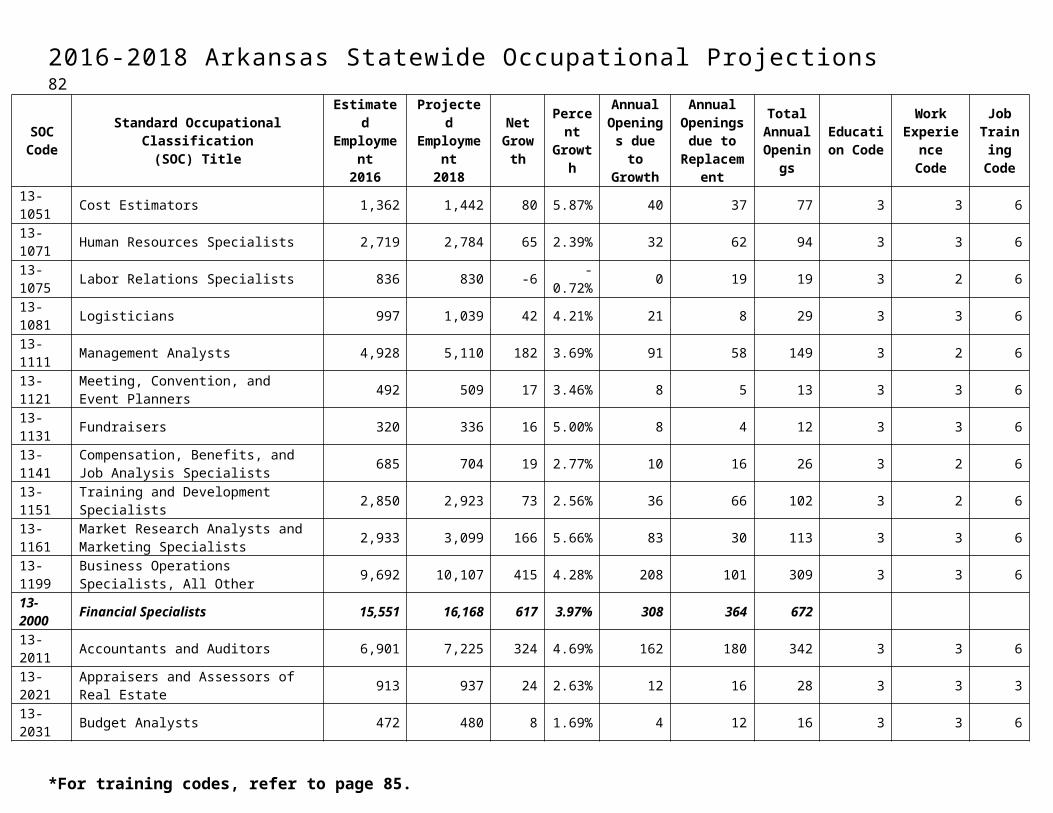
82
Top 15 Content Skills (Learned capabil it ies that al low workers to master and perform the specific activities of their jobs)
Skills Total Demand Definition
Active Listening 20,669 Giving full attention to what other people are saying, taking time to understand the points being made, asking questions as appropriate, and not interrupting at inappropriate times.
Speaking 20,470 Talking to others to convey information effectively.
Reading Comprehension 9,767 Understanding written sentences and paragraphs in work related documents.
Social Perceptiveness 9,494 Being aware of other’s reactions and understanding why they react as they do.
Critical Thinking 6,046 Using logic and reasoning to identify the strengths and weaknesses of alternative solutions, conclusions or approaches to problems.
Monitoring 5,584 Monitoring/Assessing performance of yourself, other individuals, or organizations to make improvements or take corrective action.
Service Orientation 5,579 Actively looking for ways to help people.
Coordination 4,987 Adjusting actions in relation to others' actions.
Instructing 4,949 Teaching others how to do something.
Writing 4,889 Communicating effectively in writing as appropriate for the needs of the audience.
Judgment and Decision Making 3,723 Considering the relative costs and benefits of potential actions to choose the most appropriate one.
Learning Strategies 3,449 Selecting and using training/instructional methods and procedures appropriate for the situation when learning or teaching new things.
Time Management 1,952 Managing one’s own time and the time of others.
Repairing 1,668 Repairing machines or systems using the needed tools.
Equipment Maintenance 1,593 Performing routine maintenance on equipment and determining when and what kind of maintenance is needed.
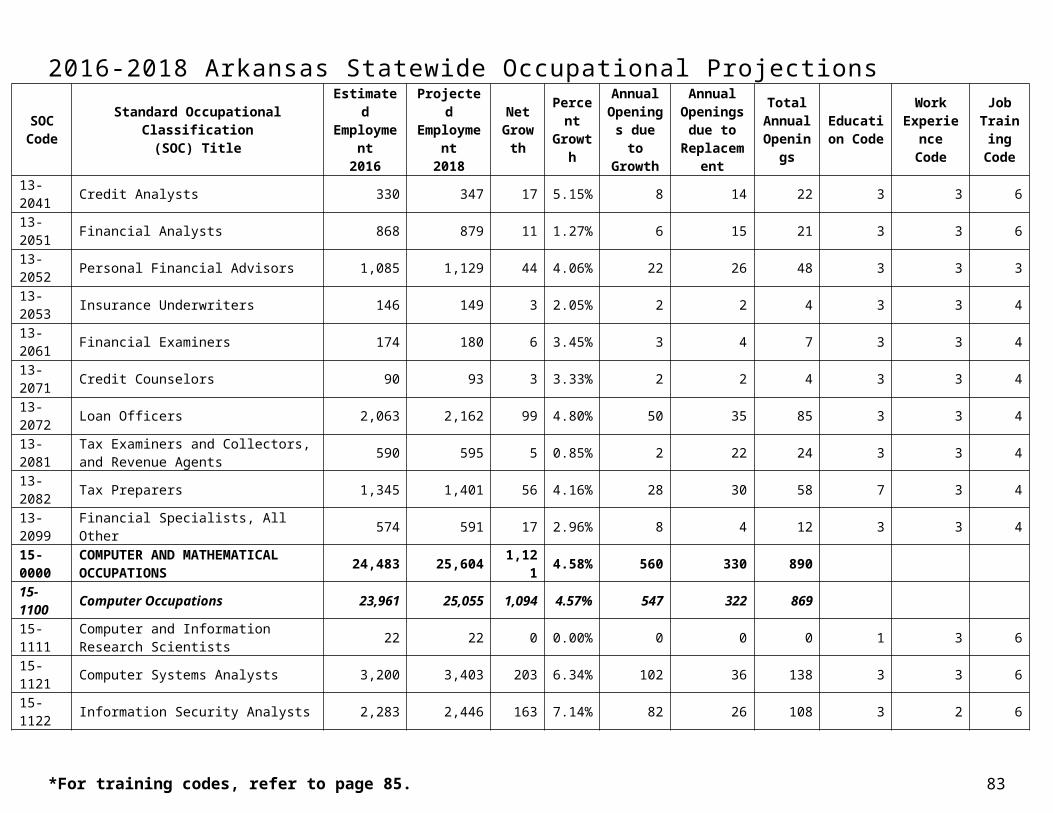
Top 15 Knowledge Domains (Learned sets of facts and standards required by many work situations)
Knowledge Domains Total Demand Definition
Customer and Personal Service 41,654Knowledge of principles and processes for providing customer and personal services. This includes customer needs assessment, meeting quality standards for services, and evaluation of customer satisfaction.
English Language 19,027Knowledge of principles and processes for providing customer and personal services. This includes customer needs assessment, meeting quality standards for services, and evaluation of customer satisfaction.
Administration and Management 9,608Knowledge of business and management principles involved in strategic planning, resource allocation, human resources modeling, leadership technique, production methods, and coordination of people and resources.
Education and Training 6,740 Knowledge of principles and methods for curriculum and training design, teaching and instruction for individuals and groups, and the measurement of training effects.
Psychology 5,768Knowledge of human behavior and performance; individual differences in ability, personality, and interests; learning and motivation; psychological research methods; and the assessment and treatment of behavioral and affective disorders.
Clerical 5,625Knowledge of administrative and clerical procedures and systems such as word processing, managing files and records, stenography and transcription, designing forms, and other office procedures and terminology.
Medicine and Dentistry 5,514Knowledge of the information and techniques needed to diagnose and treat human injuries, diseases, and deformities. This includes symptoms, treatment alternatives, drug properties and interactions, and preventive health-care measures.
Mechanical 3,954 Knowledge of machines and tools, including their designs, uses, repair, and maintenance.
Sales and Marketing 3,841Knowledge of principles and methods for showing, promoting, and selling products or services. This includes marketing strategy and tactics, product demonstration, sales techniques, and sales control systems.
Building and Construction 3,803 Knowledge of materials, methods, and the tools involved in the construction or repair of houses, buildings, or other structures such as highways and roads.
Mathematics 2,723 Knowledge of arithmetic, algebra, geometry, calculus, statistics, and their applications.
Computers and Electronics 2,482 Knowledge of circuit boards, processors, chips, electronic equipment, and computer hardware and software, including applications and programming.
Public Safety and Security 2,131Knowledge of relevant equipment, policies, procedures, and strategies to promote effective local, state, or national security operations for the protection of people, data, property, and institutions.
Production and Processing 1,767 Knowledge of raw materials, production processes, quality control, costs, and other techniques for maximizing the effective manufacture and distribution of goods.
Economics and Accounting 1,487 Knowledge of economic and accounting principles and practices, the financial markets, banking and the analysis and reporting of financial data.
83
84
Appendix: Definition of Education/Training CodesEducation
Code Type of Education Definition
1 Doctoral or Professional Degree Requires at least three years of full-time academic study beyond a Bachelor’s Degree.
2 Master's Degree Requires one or two years of full-time academic study beyond a Bachelor’s Degree.
3 Bachelor's Degree Requires four to five years of full-time academic study beyond High School.
4 Associate’s Degree Requires at least two years of full-time academic study beyond High School.
5 Postsecondary Non-Degree Award Programs last a few weeks to more than a year; leads to a certificate or other award, but not a degree.
6 Some College, No Degree Signifies the completion of a High School Diploma or equivalent program and one or more postsecondary courses that did not result in a degree or award.
7 High School Diploma or Equivalent Signifies completion of high school or an equivalent program resulting in an award of a High School Diploma or an equivalent.
8 No Formal Education Credential Signifies completion of any level of primary or secondary education that did not result in a High School Diploma or equivalent.
WorkExperience
CodeAmount of Work Experience
1 5 or More Years
2 Less than 5 Years
3 None
JobTraining
CodeType of Training Definition
1 Apprenticeship Combination of on-the-job training and related classroom instruction in which workers learn the practical and theoretical aspects of an occupation.
2 Internship/Residency Involves preparation in a field under supervision in a professional setting. Commonly results in a license upon completion.
3 Long-Term On-the-Job Training Requires twelve months of training or a combination of work experience and classroom instruction.
4 Moderate-Term On-the-Job Training Requires one to twelve months of a combination of work experience and classroom instruction.
5 Short-Term On-the-Job Training Requires a short demonstration of job duties or one month or less of training or work experience.
6 None No additional training or preparation required.
This workforce product was funded by a grant awarded by the U.S. Department of Labor's Employment and Training Administration. The product was created by the recipient and does not necessarily reflect the official position of the U.S. Department of Labor. The Department of Labor makes no guarantees, warranties, or assurances of any kind, express or implied, with respect to such information, including any information on linked sites and including, but not limited to, accuracy of the information or its completeness, timeliness, usefulness, adequacy, continued availability, or ownership. This product is copyrighted by the institution that created it. Internal use by an organization and/or personal use by an individual for non-commercial purposes is permissible. All other uses require the prior authorization of the copyright owner.
85