Embed Size (px)
Citation preview
As easy as pie: How retirement savers use prescribed investment disclosures Hazel Bateman* Isabella Dobrescu* Ben R. Newell* Andreas Ortmann* Susan Thorp#
*University of New South Wales #University of Technology Sydney

BACKGROUND: regulated choice architecture
.

Regulators want clear, comparable communication for better decisions. Concerned about consumers’ ‘financial mistakes’ Stipulating content of investment disclosures Common elements in fund choice disclosures: Type of investment fund Objectives Risk Past performance Fees
How do ordinary retirement plan members use these disclosures?
Existing evidence shows that things don’t always go to plan… Complexity can lead to ad hoc diversification and reliance on
defaults (Benartzi and Thaler 2001; Agnew et al. 2011; Morrin et al. 2012; Madrian and Shea 2001; Beshears et al. 2008) More choice is not always better (Benartzi and Thaler 2001; Brown
et al. 2007; Scheibehenne et al. 2010) Stipulated changes to information disclosure may have
unintended consequences (Navarro-Martinez et al. 2011) Non-salient information can tilt decisions (Choi et al. 2010)

Australian policy context Regulatory approach to mandatory private retirement saving
(superannuation) choice of pension fund and investment options, supported by product disclosure (and defaults) Phase 1: (From 2001) – long and detailed product disclosure
statements (PDSs), lack of easy comparison Phase 2: (From June 2012) – Shorter Product Disclosure
Statements (8 A4) with prescribed format and information
6
Shorter Product Disclosure Statements From June 2012, prescriptive regulations for 8 A4 page PDS Prescribed information:
1. About the superannuation fund x 2. How super works 3. Benefits of investing with superannuation fund x 4. Risks of super 5. How we invest your money 6. Fees and costs 7. How super is taxed 8. Insurance and your super 9. How to open an account

7
Shorter Product Disclosure Statements From June 2012, prescriptive regulations for 8 A4 page PDS Prescribed information:
1. About the superannuation fund x 2. How super works 3. Benefits of investing with superannuation fund x 4. Risks of super 5. How we invest your money 6. Fees and costs 7. How super is taxed 8. Insurance and your super 9. How to open an account


Standard risk measure and Risk label
Source: APRA Insight, 2012
How are superannuation fund members responding to the new communication regimes? Which specific information items are used by consumers?
Does this match regulator intention?
What is the cross-sectional variation in information use?
What happens to default patterns?

Experimental design .

Experiment: How do pension fund members choose investments using prescribed information? September 2012 and May 2013 172 university staff and students Lab experiments: Research Lab at UNSW TASK: Pairwise comparisons of 10 investment options using
UniSuper investment guide (single sector & pre-mixed) At least 45 comparisons per subject W/Wo labels (name/description of option) Holt-Laury lottery task; Dospert measure risk attitude Demographics, financial literacy, numeracy Show up fee + Incentive paid -> random return from most preferred
investment option. (OR return from default option)
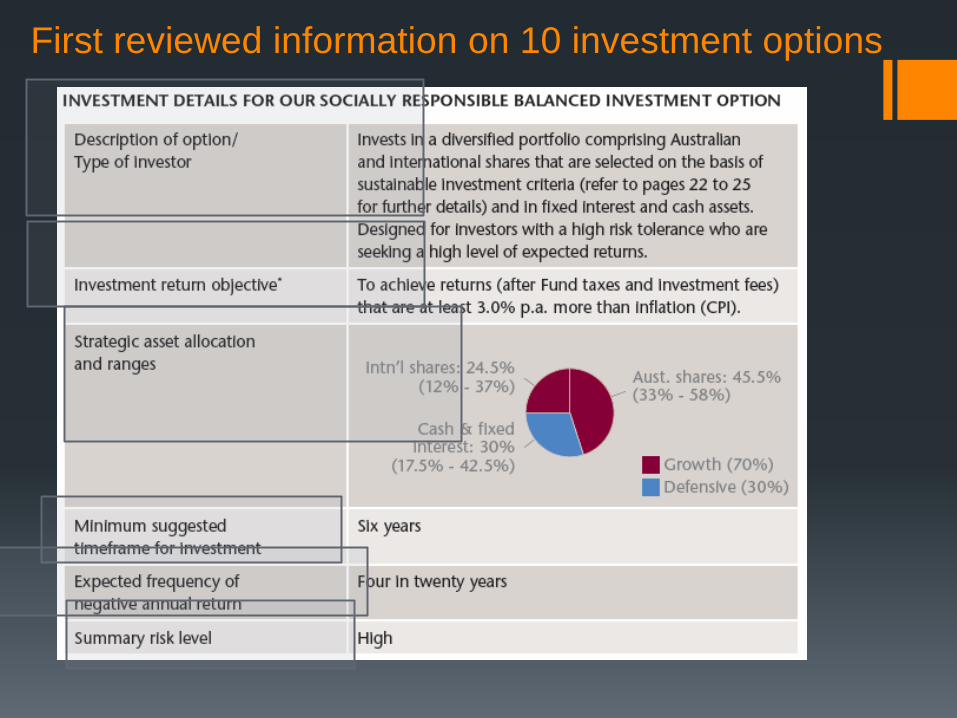
First reviewed information on 10 investment options
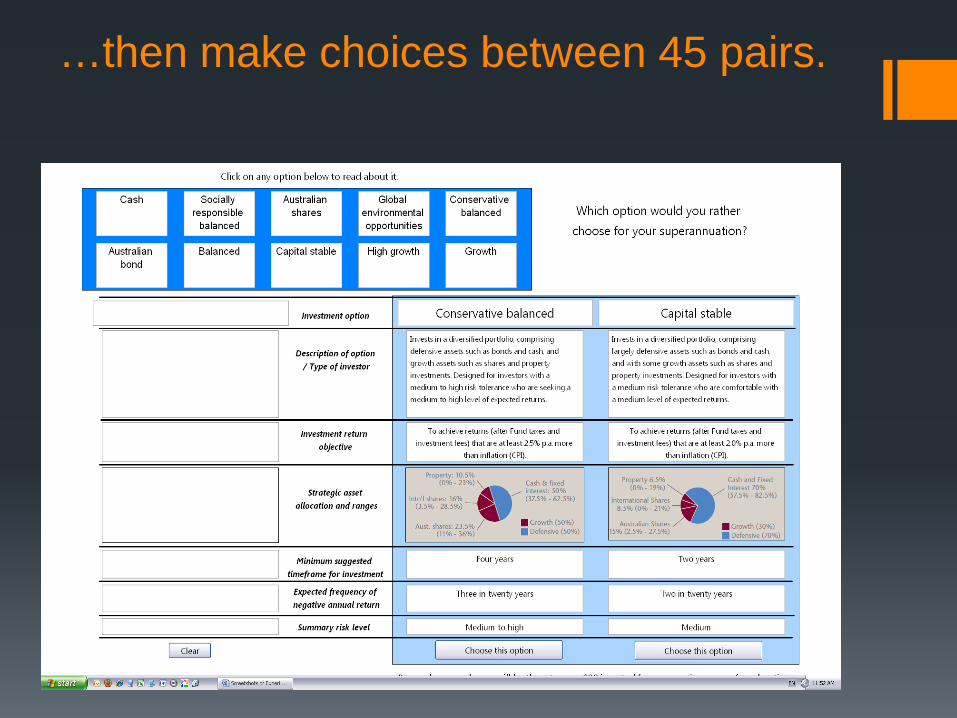
…then make choices between 45 pairs.

Option name Return Risk Performance Return Negative Summary Inferred
over CPI returns risk Sharpe (% p.a.) (years in 20) level ratio
Capital stable 2.0 2 medium 0.28
Socially responsible balanced 3.0 4 high 0.30 Growth 4.0 5 high 0.30
Cash 1.0 negligible very low -
Australian bonds 1.5 3 medium to
high 0.13
Australian shares 5.0 6 very high 0.27
Global environmental opportunities
5.0 6 very high 0.27
Conservative balanced 2.5 3
medium to high
0.30
Balanced 3.0 4 high 0.30 High growth 5.0 5 high 0.34
Key information disclosed: Investment returns and risk

Asset allocation information provides information on investment option features: concentration and share (deviation from 1/n)
Option name Concentration measures
Herfindahl Deviation
Index from
1/n
Capital stable 0.52 0.27
Socially responsible balanced 0.36 0.02
Growth 0.30 0.10
Cash 1.00 1.00
Australian bonds 1.00 1.00
Australian shares 1.00 1.00
Global environmental opportunities 1.00 1.00
Conservative balanced 0.34 0.09
Balanced 0.27 0.07
High growth 0.42 0.17

Results .
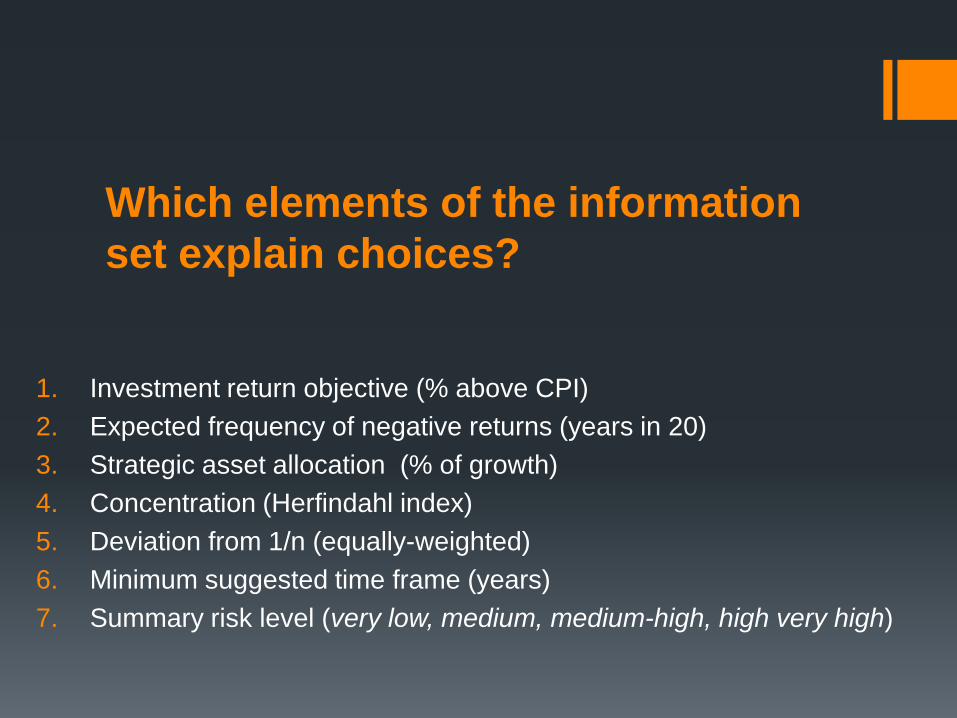
Which elements of the information set explain choices?
1. Investment return objective (% above CPI) 2. Expected frequency of negative returns (years in 20) 3. Strategic asset allocation (% of growth) 4. Concentration (Herfindahl index) 5. Deviation from 1/n (equally-weighted) 6. Minimum suggested time frame (years) 7. Summary risk level (very low, medium, medium-high, high very high)

Safer, premixed options are most popular
option Labelled Pie Chart
Not labelled Pie Chart
Labelled Table
Capital stable 71 72 64
Socially responsible balanced 62 58 55
Growth 65 63 62
Cash 24 28 28
Australian bonds 26 29 28
Australian shares 24 27 39
Global environmental opportunities 27 22 41
Conservative balanced 75 76 62
Balanced 69 68 62
High growth 57 57 58
Option selected as best, per cent of choices

Estimation approach – to investigate use of the prescribed information Regress pairwise choices on difference in returns, risk,
growth %, concentration index, deviation from 1/n, timeframe, summary risk measure indicators, and interactions 1. Pooled choice model - add indicator for treatments and
experiment rounds, staff/student indicator and demographics
2. Individual choice models

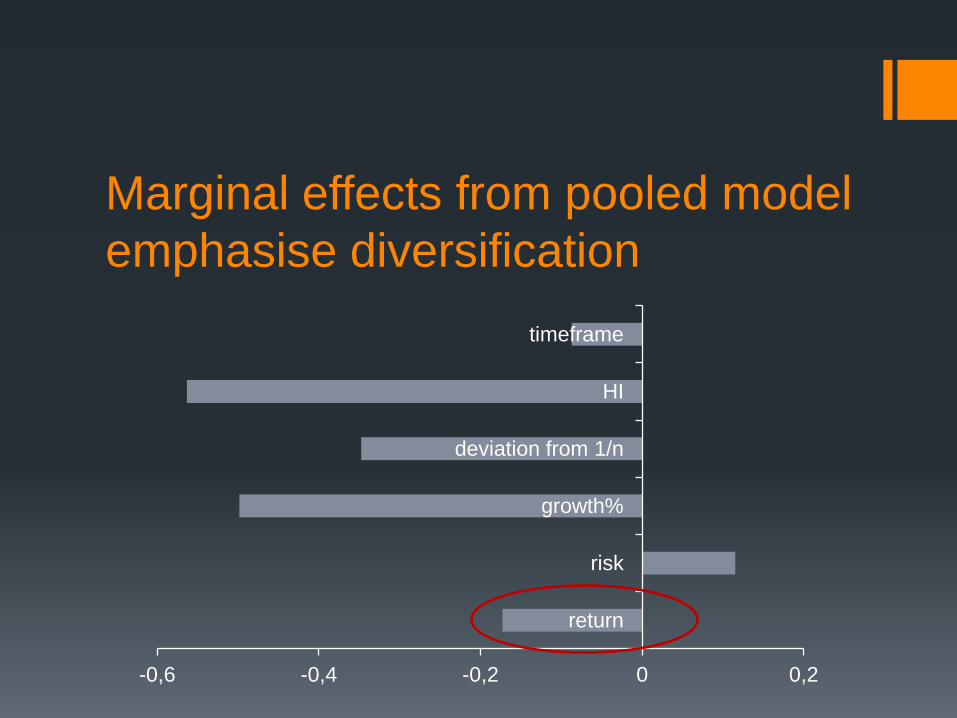
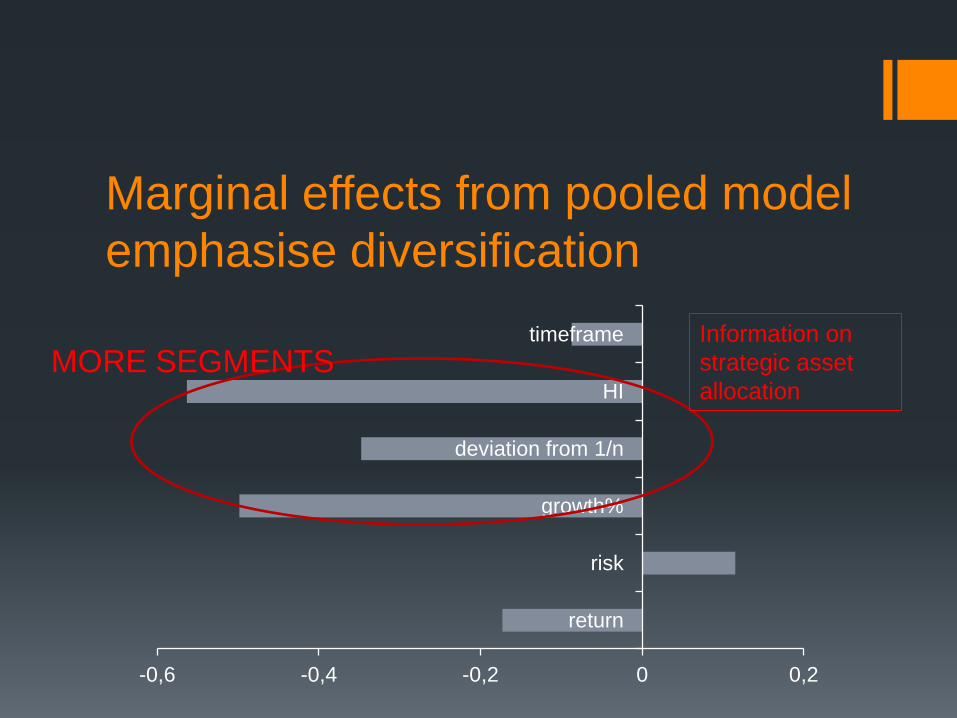
Marginal effects from pooled model emphasise diversification
-0,6 -0,4 -0,2 0 0,2
return
risk
growth%
deviation from 1/n
HI
timeframe

Marginal effects from pooled model emphasise diversification
-0,6 -0,4 -0,2 0 0,2
return
risk
growth%
deviation from 1/n
HI
timeframe
Marginal effects from pooled model emphasise diversification
-0,6 -0,4 -0,2 0 0,2
return
risk
growth%
deviation from 1/n
HI
timeframe

Marginal effects from pooled model emphasise diversification
-0,6 -0,4 -0,2 0 0,2
return
risk
growth%
deviation from 1/n
HI
timeframe Information on strategic asset allocation
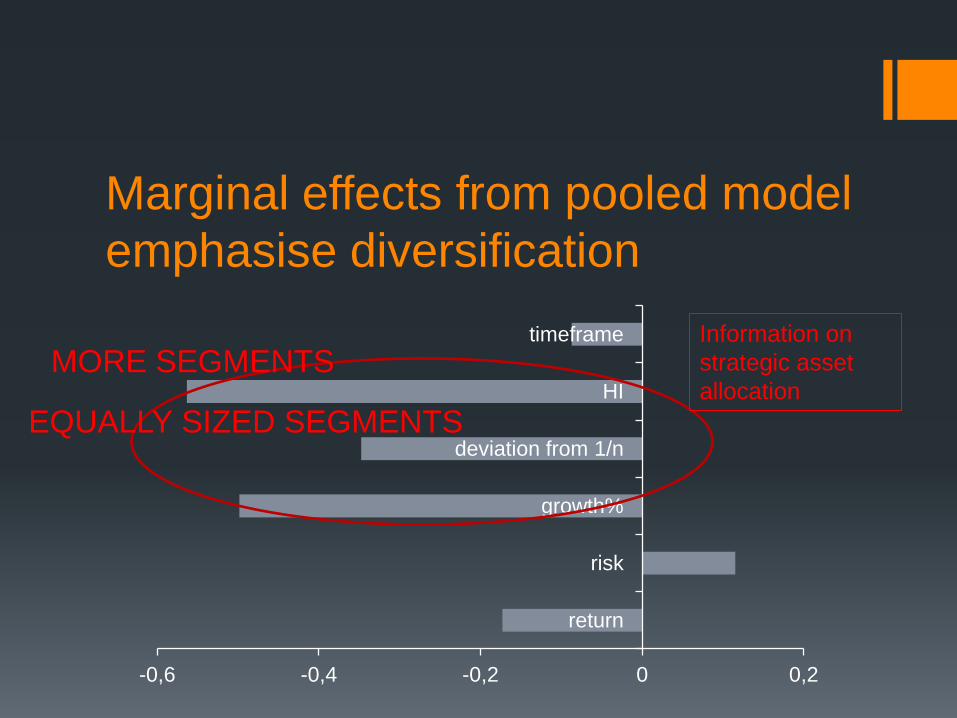
Marginal effects from pooled model emphasise diversification
-0,6 -0,4 -0,2 0 0,2
return
risk
growth%
deviation from 1/n
HI
timeframe Information on strategic asset allocation
MORE SEGMENTS
Marginal effects from pooled model emphasise diversification
-0,6 -0,4 -0,2 0 0,2
return
risk
growth%
deviation from 1/n
HI
timeframe Information on strategic asset allocation
MORE SEGMENTS
EQUALLY SIZED SEGMENTS
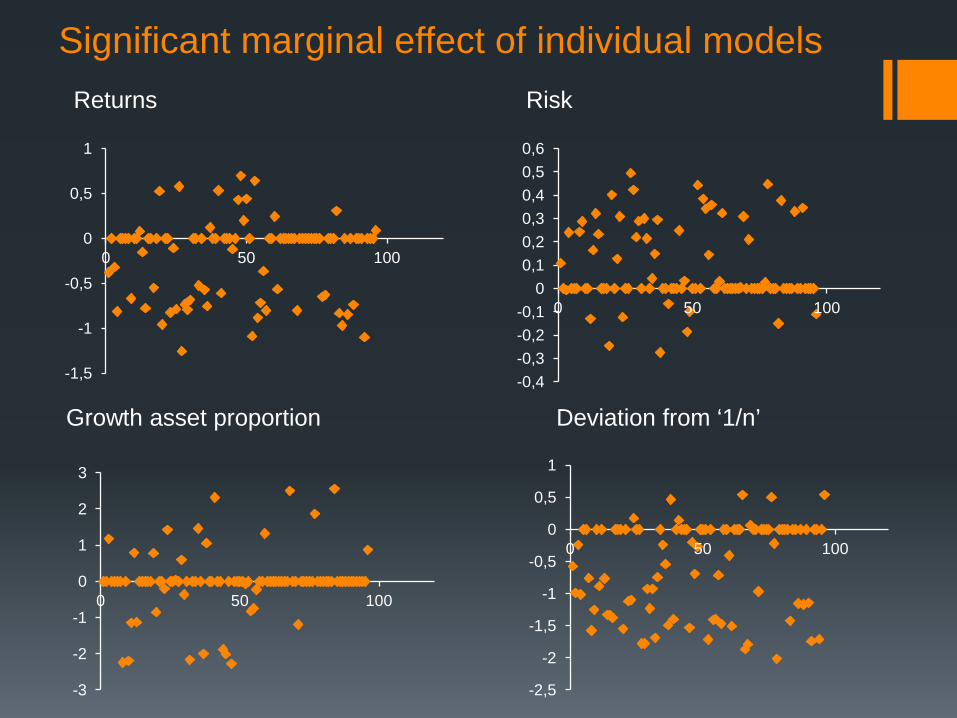
Returns Risk
Growth asset proportion Deviation from ‘1/n’
-1,5
-1
-0,5
0
0,5
1
0 50 100
Significant marginal effect of individual models
-0,4 -0,3 -0,2 -0,1
0 0,1 0,2 0,3 0,4 0,5 0,6
0 50 100
-3
-2
-1
0
1
2
3
0 50 100
-2,5
-2
-1,5
-1
-0,5
0
0,5
1
0 50 100

Subjects rarely prefer default Around 2/3 of members of Australian ‘industry funds’ default
Default investment is ‘balanced’ option
Subjects offered payout from default or preferred option
Only 2 of 96 defaulted

Robustness treatments: Visuals? ‘k’/n?
Experiment 3: 76 subjects Pie chart v. Table: 39 subjects saw table substituted for pie chart
Unlimited choice: 76 subjects chose any number of the 10 options

Table treatment: diversification was still the most important influence.
-1 -0,8 -0,6 -0,4 -0,2 0 0,2 0,4 0,6
return
risk
growth%
deviation from 1/n
HI
timeframe
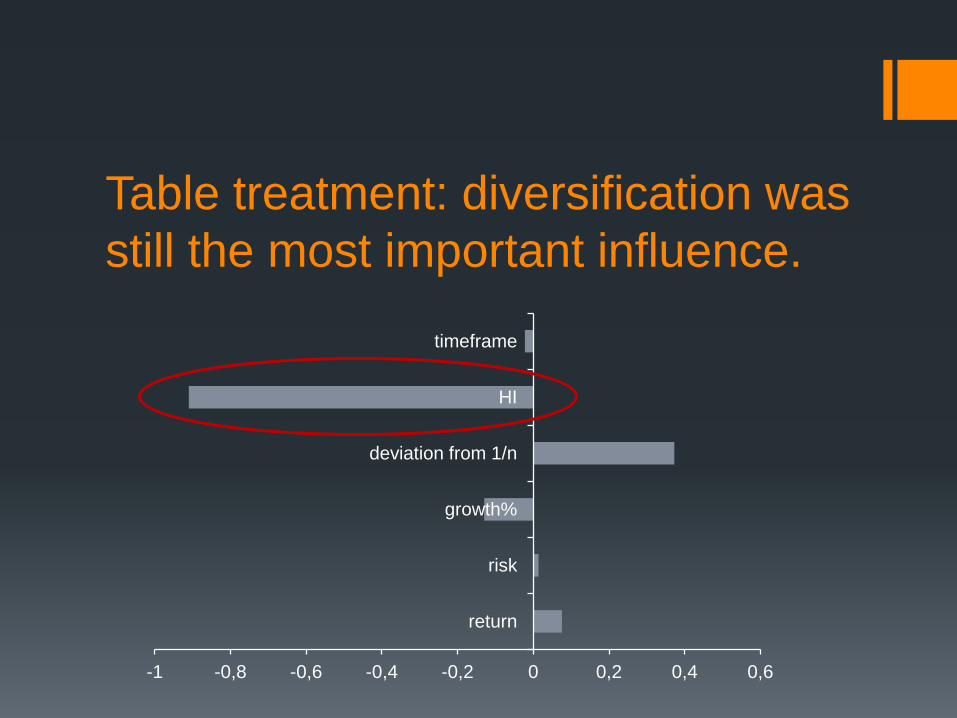
Table treatment: diversification was still the most important influence.
-1 -0,8 -0,6 -0,4 -0,2 0 0,2 0,4 0,6
return
risk
growth%
deviation from 1/n
HI
timeframe

When offered choice from the full menu, most people choose some of everything.
1 2 3 4 5 6 7 8 9 100
5
10
15
20
25
Average Allocation %
Capital stable 14 Socially responsible 11 Growth 11 Cash 8
Australian bonds 6** Australian shares 5** Global environmental 10
Conservative balanced 12 Balanced 11 High growth 13
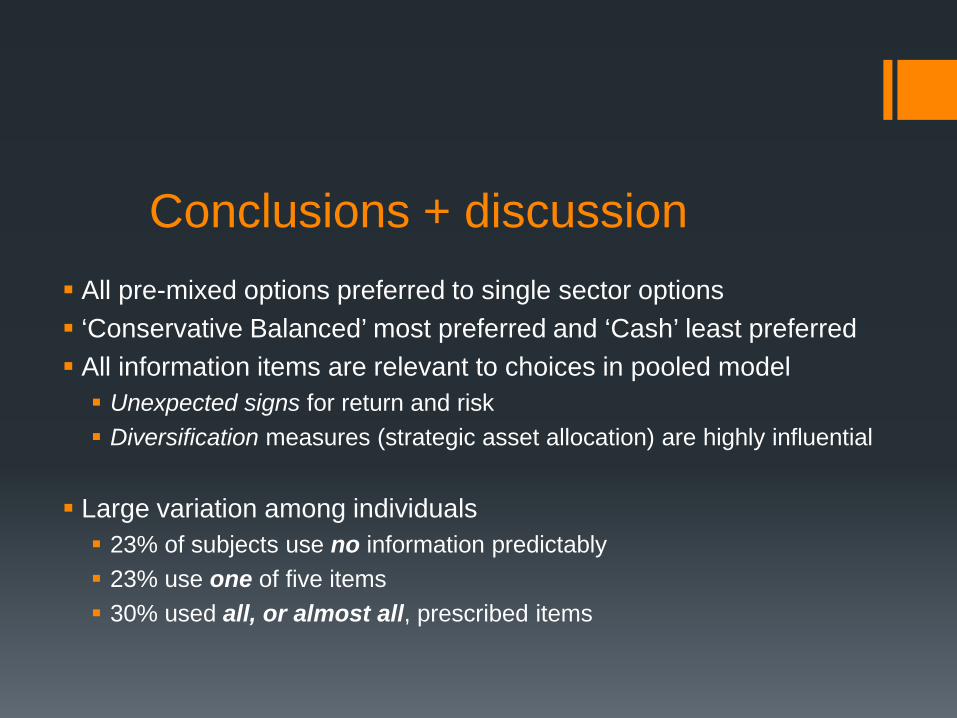
Conclusions + discussion All pre-mixed options preferred to single sector options ‘Conservative Balanced’ most preferred and ‘Cash’ least preferred All information items are relevant to choices in pooled model Unexpected signs for return and risk Diversification measures (strategic asset allocation) are highly influential
Large variation among individuals 23% of subjects use no information predictably 23% use one of five items 30% used all, or almost all, prescribed items

Salient information (returns targets/risk measures) used in
unexpected ways. Subjects prefer ‘pies’ with many, equally sized segments ‘1/n’ heuristic applies to pre-mixed option choice it persists without the visual pie-chart aid subjects apply ‘1/n’ in ‘mix-it-yourself’ task labels, tables, demographics do not change the story
Are regulators testing for the way people use disclosures?
Acknowledgements The authors are especially grateful to Jacs Davis and other staff at UniSuper, participants at the 2012 Paul Woolley Centre for Capital Market Dysfunctionality Conference, Sydney, and to Jeanette Deetlefs, Megan Gu, Chris Moore, and Danny Yeung for excellent research assistance. Research support from the Australian Research Council LP110100489, the Australian Research Council Future Fellowship FT110100151 (Newell) and the Centre of Excellence in Population Ageing Research (CEPAR), under project CE110001029 (Dobrescu) is gratefully acknowledged. The Chair of Finance and Superannuation, UTS, (Thorp) receives support from the Sydney Financial Forum (through Colonial First State Global Asset Management), the NSW Government, the Association of Superannuation Funds of Australia (ASFA), the Industry Superannuation Network (ISN), and the Paul Woolley Centre for the Study of Capital Market Dysfunctionality, UTS. Corresponding author: Susan Thorp; Address: UTS Business School, PO Box 123, Broadway NSW 2007, Australia. Tel.: +61 2 9514 7784; fax:+61 2 9514 7722 E-mail addresses: [email protected] (Bateman); [email protected] (Dobrescu); [email protected] (Newell); [email protected] (Ortmann); [email protected] (Thorp)

Summary statistics: young, well educated subjects
Sample 172 => half staff; half students
Age Median = 25
Education Median = Bachelor degree or equivalent
Years of employment Median = 2.5
Health Median = very good