Embed Size (px)
Citation preview
AS Biology Syllabus 9700 Unit 4: Transport and Gas Exchange
Recommended Prior Knowledge Knowledge of cell structure, as covered in Unit 1, will be helpful here, as will an understanding of diffusion, osmosis and active transport. Context This Unit considers the way in which cells are provided with their requirements. It builds on what students know of cell structure and movement into and out of cells, and lays the foundations for further work on physiology at A2 level. The work on blood in this Unit leads into the Immunity section in Unit 5. Outline The topic of transport is introduced by considering why large organisms need transport systems. Plant transport, including the relation between the structure and function of transport tissues, is then dealt with. Transport in mammals, including structure and function of the heart, blood vessels and blood, are considered, which leads into gas exchange in humans. If preferred, transport and gas exchange in mammals could be covered before transport in plants. There are many good opportunities within this Unit for students to develop their practical skills relating to Assessment Objectives in Group C (Experimental skills and investigations) , particularly in microscope handling and observational skills developed in Unit 1, and also including the design and evaluation of their own investigations (assessed in Paper 5). Try to ensure that each student works alone and under time pressure on some occasions, as this will help to prepare for the practical examination(s). There is a much visual material in this Unit and reinforcement of learning should include labelling and annotating of diagrams in addition to presentation of topics by groups. Students also need to make comparisons in this Unit, for example between an artery and vein, between blood, tissue fluid and lymph, left and right sides of the heart and distribution, structure and function of xylem and phloem, so reinforcement by constructing tables and sorting comparison statements under the correct headings will help. G Transport
• The need for, and functioning of, a transport system in multicellular plants • The need for, and functioning of, a transport system in mammals • Structure and functioning of the mammalian heart
H Gas exchange and smoking
• The gas exchange system • Smoking and smoking-related diseases
1
AO Learning outcomes Suggested Teaching activities Learning resources G (a)
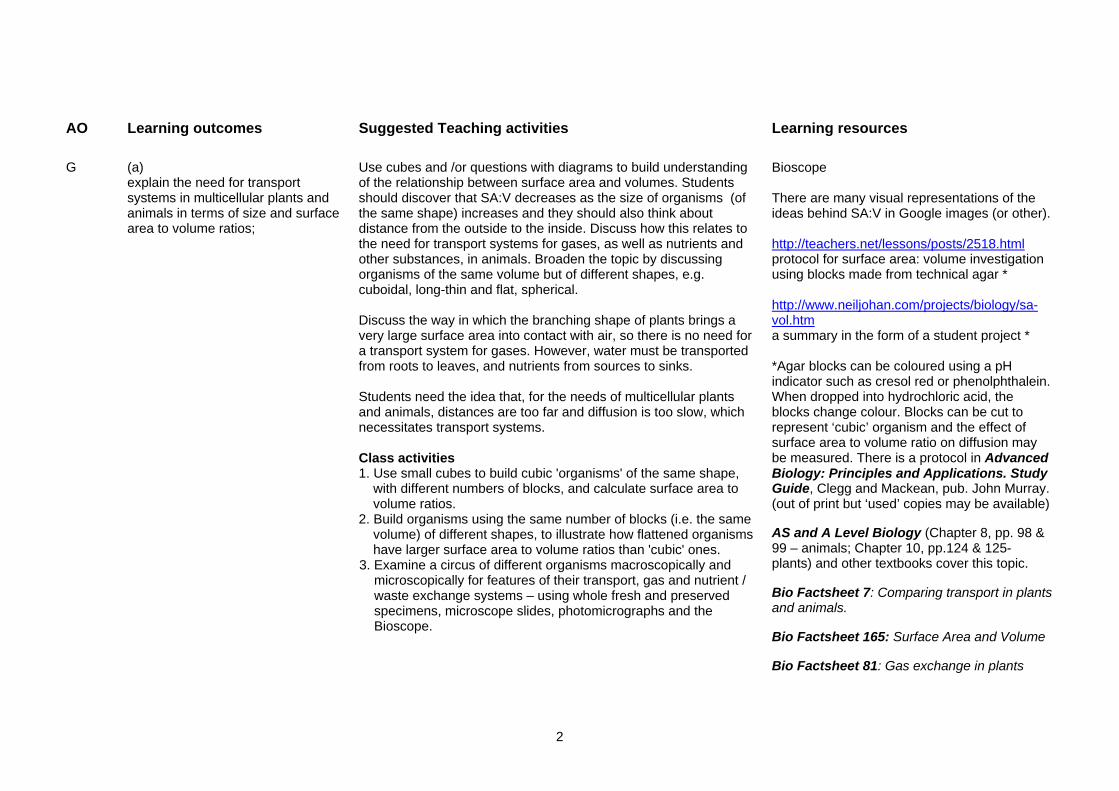
explain the need for transport systems in multicellular plants and animals in terms of size and surface area to volume ratios;
Use cubes and /or questions with diagrams to build understanding of the relationship between surface area and volumes. Students should discover that SA:V decreases as the size of organisms (of the same shape) increases and they should also think about distance from the outside to the inside. Discuss how this relates to the need for transport systems for gases, as well as nutrients and other substances, in animals. Broaden the topic by discussing organisms of the same volume but of different shapes, e.g. cuboidal, long-thin and flat, spherical. Discuss the way in which the branching shape of plants brings a very large surface area into contact with air, so there is no need for a transport system for gases. However, water must be transported from roots to leaves, and nutrients from sources to sinks. Students need the idea that, for the needs of multicellular plants and animals, distances are too far and diffusion is too slow, which necessitates transport systems. Class activities 1. Use small cubes to build cubic 'organisms' of the same shape,
with different numbers of blocks, and calculate surface area to volume ratios.
2. Build organisms using the same number of blocks (i.e. the same volume) of different shapes, to illustrate how flattened organisms have larger surface area to volume ratios than 'cubic' ones.
3. Examine a circus of different organisms macroscopically and microscopically for features of their transport, gas and nutrient / waste exchange systems – using whole fresh and preserved specimens, microscope slides, photomicrographs and the Bioscope.
Bioscope There are many visual representations of the ideas behind SA:V in Google images (or other). http://teachers.net/lessons/posts/2518.html protocol for surface area: volume investigation using blocks made from technical agar * http://www.neiljohan.com/projects/biology/sa-vol.htm a summary in the form of a student project * *Agar blocks can be coloured using a pH indicator such as cresol red or phenolphthalein. When dropped into hydrochloric acid, the blocks change colour. Blocks can be cut to represent ‘cubic’ organism and the effect of surface area to volume ratio on diffusion may be measured. There is a protocol in Advanced Biology: Principles and Applications. Study Guide, Clegg and Mackean, pub. John Murray. (out of print but ‘used’ copies may be available) AS and A Level Biology (Chapter 8, pp. 98 & 99 – animals; Chapter 10, pp.124 & 125- plants) and other textbooks cover this topic. Bio Factsheet 7: Comparing transport in plants and animals. Bio Factsheet 165: Surface Area and Volume Bio Factsheet 81: Gas exchange in plants
2
AO Learning outcomes Suggested Teaching activities Learning resources G (d)
describe the distribution of xylem and phloem tissue in roots, stems and leaves of dicotyledonous plants;
Start by revising a simple diagram of a whole plant, showing leaves and petioles, stem, (soil level), root(s) and piliferous / root hair region. Students will need to orientate themselves with regard to the distribution of the tissue in LS and TS slides, photomicrographs and diagrams. A discussion of how sections of the plant would be cut to produce the different slides may be useful before they are shown / carry out an activity where they become familiar with the distribution of the different tissues. An interesting (extension) discussion will arise if students ask ‘what happens when the root becomes the stem?’ Remind students of the definition of a tissue. A brief discussion of the differences between monocotyledons and dicotyledons (as background information only if students ask) can be given, but emphasise that this information is not required for the exam. They will probably already have drawn a TS of a leaf in Unit 1 (A,(f)), so this can be quickly revised now. Prepared slides of TS root and TS stem provide opportunities for further developing skills of observation and recording, as well as calculating magnification. Class activities 1. Stand small plants with intact root systems (wash soil off first) in
dye such as eosin for 10-30 minutes, then cut thin sections by hand to investigate the distribution of the dye; this shows the position of xylem vessels in all parts of the plant, and also emphasises their continuous nature. Compare with sections stained to show xylem – e.g. using phloroglucinol and concentrated HCl
2. Use microscopes, Bioscope and photomicrographs to investigate distribution of xylem and phloem in roots, stems and leaves of dicotyledonous plants such as Ranunculus and Ligustrum.
3. Investigate and calculate the sizes of structures in xylem and phloem, and magnification of images using microscope slides and Bioscope.
Bioscope http://leavingbio.net/FLOWERING%20PLANTS.htm simple overview of plant anatomy http://images.botany.org/ hundreds of high-quality images, including many leaf, stem and root micrographs. Lots of University Department and microscope manufacturer websites have wide collections of photomicrographs that students will find interesting e.g. http://micro.magnet.fsu.edu/index.html AS and A Level Biology (Chapter 10) and other textbooks include this topic. Both Practical Advanced Biology and Comprehensive Practical Biology for A Level have guidance for observing and recording the distribution of these tissues. The CD-ROM: Images of Biology for Advanced Level, pub. Nelson Thornes, has suitable images that are useful here. Bio Factsheet 19: Plant tissues
3
AO Learning outcomes Suggested Teaching activities Learning resources G (e)
describe the structure of xylem vessel elements and be able to recognise these using the light microscope; (f) relate the structure of xylem vessel elements to their functions;
Use photomicrographs and diagrams to illustrate and discuss the structure of xylem vessel elements. Students may already be able to link xylem to the transport of water – ensure that they realise that mineral ion transport also occurs. A ‘structure to function’ discussion needs to introduce the idea of the tension created (and hence need for lignification). Class activities 1. Use photomicrographs, the Bioscope, microscope slides, electron micrographs and diagrams from books and the web to build understanding of the structure of xylem vessel elements. 2. Add annotated labels to diagrams. 3. Construct a summary table of xylem vessel element structure linked to an explanation of function (this may be done after G(g)and (h) have been taught).
Search Google images, using ‘ xylem’, ‘xylem vessel elements’ and ‘xylem tissue’- many links to useful illustrations. http://users.rcn.com/jkimball.ma.ultranet/BiologyPages/P/PlantTissues.html introduces types of tissue and links to xylem AS and A Level Biology (Chapter 10, pp128 & 129). Bio Factsheet 146: Tracheids, vessels and sieve tubes
AO Learning outcomes Suggested Teaching activities Learning resources G (g)
explain the movement of water between plant cells and between them and their environment, in terms of water potential (no calculations involving water potential will be set); (h) describe the pathways and explain the mechanisms by which water is transported from soil to xylem and from roots to leaves;
Use questioning to revise earlier work on osmosis, and lead in to the way in which root hairs provide a large surface area for water uptake. Root hairs can be seen clearly on newly-germinated seedlings, such as mung beans, if these are grown on damp filter paper or cotton wool. Review water potential with oral question and answer / whole class discussion and revision questions. Provide an overview of the movement of water down a water potential gradient from soil to air, before looking at each part of this pathway in more detail. Some students find it helpful to see numerical values of water potential at the different locations, for comparison. Ensure that students know the difference between the apoplastic pathway and symplastic pathway. Many textbooks now include the vacuolar pathway within the symplastic pathway.
http://www.microscopy-uk.org.uk/mag/artmar00/watermvt.html a clear description of water movement through a plant, including high-quality micrographs. http://www.mhhe.com/biosci/pae/botany/histology/html/memtrans.htm nice description of symplast and apoplast http://users.rcn.com/jkimball.ma.ultranet/BiologyPages/X/Xylem.html detailed information on transport across roots and up xylem AS and A Level Biology (Chapter 10) and other textbooks include this topic
4
(i) outline the roles of nitrate ions and of magnesium ions in plants;
In order to introduce (i), mineral ion uptake from the soil solution can be mentioned this topic lends itself to testing the students’ ability to apply knowledge of membrane structure and permeability, and transport mechanisms across the membrane) – ask students to suggest why it is important to take up nitrate ions before explaining the role of magnesium ions. Encourage students to include the terms water potential and water potential gradient when explaining the pathway of water through the plant. Answers to exam questions on this topic which only mention pressure gradients are unlikely to gain full marks (loss of water from the leaf reduces hydrostatic pressure at the top of xylem vessels, thus providing the pressure gradient which ensures mass flow of water up these vessels). The work on cohesion-tension needs to be linked to the next section (G(b)(c)) on transpiration. Transpiration reduces the water potential at the top of the plant, producing the ‘tension’. Class activities 1. Work out which way water will flow to and from cells / environments with given water potentials (no calculations of water potential are expected). 2. Build understanding of mechanisms and pathways of movement
of water through plants with oral question and answer / whole class discussion and written questions.
3. Give brief written explanation why water flows as a result of water potential, and the flow of water from soil, through plant, to air as a result of water potential (including the role of cohesion- tension), and other potential and actual mechanisms of water flow (root pressure and capillarity). 4. Research in books and on the web, the various pathways by which water can flow across the root (apoplast, symplast and vacuolar) and the role of the endodermis and Casparian strip, giving a brief written / diagrammatic summary of findings
AS and A Level Biology (Chapter 2, p.39) summarises the roles of these two ions.
Bio Factsheet 82: Transport in flowering plants.
Bio Factsheet 108: Water movement across the root.
5
AO Learning outcomes Suggested Teaching activities Learning resources G (b)
define the term transpiration and explain that it is an inevitable consequence of gas exchange in plants; (c) describe how to investigate experimentally the factors that affect transpiration rate;
Use questioning to help students to revise what they remember from earlier courses about transpiration. Many will have learned the water cycle at some stage. Students will need to recall their knowledge of leaf structure. Discuss how water changes state from liquid to vapour inside the leaf, and then diffuses down a water potential gradient through open stomata into the surrounding air. This needs to be linked to cohesion-tension dealt with in the previous section (G(g)(h)). Ask students to suggest why the rate of transpiration varies during a 24 hour day – this should lead to a discussion about the need for carbon dioxide for photosynthesis during daylight hours and provide a link to open stomata and transpiration. Discuss also cuticular transpiration to facilitate understanding later of some of the features of xerophytic leaves for G(j)). Show students diagrams, or demonstrate the use of, a standard commercial potometer (e.g. Thoday photometer). Remind them that potometers measure rates of water uptake and that a cut end of a stem is not the same as uptake via root hairs. If a potometer is placed on a balance sensitive to small changes in mass, then it is possible to measure water uptake and transpiration. A simple potometer can be made using a long piece of capillary tubing to which a short length of rubber tubing is attached at one end. Submerge it all in water and shake gently until water completely fills it. Make a slanting cut across a leafy shoot, and - still under water - push this tightly into the rubber tubing. Use petroleum jelly to seal round the joint. Support the whole apparatus vertically, dry the leaves, and record the height of the air/water meniscus at suitable time intervals. If there is access to data-logging equipment and a humidity-recording sensor, try enclosing part of a plant inside a plastic bag and recording the increase in humidity as transpiration takes place.
http://users.rcn.com/jkimball.ma.ultranet/BiologyPages/T/Transpiration.html information and links to related topics http://cas.bellarmine.edu/tietjen/Laboratories/Transpiration/transpiration_text.htm has a simulation program that allows you to investigate the effect on transpiration of changing various parameters http://www-saps.plantsci.cam.ac.uk/worksheets/scotland/poto.htm student practical guide on investigating factors affecting rates AS and A Level Biology has a diagram of a potometer (Chapter 10, p.134). SAQ 10.3 (p.131) asks students to consider different factors. Both Practical Advanced Biology and Comprehensive Practical Biology for A Level have protocols for investigations relating to transpiration. Students need reminding that potometers measure rates of water uptake and that a cut end of a stem is not the same as uptake via root hairs. If a potometer is placed on a balance sensitive to small changes in mass, then it is possible to measure water uptake and transpiration. Bio Factsheet 64: Transpiration
6
Class activities 1. Give a definition of transpiration, explain why it is inevitable, and
list the advantages of transpiration. 2. Draw a large diagram of vertical section through part of a leaf,
adding numbered annotations to show the pathway of water and the sequence of events occurring.
3. Use a potometer to investigate the effect of wind speed on rate of transpiration. Present results in graphical form and describe provide explanations for the shape of the graph using the terms diffusion and water potential. 4. Plan and carry out a controlled investigation into the effect of temperature on rate of transpiration. Analyse as for activity 3. 5. Plan and / or carry out similar investigations into the effect of humidity and / or light on rate of transpiration.
AO Learning outcomes Suggested Teaching activities Learning resources G (j)
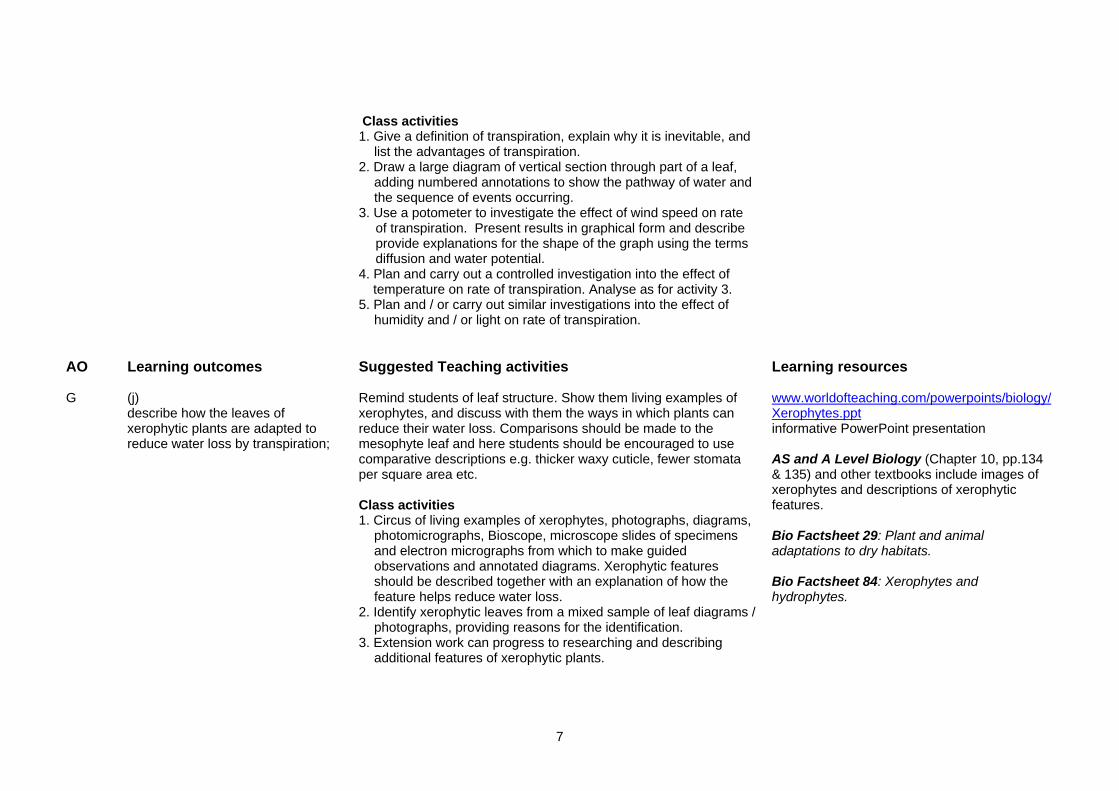
describe how the leaves of xerophytic plants are adapted to reduce water loss by transpiration;
Remind students of leaf structure. Show them living examples of xerophytes, and discuss with them the ways in which plants can reduce their water loss. Comparisons should be made to the mesophyte leaf and here students should be encouraged to use comparative descriptions e.g. thicker waxy cuticle, fewer stomata per square area etc. Class activities 1. Circus of living examples of xerophytes, photographs, diagrams, photomicrographs, Bioscope, microscope slides of specimens and electron micrographs from which to make guided observations and annotated diagrams. Xerophytic features should be described together with an explanation of how the feature helps reduce water loss. 2. Identify xerophytic leaves from a mixed sample of leaf diagrams / photographs, providing reasons for the identification. 3. Extension work can progress to researching and describing additional features of xerophytic plants.
www.worldofteaching.com/powerpoints/biology/Xerophytes.ppt informative PowerPoint presentation AS and A Level Biology (Chapter 10, pp.134 & 135) and other textbooks include images of xerophytes and descriptions of xerophytic features. Bio Factsheet 29: Plant and animal adaptations to dry habitats. Bio Factsheet 84: Xerophytes and hydrophytes.
7
AO Learning outcomes Suggested Teaching activities Learning resources G (e)
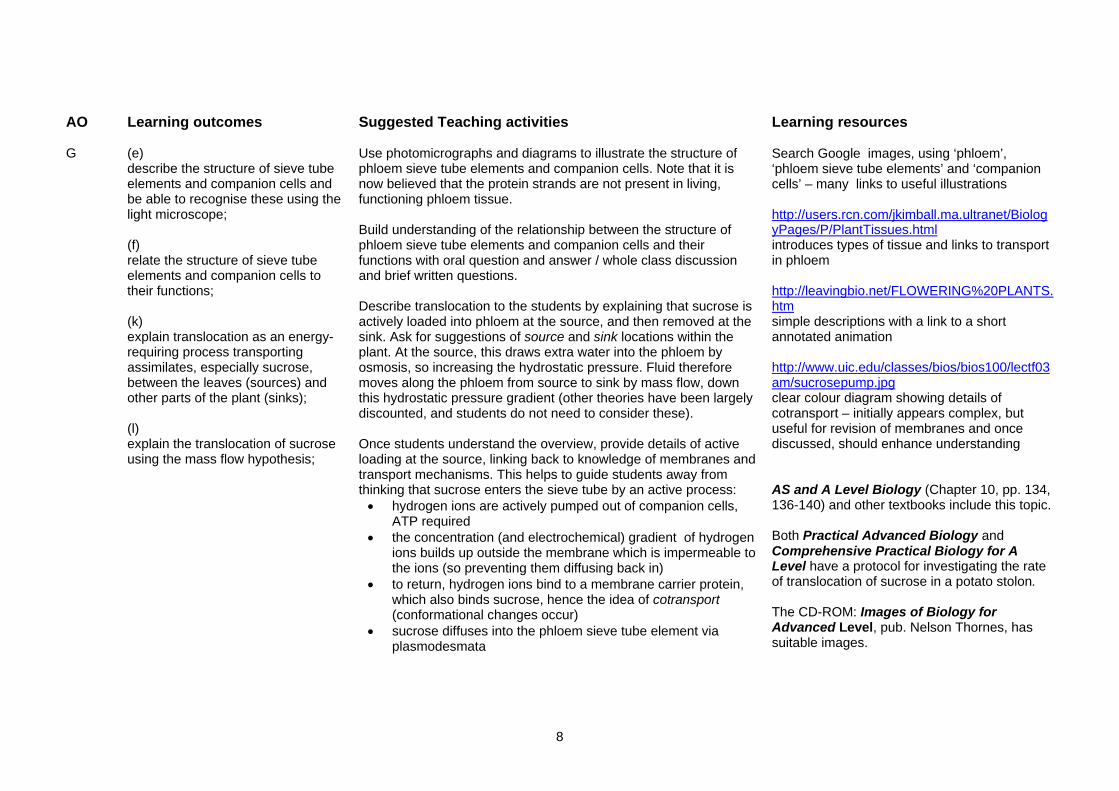
describe the structure of sieve tube elements and companion cells and be able to recognise these using the light microscope; (f) relate the structure of sieve tube elements and companion cells to their functions; (k) explain translocation as an energy-requiring process transporting assimilates, especially sucrose, between the leaves (sources) and other parts of the plant (sinks); (l) explain the translocation of sucrose using the mass flow hypothesis;
Use photomicrographs and diagrams to illustrate the structure of phloem sieve tube elements and companion cells. Note that it is now believed that the protein strands are not present in living, functioning phloem tissue. Build understanding of the relationship between the structure of phloem sieve tube elements and companion cells and their functions with oral question and answer / whole class discussion and brief written questions. Describe translocation to the students by explaining that sucrose is actively loaded into phloem at the source, and then removed at the sink. Ask for suggestions of source and sink locations within the plant. At the source, this draws extra water into the phloem by osmosis, so increasing the hydrostatic pressure. Fluid therefore moves along the phloem from source to sink by mass flow, down this hydrostatic pressure gradient (other theories have been largely discounted, and students do not need to consider these). Once students understand the overview, provide details of active loading at the source, linking back to knowledge of membranes and transport mechanisms. This helps to guide students away from thinking that sucrose enters the sieve tube by an active process: • hydrogen ions are actively pumped out of companion cells,
ATP required • the concentration (and electrochemical) gradient of hydrogen
ions builds up outside the membrane which is impermeable to the ions (so preventing them diffusing back in)
• to return, hydrogen ions bind to a membrane carrier protein, which also binds sucrose, hence the idea of cotransport (conformational changes occur)
• sucrose diffuses into the phloem sieve tube element via plasmodesmata
Search Google images, using ‘phloem’, ‘phloem sieve tube elements’ and ‘companion cells’ – many links to useful illustrations http://users.rcn.com/jkimball.ma.ultranet/BiologyPages/P/PlantTissues.html introduces types of tissue and links to transport in phloem http://leavingbio.net/FLOWERING%20PLANTS.htm simple descriptions with a link to a short annotated animation http://www.uic.edu/classes/bios/bios100/lectf03am/sucrosepump.jpg clear colour diagram showing details of cotransport – initially appears complex, but useful for revision of membranes and once discussed, should enhance understanding AS and A Level Biology (Chapter 10, pp. 134, 136-140) and other textbooks include this topic. Both Practical Advanced Biology and Comprehensive Practical Biology for A Level have a protocol for investigating the rate of translocation of sucrose in a potato stolon. The CD-ROM: Images of Biology for Advanced Level, pub. Nelson Thornes, has suitable images.
8
Class activities 1. Use photomicrographs, the Bioscope, microscope slides, electron micrographs and diagrams from books and the web to build understanding of the structure of phloem sieve tube elements and companion cells. 2. Add annotated labels to diagrams. 3. Construct a table of differences between a companion cell and a phloem sieve tube element. 4. Construct a summary table of phloem sieve tube element structure linked to an explanation of function.
Bio Factsheet 146: Tracheids, vessels and sieve tubes Bio Factsheet 132: Phloem
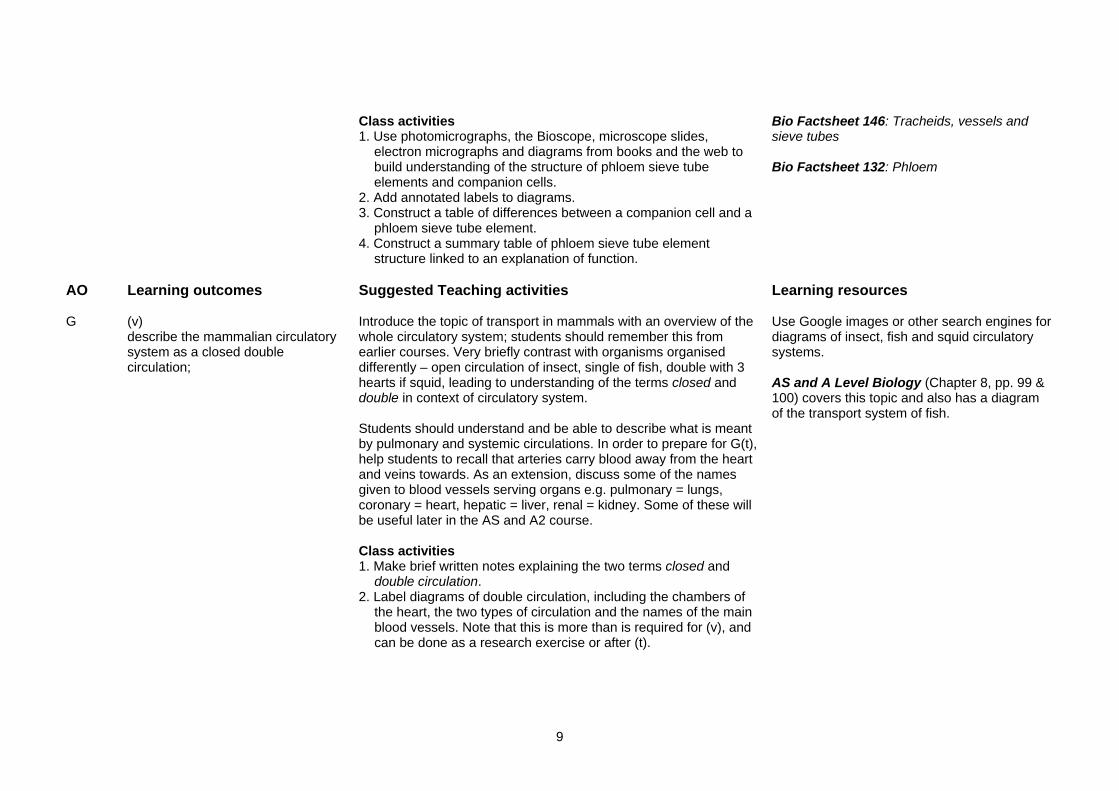
AO Learning outcomes Suggested Teaching activities Learning resources G (v)
describe the mammalian circulatory system as a closed double circulation;
Introduce the topic of transport in mammals with an overview of the whole circulatory system; students should remember this from earlier courses. Very briefly contrast with organisms organised differently – open circulation of insect, single of fish, double with 3 hearts if squid, leading to understanding of the terms closed and double in context of circulatory system. Students should understand and be able to describe what is meant by pulmonary and systemic circulations. In order to prepare for G(t), help students to recall that arteries carry blood away from the heart and veins towards. As an extension, discuss some of the names given to blood vessels serving organs e.g. pulmonary = lungs, coronary = heart, hepatic = liver, renal = kidney. Some of these will be useful later in the AS and A2 course. Class activities 1. Make brief written notes explaining the two terms closed and double circulation. 2. Label diagrams of double circulation, including the chambers of the heart, the two types of circulation and the names of the main blood vessels. Note that this is more than is required for (v), and can be done as a research exercise or after (t).
Use Google images or other search engines for diagrams of insect, fish and squid circulatory systems. AS and A Level Biology (Chapter 8, pp. 99 & 100) covers this topic and also has a diagram of the transport system of fish.
9
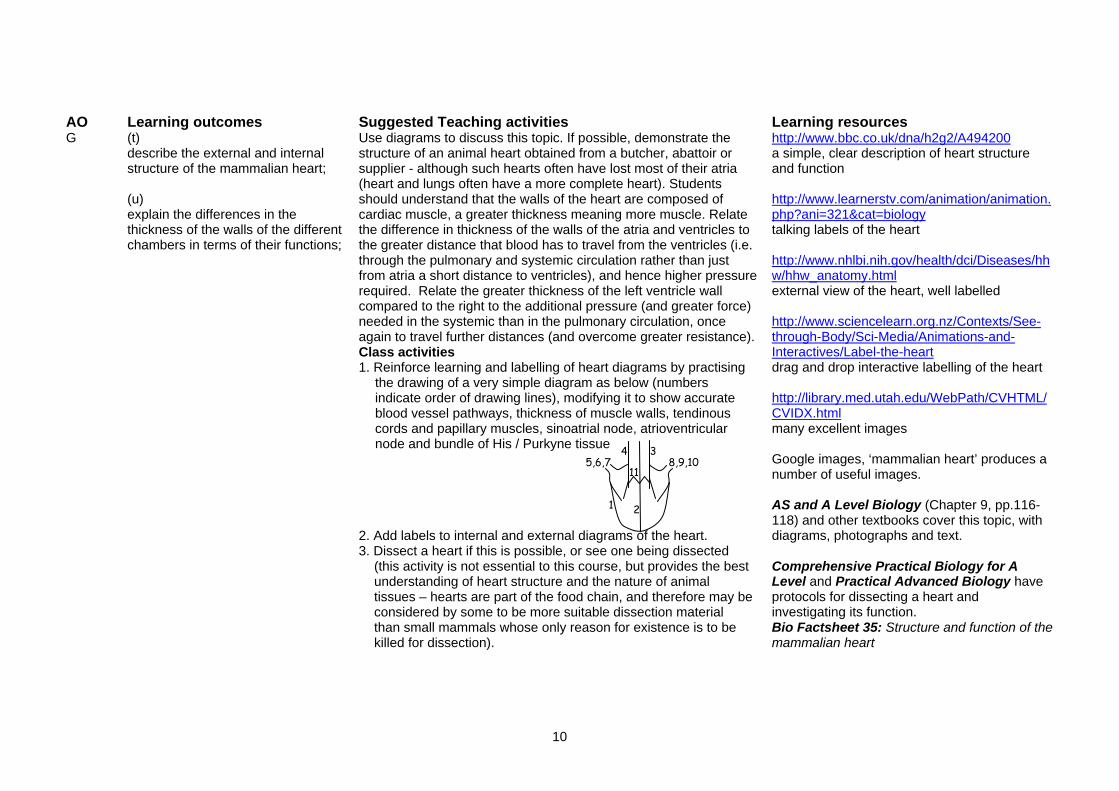
AO Learning outcomes Suggested Teaching activities Learning resources G (t)
describe the external and internal structure of the mammalian heart; (u) explain the differences in the thickness of the walls of the different chambers in terms of their functions;
Use diagrams to discuss this topic. If possible, demonstrate the structure of an animal heart obtained from a butcher, abattoir or supplier - although such hearts often have lost most of their atria (heart and lungs often have a more complete heart). Students should understand that the walls of the heart are composed of cardiac muscle, a greater thickness meaning more muscle. Relate the difference in thickness of the walls of the atria and ventricles to the greater distance that blood has to travel from the ventricles (i.e. through the pulmonary and systemic circulation rather than just from atria a short distance to ventricles), and hence higher pressure required. Relate the greater thickness of the left ventricle wall compared to the right to the additional pressure (and greater force) needed in the systemic than in the pulmonary circulation, once again to travel further distances (and overcome greater resistance). Class activities 1. Reinforce learning and labelling of heart diagrams by practising the drawing of a very simple diagram as below (numbers indicate order of drawing lines), modifying it to show accurate blood vessel pathways, thickness of muscle walls, tendinous cords and papillary muscles, sinoatrial node, atrioventricular node and bundle of His / Purkyne tissue 2. Add labels to internal and external diagrams of the heart. 3. Dissect a heart if this is possible, or see one being dissected (this activity is not essential to this course, but provides the best understanding of heart structure and the nature of animal tissues – hearts are part of the food chain, and therefore may be considered by some to be more suitable dissection material than small mammals whose only reason for existence is to be killed for dissection).
http://www.bbc.co.uk/dna/h2g2/A494200 a simple, clear description of heart structure and function http://www.learnerstv.com/animation/animation.php?ani=321&cat=biology talking labels of the heart http://www.nhlbi.nih.gov/health/dci/Diseases/hhw/hhw_anatomy.html external view of the heart, well labelled http://www.sciencelearn.org.nz/Contexts/See-through-Body/Sci-Media/Animations-and-Interactives/Label-the-heart drag and drop interactive labelling of the heart http://library.med.utah.edu/WebPath/CVHTML/CVIDX.html many excellent images Google images, ‘mammalian heart’ produces a number of useful images. AS and A Level Biology (Chapter 9, pp.116-118) and other textbooks cover this topic, with diagrams, photographs and text. Comprehensive Practical Biology for A Level and Practical Advanced Biology have protocols for dissecting a heart and investigating its function. Bio Factsheet 35: Structure and function of the mammalian heart
5,6,7 3 4
8,9,10 11
1 2
10
AO Learning outcomes Suggested Teaching activities Learning resources G (w)
describe the cardiac cycle;
If available, use animations to support understanding here. Students should understand that valves do not actively open and close, but are pushed open and shut by differences in pressure on either side. Use OHP overlays or a PowerPoint presentation to gradually build up graphs showing pressure changes in atria, ventricles and arteries during the cardiac cycle. Use whole class discussion / oral question and answer based around these to build understanding of pressure and volume changes within the heart and how these relate to muscle contraction and relaxation and valves opening and closing. A very large pressure change graph, with diagrams of the heart (underneath the x axis) in the different stages of the cycle corresponding to the times, may be useful to display during the teaching of this topic to reinforce learning. Class activities 1. Produce a table describing the sequence of events occurring in the heart in one cycle – the first column headed ‘right side of heart’, the second column headed ‘left side of heart’. This will help consolidate understanding that both sides of the heart contract and relax in unison. 2. Use the diagram learned in G(t) to build understanding of the cardiac cycle by drawing diagrams taking the heart through the whole cardiac cycle, showing the contraction and relaxation of muscle, and status of valves in the middle of diastole, atrial systole and ventricular systole 3. Practise questions that require interpretation of pressure change graphs. 4. Make a summary graph showing the pressure and volume changes on one side of the heart, annotated with (i) the time each valve opens and shuts and (ii) the evidence that can be seen on the graph that this is so.
http://www.pbs.org/wgbh/nova/eheart/human.html illustrates and briefly describes one cycle http://www.ahealthyme.com/Imagebank/heart.swf short animation showing a cycle and with additional information http://library.med.utah.edu/kw/pharm/hyper_heart1.html a very clear animation linking a cardiac cycle to blood pressure changes and an ECG* * Note that students do not need to describe or explain ECGs, but they might be given one as stimulus material in an examination question with enough information to understand what it is. AS and A Level Biology (Chapter 9, pp.118-120) has explanatory diagrams of the cardiac cycle and how heart valves work.
11
AO Learning outcomes Suggested Teaching activities Learning resources G (x)
explain how heart action is initiated and controlled (reference should be made to the sinoatrial node, the atrioventricular node and the Purkyne tissue);
Students firstly need to be clear that the heart is myogenic (it does not need to receive nerve impulses from outside to initiate heart beat).They need to understand the role of the sinoatrial node as the pacemaker initiating muscle cell depolarisation and contraction; the network of cardiac muscle fibres within the atria and the ventricles in passing the wave of depolarisation to bring about contraction; the ring of non-conducting (connective) tissue (fibrous ring) between the atria and ventricles insulating them, so that they cannot contract at the same time; the atrioventricular node in delaying the passage of depolarisation to the ventricles so that the atria can complete contraction; the Purkyne tissue is passing the depolarisation down to the bottom of the ventricles so they depolarise and contract bottom-up, squeezing the blood out up the arteries. The SAN initiating a wave of excitation or impulse is acceptable (depolarisation as a term will be better understood at A2), but do not use the terms ‘signal’, ‘wave (alone)’ ‘pulse’ or ‘message’. A common mistake is for students to use ‘nerve impulse’ in their descriptions. Students can be shown an ECG to discuss how this relates to their knowledge (see* in Learning Resources for (w)). Class activities 1. Practise diagrammatic and written questions to build understanding of the initiation of heart beat, and coordination of the contraction of the atria and ventricles. 2. Place in sequence cards containing printed statements of each of the events occurring, starting with the role of the SAN. 3. Use the diagram learned in G(t) to reinforce understanding by drawing a series of annotated diagrams to show initiation of heartbeat, atrial systole, delay by the atrioventricular node and finally ventricular systole. 4. In the correct locations on a diagram of the heart, number the events occurring in sequence, making notes for each number to the side or under the diagram.
http://hyperphysics.phy-astr.gsu.edu/hbase/biology/sanode.html clear illustration of sinoatrial node and atrioventricular node http://www.nhlbi.nih.gov/health/dci/Diseases/hhw/hhw_electrical.html animation linking activity to an ECG (note that knowledge of ECGs is not required) AS and A Level Biology (Chapter 9, pp.120-122) explains this clearly and includes SAQs. Bio Factsheet 139: Answering exam questions on the heart
12
AO Learning outcomes Suggested Teaching activities Learning resources G (m)
describe the structures of arteries, veins and capillaries and be able to recognise these vessels using the light microscope; (n) explain the relationship between the structure and function of arteries, veins and capillaries;
Students are likely to know the basic structure of arteries and veins and capillaries, so the aim here is to raise the level of their understanding to AS level (naming the layers in the walls, relating structure to function) and observing and drawing prepared TS slides using a microscope, thus developing their observing and drawing skills. They could practise measurement using a graticule. Class activities 1. Enhance understanding of structure and relation to function by whole class discussion / oral question and answer / annotation of provided diagrams. 2. Use microscope slides, Bioscope, photomicrographs and (for capillary) electron micrographs to observe, draw and explain the relationship between structure and function through annotations and bullet points. 3. Investigate the elasticity of blood vessels by suspending weights on sections of arteries and veins.
http://sln.fi.edu/biosci/vessels/vessels.html some materials to interest students, including movies. http://www.practicalbiology.org/areas/advanced/cells-to-systems/structure-and-function-of-tissues/elastic-recoil-in-arteries-and-veins,39,EXP.html practical investigating the elasticity of blood vessels http://library.med.utah.edu/WebPath/CVHTML/CVIDX.html heart and blood vessels images AS and A Level Biology (Chapter 8, pp.101-104) has clear diagrams and photomicrographs, with detailed text.
13
AO Learning outcomes Suggested Teaching activities Learning resources G (o)
describe the structure of red blood cells, phagocytes and lymphocytes; (p) state and explain the differences between blood, tissue fluid and lymph;
Once again, students are likely to have basic knowledge of this topic already. The different types of white cells are dealt with in Unit 5 so it may be preferable to leave details of function until then (and also possibly differences between macrophages and neutrophils). The terms erythrocyte and leucocyte are not required but students may come across them in their research, so a mention may be considered worthwhile. Ensure that students know the components of blood and discuss how and why the concentrations of, for e.g. oxygen, carbon dioxide, dissolved glucose, can vary. This should lead to an appreciation of the activities that occur in the capillary network – the need for exchange with cells. Use verbal question and answer to discuss how pressure changes from the arterial to the venous end of the capillary network. Note: students should be clear about the difference between blood and blood plasma. Class Activities 1. Examine red blood cells under the light microscope, in photomicrographs, with the Bioscope and in electron micrographs, and compare them to other cells such as white blood cells. 2. Draw labelled diagrams of the different cell types. 2. Revise cell structure by giving a brief written explanation of how the structural features of a red blood cell are related to their function of oxygen transport. 3. Label a diagram of a capillary network. Include arrows to show direction of blood flow, formation of tissue fluid and lymph and movement of substance (use a key / colours for different arrow styles). 4. Written explanation of how tissue fluid and lymph are formed from blood and outline their functions. 5. Construct a comparative table of differences between blood, tissue fluid and lymph
A search for blood cells e.g. on Google images, reveals some interesting illustrations. Also, many University Department and microscope manufacturer websites have wide collections of photomicrographs that students will find interesting e.g. http://micro.magnet.fsu.edu/index.html http://education.vetmed.vt.edu/Curriculum/VM8054/Labs/Lab6/Lab6.htm nice material including photomicrographs (uses term granulocyte for phagocyte). Bioscope AS and A Level Biology (Chapter 8, pp.104-108) and other textbooks include this topic. Practical Advanced Biology and Comprehensive Practical Biology for A Level, both include practical work looking at blood cells. The latter text contains several good micrographs, in colour. Bio Factsheet 36: Structure and function of blood and lymph Bio Factsheet 62: Animal tissues I – epithelia and blood Bio Factsheet 89:Tissue fluid Bio Factsheet 171: Answering exam questions: the formation and drainage of lymph
14
AO Learning outcomes Suggested Teaching activities Learning resources G (q)
describe the role of haemoglobin in carrying oxygen and carbon dioxide; (r) describe and explain the significance of the dissociation curves of adult oxyhaemoglobin at different carbon dioxide levels (the Bohr effect);
Use question and answer to help students to remember what they have already learnt about haemoglobin structure, then move on to discuss with them how a haemoglobin molecule carries oxygen. Emphasise the importance of releasing oxygen, as well as binding with it. Do not let students describe oxygen binding to haemoglobin as ‘bonding’. The carriage of carbon dioxide by haemoglobin is often described diagrammatically (at the respiring tissue) and may be left (if wished) until after students have been introduced to the basic dissociation curve of adult oxyhaemoglobin. A discussion of the importance of carbonic anhydrase should remind students of enzymes and highlight that haemoglobin is not the only protein found in red blood cells. Introduce the oxygen dissociation curve steadily and carefully (step-by-step) as students often find this difficult to understand. Use animations to help illustrate. The Bohr shift makes sense if it is explained in relation to carbon dioxide carriage by haemoglobin. Its significance should be discussed in relation to the greater need of tissues for oxygen when respiring actively. Class activities 1. Answering questions which involve interpretation of the curve, to help consolidate their understanding and to develop skills of data handling:
• to introduce partial pressure as a measure of concentration of oxygen
• to introduce the oxygen dissociation curve as results from experimental measurements
• to explain the loading and unloading of oxygen in lung and in resting tissue
• to explain the release of oxygen as a result of the lower partial pressure of oxygen in working tissue (i.e.
http://www.biology4all.com/resources_library/details.asp?ResourceID=8 a downloadable PowerPoint presentation. http://www.wiley.com/college/fob/anim/ Chapter 7: animations, slightly higher level but good (also covers myoglobin) e.g. http://www.wiley.com/college/fob/quiz/quiz07/7-12.html the Bohr effect (non-SI units) and http://www.wiley.com/college/fob/quiz/quiz07/7-7.html short animation of the dissociation curve (caution: use only to give general idea - uses non SI units for partial pressure) and http://www.mrothery.co.uk/circulation/circulationotes.htm#BLOOD written explanations plus graphs AS and A Level Biology explains the oxygen dissociation curve and includes SAQs (Chapter 8, pp.108-113). Bio Factsheet 9: Oxygen dissociation curves. Bio Factsheet 175: Haemoglobin: structure & function
15
oxyhaemoglobin dissociation) • to explain the roles of haemoglobin in carriage of carbon
dioxide in buffering hydrogen ions, (and, less importantly, in forming carbamino compounds)
• to relate the effect of carbon dioxide on haemoglobin to the Bohr effect, facilitating the unloading of ‘more’ oxygen to haemoglobin in working tissues (i.e. haemoglobin dissociates to a greater extent)
2. Carrying out simulations to show how more oxygen is loaded in areas of higher partial pressure. 3. Annotating graphs (dissociation curves) and diagrams (showing carriage of carbon dioxide).
AO Learning outcomes Suggested Teaching activities Learning resources G (s)
describe and explain the significance of the increase in the red blood cell count of humans at high altitude;
An increase in red blood cell count should be linked to an increase in haemoglobin, in order to compensate for the lower saturation that occurs at high altitudes. Students may also be interested to relate this to the benefits to athletes of training at high altitude. Class activities 1. Bibliographic and web-based research leading to a brief written / diagrammatic summary of the key points. 2. Use values obtained from research to make comparisons by calculating percentage changes.
http://www.sportsci.org/traintech/altitude/wgh.html a good article on altitude training and changes in blood cell counts, including data and references. AS and A Level Biology (Chapter 8, pp.113 & 114). Bio Factsheet 149: High altitude biology
16
AO Learning outcomes Suggested Teaching activities Learning resources H (a)
describe the structure of the human gas exchange system, including the microscopic structure of the walls of the trachea, bronchioles and alveoli with their associated blood vessels; (b) describe the distribution of cartilage, ciliated epithelium, goblet cells and smooth muscle in the trachea, bronchi and bronchioles; (c) describe the functions of cartilage, cilia, goblet cells, smooth muscle and elastic fibres in the gas exchange system;
Some of this will be revision for most students. Use question and answer to help them to remember what they know about this topic. Help them to raise their knowledge and understanding to AS level by providing prepared slides of TS of trachea and bronchiole wall, and of lung tissue, for them to interpret and draw. Discuss the reasons for the distribution of the various features within the gas exchange system. Note that a bibliographic/internet search may highlight contradictions, mainly in the location of goblet cells. Some state that there are goblet cells in the bronchiole – explain that there are very few goblet cells and discuss the reason for this (avoiding mucus hindering gas exchange in the alveoli). Draw together information on distribution before discussing functions. Class activities 1. Examine and draw from microscope slides, Bioscope, photomicrographs and electron micrographs from books and the web, trachea, bronchioles, capillaries (and arterioles & venules) and alveoli. 2. Label diagrams of sections through the trachea, bronchus and bronchiole. 3. Complete tables (using ticks and crosses) showing the presence or absence of the named features in the different areas of the gas exchange system. 4. Written explanations linking the presence / location of the structures in the different areas of the gas exchange system to their function.
http://www.meddean.luc.edu/lumen/MedEd/Histo/frames/Histo15.html some very nice photomicrographs Bioscope Lots of University Department and microscope manufacturer websites have wide collections of photomicrographs that students will find interesting e.g. http://micro.magnet.fsu.edu/index.html http://library.med.utah.edu/WebPath/HISTHTML/EM/EM040.html EM section through cilia AS and A Level Biology (Chapter 11, includes nice light micrographs) and other textbooks include this topic (AS and A Level Biology states that there are no goblet cells in bronchioles). Practical Advanced Biology and Comprehensive Practical Biology for A Level both have protocols investigating these structures. The latter text also has several good micrographs, in colour. The CD-ROM: Images of Biology for Advanced Level, pub. Nelson Thornes, has suitable images that are useful here.
17
AO Learning outcomes Suggested Teaching activities Learning resources H (d)
describe the process of gas exchange between air in the alveoli and the blood;
Students can now relate their knowledge of diffusion across cell membranes to the exchange of respiratory gases. They should be clear about the difference between diffusion across walls and across membranes: i.e. diffusion across the alveolar wall and across the capillary endothelium is not the same as considering diffusion across the membranes of the individual epithelial cells. A common written error in examinations is to amalgamate the two concepts and to state that diffusion occurs across ‘epithelial cell walls’. Discuss the roles of blood flow and ventilation in maintaining diffusion gradients for oxygen and carbon dioxide between the alveoli and blood.
Class activities
1. Annotate diagrams with key features of the process such as: • mass transport of materials (e.g. ventilation of larger
bronchioles, blood flow) • diffusion in / out of alveoli / smaller bronchioles (fast) in air • maximising diffusion gradients across alveolar membrane • minimising diffusion distance from alveolar air to blood
plasma and cells so that slow diffusion in liquid is not a problem
• arrows indicating direction of exchange of oxygen and carbon dioxide
2. Produce a written account of the features that are present to maximise the efficiency of gas exchange.
http://www.meddean.luc.edu/lumen/MedEd/Histo/frames/Histo15.html series of photomicrographs and animation about alveolus / capillary gas exchange AS and A Level Biology (Chapter 4, pp.60 & 61) and other textbooks include this topic Bio Factsheet 26: Gas exchange in animals
18
AO Learning outcomes Suggested Teaching activities Learning resources H (e)
describe the effects of tar and carcinogens in tobacco smoke on the gas exchange system; (f) describe the signs and symptoms of lung cancer and chronic obstructive pulmonary disease (emphysema and chronic bronchitis);
The topic of carcinogens in tobacco smoke could be used to link back to DNA structure and to cell division. Discuss with the students how a change in DNA structure can affect cell function and how mutation could affect the control of mitosis and cell division, allowing cells to multiply uncontrollably. This is a good exercise for students to consider consequential events. Students should understand that it is usually not good practice to simply state that smoking causes lung disease – answers should be qualified with reference to tar or carcinogens in tobacco smoke and where necessary, students should make correct links to the different named diseases. There is a wide range of material on the causes, signs and symptoms of these diseases on the internet. Although the diseases can all be caused by tobacco smoking and share some common signs and symptoms, emphasise the need to students to know and understand the characteristic features that would identify each particular disease. Class activities 1. Web and bibliographic research leading to a short piece (maximum 400 words) of writing covering all the topics in learning outcome H(f). 2. Collect, display and analyse data about a particular smoking- related disease of the gas exchange system and give a short presentation to the rest of the class.
http://www.ash.org.uk/html/factsheets/html/fact04.html - edn1 fact sheet about the relationship between smoking and many cancers, not only lung cancer. http://www.lung.ca/diseases-maladies/index_e.php a Canadian site with information about lung diseases including COPD and lung cancer. http://library.med.utah.edu/WebPath/LUNGHTML/LUNGIDX.html respiratory tract and respiratory diseases images Chapter 12 in AS and A Level Biology is devoted to smoking and disease.
19
AO Learning outcomes Suggested Teaching activities Learning resources H (g)
describe the effects of nicotine and carbon monoxide on the cardiovascular system; (h) explain the link between smoking and atherosclerosis, coronary heart disease and strokes;
This topic should be related back to earlier work on the structure and function of the heart, and the carriage of oxygen by haemoglobin. Check that students know what is meant by the term cardiovascular. Note that they are not required to know about the addictive effects of nicotine, as the learning outcome is geared towards effects on the cardiovascular system. Students should be able to give an account of the factors of smoking that contribute to the named conditions. The terminology used and the approach taken varies with textbook used. Students should try and consider sequential events and to make the links that provide the overall picture:
• damage to endothelial lining caused by changing / high blood pressure (nicotine) and by damaging chemical components (from smoking) – plaque formation
• exposure of fibrous and smooth muscle tissue leading to increase in the tissue (which may protrude into the lumen)
• platelet damage and clot formation (nicotine effect plus non-smooth lining causing turbulent blood flow) - thrombosis
• cholesterol deposition and macrophage attraction to damaged area (leading to foam cells) – atheroma / atheromatous plaque
• over time, calcium deposition (causes hardening and loss of elasticity) – atherosclerosis (mention arteriosclerosis)
• above effects causing narrowing lumen in coronary arteries, reducing blood flow to cardiac muscle , hence insufficient oxygen and glucose (angina, heart attacks)
• above effects in the coronary arteries = coronary heart disease
• above effects in the arteries serving the brain that lead to reduced blood supply (thrombosis or aneurysm) = strokes
http://www.bhf.org.uk/ British Heart Foundation has information and statistics on heart disease and risk factors. http://www.heart.org/HEARTORG/ the American Heart Association also has statistics that students can analyse and use in support of presentations to the rest of the group. http://library.med.utah.edu/WebPath/ATHHTML/ATHIDX.html coronary disease images, of which: http://library.med.utah.edu/WebPath/CVHTML/CV005.html has an image of an atherosclerotic coronary artery http://library.med.utah.edu/WebPath/CVHTML/CV028.html coronary artery bypass photograph At the end of Chapter 12 in AS and A Level Biology there is a discussion about prevention and cure. Bio Factsheet 37: Ischaemic (coronary) heart disease Bio Factsheet 218: Biology of risk factors 1: Smoking Bio Factsheet 188: Cholesterol, heart disease and statins - some useful information
20
21
(j) discuss the difficulties in achieving a balance between preventions and cure with reference to coronary heart disease, coronary by-pass surgery and heart transplant surgery;
This learning outcome is ideal for student research and whole class discussion.
Class activities 1. From bibliographic and web-based research make annotated diagrams or bullet-pointed notes on the causes and effects of atherosclerosis (thrombosis and aneurysm) and how these relate to coronary heart disease and strokes. 2. Place in order, diagrams illustrating the events leading to atherosclerosis, stick in the diagrams and then annotate, or work in pairs and give a verbal description of what is occurring. 3. Whole class discussion to build understanding of the problems caused by coronary heart disease and the difficulties in achieving the prevention / cure balance.
AO Learning outcomes Suggested Teaching activities Learning resources H (i)
evaluate the epidemiological and experimental evidence linking cigarette smoking to disease and early death
This is another good opportunity for students to develop data-handling skills. They should understand the difference between demonstrating a link between two factors and demonstrating that one causes the other. A web search will provide a very wide range of data from many different countries.
Class activities
1. Use information from a number of sources to make a brief bullet point summary of the available evidence, and a brief written evaluation of the strength of the experimental and epidemiological case that smoking is linked to disease and early death
http://www.parliament.the-stationery-office.co.uk/pa/cm199900/cmselect/cmhealth/27/9120907.htm historical review of development of epidemiological knowledge http://users.rcn.com/jkimball.ma.ultranet/BiologyPages/E/Epidemiology.html illustrated article about epidemiology, using smoking as an example A summary of some of this evidence in AS and A Level Biology, Chapter 12, pp. 154-157. Advanced Biology: Principles and Applications. Study Guide, Clegg and Mackean, pub. John Murray, also has ideas for students to research (out of print but ‘used’ copies may be available)