Embed Size (px)
Citation preview
1
AS-4084 GURU GHASIDAS VISHWAVIDYALAYA, BILASPUR (C.G.)
INSTITUTE OF TECHNOLOGY DEPARTMENT OF CIVIL ENGINEERING
B.TECH 2nd YEAR, IVth SEMESTER SUBJECT: TRANSPORTATION ENGINEERING-I
SECTION-A
Solution 1: 1. (a) 5 2. (a) Surface drainage 3. (b) 0.15 4. (c) 4 5. (a) Traffic intersection 6. (a) Cycle length 7. (b) Flash point 8. (d) 2055 9. (b) Flaps 10. (c) Sucking effect
SECTION-B
Solution 2:

2

3
4

5
Solution 3a:
FACTORS AFFECTING ROAD ALIGNMENT
a. Design speed
b. Topography
c. Other factors
i. Vehicle
ii. Human
iii. Traffic
iv. Environmental
v. Economy
vi. Others
Design speed
1. Design speed is the single most important factor that affects the geometric design.
2. Affects the sight distance, horizontal curve and the length of vertical curves.
3. Speed of vehicles vary with driver, terrain etc, a design speed is adopted for all the geometric design.
4. Design speed is defined as the highest continuous speed at which individual vehicles can travel with safety on the highway when weather conditions are conducive.
5. At the same time, a higher design speed has cascading effect in other geometric designs and thereby cost escalation. Therefore, an 85th percentile design speed is normally adopted. This speed is defined as that speed which is greater than the speed of 85% of drivers. In some countries this is as high as 95 to 98 percentile speed.
Topography
1. Next important factor that affects the geometric design is the topography.
2. It is easier to construct roads with required standards for a plain terrain.
3. However, for a given design speed, the construction cost increases multiform with the gradient and the terrain. Therefore, geometric design standards are different for different terrain to keep the cost of construction and time of construction under control. This is characterized by sharper curves and steeper gradients.
Other factors
In addition to design speed and topography, there are various other factors that affect
the geometric design and they are briefly discussed below:

6
1. Vehicle: The dimensions, weight of the axle and operating characteristics of a vehicle influence the design aspects such as width of the pavement, radii of the curve, clearances, parking geometrics etc. A design vehicle which has standard weight, dimensions and operating characteristics are used to establish highway design controls to accommodate vehicles of a designated type.
2. Human: The important human factors that influence geometric design are the physical, mental and psychological characteristics of the driver and pedestrians like the reaction time.
3. Traffic: It will be uneconomical to design the road for peak traffic flow. Therefore a reasonable value of traffic volume is selected as the design hourly volume which is determined from the various traffic data collected. The geometric design is thus based on this design volume, capacity etc.
4. Environmental: Factors like air pollution, noise pollution etc. should be given due consideration in the geometric design of roads.
5. Economy: The design adopted should be economical as far as possible. It should match with the funds alloted for capital cost and maintenance cost.
6. Others: Geometric design should be such that the aesthetics of the region is not affected.

7
Solution 3b:
Importance of Road Drainage

8
Solution 4:
i. Kerbs Kerbs indicate the boundary between the carriage way and the shoulder or islands or footpaths. Different types of kerbs are (Figure 1): a. Low or mountable kerbs b. Semi-barrier type kerbs c. Barrier type kerbs d. Submerged kerbs
a. Low or mountable kerbs • This type of kerbs are provided such that they encourage the traffic to remain in
the through traffic lanes and also allow the driver to enter the shoulder area with little difficulty.
• The height of this kerb is about 10 cm above the pavement edge with a slope which allows the vehicle to climb easily.
• This is usually provided at medians and channelization schemes and also helps in longitudinal drainage.
b. Semi-barrier type kerbs
• When the pedestrian traffic is high, these kerbs are provided.
• Their height is 15 cm above the pavement edge.
• This type of kerb prevents encroachment of parking vehicles, but at acute emergency it is possible to drive over this kerb with some difficulty.
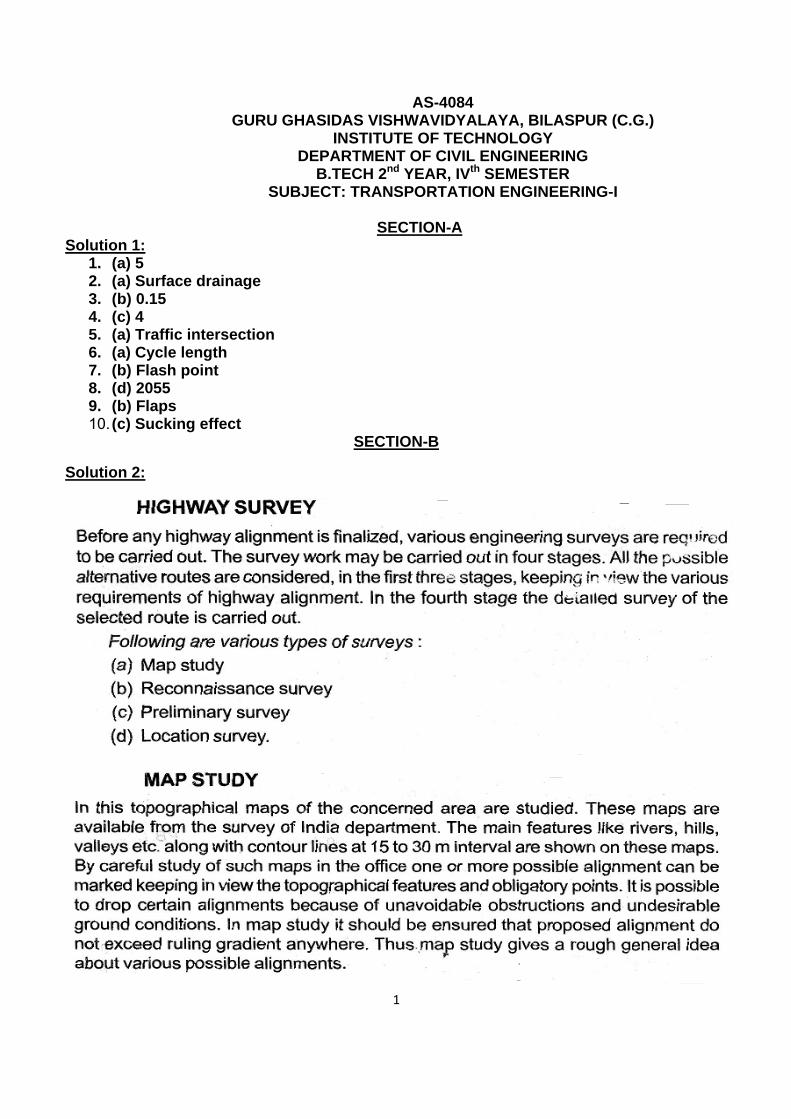
c. Barrier type kerbs
• They are designed to discourage vehicles from leaving the pavement.
• They are provided when there is considerable amount of pedestrian traffic.
• They are placed at a height of 20 cm above the pavement edge with a steep batter.
9
d. Submerged kerbs
• They are used in rural roads.
• The kerbs are provided at pavement edges between the pavement edge and shoulders.
• They provide lateral confinement and stability to the pavement.
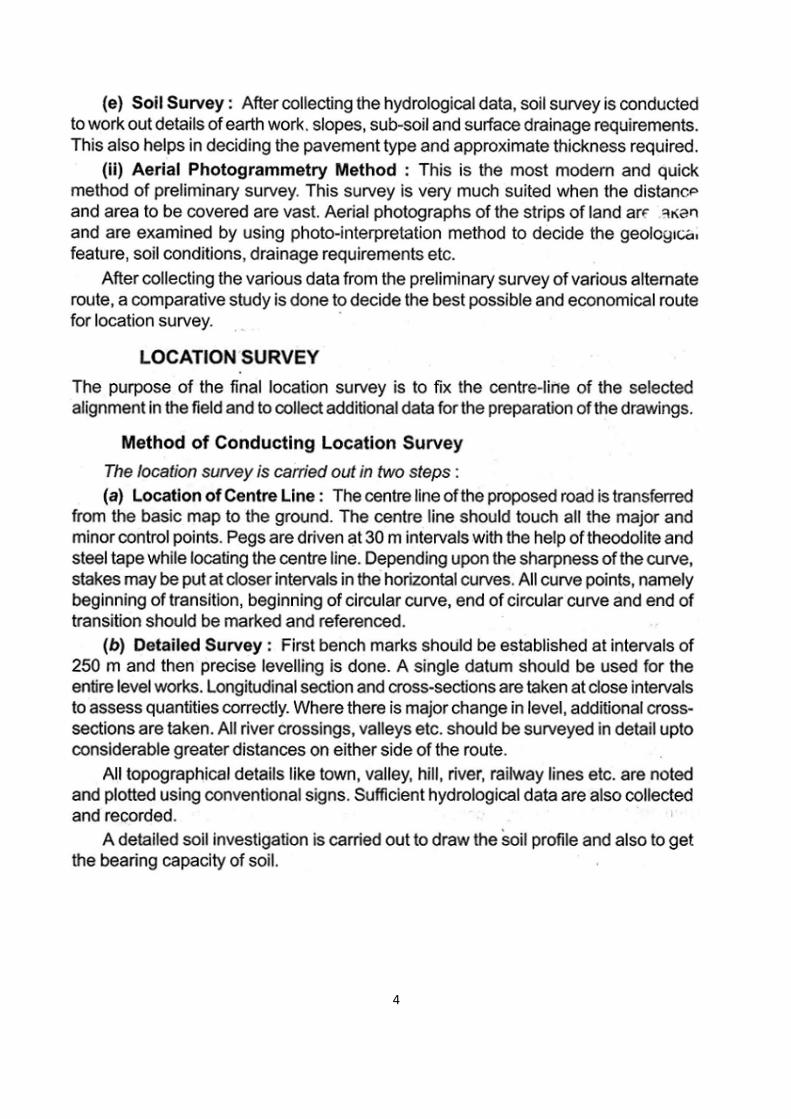
ii. Shoulders
Shoulders are provided along the road edge and are intended for accommodation of stopped vehicles, serve as an emergency lane for vehicles and provide lateral support for base and surface courses.
The shoulder should be strong enough to bear the weight of a fully loaded truck even in wet conditions.
The shoulder width should be adequate for giving working space around a stopped vehicle.
It is desirable to have a width of 4.6 m for the shoulders.
A minimum width of 2.5 m is recommended for 2-lane rural highways in India.
iii. Formation width
10
Solution 5:
Easement or Transition Curves
Easement or Transition curve is provided to change the horizontal alignment from straight to circular curve gradually and has a radius which decreases from infinity at the straight end (tangent point) to the desired radius of the circular curve at the other end (curve point).
There are five objectives for providing transition curve and are given below:
1. To introduce gradually the centrifugal force between the tangent point and the beginning of the circular curve, avoiding sudden jerk on the vehicle. This increases the comfort of passengers.
2. To enable the driver turn the steering gradually for his own comfort and security,
3. To provide gradual introduction of super elevation.
4. To provide gradual introduction of extra widening.
5. To enhance the aesthetic appearance of the road.
Type of easement curve
Spiral or clothoid
Cubic parabola
Lamniscate.
IRC recommends spiral as the transition curve because it fulfills the requirement of an ideal transition curve, that is
Rate of change or centrifugal acceleration is consistent (smooth).
Radius of the transition curve is ȸ at the straight edge and changes R to
at the curve point ( ) and calculation and field implementation is
very easy.
Length of transition curve
The length of the transition curve should be determined as the maximum of the following three criteria:
Rate of change of centrifugal acceleration
Rate of change of super elevation
An empirical formula given by IRC.
Rate of change of centrifugal acceleration, at the tangent point, radius is infinity and hence centrifugal acceleration is zero.
At the end of the transition, the radius R has minimum value R.

11
The rate of change of centrifugal acceleration should be adopted such that the design should not cause discomfort to the drivers.
If c is the rate of change of centrifugal acceleration, it can be written as:
a. Rate of change of centrifugal acceleration, at the tangent point, radius is infinity and hence centrifugal acceleration is zero.
At the end of the transition, the radius R has minimum value R.
The rate of change of centrifugal acceleration should be adopted such that the design should not cause discomfort to the drivers.
If c is the rate of change of centrifugal acceleration, it can be written as:
• Therefore, the length of the transition curve Ls1 in m is
where c is the rate of change of centrifugal acceleration given by an empirical formula suggested by by IRC as below:
b. Rate of introduction of super-elevation
• Raise (E) of the outer edge with respect to inner edge is given by .
• The rate of change of this raise from 0 to E is achieved gradually with a gradient of 1 in N over the length of the transition curve (typical range of N is 60-150).
Therefore, the length of the transition curve Ls2 is:

12
c. By empirical formula
IRC suggest the length of the transition curve is minimum for a plain and rolling terrain:
For steep and hilly terrain is:
and the shift s as
The length of the transition curve is the maximum of equations for , i.e.
SSolution 6:
13
14

15

SSolution 7:
16

17
18
Solution8:
AIM To determine the water absorption of the given coarse aggregate.
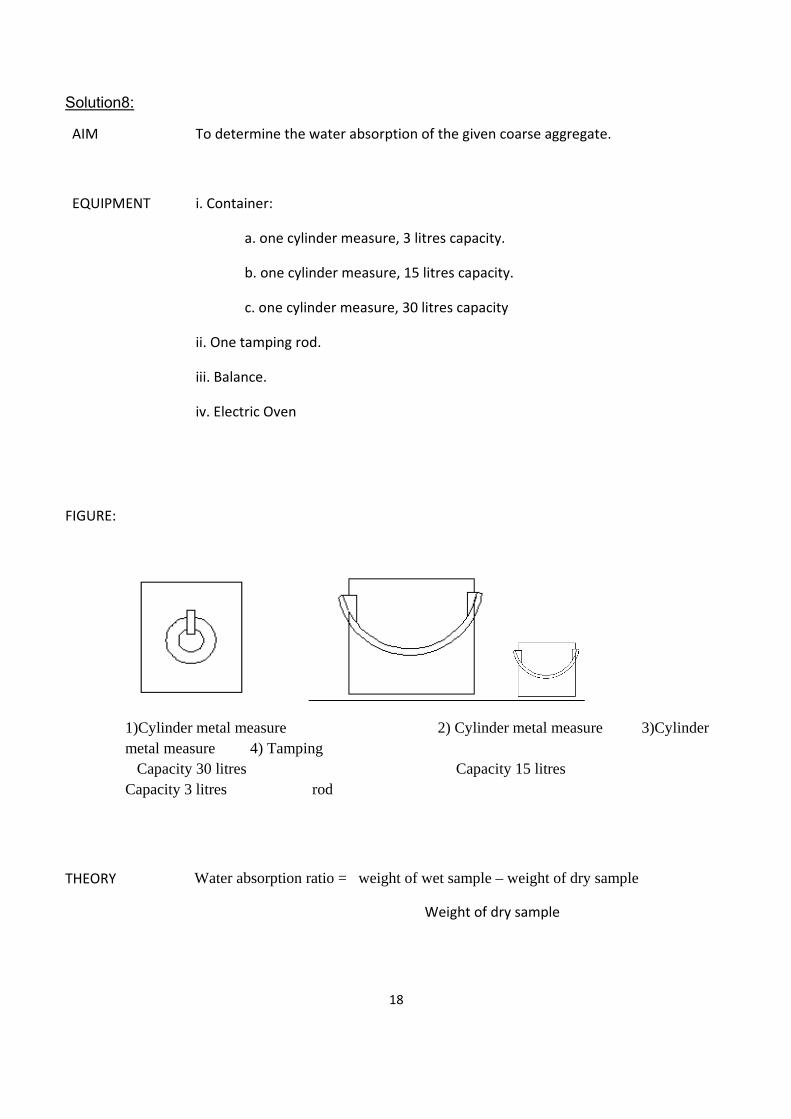
EQUIPMENT i. Container:
a. one cylinder measure, 3 litres capacity.
b. one cylinder measure, 15 litres capacity.
c. one cylinder measure, 30 litres capacity
ii. One tamping rod.
iii. Balance.
iv. Electric Oven
FIGURE:
1)Cylinder metal measure 2) Cylinder metal measure 3)Cylinder metal measure 4) Tamping Capacity 30 litres Capacity 15 litres Capacity 3 litres rod
THEORY Water absorption ratio = weight of wet sample – weight of dry sample
Weight of dry sample
19
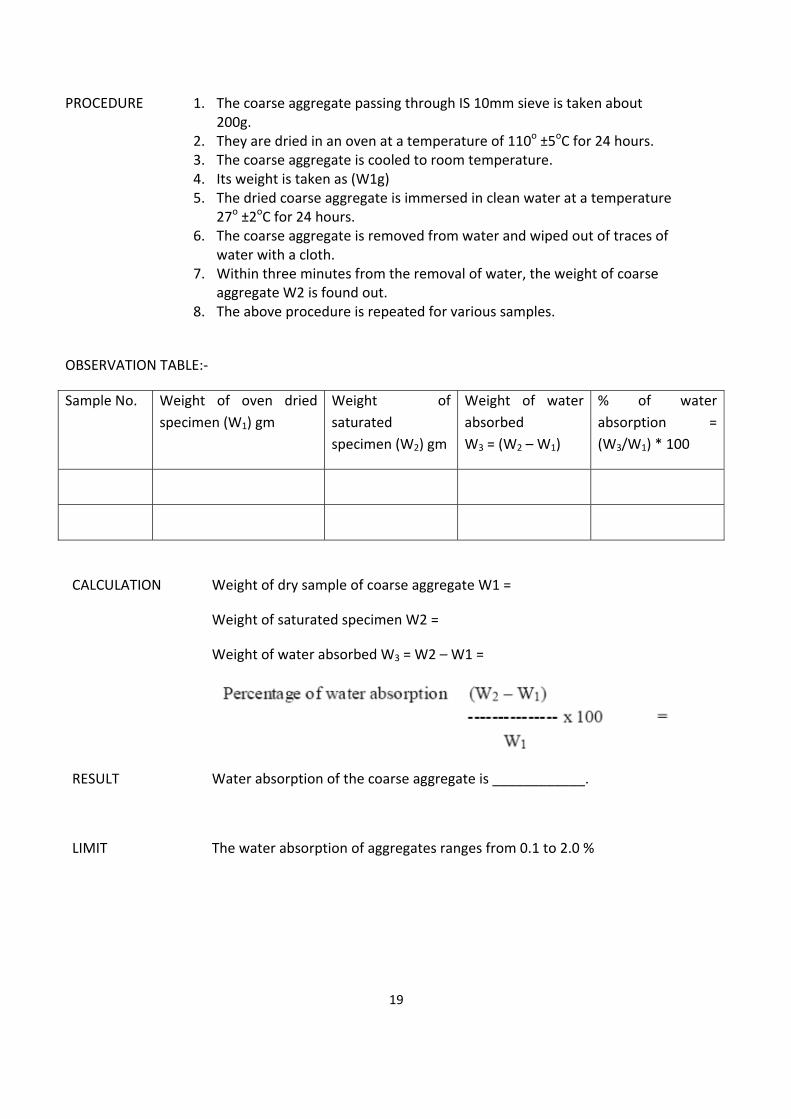
PROCEDURE 1. The coarse aggregate passing through IS 10mm sieve is taken about 200g.
2. They are dried in an oven at a temperature of 110o ±5oC for 24 hours. 3. The coarse aggregate is cooled to room temperature. 4. Its weight is taken as (W1g) 5. The dried coarse aggregate is immersed in clean water at a temperature
27o ±2oC for 24 hours. 6. The coarse aggregate is removed from water and wiped out of traces of
water with a cloth. 7. Within three minutes from the removal of water, the weight of coarse
aggregate W2 is found out. 8. The above procedure is repeated for various samples.
OBSERVATION TABLE:‐
Sample No. Weight of oven dried specimen (W1) gm
Weight of saturated specimen (W2) gm
Weight of water absorbed W3 = (W2 – W1)
% of water absorption = (W3/W1) * 100
CALCULATION Weight of dry sample of coarse aggregate W1 =
Weight of saturated specimen W2 =
Weight of water absorbed W3 = W2 – W1 =
RESULT Water absorption of the coarse aggregate is ____________.
LIMIT The water absorption of aggregates ranges from 0.1 to 2.0 %
20
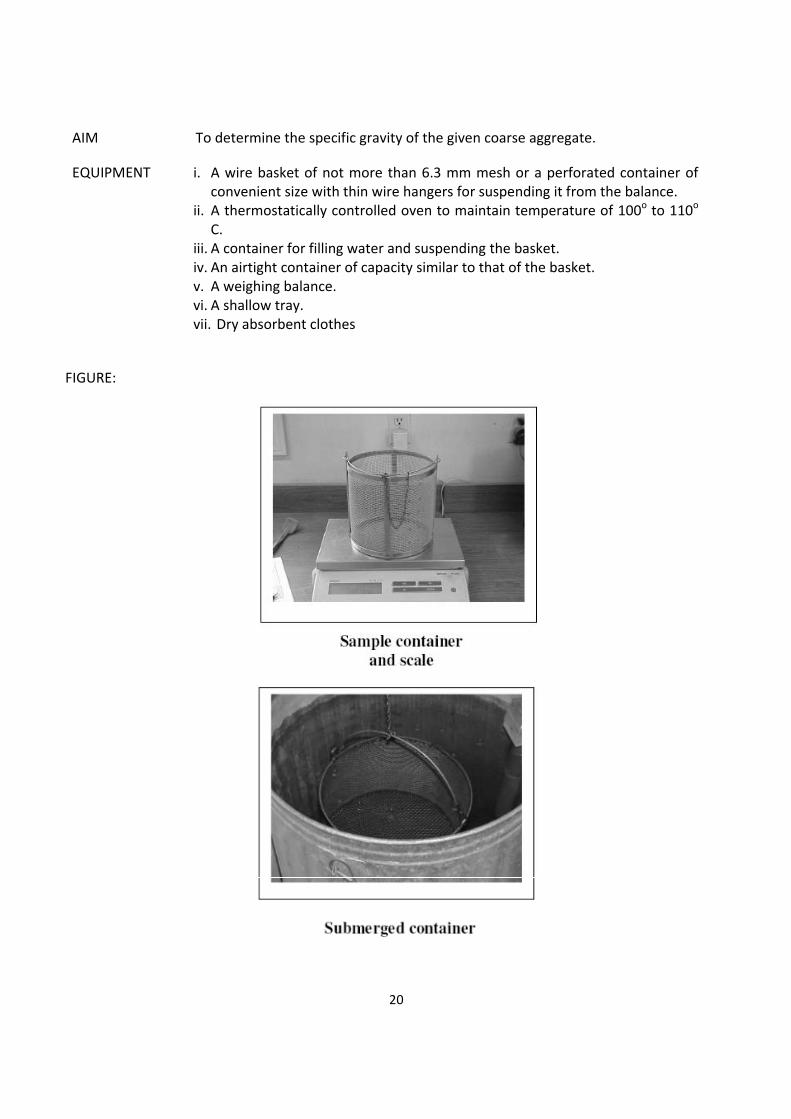
AIM To determine the specific gravity of the given coarse aggregate.
EQUIPMENT i. A wire basket of not more than 6.3 mm mesh or a perforated container of convenient size with thin wire hangers for suspending it from the balance.
ii. A thermostatically controlled oven to maintain temperature of 100o to 110o C.
iii. A container for filling water and suspending the basket. iv. An airtight container of capacity similar to that of the basket. v. A weighing balance. vi. A shallow tray. vii. Dry absorbent clothes
FIGURE:
21
THEORY Specific gravity of aggregate is the ratio of density of aggregate to the density of water at 4⁰C.
Specific gravity = Density of aggregate
Density of water at 4oC
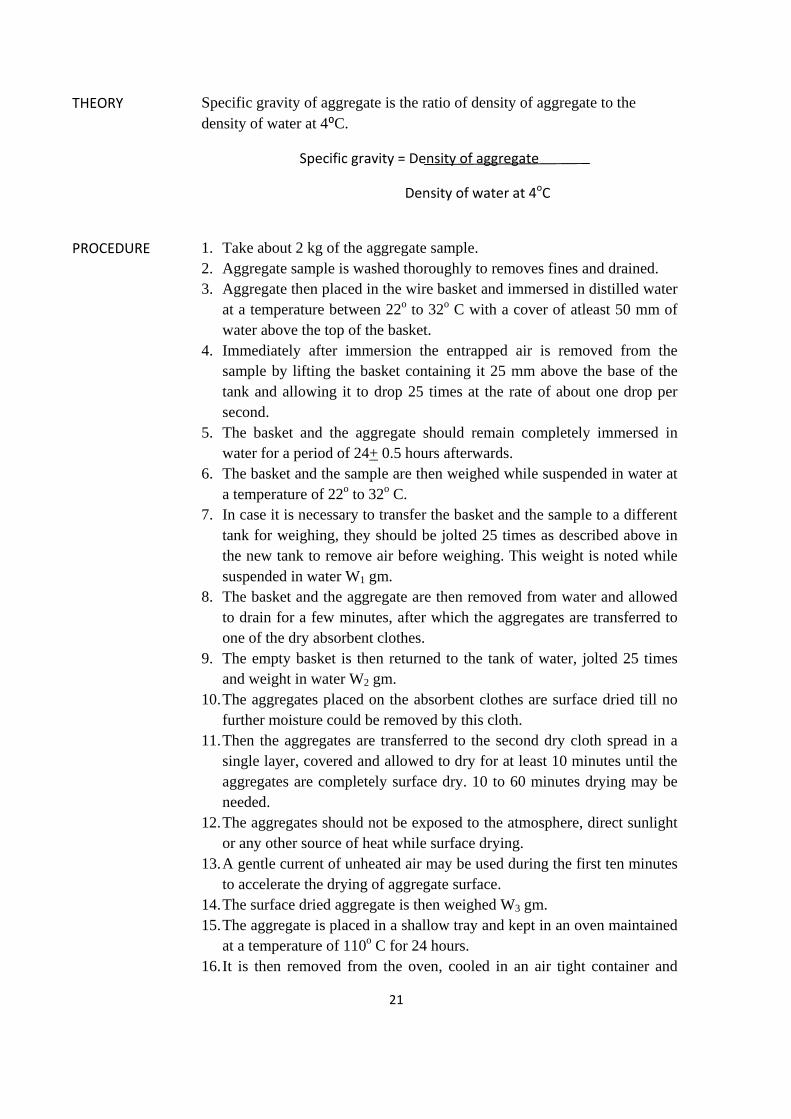
PROCEDURE 1. Take about 2 kg of the aggregate sample.
2. Aggregate sample is washed thoroughly to removes fines and drained. 3. Aggregate then placed in the wire basket and immersed in distilled water
at a temperature between 22o to 32o C with a cover of atleast 50 mm of water above the top of the basket.
4. Immediately after immersion the entrapped air is removed from the sample by lifting the basket containing it 25 mm above the base of the tank and allowing it to drop 25 times at the rate of about one drop per second.
5. The basket and the aggregate should remain completely immersed in water for a period of 24+ 0.5 hours afterwards.
6. The basket and the sample are then weighed while suspended in water at a temperature of 22o to 32o C.
7. In case it is necessary to transfer the basket and the sample to a different tank for weighing, they should be jolted 25 times as described above in the new tank to remove air before weighing. This weight is noted while suspended in water W1 gm.
8. The basket and the aggregate are then removed from water and allowed to drain for a few minutes, after which the aggregates are transferred to one of the dry absorbent clothes.
9. The empty basket is then returned to the tank of water, jolted 25 times and weight in water W2 gm.
10. The aggregates placed on the absorbent clothes are surface dried till no further moisture could be removed by this cloth.
11. Then the aggregates are transferred to the second dry cloth spread in a single layer, covered and allowed to dry for at least 10 minutes until the aggregates are completely surface dry. 10 to 60 minutes drying may be needed.
12. The aggregates should not be exposed to the atmosphere, direct sunlight or any other source of heat while surface drying.
13. A gentle current of unheated air may be used during the first ten minutes to accelerate the drying of aggregate surface.
14. The surface dried aggregate is then weighed W3 gm. 15. The aggregate is placed in a shallow tray and kept in an oven maintained
at a temperature of 110o C for 24 hours. 16. It is then removed from the oven, cooled in an air tight container and

22
weighed W4 gm. 17. At least two test should be carried out, but not concurrently.
OBSERVATION TABLE:‐
Sl. No. Details of sample Sample 1 Sample 2 Sample 3
1 Weight of saturated aggregate suspended in water with the basket = W1 gm.
2 Weight of basket suspended in water = W2 gm.
3 Weight of saturated aggregate in water = Ws = (W1 – W2) gm
4 Weight of saturated surface dry aggregate in air = W4 gm
5 Weight of water equal to the volume of the aggregate = (W3 – Ws) gm
CALCULATION (i)
(ii)

23
RESULT The specific gravity of coarse aggregate ____________.
LIMIT The specific gravity of aggregates ranges from 2.5 to 3.0.
24
Solution 9:
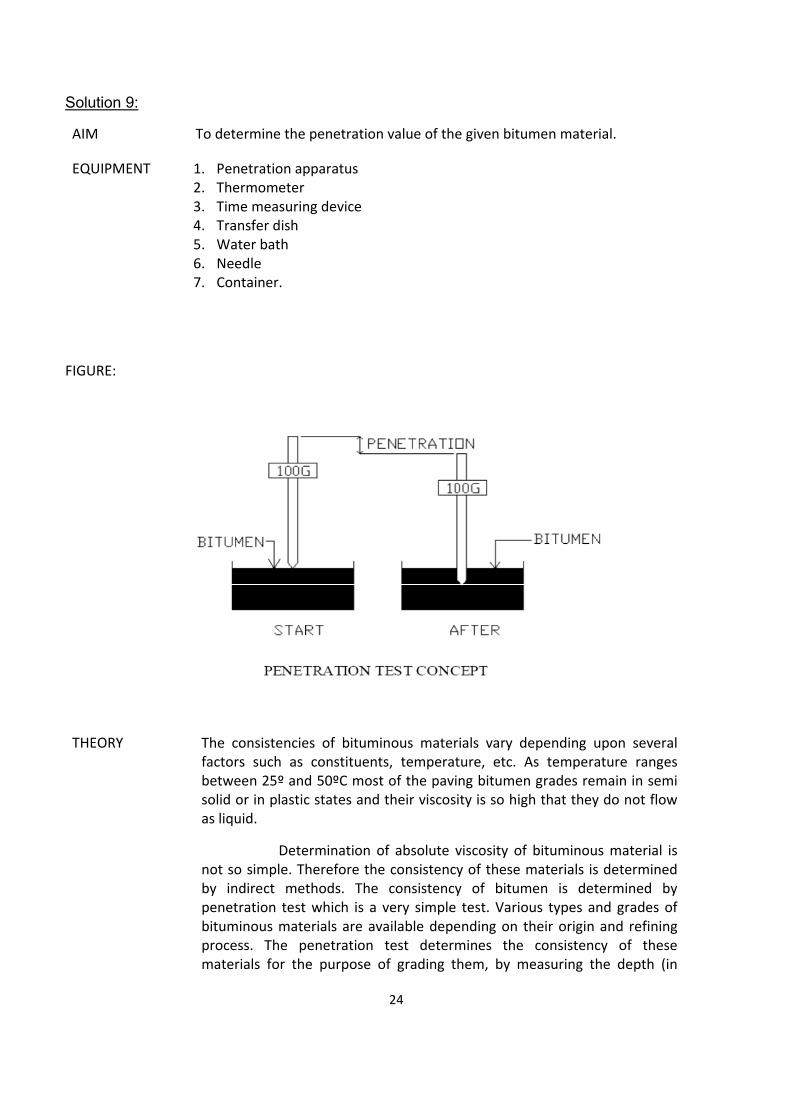
AIM To determine the penetration value of the given bitumen material.
EQUIPMENT 1. Penetration apparatus 2. Thermometer 3. Time measuring device 4. Transfer dish 5. Water bath 6. Needle 7. Container.
FIGURE:
THEORY The consistencies of bituminous materials vary depending upon several factors such as constituents, temperature, etc. As temperature ranges between 25º and 50ºC most of the paving bitumen grades remain in semi solid or in plastic states and their viscosity is so high that they do not flow as liquid.
Determination of absolute viscosity of bituminous material is not so simple. Therefore the consistency of these materials is determined by indirect methods. The consistency of bitumen is determined by penetration test which is a very simple test. Various types and grades of bituminous materials are available depending on their origin and refining process. The penetration test determines the consistency of these materials for the purpose of grading them, by measuring the depth (in

25
units of one tenth of a millimeter or one hundredth of a centimeter) to which a standard needle will penetrate vertically under specified conditions of standard load, duration and temperature. Thus the basic principle of the penetration test is the measurement of the penetration (in units of one tenth of a mm) of a standard needle in a bitumen sample maintained at 25C during five seconds, the total weight of the needle assembly being 100gm. The softer the bitumen, the greater will be the penetration. The test is conducted as per IS‐1203 for paving bitumen.
PROCEDURE 1. Soften the material to a pouring consistency at a temperature not more than 60oC for tars and 90oC for bitumen above the approximate softening point and stir it thoroughly until it is homogenous and is free from air bubbles and water. Pour the melt into the container to a depth atleast 10mm in excess of the expected penetration. Protect the sample from dust and allow it to cool in an atmosphere at a temperature between 15o to 30oC for one hour. Then place it along with the transfer dish in the water bath at 25.0o ±0.1oC and allow it to remain for 1 to 1.5 hour. The test is carried out at 25.0o ±0.1oC, unless otherwise stated.
2. Fill the transfer dish water from the water bath to depth sufficient to cover the container completely. Place the sample in it and put it upon the stand of the penetration apparatus.
3. Clean the needle with benzene, dry it and load with weight. The total moving load required is 100±0.25gms, including the weight of the needle, carrier and super‐imposed weights.
4. Adjust the needle to make contact with the surface of the sample. This may be done by placing the needle point with its image reflected by the surface of the bituminous material.
5. Make the pointer of the dial to read zero or note the initial dial reading. 6. Release the needle for exactly five seconds. 7. Adjust the penetration machine to measure the distance penetrated. 8. Make at least 3 reading at points on the surface of the sample not less
than 10mm apart and not less than 10mm from the side of the dish. 9. After each test return the sample and transfer dish to the water bath
and wash the needle clean with benzene and dry it. 10. In case of material of penetration greater than 225 three
determinations on each of the two identical tests specimens using a separate needle for each determination should be made, leaving the needle in the sample on completion of each determinations to avoid disturbance of the specimen.
OBSERVATION TABLE:‐
Readings Trials Mean Value

26
1 2 3
Penetrometer Dial Initial Reading
Penetrometer Dial Final Reading
Penetration Value
RESULT The average penetration value of a given bitumen sample is __________ and the grade of bitumen is __________________.
S
A
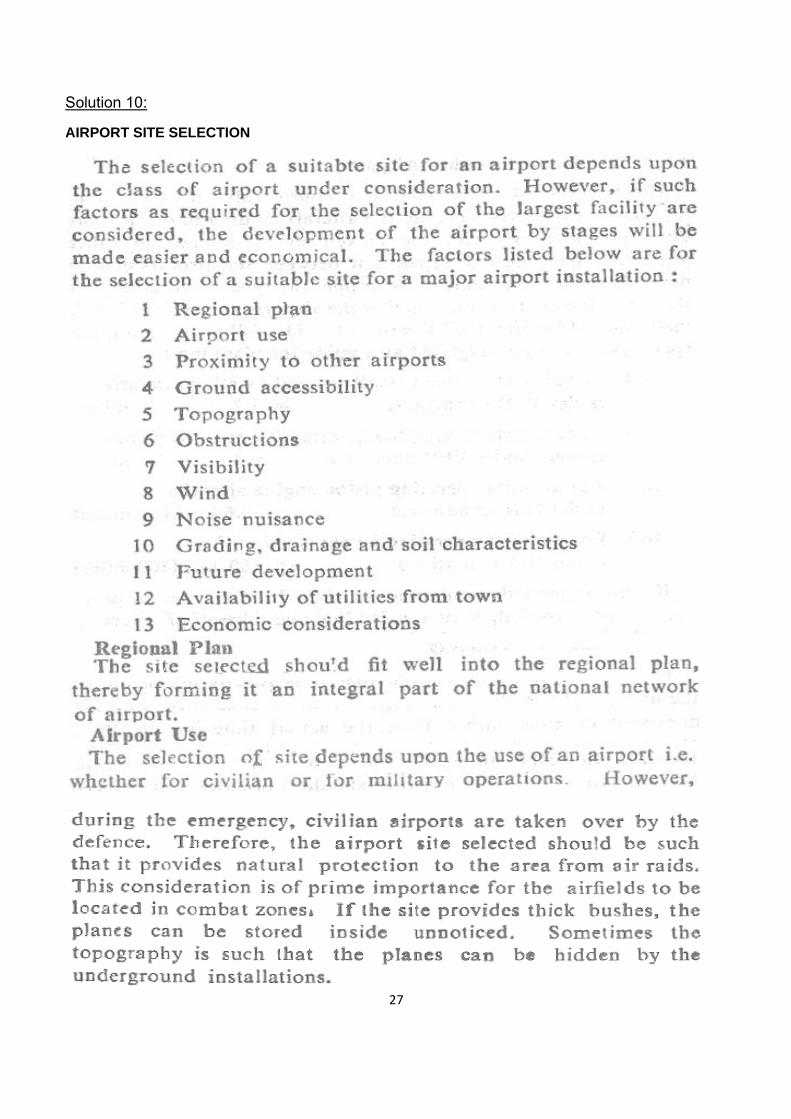
Solution 10
AIRPORT S
0:
SITE SELECCTION
27
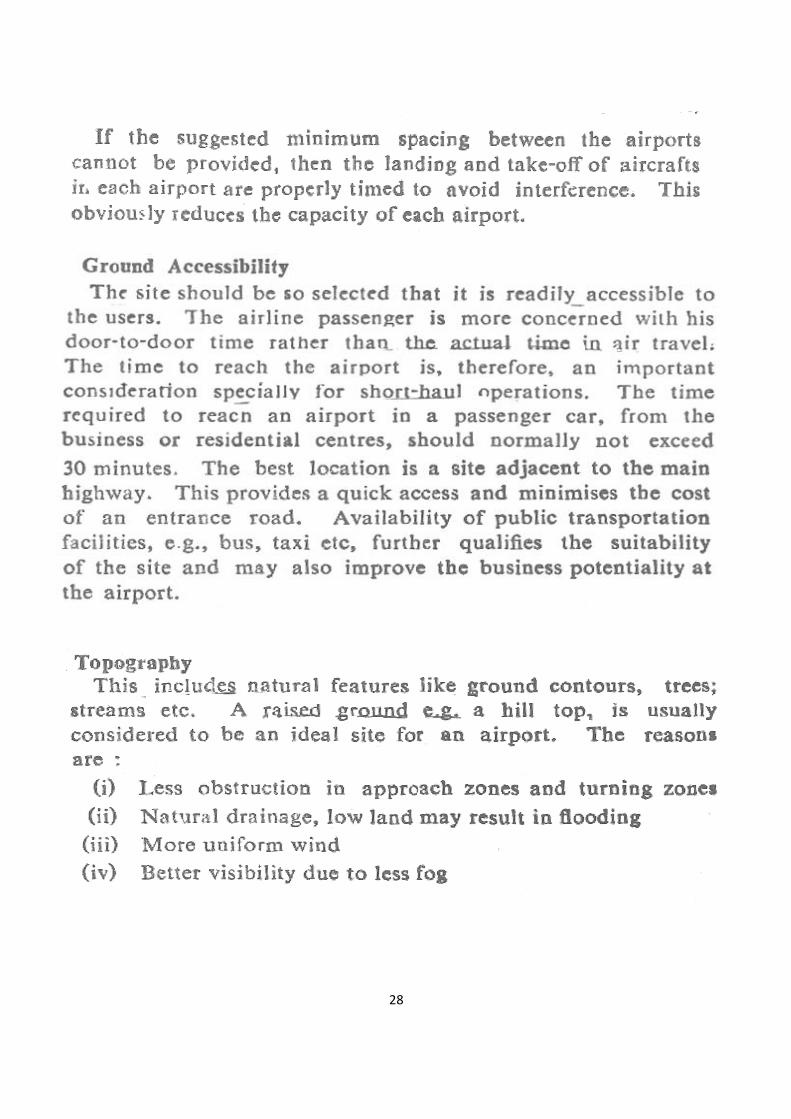
28
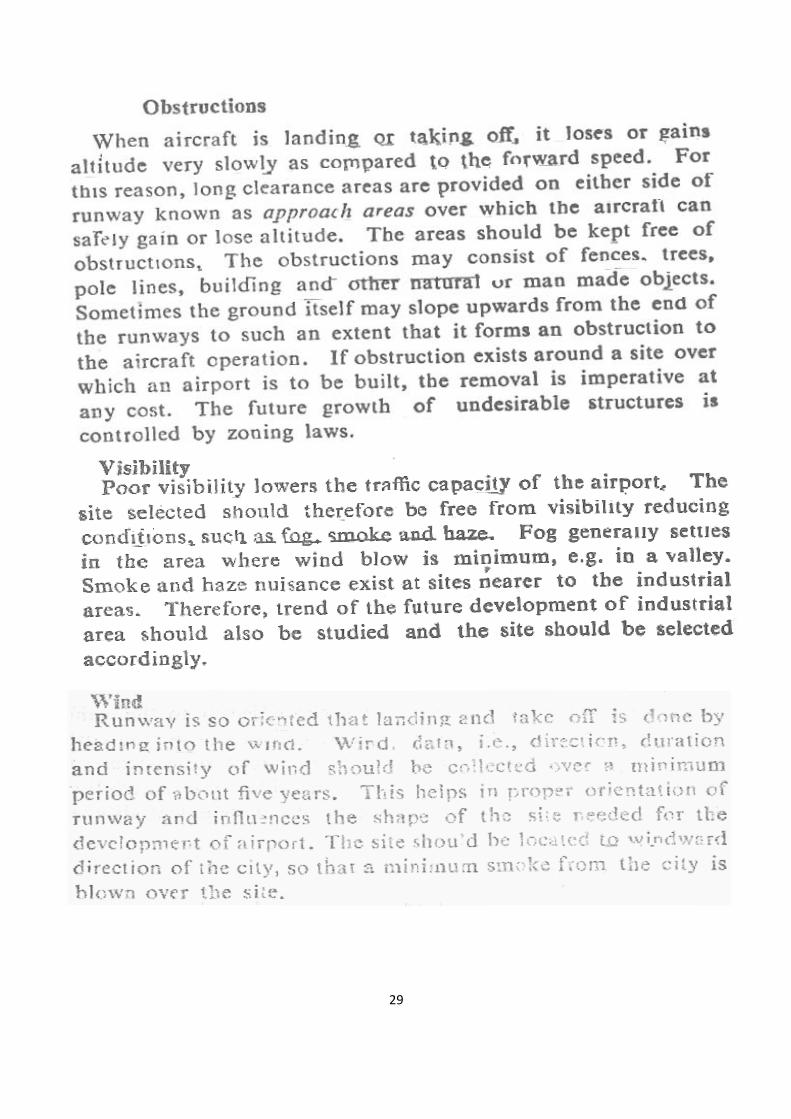
29
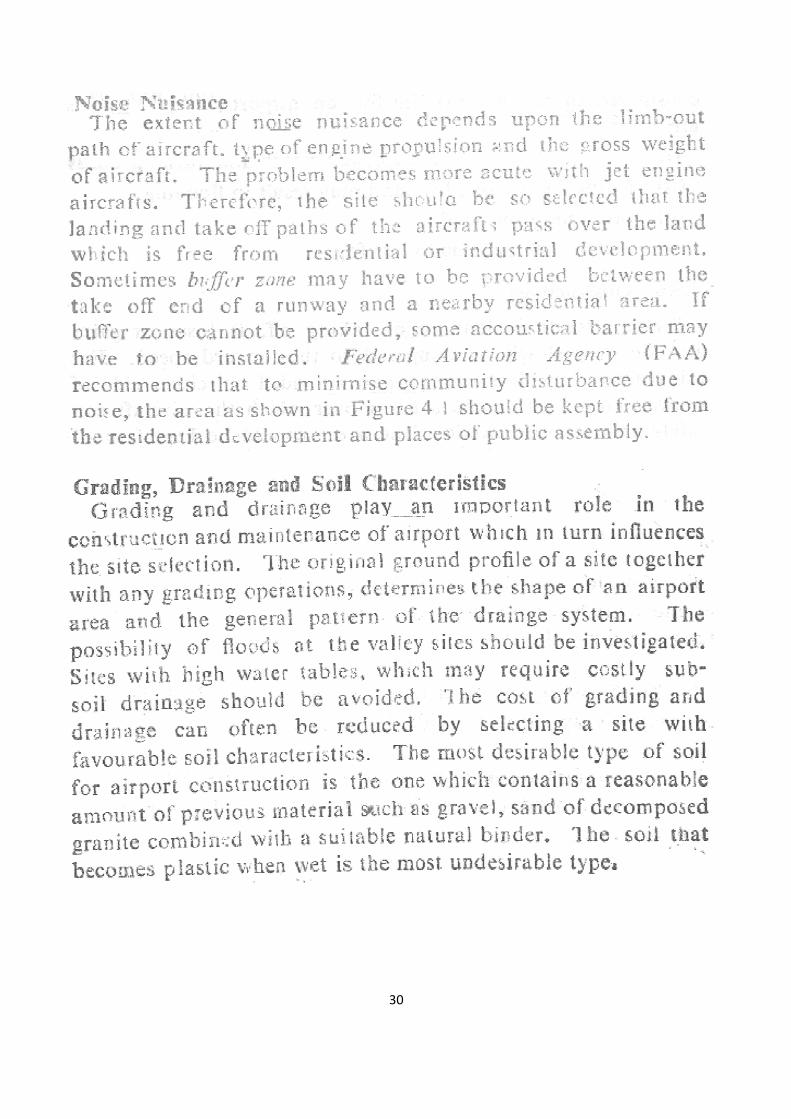
30

31
32
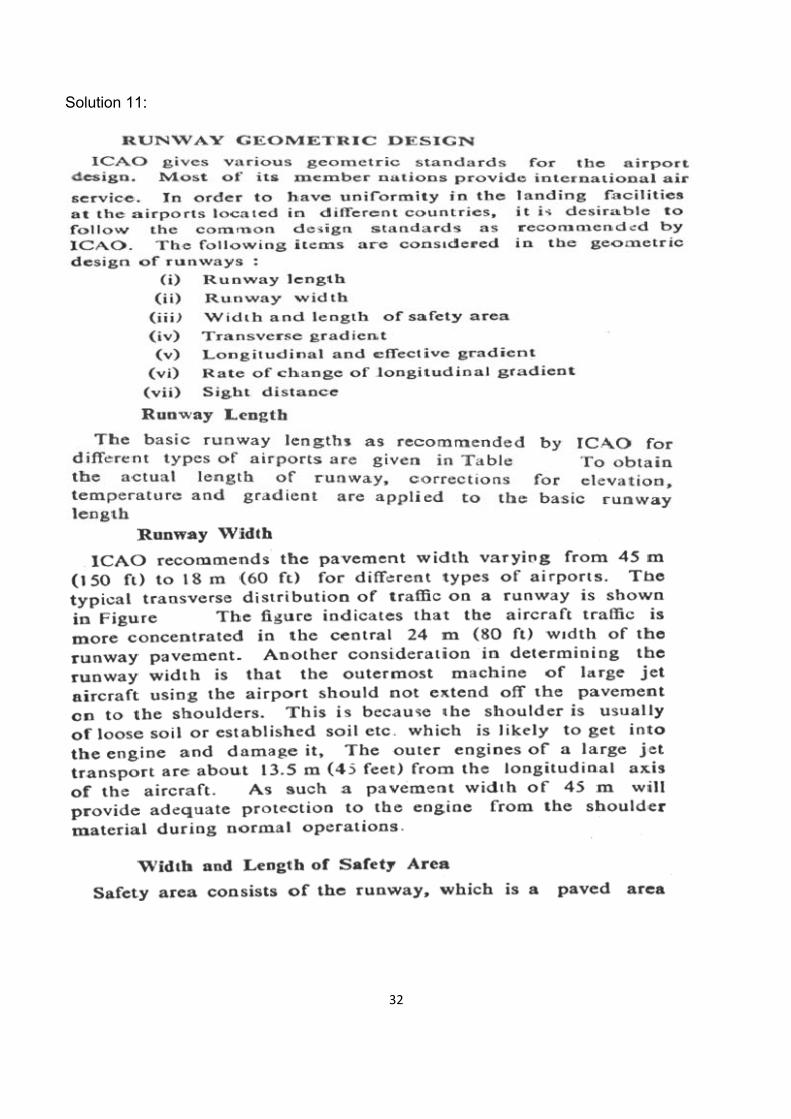
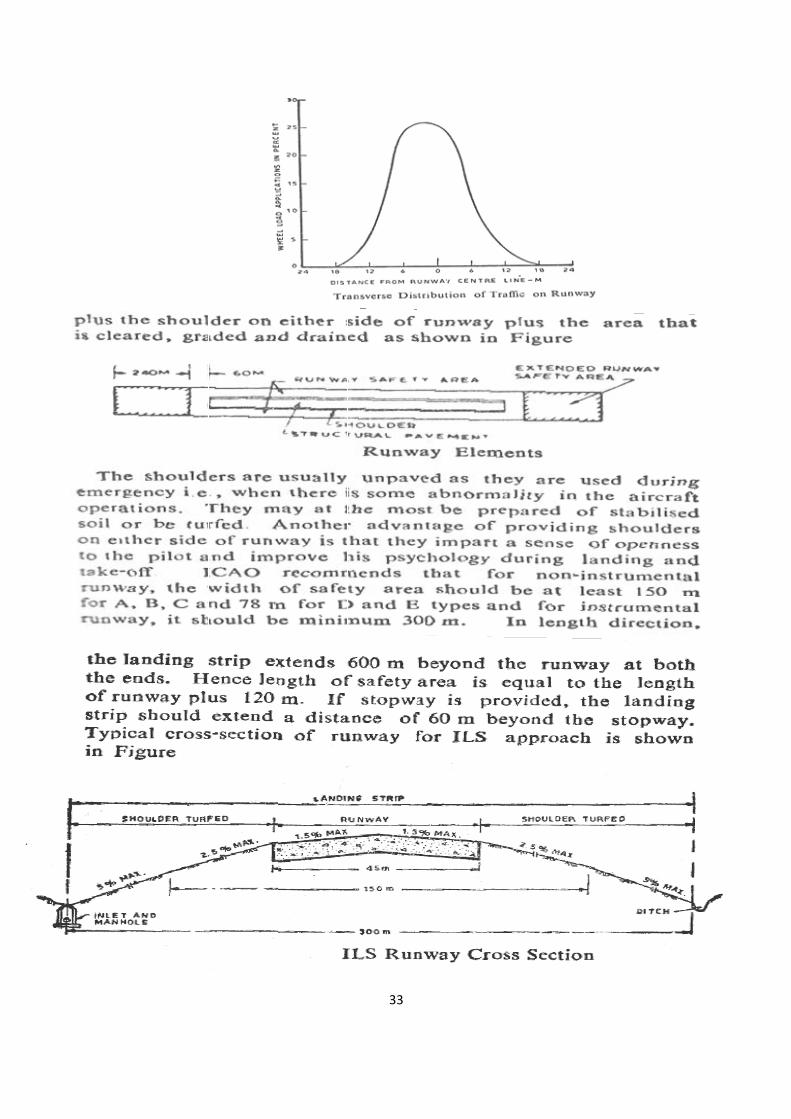
Solution 11:
33
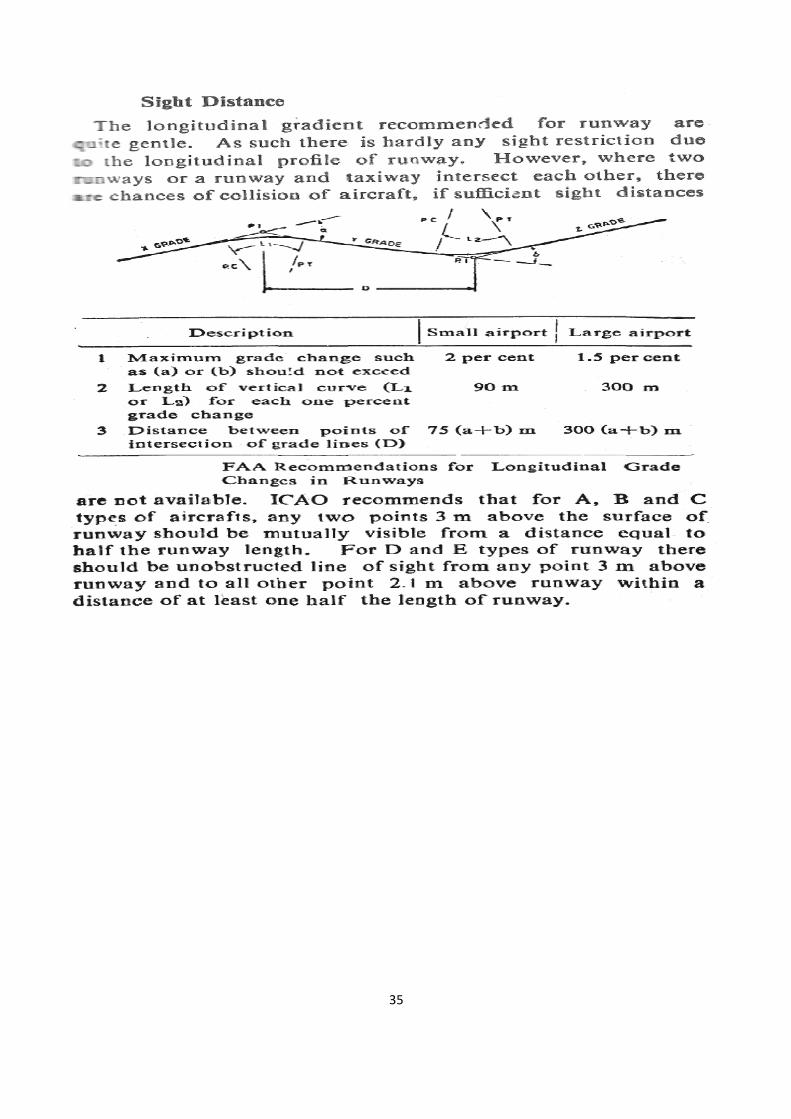
34
35
![Spiral transitions - Zhejiang University · been used for many years in path smoothing applications, such as highway or rail design [5,42]. Clothoid is also referred as the Cornu](https://img.pdfslide.us/doc/110x75/605d6d3464e7f70c637e1830/spiral-transitions-zhejiang-been-used-for-many-years-in-path-smoothing-applications.jpg)


![arXiv:1305.6644v2 [math.NA] 5 Jun 2013 · Fast and accurate clothoid tting 3 spiral curve is the following x(s) = x 0 + Z s 0 cos 1 2 0˝2 + ˝+ # 0 d˝; y(s) = y 0 + Z s 0 sin 1](https://img.pdfslide.us/doc/110x75/5fd1200f64809f6fc5525102/arxiv13056644v2-mathna-5-jun-2013-fast-and-accurate-clothoid-tting-3-spiral.jpg)


![CLOTHOID SPLINE TRANSITION SPIRALS · A planar G2 curve (a curve which is twice continuously differentiable with respect to arc length [4, p. 151]) consisting of clothoid segments,](https://img.pdfslide.us/doc/110x75/5f97ea2ebd40a029f922eb94/clothoid-spline-transition-a-planar-g2-curve-a-curve-which-is-twice-continuously.jpg)