Embed Size (px)
Citation preview

ARVO 2017 Annual Meeting Abstracts
These abstracts are licensed under a Creative Commons Attribution-NonCommercial-No Derivatives 4.0 International License. Go to http://iovs.arvojournals.org/ to access the versions of record.
511 IOP Measurement and Characterization IIThursday, May 11, 2017 8:30 AM–10:15 AMExhibit/Poster Hall Poster SessionProgram #/Board # Range: 5312–5338/B0409–B0435Organizing Section: Glaucoma
Program Number: 5312 Poster Board Number: B0409Presentation Time: 8:30 AM–10:15 AMRole of the Water-Drinking Test in Medically Treated Primary Open Angle Glaucoma PatientsHugo Salcedo1, Diana Arciniega1, Monica Mayorga2. 1Instituto de Ciencias de la Vision - Hospital Dr. Rodolfo Robles, Guatemala, Guatemala; 2Instituto de Cirugía Ocular, San Jose, Costa Rica.Purpose: The water-drinking test (WDT) was abandoned in the late 70’s as a diagnostic tool for glaucoma; but has recently re-emerged as a possible way to determine the competency of the trabecular meshwork. We performed a prospective observational study to test the hypothesis that the WDT could be useful in assessing fluctuations in patients undergoing treatment for primary open angle glaucoma (POAG).Methods: We included 122 patients; 62 on treatment for POAG (n=123 eyes) and 60 controls (n=120 eyes). The study group had been on IOP lowering treatment continuously for at least three months and presented stable intraocular pressures. Exclusion criteria were non compliance to treatment and any previous glaucoma surgical intervention. The WDT was performed fasting. Intraocular pressure was measured with Goldman tonometer. Following the consumption of 1L of water, pressures were measured every 15 minutes and repeated three times. The test was positive if the fluctuation was ≥ 6mmHg. For statistical significance; Fisher-exact test and t-test were employed.Results: The patients on treatment had a mean age of 50.56+/-18.45 years vs 51.35 +/- 11.22 for the controls (p=0.34); with 71% being female. In the study group; 52% used beta blockers (n=64), 27% a combination of two or more medications (n=33), 19% prostaglandin analogues (n=24) and 2% alpha agonists (n=2). The WDT was positive in 17.07% (n=21) in the study group and 2.5% (n=3) in the control group (p=0.0001). The mean fluctuation was 7.14+/-2.15 mmHg in the study group. There was no significant difference (p=0.18) in the mean baseline pressures between the groups that tested positive and negative (12.71+/-3.34 and 12.01+/-1.96 mmHg, respectively) and the controls (12.22+/-1.75 mmHg). As for the female gender; 15% (n=12) tested positive compared to 20.93% (n=9) of male patients (p= 0.27). In the controls, 2.17% of females and 3.57% males were positive (p=0.55). A positive WDT was found in 33.33% (n=11) of those on combination therapy; 12.5% (n=3) of prostaglandin analogues and 10.94% (n=7) of beta blockers (p=0.03). For a negative WDT the mean fluctuation was 2.20+/-1.51 and 1.99+/-1.39 for the controls. Combination therapy had the highest positive WDT fluctuation (7.54+/-2.87) followed by prostaglandin analogues (7.00+/-1.00) and beta blockers (6.57+/-0.78).Conclusions: The WDT can identify significant fluctuations in eyes with POAG that are medically treated.Commercial Relationships: Hugo Salcedo, None; Diana Arciniega, None; Monica Mayorga, NoneSupport: PAAO Tim & Judith Sear Scholarship
Program Number: 5313 Poster Board Number: B0410Presentation Time: 8:30 AM–10:15 AMPatient Outcomes for a Glaucoma Referral Refinement ClinicPeter Campbell1, 2, Laura Edwards1, Jennifer Egan2, Parul Patel2, K Sheng Lim2. 1Optometry and Vision Sciences, City, University of London, London, United Kingdom; 2Ophthalmology, Guy’s and St Thomas’ NHS Foundation Trust, London, United Kingdom.Purpose: To investigate visit outcomes for patients seen in a glaucoma referral refinement clinic over a three year period.Methods: Patients referred to a NHS Trust from community optometrists, with elevated IOP using non-contact tonometry, are seen initially by an optometrist in a hospital-based referral refinement clinic. Patients undergo visual field testing, Goldmann Applanation Tonometry, van Herick grading, optic disc assessment and are then either discharged back to their community optometrist or referred on to a consultant ophthalmologist. Data on patient outcomes and the reasons for any onward referral were analyzed for patients seen over a 5 month period (October to February) from 2013 to 2016.Results: The number of patients seen in 2013-14, 2014-15, 2015-16 were 30, 47 and 18 respectively. The percentages of patients discharged over the three years were 37%, 47% and 50% respectively. There was no significant change in the proportion of patients discharged over this time period (χ2=1.06, p=0.59). The reasons for onward referral to a consultant ophthalmologist were: elevated IOP (n=34), visual field defect (n=14), suspicious disc appearance (n=9) and narrow angle (n=7); in 11 cases more than one reason for onward referral was stated.Conclusions: The number of patients seen in 2015-16 was less than in previous years, however the proportion of patients discharged from this referral refinement clinic has not changed significantly over the last three years. The reduction in the number of patients referred to this clinic may in part be due to an increase in community-based glaucoma referral refinement clinics and/or an increase in the practice of Applanation Tonometry by community optometrists; leading to a reduction in false positive referrals.Commercial Relationships: Peter Campbell, None; Laura Edwards, None; Jennifer Egan, None; Parul Patel, None; K Sheng Lim, None
Program Number: 5314 Poster Board Number: B0411Presentation Time: 8:30 AM–10:15 AMPhiladelphia Telemedicine Glaucoma Detection and Follow-up Study: Diagnostic Positive Predictive Value between Visit 1 and Visit 2Andrew Ines2, 3, Kamran Rahmatnejad2, Lisa A. Hark2, L Jay Katz2, Michael Waisbourd2, Jonathan S. Myers2, Benjamin T. Leiby1, 2, Scott Fudemberg2, Anand Mantravadi2, Vance Doyle2, Deiana johnson2, Jeanne Molineaux2, Meskerem Divers2, Christine Burns2, Julia A. Haller2. 1Thomas Jefferson University, Philadelphia, PA; 2Glaucoma Research, Wills Eye Hospital, Philadelphia, PA; 3Sidney Kimmel Medical College, Philadelphia, PA.Purpose: To assess the effectiveness of a practice-based telemedicine screening program, utilizing fundus photography and optic nerve imaging, medical and ocular history, and intraocular pressure measurements, to improve glaucoma detection.Methods: Our targeted, at-risk population (African Americans, Hispanics, and Asians over 40; adults over 65 of any ethnicity; adults over 40 with a family history of glaucoma; or adults over 40 with diabetes) were offered a free telemedicine eye screening (Visit 1) in 7 primary care offices and 4 Federally Qualified Health Centers in Philadelphia. Participants with abnormal or unreadable images were invited back to the same location for a comprehensive eye exam by
ARVO 2017 Annual Meeting Abstracts
These abstracts are licensed under a Creative Commons Attribution-NonCommercial-No Derivatives 4.0 International License. Go to http://iovs.arvojournals.org/ to access the versions of record.
a glaucoma specialist (Visit 2). This study evaluated the agreement between the telemedicine screening diagnosis and the confirming eye exam results using positive predictive value.Results: From 4/1/15 to 11/4/16, 290 participants consented and attended both Visit 1 and Visit 2. Participants were predominately female (60.3%) and African American (72.7%), with a mean age of 59 ±10.6 years (range 39-100). During Visit 1, 306 (47.3%) participants’ images were considered normal. Using image data from the worse eye of the 290 participants diagnosed with abnormal images, 156 (53.8%) were diagnosed with glaucoma suspect at Visit 1; 35 (12.1%) with diabetic retinopathy; and 30 (10.3%) with other retinal abnormalities. Of the 156 diagnosed with glaucoma suspect at Visit 1, 122 were confirmed as glaucoma or glaucoma suspect at Visit 2 (PPV=78.2%) and 21 were confirmed to have glaucoma at Visit 2 (PPV=13.5%). Of the 35 diagnosed with diabetic retinopathy at Visit 1, 21 were confirmed to have diabetic retinopathy at Visit 2 (PPV=60%).Conclusions: A practice-based telemedicine screening can improve access, detection, and follow-up eye care for individuals at risk for glaucoma and other eye diseases. Given the high positive predictive value of the telemedicine diagnoses of glaucoma suspect and diabetic retinopathy, a glaucoma and retina specialist can accurately and effectively use telemedicine to evaluate fundus photographs and optic nerve images, combined with medical and ocular history, and IOP measurements, to predict glaucoma suspect and other eye pathology.Commercial Relationships: Andrew Ines, None; Kamran Rahmatnejad, None; Lisa A. Hark, None; L Jay Katz, None; Michael Waisbourd, None; Jonathan S. Myers, None; Benjamin T. Leiby, None; Scott Fudemberg, None; Anand Mantravadi, None; Vance Doyle, None; Deiana johnson, None; Jeanne Molineaux, None; Meskerem Divers, None; Christine Burns, None; Julia A. Haller, NoneSupport: CDC U01 DP005127Clinical Trial: NCT0239024
Program Number: 5315 Poster Board Number: B0412Presentation Time: 8:30 AM–10:15 AMThe Impact of Cataract Surgery in Patients with Low-Tension Glaucoma in a University SettingShannon Hunt, Bruce I. Gaynes, Meenakshi Chaku. Ophthalmology, Loyola University Medical Center, Elmhurst, IL.Purpose: The purpose of our study is to evaluate visual acuity (VA) and intraocular pressure (IOP) following cataract surgery in Low-Tension Glaucoma (LTG) and Primary Open-Angle Glaucoma (POAG) patients.Methods: A retrospective study on patients who underwent uncomplicated cataract surgery from 2008 to present at Loyola University Medical Center was performed. LTG was defined as open-angle glaucoma with untreated IOP of 10-21 mm Hg. POAG was defined as open-angle glaucoma with untreated IOP ≥ 22 mm Hg. Exclusion criteria included patients with secondary glaucomas, prior intraocular surgery, or those who had combined cataract and glaucoma procedures. Primary outcome measures included VA, IOP, number of glaucoma medications, and need for additional laser or surgical intervention at 1 year after cataract surgery. Statistical analysis was performed using the paired Student’s t-test.Results: Thirty eyes (21 patients) with LTG and 69 eyes (50 patients) with POAG were evaluated. Mean VA (logMAR) in the LTG group improved from 0.33±0.14 at baseline to 0.20±0.24 at 1 year (p=0.008). Mean VA (logMAR) in POAG patients improved from 0.39±0.27 at baseline to 0.21±0.22 at 1 year (p=0.014). Mean IOP in the LTG group was 12.7±3.1 mm Hg at baseline and increased by 3.5% to 13.2±2.8 mm Hg at 1 year (p=0.322). Mean IOP in the
POAG group was 15.6 ±3.2 mm Hg at baseline and decreased by 11.2% to 13.8±3.6 mm Hg at 1 year (p=0.004). Mean number of glaucoma medications in the LTG group remained unchanged (1.4 meds) after cataract surgery. In the POAG group, mean number of glaucoma medications decreased from baseline (2.0 meds) to 1 year (1.7 meds, p=0.197). One patient in the POAG group required laser trabeculoplasty during the 1 year period after cataract surgery. No filtration surgery was required in either group during the 1 year post-operative period.Conclusions: Cataract surgery in both LTG and POAG patients significantly improved visual acuity at 1 year. A significant decrease in IOP was seen in the POAG group at 1 year but not in the LTG group. No significant differences were noted in the number of glaucoma medications at 1 year. Potential study limitations include relatively small sample size and retrospective study design.Commercial Relationships: Shannon Hunt, None; Bruce I. Gaynes, None; Meenakshi Chaku, NoneSupport: Illinois Society for the Prevention of Blindness (ISPB) - Account Number 517090, LU Project Number
Program Number: 5316 Poster Board Number: B0413Presentation Time: 8:30 AM–10:15 AMThe influence of prostaglandin treatment on measurement of intraocular pressure using a pneumatonometerChristopher S. Pappa1, Cynthia J. Roberts1, 2, Ashraf M. Mahmoud1, 2, Andrew N. Springer3, Robert H. Small3, 2, William Bloom1, Gloria Fleming1. 1Ophthalmology & Visual Science, The Ohio State University, Columbus, OH; 2Biomedical Engineering, The Ohio State University, Columbus, OH; 3Anesthesiology, The Ohio State University, Columbus, OH.Purpose: To investigate the influence of prostaglandins on the difference between measurements of intraocular pressure (IOP) using a pneumatonometer (PNT) and the PASCAL Dynamic Contour Tonometer (DCT) which is known to be less influenced by corneal biomechanical properties.Methods: In an ongoing glaucoma study, 95 eyes of 49 subjects were divided into 2 groups: Group 1 with 51 eyes not receiving prostaglandin treatment at the time of enrollment, and Group 2 with 44 eyes receiving prostaglandin treatment. Normal individuals comprised the majority of Group 1. Both groups included diagnoses of primary open angle glaucoma, normal tension glaucoma, and ocular hypertension. Corvis ST was used to assess corneal biomechanical deformation response. Both intraocular pressure (IOP) and ocular pulse amplitude (OPA) were measured in the sitting position using the DCT and the PNT. DCT reports diastolic IOP, so mean DCT IOP (mDCT) was calculated by using the diastolic IOP value + ½OPA for comparison to PNT. Stepwise regression analysis was performed using SAS to predict the mDCT value in each group as a function of PNT IOP, PNT OPA, as well as corneal curvature (simK3mm), central corneal thickness (pachy), and stiffness parameter (SP-A1), all three measured by Corvis ST. Significance threshold was p<0.05.Results: Stepwise regression analysis showed the strongest predictor of mDCT based on strength of correlation in Group 1 was PNT IOP (R square 0.7184, C(p) 11.4984, p<.0001), followed second by corneal curvature (partial R square 0.0364, C(p) 5.9361, p=0.0103), and finally, pachymetry (partial R square 0.0251, C(p) 2.7306, p=0.0251). Model R square was 0.7799. Stepwise regression analysis showed the strongest predictor of mDCT in Group 2 was also PNT IOP (R square 0.5169, C(p) 16.6610, p<.0001). However, the next strongest predictor was corneal stiffness parameter (partial R square 0.0479, C(p) 13.0374, p=0.0396), followed by corneal curvature
ARVO 2017 Annual Meeting Abstracts
These abstracts are licensed under a Creative Commons Attribution-NonCommercial-No Derivatives 4.0 International License. Go to http://iovs.arvojournals.org/ to access the versions of record.
(partial R square 0.0465, C(p) 9.5831, p=0.0346), and pachymetry (partial R square 0.0621, C(p) 4.2954, p=0.0096). Model R square was 0.6735.Conclusions: As expected, pneumatonometry measurement of IOP is affected by central corneal thickness in normal eyes, as well as pathologic eyes without treatment by prostaglandins, when compared to DCT. Corneal stiffness plays an additional important role in predicting DCT IOP measurement in eyes receiving prostaglandin therapy.Commercial Relationships: Christopher S. Pappa, None; Cynthia J. Roberts, Optimeyes (C), Oculus (C), Ziemer (C); Ashraf M. Mahmoud, None; Andrew N. Springer, None; Robert H. Small, Spouse - Optimeyes (C), Spouse - Ziemer (C), Spouse - Oculus (C); William Bloom, None; Gloria Fleming, NoneSupport: Ann Ellis Fund of the Columbus Foundation
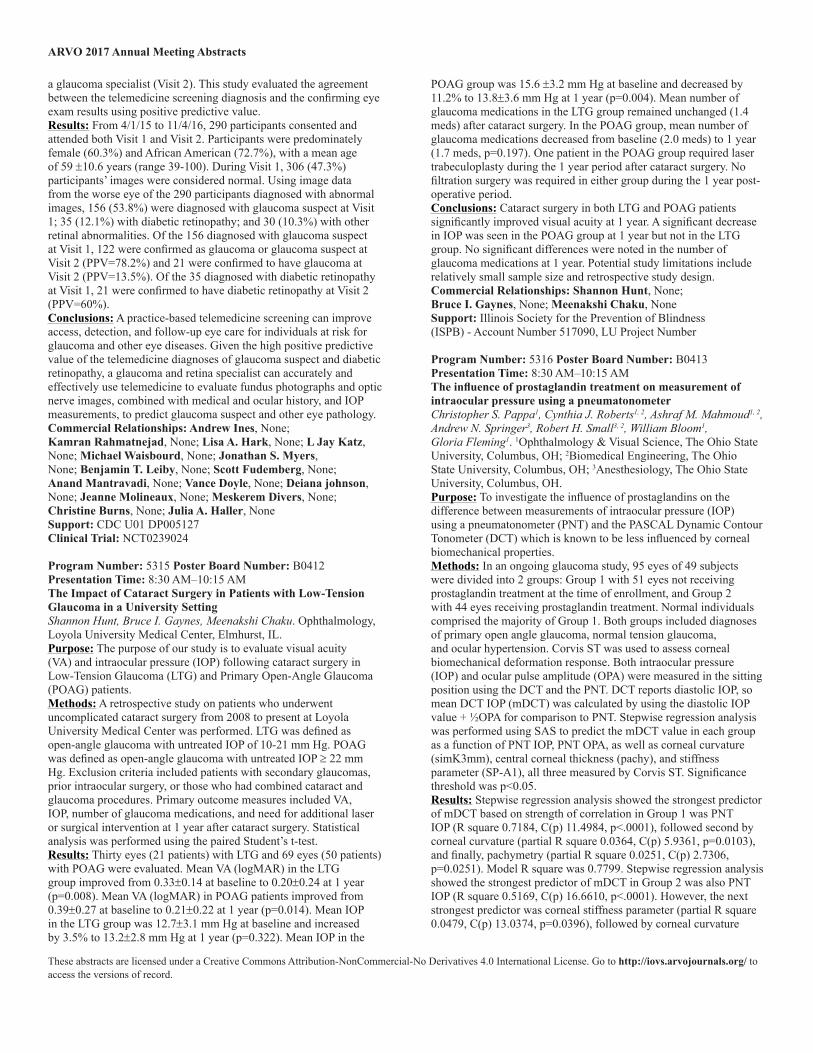
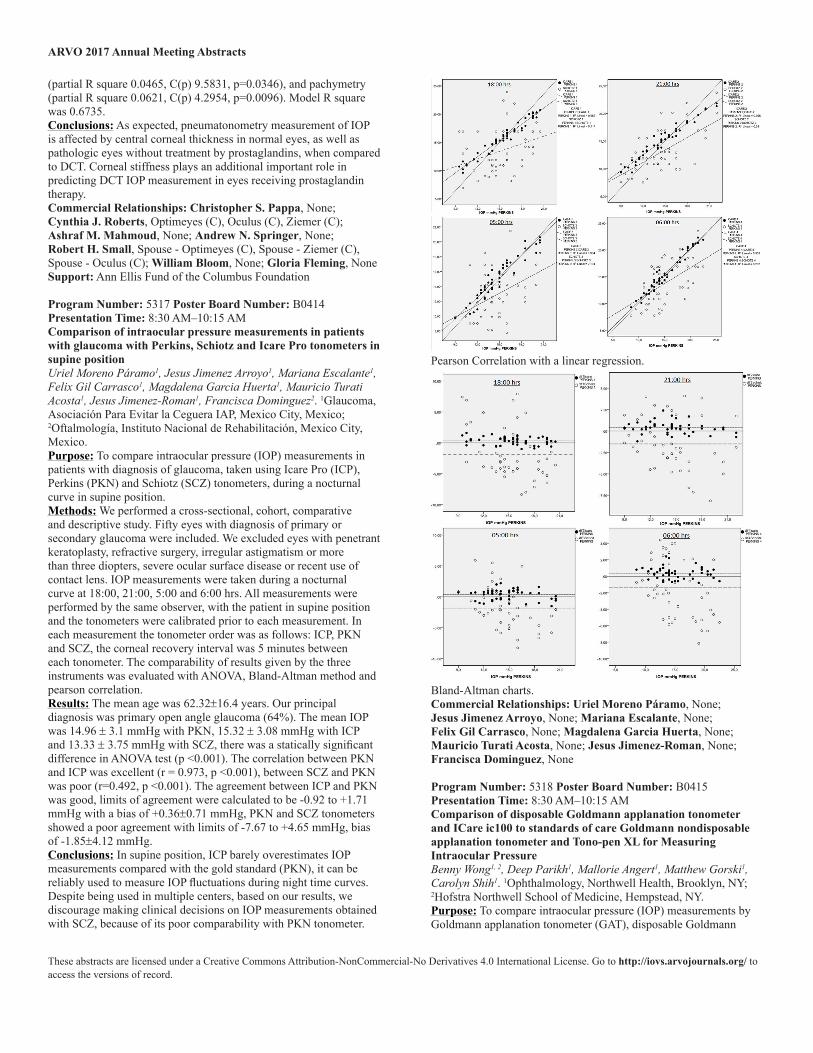
Program Number: 5317 Poster Board Number: B0414Presentation Time: 8:30 AM–10:15 AMComparison of intraocular pressure measurements in patients with glaucoma with Perkins, Schiotz and Icare Pro tonometers in supine positionUriel Moreno Páramo1, Jesus Jimenez Arroyo1, Mariana Escalante1, Felix Gil Carrasco1, Magdalena Garcia Huerta1, Mauricio Turati Acosta1, Jesus Jimenez-Roman1, Francisca Dominguez2. 1Glaucoma, Asociación Para Evitar la Ceguera IAP, Mexico City, Mexico; 2Oftalmología, Instituto Nacional de Rehabilitación, Mexico City, Mexico.Purpose: To compare intraocular pressure (IOP) measurements in patients with diagnosis of glaucoma, taken using Icare Pro (ICP), Perkins (PKN) and Schiotz (SCZ) tonometers, during a nocturnal curve in supine position.Methods: We performed a cross-sectional, cohort, comparative and descriptive study. Fifty eyes with diagnosis of primary or secondary glaucoma were included. We excluded eyes with penetrant keratoplasty, refractive surgery, irregular astigmatism or more than three diopters, severe ocular surface disease or recent use of contact lens. IOP measurements were taken during a nocturnal curve at 18:00, 21:00, 5:00 and 6:00 hrs. All measurements were performed by the same observer, with the patient in supine position and the tonometers were calibrated prior to each measurement. In each measurement the tonometer order was as follows: ICP, PKN and SCZ, the corneal recovery interval was 5 minutes between each tonometer. The comparability of results given by the three instruments was evaluated with ANOVA, Bland-Altman method and pearson correlation.Results: The mean age was 62.32±16.4 years. Our principal diagnosis was primary open angle glaucoma (64%). The mean IOP was 14.96 ± 3.1 mmHg with PKN, 15.32 ± 3.08 mmHg with ICP and 13.33 ± 3.75 mmHg with SCZ, there was a statically significant difference in ANOVA test (p <0.001). The correlation between PKN and ICP was excellent (r = 0.973, p <0.001), between SCZ and PKN was poor (r=0.492, p <0.001). The agreement between ICP and PKN was good, limits of agreement were calculated to be -0.92 to +1.71 mmHg with a bias of +0.36±0.71 mmHg, PKN and SCZ tonometers showed a poor agreement with limits of -7.67 to +4.65 mmHg, bias of -1.85±4.12 mmHg.Conclusions: In supine position, ICP barely overestimates IOP measurements compared with the gold standard (PKN), it can be reliably used to measure IOP fluctuations during night time curves. Despite being used in multiple centers, based on our results, we discourage making clinical decisions on IOP measurements obtained with SCZ, because of its poor comparability with PKN tonometer.
Pearson Correlation with a linear regression.
Bland-Altman charts.Commercial Relationships: Uriel Moreno Páramo, None; Jesus Jimenez Arroyo, None; Mariana Escalante, None; Felix Gil Carrasco, None; Magdalena Garcia Huerta, None; Mauricio Turati Acosta, None; Jesus Jimenez-Roman, None; Francisca Dominguez, None
Program Number: 5318 Poster Board Number: B0415Presentation Time: 8:30 AM–10:15 AMComparison of disposable Goldmann applanation tonometer and ICare ic100 to standards of care Goldmann nondisposable applanation tonometer and Tono-pen XL for Measuring Intraocular PressureBenny Wong1, 2, Deep Parikh1, Mallorie Angert1, Matthew Gorski1, Carolyn Shih1. 1Ophthalmology, Northwell Health, Brooklyn, NY; 2Hofstra Northwell School of Medicine, Hempstead, NY.Purpose: To compare intraocular pressure (IOP) measurements by Goldmann applanation tonometer (GAT), disposable Goldmann
ARVO 2017 Annual Meeting Abstracts
These abstracts are licensed under a Creative Commons Attribution-NonCommercial-No Derivatives 4.0 International License. Go to http://iovs.arvojournals.org/ to access the versions of record.
applanation tonometer(dGAT), ICare ic100 tonometer, and Tono-pen XL in glaucomatous, ocular hypertensive, post-corneal transplantation, and normal eyes.Methods: Intraocular pressure was measured by four different tonometers: GAT, dGAT, Icare, and Tono-pen XL and central corneal thickness was measured using ultrasound pachymetry for thirty-nine patients. Whether the patient had corneal pathology such as keratoconus, previous corneal transplant, had glaucoma, ocular hypertension, or were normal was recorded.Results: There was a good correlation between IOP measurements by GAT and that by disposable GAT (r=0.816, p<.001), that by Tonopen (r=0.945, p<.001), and that by ICare (r=0.916, p<.001). The intraclass correlation coefficients of disposable GAT, Tonopen XL, and ICare when compared to GAT were 0.79, 0.94, and 0.90, respectively. The IOP mean differences between GAT and disposable GAT were mean: 0.04mm Hg; SD:4.68 mm Hg; 95% limits of agreement: -9.14 to 9.22 mm Hg. The IOP mean differences between GAT and Tonopen were mean: 1.53 mm Hg; SD: 2.64 mm Hg; 95% limits of agreement: -3.64 to 6.70 mm Hg. The IOP mean differences between GAT and ICare were mean: 0.08 mm Hg; SD: 3.45 mm Hg; 95% limits of agreement: -6.69 to 6.84 mm Hg. For post corneal transplant patients the mean difference between GAT and Tonopen was the smallest (0.5 mm Hg).Conclusions: In terms of IOP measurement, the modality that was reliable and showed a good correlation with GAT was the Tonopen XL, with ICare having the second best correlation and the disposable GAT having the least correlation with GAT. Tonopen XL also was most reliable post corneal transplantation. Despite these differences, we observed good interdevice agreement between GAT and the disposable GAT, Tonopen XL and ICare. This suggests that single-use applications of disposable Goldmann tonometry and iCare may be good alternatives for general patients with and without glaucoma.Commercial Relationships: Benny Wong, None; Deep Parikh, None; Mallorie Angert, None; Matthew Gorski, None; Carolyn Shih, None
Program Number: 5319 Poster Board Number: B0416Presentation Time: 8:30 AM–10:15 AMComparison of Goldmann applanation tonometry and dynamic contour tonometry for measuring intraocular pressure in normal tension glaucomatous eyesJing Grace Wang1, 2, Mark A. Latina1, 2. 1Advanced Glaucoma Specialists, Reading, MA; 2Glaucoma, Mass Eye and Ear Infirmary, Boston, MA.Purpose: To compare the intraocular pressure (IOP) measurements obtained with Goldmann Applanation Tonometry (GAT) and Pascal Dynamic Contour Tonometer (DCT) (PASCAL, Zeimer, Switzerland) in control patients and patients with normal tension glaucoma (NTG).Methods: This is a retrospective chart review of patients who had eye exam at a glaucoma clinic at the Reading Health Center, Massachusetts. Intraocular pressures were measured with both Goldmann Applanation Tonometer and Pascal Dynamic Contour Tonometer. The difference between DCT IOP and GAT IOP (ΔIOP) and the percentage of eyes with a greater than 3 mm Hg IOP difference was determined for each group. Ocular pulse amplitude (OPA) was recorded with DCT. The data was statistically analyzed with Student’s t-test.Results: In control eyes (n=26, with the average age of 73.8 ± 1.7 years), the average GAT IOP was 13.43 ± 0.51 mm Hg and the average DCT IOP was 16.72 ± 2.55 mm Hg (p < 0.05). In NTG eyes (n=47, with the average age of 70.1 ± 1.6 years), the average GAT IOP was 11.55 ± 0.28 mm Hg and average DCT IOP was 16.99 ± 0.37 mm Hg (p < 0.05). The average ΔIOP was 3.30 ± 0.35 mm Hg
in control eyes which is in agreement with the published results, and 5.44 ± 0.19 mm Hg in NTG eyes (p < 0.05). The percentage of eyes with a greater than 3 mm Hg ΔIOP was determined to be 47.6% of control eyes versus 95.7% of normal tension glaucoma eyes (p < 0.05). OPA was determined to be 3.19 ± 0.24 mm Hg in control eyes and 2.57 ± 0.13 mm Hg in NTG eyes (p = 0.02).Conclusions: IOP measurements by DCT were significantly higher than GAT in NTG patients. The ΔIOP and the proportion of patients with a ΔIOP greater than 3 mm Hg is significantly higher in NTG eyes compared to control eyes. Our data suggest that IOP measurement by GAT may be underestimated in NTG patients. In addition, OPA values were found to be lower in patient with NTG. Our result echoes the previous reports that in NTG patients have prominent vascular dysregulation. A ΔIOP of greater than the expected 3 mm Hg in NTG patients may have clinical implications.Commercial Relationships: Jing Grace Wang, None; Mark A. Latina
Program Number: 5320 Poster Board Number: B0417Presentation Time: 8:30 AM–10:15 AMComparison of Three Methods to Measure Intraocular Pressure: ic100 Icare, TAO1i Icare and Goldmann Applanation TonometryGARCIA Y OTERO SANCHEZ SARA AURORA1, Jose A. Paczka2, Montserrat Romo Sainz2, Yesenia Y. Dorantes Diez2. 1OFTALMOLOGIA, ISSSTE, Zapopan, Mexico; 2UNIVERSIDAD DE GUADALAJARA, GUADALAJARA, Mexico.Purpose: Tonometry is a crucial method to manage glaucoma. Rebound tonometers are recent options to determine IOP values. The aim of the current study is to compare three different devices in assessing IOP among glaucoma patients and glaucoma suspects.Methods: IOP values were prospectively compared in a random order of consecutive patients visiting a glaucoma center. Measurements were performed by the Goldmann applanation tonometry (GAT), ic100 Icare rebound tonometry (ic100 RT) and TAO1i Icare rebound tonometry (TA01i RT) in eyes in which a battery of glaucoma testing was done. Agreement between measurements was calculated per eye with coefficient of variation (CV), correlation analysis (intraclass and confidence), and Bland-Altman plots. Correlation of keratometry and central corneal thickness (CCT) on IOP measurements was assessed with Pearson’s correlation coefficient.Results: Forty five eyes of 46 patients (mean age 66.1±11.2 years, 35 females; mean CD ratios RE 0.74±0.19/LE 0.73±0.19; mean CCT RE 537.1±30.1 microns/LE 533.5±35.2 microns) were included in this study. Non-significant differences of coefficient of variation were noted between eyes (RE vs. LE): GAT (31.2% vs. 36.8%), ic100 RT (34.2% vs. 48.2%), TA01i RT (32.1% vs. 43.2%). Both intraclass and confidence coefficient values were excellent for the three tonometric methods in each eye (RE, 0.86, CI: 0.79-0.91; LE, 0.92, CI: 0.87-0.95; RE, > 0.84; LE > 0.87, respectively). Strong and significant correlations were found among the three devices: GAT and ic100 RT (RE, r=0.85, P<0.0001; LE, r=0.90, P<0.0001), GAT and TA01i (RE, r=0.88, P<0.0001; LE, r=0.93, P<0.0001), ic100 RT and TA01i (RE, r=0.87, P<0.0001; LE r=0.96, P<0.0001). Bland-Altman plots were compatible with no consistent bias when Icare devices were compared against GAT. Mean IOP values measured by Icare devices (ic100 RT: RE, 14.0±4.8 mmHg, LE, 14.7±7.1 mmHg; TA01i RT: RE, 14.3±4.6 mmHg; LE, 15.2±6.6 mmHg) were non-significantly different than those obtained with GAT (RE, 14.7±4.7 mm Hg; LE, 14.8±5.5 mm Hg). CCT and astigmatism did not have significant impact on IOP measurements.Conclusions: IOP measurements with three different techniques (GAT, iC100 rebound tonometry and TA01i rebound tonometry) demonstrated very good correlations and non-significant pressure
ARVO 2017 Annual Meeting Abstracts
These abstracts are licensed under a Creative Commons Attribution-NonCommercial-No Derivatives 4.0 International License. Go to http://iovs.arvojournals.org/ to access the versions of record.
measurements in both eyes of Latino patients attending a specialized glaucoma center.Commercial Relationships: GARCIA Y OTERO SANCHEZ SARA AURORA, None; Jose A. Paczka, None; Montserrat Romo Sainz, None; Yesenia Y. Dorantes Diez, None
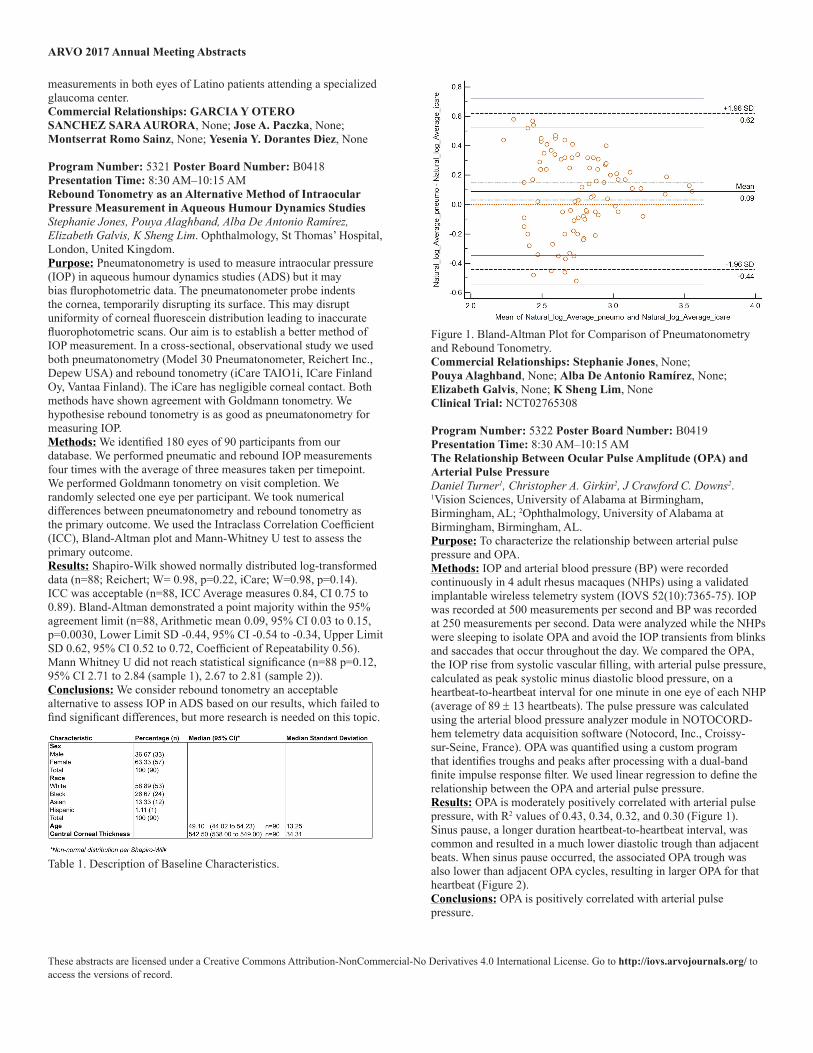
Program Number: 5321 Poster Board Number: B0418Presentation Time: 8:30 AM–10:15 AMRebound Tonometry as an Alternative Method of Intraocular Pressure Measurement in Aqueous Humour Dynamics StudiesStephanie Jones, Pouya Alaghband, Alba De Antonio Ramírez, Elizabeth Galvis, K Sheng Lim. Ophthalmology, St Thomas’ Hospital, London, United Kingdom.Purpose: Pneumatonometry is used to measure intraocular pressure (IOP) in aqueous humour dynamics studies (ADS) but it may bias flurophotometric data. The pneumatonometer probe indents the cornea, temporarily disrupting its surface. This may disrupt uniformity of corneal fluorescein distribution leading to inaccurate fluorophotometric scans. Our aim is to establish a better method of IOP measurement. In a cross-sectional, observational study we used both pneumatonometry (Model 30 Pneumatonometer, Reichert Inc., Depew USA) and rebound tonometry (iCare TAIO1i, ICare Finland Oy, Vantaa Finland). The iCare has negligible corneal contact. Both methods have shown agreement with Goldmann tonometry. We hypothesise rebound tonometry is as good as pneumatonometry for measuring IOP.Methods: We identified 180 eyes of 90 participants from our database. We performed pneumatic and rebound IOP measurements four times with the average of three measures taken per timepoint. We performed Goldmann tonometry on visit completion. We randomly selected one eye per participant. We took numerical differences between pneumatonometry and rebound tonometry as the primary outcome. We used the Intraclass Correlation Coefficient (ICC), Bland-Altman plot and Mann-Whitney U test to assess the primary outcome.Results: Shapiro-Wilk showed normally distributed log-transformed data (n=88; Reichert; W= 0.98, p=0.22, iCare; W=0.98, p=0.14). ICC was acceptable (n=88, ICC Average measures 0.84, CI 0.75 to 0.89). Bland-Altman demonstrated a point majority within the 95% agreement limit (n=88, Arithmetic mean 0.09, 95% CI 0.03 to 0.15, p=0.0030, Lower Limit SD -0.44, 95% CI -0.54 to -0.34, Upper Limit SD 0.62, 95% CI 0.52 to 0.72, Coefficient of Repeatability 0.56). Mann Whitney U did not reach statistical significance (n=88 p=0.12, 95% CI 2.71 to 2.84 (sample 1), 2.67 to 2.81 (sample 2)).Conclusions: We consider rebound tonometry an acceptable alternative to assess IOP in ADS based on our results, which failed to find significant differences, but more research is needed on this topic.
Table 1. Description of Baseline Characteristics.
Figure 1. Bland-Altman Plot for Comparison of Pneumatonometry and Rebound Tonometry.Commercial Relationships: Stephanie Jones, None; Pouya Alaghband, None; Alba De Antonio Ramírez, None; Elizabeth Galvis, None; K Sheng Lim, NoneClinical Trial: NCT02765308
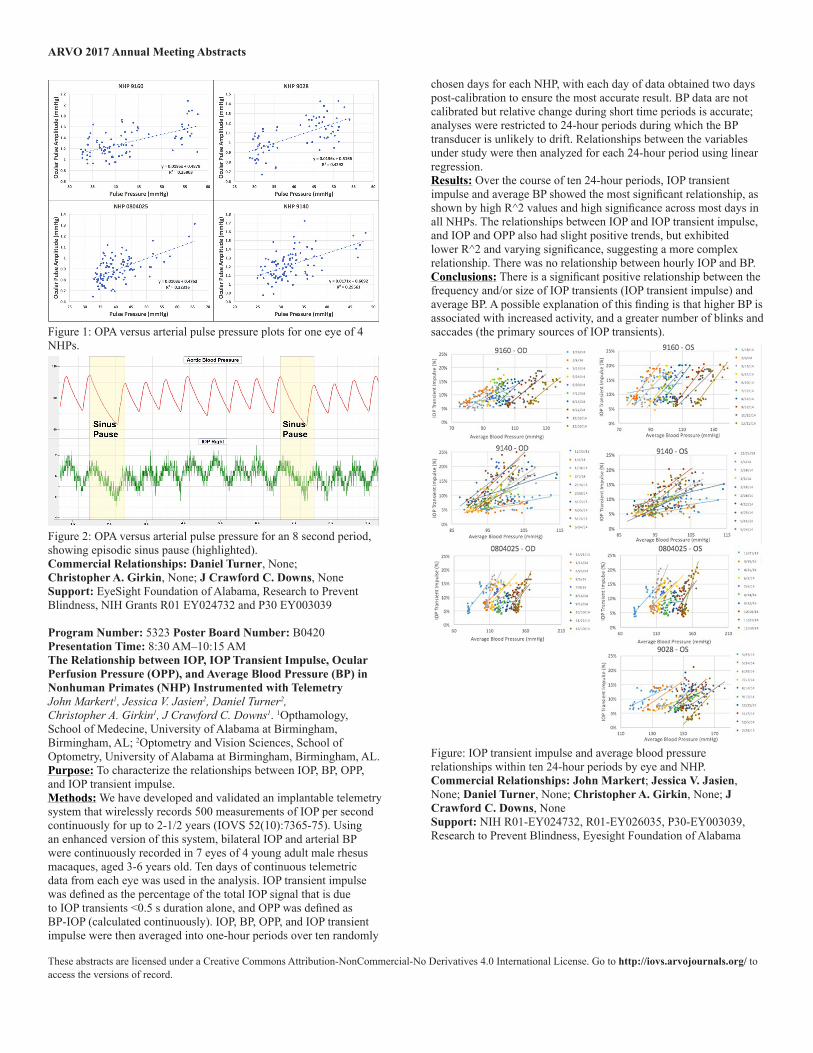
Program Number: 5322 Poster Board Number: B0419Presentation Time: 8:30 AM–10:15 AMThe Relationship Between Ocular Pulse Amplitude (OPA) and Arterial Pulse PressureDaniel Turner1, Christopher A. Girkin2, J Crawford C. Downs2. 1Vision Sciences, University of Alabama at Birmingham, Birmingham, AL; 2Ophthalmology, University of Alabama at Birmingham, Birmingham, AL.Purpose: To characterize the relationship between arterial pulse pressure and OPA.Methods: IOP and arterial blood pressure (BP) were recorded continuously in 4 adult rhesus macaques (NHPs) using a validated implantable wireless telemetry system (IOVS 52(10):7365-75). IOP was recorded at 500 measurements per second and BP was recorded at 250 measurements per second. Data were analyzed while the NHPs were sleeping to isolate OPA and avoid the IOP transients from blinks and saccades that occur throughout the day. We compared the OPA, the IOP rise from systolic vascular filling, with arterial pulse pressure, calculated as peak systolic minus diastolic blood pressure, on a heartbeat-to-heartbeat interval for one minute in one eye of each NHP (average of 89 ± 13 heartbeats). The pulse pressure was calculated using the arterial blood pressure analyzer module in NOTOCORD-hem telemetry data acquisition software (Notocord, Inc., Croissy-sur-Seine, France). OPA was quantified using a custom program that identifies troughs and peaks after processing with a dual-band finite impulse response filter. We used linear regression to define the relationship between the OPA and arterial pulse pressure.Results: OPA is moderately positively correlated with arterial pulse pressure, with R2 values of 0.43, 0.34, 0.32, and 0.30 (Figure 1). Sinus pause, a longer duration heartbeat-to-heartbeat interval, was common and resulted in a much lower diastolic trough than adjacent beats. When sinus pause occurred, the associated OPA trough was also lower than adjacent OPA cycles, resulting in larger OPA for that heartbeat (Figure 2).Conclusions: OPA is positively correlated with arterial pulse pressure.
ARVO 2017 Annual Meeting Abstracts
These abstracts are licensed under a Creative Commons Attribution-NonCommercial-No Derivatives 4.0 International License. Go to http://iovs.arvojournals.org/ to access the versions of record.
Figure 1: OPA versus arterial pulse pressure plots for one eye of 4 NHPs.
Figure 2: OPA versus arterial pulse pressure for an 8 second period, showing episodic sinus pause (highlighted).Commercial Relationships: Daniel Turner, None; Christopher A. Girkin, None; J Crawford C. Downs, NoneSupport: EyeSight Foundation of Alabama, Research to Prevent Blindness, NIH Grants R01 EY024732 and P30 EY003039
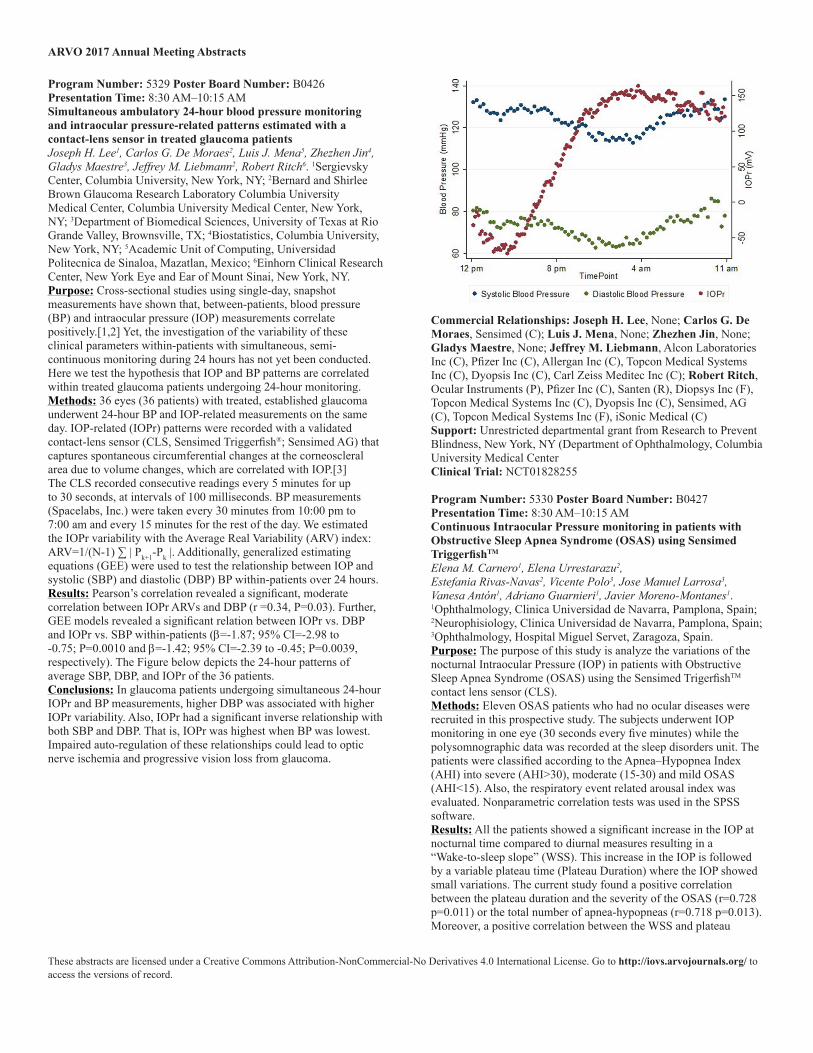
Program Number: 5323 Poster Board Number: B0420Presentation Time: 8:30 AM–10:15 AMThe Relationship between IOP, IOP Transient Impulse, Ocular Perfusion Pressure (OPP), and Average Blood Pressure (BP) in Nonhuman Primates (NHP) Instrumented with TelemetryJohn Markert1, Jessica V. Jasien2, Daniel Turner2, Christopher A. Girkin1, J Crawford C. Downs1. 1Opthamology, School of Medecine, University of Alabama at Birmingham, Birmingham, AL; 2Optometry and Vision Sciences, School of Optometry, University of Alabama at Birmingham, Birmingham, AL.Purpose: To characterize the relationships between IOP, BP, OPP, and IOP transient impulse.Methods: We have developed and validated an implantable telemetry system that wirelessly records 500 measurements of IOP per second continuously for up to 2-1/2 years (IOVS 52(10):7365-75). Using an enhanced version of this system, bilateral IOP and arterial BP were continuously recorded in 7 eyes of 4 young adult male rhesus macaques, aged 3-6 years old. Ten days of continuous telemetric data from each eye was used in the analysis. IOP transient impulse was defined as the percentage of the total IOP signal that is due to IOP transients <0.5 s duration alone, and OPP was defined as BP-IOP (calculated continuously). IOP, BP, OPP, and IOP transient impulse were then averaged into one-hour periods over ten randomly
chosen days for each NHP, with each day of data obtained two days post-calibration to ensure the most accurate result. BP data are not calibrated but relative change during short time periods is accurate; analyses were restricted to 24-hour periods during which the BP transducer is unlikely to drift. Relationships between the variables under study were then analyzed for each 24-hour period using linear regression.Results: Over the course of ten 24-hour periods, IOP transient impulse and average BP showed the most significant relationship, as shown by high R^2 values and high significance across most days in all NHPs. The relationships between IOP and IOP transient impulse, and IOP and OPP also had slight positive trends, but exhibited lower R^2 and varying significance, suggesting a more complex relationship. There was no relationship between hourly IOP and BP.Conclusions: There is a significant positive relationship between the frequency and/or size of IOP transients (IOP transient impulse) and average BP. A possible explanation of this finding is that higher BP is associated with increased activity, and a greater number of blinks and saccades (the primary sources of IOP transients).
Figure: IOP transient impulse and average blood pressure relationships within ten 24-hour periods by eye and NHP.Commercial Relationships: John Markert; Jessica V. Jasien, None; Daniel Turner, None; Christopher A. Girkin, None; J Crawford C. Downs, NoneSupport: NIH R01-EY024732, R01-EY026035, P30-EY003039, Research to Prevent Blindness, Eyesight Foundation of Alabama

ARVO 2017 Annual Meeting Abstracts
These abstracts are licensed under a Creative Commons Attribution-NonCommercial-No Derivatives 4.0 International License. Go to http://iovs.arvojournals.org/ to access the versions of record.
Program Number: 5324 Poster Board Number: B0421Presentation Time: 8:30 AM–10:15 AMTIME OF YEAR VARIATION OF INTRAOCULAR PRESSUREChristina E. Morettin1, Daniel K. Roberts1, 2, Tricia L. Newman1, Mary F. Roberts1, Bruce A. Teitelbaum1, janis E. Winters1. 1Illinois College of Optometry/Illinois Eye Institute, Chicago, IL; 2Department of Ophthalmology and Visual Sciences, University of Illinois at Chicago, School of Medicine, Chicago, IL.Purpose: To investigate intraocular pressure (IOP) variation according to month and time of year among a primary eye care population in an urban, academic eye care facility.Methods: As part of a separate investigation, IOP measurements were collected on patients belonging to several practitioners over approximately a five-year period at an urban, academic eye care facility in Chicago, Illinois. Data on ocular health status, general medical health, and other subject characteristics was also collected, with some information acquired with via a written questionnaire completed at time of examination. Subjects were excluded if they were <18 years of age, and eyes were excluded if there was a history of past intraocular surgery, uveitis, ocular trauma, or if IOP was not measured via Goldmann tonometry. Using multiple regression analysis, cross-sectional IOP level was explored as a function of numerous health and demographic variables.Results: The analysis included 2,407 subjects, which was mostly African-American (83%) and female (64%). Mean age of subjects was 50.3 +/- 15.2 years (18-94 years). Overall mean IOP was 15.1 +/- 3.6 mm Hg and 15.2 +/- 3.4 mm Hg for right/left eyes. Controlling for numerous other subject variables, including but not limited to gender, race, refractive error, presence of long anterior lens zonules, education level, smoking status, diastolic blood pressure, presence of diabetes, body mass index, presence of diabetes, and history of cancer, regression analyses demonstrated that IOP level was significantly associated with time of year in terms of quarterly and bimonthly intervals (P<0.001). Using bimonthly grouping that included Dec/Jan, Feb/Mar, Apr/May, etc., eyes had statistically (P<0.05) highest IOPs in Dec/Jan (15.6 +/- 3.6 mm Hg) and lowest in Oct/Nov (14.7 +/- 3.3 mm Hg). In additional to longer term, i.e., seasonal/quarterly variation in IOP, an observable, shorter-term cyclical pattern of IOP variation was also observed that appeared to have about two-month long intervals.Conclusions: For this cross-sectional analysis, strong time of year variation in IOP was observed, which was also accompanied by shorter, approximately bimonthly cycles of fluctuation. These data further support that time of year should be considered as a potential confounder for cross-sectional investigations of IOP.Commercial Relationships: Christina E. Morettin, None; Daniel K. Roberts, None; Tricia L. Newman, None; Mary F. Roberts, None; Bruce A. Teitelbaum, None; janis E. Winters, None
Program Number: 5325 Poster Board Number: B0422Presentation Time: 8:30 AM–10:15 AMAssessment of intraocular pressure as a function of time of day during normal patient care delivery hours in a primary eye care teaching facilityDaniel K. Roberts1, 2, Christina E. Morettin1, Tricia L. Newman1, Mary F. Roberts1, Bruce A. Teitelbaum1, janis E. Winters1. 1Clinical Education, Illinois College of Optometry, Chicago, IL; 2Epidemiology and Biostatistics, University of Illinois at Chicago, Chicago, IL.Purpose: To investigate the distribution of intraocular pressure (IOP) level among a primary eye care population in an academic eye care
facility and to determine whether there was significant relationship to time of day and patient care session.Methods: As part of a separate investigation, ocular and general health information was collected during 2011-2016 on consecutive patients belonging to six attending faculty at an urban academic eye care facility in Chicago, Illinois, USA. Relevant data was collected from the current examination, from the existing health record, and from a questionnaire independently completed by subjects at the time of exam. Subjects were included if they were >18 years of age, provided consent, and if they had dilated retinal examination and IOP measured via Goldmann tonometry on the day of exam. Eyes were excluded from analysis with history of past intraocular surgery, uveitis, or significant ocular trauma. Multivariable regression analyses were conducted to explore the relationship between IOP and time of day, with search for factors that might interact with time of day variation.Results: Analysis included 2,532 subjects (64.2% female, 82.7% African-American) who reflected facility demographics. Univariate analysis of all subjects showed a mean IOP=15.2+/-3.8 mmHg (right eyes), which had a very slight downtrend as the day progressed over three clinical care sessions (AM=15.4 mmHg; PM1=15.2 mmHg; PM2=15.1 mmHg). Multivariate control for numerous variables, including but not limited to gender, race, refractive error, education level, blood pressure, body mass index, smoking status, oral b-blocker use, corticosteroid use, and time of year, showed remarkable stability of IOP during normal workday and early evening hours (P>0.40). Likewise, the analysis did not show patient subtypes whose IOP varied significantly with time of workday except for those taking glaucoma medications (n=126). With control for other variables, their IOP trended significantly upward (P<0.001) as the day progressed.Conclusions: In this primary eye care teaching facility, Goldmann IOP level remained remarkably stable on average regardless of the workday hour, and the only patient subgroup whose IOP was modified by time of day were those taking glaucoma medications.Commercial Relationships: Daniel K. Roberts, None; Christina E. Morettin, None; Tricia L. Newman, None; Mary F. Roberts, None; Bruce A. Teitelbaum, None; janis E. Winters, None
Program Number: 5326 Poster Board Number: B0423Presentation Time: 8:30 AM–10:15 AMIOP Fluctuations in glaucoma patients measured by a self-administered tonometerJessie Huang1, 2, Michael Kalloniatis1, 2, Paula Katalinic2, Barbara Zangerl1, 2. 1Optometry and Vision Science, University of New South Wales, Kensington, NSW, Australia; 2Centre For Eye Health, Sydney, NSW, Australia.Purpose: Diagnosis and monitoring of glaucoma, a progressive optic neuropathy, is guided by intraocular pressure (IOP). With current standards of practice, IOP is typically measured during office hours at single time points hence IOP fluctuations occurring outside these hours are not detected. We performed a controlled clinical trial to investigate the extent of diurnal intraocular pressure variations in glaucoma patients utilising a novel self-administered rebound tonometry instrument.Methods: 40 patients were recruited following standard glaucoma-related examination at Centre For Eye Health in Sydney, Australia. Exclusion criteria included active ocular surface disease, significant ocular malformations or abnormalities that precluded use of the instrument. Participants underwent training and certification to use the Icare® HOME tonometer, as specified by the manufacturer which included obtaining 5 reliable baseline measurements. Upon

ARVO 2017 Annual Meeting Abstracts
These abstracts are licensed under a Creative Commons Attribution-NonCommercial-No Derivatives 4.0 International License. Go to http://iovs.arvojournals.org/ to access the versions of record.
successful completion, the tonometer was provided with instructions to perform IOP testing four times a day, over a six week period. Participants with newly diagnosed glaucoma initiated topical anti-glaucoma treatment within 24 hours of recruitment. Paired t-test was used to examine differences between groups.Results: 35 participants have completed the trial to date. 8 failed certification and 3 did not complete data collection. Preliminary analysis of 24 patients, with a mean age of 60.2 years (SD 8.2) obtained a total 129 measurements each (equivalent to 4 measurements per day). Comparison of the glaucoma group (n=8) and the non-glaucoma group (n=16) showed significantly different IOP measurements at baseline, 26.7mmHg (SD 2.5) versus 17.3mmHg (SD 1.4) respectively (p<0.01). However, IOPs were not significantly different across the 6-week period at 14.4mmHg (SD 4.0) and 15.3mmHg (SD 1.5) following treatment initiation for the glaucoma group. Diurnal fluctuations in the patients showed a median range of 14mmHg (excluding the effect of treatment), with the peak IOP occurring at different times across individuals.Conclusions: Patient-administered tonometry may provide clinicians greater insight into IOP fluctuations particularly in patients who exhibit peak IOP outside normal office hours. Observation of IOP changes following commencement of treatment will allow further establishment of treatment-to-response time intervals.Commercial Relationships: Jessie Huang, None; Michael Kalloniatis, None; Paula Katalinic, None; Barbara Zangerl, NoneSupport: Instrument grant from Icare Finland OyClinical Trial: ACTRN12615001274561
Program Number: 5327 Poster Board Number: B0424Presentation Time: 8:30 AM–10:15 AMSlit-Lamp light triggers sustained IOP reduction in ratsMalcolm J. Plunkett, John P. Wood, Glyn Chidlow. South Australian Institute of Opthalmology, Adelaide, SA, Australia.Purpose: In 1948, in the American Journal of Ophthalmology, Zaretskaya reported a reduction in intraocular pressure (IOP) in human subjects in response to photic stimuli. In the apparent absence of a plausible mechanism, this intriguing finding was adopted by fringe medicine and to our knowledge never received any further rigorous scientific study. In the current study, we attempted to replicate Zaretskaya’s findings in rodents with a view to potentially proceeding to human studies.Methods: Adult female Dark Agouti rats were maintained on a strict 12 hr dark / 12 hr light cycle for the duration of the study. Measurement of IOP occurred between 1 and 3 hours into the dark period, and was undertaken using a Tonolab tonometer. To prevent confounding movement during measurement, all rats were maintained at a level of very light anaesthesia with 1.4% isoflurane gas for a total duration of 40 minutes. Light treatment employed a Ziess style slit-lamp microscope along with a 5.4mm fundus laser lens; this applied a circle of white light of 2mm diameter to the central retina, at full intensity, for a period of 15 minutes per eye. To maximise pupillary dilation, 1% tropicamide was applied 10 minutes prior to light treatment. Animals were randomly divided into 3 groups of five (10 eyes each): control, untreated (C), tropicamide only (T), and tropicamide + slit-lamp light (T+L).Results: Measurements were carried out weekly and the IOP reduction of the T+L group was -15.4% at 2 weeks after the treatment, as compared to the control group. The change from baseline at 2 weeks was -1.5mmHg in the T+L group, and +0.7mmHg in the C group. The difference between the mean IOP values of these groups after 2 weeks, accounting for regression, was statistically significant (p = 0.002; ANCOVA). The effect lasted from
approximately 1 to 4 weeks post treatment. Tropicamide only eyes showed no significant variation over the 4 week period.Conclusions: This combination of tropicamide followed by slit-lamp light, but not tropicamide alone, is capable of a significant, prolonged IOP reduction in normal rats. This may be due to a disturbance of the pupillary eye reflex, and warrants further investigation.Commercial Relationships: Malcolm J. Plunkett, None; John P. Wood, None; Glyn Chidlow, None
Program Number: 5328 Poster Board Number: B0425Presentation Time: 8:30 AM–10:15 AMStatistical analysis of continuous IOP recordings in awake ratsSimon Bello2, 1, Christopher L. Passaglia1. 1Chemical and Biomedical Engineering, University of South Florida, Tampa, FL; 2Electrical Engineering, University of South Florida, Tampa, FL.Purpose: IOP fluctuations are typically measured via tonometry, so round-the-clock variations are not well characterized. This study analyzes the dynamic behavior of IOP over days to weeks in normal conscious rats.Methods: IOP and temperature of adult Brown-Norway rats were continuously monitored using a custom wireless implantable sensor that we have described previously. Animals were housed in a temperature-controlled (21°C) room under a 12hr/12hr light/dark cycle. Data was collected in 0.4s epochs every 20s. Each epoch contained 20 sample points, and the average was recorded. The statistical properties of IOP and temperature records were quantified with custom MATLAB programs that perform histogram, auto/cross correlation, and power spectral analysis on multiple time scales. Correlation times were measured by fitting an exponential decay function to the correlation records. In some experiments, animals were temporarily anesthetized with isoflurane and eye and body temperature were manipulated while IOP was recorded.Results: Circadian rhythms of IOP were detectable in most rats, with IOP low during subjective day and high during the subjective night. The average day-night difference in IOP across animals was 5.1 ± 1.4 mmHg (n = 7). IOP variability was often measurably larger at night, presumably because rats are nocturnal animals. IOP data were positively correlated at long and short time scales both with themselves and with temperature data. The long-term correlation had a period of 24.5 hrs and thereby reflected the circadian rhythm in IOP and temperature. The short-term correlation had a duration of 1.5 hrs. Direct manipulation of eye and body temperature further confirmed their strong influence on IOP, while isoflurane anesthesia had negligible effect.Conclusions: Mean IOP varies a daily basis between a daytime level of ~16 mmHg and nighttime level of ~21 mmHg in rats, consistent with reported tonometry measurements. The variation in IOP correlates closely with daily rhythms in body temperature. When performing tonometry on anesthetized animals, eye temperature must be maintained to ensure IOP measurement accuracy.Commercial Relationships: Simon Bello, None; Christopher L. Passaglia, NoneSupport: R21 EY023376, R01 EY027037
ARVO 2017 Annual Meeting Abstracts
These abstracts are licensed under a Creative Commons Attribution-NonCommercial-No Derivatives 4.0 International License. Go to http://iovs.arvojournals.org/ to access the versions of record.
Program Number: 5329 Poster Board Number: B0426Presentation Time: 8:30 AM–10:15 AMSimultaneous ambulatory 24-hour blood pressure monitoring and intraocular pressure-related patterns estimated with a contact-lens sensor in treated glaucoma patientsJoseph H. Lee1, Carlos G. De Moraes2, Luis J. Mena5, Zhezhen Jin4, Gladys Maestre3, Jeffrey M. Liebmann2, Robert Ritch6. 1Sergievsky Center, Columbia University, New York, NY; 2Bernard and Shirlee Brown Glaucoma Research Laboratory Columbia University Medical Center, Columbia University Medical Center, New York, NY; 3Department of Biomedical Sciences, University of Texas at Rio Grande Valley, Brownsville, TX; 4Biostatistics, Columbia University, New York, NY; 5Academic Unit of Computing, Universidad Politecnica de Sinaloa, Mazatlan, Mexico; 6Einhorn Clinical Research Center, New York Eye and Ear of Mount Sinai, New York, NY.Purpose: Cross-sectional studies using single-day, snapshot measurements have shown that, between-patients, blood pressure (BP) and intraocular pressure (IOP) measurements correlate positively.[1,2] Yet, the investigation of the variability of these clinical parameters within-patients with simultaneous, semi-continuous monitoring during 24 hours has not yet been conducted. Here we test the hypothesis that IOP and BP patterns are correlated within treated glaucoma patients undergoing 24-hour monitoring.Methods: 36 eyes (36 patients) with treated, established glaucoma underwent 24-hour BP and IOP-related measurements on the same day. IOP-related (IOPr) patterns were recorded with a validated contact-lens sensor (CLS, Sensimed Triggerfish®; Sensimed AG) that captures spontaneous circumferential changes at the corneoscleral area due to volume changes, which are correlated with IOP.[3] The CLS recorded consecutive readings every 5 minutes for up to 30 seconds, at intervals of 100 milliseconds. BP measurements (Spacelabs, Inc.) were taken every 30 minutes from 10:00 pm to 7:00 am and every 15 minutes for the rest of the day. We estimated the IOPr variability with the Average Real Variability (ARV) index: ARV=1/(N-1) ∑ | Pk+1-Pk |. Additionally, generalized estimating equations (GEE) were used to test the relationship between IOP and systolic (SBP) and diastolic (DBP) BP within-patients over 24 hours.Results: Pearson’s correlation revealed a significant, moderate correlation between IOPr ARVs and DBP (r =0.34, P=0.03). Further, GEE models revealed a significant relation between IOPr vs. DBP and IOPr vs. SBP within-patients (β=-1.87; 95% CI=-2.98 to -0.75; P=0.0010 and β=-1.42; 95% CI=-2.39 to -0.45; P=0.0039, respectively). The Figure below depicts the 24-hour patterns of average SBP, DBP, and IOPr of the 36 patients.Conclusions: In glaucoma patients undergoing simultaneous 24-hour IOPr and BP measurements, higher DBP was associated with higher IOPr variability. Also, IOPr had a significant inverse relationship with both SBP and DBP. That is, IOPr was highest when BP was lowest. Impaired auto-regulation of these relationships could lead to optic nerve ischemia and progressive vision loss from glaucoma.
Commercial Relationships: Joseph H. Lee, None; Carlos G. De Moraes, Sensimed (C); Luis J. Mena, None; Zhezhen Jin, None; Gladys Maestre, None; Jeffrey M. Liebmann, Alcon Laboratories Inc (C), Pfizer Inc (C), Allergan Inc (C), Topcon Medical Systems Inc (C), Dyopsis Inc (C), Carl Zeiss Meditec Inc (C); Robert Ritch, Ocular Instruments (P), Pfizer Inc (C), Santen (R), Diopsys Inc (F), Topcon Medical Systems Inc (C), Dyopsis Inc (C), Sensimed, AG (C), Topcon Medical Systems Inc (F), iSonic Medical (C)Support: Unrestricted departmental grant from Research to Prevent Blindness, New York, NY (Department of Ophthalmology, Columbia University Medical CenterClinical Trial: NCT01828255
Program Number: 5330 Poster Board Number: B0427Presentation Time: 8:30 AM–10:15 AMContinuous Intraocular Pressure monitoring in patients with Obstructive Sleep Apnea Syndrome (OSAS) using Sensimed TriggerfishTM
Elena M. Carnero1, Elena Urrestarazu2, Estefania Rivas-Navas2, Vicente Polo3, Jose Manuel Larrosa3, Vanesa Antón1, Adriano Guarnieri1, Javier Moreno-Montanes1. 1Ophthalmology, Clinica Universidad de Navarra, Pamplona, Spain; 2Neurophisiology, Clinica Universidad de Navarra, Pamplona, Spain; 3Ophthalmology, Hospital Miguel Servet, Zaragoza, Spain.Purpose: The purpose of this study is analyze the variations of the nocturnal Intraocular Pressure (IOP) in patients with Obstructive Sleep Apnea Syndrome (OSAS) using the Sensimed TrigerfishTM contact lens sensor (CLS).Methods: Eleven OSAS patients who had no ocular diseases were recruited in this prospective study. The subjects underwent IOP monitoring in one eye (30 seconds every five minutes) while the polysomnographic data was recorded at the sleep disorders unit. The patients were classified according to the Apnea–Hypopnea Index (AHI) into severe (AHI>30), moderate (15-30) and mild OSAS (AHI<15). Also, the respiratory event related arousal index was evaluated. Nonparametric correlation tests was used in the SPSS software.Results: All the patients showed a significant increase in the IOP at nocturnal time compared to diurnal measures resulting in a “Wake-to-sleep slope” (WSS). This increase in the IOP is followed by a variable plateau time (Plateau Duration) where the IOP showed small variations. The current study found a positive correlation between the plateau duration and the severity of the OSAS (r=0.728 p=0.011) or the total number of apnea-hypopneas (r=0.718 p=0.013). Moreover, a positive correlation between the WSS and plateau
ARVO 2017 Annual Meeting Abstracts
These abstracts are licensed under a Creative Commons Attribution-NonCommercial-No Derivatives 4.0 International License. Go to http://iovs.arvojournals.org/ to access the versions of record.
duration (r=0.621 p=0.041) was observed. RERA, a parameter related to the severity to the OSAS, also showed a positive correlation with the duration of the IOP plateau (r=0,674 p=0,023).Conclusions: This study evaluated 11 patients with different degrees of OSAS and found a positive correlation between severity of the OSAS and the IOP plateau time. Also the increased IOP was related to other polysomnographic data. These results suggest that OSAS influences the IOP during the nocturnal period.Commercial Relationships: Elena M. Carnero; Elena Urrestarazu, None; Estefania Rivas-Navas, None; Vicente Polo, None; Jose Manuel Larrosa, None; Vanesa Antón, None; Adriano Guarnieri, None; Javier Moreno-Montanes
Program Number: 5331 Poster Board Number: B0428Presentation Time: 8:30 AM–10:15 AMThe Effect of Obstructive Sleep Apnea and CPAP therapy on Intraocular PressureCindi Yim, Davis Zhou, Robert Hiensch, Timothy P. Fox, Albert Wu. Icahn School of Medicine at Mount Sinai, New York, NY.Purpose: Obstructive sleep apnea (OSA) has been associated with diseases such as hypertension, diabetes mellitus type 2, cardiovascular disease, and widely varied ocular morbidity. Current studies lack consensus about the relationship between OSA, continuous positive airway pressure (CPAP) therapy, and intraocular pressure (IOP). We performed a prospective study to assess the association between OSA and CPAP therapy on evening and morning IOP.Methods: The evening and morning IOP of 107 (N = 214 eyes) patients receiving an overnight polysomnography (PSG) study at Mount Sinai Center for Sleep Medicine was measured using rebound tonometer. Subjects were recruited and examined prior to undergoing PSG, which also included an ocular history and assessment of visual acuity. Examiners were blinded to patient medical history and OSA status. Relevant data collected during PSG included the apnea-hypoapnea index (AHI), mean oxygen saturation during wakefulness, overall diagnostic impression of OSA severity, and therapeutic pressure for those receiving CPAP. Two-tailed t-test was used to compare the difference in IOP of CPAP and non-CPAP groups. Population-averaged Generalized Estimating Equations (GEE) models were used to analyze the effect of patient demographics and comorbidities on average IOP. All calculations were performed using Python.Results: The mean evening IOP of the CPAP and non-CPAP groups measured before PSG was 14.28 ± 3.57 mmHg and 14.42 ± 3.58 mmHg, respectively (p = 0.8), while the mean morning IOP of the CPAP and non-CPAP groups was 14.32 ± 3.37 mmHg and 14.09 ± 3.18 mmHg, respectively (p = 0.4). Two-tailed t-test did not reveal a statistically significant difference in change in IOP overnight in CPAP and non-CPAP groups. Population-averaged GEE models revealed that the severity of OSA diagnosis (mild, moderate, severe) and having a comorbidity of congestive heart failure (CHF) were positively correlated with average IOP (p = 0.036 and p = 0.045, respectively).Conclusions: CPAP therapy did not appear to affect the average IOP in patients with OSA. An increased disease severity of OSA and comorbidity of CHF appeared to be associated with increased average IOP. More research is necessary to understand how long term use of CPAP therapy for OSA may affect IOP.Commercial Relationships: Cindi Yim, None; Davis Zhou, None; Robert Hiensch, None; Timothy P. Fox, None; Albert Wu, None
Program Number: 5332 Poster Board Number: B0429Presentation Time: 8:30 AM–10:15 AMCan Central Intraocular Pressure Be Predicted Accurately from Peripheral Intraocular Pressure?Viswanathan Ramasubramanian, Shreya Gupta. College of Optometry, Lotus College of Optometry, Mumbai, Maharashtra, India.Purpose: Eyes with central corneal pathologies and post-refractive surgeries often preclude accurate measurement of intraocular pressure (IOP). The goal of the current study was to try to predict the central IOP from peripheral IOP in emmetropic and myopic eyes.Methods: The study population included 25 emmetropes (ES) and 25 myopes (MS) aged 18 to 30 years. Three measurements of IOP were obtained using a non-contact air puff tonometer (Topcon CT80) at 5 corneal locations: central (cIOP), superior (sIOP), inferior (iIOP), nasal (nIOP) and temporal (tIOP). All peripheral corneal locations were approximately 2 mm from the limbus. Subsequently, three measurements of corneal thickness (CT) were taken using a specular microscope (Topcon SP-3000P) at the same central (cCT) and peripheral corneal (sCT, iCT, nCT, tCT) locations. All measurements were performed in the right eyes between 9 am and 3 pm.Results: A one-way repeated measures ANOVA showed statistically significant differences in the mean IOP and CT measured at the central and peripheral cornea within each subject groups (p<0.05). The mean SD of the IOP measurements were: sIOP: 0.88 mmHg (ES); 0.96 mmHg (MS), iIOP: 0.79 mmHg (ES); 0.63 mmHg (MS), nIOP: 0.64 mmHg (ES); 0.69 mmHg (MS), tIOP: 0.70 mmHg (ES); 0.73 mmHg (MS). There were statistically significant linear relationships between the central and peripheral IOPs in both the subject populations (p<0.05). Peripheral CTs, except for iCT were significantly linearly correlated with cIOP, in emmetropes (p<0.05). No significant relationships were observed between peripheral CTs and cIOP in myopes. The mean ± SD of the absolute differences between measured and predicted cIOP from peripheral IOP and CT measurements using linear regression equations for the two populations were: sIOP: 1.05 ± 0.70 mmHg (ES); 0.86 ± 0.71 mmHg (MS), iIOP: 0.78 ± 0.62 mmHg (ES); 0.72 ± 0.48 mmHg (MS), nIOP: 0.77 ± 0.59 mmHg (ES); 0.60 ± 0.49 mmHg (MS), tIOP: 0.94 ± 0.54 mmHg (ES); 0.61 ± 0.62 mmHg (MS), sCT: 1.07 ± 0.84 mmHg (ES), nCT: 1.12 ± 0.63 mmHg (ES), tCT: 1.03 ± 0.73 mmHg (ES).Conclusions: Peripheral IOP and CT measurements can, on average, predict the central IOP in a population with a SD of 1 mmHg or less, with nasal and temporal IOP being the best predictors. Linear regression equations described in this study could be useful to estimate central IOP in conditions where direct measurement is not possible.Commercial Relationships: Viswanathan Ramasubramanian, None; Shreya Gupta, None
Program Number: 5333 Poster Board Number: B0430Presentation Time: 8:30 AM–10:15 AMWind Instruments: A cause of chronic elevation of Intraocular Pressure in pediatric populationBrett Mueller, Rebecca Raj, Rahul Bhola. Ophthalmology, University of Louisville, Louisville, KY.Purpose: To report a novel observation of chronic elevation of intraocular pressure (IOP) from playing wind instrument in a series of pediatric patients.Methods: This is an observational case series of patients who presented to the pediatric ophthalmology department of our institution with chronic intraocular elevation, and had history of playing wind instruments for more than one year, that needed either medical or surgical intervention.
ARVO 2017 Annual Meeting Abstracts
These abstracts are licensed under a Creative Commons Attribution-NonCommercial-No Derivatives 4.0 International License. Go to http://iovs.arvojournals.org/ to access the versions of record.
Results: We report 6 pediatric patients who presented with IOP of 28 mm of Hg or higher in both eyes and had history of playing wind instruments like Saxophone, Clarinet, Trumpet, Flute and Oboe for one year or higher. All six patients had IOP elevations 10 mm of Hg or higher immediately after playing the instruments and IOP’s remained chronically elevated above 28 mm of Hg for greater than 6 months even after discontinuing the instruments. All 6 patients eventually required medical or surgical management to control the IOP.Conclusions: This study reports for the first time a cohort of patients that had chronic elevation of IOP and a history of playing wind instruments. This report speculates that there may be a link between playing wind instruments and chronic elevation of intraocular pressure. To date, little is known about the cause of juvenile open-angle glaucoma and studies are needed to help identify risk factors predisposing to this condition. The knowledge of this risk factor could aid in the early identification of children who are affected with juvenile open angle glaucoma before the onset of optic nerve damage or visual field loss.Commercial Relationships: Brett Mueller; Rebecca Raj, None; Rahul Bhola, None
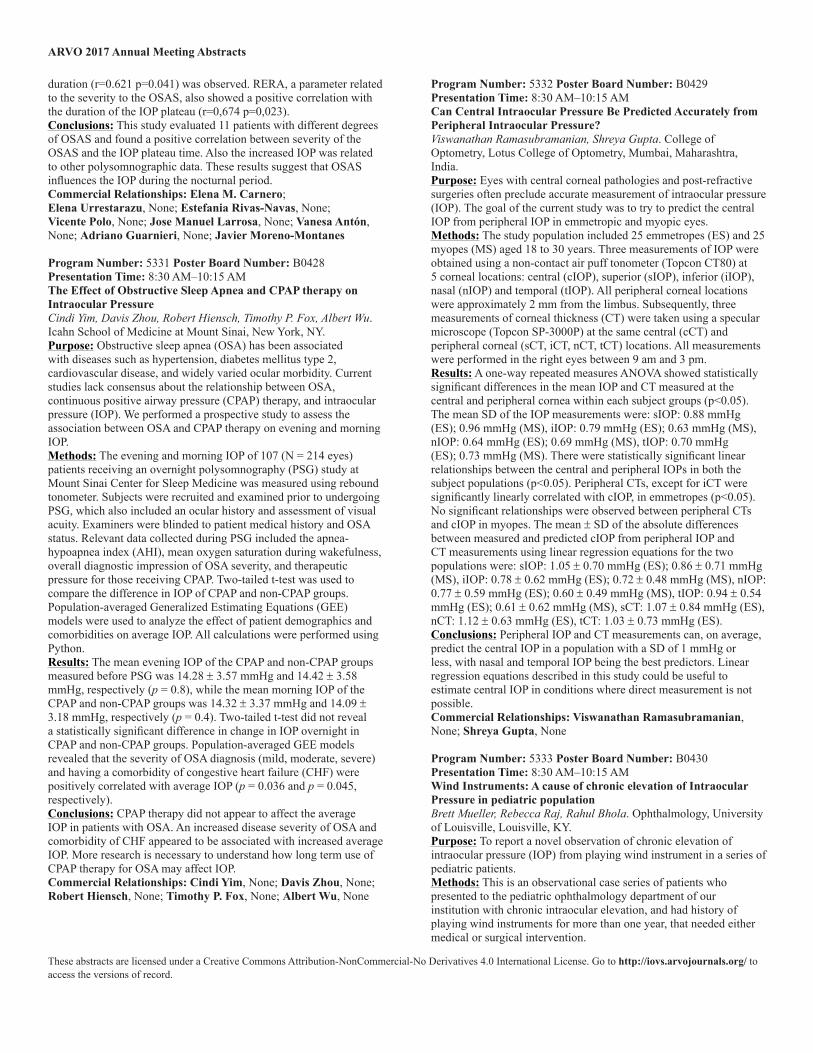
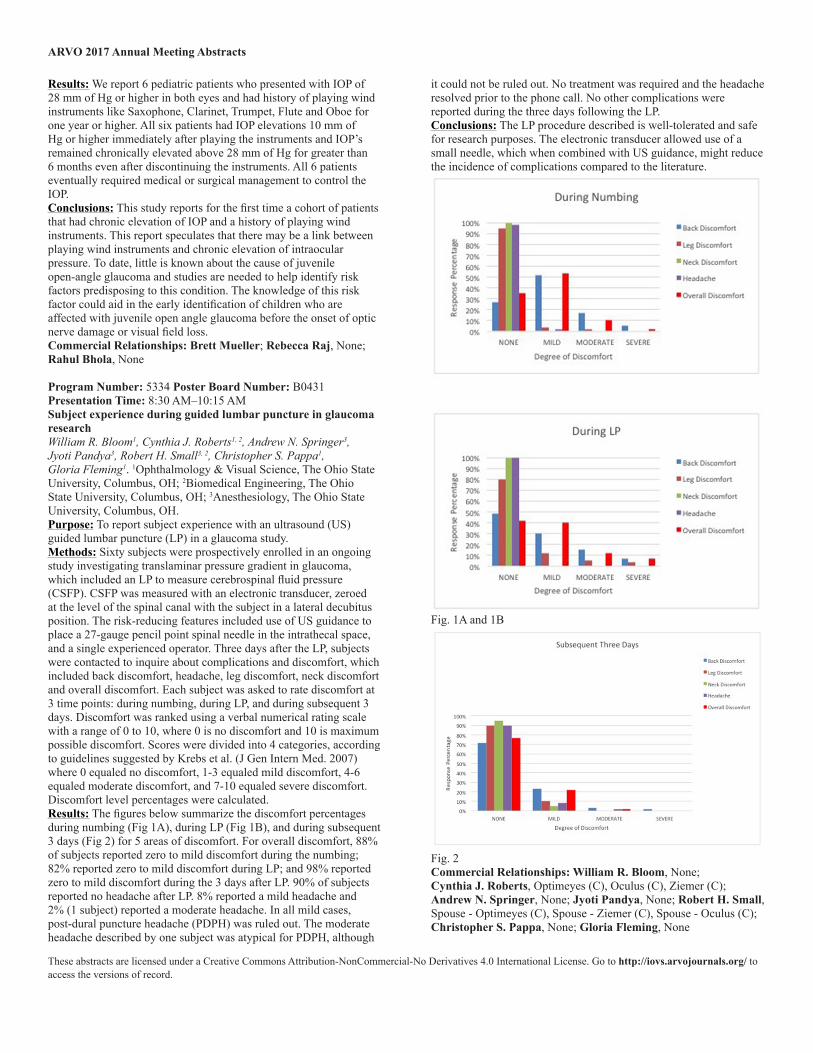
Program Number: 5334 Poster Board Number: B0431Presentation Time: 8:30 AM–10:15 AMSubject experience during guided lumbar puncture in glaucoma researchWilliam R. Bloom1, Cynthia J. Roberts1, 2, Andrew N. Springer3, Jyoti Pandya3, Robert H. Small3, 2, Christopher S. Pappa1, Gloria Fleming1. 1Ophthalmology & Visual Science, The Ohio State University, Columbus, OH; 2Biomedical Engineering, The Ohio State University, Columbus, OH; 3Anesthesiology, The Ohio State University, Columbus, OH.Purpose: To report subject experience with an ultrasound (US) guided lumbar puncture (LP) in a glaucoma study.Methods: Sixty subjects were prospectively enrolled in an ongoing study investigating translaminar pressure gradient in glaucoma, which included an LP to measure cerebrospinal fluid pressure (CSFP). CSFP was measured with an electronic transducer, zeroed at the level of the spinal canal with the subject in a lateral decubitus position. The risk-reducing features included use of US guidance to place a 27-gauge pencil point spinal needle in the intrathecal space, and a single experienced operator. Three days after the LP, subjects were contacted to inquire about complications and discomfort, which included back discomfort, headache, leg discomfort, neck discomfort and overall discomfort. Each subject was asked to rate discomfort at 3 time points: during numbing, during LP, and during subsequent 3 days. Discomfort was ranked using a verbal numerical rating scale with a range of 0 to 10, where 0 is no discomfort and 10 is maximum possible discomfort. Scores were divided into 4 categories, according to guidelines suggested by Krebs et al. (J Gen Intern Med. 2007) where 0 equaled no discomfort, 1-3 equaled mild discomfort, 4-6 equaled moderate discomfort, and 7-10 equaled severe discomfort. Discomfort level percentages were calculated.Results: The figures below summarize the discomfort percentages during numbing (Fig 1A), during LP (Fig 1B), and during subsequent 3 days (Fig 2) for 5 areas of discomfort. For overall discomfort, 88% of subjects reported zero to mild discomfort during the numbing; 82% reported zero to mild discomfort during LP; and 98% reported zero to mild discomfort during the 3 days after LP. 90% of subjects reported no headache after LP. 8% reported a mild headache and 2% (1 subject) reported a moderate headache. In all mild cases, post-dural puncture headache (PDPH) was ruled out. The moderate headache described by one subject was atypical for PDPH, although
it could not be ruled out. No treatment was required and the headache resolved prior to the phone call. No other complications were reported during the three days following the LP.Conclusions: The LP procedure described is well-tolerated and safe for research purposes. The electronic transducer allowed use of a small needle, which when combined with US guidance, might reduce the incidence of complications compared to the literature.
Fig. 1A and 1B
Fig. 2Commercial Relationships: William R. Bloom, None; Cynthia J. Roberts, Optimeyes (C), Oculus (C), Ziemer (C); Andrew N. Springer, None; Jyoti Pandya, None; Robert H. Small, Spouse - Optimeyes (C), Spouse - Ziemer (C), Spouse - Oculus (C); Christopher S. Pappa, None; Gloria Fleming, None
ARVO 2017 Annual Meeting Abstracts
These abstracts are licensed under a Creative Commons Attribution-NonCommercial-No Derivatives 4.0 International License. Go to http://iovs.arvojournals.org/ to access the versions of record.
Support: Ann Ellis Fund of the Columbus Foundation
Program Number: 5335 Poster Board Number: B0432Presentation Time: 8:30 AM–10:15 AMEffect of Trendelenburg positioning during Robot-assisted laparoscopic radical prostatectomy (RALP) on IOP and visual functionYi-Ning Chen1, Fumiyuki Araki1, Yukako Taketani1, Yasuko Okagami2, Masaaki Asamoto2, Gaku Kawamura2, Nobuko Ito2, Shigenori Kakutani2, Hiroshi Fukuhara3, Makoto Aihara1. 1Ophthalmology and Vision Correction, The University of Tokyo Hospital, Tokyo, Japan; 2Anesthesiology and Pain Relief Center, The University of Tokyo Hospital, Tokyo, Japan; 3Urology and Andrology, The University of Tokyo Hospital, Tokyo, Japan.Purpose: To evaluate the effects of Trendelenburg positioning during RALP on IOP and visual function.Methods: The study group consisted of 128 eyes from 64 male patients who underwent RALP at the University of Tokyo Hospital between December 2015 to October 2016. Best corrected visual acuity (BCVA), IOP, axial length measurement and Humphrey visual field analyzer (HFA) 30-2 program visual field testing were scheduled before and 1 week after surgery. Operation time and IOP change over time were also measured.Results: The mean age is 66.3±5.3 year old. The average operation time was 3.6±1.0 hours. The IOP immediately after anesthesia induction was11.0±2.7mmHg (OD) and 11.0±2.8mmHg (OS). The highest IOP measured during operation was 24.4±4.5mmHg (OD) and 24.6±4.5mmHg (OS). Each was significantly elevated compared with that measured immediately after anesthesia induction, respectively (p<0.001). The increasing range of IOP during operation was neither correlative with operation time nor with axial length. There was no change between the preoperative and postoperative visual acuity. The MD (mean deviation) values of HFA including 15 glaucoma eyes of 9 patients revealed no post-operative MD value decrease more than 2 dB.Conclusions: Trendelenburg positioning in RALP induced IOP elevation during operation but had no effect on post-operative visual function.Commercial Relationships: Yi-Ning Chen, None; Fumiyuki Araki, None; Yukako Taketani, None; Yasuko Okagami, None; Masaaki Asamoto, None; Gaku Kawamura, None; Nobuko Ito, None; Shigenori Kakutani, None; Hiroshi Fukuhara, None; Makoto Aihara, None
Program Number: 5336 Poster Board Number: B0433Presentation Time: 8:30 AM–10:15 AMEye Dynamics & Engineering Network (EDEN) Consortium: Study Design and Baseline DescriptionSayoko E. Moroi5, David M. Reed5, Arthur J. Sit2, Carol B. Toris3, 4, Vikas Gulati4, Jay W. McLaren2, Diana Burnett5, Jesse Gilbert5, Tyler Kristoff5, Matthew Trese1, Arash Kazemi2, Shan Fan4, David C. Musch5, 6. 1William Beaumont School of Medicine, Oakland University, Royal Oak, MI; 2Ophthalmology, The Mayo Clinic, Rochester, MN; 3Ophthalmology and Visual Sciences, Case Western Reserve University, Cleveland, OH; 4Ophthalmology and Visual Sciences, University of Nebraska Medical Center, Omaha, NE; 5Ophthalmology and Visual Sciences, University of Michigan, Ann Arbor, MI; 6Epidemiology, University of Michigan, Ann Arbor, MI.Purpose: We characterized the variation in intraocular pressure (IOP) in normal subjects. We report the study design of the Eye Dynamics and Engineering Network (EDEN) consortium, a description of study subjects, and IOP outcome measures at baseline.
Methods: These subjects were enrolled a prospective, randomized, multi-center trial to assess aqueous humor dynamic (AHD) traits and response to glaucoma medications in the same individuals. We measured IOP by tonometry, aqueous humor flow by fluorophotometry, outflow facility by 2-minute pneumatonometry (Model 30 Classic, Medtronic), and episcleral venous pressure by episcleral venomanometry. The PhenX Toolkit (www.phenxtoolkit.org) was used to assess body mass index (BMI), neck circumference, systemic disease, lifetime tobacco use, blood pressure, and systemic medications. Central cornea thickness (CCT) and ocular dimensions were measured by pachymetry and ocular biometry, respectively. Visit-to-visit IOP difference at five different times was classified as differences in IOP < 3 mmHg, between 3 – 5 mmHg, and > 5 mmHg. Data were assessed by univariate analyses and Pearson correlation for IOP difference between eyes and between visits.Results: IOP was measured in 118 normal subjects at baseline AHD measurements and three prior visits during enrollment. Mean age was 55.3 ± 8.9 years (± SD, range 40 – 81 years), 88 were females and 30 were males, and self-reported ethnoracial status with 100 Caucasians, 12 Blacks, and 6 other. CCT was similar between eyes (553 ± 36 µm OD, 552 ± 37 µm OS, p = 0.9206). Axial length was similar between eyes (23.9 ± 1.2 µm OD, 23.8 ± 1.2 µm OS, p = 0.5555). The Pearson correlation coefficient between IOP in right and left eyes was r = 0.91 (95% CI:0.87, 0.93; p < 0.0001) with similar results on three repeated IOP measurements at two study visits. The visit-to-visit IOP difference from five repeated IOP measurements (right eye only) in 96 subjects (81%) was < 3 mmHg difference, in 18 subjects (15%) was 3 – 5 mmHg difference, and in 4 subjects (4%) was > 5 mmHg difference. There was no significant effect of study site, age, sex, race, CCT, BMI, neck circumference, tobacco use, systemic disease or medications on IOP outcomes (stepwise regression analysis, all p ≥ 0.05).Conclusions: In the EDEN consortium, 15% of normal subjects have IOP difference of 3-5 mmHg between visits and 4% of normal subjects had > 5 mmHg between visits.Commercial Relationships: Sayoko E. Moroi, NIH (F); David M. Reed, None; Arthur J. Sit, NIH (F); Carol B. Toris, NIH (F); Vikas Gulati, NIH (F); Jay W. McLaren, None; Diana Burnett, None; Jesse Gilbert, None; Tyler Kristoff, None; Matthew Trese, None; Arash Kazemi, None; Shan Fan, None; David C. Musch, NIH (F)Support: EY022124 (SEM), P30 EY007003 (UM Core Center for Vision Research), CTSA: UL1TR000433 (REDCap support was provided by the Michigan Institute for Clinical & Health Research), Research to Prevent Blindness Unrestricted Grant (University of Michigan, Mayo Clinic)Clinical Trial: NCT01677507
Program Number: 5337 Poster Board Number: B0434Presentation Time: 8:30 AM–10:15 AMIncidence of post traumatic Glaucoma in “Asociacion Para Evitar la Ceguera en México” in 5 YearsMONTSERRAT PINTO CROKER1, Ana Karina Martínez Báez1, Nallely Ramos Betancourt2, Jorge Gamiochipi-Arjona1, Jesus Jimenez Arroyo2, Jesus Jimenez-Roman2, Magdalena Garcia Huerta2, Mauricio Turati Acosta2. 1RESIDENT, APEC, MEXICO, Mexico; 2APEC, MEXICO, Mexico.Purpose: Ocular trauma is an important cause of ocular morbidity. The development of glaucoma is a possible complication after trauma. The purpose of this study is to determine the incidence of post-traumatic glaucoma in patients with closed and open globe trauma and to evaluate the clinical characteristics that increase the risk of developing glaucoma.
ARVO 2017 Annual Meeting Abstracts
These abstracts are licensed under a Creative Commons Attribution-NonCommercial-No Derivatives 4.0 International License. Go to http://iovs.arvojournals.org/ to access the versions of record.
Methods: This study is a retrospective cohort. We included patients that came to our hospital with diagnosis of ocular trauma from January 2010 to December 2015. A total of 185 cases were included; mean age was 38.24 years (SD 18.90, range 7-86), 78.4% (145) were male and 58.4% (108) were left eyes.Results: The incidence of glaucoma in closed globe trauma was 7.5%. There were no glaucoma cases in open globe trauma. The mean intraocular pressure (IOP) of patients who developed glaucoma was 28.58mmHg (DS 10.13, range 10-46) at the first visit, which was higher than the patients who didn’t (p< 0.0001). The clinical characteristics that increased the risk of developing glaucoma were: hyphema (RR 6.7), vitreous hemorrhage (RR 2.19) and angular recession (RR 1.32).Conclusions: Conclusions: The incidence of glaucoma in closed globe trauma in our Center is higher than reported in previous studies. High IOP, hyphema, vitreous hemorrhage and angular recession diagnosed at the first visit seemed to increase the risk of developing post traumatic glaucoma.Commercial Relationships: MONTSERRAT PINTO CROKER, None; Ana Karina Martínez Báez, None; Nallely Ramos Betancourt, None; Jorge Gamiochipi-Arjona, None; Jesus Jimenez Arroyo, None; Jesus Jimenez-Roman, None; Magdalena Garcia Huerta, None; Mauricio Turati Acosta, None
Program Number: 5338 Poster Board Number: B0435Presentation Time: 8:30 AM–10:15 AMFunctional and Histological Analysis of a Mouse Model of Oculocerebrorenal Syndrome of LoweJorge A. Alvarado1, Na Luo1, Emilie Song1, Judith Quigley1, Yang Sun1, 2. 1Ophthalmology, Indiana University, Indianapolis, IN; 2Roudebush Veterans Administration, Indianapolis, IN.Purpose: Lowe syndrome is a rare X-linked recessive disorder that affects the eyes, brain, and kidneys. In particular, infants with mutations in the OCRL gene are born with cataracts and develop congenital glaucoma. Previous studies showed that mice deficient
in only Ocrl (Ocrl-/-) exhibited little to no abnormalities, and those lacking in both Ocrl and Inpp5b (Ocrl-/-:Inpp5b-/-) died on embryonic day 9.5, but introduction of the human INPP5B to double-knockout mice (Ocrl-/-:Inpp5b-/-: INPP5B+/+) developed renal abnormalities seen in Lowe syndrome. However, ocular defects have yet to be described. The purpose of this study is to describe the ocular phenotypes of a Lowe syndrome mouse model (IOB) and compare to the human ocular pathology.Methods: Lowe syndrome IOB mouse eyes were photographed and examined for the presence of cataracts. Optical coherence tomography (OCT) imaging and tissue sectioning were performed to examine the lens and retina vasculature. An anterior chamber perfusion system was used to measure aqueous outflow rate via a computer-controlled flow pump, while a tonometer was used to measure IOP. A human Lowe syndrome patient who underwent enucleation for glaucoma was examined and compared with the mouse histology.Results: Cataracts were visibly present in the eyes of Lowe syndrome IOB mouse. On histology, 50% (N=8) of IOB eyes exhibited lenticular cavities, 75% showed retained nuclei in lens, and there was a significant increase (p < 0.001, student t-test) in thickness of lens basement membrane as compared to WT (N=4; control N=6). OCT and retina vessel imaging showed no significant differences between the IOB and control mice. Histology sections revealed a reduced number of ganglion cells in the retina of IOB mice. Moreover, IOB mice exhibited elevated levels of IOP than control (p = 0.01, student t-test), in addition to lower outflow rate at different IOP levels (p < 0.001, student t-test).Conclusions: The IOB mouse exhibits ocular defects, such as formation of cataracts and decreased aqueous outflow facility, similar to human phenotypes in Lowe syndrome patients.Commercial Relationships: Jorge A. Alvarado, None; Na Luo, None; Emilie Song, None; Judith Quigley, None; Yang Sun, NoneSupport: NEI K08-022058, NEI R01-25295, VA merit I0CX001298, ARI, E. Matilda Ziegler, RPB, Showalter