Embed Size (px)
Citation preview
ARTS VICTORIA
Economic Impact of the Victorian Arts and Cultural Sector
2013
kpmg.com.au
Contents
Executive Summary i
1 Introduction 1
2 Arts and Cultural Industries: Scope, Definitions and Terminology 3
3 Economic Contribution of the Victorian Arts and Culture Sector 53.1 Direct Output 73.2 Direct Value Added 83.3 Direct Employment 93.4 Industry Comparisons 113.5 Induced Tourism 153.6 Total Contribution of the Arts and Culture Sector 17
4 Government Support for the Sector 214.1 Victorian Government Support: Arts Victoria 214.2 Other Victorian Government Support 214.3 Other Government Support 254.4 Economic Impact of Funding by the Victorian Government 26
Appendix A: ACL Classification 27
Appendix B: Method of Estimation 28
Appendix C: Economic Modelling 30
Appendix D: Comparisons and Clarification of Economic Measures 34
References 35
Inherent Limitations
This report has been prepared as outlined in the Introduction Section. The services provided in connection with this engagement comprise an advisory engagement, which is not subject to assurance or other standards issued by the Australian Auditing and Assurance Standards Board and, consequently no opinions or conclusions intended to convey assurance have been expressed.
No warranty of completeness, accuracy or reliability is given in relation to the statements and representations made by, and the information and documentation provided by, Arts Victoria management and personnel consulted as part of the process.
KPMG have indicated within this report the sources of the information provided. We have not sought to independently verify those sources unless otherwise noted within the report.
KPMG is under no obligation in any circumstance to update this report, in either oral or written form, for events occurring after the report has been issued in final form.
The findings in this report have been formed on the above basis.
Third Party Reliance
This report has been prepared at the request of Arts Victoria in accordance with the terms of KPMG’s engagement letter/contract dated July 2012. Other than our responsibility to Arts Victoria, neither KPMG nor any member or employee of KPMG undertakes responsibility arising in any way from reliance placed by a third party on this report. Any reliance placed is that party’s sole responsibility.
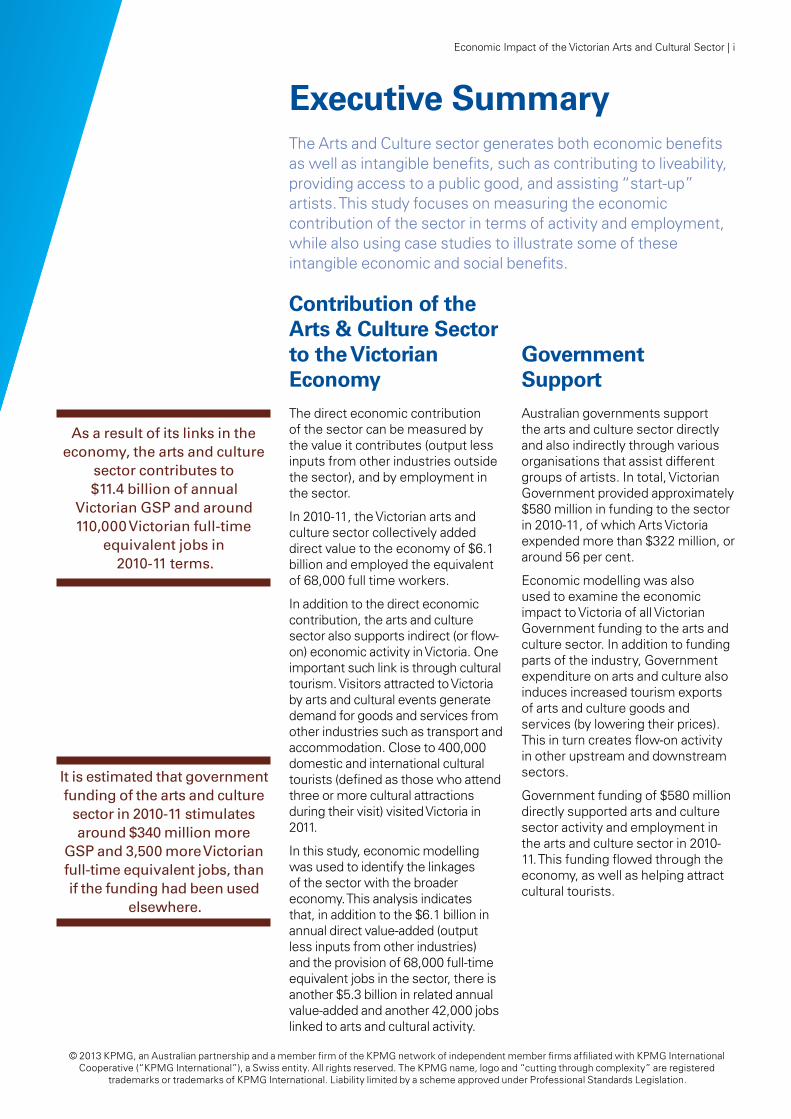
Contribution of the Arts & Culture Sector to the Victorian EconomyThe direct economic contribution of the sector can be measured by the value it contributes (output less inputs from other industries outside the sector), and by employment in the sector.
In 2010-11, the Victorian arts and culture sector collectively added direct value to the economy of $6.1 billion and employed the equivalent of 68,000 full time workers.
In addition to the direct economic contribution, the arts and culture sector also supports indirect (or flow-on) economic activity in Victoria. One important such link is through cultural tourism. Visitors attracted to Victoria by arts and cultural events generate demand for goods and services from other industries such as transport and accommodation. Close to 400,000 domestic and international cultural tourists (defined as those who attend three or more cultural attractions during their visit) visited Victoria in 2011.
In this study, economic modelling was used to identify the linkages of the sector with the broader economy. This analysis indicates that, in addition to the $6.1 billion in annual direct value-added (output less inputs from other industries) and the provision of 68,000 full-time equivalent jobs in the sector, there is another $5.3 billion in related annual value-added and another 42,000 jobs linked to arts and cultural activity.
Executive Summary The Arts and Culture sector generates both economic benefits as well as intangible benefits, such as contributing to liveability, providing access to a public good, and assisting “start-up” artists. This study focuses on measuring the economic contribution of the sector in terms of activity and employment, while also using case studies to illustrate some of these intangible economic and social benefits.
Government SupportAustralian governments support the arts and culture sector directly and also indirectly through various organisations that assist different groups of artists. In total, Victorian Government provided approximately $580 million in funding to the sector in 2010-11, of which Arts Victoria expended more than $322 million, or around 56 per cent.
Economic modelling was also used to examine the economic impact to Victoria of all Victorian Government funding to the arts and culture sector. In addition to funding parts of the industry, Government expenditure on arts and culture also induces increased tourism exports of arts and culture goods and services (by lowering their prices). This in turn creates flow-on activity in other upstream and downstream sectors.
Government funding of $580 million directly supported arts and culture sector activity and employment in the arts and culture sector in 2010-11. This funding flowed through the economy, as well as helping attract cultural tourists.
As a result of its links in the economy, the arts and culture
sector contributes to $11.4 billion of annual
Victorian GSP and around 110,000 Victorian full-time
equivalent jobs in 2010-11 terms.
It is estimated that government funding of the arts and culture
sector in 2010-11 stimulates around $340 million more
GSP and 3,500 more Victorian full-time equivalent jobs, than if the funding had been used
elsewhere.
Economic Impact of the Victorian Arts and Cultural Sector | i
© 2013 KPMG, an Australian partnership and a member firm of the KPMG network of independent member firms affiliated with KPMG International Cooperative (“KPMG International”), a Swiss entity. All rights reserved. The KPMG name, logo and “cutting through complexity” are registered
trademarks or trademarks of KPMG International. Liability limited by a scheme approved under Professional Standards Legislation.
Introduction1
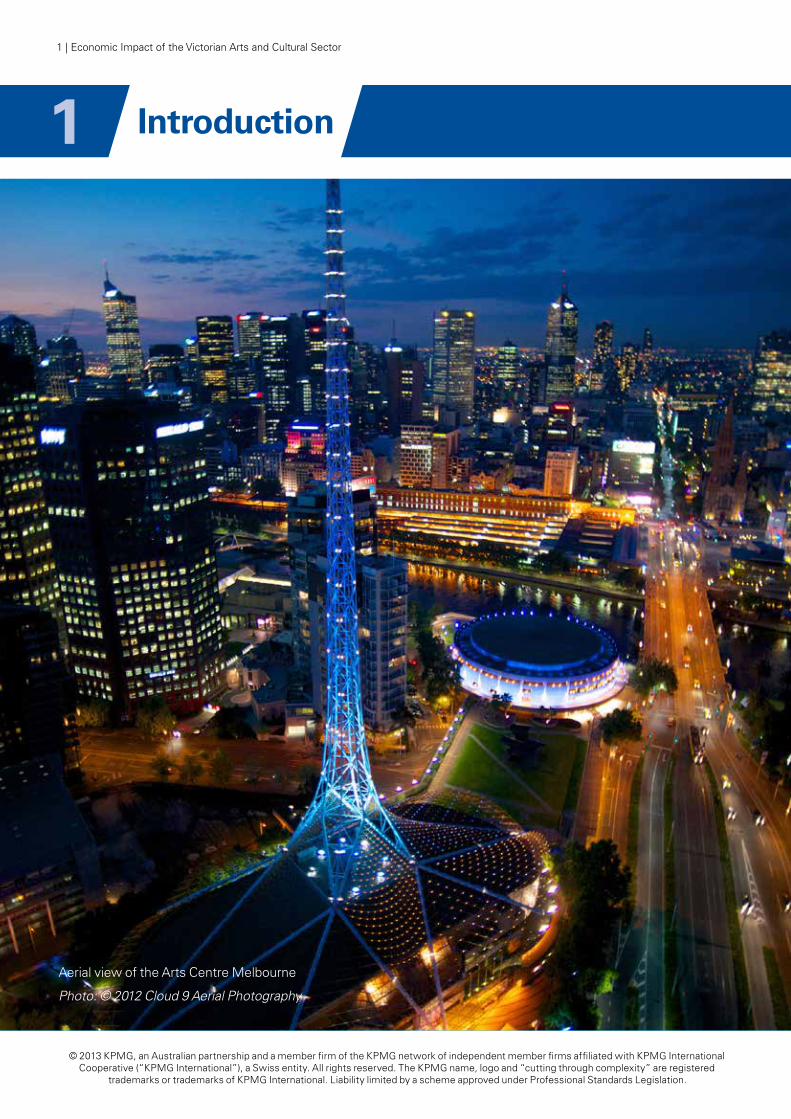
Aerial view of the Arts Centre Melbourne
Photo: © 2012 Cloud 9 Aerial Photography
1 | Economic Impact of the Victorian Arts and Cultural Sector
© 2013 KPMG, an Australian partnership and a member firm of the KPMG network of independent member firms affiliated with KPMG International Cooperative (“KPMG International”), a Swiss entity. All rights reserved. The KPMG name, logo and “cutting through complexity” are registered
trademarks or trademarks of KPMG International. Liability limited by a scheme approved under Professional Standards Legislation.
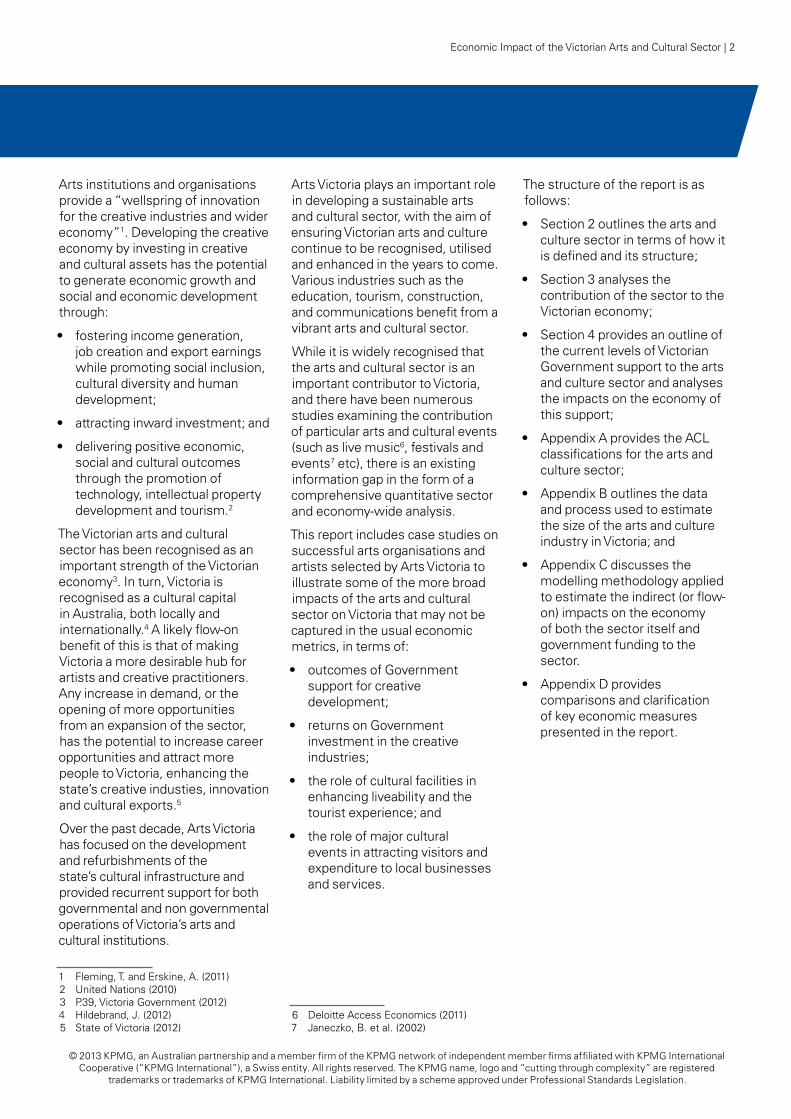
Arts institutions and organisations provide a “wellspring of innovation for the creative industries and wider economy”1. Developing the creative economy by investing in creative and cultural assets has the potential to generate economic growth and social and economic development through:
• fostering income generation, job creation and export earnings while promoting social inclusion, cultural diversity and human development;
• attracting inward investment; and
• delivering positive economic, social and cultural outcomes through the promotion of technology, intellectual property development and tourism.2
The Victorian arts and cultural sector has been recognised as an important strength of the Victorian economy3. In turn, Victoria is recognised as a cultural capital in Australia, both locally and internationally.4 A likely flow-on benefit of this is that of making Victoria a more desirable hub for artists and creative practitioners. Any increase in demand, or the opening of more opportunities from an expansion of the sector, has the potential to increase career opportunities and attract more people to Victoria, enhancing the state’s creative industies, innovation and cultural exports.5
Over the past decade, Arts Victoria has focused on the development and refurbishments of the state’s cultural infrastructure and provided recurrent support for both governmental and non governmental operations of Victoria’s arts and cultural institutions.
1 Fleming, T. and Erskine, A. (2011)2 United Nations (2010)3 P.39, Victoria Government (2012)4 Hildebrand, J. (2012)5 State of Victoria (2012)
Arts Victoria plays an important role in developing a sustainable arts and cultural sector, with the aim of ensuring Victorian arts and culture continue to be recognised, utilised and enhanced in the years to come. Various industries such as the education, tourism, construction, and communications benefit from a vibrant arts and cultural sector.
While it is widely recognised that the arts and cultural sector is an important contributor to Victoria, and there have been numerous studies examining the contribution of particular arts and cultural events (such as live music6, festivals and events7 etc), there is an existing information gap in the form of a comprehensive quantitative sector and economy-wide analysis.
This report includes case studies on successful arts organisations and artists selected by Arts Victoria to illustrate some of the more broad impacts of the arts and cultural sector on Victoria that may not be captured in the usual economic metrics, in terms of:
• outcomes of Government support for creative development;
• returns on Government investment in the creative industries;
• the role of cultural facilities in enhancing liveability and the tourist experience; and
• the role of major cultural events in attracting visitors and expenditure to local businesses and services.
6 Deloitte Access Economics (2011)7 Janeczko, B. et al. (2002)
The structure of the report is as follows:
• Section 2 outlines the arts and culture sector in terms of how it is defined and its structure;
• Section 3 analyses the contribution of the sector to the Victorian economy;
• Section 4 provides an outline of the current levels of Victorian Government support to the arts and culture sector and analyses the impacts on the economy of this support;
• Appendix A provides the ACL classifications for the arts and culture sector;
• Appendix B outlines the data and process used to estimate the size of the arts and culture industry in Victoria; and
• Appendix C discusses the modelling methodology applied to estimate the indirect (or flow-on) impacts on the economy of both the sector itself and government funding to the sector.
• Appendix D provides comparisons and clarification of key economic measures presented in the report.
Economic Impact of the Victorian Arts and Cultural Sector | 2
© 2013 KPMG, an Australian partnership and a member firm of the KPMG network of independent member firms affiliated with KPMG International Cooperative (“KPMG International”), a Swiss entity. All rights reserved. The KPMG name, logo and “cutting through complexity” are registered
trademarks or trademarks of KPMG International. Liability limited by a scheme approved under Professional Standards Legislation.
Arts and Cultural Industries: Scope, Definitions and Terminology
Since arts and culture underpin so many activities, there is a considerable challenge in determining what industries are or are not part of the arts and culture sector. The approach taken in this study is to include the range of activities that specifically involve culture and creativity as well as those activities that add value to cultural and creative works.
The arts and culture sector includes organisations, such as those in the visual and performing arts, which contribute to the economy at the regional and national levels as well as in the export market. The development of the arts and culture sector has led to ‘creative enterprises’, which use both creative human capital and technology to generate wealth in areas such as ‘new media’ or
‘multi-media’ and which include a range of activities in areas such as film and television, broadcasting, computer animation, web design and music. On the other hand, the arts and culture sector is also comprised of a range of ‘knowledge based’ activities including architecture and urban design, industrial design, designer fashion,
writing and publishing. Collecting institutions such as libraries and heritage organisations fall into this
‘knowledge based’ category as they provide the service of knowledge collation, as well as preserving and displaying Victoria’s natural, physical and social heritage.
The arts and culture sector is largely made up of micro businesses or small to medium sized enterprises that focus on local, national and international markets. The sector also includes national, state and local government institutions and agencies which provide direct services. Some of the sector congregates into economic clusters, helping to drive economic growth and development, including by exporting services or goods based on their intellectual property.
This study adopts the Australian Bureau of Statistics (ABS) definition of the cultural industry sector under its Australian Culture and Leisure Classification (ACLC) system. This classification has been developed by the ABS as a step to achieving a common set of classifications, which should in turn enable better data analysis and decision-making.
2The ACLC consists of the following three main parts.
• Industry Classification – lists industries consisting of organisations for which the main activity is the production or provision of culture and leisure goods and services.1
• Production Classification – a list of culture and leisure goods and services (together known as products). These products are the primary output of the industries listed in the ACLC industry classification.
• Occupation Classification – lists occupations which are predominantly ‘culture or leisure’ in nature.
In this study, we broadly define 10 industry sectors, following the Australian Culture and Leisure Classification (ACLC)2 system, to measure their economic impact in the State. The diagram on the following page provides definitions and examples of organisations included in these 10 Victorian arts and culture industry classifications, with more detailed breakdowns provided in Appendix A.
1 Where an organisation produces a culture or leisure good, but that is not its main activity, it would not be included or counted.
2 Australian Bureau of Statistics (2008)
3 | Economic Impact of the Victorian Arts and Cultural Sector
© 2013 KPMG, an Australian partnership and a member firm of the KPMG network of independent member firms affiliated with KPMG International Cooperative (“KPMG International”), a Swiss entity. All rights reserved. The KPMG name, logo and “cutting through complexity” are registered
trademarks or trademarks of KPMG International. Liability limited by a scheme approved under Professional Standards Legislation.
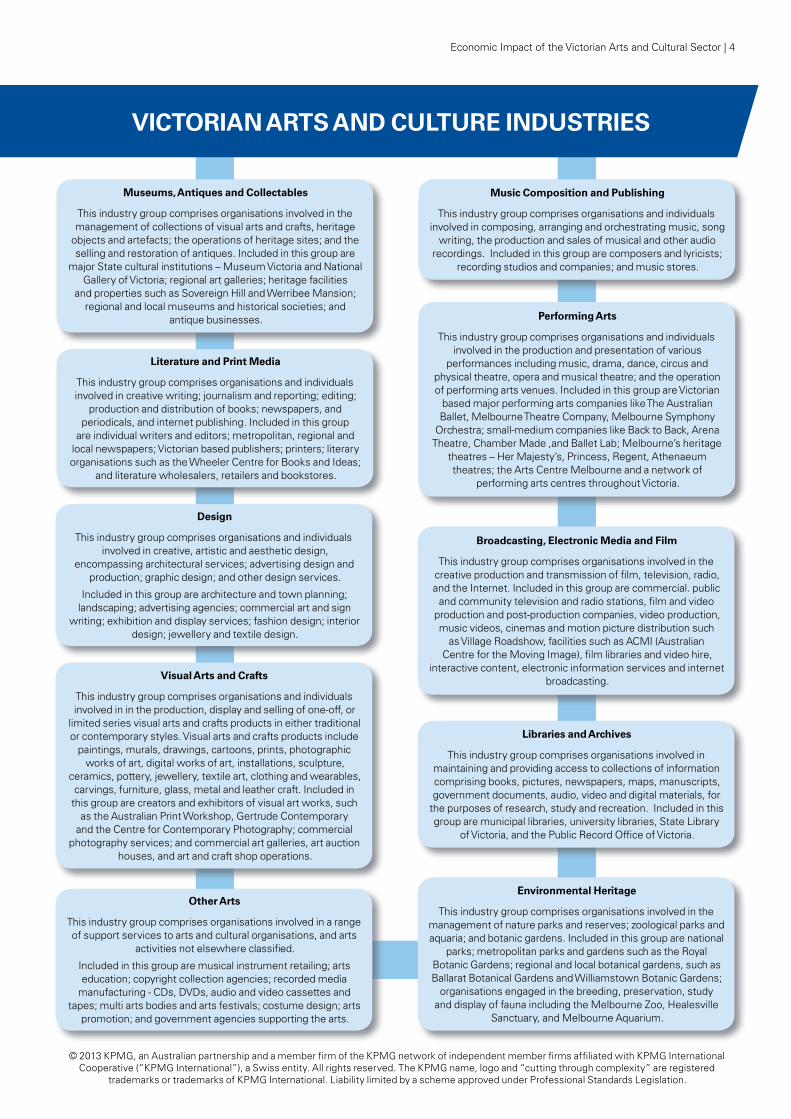
Museums, Antiques and Collectables
This industry group comprises organisations involved in the management of collections of visual arts and crafts, heritage
objects and artefacts; the operations of heritage sites; and the selling and restoration of antiques. Included in this group are
major State cultural institutions – Museum Victoria and National Gallery of Victoria; regional art galleries; heritage facilities
and properties such as Sovereign Hill and Werribee Mansion; regional and local museums and historical societies; and
antique businesses.
Literature and Print Media
This industry group comprises organisations and individuals involved in creative writing; journalism and reporting; editing;
production and distribution of books; newspapers, and periodicals, and internet publishing. Included in this group
are individual writers and editors; metropolitan, regional and local newspapers; Victorian based publishers; printers; literary organisations such as the Wheeler Centre for Books and Ideas;
and literature wholesalers, retailers and bookstores.
Music Composition and Publishing
This industry group comprises organisations and individuals involved in composing, arranging and orchestrating music, song
writing, the production and sales of musical and other audio recordings. Included in this group are composers and lyricists;
recording studios and companies; and music stores.
Performing Arts
This industry group comprises organisations and individuals involved in the production and presentation of various
performances including music, drama, dance, circus and physical theatre, opera and musical theatre; and the operation of performing arts venues. Included in this group are Victorian
based major performing arts companies like The Australian Ballet, Melbourne Theatre Company, Melbourne Symphony
Orchestra; small-medium companies like Back to Back, Arena Theatre, Chamber Made ,and Ballet Lab; Melbourne’s heritage
theatres – Her Majesty’s, Princess, Regent, Athenaeum theatres; the Arts Centre Melbourne and a network of
performing arts centres throughout Victoria.
Design
This industry group comprises organisations and individuals involved in creative, artistic and aesthetic design,
encompassing architectural services; advertising design and production; graphic design; and other design services.
Included in this group are architecture and town planning; landscaping; advertising agencies; commercial art and sign
writing; exhibition and display services; fashion design; interior design; jewellery and textile design.
Visual Arts and Crafts
This industry group comprises organisations and individuals involved in in the production, display and selling of one-off, or
limited series visual arts and crafts products in either traditional or contemporary styles. Visual arts and crafts products include
paintings, murals, drawings, cartoons, prints, photographic works of art, digital works of art, installations, sculpture,
ceramics, pottery, jewellery, textile art, clothing and wearables, carvings, furniture, glass, metal and leather craft. Included in
this group are creators and exhibitors of visual art works, such as the Australian Print Workshop, Gertrude Contemporary
and the Centre for Contemporary Photography; commercial photography services; and commercial art galleries, art auction
houses, and art and craft shop operations.
Other Arts
This industry group comprises organisations involved in a range of support services to arts and cultural organisations, and arts
activities not elsewhere classified.
Included in this group are musical instrument retailing; arts education; copyright collection agencies; recorded media
manufacturing - CDs, DVDs, audio and video cassettes and tapes; multi arts bodies and arts festivals; costume design; arts
promotion; and government agencies supporting the arts.
Broadcasting, Electronic Media and Film
This industry group comprises organisations involved in the creative production and transmission of film, television, radio, and the Internet. Included in this group are commercial. public
and community television and radio stations, film and video production and post-production companies, video production, music videos, cinemas and motion picture distribution such
as Village Roadshow, facilities such as ACMI (Australian Centre for the Moving Image), film libraries and video hire,
interactive content, electronic information services and internet broadcasting.
Libraries and Archives
This industry group comprises organisations involved in maintaining and providing access to collections of information comprising books, pictures, newspapers, maps, manuscripts, government documents, audio, video and digital materials, for
the purposes of research, study and recreation. Included in this group are municipal libraries, university libraries, State Library
of Victoria, and the Public Record Office of Victoria.
Environmental Heritage
This industry group comprises organisations involved in the management of nature parks and reserves; zoological parks and aquaria; and botanic gardens. Included in this group are national
parks; metropolitan parks and gardens such as the Royal Botanic Gardens; regional and local botanical gardens, such as Ballarat Botanical Gardens and Williamstown Botanic Gardens;
organisations engaged in the breeding, preservation, study and display of fauna including the Melbourne Zoo, Healesville
Sanctuary, and Melbourne Aquarium.
VICTORIAn ARTS AnD CuLTuRE InDuSTRIES
Economic Impact of the Victorian Arts and Cultural Sector | 4
© 2013 KPMG, an Australian partnership and a member firm of the KPMG network of independent member firms affiliated with KPMG International Cooperative (“KPMG International”), a Swiss entity. All rights reserved. The KPMG name, logo and “cutting through complexity” are registered
trademarks or trademarks of KPMG International. Liability limited by a scheme approved under Professional Standards Legislation.
Economic Contribution of the Victorian: Arts and Culture Sector3
Some cultural goods and services have creative or artistic elements that are tangible, such as artwork or publications, while others are intangible services, such as musical performance or museum visitations. Some are final goods that are supplied to consumers, such as radio and video broadcasts or a theatre performance, while others are intermediate goods, such as the preparation of sets for film or theatre productions.
What cultural outputs have in common with all other industry outputs is that their production utilises resources of labour and capital as well as intermediate goods and services. The sector generates wealth and creates jobs through the utilisation and commercialisation of their intellectual property.
The analysis of the economic contribution of the arts and culture sector in this study is based on the following components. Comparisons across these measures and fuirther explanation of the results are presented in more detail in Appendix D.
• Output refers to the goods and services produced by an industry or sector. It is the value of these goods and services, produced using a combination of labour, capital, and other goods and services including imports.
• Value added is equivalent to output less goods and services sourced from other suppliers (including imports), and is the sector’s contribution to gross state product. By excluding goods and service inputs from other industries and imports, ‘value added’ avoids double counting
as it does not include the value-added from other industries. In other words, it represents only the value added to products and services that the creative businesses in Victoria produce.
• Employment refers to the number of people employed. This study takes into account total Full Time Equivalent (FTE) jobs, which assumes standard working hours are 37.5 hours a week.
Further, it is recognised that this sector also contributes in other qualitative ways that are not captured in conventional economic statistics. For example, other benefits include contributing to a city’s liveability, and helping to foster knowledge and skills transfers as well as contributing to education outcomes, tourism, destination branding, international image, etc.
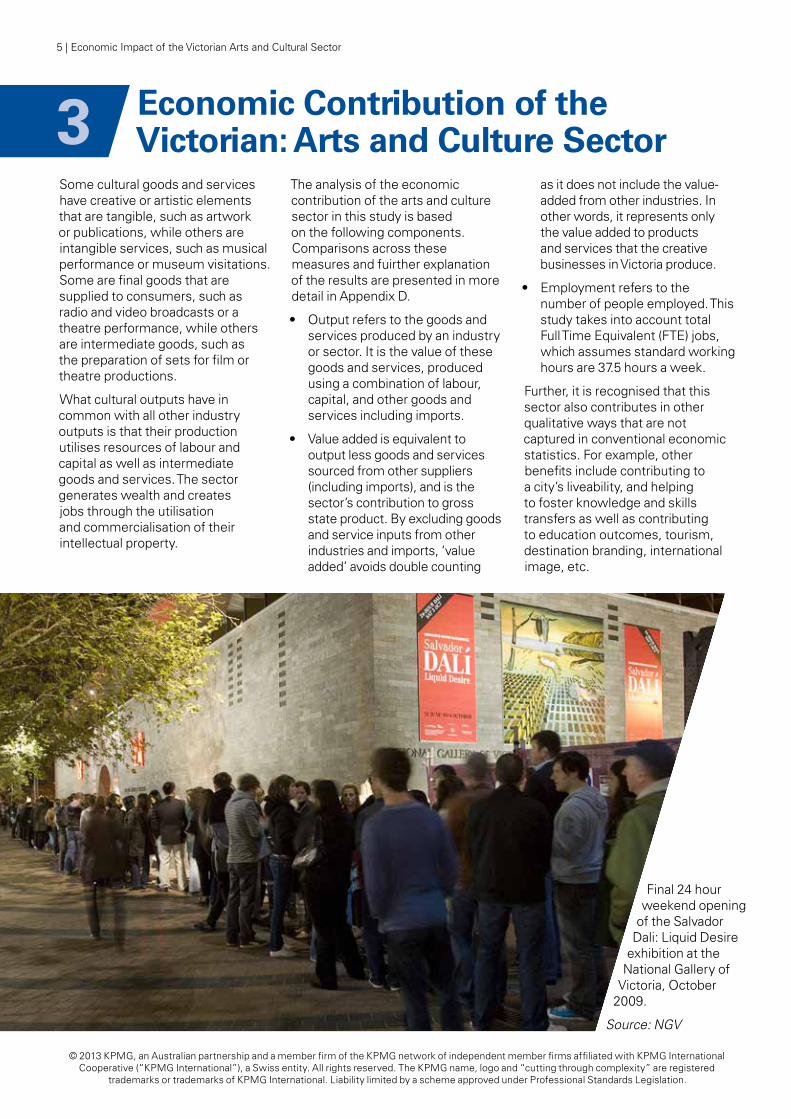
Final 24 hour weekend opening
of the Salvador Dali: Liquid Desire
exhibition at the National Gallery of
Victoria, October 2009.
Source: NGV
5 | Economic Impact of the Victorian Arts and Cultural Sector
© 2013 KPMG, an Australian partnership and a member firm of the KPMG network of independent member firms affiliated with KPMG International Cooperative (“KPMG International”), a Swiss entity. All rights reserved. The KPMG name, logo and “cutting through complexity” are registered
trademarks or trademarks of KPMG International. Liability limited by a scheme approved under Professional Standards Legislation.
Melbourne International Comedy Festival
The Melbourne International Comedy
Festival is one of the highlights of
Melbourne’s major events calendar.
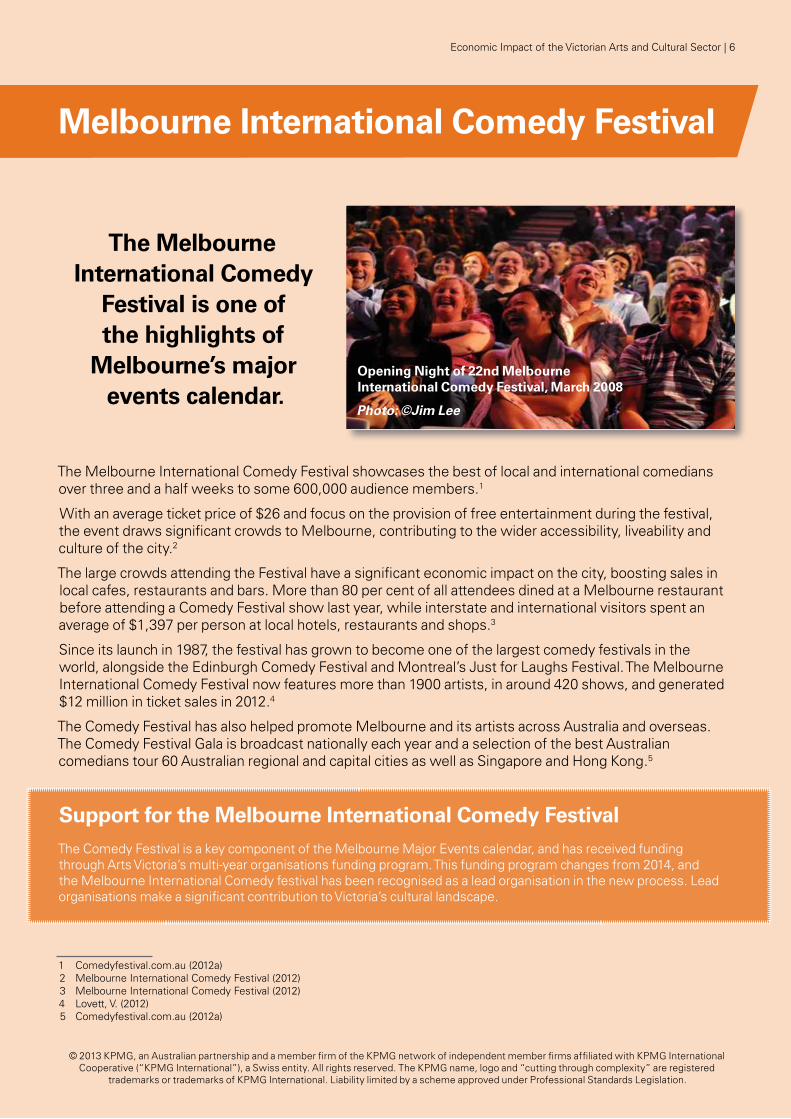
The Melbourne International Comedy Festival showcases the best of local and international comedians over three and a half weeks to some 600,000 audience members.1
With an average ticket price of $26 and focus on the provision of free entertainment during the festival, the event draws significant crowds to Melbourne, contributing to the wider accessibility, liveability and culture of the city.2
The large crowds attending the Festival have a significant economic impact on the city, boosting sales in local cafes, restaurants and bars. More than 80 per cent of all attendees dined at a Melbourne restaurant before attending a Comedy Festival show last year, while interstate and international visitors spent an average of $1,397 per person at local hotels, restaurants and shops.3
Since its launch in 1987, the festival has grown to become one of the largest comedy festivals in the world, alongside the Edinburgh Comedy Festival and Montreal’s Just for Laughs Festival. The Melbourne International Comedy Festival now features more than 1900 artists, in around 420 shows, and generated $12 million in ticket sales in 2012.4
The Comedy Festival has also helped promote Melbourne and its artists across Australia and overseas. The Comedy Festival Gala is broadcast nationally each year and a selection of the best Australian comedians tour 60 Australian regional and capital cities as well as Singapore and Hong Kong.5
Support for the Melbourne International Comedy Festival The Comedy Festival is a key component of the Melbourne Major Events calendar, and has received funding through Arts Victoria’s multi-year organisations funding program. This funding program changes from 2014, and the Melbourne International Comedy festival has been recognised as a lead organisation in the new process. Lead organisations make a significant contribution to Victoria’s cultural landscape.
1 Comedyfestival.com.au (2012a)2 Melbourne International Comedy Festival (2012)3 Melbourne International Comedy Festival (2012)4 Lovett, V. (2012)5 Comedyfestival.com.au (2012a)
Opening night of 22nd Melbourne International Comedy Festival, March 2008
Photo: ©Jim Lee
Economic Impact of the Victorian Arts and Cultural Sector | 6
© 2013 KPMG, an Australian partnership and a member firm of the KPMG network of independent member firms affiliated with KPMG International Cooperative (“KPMG International”), a Swiss entity. All rights reserved. The KPMG name, logo and “cutting through complexity” are registered
trademarks or trademarks of KPMG International. Liability limited by a scheme approved under Professional Standards Legislation.
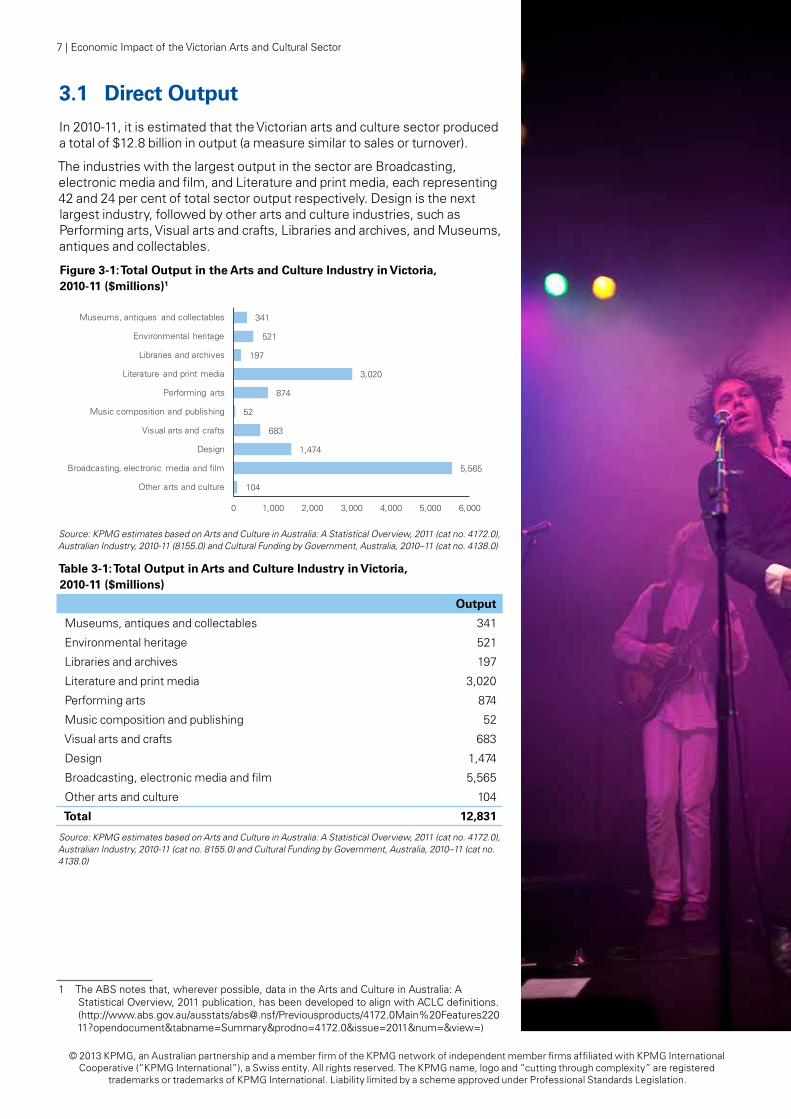
3.1 Direct OutputIn 2010-11, it is estimated that the Victorian arts and culture sector produced a total of $12.8 billion in output (a measure similar to sales or turnover).
The industries with the largest output in the sector are Broadcasting, electronic media and film, and Literature and print media, each representing 42 and 24 per cent of total sector output respectively. Design is the next largest industry, followed by other arts and culture industries, such as Performing arts, Visual arts and crafts, Libraries and archives, and Museums, antiques and collectables.
Figure 3-1: Total Output in the Arts and Culture Industry in Victoria, 2010-11 ($millions)1
Source: KPMG estimates based on Arts and Culture in Australia: A Statistical Overview, 2011 (cat no. 4172.0), Australian Industry, 2010-11 (8155.0) and Cultural Funding by Government, Australia, 2010–11 (cat no. 4138.0)
Table 3-1: Total Output in Arts and Culture Industry in Victoria, 2010-11 ($millions)
Output
Museums, antiques and collectables 341
Environmental heritage 521
Libraries and archives 197
Literature and print media 3,020
Performing arts 874
Music composition and publishing 52
Visual arts and crafts 683
Design 1,474
Broadcasting, electronic media and film 5,565
Other arts and culture 104
Total 12,831
Source: KPMG estimates based on Arts and Culture in Australia: A Statistical Overview, 2011 (cat no. 4172.0), Australian Industry, 2010-11 (cat no. 8155.0) and Cultural Funding by Government, Australia, 2010–11 (cat no. 4138.0)
1 The ABS notes that, wherever possible, data in the Arts and Culture in Australia: A Statistical Overview, 2011 publication, has been developed to align with ACLC definitions. (http://www.abs.gov.au/ausstats/[email protected]/Previousproducts/4172.0Main%20Features22011?opendocument&tabname=Summary&prodno=4172.0&issue=2011&num=&view=)
341
521
197
3,020
874
52
683
1,474
5,565
104
0 1,000 2,000 3,000 4,000 5,000 6,000
Museums, antiques and collectables
Environmental heritage
Libraries and archives
Literature and print media
Performing arts
Music composition and publishing
Visual arts and crafts
Design
Broadcasting, electronic media and film
Other arts and culture
7 | Economic Impact of the Victorian Arts and Cultural Sector
© 2013 KPMG, an Australian partnership and a member firm of the KPMG network of independent member firms affiliated with KPMG International Cooperative (“KPMG International”), a Swiss entity. All rights reserved. The KPMG name, logo and “cutting through complexity” are registered
trademarks or trademarks of KPMG International. Liability limited by a scheme approved under Professional Standards Legislation.
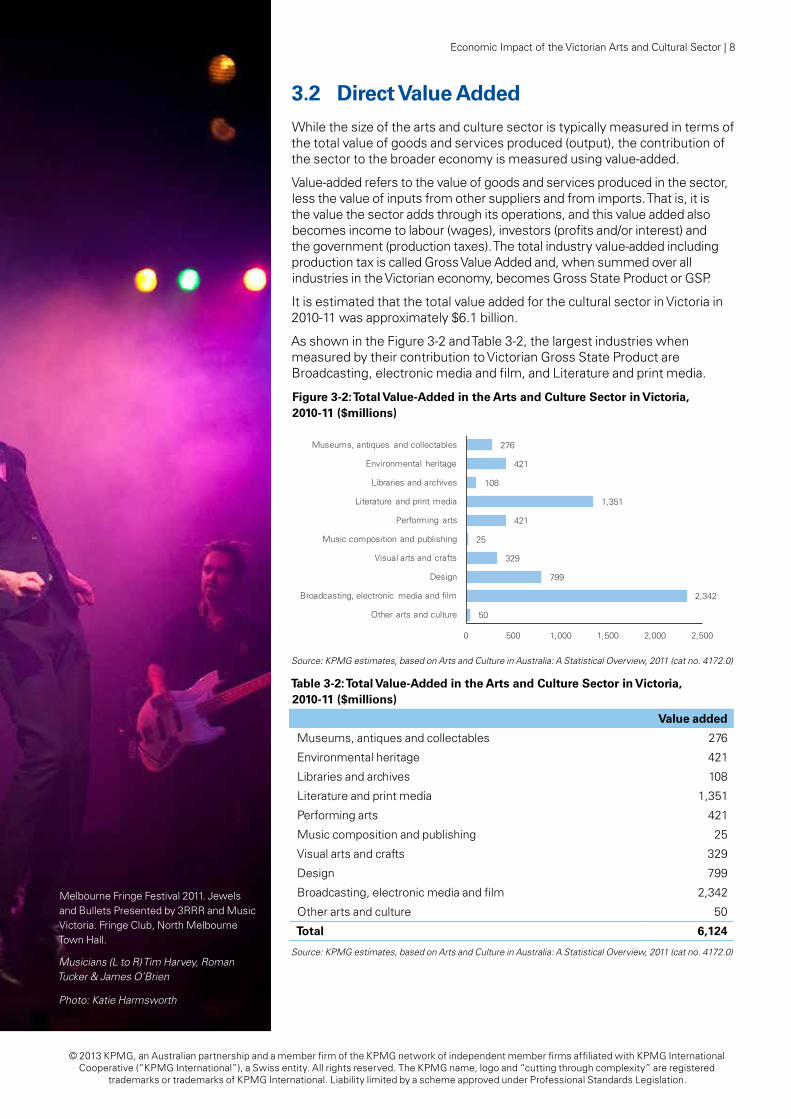
3.2 Direct Value AddedWhile the size of the arts and culture sector is typically measured in terms of the total value of goods and services produced (output), the contribution of the sector to the broader economy is measured using value-added.
Value-added refers to the value of goods and services produced in the sector, less the value of inputs from other suppliers and from imports. That is, it is the value the sector adds through its operations, and this value added also becomes income to labour (wages), investors (profits and/or interest) and the government (production taxes). The total industry value-added including production tax is called Gross Value Added and, when summed over all industries in the Victorian economy, becomes Gross State Product or GSP.
It is estimated that the total value added for the cultural sector in Victoria in 2010-11 was approximately $6.1 billion.
As shown in the Figure 3-2 and Table 3-2, the largest industries when measured by their contribution to Victorian Gross State Product are Broadcasting, electronic media and film, and Literature and print media.
Figure 3-2: Total Value-Added in the Arts and Culture Sector in Victoria, 2010-11 ($millions)
Source: KPMG estimates, based on Arts and Culture in Australia: A Statistical Overview, 2011 (cat no. 4172.0)
Table 3-2: Total Value-Added in the Arts and Culture Sector in Victoria, 2010-11 ($millions)
Value added
Museums, antiques and collectables 276
Environmental heritage 421
Libraries and archives 108
Literature and print media 1,351
Performing arts 421
Music composition and publishing 25
Visual arts and crafts 329
Design 799
Broadcasting, electronic media and film 2,342
Other arts and culture 50
Total 6,124
Source: KPMG estimates, based on Arts and Culture in Australia: A Statistical Overview, 2011 (cat no. 4172.0)
276
421
108
1,351
421
25
329
799
2,342
50
0 500 1,000 1,500 2,000 2,500
Museums, antiques and collectables
Environmental heritage
Libraries and archives
Literature and print media
Performing arts
Music composition and publishing
Visual arts and crafts
Design
Broadcasting, electronic media and film
Other arts and culture
Melbourne Fringe Festival 2011. Jewels and Bullets Presented by 3RRR and Music Victoria. Fringe Club, North Melbourne Town Hall.
Musicians (L to R) Tim Harvey, Roman Tucker & James O’Brien
Photo: Katie Harmsworth
Economic Impact of the Victorian Arts and Cultural Sector | 8
© 2013 KPMG, an Australian partnership and a member firm of the KPMG network of independent member firms affiliated with KPMG International Cooperative (“KPMG International”), a Swiss entity. All rights reserved. The KPMG name, logo and “cutting through complexity” are registered
trademarks or trademarks of KPMG International. Liability limited by a scheme approved under Professional Standards Legislation.
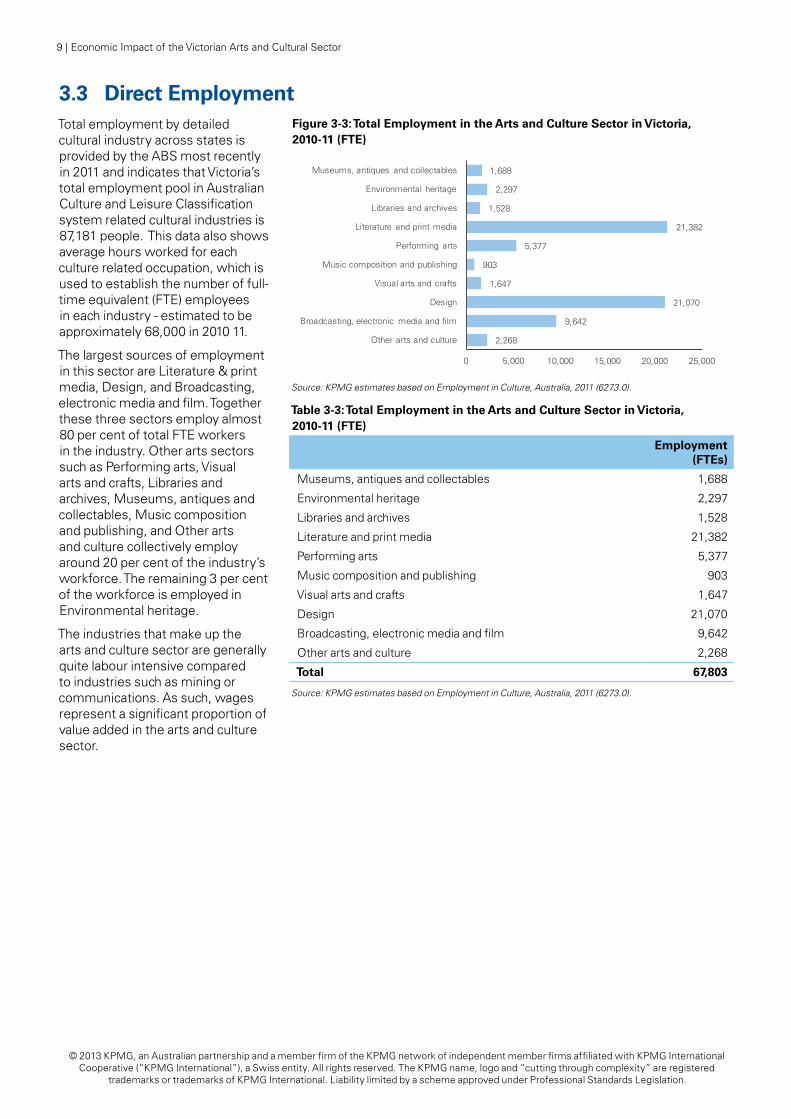
3.3 Direct EmploymentTotal employment by detailed cultural industry across states is provided by the ABS most recently in 2011 and indicates that Victoria’s total employment pool in Australian Culture and Leisure Classification system related cultural industries is 87,181 people. This data also shows average hours worked for each culture related occupation, which is used to establish the number of full-time equivalent (FTE) employees in each industry - estimated to be approximately 68,000 in 2010 11.
The largest sources of employment in this sector are Literature & print media, Design, and Broadcasting, electronic media and film. Together these three sectors employ almost 80 per cent of total FTE workers in the industry. Other arts sectors such as Performing arts, Visual arts and crafts, Libraries and archives, Museums, antiques and collectables, Music composition and publishing, and Other arts and culture collectively employ around 20 per cent of the industry’s workforce. The remaining 3 per cent of the workforce is employed in Environmental heritage.
The industries that make up the arts and culture sector are generally quite labour intensive compared to industries such as mining or communications. As such, wages represent a significant proportion of value added in the arts and culture sector.
1,688
2,297
1,528
21,382
5,377
903
1,647
21,070
9,642
2,268
0 5,000 10,000 15,000 20,000 25,000
Museums, antiques and collectables
Environmental heritage
Libraries and archives
Literature and print media
Performing arts
Music composition and publishing
Visual arts and crafts
Design
Broadcasting, electronic media and film
Other arts and culture
Figure 3-3: Total Employment in the Arts and Culture Sector in Victoria, 2010-11 (FTE)
Source: KPMG estimates based on Employment in Culture, Australia, 2011 (6273.0).
Table 3-3: Total Employment in the Arts and Culture Sector in Victoria, 2010-11 (FTE)
Employment (FTEs)
Museums, antiques and collectables 1,688
Environmental heritage 2,297
Libraries and archives 1,528
Literature and print media 21,382
Performing arts 5,377
Music composition and publishing 903
Visual arts and crafts 1,647
Design 21,070
Broadcasting, electronic media and film 9,642
Other arts and culture 2,268
Total 67,803
Source: KPMG estimates based on Employment in Culture, Australia, 2011 (6273.0).
9 | Economic Impact of the Victorian Arts and Cultural Sector
© 2013 KPMG, an Australian partnership and a member firm of the KPMG network of independent member firms affiliated with KPMG International Cooperative (“KPMG International”), a Swiss entity. All rights reserved. The KPMG name, logo and “cutting through complexity” are registered
trademarks or trademarks of KPMG International. Liability limited by a scheme approved under Professional Standards Legislation.
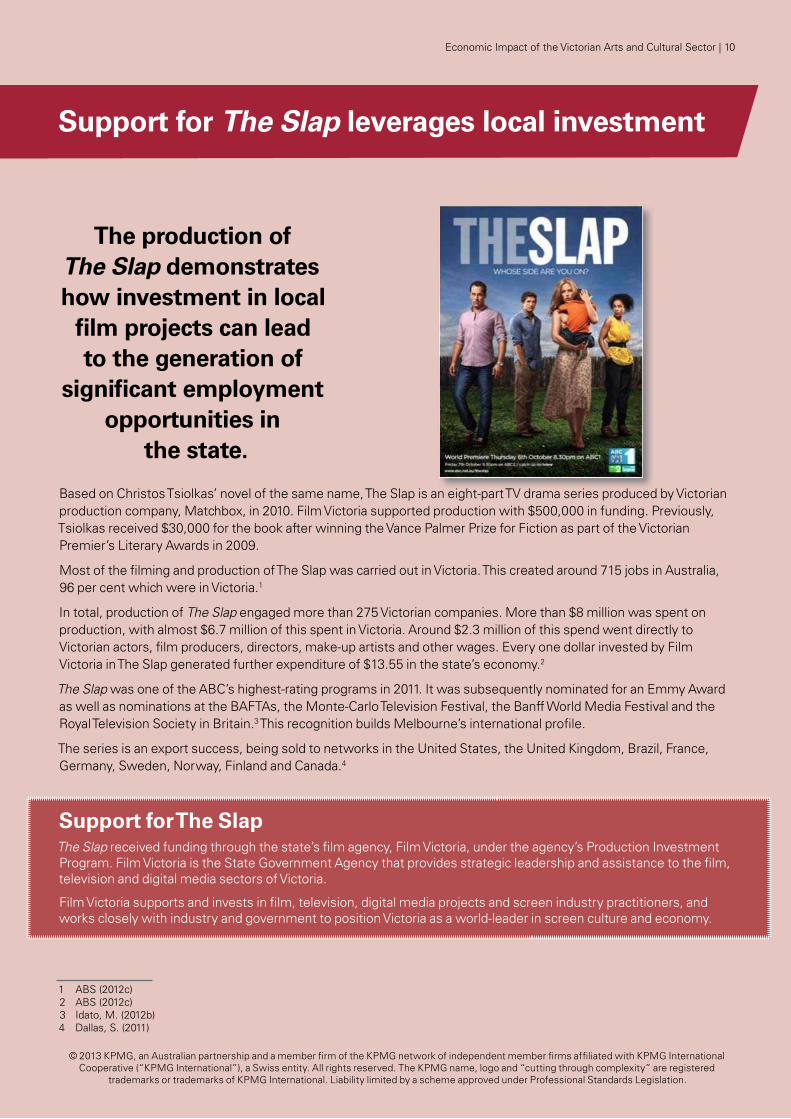
Support for The Slap leverages local investment
The production of The Slap demonstrates how investment in local
film projects can lead to the generation of
significant employment opportunities in
the state.
Based on Christos Tsiolkas’ novel of the same name, The Slap is an eight-part TV drama series produced by Victorian production company, Matchbox, in 2010. Film Victoria supported production with $500,000 in funding. Previously, Tsiolkas received $30,000 for the book after winning the Vance Palmer Prize for Fiction as part of the Victorian Premier’s Literary Awards in 2009.
Most of the filming and production of The Slap was carried out in Victoria. This created around 715 jobs in Australia, 96 per cent which were in Victoria.1
In total, production of The Slap engaged more than 275 Victorian companies. More than $8 million was spent on production, with almost $6.7 million of this spent in Victoria. Around $2.3 million of this spend went directly to Victorian actors, film producers, directors, make-up artists and other wages. Every one dollar invested by Film Victoria in The Slap generated further expenditure of $13.55 in the state’s economy.2
The Slap was one of the ABC’s highest-rating programs in 2011. It was subsequently nominated for an Emmy Award as well as nominations at the BAFTAs, the Monte-Carlo Television Festival, the Banff World Media Festival and the Royal Television Society in Britain.3 This recognition builds Melbourne’s international profile.
The series is an export success, being sold to networks in the United States, the United Kingdom, Brazil, France, Germany, Sweden, Norway, Finland and Canada.4
Support for The Slap The Slap received funding through the state’s film agency, Film Victoria, under the agency’s Production Investment Program. Film Victoria is the State Government Agency that provides strategic leadership and assistance to the film, television and digital media sectors of Victoria.
Film Victoria supports and invests in film, television, digital media projects and screen industry practitioners, and works closely with industry and government to position Victoria as a world-leader in screen culture and economy.
1 ABS (2012c)2 ABS (2012c)3 Idato, M. (2012b)4 Dallas, S. (2011)
Economic Impact of the Victorian Arts and Cultural Sector | 10
© 2013 KPMG, an Australian partnership and a member firm of the KPMG network of independent member firms affiliated with KPMG International Cooperative (“KPMG International”), a Swiss entity. All rights reserved. The KPMG name, logo and “cutting through complexity” are registered
trademarks or trademarks of KPMG International. Liability limited by a scheme approved under Professional Standards Legislation.
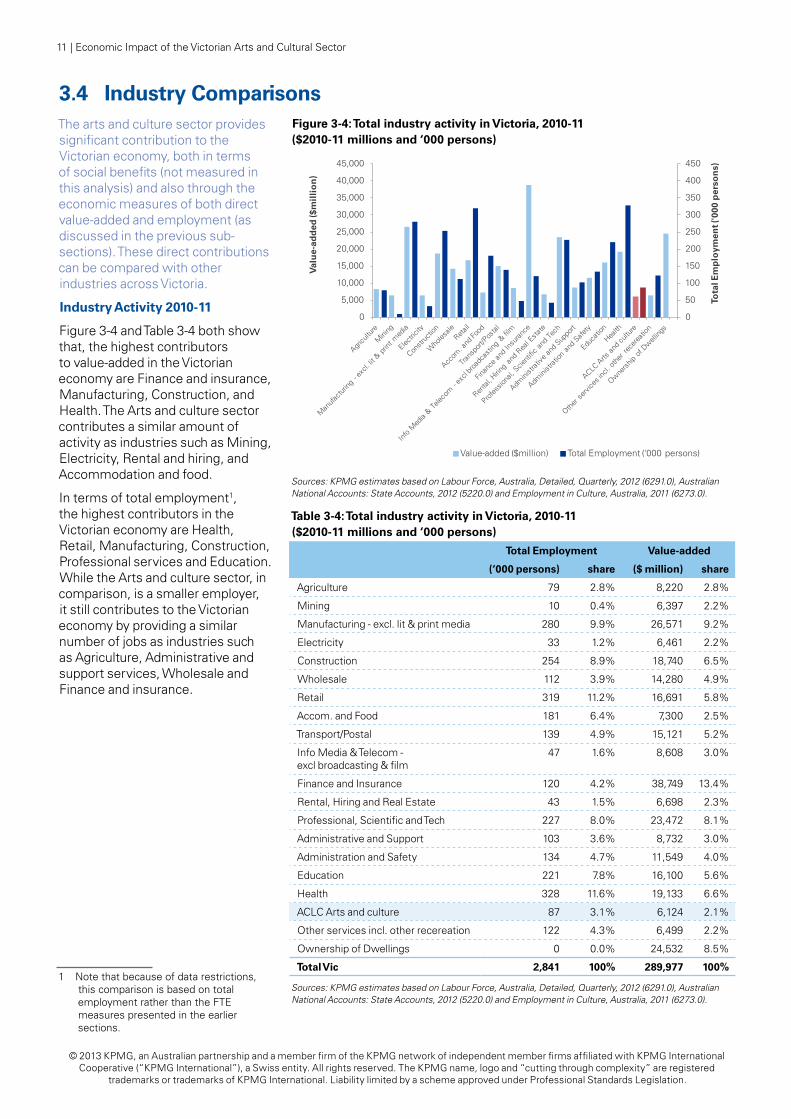
3.4 Industry ComparisonsThe arts and culture sector provides significant contribution to the Victorian economy, both in terms of social benefits (not measured in this analysis) and also through the economic measures of both direct value-added and employment (as discussed in the previous sub-sections). These direct contributions can be compared with other industries across Victoria.
Industry Activity 2010-11
Figure 3-4 and Table 3-4 both show that, the highest contributors to value-added in the Victorian economy are Finance and insurance, Manufacturing, Construction, and Health. The Arts and culture sector contributes a similar amount of activity as industries such as Mining, Electricity, Rental and hiring, and Accommodation and food.
In terms of total employment1, the highest contributors in the Victorian economy are Health, Retail, Manufacturing, Construction, Professional services and Education. While the Arts and culture sector, in comparison, is a smaller employer, it still contributes to the Victorian economy by providing a similar number of jobs as industries such as Agriculture, Administrative and support services, Wholesale and Finance and insurance.
1 Note that because of data restrictions, this comparison is based on total employment rather than the FTE measures presented in the earlier sections.
0
50
100
150
200
250
300
350
400
450
0
5,000
10,000
15,000
20,000
25,000
30,000
35,000
40,000
45,000
Tota
l Em
plo
ymen
t ('0
00 p
erso
ns)
Val
ue-
add
ed ($
mil
lio
n)
Value-added ($million) Total Employment ('000 persons)
Figure 3-4: Total industry activity in Victoria, 2010-11 ($2010-11 millions and ‘000 persons)
Sources: KPMG estimates based on Labour Force, Australia, Detailed, Quarterly, 2012 (6291.0), Australian National Accounts: State Accounts, 2012 (5220.0) and Employment in Culture, Australia, 2011 (6273.0).
Table 3-4: Total industry activity in Victoria, 2010-11 ($2010-11 millions and ‘000 persons)
Total Employment Value-added
(‘000 persons) share ($ million) share
Agriculture 79 2.8% 8,220 2.8%
Mining 10 0.4% 6,397 2.2%
Manufacturing - excl. lit & print media 280 9.9% 26,571 9.2%
Electricity 33 1.2% 6,461 2.2%
Construction 254 8.9% 18,740 6.5%
Wholesale 112 3.9% 14,280 4.9%
Retail 319 11.2% 16,691 5.8%
Accom. and Food 181 6.4% 7,300 2.5%
Transport/Postal 139 4.9% 15,121 5.2%
Info Media & Telecom - excl broadcasting & film
47 1.6% 8,608 3.0%
Finance and Insurance 120 4.2% 38,749 13.4%
Rental, Hiring and Real Estate 43 1.5% 6,698 2.3%
Professional, Scientific and Tech 227 8.0% 23,472 8.1%
Administrative and Support 103 3.6% 8,732 3.0%
Administration and Safety 134 4.7% 11,549 4.0%
Education 221 7.8% 16,100 5.6%
Health 328 11.6% 19,133 6.6%
ACLC Arts and culture 87 3.1% 6,124 2.1%
Other services incl. other recereation 122 4.3% 6,499 2.2%
Ownership of Dwellings 0 0.0% 24,532 8.5%
Total Vic 2,841 100% 289,977 100%
Sources: KPMG estimates based on Labour Force, Australia, Detailed, Quarterly, 2012 (6291.0), Australian National Accounts: State Accounts, 2012 (5220.0) and Employment in Culture, Australia, 2011 (6273.0).
11 | Economic Impact of the Victorian Arts and Cultural Sector
© 2013 KPMG, an Australian partnership and a member firm of the KPMG network of independent member firms affiliated with KPMG International Cooperative (“KPMG International”), a Swiss entity. All rights reserved. The KPMG name, logo and “cutting through complexity” are registered
trademarks or trademarks of KPMG International. Liability limited by a scheme approved under Professional Standards Legislation.
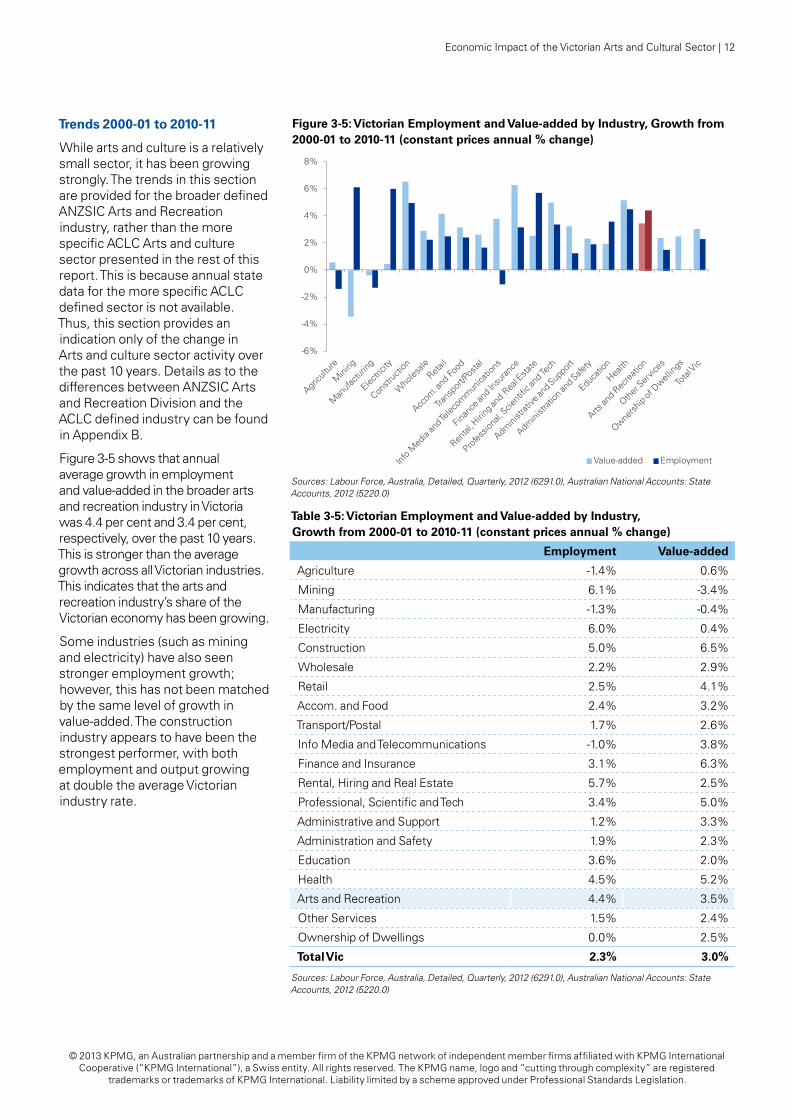
Trends 2000-01 to 2010-11
While arts and culture is a relatively small sector, it has been growing strongly. The trends in this section are provided for the broader defined ANZSIC Arts and Recreation industry, rather than the more specific ACLC Arts and culture sector presented in the rest of this report. This is because annual state data for the more specific ACLC defined sector is not available. Thus, this section provides an indication only of the change in Arts and culture sector activity over the past 10 years. Details as to the differences between ANZSIC Arts and Recreation Division and the ACLC defined industry can be found in Appendix B.
Figure 3-5 shows that annual average growth in employment and value-added in the broader arts and recreation industry in Victoria was 4.4 per cent and 3.4 per cent, respectively, over the past 10 years. This is stronger than the average growth across all Victorian industries. This indicates that the arts and recreation industry’s share of the Victorian economy has been growing.
Some industries (such as mining and electricity) have also seen stronger employment growth; however, this has not been matched by the same level of growth in value-added. The construction industry appears to have been the strongest performer, with both employment and output growing at double the average Victorian industry rate.
Figure 3-5: Victorian Employment and Value-added by Industry, Growth from 2000-01 to 2010-11 (constant prices annual % change)
Sources: Labour Force, Australia, Detailed, Quarterly, 2012 (6291.0), Australian National Accounts: State Accounts, 2012 (5220.0)
Table 3-5: Victorian Employment and Value-added by Industry, Growth from 2000-01 to 2010-11 (constant prices annual % change)
Employment Value-added
Agriculture -1.4% 0.6%
Mining 6.1% -3.4%
Manufacturing -1.3% -0.4%
Electricity 6.0% 0.4%
Construction 5.0% 6.5%
Wholesale 2.2% 2.9%
Retail 2.5% 4.1%
Accom. and Food 2.4% 3.2%
Transport/Postal 1.7% 2.6%
Info Media and Telecommunications -1.0% 3.8%
Finance and Insurance 3.1% 6.3%
Rental, Hiring and Real Estate 5.7% 2.5%
Professional, Scientific and Tech 3.4% 5.0%
Administrative and Support 1.2% 3.3%
Administration and Safety 1.9% 2.3%
Education 3.6% 2.0%
Health 4.5% 5.2%
Arts and Recreation 4.4% 3.5%
Other Services 1.5% 2.4%
Ownership of Dwellings 0.0% 2.5%
Total Vic 2.3% 3.0%
Sources: Labour Force, Australia, Detailed, Quarterly, 2012 (6291.0), Australian National Accounts: State Accounts, 2012 (5220.0)
-6%
-4%
-2%
0%
2%
4%
6%
8%
Value-added Employment
Economic Impact of the Victorian Arts and Cultural Sector | 12
© 2013 KPMG, an Australian partnership and a member firm of the KPMG network of independent member firms affiliated with KPMG International Cooperative (“KPMG International”), a Swiss entity. All rights reserved. The KPMG name, logo and “cutting through complexity” are registered
trademarks or trademarks of KPMG International. Liability limited by a scheme approved under Professional Standards Legislation.
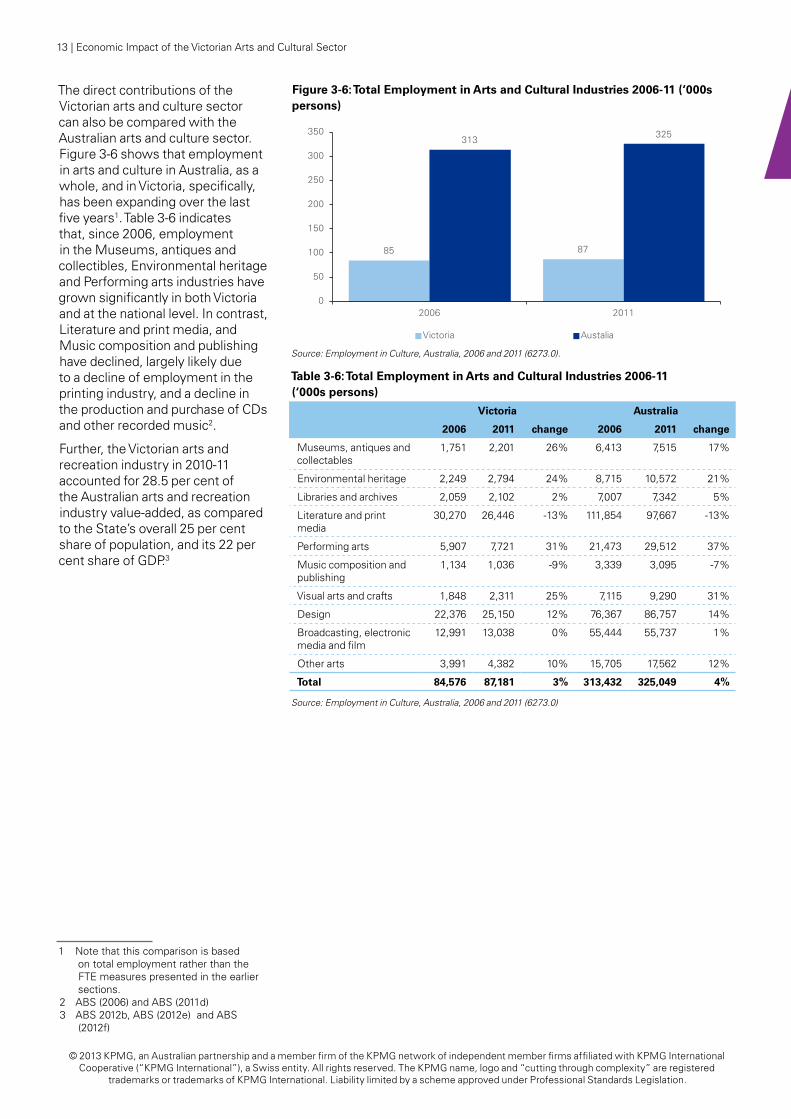
The direct contributions of the Victorian arts and culture sector can also be compared with the Australian arts and culture sector. Figure 3-6 shows that employment in arts and culture in Australia, as a whole, and in Victoria, specifically, has been expanding over the last five years1. Table 3-6 indicates that, since 2006, employment in the Museums, antiques and collectibles, Environmental heritage and Performing arts industries have grown significantly in both Victoria and at the national level. In contrast, Literature and print media, and Music composition and publishing have declined, largely likely due to a decline of employment in the printing industry, and a decline in the production and purchase of CDs and other recorded music2.
Further, the Victorian arts and recreation industry in 2010-11 accounted for 28.5 per cent of the Australian arts and recreation industry value-added, as compared to the State’s overall 25 per cent share of population, and its 22 per cent share of GDP.3
1 Note that this comparison is based on total employment rather than the FTE measures presented in the earlier sections.
2 ABS (2006) and ABS (2011d)3 ABS 2012b, ABS (2012e) and ABS
(2012f)
Figure 3-6: Total Employment in Arts and Cultural Industries 2006-11 (‘000s persons)
Source: Employment in Culture, Australia, 2006 and 2011 (6273.0).
Table 3-6: Total Employment in Arts and Cultural Industries 2006-11 (‘000s persons)
Victoria Australia
2006 2011 change 2006 2011 change
Museums, antiques and collectables
1,751 2,201 26% 6,413 7,515 17%
Environmental heritage 2,249 2,794 24% 8,715 10,572 21%
Libraries and archives 2,059 2,102 2% 7,007 7,342 5%
Literature and print media
30,270 26,446 -13% 111,854 97,667 -13%
Performing arts 5,907 7,721 31% 21,473 29,512 37%
Music composition and publishing
1,134 1,036 -9% 3,339 3,095 -7%
Visual arts and crafts 1,848 2,311 25% 7,115 9,290 31%
Design 22,376 25,150 12% 76,367 86,757 14%
Broadcasting, electronic media and film
12,991 13,038 0% 55,444 55,737 1%
Other arts 3,991 4,382 10% 15,705 17,562 12%
Total 84,576 87,181 3% 313,432 325,049 4%
Source: Employment in Culture, Australia, 2006 and 2011 (6273.0)
85 87
313 325
0
50
100
150
200
250
300
350
2006 2011
Victoria Austalia
13 | Economic Impact of the Victorian Arts and Cultural Sector
© 2013 KPMG, an Australian partnership and a member firm of the KPMG network of independent member firms affiliated with KPMG International Cooperative (“KPMG International”), a Swiss entity. All rights reserved. The KPMG name, logo and “cutting through complexity” are registered
trademarks or trademarks of KPMG International. Liability limited by a scheme approved under Professional Standards Legislation.
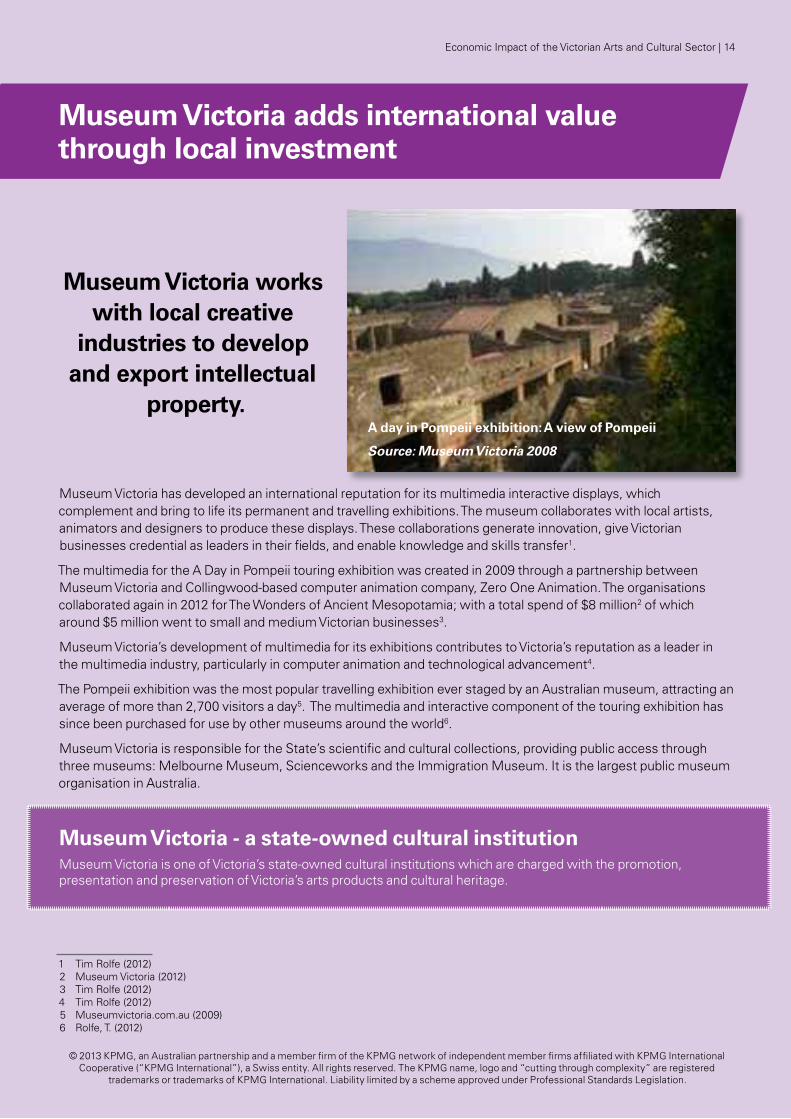
Museum Victoria adds international value through local investment
Museum Victoria works with local creative
industries to develop and export intellectual
property.
Museum Victoria has developed an international reputation for its multimedia interactive displays, which complement and bring to life its permanent and travelling exhibitions. The museum collaborates with local artists, animators and designers to produce these displays. These collaborations generate innovation, give Victorian businesses credential as leaders in their fields, and enable knowledge and skills transfer1.
The multimedia for the A Day in Pompeii touring exhibition was created in 2009 through a partnership between Museum Victoria and Collingwood-based computer animation company, Zero One Animation. The organisations collaborated again in 2012 for The Wonders of Ancient Mesopotamia; with a total spend of $8 million2 of which around $5 million went to small and medium Victorian businesses3.
Museum Victoria’s development of multimedia for its exhibitions contributes to Victoria’s reputation as a leader in the multimedia industry, particularly in computer animation and technological advancement4.
The Pompeii exhibition was the most popular travelling exhibition ever staged by an Australian museum, attracting an average of more than 2,700 visitors a day5. The multimedia and interactive component of the touring exhibition has since been purchased for use by other museums around the world6.
Museum Victoria is responsible for the State’s scientific and cultural collections, providing public access through three museums: Melbourne Museum, Scienceworks and the Immigration Museum. It is the largest public museum organisation in Australia.
Museum Victoria - a state-owned cultural institution Museum Victoria is one of Victoria’s state-owned cultural institutions which are charged with the promotion, presentation and preservation of Victoria’s arts products and cultural heritage.
1 Tim Rolfe (2012)2 Museum Victoria (2012)3 Tim Rolfe (2012)4 Tim Rolfe (2012)5 Museumvictoria.com.au (2009)6 Rolfe, T. (2012)
A day in Pompeii exhibition: A view of Pompeii
Source: Museum Victoria 2008
Economic Impact of the Victorian Arts and Cultural Sector | 14
© 2013 KPMG, an Australian partnership and a member firm of the KPMG network of independent member firms affiliated with KPMG International Cooperative (“KPMG International”), a Swiss entity. All rights reserved. The KPMG name, logo and “cutting through complexity” are registered
trademarks or trademarks of KPMG International. Liability limited by a scheme approved under Professional Standards Legislation.
3.5 Induced TourismCultural tourism has been identified as a new growth area for Australian tourism, attracting increasing numbers of domestic and international visitors1.
While Tourism Research Australia defines a cultural and heritage visitor as a visitor who attends one cultural or heritage activity, it is likely that tourists who only attend one cultural and heritage attraction may be coming to Victoria for other purposes. As such, this analysis defines tourists who attend at least three cultural attractions during their visit as being ‘induced cultural tourists’ or tourists that are induced to travel to Victoria because of cultural and heritage attractions.
Tourism Research Australia provides statistics on the proportion of visitors who attend three or more cultural events. In Victoria, this may include activities such as:
• attending theatre, concerts or other performing arts;
• visiting museums or art galleries;
• visiting art, craft workshops or studios;
• attending festivals, fairs, or cultural events;
• experiencing Aboriginal art, craft and cultural displays;
• visiting an Aboriginal site or community; or
• visiting historical or heritage buildings, sites or monuments2.
1 CRC for Sustainable Tourism (2008)2 Tourism Research Australia (2009)
In 2009, within Australia, Melbourne’s share of domestic and international cultural tourists was second only to Sydney3. Moreover, international tourist arrivals in Melbourne have been growing, with growth of 5.5 per cent measured in the year to March 20124. Victoria’s success in attracting tourists is due, in part, to the state’s lively arts scene. Throughout Victoria, there are numerous major cultural institutions, theatres, galleries, live music venues, as well as a variety of high profile popular events, including the Melbourne International Arts Festival, the Melbourne International Comedy Festival, the Port Fairy Folk Festival, the Wangaratta Jazz Festival, the Melbourne International Film Festival, and major exhibitions such as A Day in Pompeii, Napoleon: Revolution to Empire or Grace Kelly: Style Icon in Bendigo, and the Melbourne Fringe Festival5.
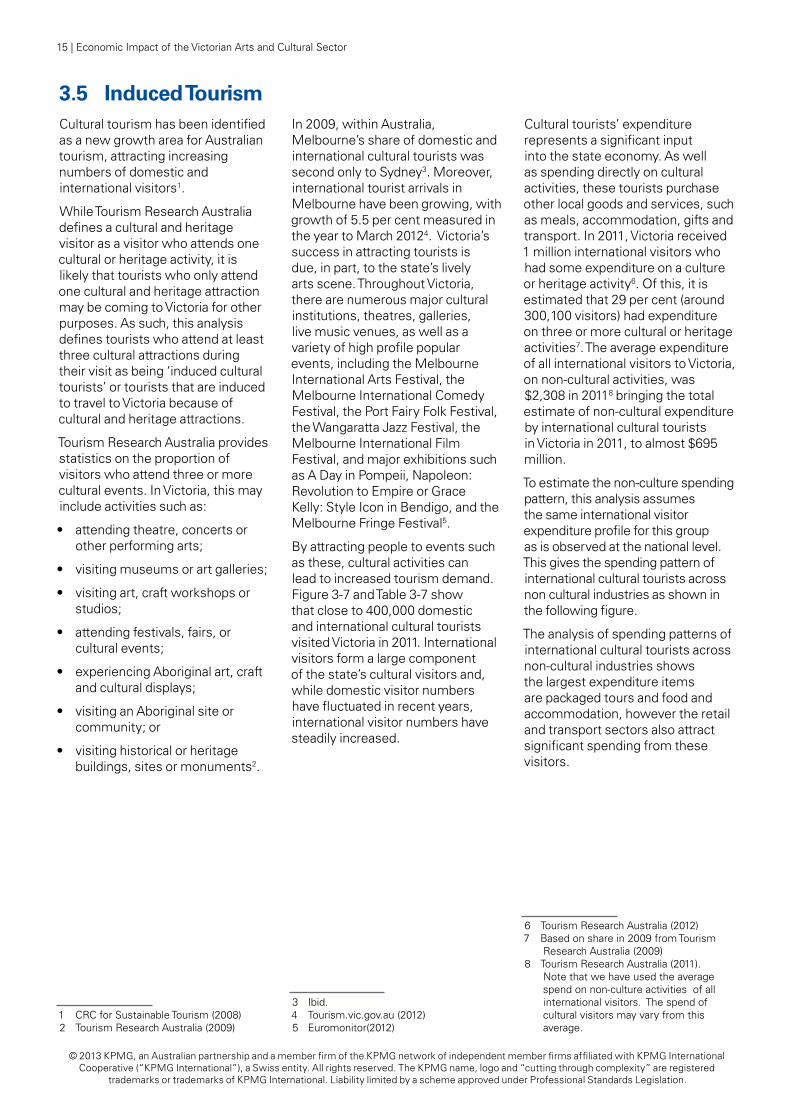
By attracting people to events such as these, cultural activities can lead to increased tourism demand. Figure 3-7 and Table 3-7 show that close to 400,000 domestic and international cultural tourists visited Victoria in 2011. International visitors form a large component of the state’s cultural visitors and, while domestic visitor numbers have fluctuated in recent years, international visitor numbers have steadily increased.
3 Ibid.4 Tourism.vic.gov.au (2012)5 Euromonitor(2012)
Cultural tourists’ expenditure represents a significant input into the state economy. As well as spending directly on cultural activities, these tourists purchase other local goods and services, such as meals, accommodation, gifts and transport. In 2011, Victoria received 1 million international visitors who had some expenditure on a culture or heritage activity6. Of this, it is estimated that 29 per cent (around 300,100 visitors) had expenditure on three or more cultural or heritage activities7. The average expenditure of all international visitors to Victoria, on non-cultural activities, was $2,308 in 20118 bringing the total estimate of non-cultural expenditure by international cultural tourists in Victoria in 2011, to almost $695 million.
To estimate the non-culture spending pattern, this analysis assumes the same international visitor expenditure profile for this group as is observed at the national level. This gives the spending pattern of international cultural tourists across non cultural industries as shown in the following figure.
The analysis of spending patterns of international cultural tourists across non-cultural industries shows the largest expenditure items are packaged tours and food and accommodation, however the retail and transport sectors also attract significant spending from these visitors.
6 Tourism Research Australia (2012)7 Based on share in 2009 from Tourism
Research Australia (2009)8 Tourism Research Australia (2011).
Note that we have used the average spend on non-culture activities of all international visitors. The spend of cultural visitors may vary from this average.
15 | Economic Impact of the Victorian Arts and Cultural Sector
© 2013 KPMG, an Australian partnership and a member firm of the KPMG network of independent member firms affiliated with KPMG International Cooperative (“KPMG International”), a Swiss entity. All rights reserved. The KPMG name, logo and “cutting through complexity” are registered
trademarks or trademarks of KPMG International. Liability limited by a scheme approved under Professional Standards Legislation.
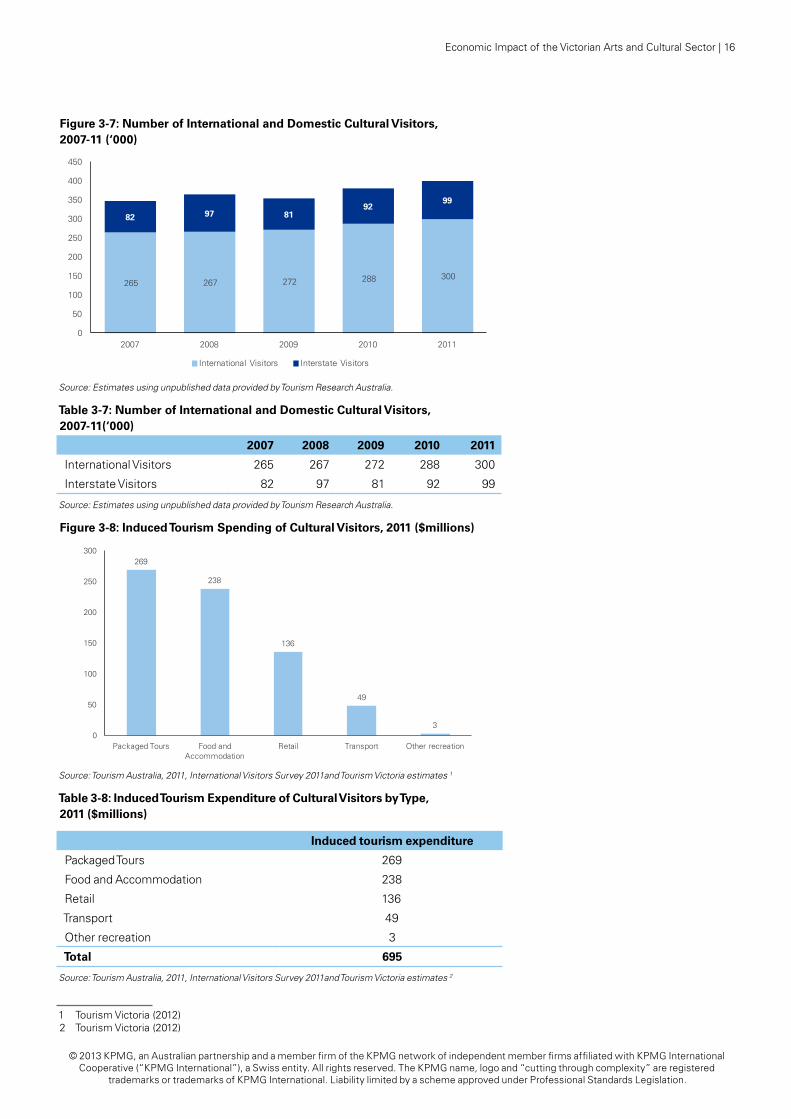
Figure 3-7: number of International and Domestic Cultural Visitors, 2007-11 (‘000)
Source: Estimates using unpublished data provided by Tourism Research Australia.
Table 3-7: number of International and Domestic Cultural Visitors, 2007-11(‘000)
2007 2008 2009 2010 2011
International Visitors 265 267 272 288 300
Interstate Visitors 82 97 81 92 99
Source: Estimates using unpublished data provided by Tourism Research Australia.
Figure 3-8: Induced Tourism Spending of Cultural Visitors, 2011 ($millions)
Source: Tourism Australia, 2011, International Visitors Survey 2011and Tourism Victoria estimates 1
Table 3-8: Induced Tourism Expenditure of Cultural Visitors by Type, 2011 ($millions)
Induced tourism expenditure
Packaged Tours 269
Food and Accommodation 238
Retail 136
Transport 49
Other recreation 3
Total 695
Source: Tourism Australia, 2011, International Visitors Survey 2011and Tourism Victoria estimates 2
1 Tourism Victoria (2012)2 Tourism Victoria (2012)
265 267 272 288 300
82 97 8192
99
0
50
100
150
200
250
300
350
400
450
2007 2008 2009 2010 2011
International Visitors Interstate Visitors
269
238
136
49
30
50
100
150
200
250
300
Packaged Tours Food and Accommodation
Retail Transport Other recreation
Economic Impact of the Victorian Arts and Cultural Sector | 16
© 2013 KPMG, an Australian partnership and a member firm of the KPMG network of independent member firms affiliated with KPMG International Cooperative (“KPMG International”), a Swiss entity. All rights reserved. The KPMG name, logo and “cutting through complexity” are registered
trademarks or trademarks of KPMG International. Liability limited by a scheme approved under Professional Standards Legislation.
3.6 Total Contribution of the Arts and Culture SectorThe arts and culture sector has backward and forward linkages in the supply chain, where inputs to and outputs of the arts and cultural sector are sourced from, or demanded by, other businesses/industries. For example, a set designer may purchase timber to construct a set that is used in a commercial for financial services. The timber is an input to the set design - which in turn is an input to the Film, radio and TV industries production - and the commercial is the output of the Film, radio and TV industry - which is purchased as an input by the finance and insurance industry.
Thus, the arts and culture sector contributes to business activity across many industries, from manufacturing and construction to retailing and entertainment. The arts and culture sector adds value to production through design, technical performance, packaging, branding and creative skills.
In taking into account the inter-connectivity of the arts and culture sector, this study measures both the direct impacts (which are the direct contributions flowing from the arts and culture sector to the value-added of the Victorian economy), and the indirect linkages (which are the contributions to the broader economy through the inter-industry linkages outside the arts and culture industry).
The direct contribution of the arts and culture sector was discussed in the previous sub-sections. This section now extends that discussion to also capture the flow-on or indirect impacts of the sector that stem from the backward and forward linkages discussed above.
This study uses Computable General Equilibrium (CGE) economic modelling to identify the linkages or flow-on impacts of the arts and culture sector throughout the economy (described in Appendix C). Based on current industry relationships and
1 To illustrate the indirect contribution of the sector, this section extrapolates the economic impact on the rest of the Victorian economy of a 10 per cent increase in arts and culture sector activity equivalent to $1,283 million in output or $612 million value add. This shows how a modest increase in the arts and culture sector’s output can flow through to other sectors. This scenario can be thought of as an ad hoc increase in the supply of the arts and culture sector by 10 per cent and is then used to infer the total contribution of the industry to the Victorian economy.
2 Note: this is the current contribution, based on current industry relationships and input choices. This should not be used to infer the outcome of extreme scenarios such as the doubling of the size of the sector where those relationships may no longer hold.
the Arts and Culture Sector in Victoria provides a total annual contribution to Victorian Gross State Product (GSP) of
$11.4 billion (in 2010-11 dollars) and around 110,000 Victorian
full-time equivalent jobs
dependencies, economic modelling broadly shows that, every $1 spent annually in arts and cultural sector value-added, currently flows through to a total annual return of $1.90 in Victorian value-added.1
Extrapolating these results indicates that, in 2010/11 dollars, in addition to the $6.1 billion annual direct value-added in this sector (discussed in subsection 3.3), there is another $5.3 billion in related annual value-added across the Victorian economy. Similarly, in addition to the 68,000 FTE employees directly employed in the arts and culture industry, there is another 42,000 FTE Victorian employees in jobs linked to arts and culture activity.
Thus, combining the direct and indirect linkages means that the Arts and Culture Sector in Victoria provides: a total annual contribution to Victorian Gross State Product (GSP) of $11.4 billion (in 2010-11 dollars); and around 110,000 Victorian full-time equivalent jobs2.
17 | Economic Impact of the Victorian Arts and Cultural Sector
© 2013 KPMG, an Australian partnership and a member firm of the KPMG network of independent member firms affiliated with KPMG International Cooperative (“KPMG International”), a Swiss entity. All rights reserved. The KPMG name, logo and “cutting through complexity” are registered
trademarks or trademarks of KPMG International. Liability limited by a scheme approved under Professional Standards Legislation.
Bendigo Art Gallery puts Bendigo on the map
Cultural venues such as Bendigo Art Gallery make a significant contribution
to local economies and enhance liveability, attracting visitors and
new residents.
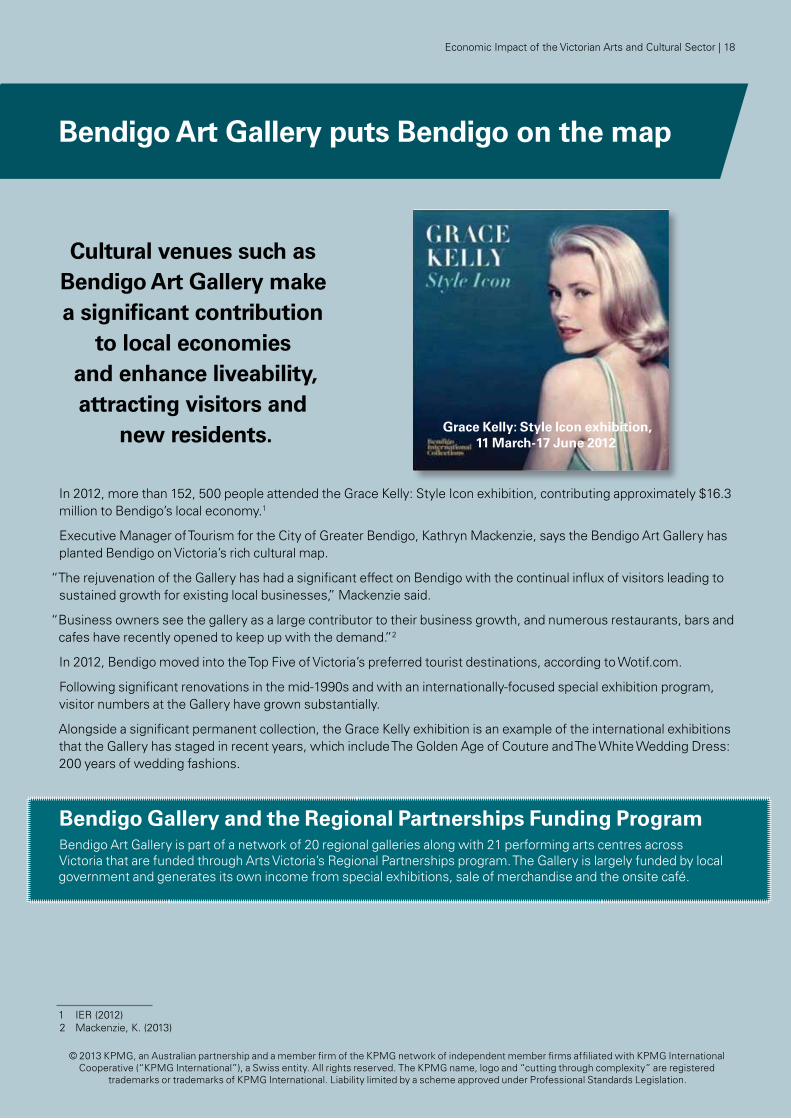
In 2012, more than 152, 500 people attended the Grace Kelly: Style Icon exhibition, contributing approximately $16.3 million to Bendigo’s local economy.1
Executive Manager of Tourism for the City of Greater Bendigo, Kathryn Mackenzie, says the Bendigo Art Gallery has planted Bendigo on Victoria’s rich cultural map.
“The rejuvenation of the Gallery has had a significant effect on Bendigo with the continual influx of visitors leading to sustained growth for existing local businesses,” Mackenzie said.
“Business owners see the gallery as a large contributor to their business growth, and numerous restaurants, bars and cafes have recently opened to keep up with the demand.”2
In 2012, Bendigo moved into the Top Five of Victoria’s preferred tourist destinations, according to Wotif.com.
Following significant renovations in the mid-1990s and with an internationally-focused special exhibition program, visitor numbers at the Gallery have grown substantially.
Alongside a significant permanent collection, the Grace Kelly exhibition is an example of the international exhibitions that the Gallery has staged in recent years, which include The Golden Age of Couture and The White Wedding Dress: 200 years of wedding fashions.
Bendigo Gallery and the Regional Partnerships Funding ProgramBendigo Art Gallery is part of a network of 20 regional galleries along with 21 performing arts centres across Victoria that are funded through Arts Victoria’s Regional Partnerships program. The Gallery is largely funded by local government and generates its own income from special exhibitions, sale of merchandise and the onsite café.
1 IER (2012)2 Mackenzie, K. (2013)
Grace Kelly: Style Icon exhibition, 11 March-17 June 2012
Economic Impact of the Victorian Arts and Cultural Sector | 18
© 2013 KPMG, an Australian partnership and a member firm of the KPMG network of independent member firms affiliated with KPMG International Cooperative (“KPMG International”), a Swiss entity. All rights reserved. The KPMG name, logo and “cutting through complexity” are registered
trademarks or trademarks of KPMG International. Liability limited by a scheme approved under Professional Standards Legislation.
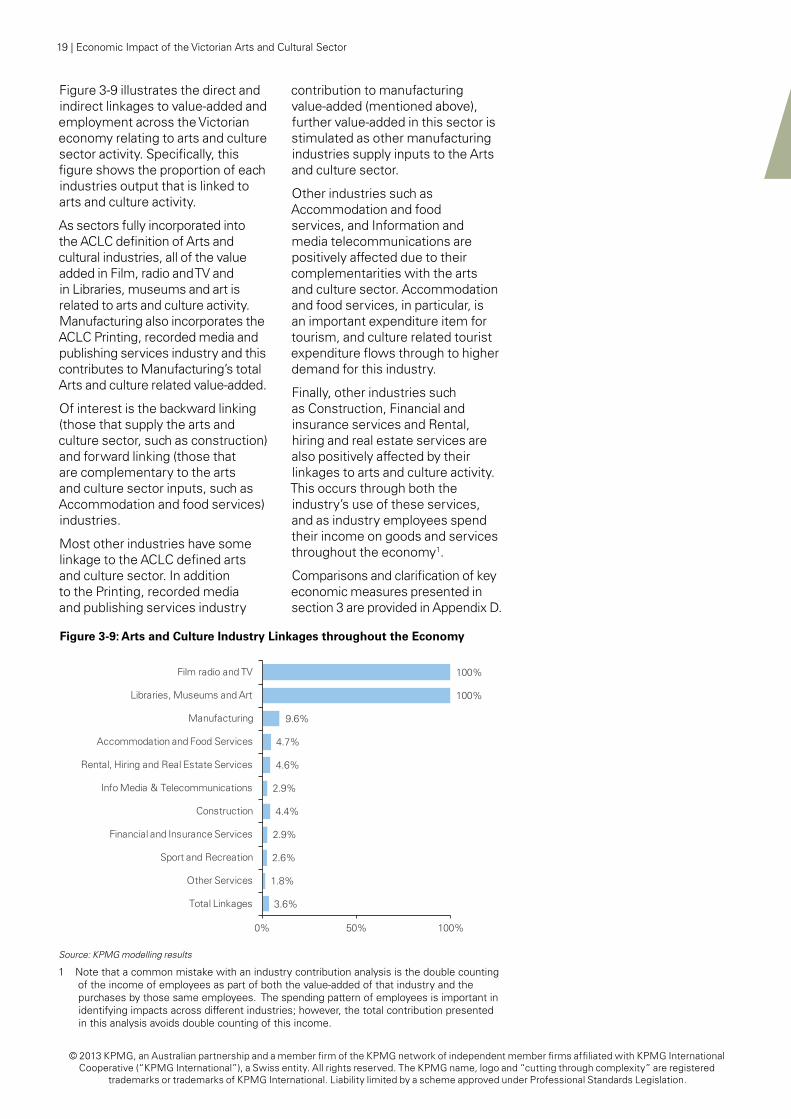
Figure 3-9: Arts and Culture Industry Linkages throughout the Economy
Source: KPMG modelling results
Figure 3-9 illustrates the direct and indirect linkages to value-added and employment across the Victorian economy relating to arts and culture sector activity. Specifically, this figure shows the proportion of each industries output that is linked to arts and culture activity.
As sectors fully incorporated into the ACLC definition of Arts and cultural industries, all of the value added in Film, radio and TV and in Libraries, museums and art is related to arts and culture activity. Manufacturing also incorporates the ACLC Printing, recorded media and publishing services industry and this contributes to Manufacturing’s total Arts and culture related value-added.
Of interest is the backward linking (those that supply the arts and culture sector, such as construction) and forward linking (those that are complementary to the arts and culture sector inputs, such as Accommodation and food services) industries.
Most other industries have some linkage to the ACLC defined arts and culture sector. In addition to the Printing, recorded media and publishing services industry
contribution to manufacturing value-added (mentioned above), further value-added in this sector is stimulated as other manufacturing industries supply inputs to the Arts and culture sector.
Other industries such as Accommodation and food services, and Information and media telecommunications are positively affected due to their complementarities with the arts and culture sector. Accommodation and food services, in particular, is an important expenditure item for tourism, and culture related tourist expenditure flows through to higher demand for this industry.
Finally, other industries such as Construction, Financial and insurance services and Rental, hiring and real estate services are also positively affected by their linkages to arts and culture activity. This occurs through both the industry’s use of these services, and as industry employees spend their income on goods and services throughout the economy1.
Comparisons and clarification of key economic measures presented in section 3 are provided in Appendix D.
100%
100%
9.6%
4.7%
4.6%
2.9%
4.4%
2.9%
2.6%
1.8%
3.6%
0% 50% 100%
Film radio and TV
Libraries, Museums and Art
Manufacturing
Accommodation and Food Services
Rental, Hiring and Real Estate Services
Info Media & Telecommunications
Construction
Financial and Insurance Services
Sport and Recreation
Other Services
Total Linkages
1 Note that a common mistake with an industry contribution analysis is the double counting of the income of employees as part of both the value-added of that industry and the purchases by those same employees. The spending pattern of employees is important in identifying impacts across different industries; however, the total contribution presented in this analysis avoids double counting of this income.
19 | Economic Impact of the Victorian Arts and Cultural Sector
© 2013 KPMG, an Australian partnership and a member firm of the KPMG network of independent member firms affiliated with KPMG International Cooperative (“KPMG International”), a Swiss entity. All rights reserved. The KPMG name, logo and “cutting through complexity” are registered
trademarks or trademarks of KPMG International. Liability limited by a scheme approved under Professional Standards Legislation.
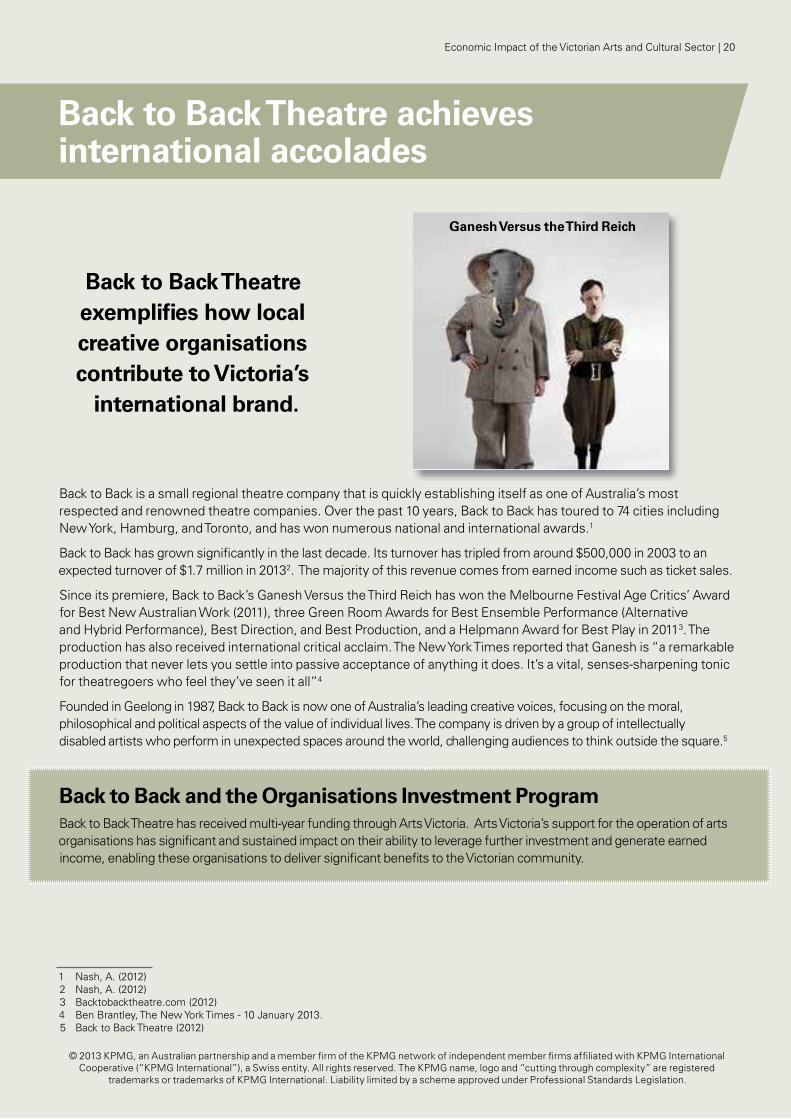
Back to Back Theatre achieves international accolades
Back to Back Theatre exemplifies how local creative organisations contribute to Victoria’s
international brand.
Back to Back is a small regional theatre company that is quickly establishing itself as one of Australia’s most respected and renowned theatre companies. Over the past 10 years, Back to Back has toured to 74 cities including New York, Hamburg, and Toronto, and has won numerous national and international awards.1
Back to Back has grown significantly in the last decade. Its turnover has tripled from around $500,000 in 2003 to an expected turnover of $1.7 million in 20132. The majority of this revenue comes from earned income such as ticket sales.
Since its premiere, Back to Back’s Ganesh Versus the Third Reich has won the Melbourne Festival Age Critics’ Award for Best New Australian Work (2011), three Green Room Awards for Best Ensemble Performance (Alternative and Hybrid Performance), Best Direction, and Best Production, and a Helpmann Award for Best Play in 20113. The production has also received international critical acclaim. The New York Times reported that Ganesh is “a remarkable production that never lets you settle into passive acceptance of anything it does. It’s a vital, senses-sharpening tonic for theatregoers who feel they’ve seen it all”4
Founded in Geelong in 1987, Back to Back is now one of Australia’s leading creative voices, focusing on the moral, philosophical and political aspects of the value of individual lives. The company is driven by a group of intellectually disabled artists who perform in unexpected spaces around the world, challenging audiences to think outside the square.5
Back to Back and the Organisations Investment ProgramBack to Back Theatre has received multi-year funding through Arts Victoria. Arts Victoria’s support for the operation of arts organisations has significant and sustained impact on their ability to leverage further investment and generate earned income, enabling these organisations to deliver significant benefits to the Victorian community.
1 Nash, A. (2012)2 Nash, A. (2012)3 Backtobacktheatre.com (2012)4 Ben Brantley, The New York Times - 10 January 2013.5 Back to Back Theatre (2012)
Ganesh Versus the Third Reich
Economic Impact of the Victorian Arts and Cultural Sector | 20
© 2013 KPMG, an Australian partnership and a member firm of the KPMG network of independent member firms affiliated with KPMG International Cooperative (“KPMG International”), a Swiss entity. All rights reserved. The KPMG name, logo and “cutting through complexity” are registered
trademarks or trademarks of KPMG International. Liability limited by a scheme approved under Professional Standards Legislation.
Government Support for the Sector4Australian governments support the arts and culture sector directly and also indirectly through various organisations that assist the different groups of artists in the sector.
While a sizable portion of the government assistance is in the form of grants, most government support – at all levels – is via direct service provision, including through statutory authorities such as theatres, museums libraries, and other government institutions. Governments also support the arts through industry investment such as in film/television production, and by partnering with business sectors, organisations and individuals to develop artists and organisations in the sector.Value added is equivalent to output less goods and services sourced from other suppliers (including imports), and is the sector’s contribution to gross state product. By excluding goods and service inputs from other industries and imports, ‘value added’ avoids double counting as it does not include the value-added from other industries. In other words, it represents only the value added to products and services that the creative businesses in Victoria produce.
4.1 Victorian Government Support: Arts VictoriaArts Victoria is the state government body which advises on, and implements arts policy. Arts Victoria is charged with making the arts available and accessible to all Victorians and with supporting and developing Victoria’s artists and creative industries.
Arts Victoria is a part of Victoria’s Department of Premier and Cabinet and reports to the Minister for the Arts.
Arts Victoria was established in 1972 by the Arts Victoria Act 1972. Under the Act, its roles and responsibilities include:
• to develop and improve the knowledge, understanding, appreciation and practice of the arts;
• to increase the availability and accessibility of the arts to the public;
• to encourage and assist in the provision of facilities to enable the arts to be displayed; and
• to continue to survey and assess the arts and report to Parliament on potential improvements.
Arts Victoria also oversees the state-owned arts and cultural organisations throughout Victoria. These include Arts Centre Melbourne, Australian Centre for the Moving Image, Geelong Performing Arts Centre, Museum Victoria, National Gallery of Victoria, State Library of Victoria, Public Record Office of Victoria and Melbourne Recital Centre.
Arts Victoria also provides a range of funding programs to assist in
the development and presentation of cultural projects and services with the aim of benefiting the Victorian arts sector and the wider community.
In 2010-11, Arts Victoria expended more than $322 million in recurrent and capital funding to support a range of arts and cultural organisations and activities across Victoria, accounting for around 56 per cent of Victorian Government support for the cultural sector.
4.2 Other Victorian Government SupportWhile Arts Victoria’s funding is primarily directed to performing arts, museums and cultural heritage, galleries, libraries and archives, and the moving image, other Victorian Government departments provide significant support for the Victorian cultural sector.
The Victorian government supports the film industry through Film Victoria, the state’s film and television industry support agency. Film Victoria provides strategic leadership and assistance to the film, television, and digital media industries of Victoria by1:
• providing investment for various film, television and digital media projects to increase production and promote its industry growth;
• developing strategic policies, procedures and relevant legislation to improve organisational efficiency; and
• providing support for industry practitioners to up skill in content creation and business development areas.
Environmental Heritage is the largest component of Victorian Government cultural expenditure. The Department of Environment and
1 Film.vic.gov.au (2012)
21 | Economic Impact of the Victorian Arts and Cultural Sector
© 2013 KPMG, an Australian partnership and a member firm of the KPMG network of independent member firms affiliated with KPMG International Cooperative (“KPMG International”), a Swiss entity. All rights reserved. The KPMG name, logo and “cutting through complexity” are registered
trademarks or trademarks of KPMG International. Liability limited by a scheme approved under Professional Standards Legislation.
Primary Industries is responsible for the conservation of Victoria’s natural and cultural heritage on public land. Victoria has more than 4 million hectares, of 14 per cent of the state which are wilderness, state and regional parks and reserve areas, which are managed by Parks Victoria. Parks Victoria also manages Melbourne’s metropolitan parks and open space network, as well as the lower Yarra, Maribyrnong and Patterson Rivers and Port Philip and Western Port Bays.
Significant government funding is also provided for the preservation, display and public education of flora and fauna through the Royal Botanic Gardens and the Melbourne Zoo.
The Victorian Government, through Local Government Victoria, supports public libraries throughout the State through a range of grants to local government and other funding. There are a 46 regional and local library services, operating 290 branches and 26 mobile libraries, meeting the information and recreational needs of all Victorians.
Heritage Victoria is responsible for the preservation of the state’s material cultural heritage – sites and buildings, objects and artefacts – and provides funding, educational services and other resources and support for heritage related projects. Protection of Aboriginal cultural heritage is the responsibility of Aboriginal Affairs Victoria.
The Victorian Government also provides indirect support though Tourism Victoria via the tourism and travel industry’s promotion of arts and culture activities. The arts and culture sector and the tourism industry are closely related, with many arts organisations and cultural institutions also tourist destinations. Tourism Victoria provides support to the arts and culture sector by developing Victorian Government
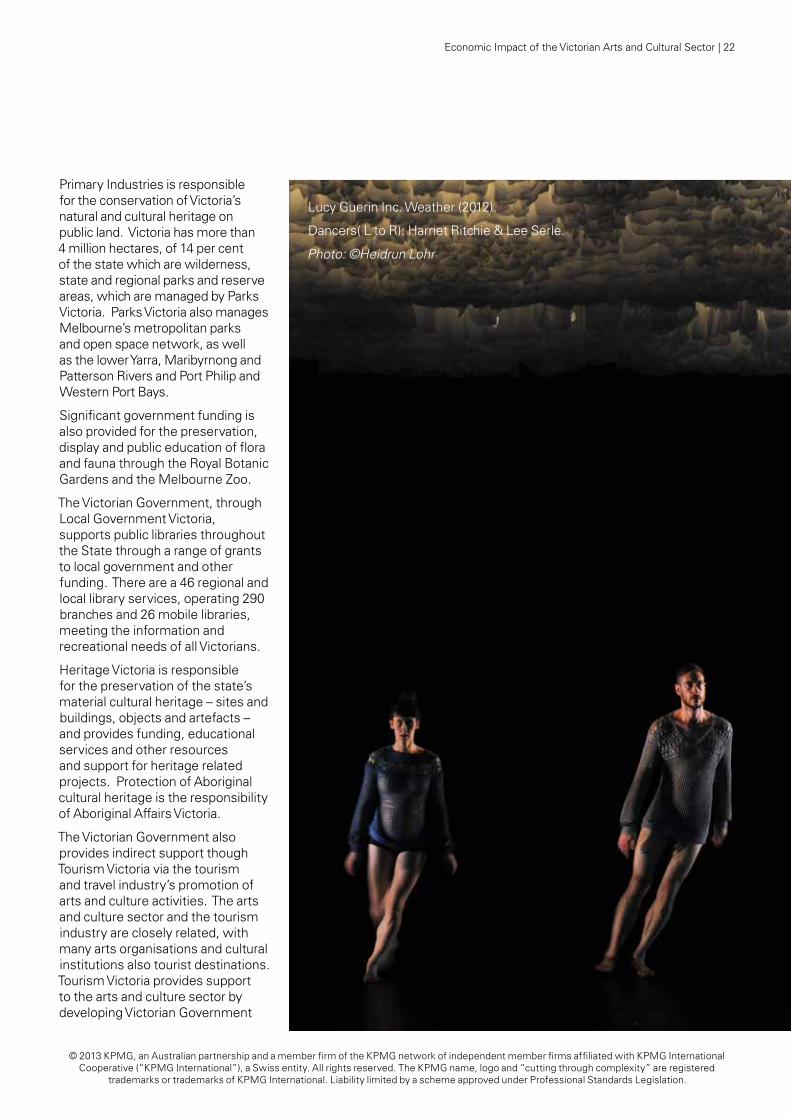
Lucy Guerin Inc. Weather (2012).
Dancers( L to R): Harriet Ritchie & Lee Serle.
Photo: ©Heidrun Lohr
Economic Impact of the Victorian Arts and Cultural Sector | 22
© 2013 KPMG, an Australian partnership and a member firm of the KPMG network of independent member firms affiliated with KPMG International Cooperative (“KPMG International”), a Swiss entity. All rights reserved. The KPMG name, logo and “cutting through complexity” are registered
trademarks or trademarks of KPMG International. Liability limited by a scheme approved under Professional Standards Legislation.
policies to promote the industry. Furthermore, many of the marketing initiatives strongly promote the arts and culture sector in an aim to also promote the tourism and travel industry in Victoria.
The arts and culture sector is also supported by the Victorian Major Events Company (VMEC), a Victorian Government organisation that secures major entertainment and sporting events for Victoria. VMEC promotes the sector by attracting major domestic and international events to Victoria and establishing opportunities with various businesses in the state. Some recent major cultural events include Melbourne Winter Masterpieces exhibition: Napoleon: Revolution to Empire and World DanceSport Championship2.
Table 4-1 shows the allocation of funding from Arts Victoria and other government funding across each of the 10 Australian Culture and Leisure Classification system industries.
In 2010-11, other Victorian Government agencies provided almost $258 million to the arts and culture sector. In total, Victorian Government funding to the sector was worth around $580 million that year.
Figure 4-1 highlights that a significant portion of Victorian government funding, with environmental heritage funding a particular exception, is allocated via Arts Victoria.
2 Victorian Major Events Company (2009)
Table 4-1: Victorian Government Cultural Funding, 2010-11 ($millions)
Arts Victoria
Other Government
Total Funding
Museums, antiques and collectables 105.2 25.8 131.0
Environmental heritage 0.0 142.7 142.7
Libraries and archives 60.6 35.9 96.5
Literature and print media 2.8 2.1 4.9
Performing arts 106.7 9.3 116.0
Music composition and publishing 0.0 4.1 4.1
Visual arts and crafts 2.8 0.5 3.3
Design 0.0 3.6 3.6
Broadcasting, electronic media and film 20.2 27.6 47.8
Other arts and culture 23.8 6.7 30.5
Total 322.2 258.2 580.4
Source: Unpublished data from Arts Victoria and Cultural Funding by Government 2010-11
Figure 4-1: Victorian Government Cultural Funding 2010-11 ($millions)
Source: Unpublished data from Arts Victoria and Cultural Funding by Government 2010-11, (cat 4183.0)
105.2
0.0
60.6
2.8
106.7
0.0
2.8
0.0
20.2
23.8
25.8
142.7
35.9
2.1
9.3
4.1
0.5
3.6
27.6
6.7
0 40 80 120 160
Museums, antiques and collectables
Environmental heritage
Libraries and archives
Literature and print media
Performing arts
Music composition and publishing
Visual arts and crafts
Design
Broadcasting, electronic media and film
Other arts and culture
Arts Victoria Funding Other Govt Funding
23 | Economic Impact of the Victorian Arts and Cultural Sector
© 2013 KPMG, an Australian partnership and a member firm of the KPMG network of independent member firms affiliated with KPMG International Cooperative (“KPMG International”), a Swiss entity. All rights reserved. The KPMG name, logo and “cutting through complexity” are registered
trademarks or trademarks of KPMG International. Liability limited by a scheme approved under Professional Standards Legislation.
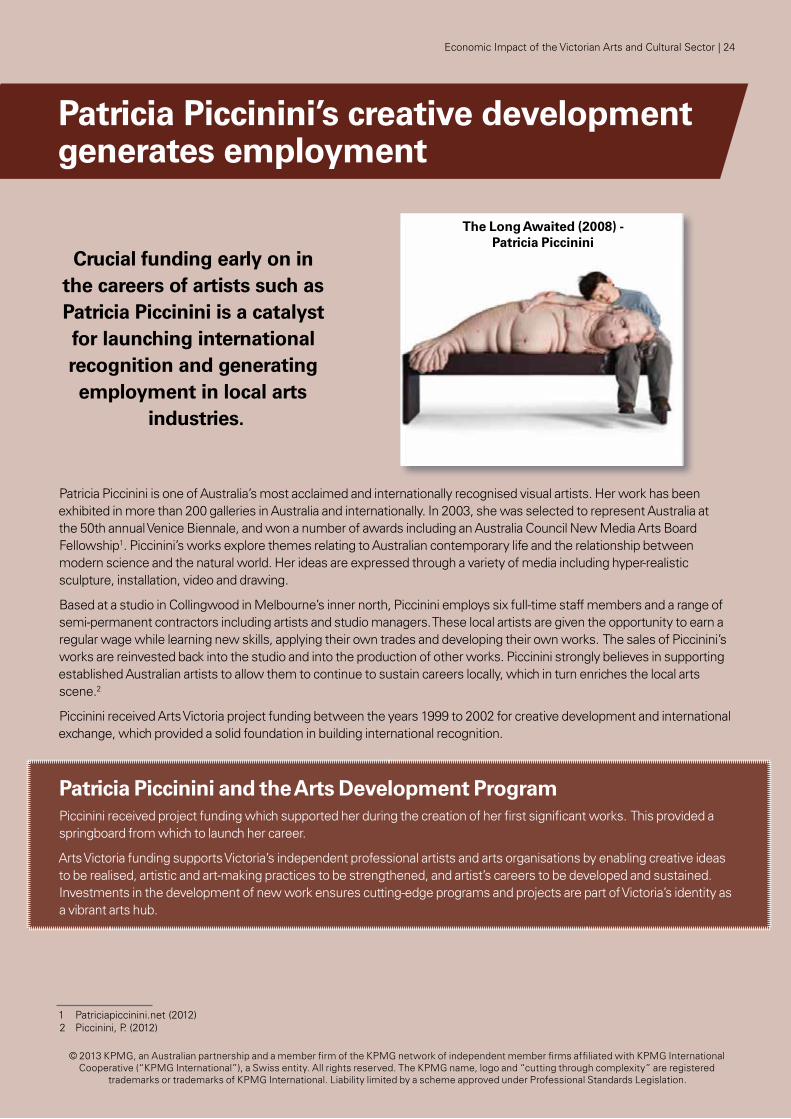
Patricia Piccinini’s creative development generates employment
Crucial funding early on in the careers of artists such as Patricia Piccinini is a catalyst for launching international recognition and generating employment in local arts
industries.
Patricia Piccinini is one of Australia’s most acclaimed and internationally recognised visual artists. Her work has been exhibited in more than 200 galleries in Australia and internationally. In 2003, she was selected to represent Australia at the 50th annual Venice Biennale, and won a number of awards including an Australia Council New Media Arts Board Fellowship1. Piccinini’s works explore themes relating to Australian contemporary life and the relationship between modern science and the natural world. Her ideas are expressed through a variety of media including hyper-realistic sculpture, installation, video and drawing.
Based at a studio in Collingwood in Melbourne’s inner north, Piccinini employs six full-time staff members and a range of semi-permanent contractors including artists and studio managers. These local artists are given the opportunity to earn a regular wage while learning new skills, applying their own trades and developing their own works. The sales of Piccinini’s works are reinvested back into the studio and into the production of other works. Piccinini strongly believes in supporting established Australian artists to allow them to continue to sustain careers locally, which in turn enriches the local arts scene.2
Piccinini received Arts Victoria project funding between the years 1999 to 2002 for creative development and international exchange, which provided a solid foundation in building international recognition.
Patricia Piccinini and the Arts Development ProgramPiccinini received project funding which supported her during the creation of her first significant works. This provided a springboard from which to launch her career.
Arts Victoria funding supports Victoria’s independent professional artists and arts organisations by enabling creative ideas to be realised, artistic and art-making practices to be strengthened, and artist’s careers to be developed and sustained. Investments in the development of new work ensures cutting-edge programs and projects are part of Victoria’s identity as a vibrant arts hub.
1 Patriciapiccinini.net (2012)2 Piccinini, P. (2012)
The Long Awaited (2008) - Patricia Piccinini
Economic Impact of the Victorian Arts and Cultural Sector | 24
© 2013 KPMG, an Australian partnership and a member firm of the KPMG network of independent member firms affiliated with KPMG International Cooperative (“KPMG International”), a Swiss entity. All rights reserved. The KPMG name, logo and “cutting through complexity” are registered
trademarks or trademarks of KPMG International. Liability limited by a scheme approved under Professional Standards Legislation.
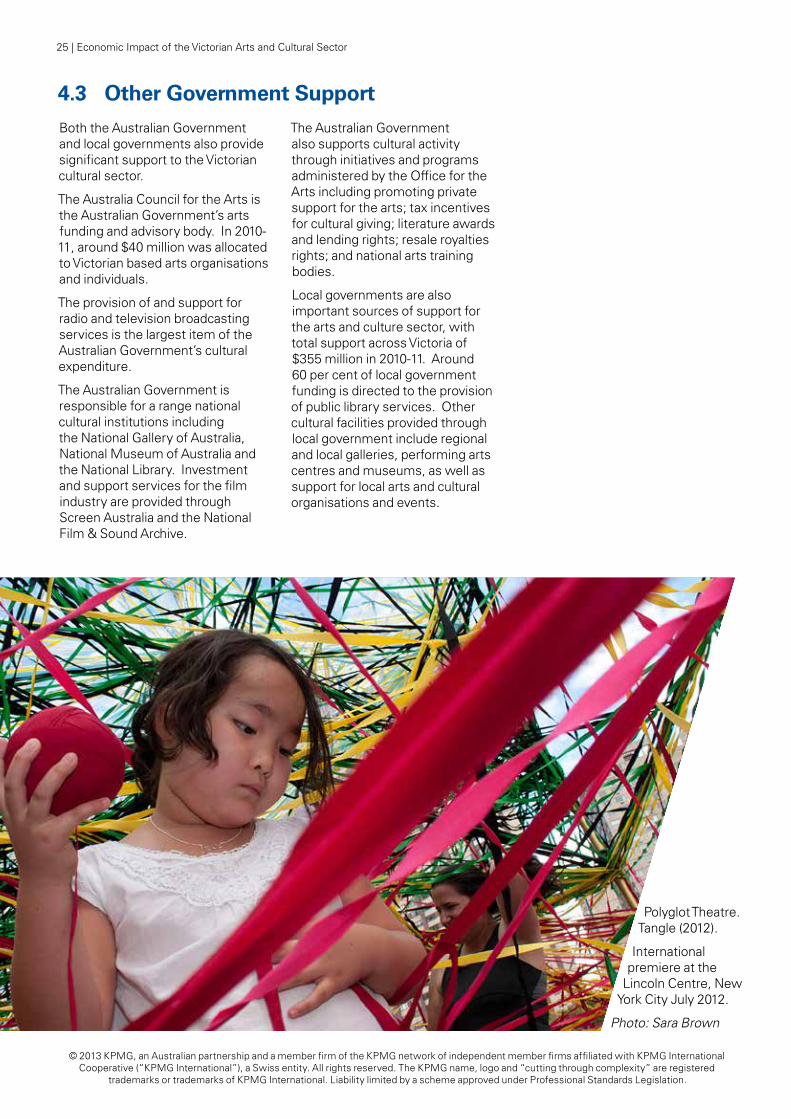
4.3 Other Government Support
Both the Australian Government and local governments also provide significant support to the Victorian cultural sector.
The Australia Council for the Arts is the Australian Government’s arts funding and advisory body. In 2010-11, around $40 million was allocated to Victorian based arts organisations and individuals.
The provision of and support for radio and television broadcasting services is the largest item of the Australian Government’s cultural expenditure.
The Australian Government is responsible for a range national cultural institutions including the National Gallery of Australia, National Museum of Australia and the National Library. Investment and support services for the film industry are provided through Screen Australia and the National Film & Sound Archive.
The Australian Government also supports cultural activity through initiatives and programs administered by the Office for the Arts including promoting private support for the arts; tax incentives for cultural giving; literature awards and lending rights; resale royalties rights; and national arts training bodies.
Local governments are also important sources of support for the arts and culture sector, with total support across Victoria of $355 million in 2010-11. Around 60 per cent of local government funding is directed to the provision of public library services. Other cultural facilities provided through local government include regional and local galleries, performing arts centres and museums, as well as support for local arts and cultural organisations and events.
Polyglot Theatre. Tangle (2012).
International premiere at the
Lincoln Centre, New York City July 2012.
Photo: Sara Brown
25 | Economic Impact of the Victorian Arts and Cultural Sector
© 2013 KPMG, an Australian partnership and a member firm of the KPMG network of independent member firms affiliated with KPMG International Cooperative (“KPMG International”), a Swiss entity. All rights reserved. The KPMG name, logo and “cutting through complexity” are registered
trademarks or trademarks of KPMG International. Liability limited by a scheme approved under Professional Standards Legislation.
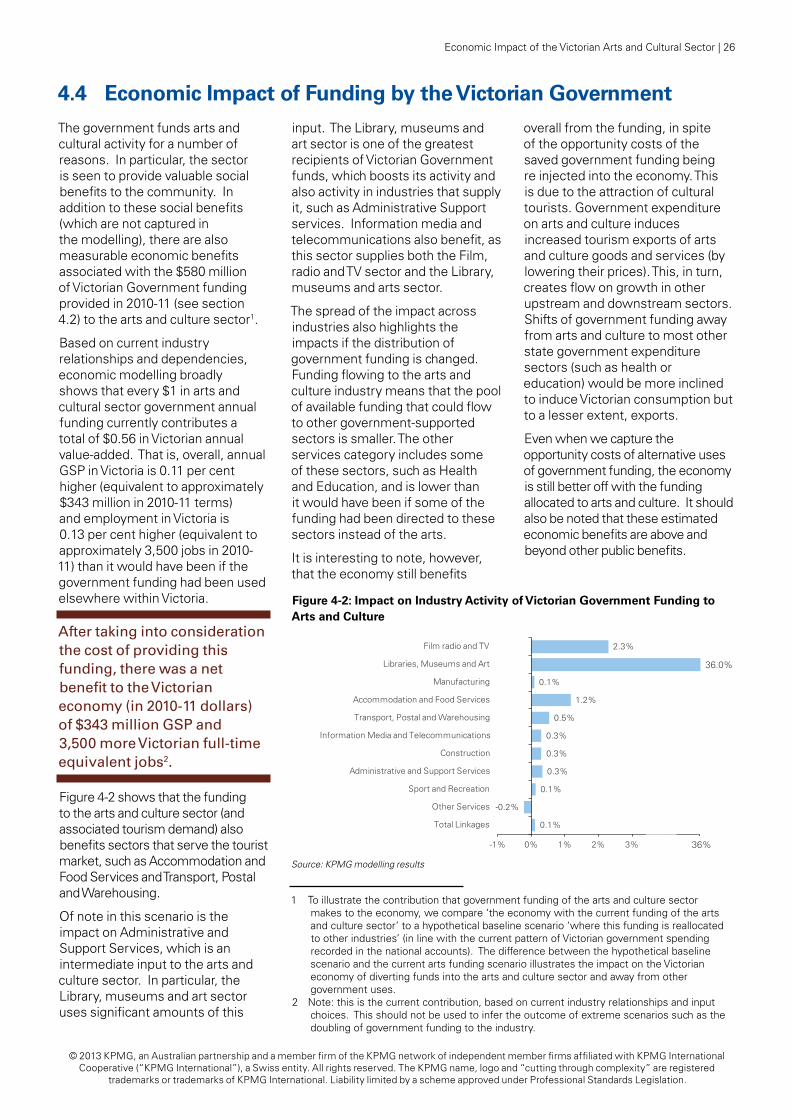
4.4 Economic Impact of Funding by the Victorian Government
The government funds arts and cultural activity for a number of reasons. In particular, the sector is seen to provide valuable social benefits to the community. In addition to these social benefits (which are not captured in the modelling), there are also measurable economic benefits associated with the $580 million of Victorian Government funding provided in 2010-11 (see section 4.2) to the arts and culture sector1.
Based on current industry relationships and dependencies, economic modelling broadly shows that every $1 in arts and cultural sector government annual funding currently contributes a total of $0.56 in Victorian annual value-added. That is, overall, annual GSP in Victoria is 0.11 per cent higher (equivalent to approximately $343 million in 2010-11 terms) and employment in Victoria is 0.13 per cent higher (equivalent to approximately 3,500 jobs in 2010-11) than it would have been if the government funding had been used elsewhere within Victoria.
After taking into consideration the cost of providing this funding, there was a net benefit to the Victorian economy (in 2010-11 dollars) of $343 million GSP and 3,500 more Victorian full-time equivalent jobs2.
Figure 4-2 shows that the funding to the arts and culture sector (and associated tourism demand) also benefits sectors that serve the tourist market, such as Accommodation and Food Services and Transport, Postal and Warehousing.
Of note in this scenario is the impact on Administrative and Support Services, which is an intermediate input to the arts and culture sector. In particular, the Library, museums and art sector uses significant amounts of this
input. The Library, museums and art sector is one of the greatest recipients of Victorian Government funds, which boosts its activity and also activity in industries that supply it, such as Administrative Support services. Information media and telecommunications also benefit, as this sector supplies both the Film, radio and TV sector and the Library, museums and arts sector.
The spread of the impact across industries also highlights the impacts if the distribution of government funding is changed. Funding flowing to the arts and culture industry means that the pool of available funding that could flow to other government-supported sectors is smaller. The other services category includes some of these sectors, such as Health and Education, and is lower than it would have been if some of the funding had been directed to these sectors instead of the arts.
It is interesting to note, however, that the economy still benefits
overall from the funding, in spite of the opportunity costs of the saved government funding being re injected into the economy. This is due to the attraction of cultural tourists. Government expenditure on arts and culture induces increased tourism exports of arts and culture goods and services (by lowering their prices). This, in turn, creates flow on growth in other upstream and downstream sectors. Shifts of government funding away from arts and culture to most other state government expenditure sectors (such as health or education) would be more inclined to induce Victorian consumption but to a lesser extent, exports.
Even when we capture the opportunity costs of alternative uses of government funding, the economy is still better off with the funding allocated to arts and culture. It should also be noted that these estimated economic benefits are above and beyond other public benefits.
Figure 4-2: Impact on Industry Activity of Victorian Government Funding to Arts and Culture
Source: KPMG modelling results
1 To illustrate the contribution that government funding of the arts and culture sector makes to the economy, we compare ‘the economy with the current funding of the arts and culture sector’ to a hypothetical baseline scenario ‘where this funding is reallocated to other industries’ (in line with the current pattern of Victorian government spending recorded in the national accounts). The difference between the hypothetical baseline scenario and the current arts funding scenario illustrates the impact on the Victorian economy of diverting funds into the arts and culture sector and away from other government uses.
2 Note: this is the current contribution, based on current industry relationships and input choices. This should not be used to infer the outcome of extreme scenarios such as the doubling of government funding to the industry.
2.3%
0.1%
1.2%
0.5%
0.3%
0.3%
0.3%
0.1%
-0.2%
0.1%
-1% 0% 1% 2% 3% 4% 5%
Film radio and TV
Libraries, Museums and Art
Manufacturing
Accommodation and Food Services
Transport, Postal and Warehousing
Information Media and Telecommunications
Construction
Administrative and Support Services
Sport and Recreation
Other Services
Total Linkages
36.0%
36%
Economic Impact of the Victorian Arts and Cultural Sector | 26
© 2013 KPMG, an Australian partnership and a member firm of the KPMG network of independent member firms affiliated with KPMG International Cooperative (“KPMG International”), a Swiss entity. All rights reserved. The KPMG name, logo and “cutting through complexity” are registered
trademarks or trademarks of KPMG International. Liability limited by a scheme approved under Professional Standards Legislation.
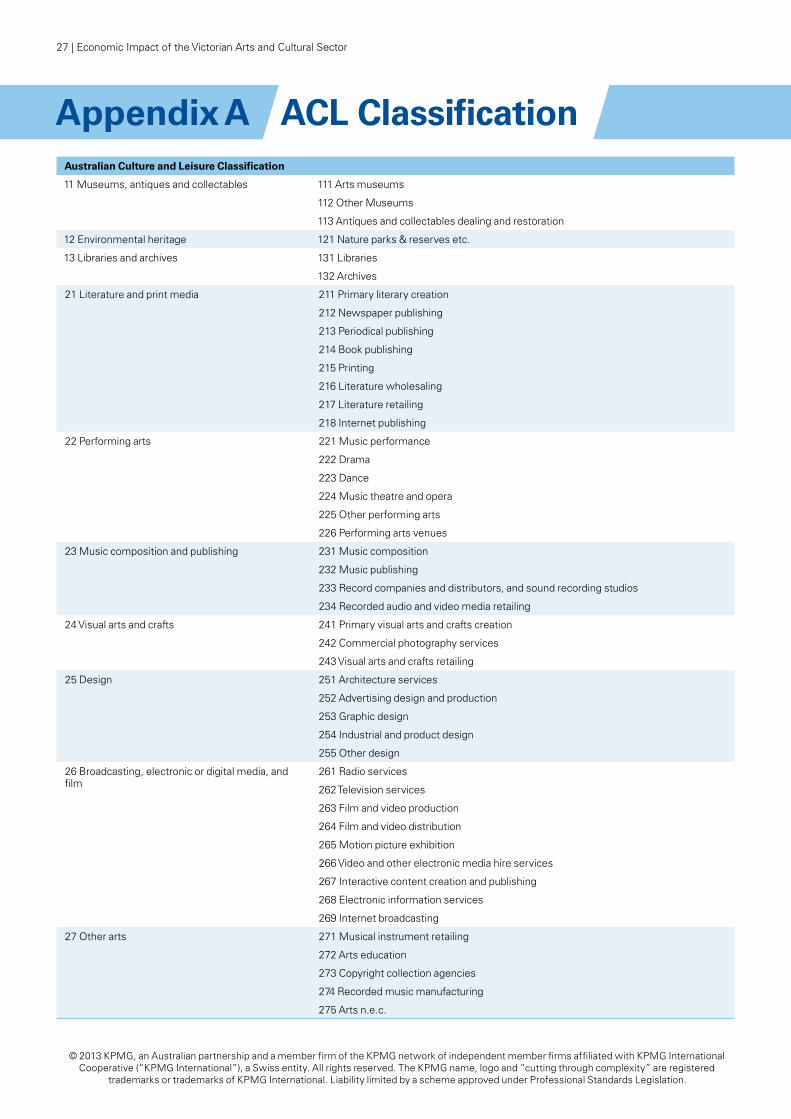
ACL ClassificationAppendix AAustralian Culture and Leisure Classification
11 Museums, antiques and collectables 111 Arts museums
112 Other Museums
113 Antiques and collectables dealing and restoration
12 Environmental heritage 121 Nature parks & reserves etc.
13 Libraries and archives 131 Libraries
132 Archives
21 Literature and print media 211 Primary literary creation
212 Newspaper publishing
213 Periodical publishing
214 Book publishing
215 Printing
216 Literature wholesaling
217 Literature retailing
218 Internet publishing
22 Performing arts 221 Music performance
222 Drama
223 Dance
224 Music theatre and opera
225 Other performing arts
226 Performing arts venues
23 Music composition and publishing 231 Music composition
232 Music publishing
233 Record companies and distributors, and sound recording studios
234 Recorded audio and video media retailing
24 Visual arts and crafts 241 Primary visual arts and crafts creation
242 Commercial photography services
243 Visual arts and crafts retailing
25 Design 251 Architecture services
252 Advertising design and production
253 Graphic design
254 Industrial and product design
255 Other design
26 Broadcasting, electronic or digital media, and film
261 Radio services
262 Television services
263 Film and video production
264 Film and video distribution
265 Motion picture exhibition
266 Video and other electronic media hire services
267 Interactive content creation and publishing
268 Electronic information services
269 Internet broadcasting
27 Other arts 271 Musical instrument retailing
272 Arts education
273 Copyright collection agencies
274 Recorded music manufacturing
275 Arts n.e.c.
27 | Economic Impact of the Victorian Arts and Cultural Sector
© 2013 KPMG, an Australian partnership and a member firm of the KPMG network of independent member firms affiliated with KPMG International Cooperative (“KPMG International”), a Swiss entity. All rights reserved. The KPMG name, logo and “cutting through complexity” are registered
trademarks or trademarks of KPMG International. Liability limited by a scheme approved under Professional Standards Legislation.
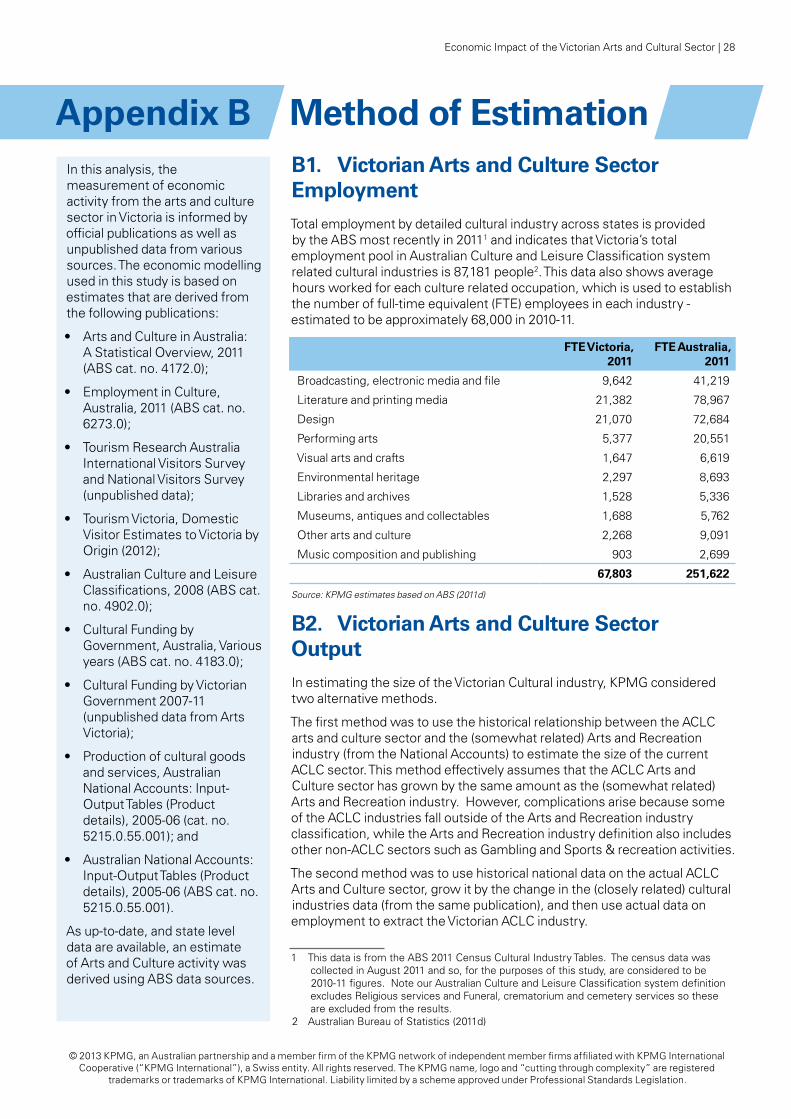
Method of Estimation In this analysis, the measurement of economic activity from the arts and culture sector in Victoria is informed by official publications as well as unpublished data from various sources. The economic modelling used in this study is based on estimates that are derived from the following publications:
• Arts and Culture in Australia: A Statistical Overview, 2011 (ABS cat. no. 4172.0);
• Employment in Culture, Australia, 2011 (ABS cat. no. 6273.0);
• Tourism Research Australia International Visitors Survey and National Visitors Survey (unpublished data);
• Tourism Victoria, Domestic Visitor Estimates to Victoria by Origin (2012);
• Australian Culture and Leisure Classifications, 2008 (ABS cat. no. 4902.0);
• Cultural Funding by Government, Australia, Various years (ABS cat. no. 4183.0);
• Cultural Funding by Victorian Government 2007-11 (unpublished data from Arts Victoria);
• Production of cultural goods and services, Australian National Accounts: Input-Output Tables (Product details), 2005-06 (cat. no. 5215.0.55.001); and
• Australian National Accounts: Input-Output Tables (Product details), 2005-06 (ABS cat. no. 5215.0.55.001).
As up-to-date, and state level data are available, an estimate of Arts and Culture activity was derived using ABS data sources.
B1. Victorian Arts and Culture Sector EmploymentTotal employment by detailed cultural industry across states is provided by the ABS most recently in 20111 and indicates that Victoria’s total employment pool in Australian Culture and Leisure Classification system related cultural industries is 87,181 people2. This data also shows average hours worked for each culture related occupation, which is used to establish the number of full-time equivalent (FTE) employees in each industry - estimated to be approximately 68,000 in 2010-11.
FTE Victoria, 2011
FTE Australia, 2011
Broadcasting, electronic media and file 9,642 41,219
Literature and printing media 21,382 78,967
Design 21,070 72,684
Performing arts 5,377 20,551
Visual arts and crafts 1,647 6,619
Environmental heritage 2,297 8,693
Libraries and archives 1,528 5,336
Museums, antiques and collectables 1,688 5,762
Other arts and culture 2,268 9,091
Music composition and publishing 903 2,699
67,803 251,622
Source: KPMG estimates based on ABS (2011d)
B2. Victorian Arts and Culture Sector OutputIn estimating the size of the Victorian Cultural industry, KPMG considered two alternative methods.
The first method was to use the historical relationship between the ACLC arts and culture sector and the (somewhat related) Arts and Recreation industry (from the National Accounts) to estimate the size of the current ACLC sector. This method effectively assumes that the ACLC Arts and Culture sector has grown by the same amount as the (somewhat related) Arts and Recreation industry. However, complications arise because some of the ACLC industries fall outside of the Arts and Recreation industry classification, while the Arts and Recreation industry definition also includes other non-ACLC sectors such as Gambling and Sports & recreation activities.
The second method was to use historical national data on the actual ACLC Arts and Culture sector, grow it by the change in the (closely related) cultural industries data (from the same publication), and then use actual data on employment to extract the Victorian ACLC industry.
1 This data is from the ABS 2011 Census Cultural Industry Tables. The census data was collected in August 2011 and so, for the purposes of this study, are considered to be 2010-11 figures. Note our Australian Culture and Leisure Classification system definition excludes Religious services and Funeral, crematorium and cemetery services so these are excluded from the results.
2 Australian Bureau of Statistics (2011d)
Appendix B
Economic Impact of the Victorian Arts and Cultural Sector | 28
© 2013 KPMG, an Australian partnership and a member firm of the KPMG network of independent member firms affiliated with KPMG International Cooperative (“KPMG International”), a Swiss entity. All rights reserved. The KPMG name, logo and “cutting through complexity” are registered
trademarks or trademarks of KPMG International. Liability limited by a scheme approved under Professional Standards Legislation.
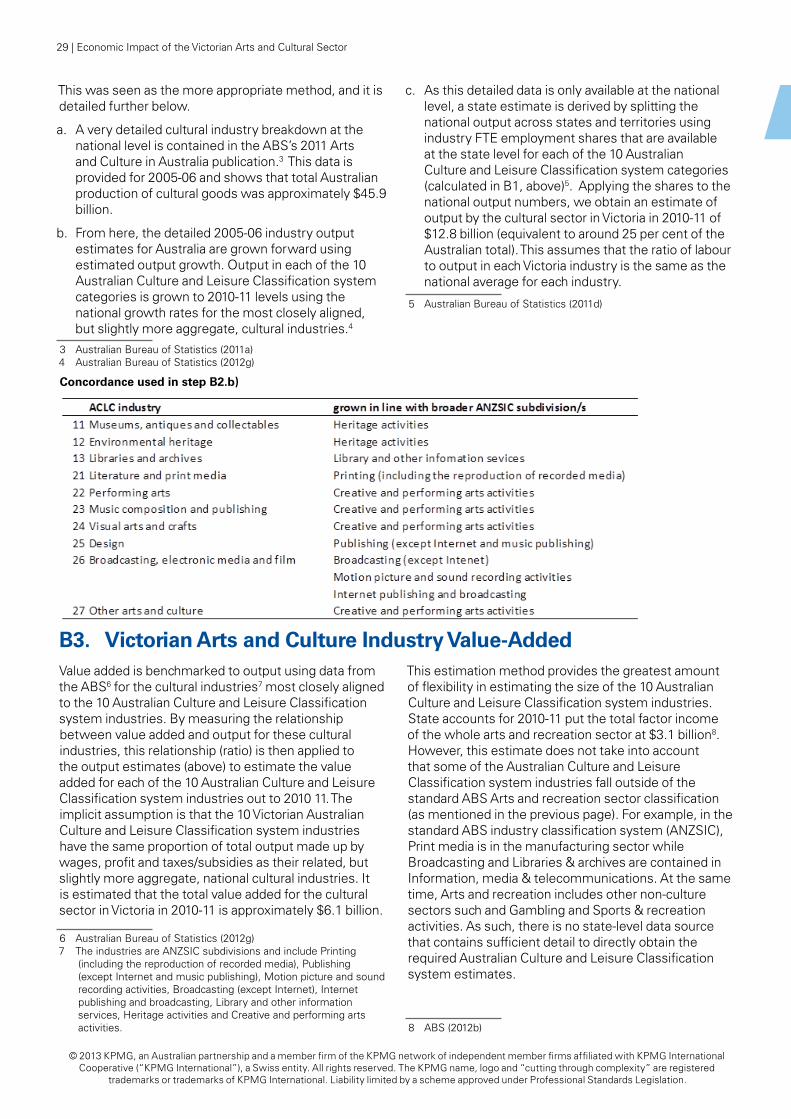
This was seen as the more appropriate method, and it is detailed further below.
a. A very detailed cultural industry breakdown at the national level is contained in the ABS’s 2011 Arts and Culture in Australia publication.3 This data is provided for 2005-06 and shows that total Australian production of cultural goods was approximately $45.9 billion.
b. From here, the detailed 2005-06 industry output estimates for Australia are grown forward using estimated output growth. Output in each of the 10 Australian Culture and Leisure Classification system categories is grown to 2010-11 levels using the national growth rates for the most closely aligned, but slightly more aggregate, cultural industries.4
3 Australian Bureau of Statistics (2011a)4 Australian Bureau of Statistics (2012g)
c. As this detailed data is only available at the national level, a state estimate is derived by splitting the national output across states and territories using industry FTE employment shares that are available at the state level for each of the 10 Australian Culture and Leisure Classification system categories (calculated in B1, above)5. Applying the shares to the national output numbers, we obtain an estimate of output by the cultural sector in Victoria in 2010-11 of $12.8 billion (equivalent to around 25 per cent of the Australian total). This assumes that the ratio of labour to output in each Victoria industry is the same as the national average for each industry.
5 Australian Bureau of Statistics (2011d)
Concordance used in step B2.b)
B3. Victorian Arts and Culture Industry Value-AddedValue added is benchmarked to output using data from the ABS6 for the cultural industries7 most closely aligned to the 10 Australian Culture and Leisure Classification system industries. By measuring the relationship between value added and output for these cultural industries, this relationship (ratio) is then applied to the output estimates (above) to estimate the value added for each of the 10 Australian Culture and Leisure Classification system industries out to 2010 11. The implicit assumption is that the 10 Victorian Australian Culture and Leisure Classification system industries have the same proportion of total output made up by wages, profit and taxes/subsidies as their related, but slightly more aggregate, national cultural industries. It is estimated that the total value added for the cultural sector in Victoria in 2010-11 is approximately $6.1 billion.
6 Australian Bureau of Statistics (2012g)7 The industries are ANZSIC subdivisions and include Printing
(including the reproduction of recorded media), Publishing (except Internet and music publishing), Motion picture and sound recording activities, Broadcasting (except Internet), Internet publishing and broadcasting, Library and other information services, Heritage activities and Creative and performing arts activities.
This estimation method provides the greatest amount of flexibility in estimating the size of the 10 Australian Culture and Leisure Classification system industries. State accounts for 2010-11 put the total factor income of the whole arts and recreation sector at $3.1 billion8. However, this estimate does not take into account that some of the Australian Culture and Leisure Classification system industries fall outside of the standard ABS Arts and recreation sector classification (as mentioned in the previous page). For example, in the standard ABS industry classification system (ANZSIC), Print media is in the manufacturing sector while Broadcasting and Libraries & archives are contained in Information, media & telecommunications. At the same time, Arts and recreation includes other non-culture sectors such and Gambling and Sports & recreation activities. As such, there is no state-level data source that contains sufficient detail to directly obtain the required Australian Culture and Leisure Classification system estimates.
8 ABS (2012b)
29 | Economic Impact of the Victorian Arts and Cultural Sector
© 2013 KPMG, an Australian partnership and a member firm of the KPMG network of independent member firms affiliated with KPMG International Cooperative (“KPMG International”), a Swiss entity. All rights reserved. The KPMG name, logo and “cutting through complexity” are registered
trademarks or trademarks of KPMG International. Liability limited by a scheme approved under Professional Standards Legislation.
Economic Modelling Appendix C
This attachment discusses and presents the economic modelling approach used to estimate the economic contribution of the arts and culture sector to the Victorian economy and the impact of government funding associated with this sector. To estimate the total economic contribution of the arts and culture sector in Victoria, this study employed a comparative static, computable general equilibrium (CGE) model, described further below.
C1. Modelling economic impactsTo model the economic impacts beyond those that directly relate to the arts and culture sector (as outlined in section 3), it is necessary to employ a modelling technique that makes use of information about the linkages of the sector within the broader economic context. The starting point for modelling these linkages is the input-output table published by the ABS.
Input-output table data provides detailed information on the upstream and downstream linkages of each industry in the economy. Upstream linkages refer to the sources of inputs to the industry in question. These linkages may be in the form of the use of intermediate inputs produced by other domestic industries, imported intermediate inputs, labour and other factors of production. For example, the preparation of a set for a theatre production would use inputs such as paint, timber, imported fabrics, and services such as those of the transport industry. Downstream refers to linkages to those economic agents that purchase the industry’s output. For example, a tourism business might purchase a block booking of theatre tickets that it bundles with accommodation, dining and transport to sell to interstate tourists. Consequently, downstream linkages include sales to other industries that use the output of the arts and culture sector as an intermediate input to their own production process or final users of the product such as households (who attend arts or cultural events), the government (for example, when the education sector purchases tickets to a theatre production for students) or foreigners (which are recorded as exports, for example, through providing arts and culture sector goods or services to tourists).
An input-output table is a useful tool as a snapshot of the economic flows within the economy at the time the data was collected. An input-output table can be used to provide simplified estimates of the sensitivity of the economy (measured by employment, value added or turnover) to small changes (termed ‘shocks’) within industries. An example of such a shock might be a one per cent increase in interstate tourists attracted to Melbourne to attend a popular theatrical production. This might lead to a similar increase in the use of hotel nights, restaurant meals, etc. This sort of analysis can
be used at the industry-wide level to estimate input-output multipliers – that is, the total economy-wide impact on employment or output resulting from a change in one industry, taking into account the change in demand for the outputs of other industries.
However, an input-output table in itself is not an economic model that can explain how the economy may react to changes such as to demand or prices. A major limitation of the use of input-output multipliers when used to conduct impact analysis is that the relationship between industry inputs and outputs (the coefficients) are fixed, implying that industry structures remain unchanged by the shock to the industry (for example, a change in demand or prices).
Effectively, input-output multipliers are based on the assumption of unlimited resources. For example extending the example above, it assumes the one per cent increase in interstate tourists attending a Melbourne based theatrical production can be accommodated in hotels through utilising what would otherwise have been empty rooms, and can find restaurant bookings in what would have otherwise be unfilled tables.
In reality, scarcity of availability of inputs (e.g. skilled labour, accommodation etc) mean that these inputs are affected by and respond to prices (e.g. wages, room prices). The higher prices, due to the increased demand for rooms by those visiting to attend the theatre, will at the margin reduce demand by some other visitors (perhaps those attending for shopping or to visit relatives). Therefore, the result will be that these price impacts will then have an impact on activity levels which feed back into price effects and so on.
In input-output analysis, where all adjustments relate only to the quantities produced, this type of feedback response is assumed not to occur. Consequently, using an input-output model can result in an overstatement of the impacts of a change in one sector on the broader economy. For these reasons, while the ABS previously published input-output multipliers, it has ceased publishing these estimates.
Economic Impact of the Victorian Arts and Cultural Sector | 30
© 2013 KPMG, an Australian partnership and a member firm of the KPMG network of independent member firms affiliated with KPMG International Cooperative (“KPMG International”), a Swiss entity. All rights reserved. The KPMG name, logo and “cutting through complexity” are registered
trademarks or trademarks of KPMG International. Liability limited by a scheme approved under Professional Standards Legislation.
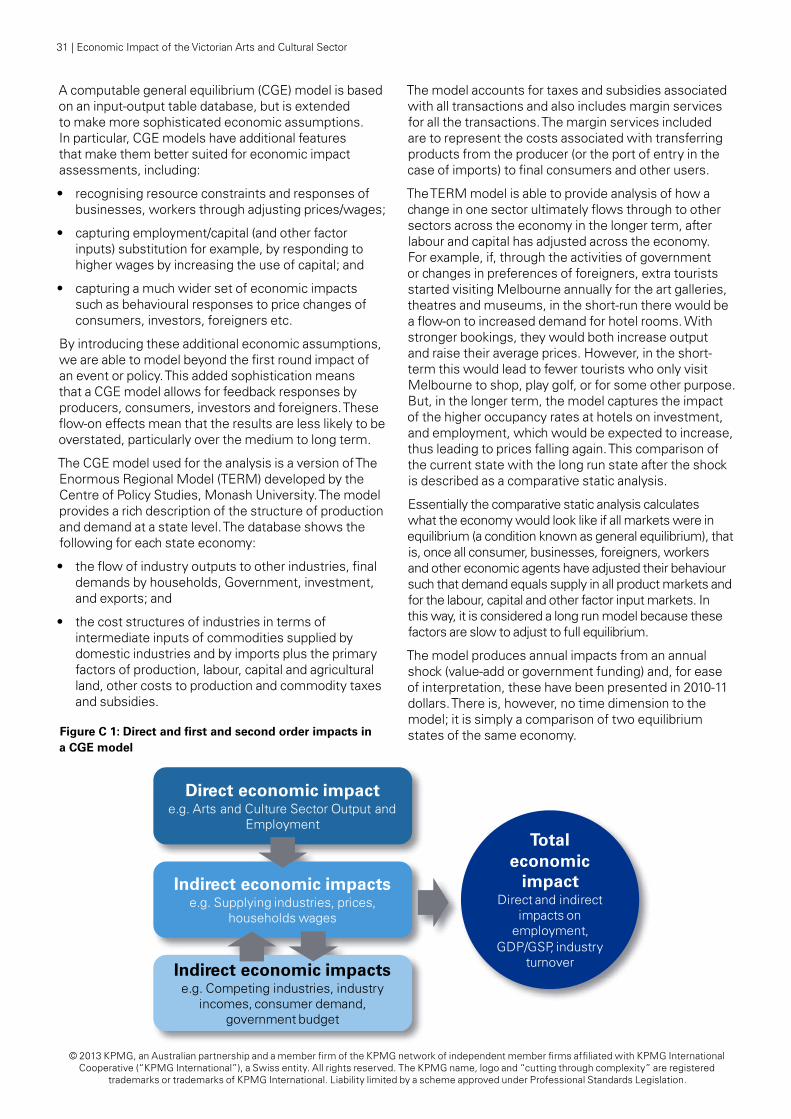
A computable general equilibrium (CGE) model is based on an input-output table database, but is extended to make more sophisticated economic assumptions. In particular, CGE models have additional features that make them better suited for economic impact assessments, including:
• recognising resource constraints and responses of businesses, workers through adjusting prices/wages;
• capturing employment/capital (and other factor inputs) substitution for example, by responding to higher wages by increasing the use of capital; and
• capturing a much wider set of economic impacts such as behavioural responses to price changes of consumers, investors, foreigners etc.
By introducing these additional economic assumptions, we are able to model beyond the first round impact of an event or policy. This added sophistication means that a CGE model allows for feedback responses by producers, consumers, investors and foreigners. These flow-on effects mean that the results are less likely to be overstated, particularly over the medium to long term.
The CGE model used for the analysis is a version of The Enormous Regional Model (TERM) developed by the Centre of Policy Studies, Monash University. The model provides a rich description of the structure of production and demand at a state level. The database shows the following for each state economy:
• the flow of industry outputs to other industries, final demands by households, Government, investment, and exports; and
• the cost structures of industries in terms of intermediate inputs of commodities supplied by domestic industries and by imports plus the primary factors of production, labour, capital and agricultural land, other costs to production and commodity taxes and subsidies.
The model accounts for taxes and subsidies associated with all transactions and also includes margin services for all the transactions. The margin services included are to represent the costs associated with transferring products from the producer (or the port of entry in the case of imports) to final consumers and other users.
The TERM model is able to provide analysis of how a change in one sector ultimately flows through to other sectors across the economy in the longer term, after labour and capital has adjusted across the economy. For example, if, through the activities of government or changes in preferences of foreigners, extra tourists started visiting Melbourne annually for the art galleries, theatres and museums, in the short-run there would be a flow-on to increased demand for hotel rooms. With stronger bookings, they would both increase output and raise their average prices. However, in the short-term this would lead to fewer tourists who only visit Melbourne to shop, play golf, or for some other purpose. But, in the longer term, the model captures the impact of the higher occupancy rates at hotels on investment, and employment, which would be expected to increase, thus leading to prices falling again. This comparison of the current state with the long run state after the shock is described as a comparative static analysis.
Essentially the comparative static analysis calculates what the economy would look like if all markets were in equilibrium (a condition known as general equilibrium), that is, once all consumer, businesses, foreigners, workers and other economic agents have adjusted their behaviour such that demand equals supply in all product markets and for the labour, capital and other factor input markets. In this way, it is considered a long run model because these factors are slow to adjust to full equilibrium.
The model produces annual impacts from an annual shock (value-add or government funding) and, for ease of interpretation, these have been presented in 2010-11 dollars. There is, however, no time dimension to the model; it is simply a comparison of two equilibrium states of the same economy. Figure C 1: Direct and first and second order impacts in
a CGE model
Direct economic impacte.g. Arts and Culture Sector Output and
Employment
Indirect economic impactse.g. Supplying industries, prices,
households wages
Indirect economic impactse.g. Competing industries, industry
incomes, consumer demand, government budget
Total economic
impactDirect and indirect
impacts on employment,
GDP/GSP, industry turnover
31 | Economic Impact of the Victorian Arts and Cultural Sector
© 2013 KPMG, an Australian partnership and a member firm of the KPMG network of independent member firms affiliated with KPMG International Cooperative (“KPMG International”), a Swiss entity. All rights reserved. The KPMG name, logo and “cutting through complexity” are registered
trademarks or trademarks of KPMG International. Liability limited by a scheme approved under Professional Standards Legislation.
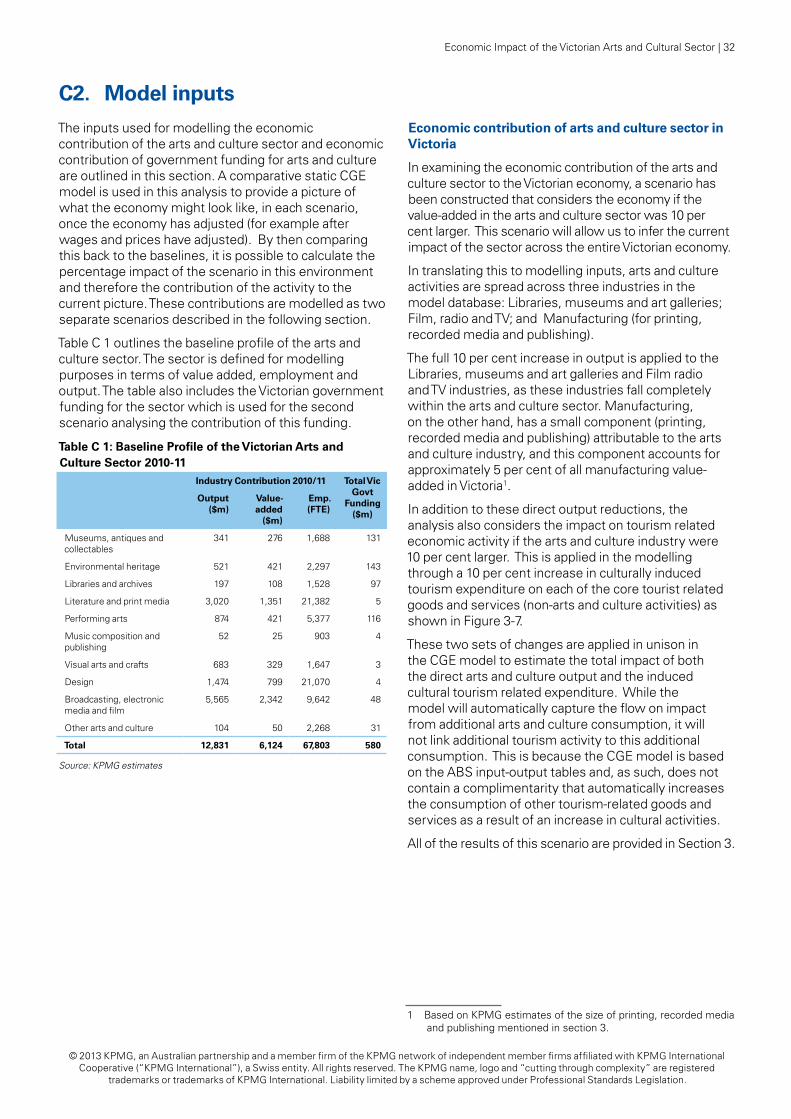
C2. Model inputs
The inputs used for modelling the economic contribution of the arts and culture sector and economic contribution of government funding for arts and culture are outlined in this section. A comparative static CGE model is used in this analysis to provide a picture of what the economy might look like, in each scenario, once the economy has adjusted (for example after wages and prices have adjusted). By then comparing this back to the baselines, it is possible to calculate the percentage impact of the scenario in this environment and therefore the contribution of the activity to the current picture. These contributions are modelled as two separate scenarios described in the following section.
Table C 1 outlines the baseline profile of the arts and culture sector. The sector is defined for modelling purposes in terms of value added, employment and output. The table also includes the Victorian government funding for the sector which is used for the second scenario analysing the contribution of this funding.
Table C 1: Baseline Profile of the Victorian Arts and Culture Sector 2010-11
Industry Contribution 2010/11 Total Vic Govt
Funding ($m)
Output ($m)
Value-added
($m)
Emp. (FTE)
Museums, antiques and collectables
341 276 1,688 131
Environmental heritage 521 421 2,297 143
Libraries and archives 197 108 1,528 97
Literature and print media 3,020 1,351 21,382 5
Performing arts 874 421 5,377 116
Music composition and publishing
52 25 903 4
Visual arts and crafts 683 329 1,647 3
Design 1,474 799 21,070 4
Broadcasting, electronic media and film
5,565 2,342 9,642 48
Other arts and culture 104 50 2,268 31
Total 12,831 6,124 67,803 580
Source: KPMG estimates
Economic contribution of arts and culture sector in Victoria
In examining the economic contribution of the arts and culture sector to the Victorian economy, a scenario has been constructed that considers the economy if the value-added in the arts and culture sector was 10 per cent larger. This scenario will allow us to infer the current impact of the sector across the entire Victorian economy.
In translating this to modelling inputs, arts and culture activities are spread across three industries in the model database: Libraries, museums and art galleries; Film, radio and TV; and Manufacturing (for printing, recorded media and publishing).
The full 10 per cent increase in output is applied to the Libraries, museums and art galleries and Film radio and TV industries, as these industries fall completely within the arts and culture sector. Manufacturing, on the other hand, has a small component (printing, recorded media and publishing) attributable to the arts and culture industry, and this component accounts for approximately 5 per cent of all manufacturing value-added in Victoria1.
In addition to these direct output reductions, the analysis also considers the impact on tourism related economic activity if the arts and culture industry were 10 per cent larger. This is applied in the modelling through a 10 per cent increase in culturally induced tourism expenditure on each of the core tourist related goods and services (non-arts and culture activities) as shown in Figure 3-7.
These two sets of changes are applied in unison in the CGE model to estimate the total impact of both the direct arts and culture output and the induced cultural tourism related expenditure. While the model will automatically capture the flow on impact from additional arts and culture consumption, it will not link additional tourism activity to this additional consumption. This is because the CGE model is based on the ABS input-output tables and, as such, does not contain a complimentarity that automatically increases the consumption of other tourism-related goods and services as a result of an increase in cultural activities.
All of the results of this scenario are provided in Section 3.
1 Based on KPMG estimates of the size of printing, recorded media and publishing mentioned in section 3.
Economic Impact of the Victorian Arts and Cultural Sector | 32
© 2013 KPMG, an Australian partnership and a member firm of the KPMG network of independent member firms affiliated with KPMG International Cooperative (“KPMG International”), a Swiss entity. All rights reserved. The KPMG name, logo and “cutting through complexity” are registered
trademarks or trademarks of KPMG International. Liability limited by a scheme approved under Professional Standards Legislation.
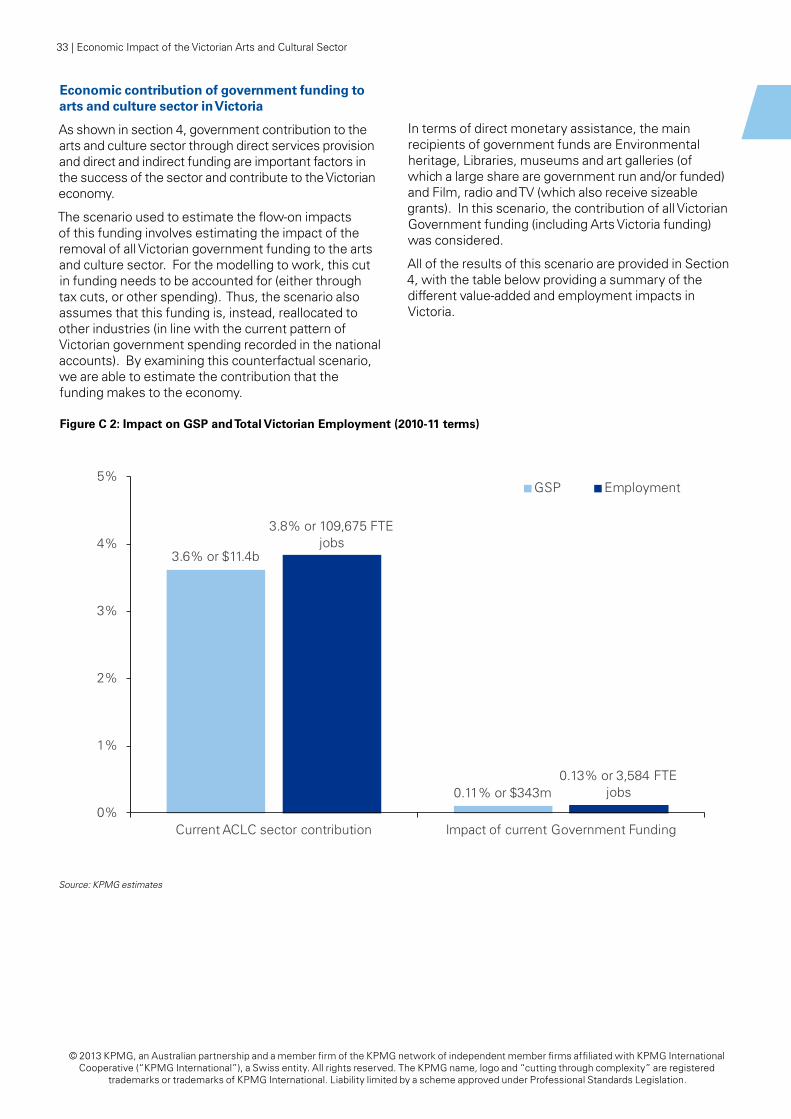
Economic contribution of government funding to arts and culture sector in Victoria
As shown in section 4, government contribution to the arts and culture sector through direct services provision and direct and indirect funding are important factors in the success of the sector and contribute to the Victorian economy.
The scenario used to estimate the flow-on impacts of this funding involves estimating the impact of the removal of all Victorian government funding to the arts and culture sector. For the modelling to work, this cut in funding needs to be accounted for (either through tax cuts, or other spending). Thus, the scenario also assumes that this funding is, instead, reallocated to other industries (in line with the current pattern of Victorian government spending recorded in the national accounts). By examining this counterfactual scenario, we are able to estimate the contribution that the funding makes to the economy.
In terms of direct monetary assistance, the main recipients of government funds are Environmental heritage, Libraries, museums and art galleries (of which a large share are government run and/or funded) and Film, radio and TV (which also receive sizeable grants). In this scenario, the contribution of all Victorian Government funding (including Arts Victoria funding) was considered.
All of the results of this scenario are provided in Section 4, with the table below providing a summary of the different value-added and employment impacts in Victoria.
Figure C 2: Impact on GSP and Total Victorian Employment (2010-11 terms)
3.6% or $11.4b
0.11% or $343m
3.8% or 109,675 FTE jobs
0.13% or 3,584 FTE jobs
0%
1%
2%
3%
4%
5%
Current ACLC sector contribution Impact of current Government Funding
GSP Employment
Source: KPMG estimates
33 | Economic Impact of the Victorian Arts and Cultural Sector
© 2013 KPMG, an Australian partnership and a member firm of the KPMG network of independent member firms affiliated with KPMG International Cooperative (“KPMG International”), a Swiss entity. All rights reserved. The KPMG name, logo and “cutting through complexity” are registered
trademarks or trademarks of KPMG International. Liability limited by a scheme approved under Professional Standards Legislation.
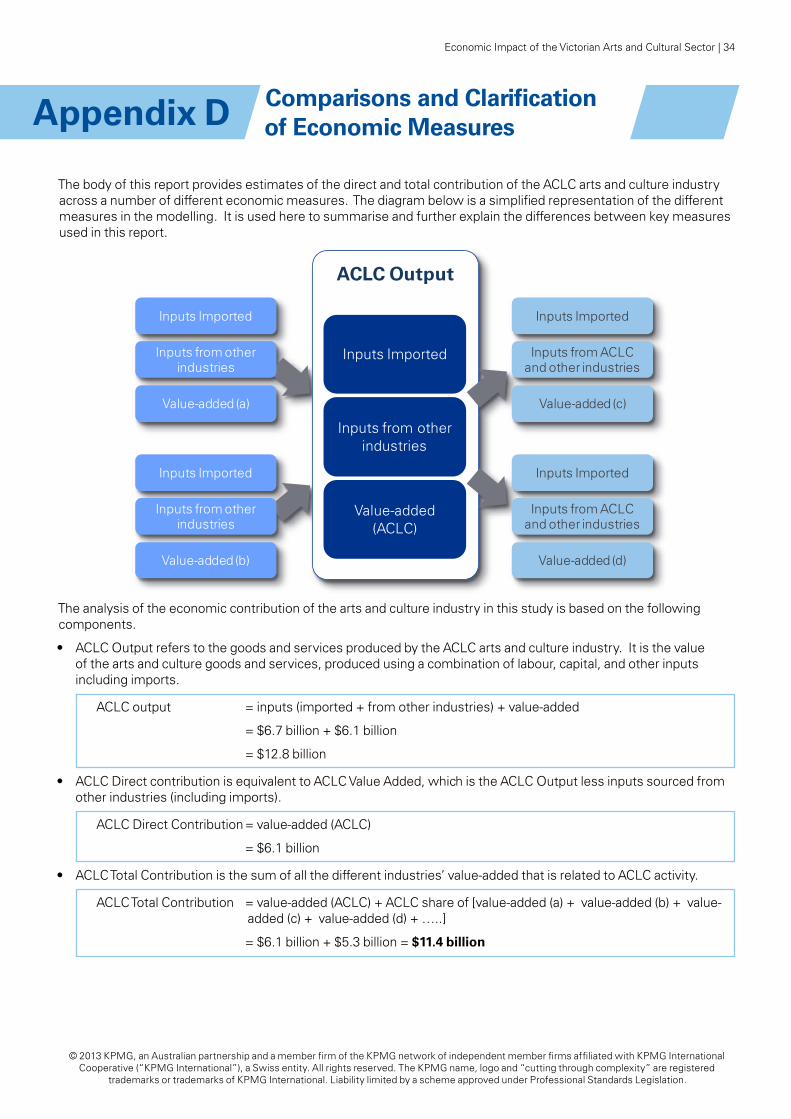
Comparisons and Clarification of Economic Measures Appendix D
The body of this report provides estimates of the direct and total contribution of the ACLC arts and culture industry across a number of different economic measures. The diagram below is a simplified representation of the different measures in the modelling. It is used here to summarise and further explain the differences between key measures used in this report.
The analysis of the economic contribution of the arts and culture industry in this study is based on the following components.
• ACLC Output refers to the goods and services produced by the ACLC arts and culture industry. It is the value of the arts and culture goods and services, produced using a combination of labour, capital, and other inputs including imports.
ACLC output = inputs (imported + from other industries) + value-added
= $6.7 billion + $6.1 billion
= $12.8 billion
• ACLC Direct contribution is equivalent to ACLC Value Added, which is the ACLC Output less inputs sourced from other industries (including imports).
ACLC Direct Contribution = value-added (ACLC)
= $6.1 billion
• ACLC Total Contribution is the sum of all the different industries’ value-added that is related to ACLC activity.
ACLC Total Contribution = value-added (ACLC) + ACLC share of [value-added (a) + value-added (b) + value-added (c) + value-added (d) + …..]
= $6.1 billion + $5.3 billion = $11.4 billion
ACLC Output
Inputs Imported
Value-added (ACLC)
Inputs from other industries
Inputs Imported
Value-added (c)
Inputs from ACLCand other industries
Inputs Imported
Value-added (d)
Inputs from ACLCand other industries
Inputs Imported
Value-added (a)
Inputs Imported
Value-added (b)
Inputs from other industries
Inputs from other industries
Economic Impact of the Victorian Arts and Cultural Sector | 34
© 2013 KPMG, an Australian partnership and a member firm of the KPMG network of independent member firms affiliated with KPMG International Cooperative (“KPMG International”), a Swiss entity. All rights reserved. The KPMG name, logo and “cutting through complexity” are registered
trademarks or trademarks of KPMG International. Liability limited by a scheme approved under Professional Standards Legislation.
References
• Arts.vic.gov.au (n.d.) Arts Victoria - Arts Development. Available at: http://www.arts.vic.gov.au/Funding_Programs/Arts_Development [Accessed: 1 Feb 2013].
• Australian Bureau of Statistics (2006) Employment in Culture, Australia. Catalogue 6273.0.
• Australian Bureau of Statistics (2008) Australian Culture and Leisure Classifications. Catalogue 4902.0.
• Australian Bureau of Statistics (2011a) Arts and Culture in Australia: A Statistical Overview. Catalogue 4172.0.
• Australian Bureau of Statistics (2011b) Cultural Funding by Government, Australia 2010–11. Catalogue 4183.0.
• Australian Bureau of Statistics (2011c) Australian Industry, 2010-11. Catalogue 8155.0.
• Australian Bureau of Statistics (2011d) Employment in Culture, Australia. Catalogue 6273.0.
• Australian Bureau of Statistics (2012a) Australian National Accounts: Input Output Tables. Catalogue 5209.0.
• Australian Bureau of Statistics (2012b) Australian National Accounts: State Accounts. Catalogue 5220.0.
• Australian Bureau of Statistics (2012c) Labour Force, Australia, Detailed, Quarterly. Catalogue 6291.0.
• Australian Bureau of Statistics (2012d) Cultural Funding in Australia, Three Tiers of Government, 2009-10.
• Australian Bureau of Statistics (2012e) Australian Demographic Statistics, Sep 2012, Catalogue (3101.0)
• Australian Bureau of Statistics (2012f) Australian National Accounts. Catalogue 5204.0.
• Australian Bureau of Statistics (2012g) Australian Industry, 2010-1. Catalogue 8155.0
• Back to Back Theatre (2012) Back to Back Theatre Annual Report 2011. Back to Back Theatre.
• Backtobacktheatre.com (2012) Awards Back to Back Theatre. Available at: http://backtobacktheatre.com/about/awards [Accessed: 1 Feb 2013]
• Bendigo Art Gallery (2006) Bendigo Art Gallery Annual Report 2005-06. Bendigo Art Gallery.
• Bendigo Art Gallery (2012) Bendigo Art Gallery Annual Report 2011-12. Bendigo Art Gallery.
• Comedyfestival.com.au (2012a) Background | Melbourne International Comedy Festival 2013. Available at: http://www.comedyfestival.com.au/about-us/background/ [Accessed: 1 Feb 2013].
• Comedyfestival.com.au (2012b) 2012 Results | Melbourne International Comedy Festival 2012. Available at: http://www.comedyfestival.com.au/2012/season/results/ [Accessed: 1 Feb 2013].
• Cornish, R. (2012) Boomtown Bendigo finds its country cool. The Age, 25th August.
• CRC for Sustainable Tourism (2008) Culture and heritage tourism: understanding the issues and success factors. [report] CRC for Sustainable Tourism.
• Dallas, S. (2011) The Slap sells to the US and Canada. IF Magazine, 8th November. Available at: http://if.com.au/2011/11/18/article/PUCGJOOYLT.html [Accessed: 1 February 2013].
• Deloitte Access Economics (2011) The economic social and cultural contribution of venue-based live music in Victoria. Arts Victoria.
• Euromonitor (2012) Tourism Flows Inbound in Australia. Travel and Tourism, Country Report. Euromonitor.
• Film.vic.gov.au (2012) What we do - Film Victoria. Available at: http://www.film.vic.gov.au/about/what-we-do [Accessed: 1 Feb 2013].
• Fleming, T. and Erskine, A. (2011) Supporting growth in the arts economy. Arts Council England.
• Hildebrand, J. (2012) Which is the real cultural capital of Australia? Melbourne or Sydney?. The Daily Telegraph, 23rd May. Available at: http://www.dailytelegraph.com.au/news/which-is-the-real-cultural-capital-of-australia-melbourne-or-sydney/story-e6freuy9-1226364740642 [Accessed: 1/2/2013].
• Idato, M. (2012a) Three Australian shows and one Australian nominated for International Emmys. The Age, 9th October.
35 | Economic Impact of the Victorian Arts and Cultural Sector
© 2013 KPMG, an Australian partnership and a member firm of the KPMG network of independent member firms affiliated with KPMG International Cooperative (“KPMG International”), a Swiss entity. All rights reserved. The KPMG name, logo and “cutting through complexity” are registered
trademarks or trademarks of KPMG International. Liability limited by a scheme approved under Professional Standards Legislation.
• Idato, M. (2012b) The Slap in Amazing Race for Emmy’s. Sydney Morning Herald, 18th November. Available at: http://www.smh.com.au/entertainment/tv-and-radio/the-slap-in-amazing-race-for-emmys-20121117-29iwm.html [Accessed: 1 February 2013].
• IER (2012), Grace Kelly Exhibition Bendigo Art Gallery: Economic Impact and Market Research Report.
• Janeczko, B. et al. (2002) Estimating the economic impacts of festivals and events: a research guide. CRC Sustainable Tourism.
• Kalina, P. (2011) Small screen, great adaptations. The Age, 28th July.
• Lovett, V. (2012). General Manager of the Melbourne International Comedy Festival. Interviewed by Virginia Spring 8 October 2012.
• Mackenzie, K. (2013), Executive Manager Tourism, City of Greater Bendigo. Interviewed by Virginia Spring 24 October 2012.
• Melbourne International Comedy Festival (2012), Marketing Report 28 March – 22 April 2012.
• Minister for Tourism and Major Events The Hon Louise Asher MP (2013) Festival goers set to be all smiles with funding boost to Melbourne International Comedy Festival. [press release] 29 February 2012.
• Museum Victoria (2012) Annual Report 2011-12. Museum Victoria, p.23-33.
• Museumvictoria.com.au (2009) About the exhibition: Melbourne Museum. Available at: http://museumvictoria.com.au/melbournemuseum/discoverycentre/pompeii/about-the-exhibition/ [Accessed: 1 Feb 2013].
• Nash, A. (2012), Executive Producer, Back to Back Theatre. Interviewed by Virginia Spring 9 November 2012.
• OzTAM (n.d.) OzTAM ratings reports. Available at: http://www.oztam.com.au/Default.aspx [Accessed: 1 Feb 2013].
• Patriciapiccinini.net (2012) Patricia Piccinini CV. Available at: http://www.patriciapiccinini.net/cv/ [Accessed: 1 Feb 2013].
• Piccinini, P. (2013), personal communication. Interviewed by Virginia Spring, 23 October 2012.
• Rolfe, T. (2013), Head, MV Studios, Museum Victoria. Interviewed by Virginia Spring, 10 October 2012.
• State of Victoria (2012) Funding to safeguard Victoria’s cultural treasures. 2012-13 Victorian State Budget.
• Tourism Research Australia (2009) Cultural and heritage tourism in Australia: Snapshots 2009. Tourism Research Australia.
• Tourism Research Australia (2011) International Visitors in Australia – December 2011 Quarterly Results of the International Visitor Survey.
• Tourism Research Australia (2012) unpublished data
• Tourism Victoria (2012) Domestic Visitor Estimates to Victoria by Origin. Tourism Victoria.
• Tourism.vic.gov.au (2012) Tourism Victoria - Home. Available at: http://www.tourism.vic.gov.au/ [Accessed: 1 Feb 2013].
• United Nations (2010) Creative Economy: A Feasible Development option. United Nations.
• Victorian Government (2012) Securing Victoria’s Economy, 2012.
• Victorian Major Events Company (2009) Australian Open - Major events - Victorian Major Events Company (VMEC). Available at: http://www.vmec.com.au/major-events [Accessed: 1 Feb 2013].
Economic Impact of the Victorian Arts and Cultural Sector | 36
© 2013 KPMG, an Australian partnership and a member firm of the KPMG network of independent member firms affiliated with KPMG International Cooperative (“KPMG International”), a Swiss entity. All rights reserved. The KPMG name, logo and “cutting through complexity” are registered
trademarks or trademarks of KPMG International. Liability limited by a scheme approved under Professional Standards Legislation.
ARTS VICTORIA
Economic Impact of the Victorian Arts and Cultural Sector
2013
kpmg.com.au
Inherent Limitations
This report has been prepared as outlined in the Introduction Section. The services provided in connection with this engagement comprise an advisory engagement, which is not subject to assurance or other standards issued by the Australian Auditing and Assurance Standards Board and, consequently no opinions or conclusions intended to convey assurance have been expressed.
No warranty of completeness, accuracy or reliability is given in relation to the statements and representations made by, and the information and documentation provided by, Arts Victoria management and personnel consulted as part of the process.
KPMG have indicated within this report the sources of the information provided. We have not sought to independently verify those sources unless otherwise noted within the report.
KPMG is under no obligation in any circumstance to update this report, in either oral or written form, for events occurring after the report has been issued in final form.
The findings in this report have been formed on the above basis.
Third Party Reliance
This report has been prepared at the request of Arts Victoria in accordance with the terms of KPMG’s engagement letter/contract dated July 2012. Other than our responsibility to Arts Victoria, neither KPMG nor any member or employee of KPMG undertakes responsibility arising in any way from reliance placed by a third party on this report. Any reliance placed is that party’s sole responsibility.
Contact us
Simon CordenDirector, Government Advisory Services - AdvisoryT: + 61 (3) 9288 6183 E: [email protected]
Jodie PatronAssociate Director, EconomicsAdvisoryT: + 61 (2) 6248 1063 E: [email protected]
www.kpmg.com.au