Embed Size (px)
Citation preview

Artificial Neural Networksvs.
The Beating the Dow Strategy
Dr. John C. Merkel IIIMorehouse College
$
Motivation
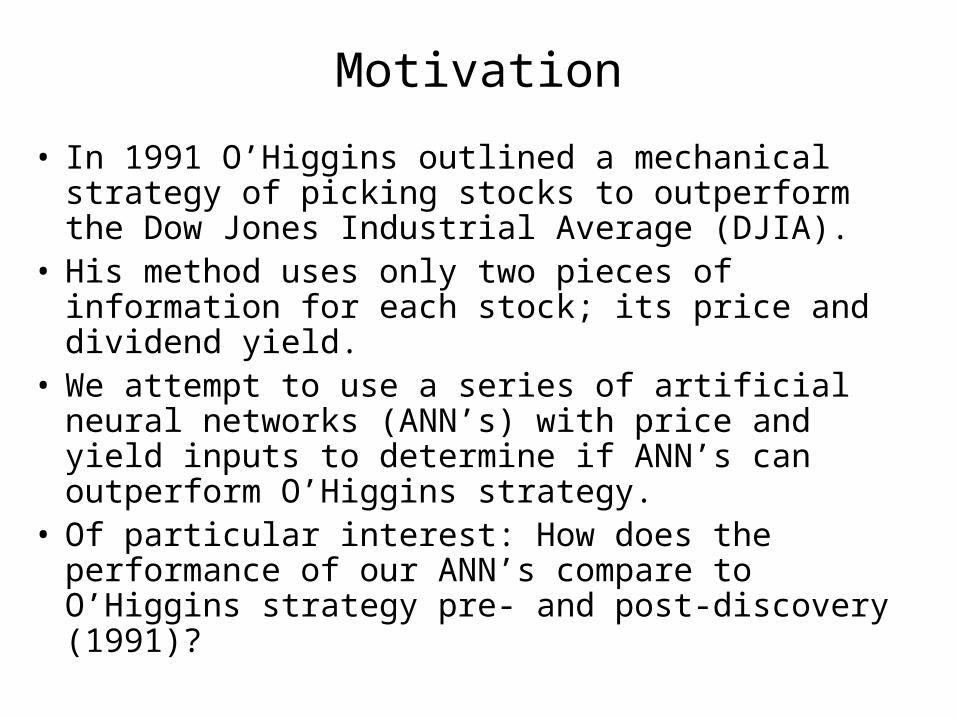
• In 1991 O’Higgins outlined a mechanical strategy of picking stocks to outperform the Dow Jones Industrial Average (DJIA).
• His method uses only two pieces of information for each stock; its price and dividend yield.
• We attempt to use a series of artificial neural networks (ANN’s) with price and yield inputs to determine if ANN’s can outperform O’Higgins strategy.
• Of particular interest: How does the performance of our ANN’s compare to O’Higgins strategy pre- and post-discovery (1991)?

Presentation Outline
• Part I - Introduction to O’Higgins’ Beating the Dow (BTD)
strategy/algorithm.
• Part II - Applying an ANN to the BTD strategy.
• Part III - Who won? The Results.

Part I
The Beating the Dow Strategy
Michael O’Higgins – Beating the Dow (1991)
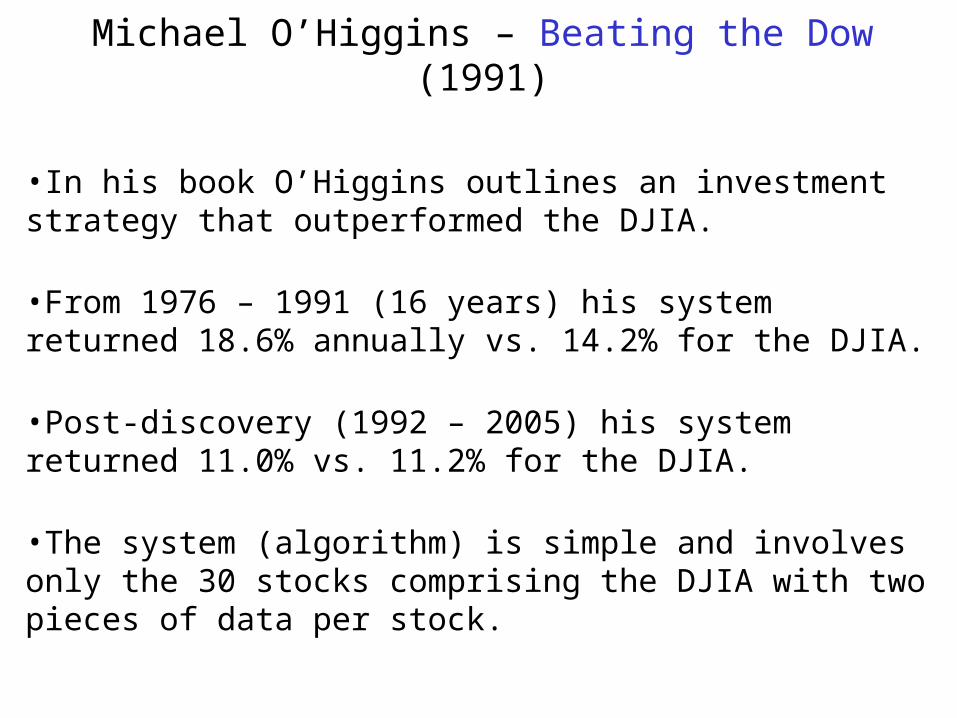
•In his book O’Higgins outlines an investment strategy that outperformed the DJIA.
•From 1976 – 1991 (16 years) his system returned 18.6% annually vs. 14.2% for the DJIA.
•Post-discovery (1992 – 2005) his system returned 11.0% vs. 11.2% for the DJIA.
•The system (algorithm) is simple and involves only the 30 stocks comprising the DJIA with two pieces of data per stock.
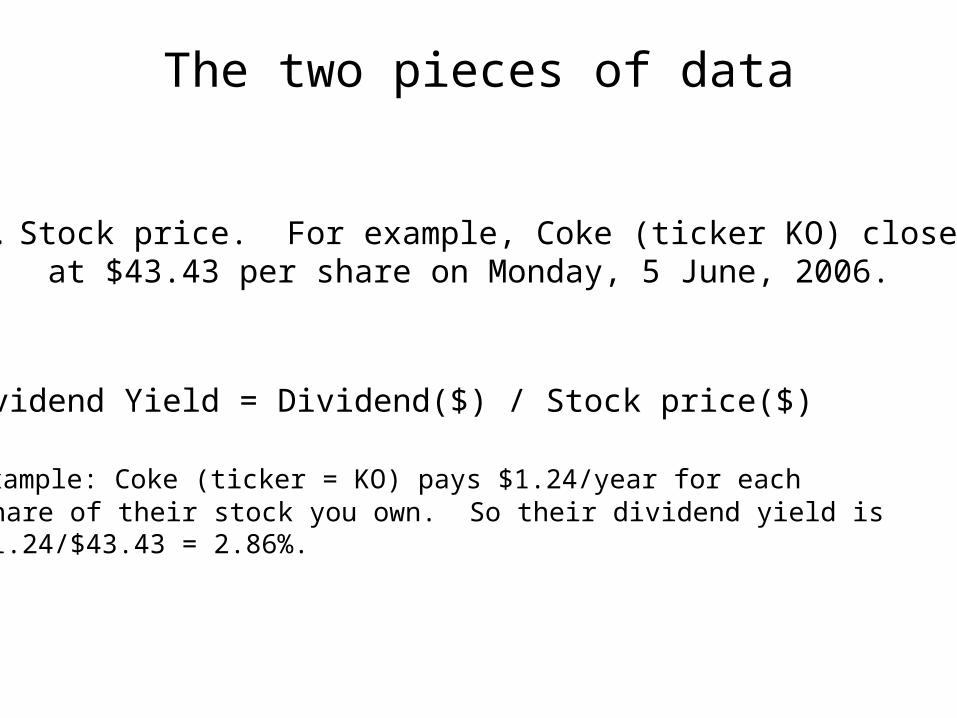
The two pieces of data
2. Dividend Yield = Dividend($) / Stock price($) Example: Coke (ticker = KO) pays $1.24/year for each share of their stock you own. So their dividend yield is $1.24/$43.43 = 2.86%.
1. Stock price. For example, Coke (ticker KO) closed at $43.43 per share on Monday, 5 June, 2006.
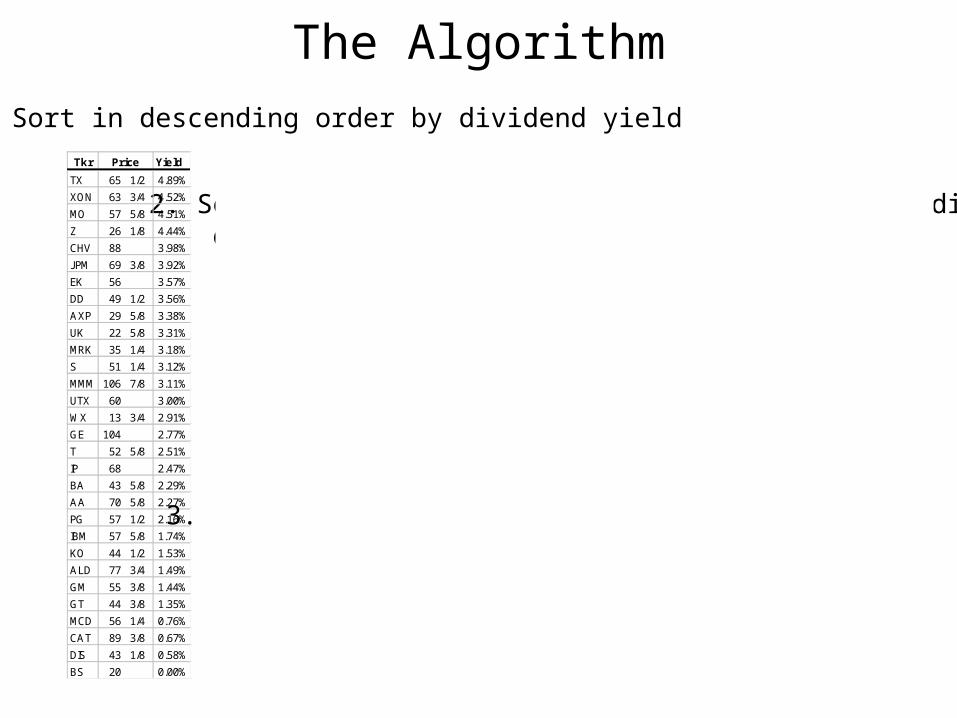
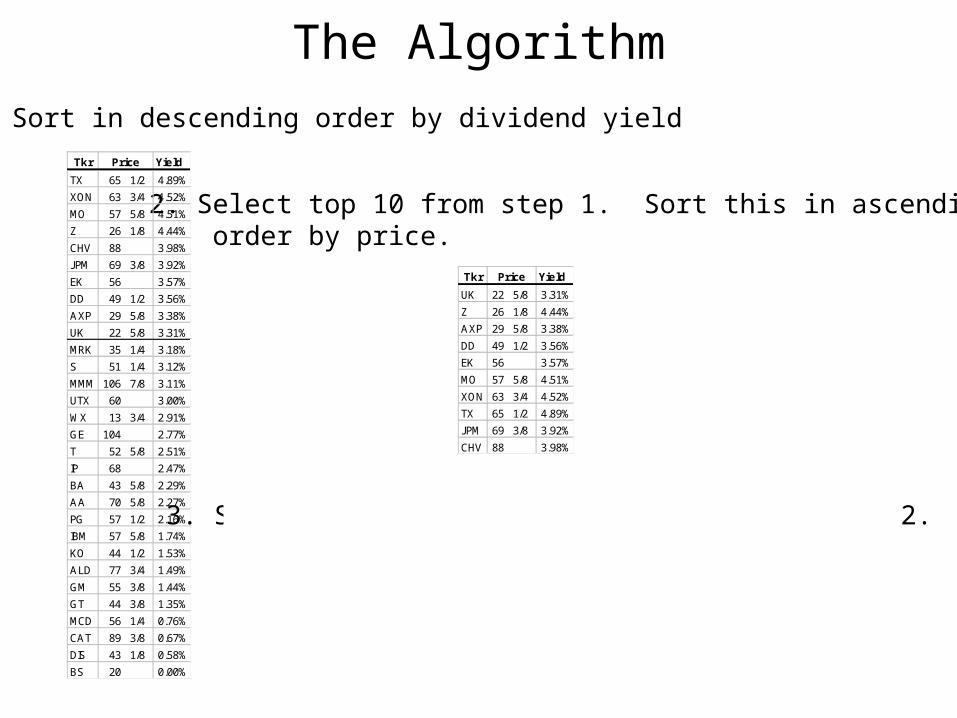
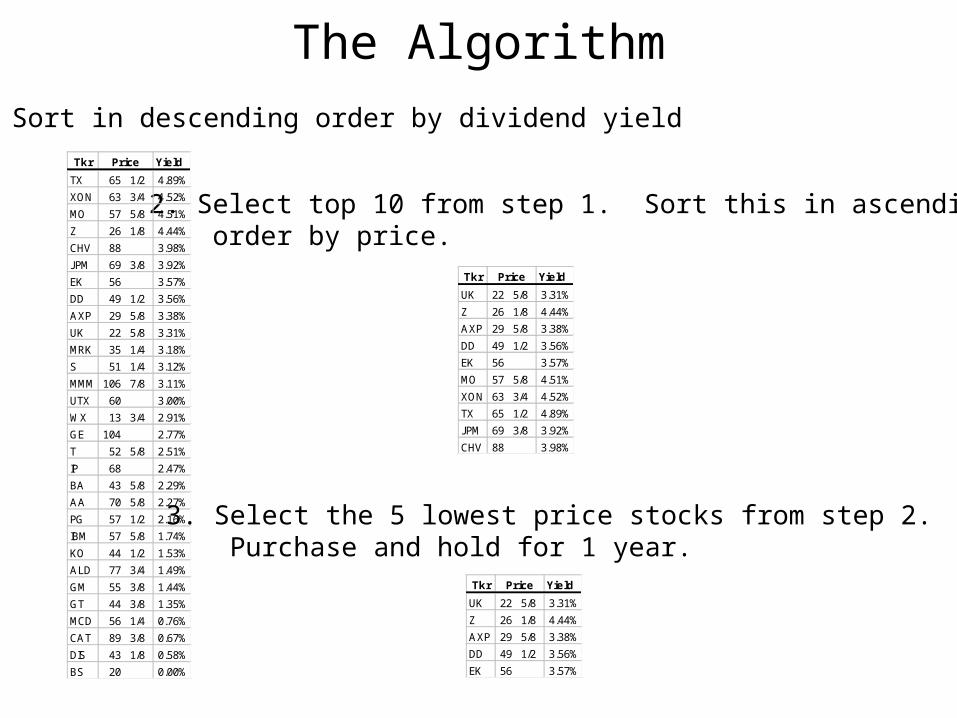
The Algorithm1. Sort in descending order by dividend yield
2. Select top 10 from step 1. Sort this in ascending order by price.
Tkr Price Yield
TX 65 1/2 4.89%
XON 63 3/4 4.52%
MO 57 5/8 4.51%
Z 26 1/8 4.44%
CHV 88 3.98%
JPM 69 3/8 3.92%
EK 56 3.57%
DD 49 1/2 3.56%
AXP 29 5/8 3.38%
UK 22 5/8 3.31%
MRK 35 1/4 3.18%
S 51 1/4 3.12%
MMM 106 7/8 3.11%
UTX 60 3.00%
WX 13 3/4 2.91%
GE 104 2.77%
T 52 5/8 2.51%
IP 68 2.47%
BA 43 5/8 2.29%
AA 70 5/8 2.27%
PG 57 1/2 2.16%
IBM 57 5/8 1.74%
KO 44 1/2 1.53%
ALD 77 3/4 1.49%
GM 55 3/8 1.44%
GT 44 3/8 1.35%
MCD 56 1/4 0.76%
CAT 89 3/8 0.67%
DIS 43 1/8 0.58%
BS 20 0.00%
Tkr Price Yield
UK 22 5/8 3.31%
Z 26 1/8 4.44%
AXP 29 5/8 3.38%
DD 49 1/2 3.56%
EK 56 3.57%
MO 57 5/8 4.51%
XON 63 3/4 4.52%
TX 65 1/2 4.89%
JPM 69 3/8 3.92%
CHV 88 3.98%
3. Select the 5 lowest price stocks from step 2. Purchase and hold for 1 year.
Tkr Price Yield
UK 22 5/8 3.31%
Z 26 1/8 4.44%
AXP 29 5/8 3.38%
DD 49 1/2 3.56%
EK 56 3.57%
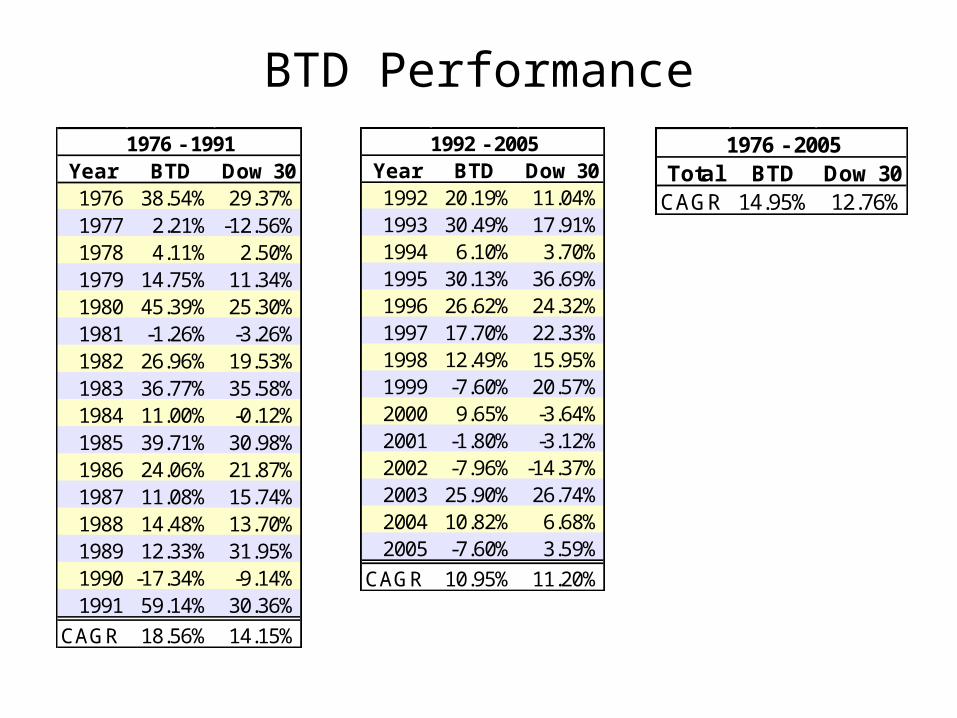
BTD Performance
Year BTD Dow 301992 20.19% 11.04%1993 30.49% 17.91%1994 6.10% 3.70%1995 30.13% 36.69%1996 26.62% 24.32%1997 17.70% 22.33%1998 12.49% 15.95%1999 -7.60% 20.57%2000 9.65% -3.64%2001 -1.80% -3.12%2002 -7.96% -14.37%2003 25.90% 26.74%2004 10.82% 6.68%2005 -7.60% 3.59%
CAGR 10.95% 11.20%
1992 - 2005Year BTD Dow 301976 38.54% 29.37%1977 2.21% -12.56%1978 4.11% 2.50%1979 14.75% 11.34%1980 45.39% 25.30%1981 -1.26% -3.26%1982 26.96% 19.53%1983 36.77% 35.58%1984 11.00% -0.12%1985 39.71% 30.98%1986 24.06% 21.87%1987 11.08% 15.74%1988 14.48% 13.70%1989 12.33% 31.95%1990 -17.34% -9.14%1991 59.14% 30.36%
CAGR 18.56% 14.15%
1976 - 1991
Total BTD Dow 30CAGR 14.95% 12.76%
1976 - 2005

Part II
Applying a Neural Network
Motivation
• If O’Higgins is right, then dividend yield and stock price have some predictive power concerning stock performance.
• Idea: can an ANN use these same 2 pieces of data to make predictions about a stock?
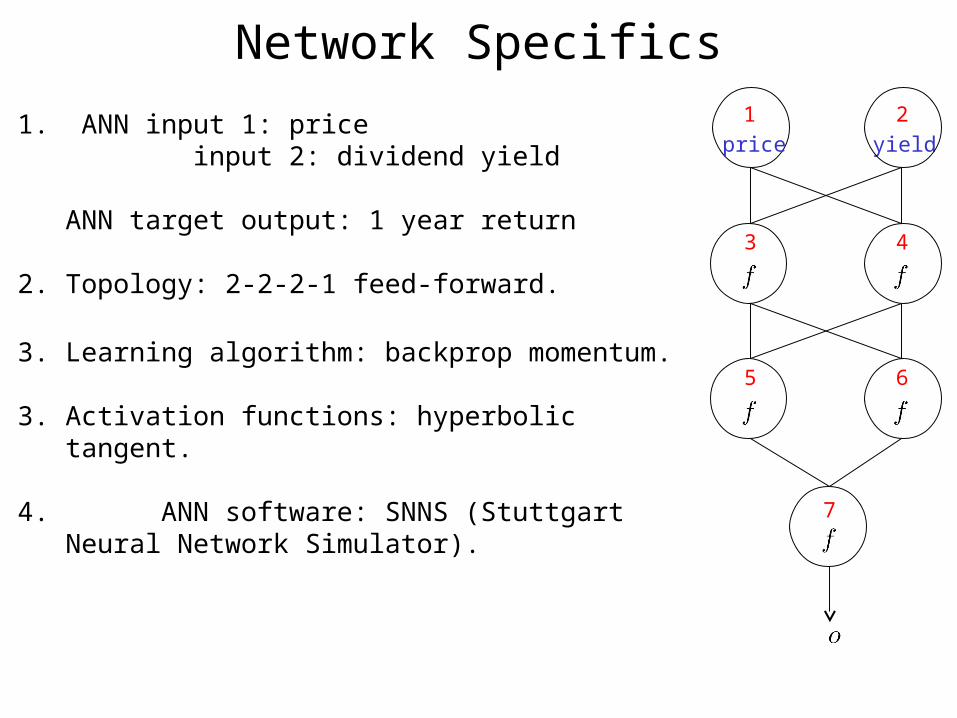
Network Specifics
1. ANN input 1: price input 2: dividend yield
ANN target output: 1 year return
2. Topology: 2-2-2-1 feed-forward.
3. Learning algorithm: backprop momentum.
3. Activation functions: hyperbolic tangent.
4. ANN software: SNNS (Stuttgart Neural Network Simulator).
1
4
2
3
5
price yield
6
7
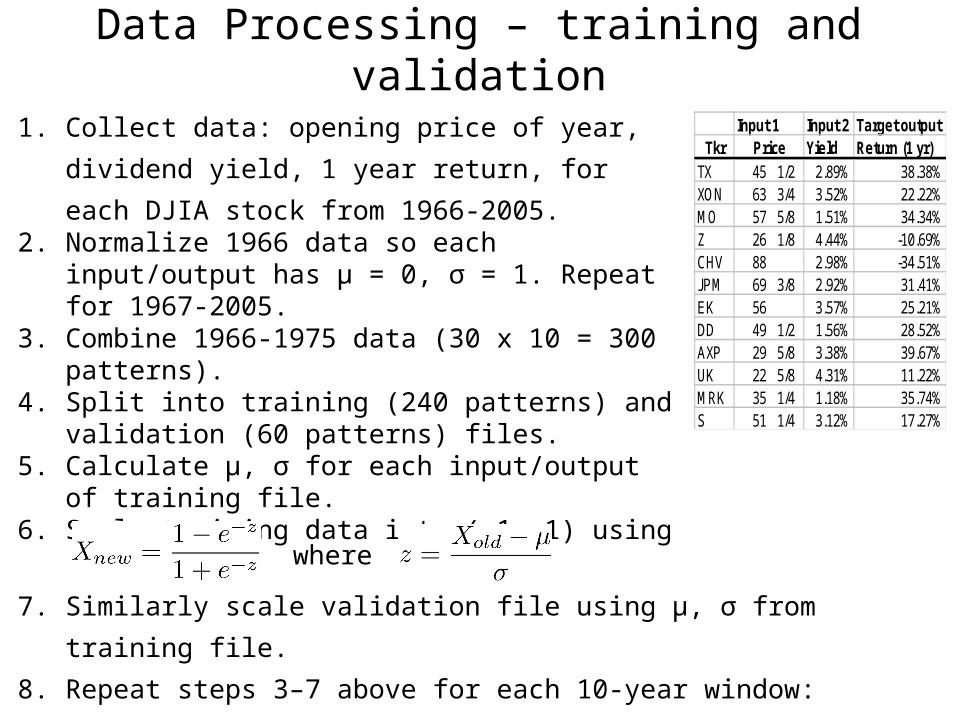
Data Processing – training and validation
1. Collect data: opening price of year, dividend
yield, 1 year return, for each DJIA stock from
1966-2005.2. Normalize 1966 data so each input/output
has μ = 0, σ = 1. Repeat for 1967-2005.3. Combine 1966-1975 data (30 x 10 = 300
patterns).4. Split into training (240 patterns) and
validation (60 patterns) files.5. Calculate μ, σ for each input/output of
training file. 6. Scale training data into (-1, 1) using
Input 1 Input 2 Target outputTkr Price Yield Return (1 yr)
TX 45 1/2 2.89% 38.38%XON 63 3/4 3.52% 22.22%MO 57 5/8 1.51% 34.34%Z 26 1/8 4.44% -10.69%CHV 88 2.98% -34.51%JPM 69 3/8 2.92% 31.41%EK 56 3.57% 25.21%DD 49 1/2 1.56% 28.52%AXP 29 5/8 3.38% 39.67%UK 22 5/8 4.31% 11.22%MRK 35 1/4 1.18% 35.74%S 51 1/4 3.12% 17.27%
where
7. Similarly scale validation file using μ, σ from training file.
8. Repeat steps 3–7 above for each 10-year window:
67-76, 68-77,…, 95-04.
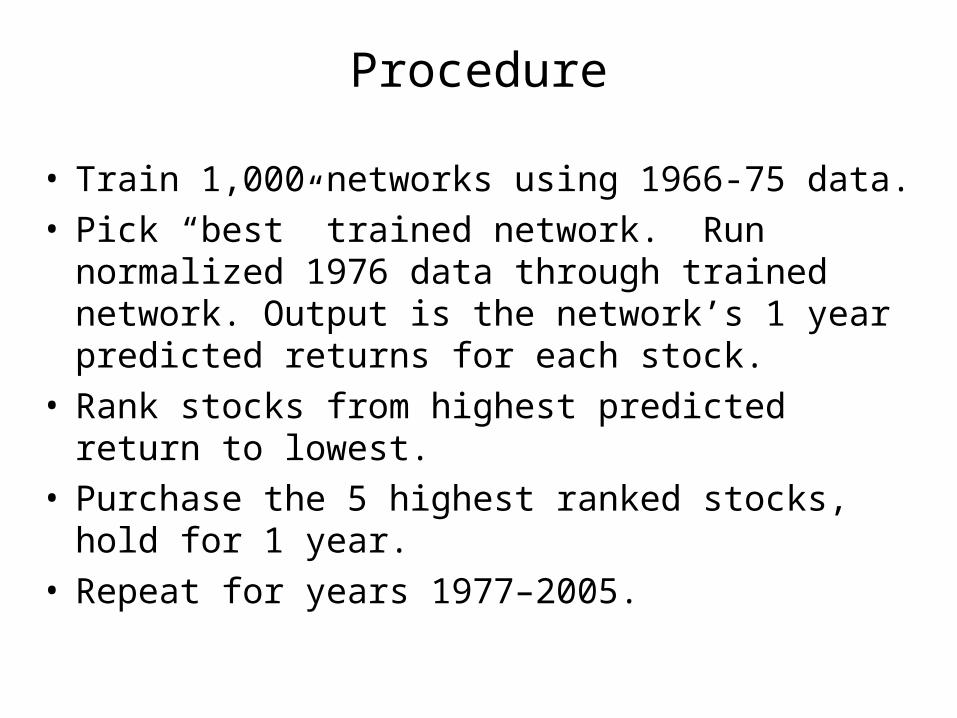
Procedure
• Train 1,000 networks using 1966-75 data.• Pick “best” trained network. Run
normalized 1976 data through trained network. Output is the network’s 1 year predicted returns for each stock.
• Rank stocks from highest predicted return to lowest.
• Purchase the 5 highest ranked stocks, hold for 1 year.
• Repeat for years 1977–2005.
Part III
Results
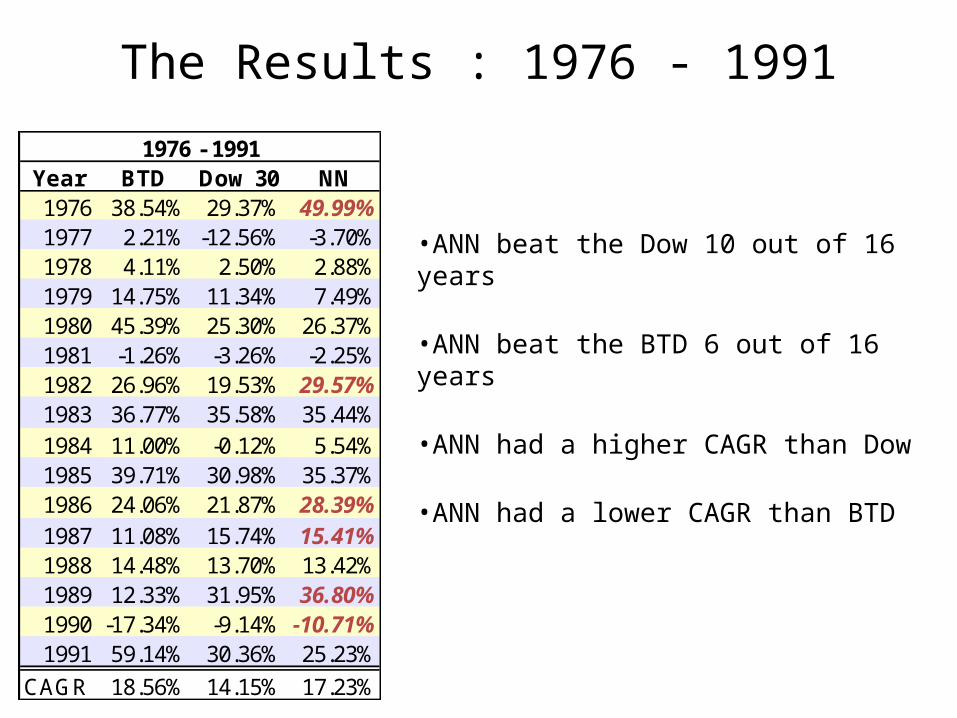
The Results : 1976 - 1991
•ANN beat the Dow 10 out of 16 years
•ANN beat the BTD 6 out of 16 years
•ANN had a higher CAGR than Dow
•ANN had a lower CAGR than BTD
Year BTD Dow 30 NN1976 38.54% 29.37% 49.99%1977 2.21% -12.56% -3.70%1978 4.11% 2.50% 2.88%1979 14.75% 11.34% 7.49%1980 45.39% 25.30% 26.37%1981 -1.26% -3.26% -2.25%1982 26.96% 19.53% 29.57%1983 36.77% 35.58% 35.44%1984 11.00% -0.12% 5.54%1985 39.71% 30.98% 35.37%1986 24.06% 21.87% 28.39%1987 11.08% 15.74% 15.41%1988 14.48% 13.70% 13.42%1989 12.33% 31.95% 36.80%1990 -17.34% -9.14% -10.71%1991 59.14% 30.36% 25.23%
CAGR 18.56% 14.15% 17.23%
1976 - 1991
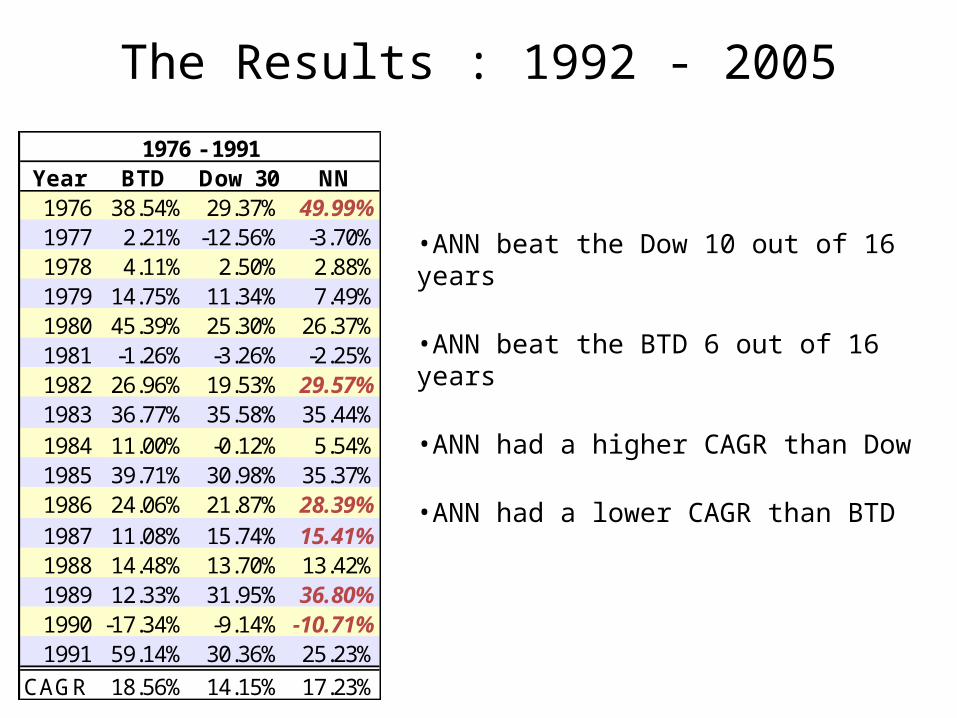
The Results : 1992 - 2005
•ANN beat the Dow 10 out of 16 years
•ANN beat the BTD 6 out of 16 years
•ANN had a higher CAGR than Dow
•ANN had a lower CAGR than BTD
Year BTD Dow 30 NN1976 38.54% 29.37% 49.99%1977 2.21% -12.56% -3.70%1978 4.11% 2.50% 2.88%1979 14.75% 11.34% 7.49%1980 45.39% 25.30% 26.37%1981 -1.26% -3.26% -2.25%1982 26.96% 19.53% 29.57%1983 36.77% 35.58% 35.44%1984 11.00% -0.12% 5.54%1985 39.71% 30.98% 35.37%1986 24.06% 21.87% 28.39%1987 11.08% 15.74% 15.41%1988 14.48% 13.70% 13.42%1989 12.33% 31.95% 36.80%1990 -17.34% -9.14% -10.71%1991 59.14% 30.36% 25.23%
CAGR 18.56% 14.15% 17.23%
1976 - 1991