Embed Size (px)
Citation preview
Journal of Civil Engineering and Construction Technology Vol. 2(3), pp. 54-64, March 2011 Available online at http://www.academicjournals.org/jcect ISSN 2141-2634 ©2011Academic Journals
Full Length Research Paper
Artificial neural networks in calculation of telecommunication towers natural frequency
Kaveh Kumarci* and Afsaneh Banitalebi Dehkordi
Sama Technical and Vocational Training Collage, Islamic Azad University, Shahrekord Branch, Shahr-e-kord, Iran.
Accepted 2 December, 2010
The present paper presented the training or learning algorithms in telecommunication towers based on the artificial neural networks to calculate accurately their natural frequency in different supporting conditions. Using SAP2000 program, the real frequency is calculated and is defined as a goal function for neural network, so that all outputs of the network can be compared to this function and the error can be calculated. The inputs including dimensions or specifications of telecommunication towers are made in MATLAB environment. According to the presented results, the performance of the neural network is optimum, and the errors are less than 6%, so the network can perform training in different manner. Furthermore, compare with analysis time of SAP2000 software, the time of frequency calculations in neural network is very low the precision of 9% is recorded. Key words: Natural frequency, artificial intelligence, telecommunication towers, training and learning algorithm.
INTRODUCTION The subject of neural networks is an offshoot of artificial intelligence, date back to the 1940s, when McCulloch and Pitts developed the first neural model. Since then the wide interest in artificial neural networks, both among researchers and areas of various applications, has resulted in more powerful networks, better training algorithms and improved hardware (Nayak et al., 2001).
Soft computing techniques such as expert systems, fuzzy logic, neural networks and other techniques differ from conventional hard computing in that they are tractable, robust, efficient and inexpensive (Nikravesh and Aminzadeh, 2001) .Also, modern programming methods are extensive in science research, which are sensitive to error in input data. Although, in many cases, the pure mathematical model can define the properties of the system almost completely, it fails to provide much insight into how the system works and what are the main and essential dependencies between its variables (Fazel et al., 2008). But this problem is solved by artificial neural network and use a software environment. *Corresponding author. E-mail: [email protected] Tel: 00989133811911.
Therefore the fact that artificial neural network can produce a functional relation between the input and output shows that it can be used as a reasonable mapping system (Christine et al., 2007).
An artificial neural network attempts to mimic human thought process to solve complex multivariate and non-linear problems with incomplete or confusing information. Neural network representations are capable of developing functional relationship from discrete values of input/output quantities obtained from computational approaches or experimental results. This generalization property makes it possible to train a network on a representative set of input/output examples and get good results for new inputs without training the network on all possible input/output examples. Because of proven capabilities at pattern mapping, classification and optimization even with fuzzy, chaotic or complete information, neural networks have been successfully used to model experimental data. Neural networks are wonderful tools, which permits the development of quantitative expression without compromising the known complexity of problem (Bhadeshia, 2008).
Artificial neural networks are now well established, and prominent in the literature, when computational based approaches are involved (Sha and Edward, 2007). They

has pervaded all aspect of material science resulting in discovery of new phenomena and has been used in quantitative design and control (Bhadeshia, 2009). Use of neural networks in structure engineering is developing and will develop more and more (Vanderplaats and Salajegheh, 1988; Moore and Vanderplaats, 1999).
From the viewpoint of telecommunication networks and systems, an increasing number of studies can be observed in recent literature dealing with proposed applications of neural nets in telecommunication environments (Barson et al., 1996; Edwards et al., 1997).
Calculation of structures frequency and restricted them by determined values (or maximize) has two results: decreasing of structure frequency amplitude and prevention of resonance in structure dynamic response (kumarci et al., 2008). Previous studies of some researchers (Szewczyk and Hajela, 1993) are samples of approaching the best neural network in this field.
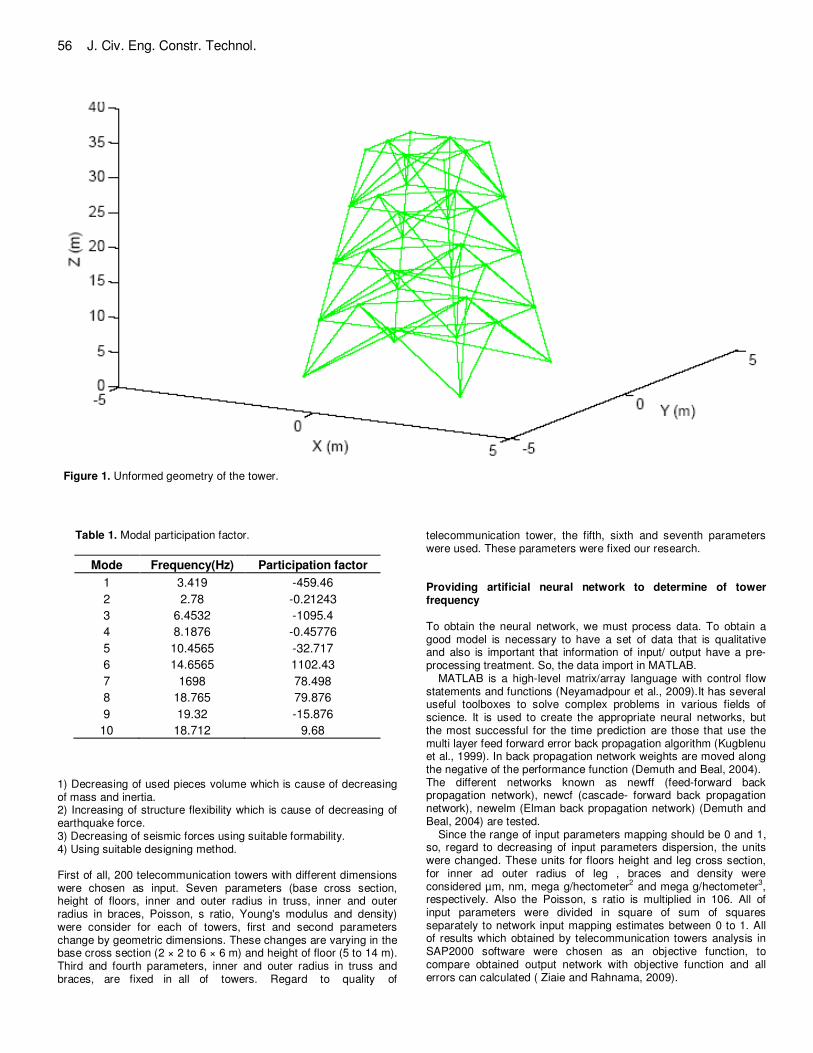
Telecommunication towers are among the few steel structures that little attention has been paid to their seismic behavior in existing design code. With advances in the telecommunication industry, the use of telecommunication towers is rapidly increasing (Godrati et al., 2007). In recent years, an increasing number of studies have used artificial neural nets in telecommunication systems, computer networks and data transmission technologies. In this paper, an overview of potential uses of neural nets in telecommunication towers will be given. We have two main purposes: first, to discuss proposed major neural at structures and second, to describe the network testing for telecommunication towers in different modes. CONSIDERED TELECOMMUNICATION TOWER With advances in telecommunication industry, the use of telecommunication towers is rapidly increasing. Generally, telecommunication towers are divided into self-supporting and guyed towers. In this study, to demonstrate the nonlinear effects, one 4-legged self-standing tower (Figure 1) is selected for analysis.
The proposed self-standing structure consists of aluminum alloy pipes. The trusses at leg location have an outer radius of 0.03m and an inner radius of 0.028 m. The braces have smaller cross sections with outer radius of 0.002 and inner radius of 0.01 m. Young
’s modulus is 7
x 1010
Pa and mass density is 2800 kg/m3. Poisson
, s
ratio is 0.29 and no pesters is applied. For instance, we considered a telecommunication tower and analyzed it at first ten mode shapes. The tower has four floors and each floor
’s height is 8 m. Also, the base cross-sectional
is 2 x 2 m2. The four base points are fixed on ground.
MODAL ANALYSIS
For the purpose of comparison of the usual engineering approach,
Kumarci and Dehkordi 55 the towers response is assumed to be linear and SRSS (Square Root of the Sum of the Squares) is employed for the estimation of the deformation of the tower. The response spectrum of a linear elastic SDOF system is obtained from the literature (Chopra, 2007). The first ten mode shapes are shown in Fig. 2. The third and sixth modes are torsion modes. The eighth and ninth modes have severe deformations on the top section of the tower. All the other modes are bending modes. In the first ten modes considered, the 2nd mode is along the y direction. Though it is included in the following calculation, it is found that it contributed very little and almost can be neglected because its modal participation factor is 4.6e-3 of the 1st mode’s. The modal participation factor (Biggs, 1964) can be calculated as:
(1) Where Mr is the mass of the rth degree of freedom, φm is the modal shape component for the rth mass in the nth mode.
The product of the modal participation factor, the specific response from the response spectrum, and the characteristic shape coordinate gives the estimation of the maximum deflection. The maximum tip deflection is 0.0563 m, which is almost half of the result by real time analysis. Although the analysis is done quickly in this way, the accuracy is not good. The effective modal mass provides a method for judging the "significance" of a vibration mode.
Modes with relatively high effective masses can be readily excited by base excitation. On the other hand, modes with low effective masses cannot be readily excited in this manner. Consider a modal transient or frequency response function analysis via the finite element method. For brevity, only a limited number of modes should be included in the analysis. So, in this work, we chose first ten modes and considered frequency and participation factor for each of them.
Frequency is the number of waves that pass a fixed point per unit time; also, the number of cycles or vibrations undergone in unit time in periodic motion. In perform of a linear dynamic problem (small displacement analysis with linear elastic materials), the technique is used which is called modal analysis and requires a frequency analysis to be run first.
This inevitably requires choosing how many natural frequencies should be solving for. One useful check for it is to plot the Mass Participation Factors. In calculation of natural frequency in telecommunication towers, frequency and participation factor is providing for each mode. The results are shown in Table 1.
SAP is a static and dynamic structural analysis program that includes linear and non-linear analysis capabilities (Sullins, 2006). Since SAP2000 software has no limitations regarding the number of vibration modes considered in analysis (Wilson and Habibullah, 1999), therefore the first ten modes of vibration have been considered in dynamic analysis. In harmonic and some types of periodic motions, there is a continual conversion of energy from one form to another. On one hand, there is potential energy due to its position and, hence, it has potential for movement. On the other hand, there is energy of movement itself. This energy can deform mode state. The deformations at different time instants are shown in Figure 2. The dash lines represent the unformed geometry of tower. The solid lines represent the deformed geometry.
Telecommunication towers are vital component and management needs to assess the reliability and safety towers to minimize the risk of disputations to power supply that may result from in service tower failure (Albermani and Kitiopornchai, 2003).
Considering desired frequency, the follows should be considered in optimization:
56 J. Civ. Eng. Constr. Technol.
Figure 1. Unformed geometry of the tower.
Table 1. Modal participation factor.
Mode Frequency(Hz) Participation factor
1 3.419 -459.46
2 2.78 -0.21243
3 6.4532 -1095.4
4 8.1876 -0.45776
5 10.4565 -32.717
6 14.6565 1102.43
7 1698 78.498
8 18.765 79.876
9 19.32 -15.876
10 18.712 9.68 1) Decreasing of used pieces volume which is cause of decreasing of mass and inertia. 2) Increasing of structure flexibility which is cause of decreasing of earthquake force. 3) Decreasing of seismic forces using suitable formability. 4) Using suitable designing method. First of all, 200 telecommunication towers with different dimensions were chosen as input. Seven parameters (base cross section, height of floors, inner and outer radius in truss, inner and outer radius in braces, Poisson, s ratio, Young's modulus and density) were consider for each of towers, first and second parameters change by geometric dimensions. These changes are varying in the base cross section (2 × 2 to 6 × 6 m) and height of floor (5 to 14 m). Third and fourth parameters, inner and outer radius in truss and braces, are fixed in all of towers. Regard to quality of
telecommunication tower, the fifth, sixth and seventh parameters were used. These parameters were fixed our research. Providing artificial neural network to determine of tower frequency To obtain the neural network, we must process data. To obtain a good model is necessary to have a set of data that is qualitative and also is important that information of input/ output have a pre- processing treatment. So, the data import in MATLAB.
MATLAB is a high-level matrix/array language with control flow statements and functions (Neyamadpour et al., 2009).It has several useful toolboxes to solve complex problems in various fields of science. It is used to create the appropriate neural networks, but the most successful for the time prediction are those that use the multi layer feed forward error back propagation algorithm (Kugblenu et al., 1999). In back propagation network weights are moved along the negative of the performance function (Demuth and Beal, 2004). The different networks known as newff (feed-forward back propagation network), newcf (cascade- forward back propagation network), newelm (Elman back propagation network) (Demuth and Beal, 2004) are tested.
Since the range of input parameters mapping should be 0 and 1, so, regard to decreasing of input parameters dispersion, the units were changed. These units for floors height and leg cross section, for inner ad outer radius of leg , braces and density were considered µm, nm, mega g/hectometer
2 and mega g/hectometer
3,
respectively. Also the Poisson, s ratio is multiplied in 106. All of input parameters were divided in square of sum of squares separately to network input mapping estimates between 0 to 1. All of results which obtained by telecommunication towers analysis in SAP2000 software were chosen as an objective function, to compare obtained output network with objective function and all errors can calculated ( Ziaie and Rahnama, 2009).
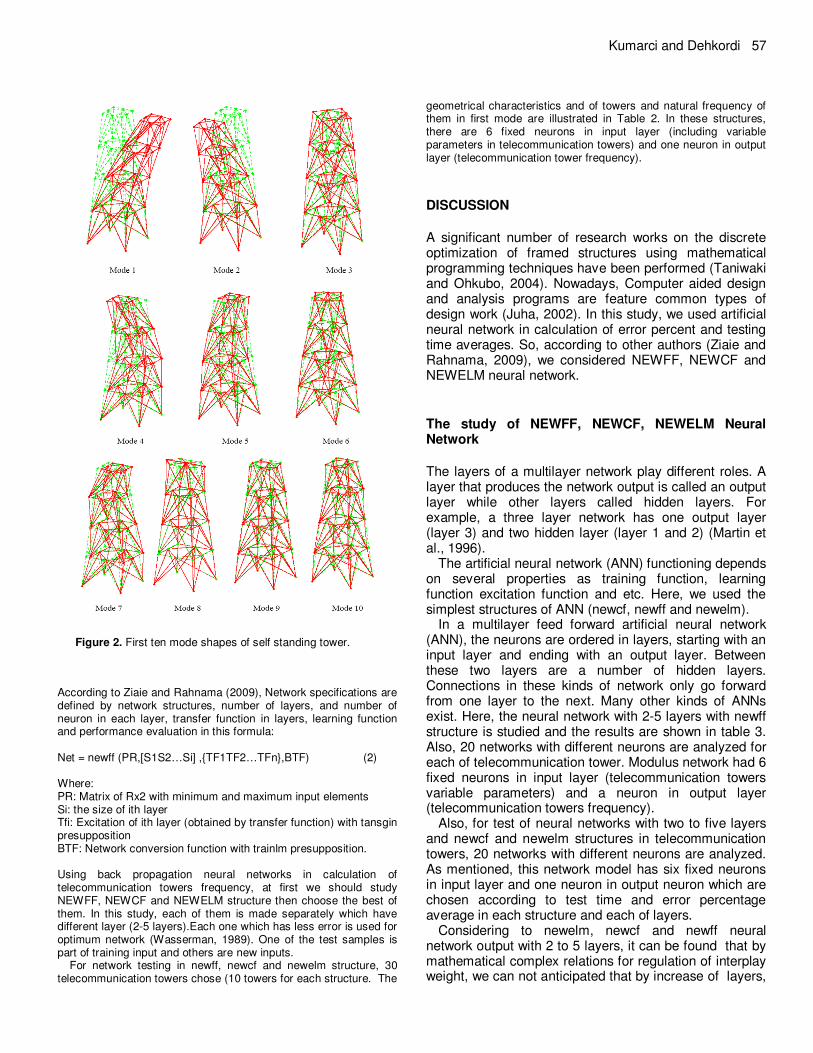
Figure 2. First ten mode shapes of self standing tower.
According to Ziaie and Rahnama (2009), Network specifications are defined by network structures, number of layers, and number of neuron in each layer, transfer function in layers, learning function and performance evaluation in this formula: Net = newff (PR,[S1S2…Si] ,{TF1TF2…TFn},BTF) (2) Where: PR: Matrix of Rx2 with minimum and maximum input elements Si: the size of ith layer Tfi: Excitation of ith layer (obtained by transfer function) with tansgin presupposition BTF: Network conversion function with trainlm presupposition. Using back propagation neural networks in calculation of telecommunication towers frequency, at first we should study NEWFF, NEWCF and NEWELM structure then choose the best of them. In this study, each of them is made separately which have different layer (2-5 layers).Each one which has less error is used for optimum network (Wasserman, 1989). One of the test samples is part of training input and others are new inputs.
For network testing in newff, newcf and newelm structure, 30 telecommunication towers chose (10 towers for each structure. The
Kumarci and Dehkordi 57 geometrical characteristics and of towers and natural frequency of them in first mode are illustrated in Table 2. In these structures, there are 6 fixed neurons in input layer (including variable parameters in telecommunication towers) and one neuron in output layer (telecommunication tower frequency).
DISCUSSION
A significant number of research works on the discrete optimization of framed structures using mathematical programming techniques have been performed (Taniwaki and Ohkubo, 2004). Nowadays, Computer aided design and analysis programs are feature common types of design work (Juha, 2002). In this study, we used artificial neural network in calculation of error percent and testing time averages. So, according to other authors (Ziaie and Rahnama, 2009), we considered NEWFF, NEWCF and NEWELM neural network.
The study of NEWFF, NEWCF, NEWELM Neural Network
The layers of a multilayer network play different roles. A layer that produces the network output is called an output layer while other layers called hidden layers. For example, a three layer network has one output layer (layer 3) and two hidden layer (layer 1 and 2) (Martin et al., 1996).
The artificial neural network (ANN) functioning depends on several properties as training function, learning function excitation function and etc. Here, we used the simplest structures of ANN (newcf, newff and newelm).
In a multilayer feed forward artificial neural network (ANN), the neurons are ordered in layers, starting with an input layer and ending with an output layer. Between these two layers are a number of hidden layers. Connections in these kinds of network only go forward from one layer to the next. Many other kinds of ANNs exist. Here, the neural network with 2-5 layers with newff structure is studied and the results are shown in table 3. Also, 20 networks with different neurons are analyzed for each of telecommunication tower. Modulus network had 6 fixed neurons in input layer (telecommunication towers variable parameters) and a neuron in output layer (telecommunication towers frequency).
Also, for test of neural networks with two to five layers and newcf and newelm structures in telecommunication towers, 20 networks with different neurons are analyzed. As mentioned, this network model has six fixed neurons in input layer and one neuron in output neuron which are chosen according to test time and error percentage average in each structure and each of layers.
Considering to newelm, newcf and newff neural network output with 2 to 5 layers, it can be found that by mathematical complex relations for regulation of interplay weight, we can not anticipated that by increase of layers,
58 J. Civ. Eng. Constr. Technol.
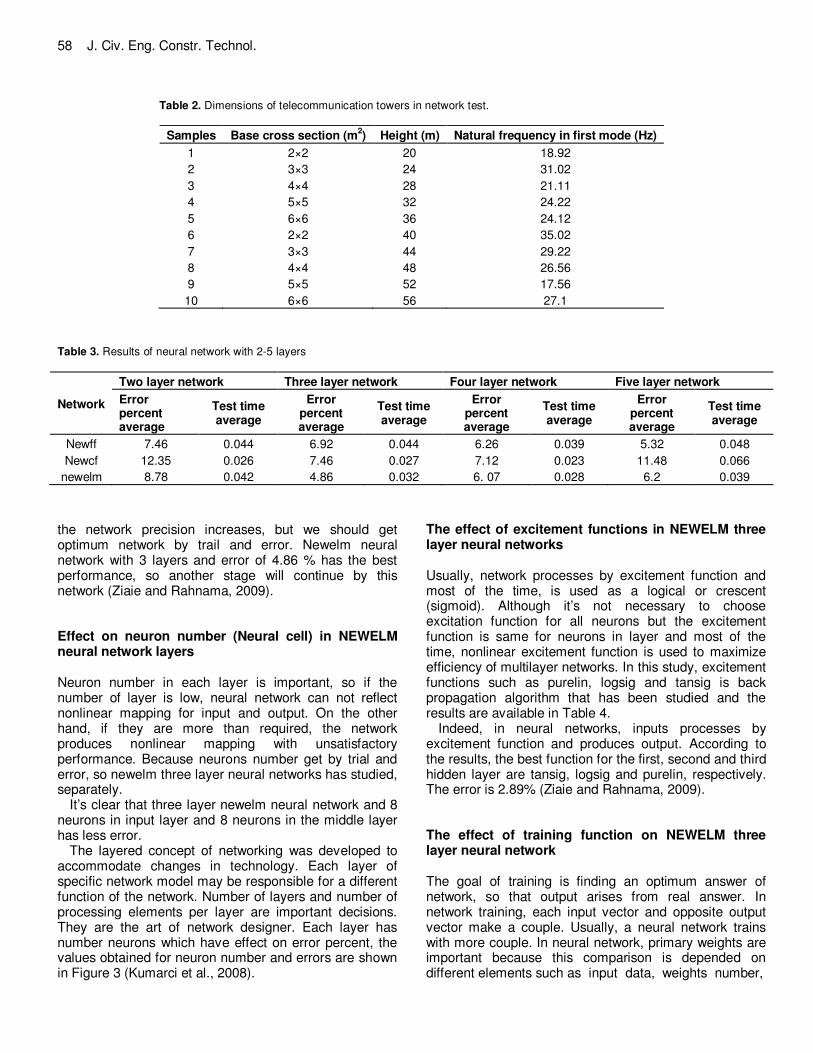
Table 2. Dimensions of telecommunication towers in network test.
Samples Base cross section (m2) Height (m) Natural frequency in first mode (Hz)
1 2×2 20 18.92
2 3×3 24 31.02
3 4×4 28 21.11
4 5×5 32 24.22
5 6×6 36 24.12
6 2×2 40 35.02
7 3×3 44 29.22
8 4×4 48 26.56
9 5×5 52 17.56
10 6×6 56 27.1 Table 3. Results of neural network with 2-5 layers
Network
Two layer network Three layer network Four layer network Five layer network
Error percent average
Test time average
Error percent average
Test time average
Error percent average
Test time average
Error percent average
Test time average
Newff 7.46 0.044 6.92 0.044 6.26 0.039 5.32 0.048
Newcf 12.35 0.026 7.46 0.027 7.12 0.023 11.48 0.066
newelm 8.78 0.042 4.86 0.032 6. 07 0.028 6.2 0.039
the network precision increases, but we should get optimum network by trail and error. Newelm neural network with 3 layers and error of 4.86 % has the best performance, so another stage will continue by this network (Ziaie and Rahnama, 2009). Effect on neuron number (Neural cell) in NEWELM neural network layers Neuron number in each layer is important, so if the number of layer is low, neural network can not reflect nonlinear mapping for input and output. On the other hand, if they are more than required, the network produces nonlinear mapping with unsatisfactory performance. Because neurons number get by trial and error, so newelm three layer neural networks has studied, separately.
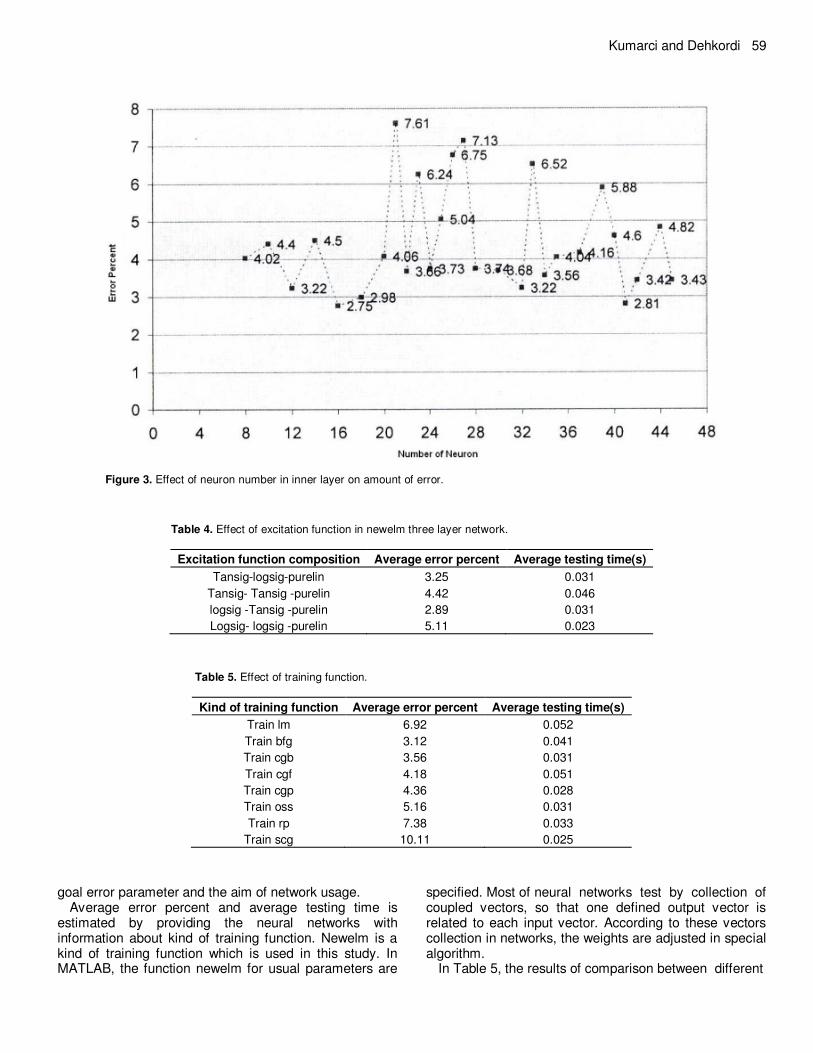
It’s clear that three layer newelm neural network and 8 neurons in input layer and 8 neurons in the middle layer has less error.
The layered concept of networking was developed to accommodate changes in technology. Each layer of specific network model may be responsible for a different function of the network. Number of layers and number of processing elements per layer are important decisions. They are the art of network designer. Each layer has number neurons which have effect on error percent, the values obtained for neuron number and errors are shown in Figure 3 (Kumarci et al., 2008).
The effect of excitement functions in NEWELM three layer neural networks Usually, network processes by excitement function and most of the time, is used as a logical or crescent (sigmoid). Although it’s not necessary to choose excitation function for all neurons but the excitement function is same for neurons in layer and most of the time, nonlinear excitement function is used to maximize efficiency of multilayer networks. In this study, excitement functions such as purelin, logsig and tansig is back propagation algorithm that has been studied and the results are available in Table 4.
Indeed, in neural networks, inputs processes by excitement function and produces output. According to the results, the best function for the first, second and third hidden layer are tansig, logsig and purelin, respectively. The error is 2.89% (Ziaie and Rahnama, 2009). The effect of training function on NEWELM three layer neural network The goal of training is finding an optimum answer of network, so that output arises from real answer. In network training, each input vector and opposite output vector make a couple. Usually, a neural network trains with more couple. In neural network, primary weights are important because this comparison is depended on different elements such as input data, weights number,
Kumarci and Dehkordi 59
Figure 3. Effect of neuron number in inner layer on amount of error.
Table 4. Effect of excitation function in newelm three layer network.
Excitation function composition Average error percent Average testing time(s)
Tansig-logsig-purelin 3.25 0.031
Tansig- Tansig -purelin 4.42 0.046
logsig -Tansig -purelin 2.89 0.031
Logsig- logsig -purelin 5.11 0.023
Table 5. Effect of training function.
Kind of training function Average error percent Average testing time(s)
Train lm 6.92 0.052
Train bfg 3.12 0.041
Train cgb 3.56 0.031
Train cgf 4.18 0.051
Train cgp 4.36 0.028
Train oss 5.16 0.031
Train rp 7.38 0.033
Train scg 10.11 0.025
goal error parameter and the aim of network usage. Average error percent and average testing time is
estimated by providing the neural networks with information about kind of training function. Newelm is a kind of training function which is used in this study. In MATLAB, the function newelm for usual parameters are
specified. Most of neural networks test by collection of coupled vectors, so that one defined output vector is related to each input vector. According to these vectors collection in networks, the weights are adjusted in special algorithm.
In Table 5, the results of comparison between different

60 J. Civ. Eng. Constr. Technol. Table 6. Effect of learning function.
Kind of training function
Average error percent
Average testing time(s)
Learn gdm 2.92 0.031
Learn gd 2.56 0.034
Learn som 3.14 0.036
Learn p 5.54 0.029
Learn os 7.18 0.031
Learn lv1 3.52 0.026
Learnlv2 8.13 0.032
Learn con 5.12 0.034
Learn k 4.18 0.039
Learn Is 6.51 0.047
Learn h 11.12 0.096
Learn hd 6.66 0.089
Learn wh 4.92 0.089
Table 7. Effect of error function.
Kind of training function
Average error percent
Average testing time(s)
mae 19.36 0.018
mse 12.46 0.012
Msereg 17.12 0.014
sse 4.52 0. 016
Table 8. Results of different telecommunication towers analysis.
Number of mode
Average real analysis time
(s)
Average testing time in
network (s)
Average real analysis time (s)
First 8.83 0.021 3.88
Second 8.92 0.018 5.21
Sixth 8.99 0.016 4.55
Ninth 4.67 0.011 3.42
training function in newelm network are shown. So, we found that Train bfg has less error (3.12%) and its performance is better than other functions. So, we found that Train bfg has less error (3.12%) and its performance is better than other functions. The effect of learning function on NEWELM three layer neural network In the neural network, all of calculations are layer by layer, so, we can estimate outputs. At first, output ofinput for another layer. After that, according to input, the second layer output is calculated. This process continues to output make output vector. In order to find
effect of learning function, we tested different kinds of training function. Training functions were used to predict the values of averages of error percent and testing time (Table 6). According Table 6, learn gd function (error = 2.56%) has better performance. In this function, training input functions binary. After training, the network accepts continuous input and produces output. The effect of performance evaluation (Error) on NEWELM three layer neural network In performance evaluation, we want to study how a network performs by trained and new (untrained) input. Again, other kinds of training function are studied from average error percent and average testing time. Amount of training and network performance calculated by different parameters and methods. The average error percent and testing time is providing for other kinds of training function to study effect of error function. Each of them studied separately and the best functions chose (Table 7).
In these functions, regard to results of performance evaluation, testing time and error percent averages and choosing three layer newelm neural network , it is concluded that sse has the best function as compare with other functions.
Proposed neural network By analysis, this neural network is suggested for calculation of telecommunication towers frequency: net = newelm (max min(p),[8 8 1],{′tansig' ′logsig' 'purelin'};'traincgb','learn p', 'sse') RESULTS Different telecommunication towers have been analyzed by SAP2000 software and neural networks efficiency has been determined. Because the third and sixth modes are tensional modes and eighth and ninth modes have more displacements in top of tower, and other modes are flexural, the first, second, sixth and ninth modes are tested for testing telecommunication towers.
SAP is a static and dynamic structural analysis program that includes linear and non-linear capabilities. Seismic analysis can be performed using SAP2000 (Ghodrati et al., 2007). Telecommunication towers analysis is provided by considering the first (flexural), second (flexural), sixth (torsion) and ninth (with sever movement in top of the tower) mode, respectively.
In Table 8, the average of real analysis time, average testing time and real analysis time are calculated and the results are shown for the first, second, sixth and ninth modes.
Kumarci and Dehkordi 61
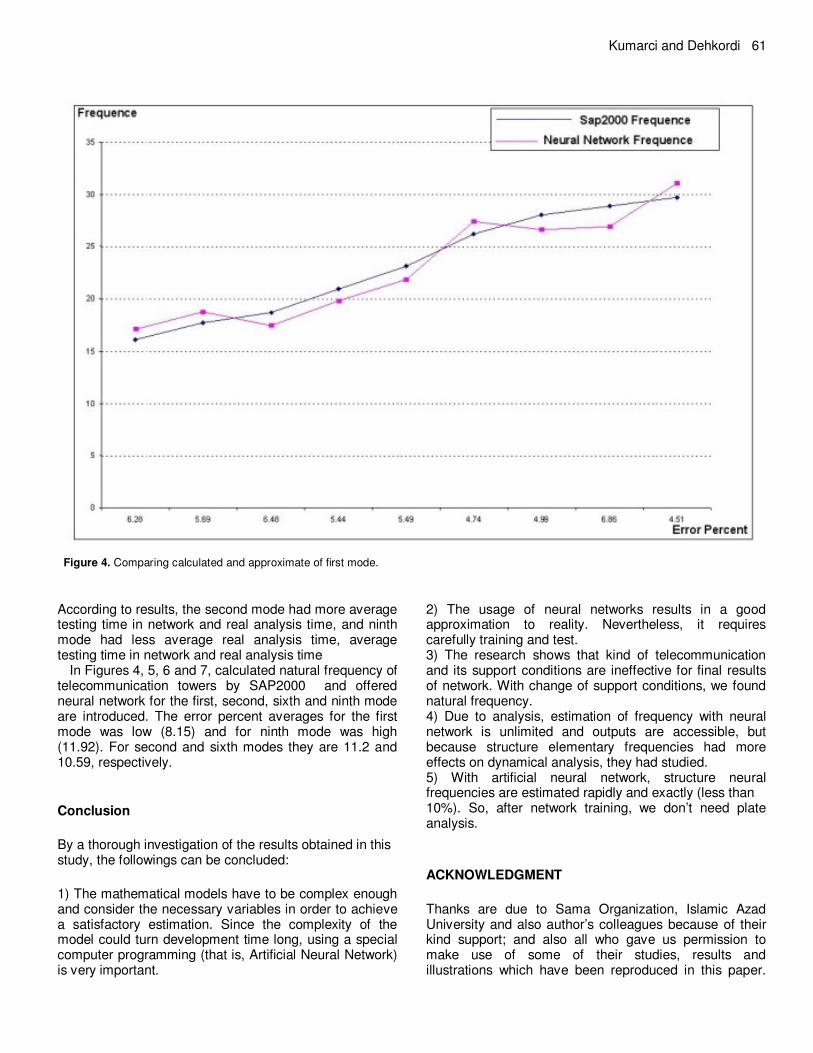
Figure 4. Comparing calculated and approximate of first mode.
According to results, the second mode had more average testing time in network and real analysis time, and ninth mode had less average real analysis time, average testing time in network and real analysis time
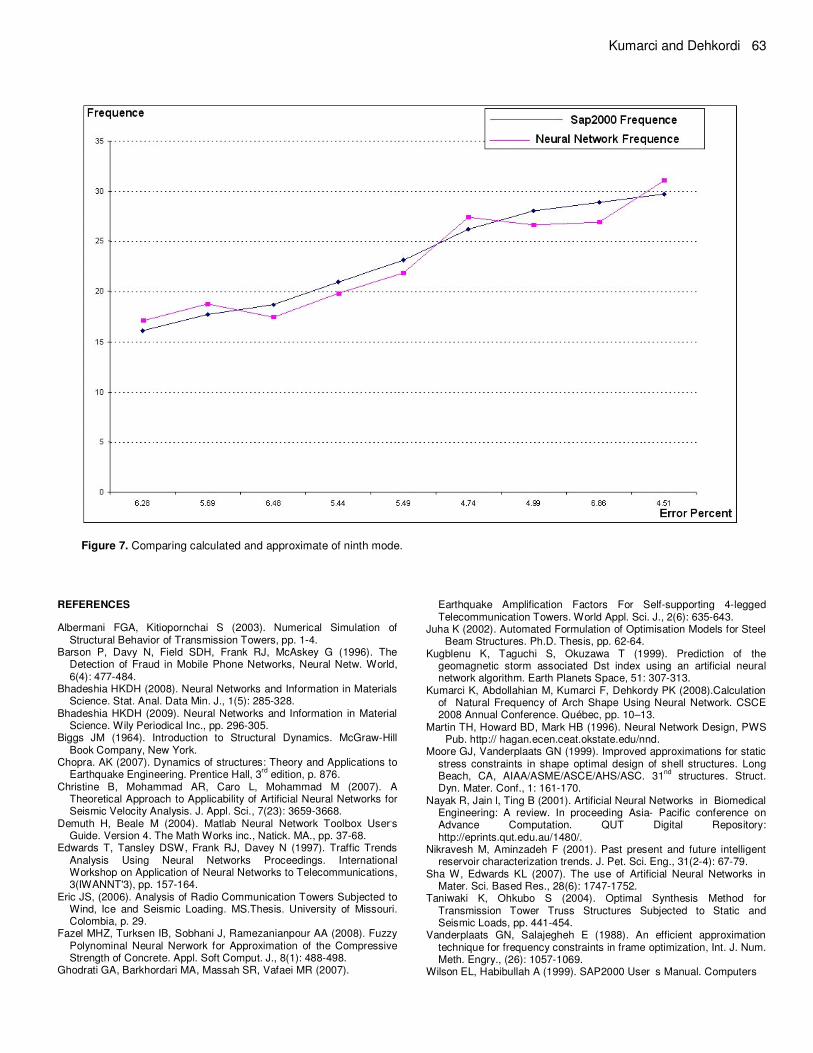
In Figures 4, 5, 6 and 7, calculated natural frequency of telecommunication towers by SAP2000 and offered neural network for the first, second, sixth and ninth mode are introduced. The error percent averages for the first mode was low (8.15) and for ninth mode was high (11.92). For second and sixth modes they are 11.2 and 10.59, respectively.
Conclusion
By a thorough investigation of the results obtained in this study, the followings can be concluded:
1) The mathematical models have to be complex enough and consider the necessary variables in order to achieve a satisfactory estimation. Since the complexity of the model could turn development time long, using a special computer programming (that is, Artificial Neural Network) is very important.
2) The usage of neural networks results in a good approximation to reality. Nevertheless, it requires carefully training and test. 3) The research shows that kind of telecommunication and its support conditions are ineffective for final results of network. With change of support conditions, we found natural frequency. 4) Due to analysis, estimation of frequency with neural network is unlimited and outputs are accessible, but because structure elementary frequencies had more effects on dynamical analysis, they had studied. 5) With artificial neural network, structure neural frequencies are estimated rapidly and exactly (less than 10%). So, after network training, we don’t need plate analysis.
ACKNOWLEDGMENT
Thanks are due to Sama Organization, Islamic Azad University and also author’s colleagues because of their kind support; and also all who gave us permission to make use of some of their studies, results and illustrations which have been reproduced in this paper.

62 J. Civ. Eng. Constr. Technol.
Figure 5. Comparing calculated and approximate of second mode.
Figure 6. Comparing calculated and approximate of sixth mode.
Kumarci and Dehkordi 63
Figure 7. Comparing calculated and approximate of ninth mode.
REFERENCES
Albermani FGA, Kitiopornchai S (2003). Numerical Simulation of Structural Behavior of Transmission Towers, pp. 1-4.
Barson P, Davy N, Field SDH, Frank RJ, McAskey G (1996). The Detection of Fraud in Mobile Phone Networks, Neural Netw. World, 6(4): 477-484.
Bhadeshia HKDH (2008). Neural Networks and Information in Materials Science. Stat. Anal. Data Min. J., 1(5): 285-328.
Bhadeshia HKDH (2009). Neural Networks and Information in Material Science. Wily Periodical Inc., pp. 296-305.
Biggs JM (1964). Introduction to Structural Dynamics. McGraw-Hill Book Company, New York.
Chopra. AK (2007). Dynamics of structures: Theory and Applications to Earthquake Engineering. Prentice Hall, 3
rd edition, p. 876.
Christine B, Mohammad AR, Caro L, Mohammad M (2007). A Theoretical Approach to Applicability of Artificial Neural Networks for Seismic Velocity Analysis. J. Appl. Sci., 7(23): 3659-3668.
Demuth H, Beale M (2004). Matlab Neural Network Toolbox User,s
Guide. Version 4. The Math Works inc., Natick. MA., pp. 37-68. Edwards T, Tansley DSW, Frank RJ, Davey N (1997). Traffic Trends
Analysis Using Neural Networks Proceedings. International Workshop on Application of Neural Networks to Telecommunications, 3(IWANNT'3), pp. 157-164.
Eric JS, (2006). Analysis of Radio Communication Towers Subjected to Wind, Ice and Seismic Loading. MS.Thesis. University of Missouri. Colombia, p. 29.
Fazel MHZ, Turksen IB, Sobhani J, Ramezanianpour AA (2008). Fuzzy Polynominal Neural Nerwork for Approximation of the Compressive Strength of Concrete. Appl. Soft Comput. J., 8(1): 488-498.
Ghodrati GA, Barkhordari MA, Massah SR, Vafaei MR (2007).
Earthquake Amplification Factors For Self-supporting 4-legged Telecommunication Towers. World Appl. Sci. J., 2(6): 635-643.
Juha K (2002). Automated Formulation of Optimisation Models for Steel Beam Structures. Ph.D. Thesis, pp. 62-64.
Kugblenu K, Taguchi S, Okuzawa T (1999). Prediction of the geomagnetic storm associated Dst index using an artificial neural network algorithm. Earth Planets Space, 51: 307-313.
Kumarci K, Abdollahian M, Kumarci F, Dehkordy PK (2008).Calculation of Natural Frequency of Arch Shape Using Neural Network. CSCE 2008 Annual Conference. Québec, pp. 10–13.
Martin TH, Howard BD, Mark HB (1996). Neural Network Design, PWS Pub. http:// hagan.ecen.ceat.okstate.edu/nnd.
Moore GJ, Vanderplaats GN (1999). Improved approximations for static stress constraints in shape optimal design of shell structures. Long Beach, CA, AIAA/ASME/ASCE/AHS/ASC. 31
nd structures. Struct.
Dyn. Mater. Conf., 1: 161-170. Nayak R, Jain l, Ting B (2001). Artificial Neural Networks in Biomedical
Engineering: A review. In proceeding Asia- Pacific conference on Advance Computation. QUT Digital Repository: http://eprints.qut.edu.au/1480/.
Nikravesh M, Aminzadeh F (2001). Past present and future intelligent reservoir characterization trends. J. Pet. Sci. Eng., 31(2-4): 67-79.
Sha W, Edwards KL (2007). The use of Artificial Neural Networks in Mater. Sci. Based Res., 28(6): 1747-1752.
Taniwaki K, Ohkubo S (2004). Optimal Synthesis Method for Transmission Tower Truss Structures Subjected to Static and Seismic Loads, pp. 441-454.
Vanderplaats GN, Salajegheh E (1988). An efficient approximation technique for frequency constraints in frame optimization, Int. J. Num. Meth. Engry., (26): 1057-1069.
Wilson EL, Habibullah A (1999). SAP2000 Userʾs Manual. Computers

64 J. Civ. Eng. Constr. Technol.
and Structures. Inc.,Berkeley, California. Zewczyk ZS, Hajela P (1993). Neural network approximation in a
simulated annealing based optimal structure. Des. Struct. Optim., 5: 159-165.
Ziaie A, Rahnama (2009).Calculation of Concrete Minarets Frequency
by Neural Network. J. Environ. Sci. Technol., 2(1): pp. 48-55.