Embed Size (px)
Citation preview

Published by Articulate® Storyline www.articulate.com
3.2 Prevalence and its Relationship to Incidence
Notes:
Prevalence and its relationship to incidence.
Learning Outcomes
Published by Articulate® Storyline www.articulate.com
Notes:
At the end of the presentation, you will be able to:
Define, calculate, and interpret prevalence
Distinguish between point and period prevalence
Recognize special types of incidence and prevalence measures
Recognize the interrelationship between incidence, prevalence, and duration of disease
Differentiate the use of incidence and prevalence measures
Development of Disease
Notes:
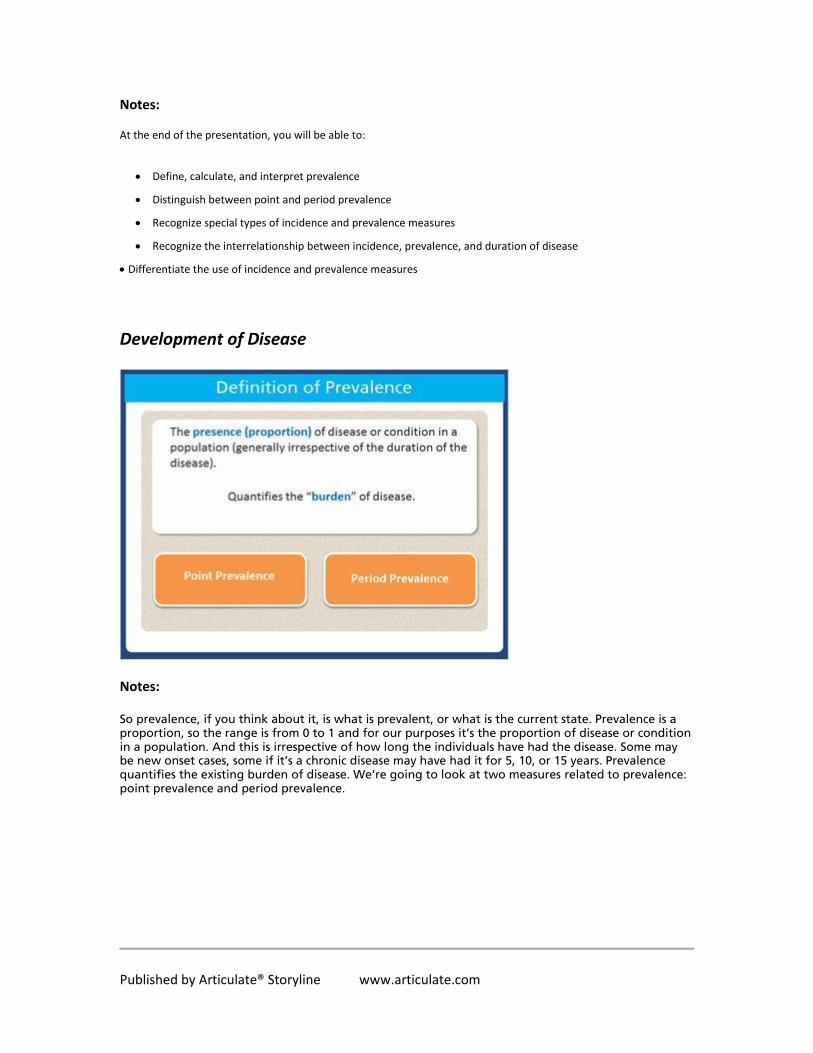
So prevalence, if you think about it, is what is prevalent, or what is the current state. Prevalence is a proportion, so the range is from 0 to 1 and for our purposes it’s the proportion of disease or condition in a population. And this is irrespective of how long the individuals have had the disease. Some may be new onset cases, some if it’s a chronic disease may have had it for 5, 10, or 15 years. Prevalence quantifies the existing burden of disease. We’re going to look at two measures related to prevalence: point prevalence and period prevalence.
Published by Articulate® Storyline www.articulate.com
Point Prevalence
Notes:
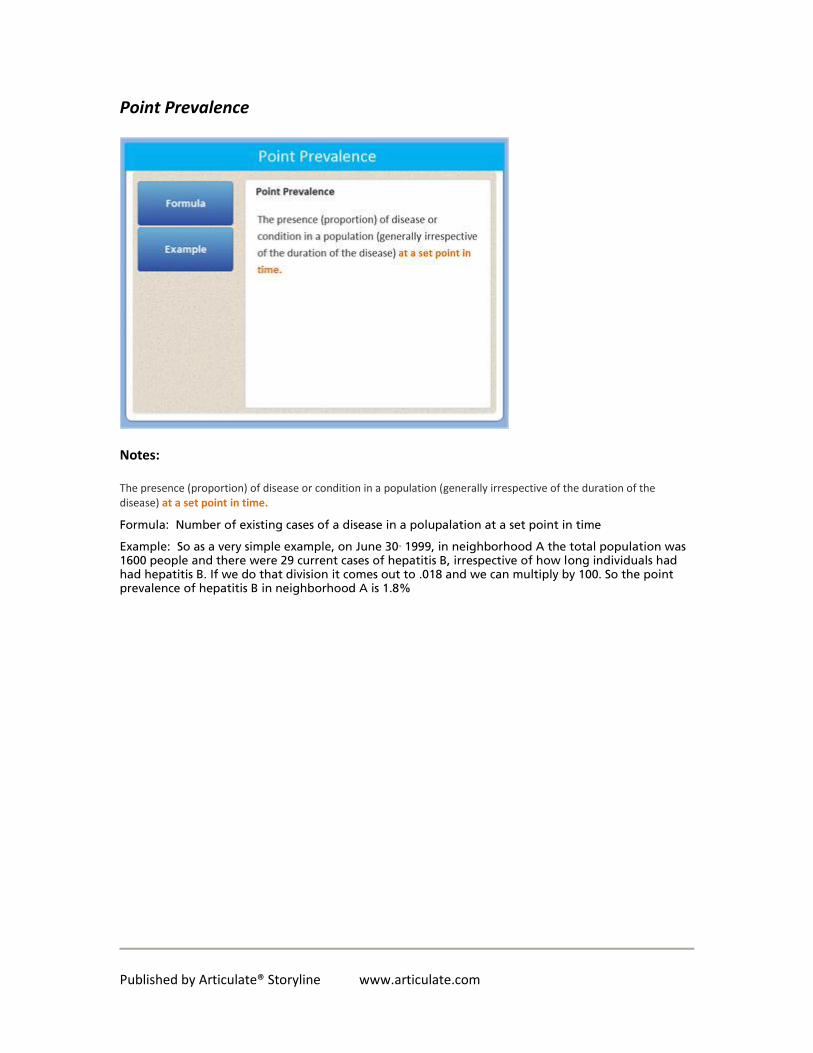
The presence (proportion) of disease or condition in a population (generally irrespective of the duration of the disease) at a set point in time.
Formula: Number of existing cases of a disease in a polupalation at a set point in time
Example: So as a very simple example, on June 30th 1999, in neighborhood A the total population was 1600 people and there were 29 current cases of hepatitis B, irrespective of how long individuals had had hepatitis B. If we do that division it comes out to .018 and we can multiply by 100. So the point prevalence of hepatitis B in neighborhood A is 1.8%
Published by Articulate® Storyline www.articulate.com
Period Prevalence
Notes:
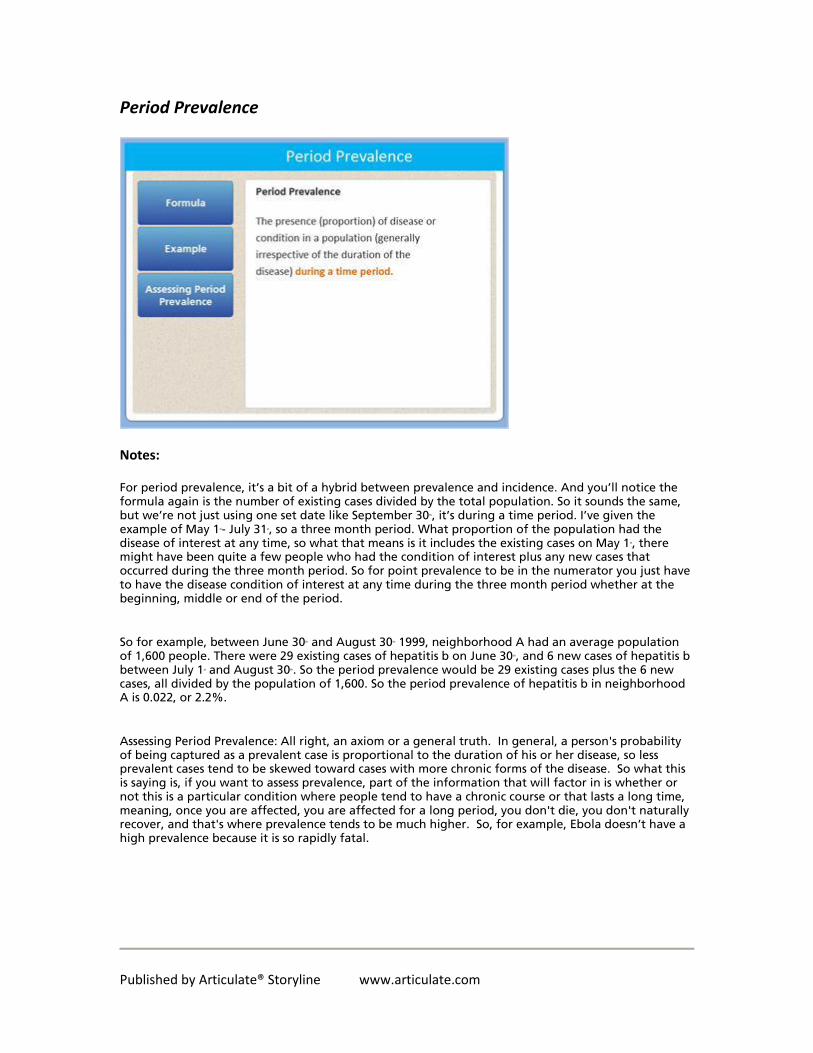
For period prevalence, it’s a bit of a hybrid between prevalence and incidence. And you’ll notice the formula again is the number of existing cases divided by the total population. So it sounds the same, but we’re not just using one set date like September 30th, it’s during a time period. I’ve given the example of May 1st- July 31st, so a three month period. What proportion of the population had the disease of interest at any time, so what that means is it includes the existing cases on May 1 st, there might have been quite a few people who had the condition of interest plus any new cases that occurred during the three month period. So for point prevalence to be in the numerator you just have to have the disease condition of interest at any time during the three month period whether at the beginning, middle or end of the period.
So for example, between June 30th and August 30th 1999, neighborhood A had an average population of 1,600 people. There were 29 existing cases of hepatitis b on June 30th, and 6 new cases of hepatitis b between July 1st and August 30th. So the period prevalence would be 29 existing cases plus the 6 new cases, all divided by the population of 1,600. So the period prevalence of hepatitis b in neighborhood A is 0.022, or 2.2%.
Assessing Period Prevalence: All right, an axiom or a general truth. In general, a person's probability of being captured as a prevalent case is proportional to the duration of his or her disease, so less prevalent cases tend to be skewed toward cases with more chronic forms of the disease. So what this is saying is, if you want to assess prevalence, part of the information that will factor in is whether or not this is a particular condition where people tend to have a chronic course or that lasts a long time, meaning, once you are affected, you are affected for a long period, you don't die, you don't naturally recover, and that's where prevalence tends to be much higher. So, for example, Ebola doesn’t have a high prevalence because it is so rapidly fatal.
Published by Articulate® Storyline www.articulate.com
Population Units
Notes:
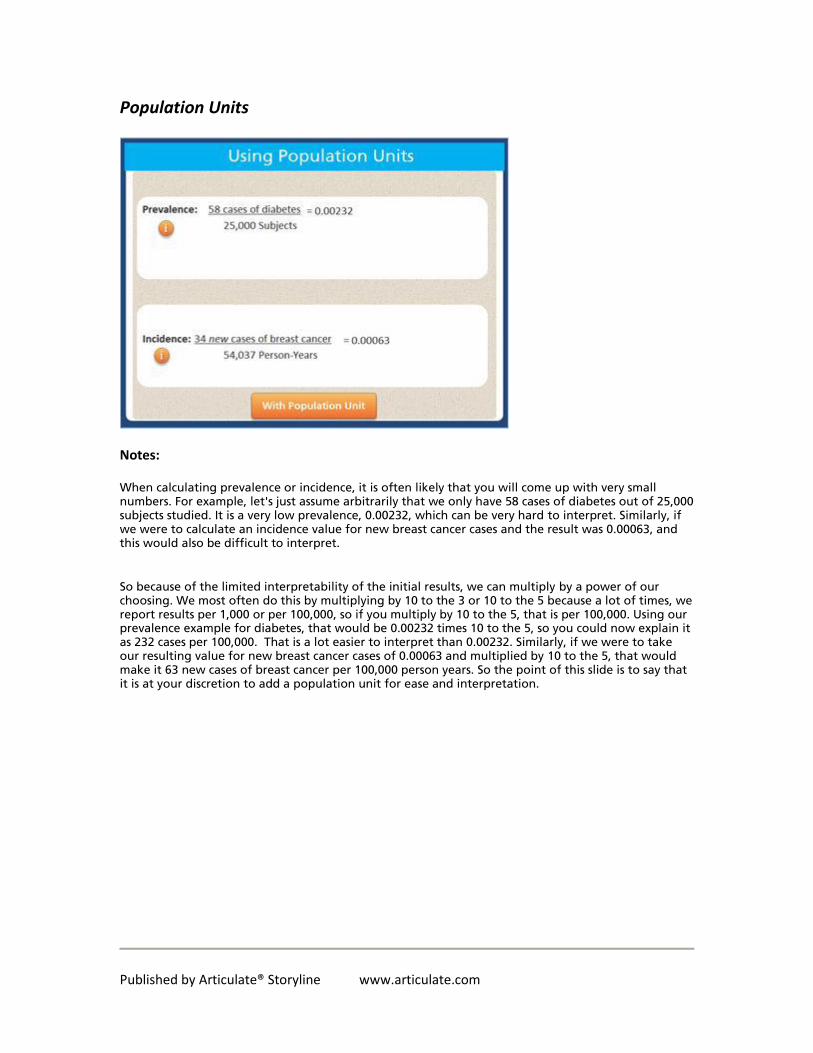
When calculating prevalence or incidence, it is often likely that you will come up with very small numbers. For example, let's just assume arbitrarily that we only have 58 cases of diabetes out of 25,000 subjects studied. It is a very low prevalence, 0.00232, which can be very hard to interpret. Similarly, if we were to calculate an incidence value for new breast cancer cases and the result was 0.00063, and this would also be difficult to interpret.
So because of the limited interpretability of the initial results, we can multiply by a power of our choosing. We most often do this by multiplying by 10 to the 3 or 10 to the 5 because a lot of times, we report results per 1,000 or per 100,000, so if you multiply by 10 to the 5, that is per 100,000. Using our prevalence example for diabetes, that would be 0.00232 times 10 to the 5, so you could now explain it as 232 cases per 100,000. That is a lot easier to interpret than 0.00232. Similarly, if we were to take our resulting value for new breast cancer cases of 0.00063 and multiplied by 10 to the 5, that would make it 63 new cases of breast cancer per 100,000 person years. So the point of this slide is to say that it is at your discretion to add a population unit for ease and interpretation.
Published by Articulate® Storyline www.articulate.com
Special Types of Incidence and Prevalence
Notes:
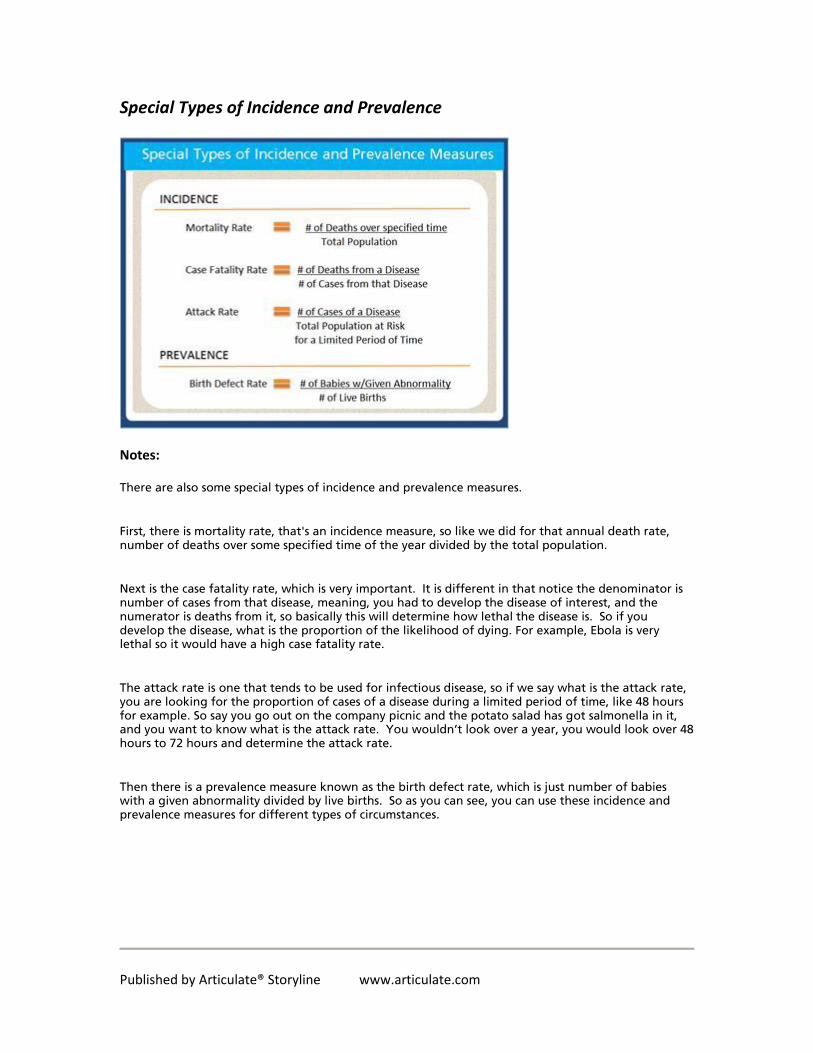
There are also some special types of incidence and prevalence measures.
First, there is mortality rate, that's an incidence measure, so like we did for that annual death rate, number of deaths over some specified time of the year divided by the total population.
Next is the case fatality rate, which is very important. It is different in that notice the denominator is number of cases from that disease, meaning, you had to develop the disease of interest, and the numerator is deaths from it, so basically this will determine how lethal the disease is. So if you develop the disease, what is the proportion of the likelihood of dying. For example, Ebola is very lethal so it would have a high case fatality rate.
The attack rate is one that tends to be used for infectious disease, so if we say what is the attack rate, you are looking for the proportion of cases of a disease during a limited period of time, like 48 hours for example. So say you go out on the company picnic and the potato salad has got salmonella in it, and you want to know what is the attack rate. You wouldn’t look over a year, you would look over 48 hours to 72 hours and determine the attack rate.
Then there is a prevalence measure known as the birth defect rate, which is just number of babies with a given abnormality divided by live births. So as you can see, you can use these incidence and prevalence measures for different types of circumstances.
Published by Articulate® Storyline www.articulate.com
Knowledge Check
(True/False, 10 points, 1 attempt permitted)
Notes:
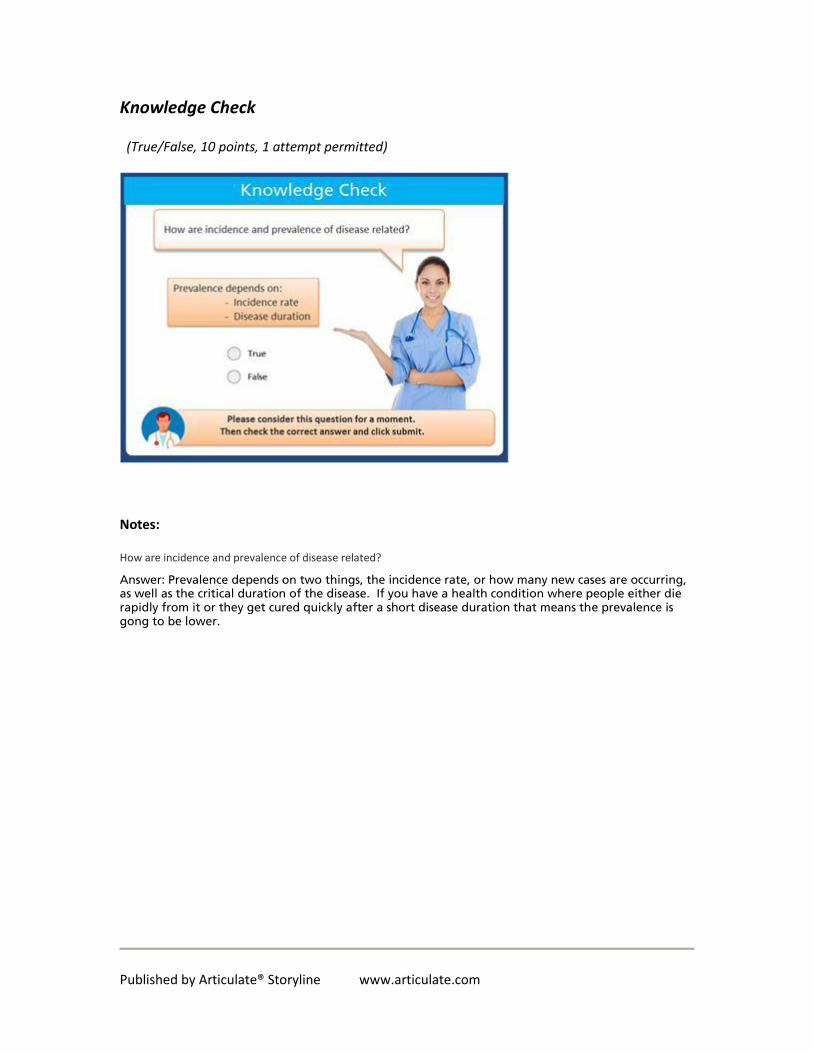
How are incidence and prevalence of disease related?
Answer: Prevalence depends on two things, the incidence rate, or how many new cases are occurring, as well as the critical duration of the disease. If you have a health condition where people either die rapidly from it or they get cured quickly after a short disease duration that means the prevalence is gong to be lower.
Published by Articulate® Storyline www.articulate.com
Relationship between prevalence and incidence
Notes:
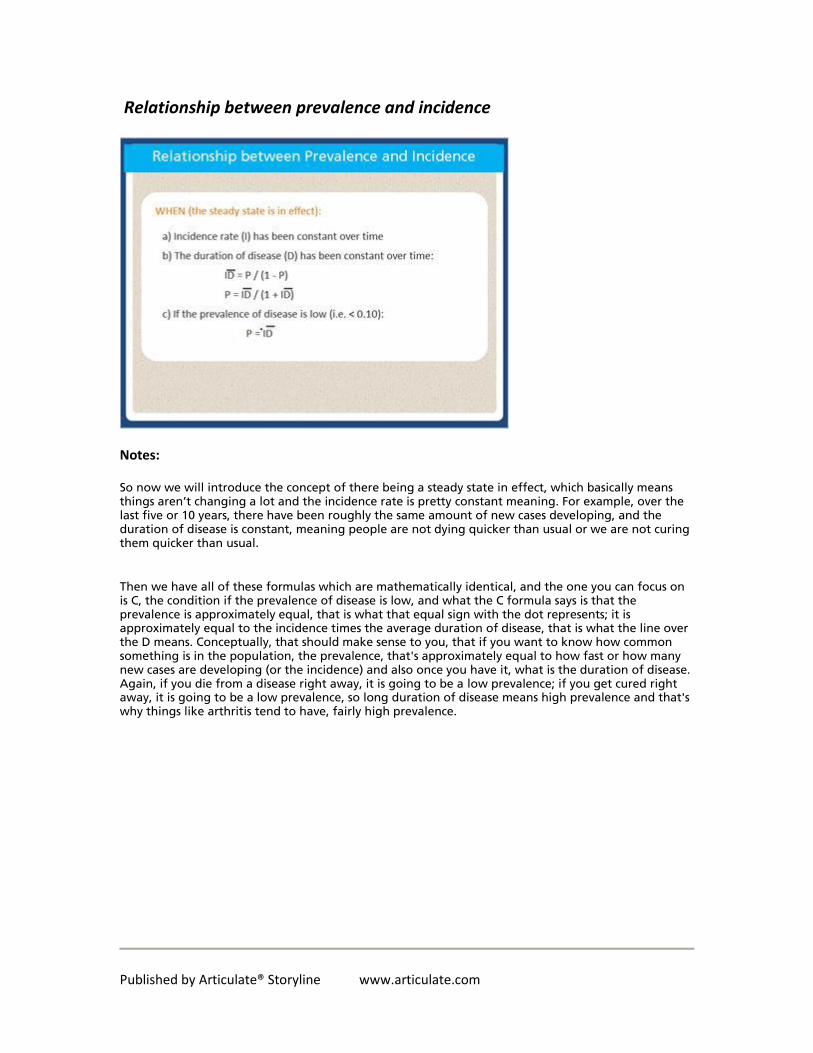
So now we will introduce the concept of there being a steady state in effect, which basically means things aren’t changing a lot and the incidence rate is pretty constant meaning. For example, over the last five or 10 years, there have been roughly the same amount of new cases developing, and the duration of disease is constant, meaning people are not dying quicker than usual or we are not curing them quicker than usual.
Then we have all of these formulas which are mathematically identical, and the one you can focus on is C, the condition if the prevalence of disease is low, and what the C formula says is that the prevalence is approximately equal, that is what that equal sign with the dot represents; it is approximately equal to the incidence times the average duration of disease, that is what the line over the D means. Conceptually, that should make sense to you, that if you want to know how common something is in the population, the prevalence, that's approximately equal to how fast or how many new cases are developing (or the incidence) and also once you have it, what is the duration of disease. Again, if you die from a disease right away, it is going to be a low prevalence; if you get cured right away, it is going to be a low prevalence, so long duration of disease means high prevalence and that's why things like arthritis tend to have, fairly high prevalence.

Published by Articulate® Storyline www.articulate.com
Uses of Incidence & Prevalence Measures
Knowledge Check

Published by Articulate® Storyline www.articulate.com
2. Practice Exercise
Questions
Notes:
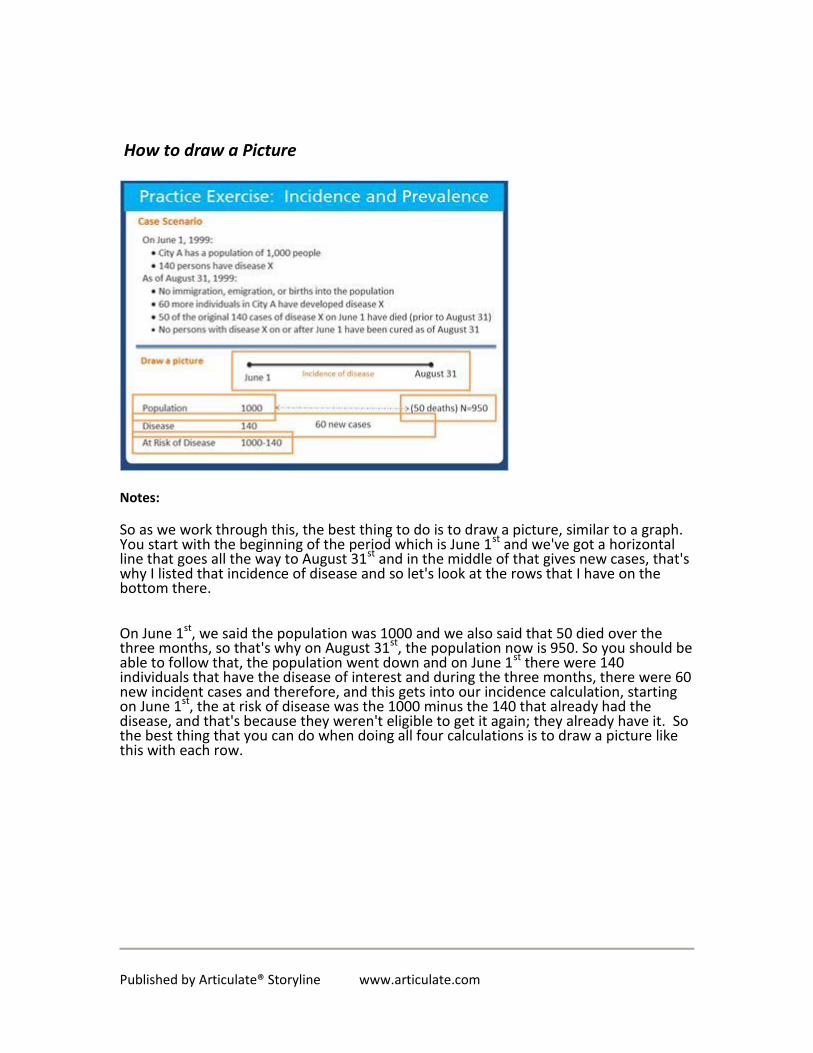
Now we will work through an example and then do a practice exercise for incidence and prevalence. So here is the circumstance, June 1st, 1999 we're going to study City A, which has a population of 1000 people and on that particular date, 140 people have our disease of interest. And then we're going to look at city A three months later, on August 31st, and in that three month period we will say nobody moved out or moved in and there were no new births.
However, there were 60 more people that developed the disease of interest, so 60 new cases. But 50 of the original 140 that had the disease on June 1st have died by August 31st. So it must be a fairly severe disease, because there were some deaths and nobody was cured of the disease. So we will use this information first to look into point prevalence on June 1st, and then for number two we will calculate the period prevalence, and to do this we have to assume an average population because notice that City A started with a 1000 people and 50 died over the three months, so the population didn't stay the same size, so the average population over the three month period was 975.
Then we will calculate the three month cumulative incidence and that's for disease X. Finally, we will calculate the point prevalence but this time rather than at the beginning of the period at the end, on August 31st.
Published by Articulate® Storyline www.articulate.com
How to draw a Picture
Notes:
So as we work through this, the best thing to do is to draw a picture, similar to a graph. You start with the beginning of the period which is June 1st and we've got a horizontal line that goes all the way to August 31st and in the middle of that gives new cases, that's why I listed that incidence of disease and so let's look at the rows that I have on the bottom there.
On June 1st, we said the population was 1000 and we also said that 50 died over the three months, so that's why on August 31st, the population now is 950. So you should be able to follow that, the population went down and on June 1st there were 140 individuals that have the disease of interest and during the three months, there were 60 new incident cases and therefore, and this gets into our incidence calculation, starting on June 1st, the at risk of disease was the 1000 minus the 140 that already had the disease, and that's because they weren't eligible to get it again; they already have it. So the best thing that you can do when doing all four calculations is to draw a picture like this with each row.
Published by Articulate® Storyline www.articulate.com
Answers
Notes:
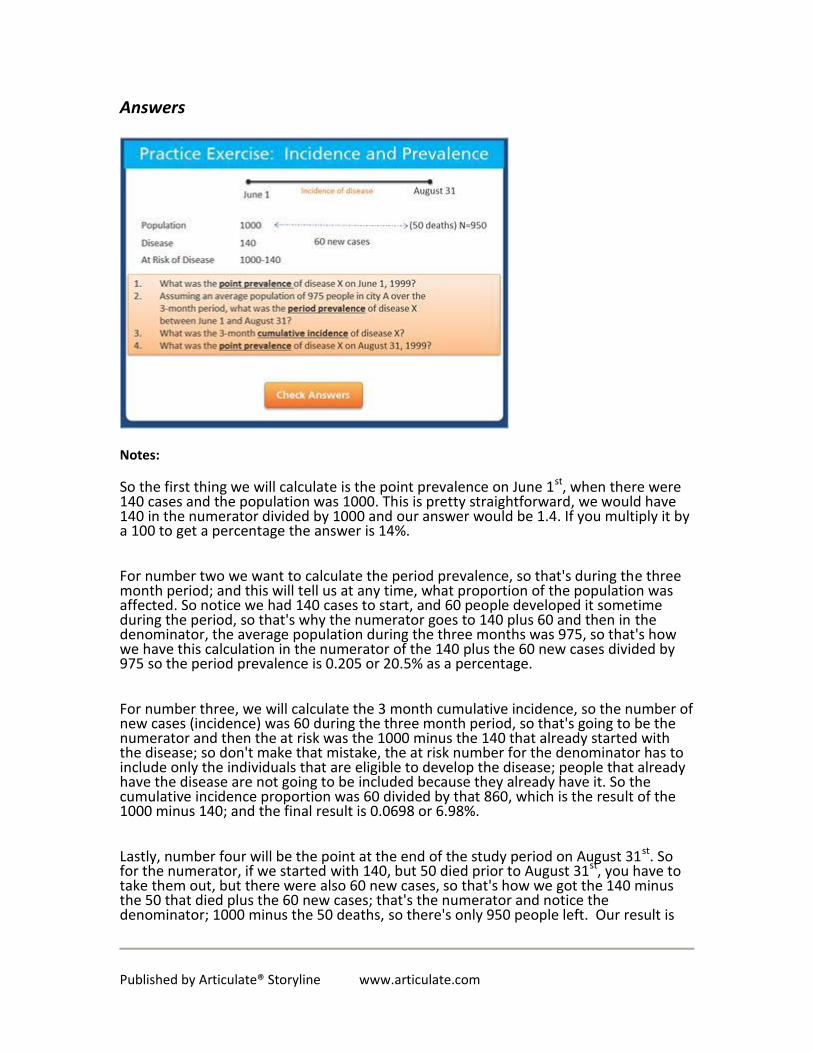
So the first thing we will calculate is the point prevalence on June 1st, when there were 140 cases and the population was 1000. This is pretty straightforward, we would have 140 in the numerator divided by 1000 and our answer would be 1.4. If you multiply it by a 100 to get a percentage the answer is 14%.
For number two we want to calculate the period prevalence, so that's during the three month period; and this will tell us at any time, what proportion of the population was affected. So notice we had 140 cases to start, and 60 people developed it sometime during the period, so that's why the numerator goes to 140 plus 60 and then in the denominator, the average population during the three months was 975, so that's how we have this calculation in the numerator of the 140 plus the 60 new cases divided by 975 so the period prevalence is 0.205 or 20.5% as a percentage.
For number three, we will calculate the 3 month cumulative incidence, so the number of new cases (incidence) was 60 during the three month period, so that's going to be the numerator and then the at risk was the 1000 minus the 140 that already started with the disease; so don't make that mistake, the at risk number for the denominator has to include only the individuals that are eligible to develop the disease; people that already have the disease are not going to be included because they already have it. So the cumulative incidence proportion was 60 divided by that 860, which is the result of the 1000 minus 140; and the final result is 0.0698 or 6.98%.
Lastly, number four will be the point at the end of the study period on August 31st. So for the numerator, if we started with 140, but 50 died prior to August 31st, you have to take them out, but there were also 60 new cases, so that's how we got the 140 minus the 50 that died plus the 60 new cases; that's the numerator and notice the denominator; 1000 minus the 50 deaths, so there's only 950 people left. Our result is
Published by Articulate® Storyline www.articulate.com
0.158 or 15.8%. So that is how to complete all four calculations, and you just want to make sure that you carefully think about what's in the numerator and what's in the denominator.
Knowledge Check Intro
Notes:
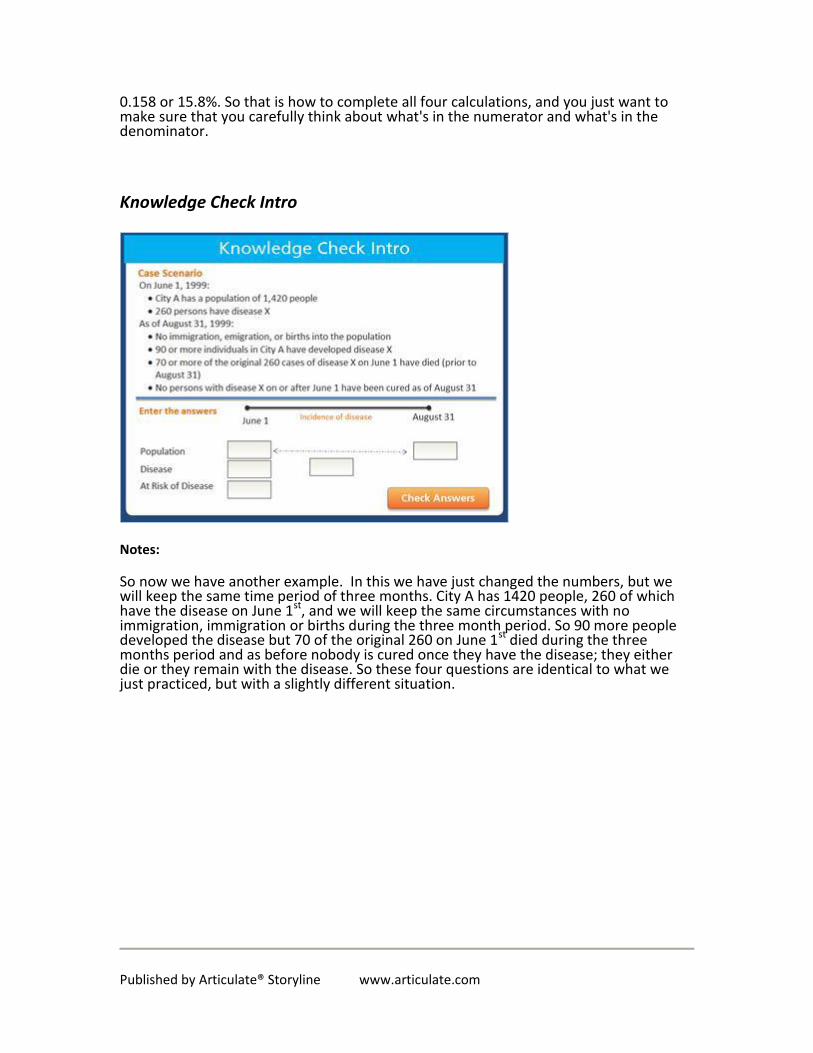
So now we have another example. In this we have just changed the numbers, but we will keep the same time period of three months. City A has 1420 people, 260 of which have the disease on June 1st, and we will keep the same circumstances with no immigration, immigration or births during the three month period. So 90 more people developed the disease but 70 of the original 260 on June 1st died during the three months period and as before nobody is cured once they have the disease; they either die or they remain with the disease. So these four questions are identical to what we just practiced, but with a slightly different situation.

Published by Articulate® Storyline www.articulate.com
Knowledge Check 1
Notes:
So the first thing we will calculate is the point prevalence on June 1st, when there were 140 cases and the population was 1000. This is pretty straightforward, we would have 140 in the numerator divided by 1000 and our answer would be 1.4. If you multiply it by a 100 to get a percentage the answer is 14%.

Published by Articulate® Storyline www.articulate.com
Knowledge Check 2
Notes:
For number two we want to calculate the period prevalence, so that’s during the three month period; and this will tell us at any time, what proportion of the population was affected. So notice we had 140 cases to start, and 60 people developed it sometime during the period, so that’s why the numerator goes to 140 plus 60 and then in the denominator, the average population during the three months was 975, so that’s how we have this calculation in the numerator of the 140 plus the 60 new cases divided by 975 so the period prevalence is 0.205 or 20.5% as a percentage.

Published by Articulate® Storyline www.articulate.com
Knowledge Check 3
Notes:
For number three, we will calculate the 3 month cumulative incidence, so the number of new cases (incidence) was 60 during the three month period, so that’s going to be the numerator and then the at risk was the 1000 minus the 140 that already started with the disease; so don’t make that mistake, the at risk number for the denominator has to include only the individuals that are eligible to develop the disease; people that already have the disease are not going to be included because they already have it. So the cumulative incidence proportion was 60 divided by that 860, which is the result of the 1000 minus 140; and the final result is 0.0698 or 6.98%.

Published by Articulate® Storyline www.articulate.com
Knowledge Check 4
Notes:
Lastly, number four will be the point at the end of the study period on August 31st. So for the numerator, if we started with 140, but 50 died prior to August 31 st, you have to take them out, but there were also 60 new cases, so that’s how we got the 140 minus the 50 that died plus the 60 new cases; that’s the numerator and notice the denominator; 1000 minus the 50 deaths, so there’s only 950 people left. Our result is 0.158 or 15.8%. So that is how to complete all four calculations, and you just want to make sure that you carefully think about what’s in the numerator and what’s in the denominator.
Published by Articulate® Storyline www.articulate.com
Summary
Notes:
You are now able to:
Define, calculate, and interpret prevalence
Distinguish between point and period prevalence
Understand special types of incidence and prevalence measures
Understand the interrelationship between incidence, prevalence, and duration of disease
Differentiate the use of incidence and prevalence measures