Embed Size (px)
Citation preview

June 2004 / Vol. 54 No. 6 • BioScience 573
Articles
The array of airborne and satellite sensors deployedto monitor the biosphere has increased rapidly over the
last decade (Lefsky and Cohen 2003). Land cover can bereadily mapped at a variety of spatial resolutions and degreesof disaggregation, and biophysical state variables such as leafarea index (LAI) can also be mapped to reveal spatial patternsin vegetation distribution and phenology. However, remotemonitoring of carbon cycle process rates, such as net primaryproduction (NPP) and net ecosystem production (NEP), re-mains challenging. Quantifying these flux rates is critical tounderstanding the role of the biosphere in regulating at-mospheric carbon dioxide (CO2) concentration.
Ecosystem process models are important tools for apply-ing the information provided by remote sensing products toquantify fluxes of carbon and other elements. Physiologi-cally based process models, applied in a spatially distributedmode, can assimilate and effectively integrate a diverse as-semblage of environmental data, including information onsoils, climate, and vegetation. Many of the relevant data on veg-etation are now available from remote sensing, and the inte-gration of remote sensing and process modeling is a rapidlyevolving field (Cohen and Goward 2004).
The emerging capabilities for monitoring carbon pools andfluxes at relatively high spatial and temporal resolution arefinding numerous applications, notably with respect to meet-ing the requirements of the United Nations Framework Con-vention on Climate Change to produce carbon emission
inventories that include the effects of land use (e.g., Chen etal. 2003). At the regional scale, comparison of carbon cycleprocesses from years with different seasonal and annualweather patterns can give an indication of potential regionalresponses and biospheric feedbacks to climate change.Landscape- and regional-scale mapping of carbon fluxes is alsoneeded to provide local validation of the global measures ofNPP products from coarse-resolution sensors such as MODIS(Moderate Resolution Imaging Spectroradiometer; Runninget al. 2004) and to evaluate the carbon flux estimates derivedfrom inverse modeling (Ciais et al. 2000). In this article, weoutline remote sensing capabilities in relation to carbon cycle modeling and present examples of studies in threeNorth American regions to demonstrate specific applica-tions of an integrated remote sensing and modeling approach.
David P. Turner (e-mail: [email protected]) is an associate pro-
fessor of ecological modeling in the Department of Forest Science, Oregon
State University, Corvallis OR 97331. Scott V. Ollinger is an assistant pro-
fessor of forest ecosystem analysis and remote sensing at the Institute for the
Study of Earth, Oceans, and Space, University of New Hampshire, Durham,
NH 03824. John S. Kimball is an assistant professor of hydrology and ecol-
ogy research at Flathead Lake Biological Station, Division of Biological
Sciences, University of Montana, Missoula, MT 59812. © 2004 American
Institute of Biological Sciences.
Integrating Remote Sensing andEcosystem Process Models forLandscape- to Regional-ScaleAnalysis of the Carbon Cycle
DAVID P. TURNER, SCOTT V. OLLINGER, AND JOHN S. KIMBALL
A growing body of research has demonstrated the complementary nature of remote sensing and ecosystem modeling in studies of terrestrial carboncycling. Whereas remote sensing instruments are designed to capture spatially continuous information on the reflectance properties of landscapeand vegetation, models focus on the underlying biogeochemical processes that regulate carbon transformation, often over longer temporal scales.Remote sensing capabilities, developed over the past several decades, now provide regular, high-resolution (10-meter to 1-kilometer) mapping andmonitoring of land surface characteristics relevant to modeling, including vegetation type, biomass, stand age class, phenology, leaf area index, andtree height. Integration of these data sets with ecosystem process models and distributed climate data provides a means for regional assessment ofcarbon fluxes and analysis of the underlying processes affecting them. Applications include monitoring of carbon pools and flux in response to theUnited Nations Framework Convention on Climate Change.
Keywords: remote sensing, models, carbon flux, landscape, regional

Models as platforms for data synthesis and integration The rapidly proliferating volume of spatial data generated byremote sensing has created a significant challenge in terms ofdesigning algorithms that optimally assimilate, integrate, anddistill these data into useful information. A spatially distrib-uted process model uses spatial data to define initial condi-tions (e.g., land-cover type) or as primary drivers forcomputing biophysical processes (e.g., daily temperature). Amajor benefit to using process models for scaling purposes isthat they can estimate many measurable variables; the modelalgorithms thus represent hypotheses that can be assessed andpotentially revised after confrontation with observations.
Depending on the scientific objectives or applications,carbon cycle models have been designed with varying degreesof aggregation with respect to ecosystem processes, compo-nents, and time steps. Models also vary widely in how muchthey use remotely sensed input. For the purposes of assess-ing impacts of future climate change, a model must be ableto determine its own biogeography and biogeochemistryprimarily on the basis of climate and edaphic conditions.However, if the objective is simply monitoring current NPP,a wide variety of remotely sensed data could potentially beused.
Because the relatively simple models based on light-use efficiency (see Running et al. 2004) focus on current vegeta-tion condition and do not include ecological and biogeo-chemical processes, they are generally not suitable for capturingchanges in carbon flux over the course of forest succession.Since these changes can be a major factor in characterizing actual forest carbon flux for a specific area, more complexmodels may be needed for some applications. The most com-plex models, such as ecosys (Grant et al. 2003), are designedprimarily to improve understanding of ecosystem functionand to investigate potential impacts of environmental changeat the site level. These models tend to have input requirementsthat are not feasibly generated in a spatial mode. Here we focus on ecosystem process models of intermediate com-plexity, such as PnET-CN and Biome-BGC (table 1). Thesemodels were designed to capture important ecosystemprocesses using generalized response functions that can be applied across large areas.
Remote sensing of vegetation properties in relation to modelingPrescribing initial conditions for a spatially distributed modelrun affords important constaints on model behavior. Theseinitial conditions may include both categorical and contin-uous variables.
Land cover. Specifying the type of land cover is an importantfirst step in the implementation of a spatially distributedcarbon cycle model, because vegetation cover types differwidely in their allometry and physiology. These differences inmorphological and ecophysiological attributes are the resultof adaptations to specific environments (Reich et al. 1997).
Broadleaf deciduous forests, for example, have very differentstructural and environmental response characteristics thangrassland or evergreen coniferous forests, even though thesevegetation types often occupy the same physiographic re-gions. Whereas differences in plant functional attributes canbe observed and quantified at the plot scale, land-cover mapsbased on remote sensing provide the means to extrapolate lo-cal observations across large regions. Although spatial vari-ation in the attributes of vegetation within a cover type canalso be important, the relative consistency of these func-tional adaptations within cover types has proved to be enor-mously useful to modelers when combined with spatial datafor land-cover characteristics. In this way, vegetation param-eters required by models (e.g., leaf mass per unit area andmaximum stomatal conductance) can be estimated spatiallyand allowed to interact with information on climate, soils, orother environmental factors (Ollinger et al. 1998).
In an effort to standardize land-cover classification at theglobal scale, the International Geosphere-Biosphere Pro-gramme has developed a 15-class scheme based on generalstructural characteristics of global vegetation and other land-cover features. This degree of disaggregation roughly matchesthe capability of sensors such as the Landsat Thematic Map-per to isolate different classes of land cover. An alternative tovegetation classification is provided by the “continuous fields”for life form, leaf type, and leaf longevity that are being developed from 500-meter (m) MODIS data. These surfacesmake maximum use of multitemporal satellite data and willbe increasingly useful for model initialization in regional applications.
Forest stand age class. Change in NPP with stand age is a well-recognized phenomenon, even though the mechanisms un-derlying this change remain controversial (Gower et al. 1996).Temporal patterns in NEP over relatively long-term succes-sional stages within a cover type are also generally understoodbecause of the strong carbon source associated with woodyresidues in early succession and the accumulation of stemwood and woody debris in mid to late succession (Janisch andHarmon 2002). If stand age is specified by remote sensing,carbon cycle process models can be run over the course ofsuccession, improving their ability to accurately simulateNPP and NEP (Thornton et al. 2002, Law et al. forthcoming).
Classification based on remote sensing is the most commonapproach to assessing regional patterns of forest stand age,because it requires only one image and is relatively efficientcompared to field inventory approaches. The changes in reflectance with stand age that permit classification are associated with differences in the proportion of ground surface that is exposed, in the spectral characteristics of thefoliage (including epiphytic lichens), and in the structuralproperties of the canopy, which influence patterns of shad-ing. In moist tropical forests, several stages of succession canbe separated using the Landsat Enhanced Thematic MapperPlus (ETM+) sensor by relying on differences in red andnear-infrared reflectances (Moran et al. 1994). In the Pacific
574 BioScience • June 2004 / Vol. 54 No. 6
Articles
Northwest, reflectances in the midinfrared wavelengths havealso been included in age-based classification schemes (Co-hen et al. 1995). Classification accuracies on the order of80% are generally achieved in these studies. An alternative,more precise approach to estimating stand age is the analy-sis of change detection using multiple images (Hall et al.1991, Cohen et al. 2002). This approach is particularly desirablefor modeling NEP in the first few years of succession, whenheterotrophic respiration is high and NPP is low.
Leaf area index. Specifying LAI from remote sensing is par-ticularly informative when models include canopy light ex-tinction and other processes that vary with canopy depth.There is usually a significant correlation of LAI to spectralvegetation indexes such as the normalized difference vegeta-tion index (NDVI) because of the variable red and near-infrared spectral reflectance properties of photosyntheticmaterial. However, the relationship tends to be asymptotic,with saturation at LAI levels on the order of three to five(Turner et al. 1999). Forest LAI has also been estimated using airborne lidar (light detecting and ranging) sensors, andthe relationship of field-measured LAI to lidar data is not asymptotic (Lefsky et al. 1999). Lidar, like the combination ofhyperspectral data and interferometric synthetic apertureradar (InSAR), has the added capability of characterizingthe distribution of foliage with height in the canopy (Lefskyet al. 2002, Treuhaft et al. 2002, 2004).
Besides the maximum seasonal LAI, some carbon cyclemodels also assimilate spatial information on seasonal changesin LAI (e.g., Liu et al. 1999) or dates for the beginning of leaf-out and the beginning and end of leaf drop. For Earth-orbitingsensors with daily coverage, it has been demonstrated thatcompositing over intervals of 8 days or more to avoid prob-lems with cloudiness generally permits reliable monitoring ofleaf phenology. Capturing the seasonal trajectory of LAI inecosystems such as grasslands and deciduous forests is nowpossible at spatial resolutions as fine as 250 m with MODISdata (Zhang et al. 2003). Since interannual variation in NPPand NEP is significantly affected by the length of the grow-ing season (Kimball et al. forthcoming), knowing the timingof green-up and leaf drop is of great value.
Foliar nitrogen. The positive relationship between leaf nitrogenand photosynthetic capacity has become one of the mostenduring results of modern ecophysiology and is at the core
of a number of ecosystem models. The basis of this relation-ship is that most of the nitrogen in plant foliage is containedwithin proteins and carboxylating enzymes that are associatedwith photosynthesis (e.g., rubisco [ribulose biphosphate car-boxylase/oxygenase]).
Evidence supporting the role of canopy nitrogen concen-trations as a scalar for carbon uptake comes from both theo-retical and empirical studies. Because nitrogen is often thelimiting nutrient in terrestrial ecosystems, it has been ar-gued that natural selection should favor individuals that al-locate nitrogen through the canopy in an efficient manner.This notion has also been borne out through field studiesshowing strong relationships among NPP, canopy-level ni-trogen concentrations, and rates of nitrogen mineralizationin soils (Reich et al 1997, Smith et al. 2002). Recently, Greenand colleagues (2003) compiled data from a variety of C3 plantcommunities and found that most of the variation in canopylight-use efficiency could be explained by variation in leaf ni-trogen.
An obvious extension of these results is that methods fordetecting canopy nitrogen concentrations can substantiallyimprove the accuracy of spatially explicit model applica-tions. Methods for detecting canopy nitrogen using airborneremote sensing at high spectral resolution have been availablefor some time (see Smith et al. 2002), and one of the authorsof this article (S. V. O., working with Marie-Louise Smith) recently showed that this approach increased the predictionaccuracy of a productivity model applied in the White Moun-tains region of New Hampshire. However, broader applica-tion of canopy nitrogen detection has thus far been limitedby the availability of hyperspectral data and by the smallspatial coverage of the instruments that are currently avail-able. Given the critical importance of nitrogen as a rate-limiting factor in terrestrial carbon cycling, and the contin-ued development of new hyperspectral sensors (e.g., thespace-based Hyperion instrument, launched in November2000), expanded application of this approach can be ex-pected in the future (Ustin et al. 2004).
Biomass. Knowledge of the amount of vegetation biomass isa strong foundation for simulating local carbon budgets.The mass of living material is often used to initialize vegeta-tion carbon pools for regional model simulations (Kimballet al. 2000) and is particularly important for estimating auto-trophic respiration. Stem mass is also indicative of the detri-
June 2004 / Vol. 54 No. 6 • BioScience 575
Articles
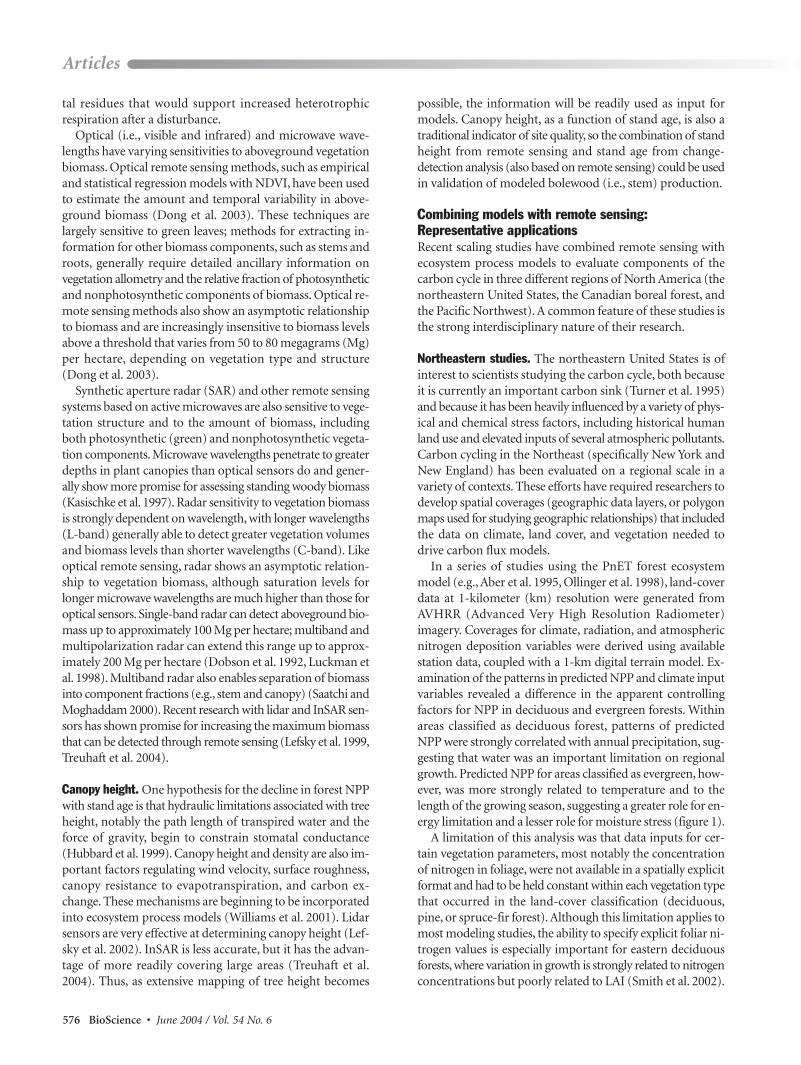
Table 1. Comparison of ecosystem models at different levels of aggregation.
Model name Time step Features Reference
TEM Monthly Rate parameters calibrated with observed Raich et al. 1991net primary production
PnET-CN Monthly Maximum photosynthetic rate determined Aber et al. 1997by foliar nitrogen concentration
Biome-BGC Daily Photosynthesis and transpiration based on Thornton et al. 2002stomatal conductance
SPA Hourly Water balance (includes root and stem Williams et al. 2001resistance and plant capacitance)
tal residues that would support increased heterotrophic respiration after a disturbance.
Optical (i.e., visible and infrared) and microwave wave-lengths have varying sensitivities to aboveground vegetationbiomass. Optical remote sensing methods, such as empiricaland statistical regression models with NDVI, have been usedto estimate the amount and temporal variability in above-ground biomass (Dong et al. 2003). These techniques arelargely sensitive to green leaves; methods for extracting in-formation for other biomass components, such as stems androots, generally require detailed ancillary information onvegetation allometry and the relative fraction of photosyntheticand nonphotosynthetic components of biomass. Optical re-mote sensing methods also show an asymptotic relationshipto biomass and are increasingly insensitive to biomass levelsabove a threshold that varies from 50 to 80 megagrams (Mg)per hectare, depending on vegetation type and structure(Dong et al. 2003).
Synthetic aperture radar (SAR) and other remote sensingsystems based on active microwaves are also sensitive to vege-tation structure and to the amount of biomass, includingboth photosynthetic (green) and nonphotosynthetic vegeta-tion components. Microwave wavelengths penetrate to greaterdepths in plant canopies than optical sensors do and gener-ally show more promise for assessing standing woody biomass(Kasischke et al. 1997). Radar sensitivity to vegetation biomassis strongly dependent on wavelength, with longer wavelengths(L-band) generally able to detect greater vegetation volumesand biomass levels than shorter wavelengths (C-band). Likeoptical remote sensing, radar shows an asymptotic relation-ship to vegetation biomass, although saturation levels forlonger microwave wavelengths are much higher than those foroptical sensors. Single-band radar can detect aboveground bio-mass up to approximately 100 Mg per hectare; multiband andmultipolarization radar can extend this range up to approx-imately 200 Mg per hectare (Dobson et al. 1992, Luckman etal. 1998). Multiband radar also enables separation of biomassinto component fractions (e.g., stem and canopy) (Saatchi andMoghaddam 2000). Recent research with lidar and InSAR sen-sors has shown promise for increasing the maximum biomassthat can be detected through remote sensing (Lefsky et al. 1999,Treuhaft et al. 2004).
Canopy height. One hypothesis for the decline in forest NPPwith stand age is that hydraulic limitations associated with treeheight, notably the path length of transpired water and theforce of gravity, begin to constrain stomatal conductance(Hubbard et al. 1999). Canopy height and density are also im-portant factors regulating wind velocity, surface roughness,canopy resistance to evapotranspiration, and carbon ex-change. These mechanisms are beginning to be incorporatedinto ecosystem process models (Williams et al. 2001). Lidarsensors are very effective at determining canopy height (Lef-sky et al. 2002). InSAR is less accurate, but it has the advan-tage of more readily covering large areas (Treuhaft et al.2004). Thus, as extensive mapping of tree height becomes
possible, the information will be readily used as input for models. Canopy height, as a function of stand age, is also a traditional indicator of site quality, so the combination of standheight from remote sensing and stand age from change-detection analysis (also based on remote sensing) could be usedin validation of modeled bolewood (i.e., stem) production.
Combining models with remote sensing: Representative applicationsRecent scaling studies have combined remote sensing withecosystem process models to evaluate components of thecarbon cycle in three different regions of North America (thenortheastern United States, the Canadian boreal forest, andthe Pacific Northwest). A common feature of these studies isthe strong interdisciplinary nature of their research.
Northeastern studies. The northeastern United States is ofinterest to scientists studying the carbon cycle, both becauseit is currently an important carbon sink (Turner et al. 1995)and because it has been heavily influenced by a variety of phys-ical and chemical stress factors, including historical humanland use and elevated inputs of several atmospheric pollutants.Carbon cycling in the Northeast (specifically New York andNew England) has been evaluated on a regional scale in a variety of contexts. These efforts have required researchers todevelop spatial coverages (geographic data layers, or polygonmaps used for studying geographic relationships) that includedthe data on climate, land cover, and vegetation needed todrive carbon flux models.
In a series of studies using the PnET forest ecosystemmodel (e.g., Aber et al. 1995, Ollinger et al. 1998), land-coverdata at 1-kilometer (km) resolution were generated fromAVHRR (Advanced Very High Resolution Radiometer) imagery. Coverages for climate, radiation, and atmosphericnitrogen deposition variables were derived using available station data, coupled with a 1-km digital terrain model. Ex-amination of the patterns in predicted NPP and climate inputvariables revealed a difference in the apparent controllingfactors for NPP in deciduous and evergreen forests. Withinareas classified as deciduous forest, patterns of predictedNPP were strongly correlated with annual precipitation, sug-gesting that water was an important limitation on regionalgrowth. Predicted NPP for areas classified as evergreen, how-ever, was more strongly related to temperature and to thelength of the growing season, suggesting a greater role for en-ergy limitation and a lesser role for moisture stress (figure 1).
A limitation of this analysis was that data inputs for cer-tain vegetation parameters, most notably the concentrationof nitrogen in foliage, were not available in a spatially explicitformat and had to be held constant within each vegetation typethat occurred in the land-cover classification (deciduous,pine, or spruce-fir forest). Although this limitation applies tomost modeling studies, the ability to specify explicit foliar ni-trogen values is especially important for eastern deciduousforests, where variation in growth is strongly related to nitrogenconcentrations but poorly related to LAI (Smith et al. 2002).
576 BioScience • June 2004 / Vol. 54 No. 6
Articles

Given the absence of data layers for canopy nitrogen at the re-gional scale, a subsequent investigation was carried out (byS.V. O. and Marie-Louise Smith) over a smaller landscape sur-rounding the Bartlett Experimental Forest (BEF) in northernNew Hampshire. A spatial coverage for canopy nitrogen wasderived using remotely sensed data at high spectral resolutionfrom the aircraft-based Airborne Visible/Infrared ImagingSpectrometer (AVIRIS) sensor operated by the NationalAeronautics and Space Administration (NASA). In this study,the PnET model was run at 18-m spatial resolution usingAVIRIS-derived canopy nitrogen inputs. As a means of test-ing the benefit of canopy nitrogen detection, an additional setof runs was conducted using mean foliar nitrogen values fordeciduous and evergreen stands, mimicking the approach usedwhen data at high spectral resolution are not available. Com-parison of simulated wood growth against field measure-ments at 38 field validation plots (figure 2) produced apredicted r2 of 0.74, which was a substantial improvement overpredictions generated using mean foliar nitrogen (r2 = 0.37).
An interesting outcome of this work was that, at the scalerepresented by the BEF (approximately 5 by 5 km), the fac-tor that explained most of the variation in predicted andobserved productivity was foliar nitrogen (figure 2), withmuch smaller degrees of variation caused by climatic variables.This apparent contrast with results observed for the GreaterNortheast reflects the different degrees of variation thesefactors exhibit over different spatial scales. At BEF, local vari-ation in foliar nitrogen is substantial; the range of nitrogenmeasurements for the forest is almost as great as the range forthe entire region. In contrast, temperature and precipitation
typically vary more widely at regional and continental scalesthan within local landscapes. Although local variation in climate can be important, particularly in areas of complextopography, the range of temperature and precipitation experienced at BEF is small compared with the broad gradi-ents that occur over larger geographical regions.
Boreal Ecosystem-Atmosphere Study. The Boreal Ecosystem-Atmosphere Study (BOREAS) was an international, multi-disciplinary effort to improve understanding of the structureand function of the boreal forest biome (Sellers et al. 1997).Recent evidence of increased warming in Canada’s borealforests—a trend that has been linked to global climatechange—has generated great interest from the scientific com-munity, particularly in light of the potential for large positivefeedbacks to regional and global weather and carbon cycles.Thus, researchers have endeavored to clarify the interactionsof boreal forest processes with climate and to examine the roleof these forests in the terrestrial carbon cycle. A major focusof BOREAS was the development and evaluation of an inte-grated surface measurement network, along with approachesbased on ecological models and remote sensing, for the tem-poral and spatial extrapolation of forest biomass, productivity,and net carbon exchange.
A primary requirement of the regional ecological model-ing efforts in BOREAS was relevant land-cover classifica-tion. Biophysical and meteorological measurements, includingtower-based eddy covariance measurements, were made at anetwork of sites within the region. These measurements revealed marked differences in energy exchange and carbon
June 2004 / Vol. 54 No. 6 • BioScience 577
Articles
Figure 1. Net primary production, or NPP, in grams of carbon per square meter per year(1-kilometer resolution), simulated by the PnET model for the northeastern United Statesusing land-cover data from remote sensing (left). Simulated NPP for three cover types(right) is strongly related to annual precipitation (for deciduous forests) or to annualgrowing degree days (for pine and spruce-fir forests).
Net primary production (grams per m2 per year)
NPP
(gra
ms
per m
2pe
r ye
ar)
NPP
(gra
ms
per m
2pe
r ye
ar)
Growing degree days
Precipitation (cm per year)

cycle dynamics among needleleaf coniferous and broadleaf de-ciduous forests, as well as major differences between forestsand wetlands. Initially, many of these critical features werepoorly delineated using optical remote sensing approaches thathad been successfully used for other biomes at relativelycoarse spatial resolution (i.e., > 1 km). Subsequent ecologi-cal modeling studies revealed that adequate representation ofsubgrid-scale land-cover heterogeneity, particularly betweendeciduous forests, coniferous forests, and wetlands, is criticalfor accurate regional extrapolations of boreal carbon ex-change dynamics (e.g., Kimball et al. 1999).
BOREAS researchers made a major effort to develop im-proved remote sensing products for initializing and verifyingmodel simulations of carbon exchange. A significant lessonlearned during the study was that, at high latitudes, the application of satellite-based optical remote sensing methodsfor landscape assessment and monitoring was limited by frequent cloud cover, smoke, and other atmospheric aerosoleffects, as well as low sun angles and reduced solar illumina-tion for much of the year. Radar remote sensing, however, wasfound to be particularly useful for these environments becauseof its sensitivity to surface texture, biomass, and dielectric prop-erties and its ability to operate by night or day, under virtu-ally any weather conditions.
Of special interest was the finding that satellite informationon daily radar backscatter from the Ku-band NASA Scat-terometer, or NSCAT, was sensitive to the timing of primaryspring thaw and fall freeze events, which corresponded withtower eddy covariance measurements and with ecologicalmodel simulations of seasonal shifts in net CO2 exchange(Frolking et al. 1999). Results of ecological model simulationsand of studies measuring tower eddy flux showed that annualNPP and NEP for boreal forests are particularly sensitive tothe timing of spring thaw and to the duration of the grow-ing season (Kimball et al. 2000). Subsequent analyses ofrecords from long-term, satellite-based active and passivemicrowave remote sensing, and of long-term simulations ofstand carbon exchange, revealed strong linkages between thetiming of the primary spring thaw event and the annual netcarbon exchange for boreal coniferous and deciduous stands(see figure 3). Airborne and satellite remote sensing based onSAR was also employed to improve land-cover mapping,particularly for wetlands, and to quantify spatial and temporalpatterns in vegetation (crown and stem) biomass (Saatchi andMoghaddam 2000).
As in the northeastern studies, a major factor that BOREASdid not directly address was the role of disturbance (e.g.,fire, land management, insects) in shaping the boreal land-scape and determining the carbon cycle dynamics of the bo-real forest. Initial land-cover classifications for the region,derived from NDVI data at 1-km resolution gathered usingAVHRR, indicated that approximately 30% of the regionwas directly affected by fire disturbance during the 30- to 35-year period before 1992 (Steyaert et al. 1997). Disturbancesfrom insect defoliation, logging, and agriculture-related deforestation are also known to play an important role in shap-ing land cover, the age distribution of forest stands, and associated carbon budgets for the region. BOREAS follow-on investigations have attempted to address some of these deficiencies.
Pacific Northwest study. The Pacific Northwest, with its old-growth temperate rain forests, has some of the highest car-bon densities on the planet. The rates of NPP and NEP arealso relatively high, depending on stand age and location(Law et al. forthcoming), and the region has been subject tointensive logging over the last 100 years (Garman et al. 1999).Thus, like the Northeast, the Pacific Northwest is of great in-terest to researchers trying to understand the carbon cycle.
Forest carbon budgets for the Pacific Northwest have beenconstructed on landscape to regional scales, using forest in-ventory data (Turner et al. 1995) and remote sensing of landcover and disturbance (Cohen et al. 1996). More recent effortshave included remote sensing of LAI and implementation ofchange detection for aging of forest stands (Turner et al.2003a). The process model used in the recent Pacific North-west studies is Biome-BGC (Thornton et al. 2002), which es-timates heterotrophic respiration as well as NPP. To accountfor heterotrophic respiration, particularly as it is influencedby stand age, the model must be “spun up”(i.e., run over 1000
578 BioScience • June 2004 / Vol. 54 No. 6
Articles
Figure 2. The relationship between foliar nitrogen (N)concentration (as a percentage of leaf mass) and woodgrowth (in grams of carbon per square meter per year) for38 growth-inventory plots at the Bartlett ExperimentalForest in north-central New Hampshire. Shaded symbolsshow the field-measured relationship; open symbols showthe predicted relationship, generated by combining re-motely sensed canopy nitrogen estimates (from the Air-borne Visible/Infrared Imaging Spectrometer, or AVIRIS)with the PnET ecosystem model.

years or more) to bring the slow-turnover soil carbon pools into near equilibrium with the local climate. At the end of the spin-up, a disturbancesuch as clear-cut logging is simulated, and the modelis run forward to an age specified by the remotesensing analysis. Site water balance (in part a func-tion of soil depth) strongly regulates LAI in the Pacific Northwest; thus, the spin-ups are run at arange of soil depths for each grid cell, to determinea depth that results in agreement between modeledand remotely sensed LAI.
At the landscape scale, the implementation of thiscombination of remote sensing and modeling (fig-ure 4) revealed the strong influence of stand age-classdistribution on areawide NEP (Turner et al. 2003a).Without including the age-class specification, thesimulated landscape-scale NEP was 50 grams (g)carbon per square meter per year in the central Cas-cade Mountains in Oregon (a small carbon sink),compared with more than 200 g carbon per squaremeter per year for the same area with the stand ageclass specified by the ETM+ sensor. In an applicationover a much larger domain, the dominant control onNPP and NEP was the water balance gradient that ex-tends inland from the Pacific coast (Law et al. forth-coming). For all locations, the simulations showeda strong interannual variation in NPP, associatedprimarily with the degree of summer drought.
Validation of model-based carbon flux estimatesin the Pacific Northwest has been approached atmultiple scales (Law et al. forthcoming). Comparingthe daily gross primary production (GPP) and NEPas simulated by the model with the same measuresas estimated from eddy covariance data made it pos-sible to assess model sensitivity to daily weather. Toevaluate model behavior over a successional se-quence, field measurements of NPP and NEP at achronosequence of plots in different climatic zoneswere compared with model simulations of NPP andNEP at the stand locations. At the regional scale,data from the permanent plot network of the USDA(US Department of Agriculture) Forest Service’sForest Inventory and Analysis program provided aspatially extensive data set for validation of theBiome-BGC model. However, the inventory datahave considerable limitations in terms of convertingthe raw measurements of tree diameters to estimatesof carbon pools and flux (Jenkins et al. 2001). Becausethe exact locations of the inventory plots are not re-leased, comparisons of measured (figure 5) and simulated stemproduction were made within age-class bins at the ecozonescale to examine overall bias and age trends in production.
Selected research challengesThe increasing availability of spatial data and the growing interest in quantifying terrestrial carbon flux have driven
rapid progress in the integration of modeling and remote sens-ing. Some of the key challenges at this point relate to algorithmdevelopment and the interpretation or validation of result-ing products.
Resolving aggregation issues. There is an unavoidable ten-sion in carbon flux scaling studies between spatial resolution
June 2004 / Vol. 54 No. 6 • BioScience 579
Articles
Figure 3. Satellite remote sensing (top) of the 1997 primary spring thaw event for the Boreal Ecosystem-Atmosphere Study (BOREAS)study region, derived from temporal classification of daily radarbackscatter information from the NASA (National Aeronautics andSpace Administration) Scatterometer, or NSCAT. The dates in the leg-end represent the interval during which thaw occurred. Graph (bottompanel) shows the relationship between measurements of abovegroundnet primary production (NPP) for different forest types by year withinthe study region and corresponding estimates of snowpack depletion,a surrogate measure of spring thaw timing. Years with an early springtend to promote greater annual NPP, whereas years with a delayedspring promote the opposite response. Adapted from Kimball and colleagues (2000, forthcoming).
Date of primary boreal spring thaw event derived from satellite remotesensing (BOREAS study region, 1997)
< Mar 16
Mar 17–31
Apr 1–5
Apr 16–30
May 1–15> May 16
Open water
No data
Black spruce (r2 = 0.57, slope = –1.2)Jack pine (r2 = 0.52, slope = –0.4)Mixed deciduous/coniferous forest (r2 = 0.36, slope = –1.5)Aspen (r2 = 0.50, slope = –2.6)
NPP
(abo
ve g
roun
d)(g
ram
s of
car
bon
per m
2pe
r ye
ar)

and spatial extent. Process models tend to be computation-ally demanding, especially if a long spin-up is required. Thus,it may not be feasible to scale NPP and NEP over millions ofsquare kilometers at the 30-m resolution of the ETM+ sen-sor. Comparisons of pattern and process at coarse and finescales over the same domain often reveal scale dependence inmodel inputs and outputs (Moody and Woodcock 1995,Kimball et al. 1999). New strategies are needed to diagnose and,if need be, compensate for this scale dependence.
Screening algorithms that detect the scale of spatial heterogeneity in land cover based on high spatial resolutionspectral reflectance could potentially be used to differentiatebetween relatively homogeneous areas and the heterogeneousareas where a fine spatial resolution (< 1 km) may be needed.Analysis of spatial autocorrelation with Landsat Thematic
Mapper imagery in the Pacific Northwest suggests that atresolutions coarser than 250 m, the pattern of dispersedclear-cuts begins to be lost (Turner et al. 2000).
The potential problems with temporal resolution are anal-ogous to those with spatial resolution in many respects. Leaf-level measurements with cuvettes, and ecosystem-levelmeasurements with eddy covariance flux towers, reveal thatbasic physiological processes such as photosynthesis andplant respiration respond quite rapidly (and often in a non-linear fashion) to environmental drivers such as temperatureand irradiance. However, running a half-hourly time-stepmodel over a large area for multiple years is often not feasi-ble, not only for computational reasons but also because ofthe difficulty of providing meteorological data for each gridcell at each time step. One alternative approach has been to
580 BioScience • June 2004 / Vol. 54 No. 6
Articles
Figure 4. Landscape-scale application of the Biome-BGC model with inputs of land cover and leaf area index from remotesensing: (a) shaded relief, (b) land cover, (c) leaf area index (in square meters of leaf area per square meter of ground), and(d) net ecosystem production (in grams of carbon per square meter per year). “HJA” refers to the H. J. Andrews ExperimentalForest. Adapted from Turner and colleagues (2003a).
HJA boundaryYoung conifer
Mature conifer
Old conifer
Mixed
Broadleaf
Semiopen
Open
Water
a b
dc
g C m–2 yr–1m2 m–2
0 12 < 0 0 550

develop process models using data at fine temporal resolu-tion for model calibration (e.g., half-hourly eddy covarianceflux data) and to run the models for a wide range of envi-ronmental conditions, subsequently aggregating results to acoarser time step to create response surfaces or parameteri-zations for much simpler model forms (Williams et al. 1997).The simpler model is then used in scaling applications.
Distinguishing the effects of canopy structure and chemistryin carbon flux studies. In forested ecosystems, the canopyproperties that have been examined as potential scalars be-tween remotely sensed imagery and carbon flux simulationmodels can be generalized into two groups: (1) structuralproperties, such as canopy biomass and LAI, and (2) bio-chemical variables, such as chlorophyll and nitrogen con-centrations.Although there is a reasonably firm understandingof the roles played by each of these variables at specific sites,the degree to which broadscale patterns of terrestrial carbonuptake reflect variation in canopy structure rather than chem-istry is not well understood.
Remote sensing is quite effective in quantifying LAI at relatively low levels. When LAI is low, the relationship of LAIto NPP is strong, because a higher LAI means more absorbed photosynthetically active radiation (APAR). How-ever, when LAI is higher (> 4), the fraction of incident pho-tosynthetically active radiation that is absorbed by the canopyis often close to 1, and therefore APAR does not increase ap-preciably with increasing LAI. At that point, additional struc-tural, compositional, and biochemical factors gain importanceas determinants of productivity. These include the following:
• The distribution of LAI among different heights in thecanopy (detectable by lidar and InSAR), which affectsthe ratio of direct to diffuse light in the canopy andhence the efficiency of light use.
• The variation among species in shade tolerance and incorresponding light-use efficiency.
• The variation in foliar nitrogen concentration amongsites, and among species within a site, which stronglyinfluences productivity (Smith et al. 2002).
It is also evident that decreases in foliar nitrogen concentra-tion late in the growing season are correlated with decreasesin canopy light-use efficiency that are independent of changesin LAI (Wilson et al. 2001, Turner et al. 2003b).
Although regional- and continental-scale variation infoliar nitrogen has been observed empirically and predictedby optimal nitrogen allocation models (e.g., Haxeltine andPrentice 1996), detecting nitrogen concentrations at broadspatial scales has not been accomplished. The successfullaunch of the Hyperion sensor, which operates at high spec-tral resolution (220 channels) and at 30-m spatial resolution(an effective resolution for vegetation surveys), providesopportunities for research at a growing number of sites(Ustin et al. 2004). The technical challenges that must be metto make optimal use of these data include dealing with
large volumes of data, improving methods for atmosphericcorrection, and developing broadly applicable relation-ships between spectral data and measured biochemicalconstituents.
Validating estimates of carbon flux at coarse spatial resolu-tions. The successful deployment of the MODIS sensor nowpermits estimation of GPP every 8 days, and of NPP on anannual basis, for every square kilometer of Earth’s terrestrialsurface (Running et al. 2004). A critical scaling issue relatedto the task of validating products from coarse-resolutionsensors such as MODIS involves matching the scale of groundmeasurements to the scale of the sensor products. NPP is typically measured in plots or subplots ranging from 1 to 100 m2 (Gower et al. 1999); thus, it is not feasible to measureNPP from wall to wall in a coarse-resolution grid cell. For NPP,the best alternative may be to use remote sensing and modeling at fine spatial resolution (10 to 30 m), in which the
June 2004 / Vol. 54 No. 6 • BioScience 581
Articles
Figure 5. Aboveground wood net primary production(NPPAw; grams of carbon per square meter per year) andstand age (years) at permanent plots managed by theUSDA (US Department of Agriculture) Forest Service’sForest Inventory and Analysis Program in two ecozones,(a) the western Cascades and (b) the eastern Cascades.Adapted from Law and colleagues (forthcoming).
NPP
Aw(g
C m
–2y–1
)N
PPAw
(g C
m–2
y–1)
Age
Age
b
a

size of the grid cells more nearly matches the size of the validation plots. For GPP and NEP, validation measurementscan be derived from NEP measurements at the scale of aflux tower footprint (usually < 1 km2). For these measure-ments, as for NPP, validation can be accomplished by first using fine-scale remote sensing and modeling rather than direct comparison to MODIS GPP, which tends to be com-promised by uncertainty about footprint location and bydata gaps in the tower data. The high-quality meteorologicalobservations at the tower can be used as model drivers, andGPP estimates from tower data can be used for validation ofmodeled GPP (Turner et al. 2003c).
The regional scaling of NPP or NEP based on remotesensing and process models will also eventually provide val-idation of land surface flux estimates derived from inversemodeling (e.g., Ciais et al. 2000). The inversion approachcurrently relies on flask samples, which significantly con-strains the spatial resolution of the output (i.e., continentalscale). However, new satellite-borne sensors under develop-ment will have the capability to measure total column and ver-tical profile abundance of CO2 and thus to monitor spatial andtemporal patterns in CO2 concentration much more com-prehensively (Engelen et al. 2001). The associated carbonflux estimates derived from inverse modeling, therefore, willhave higher spatial and temporal resolution and will beamenable to validation with regional flux estimates generatedfrom satellite data and process models.
Meeting the commitments of the United Nations FrameworkConvention on Climate Change. The UN framework con-vention, adopted internationally in 1994, calls for partici-pating countries to deliver periodic inventories of greenhousegas emissions, including the sources and sinks of CO2 asso-ciated with land use. The simplest approach to estimating carbon flux is a change-in-stocks approach that relies oncomprehensive inventories of vegetation biomass. Differ-ences in total carbon storage at two points in time are dividedby the relevant interval to obtain an annual flux estimate averaged over the interval. In forested regions at mid latitudes,this approach usually amounts to repeated surveys of a net-work of permanent plots maintained by federal agencies forthe purposes of natural resource inventories (Birdsey et al.1993). There are limitations to the inventory approach, in thatrelatively long intervals are required to resurvey all plots,sampling intensity may be low, and the results tend to revealonly a net effect (i.e., relatively little about the mechanisms accounting for the changes).
An integrated remote sensing and modeling approach canalso produce an estimate of annual changes in carbon stocks.Such an approach has the benefit of being spatially and tem-porally explicit and of quantifying the full suite of carbon poolsand fluxes, including changes associated with harvesting(Chen et al. 2003, Turner et al. 2004). The change-in-stocksand remote sensing and modeling approaches to estimatingfluxes at a national level require quite different research in-frastructures, but they are ultimately complementary. Both are
likely to play a role in the emerging US Carbon Cycle ScienceProgram (within the US Global Change Research Program),whose primary objectives include producing carbon flux estimates relevant to the evolution of policy regarding globalclimate change.
ConclusionsEcosystem process models have become important tools forscaling NPP and NEP over landscape to regional domains.Their power is largely derived from their ability to distill a widearray of diverse data into useful information and to force con-sistency among numerous discrete observational data sets.Satellite remote sensing is providing an increasing variety ofspatial data layers that are potentially usable as model inputor for validation of model output. The integration of processmodels and remote sensing is particularly effective for mon-itoring at landscape to regional scales, because at fine spatialand temporal resolutions it can resolve the major near-termcontrols on carbon fluxes, including land use, foliar bio-physical characteristics, topography, and climatic gradients.Research challenges in this field include optimizing spatial andtemporal resolution for specific applications, differentiatingthe relative influences of structural and chemical variables onecosystem carbon fluxes, and systematically validating model-based flux estimates.
AcknowledgmentsSupport for this work was provided by the National Aero-nautics and Space Administration (NASA) Terrestrial Ecol-ogy Program, the NASA Carbon Cycle Science Program(grant no. CARBON-0000-1234), the National Institute forGlobal Environmental Change (grant no. UNH901214-02),and the US Environmental Protection Agency’s STAR (Sci-ence to Achieve Results) program (grant no. R-82830901-0).
References citedAber JD, Ollinger SV, Federer CA, Reich PB, Goulden ML, Kicklighter DW,
Melillo JM, Lathrop RG Jr. 1995. Predicting the effects of climate changeon water yield and forest production in the northeastern United States.Climate Research 5: 207–222.
Aber JD, Ollinger SV, Driscoll CT. 1997. Modeling nitrogen saturation in for-est ecosystems in response to land use and atmospheric deposition.Ecological Modelling 101: 61–78.
Birdsey RA, Plantinga AJ, Heath LS. 1993. Past and prospective changes inU.S. forest ecosystems. Forest Ecology and Management 58: 33–40.
Chen JM, Weimin J, Cihlar J, Price D, Liu J, Chen W, Pan J, Black A, Barr A.2003. Spatial distribution of carbon sources and sinks in Canada’s forests.Tellus 55B: 622–641.
Ciais P, Peylin P, Bosquet P. 2000. Regional biospheric carbon fluxes as in-ferred from atmospheric CO2 measurements. Ecological Applications 10:1574–1589.
Cohen WB, Goward SN. 2004. Landsat’s role in ecological applications of re-mote sensing. BioScience 54: 535–545.
Cohen WB, Spies TA, Fiorella M. 1995. Estimating the age and structure offorests in a multi-ownership landscape of western Oregon, U.S.A. In-ternational Journal of Remote Sensing 16: 72–746.
Cohen WB, Harmon ME, Wallin DO, Fiorella M. 1996. Two decades of car-bon flux from forests of the Pacific Northwest. BioScience 46: 836–844.
Cohen WB, Spies TA, Alig RJ, Oetter DR, Maiersperger TK, Fiorella M.2002. Characterizing 23 years (1972–1995) of stand replacement
582 BioScience • June 2004 / Vol. 54 No. 6
Articles

disturbance in western Oregon forests with Landsat imagery. Ecosystems5: 122–137.
Dobson MC, Ulaby FT, LeToan T, Beaudoin A, Kasischke ES, Christensen N.1992. Dependence of radar backscatter on coniferous forest biomass. IEEETransactions on Geoscience and Remote Sensing 30: 412–415.
Dong J, Kaufmann RK, Myneni RB, Tucker CJ, Kauppi PE, Liski J, BuermannW,Alexeyev V, Hughes MK. 2003. Remote sensing estimates of boreal andtemperate forest woody biomass: Carbon pools, sources, and sinks. Re-mote Sensing of Environment 84: 393–410.
Engelen RJ, Denning AS, Gurney KR, Stephens GL. 2001. Global observa-tions of the carbon budget, pt. 1: Expected satellite capabilities for emis-sion spectroscopy in the EOS and NPOESS eras. Journal of GeophysicalResearch 106: 20055–20068.
Frolking S, McDonald K, Kimball J, Zimmermann R, Way JB, Running SW.1999. Using the space-borne NASA Scatterometer (NSCAT) to determinethe frozen and thawed seasons of a boreal landscape. Journal of Geo-physical Research 104: 27895–27907.
Garman SL, Swanson FJ, Spies TA. 1999. Past, present, and future land-scape patterns in the Douglas-fir region of the Pacific Northwest. Pages61–86 in Rochelle JA, Lehmann LA, Wisniewski J, eds. Forest Fragmen-tation: Wildlife and Management Implications. Boston: Brill.
Gower ST, McMurtrie RE, Murty D. 1996. Aboveground net primary pro-duction decline with stand age: Potential causes. Trends in Ecology andEvolution 11: 378–382.
Gower ST, Kucharik CJ, Norman JM. 1999. Direct and indirect estimationof leaf area index, fAPAR, and net primary production of terrestrial ecosys-tems. Remote Sensing of Environment 70: 29–51.
Grant RF, Oechel WC, Ping C. 2003. Modelling carbon balances of coastalarctic tundra under changing climate. Global Change Biology 9: 16–36.
Green DS, Erickson JE, Kruger EL. 2003. Foliar morphology and canopy ni-trogen as predictors of light-use efficiency in terrestrial vegetation. Agri-cultural and Forest Meteorology 115: 163–171.
Hall FG, Botkin DB, Strebel DE, Woods KD, Goetz SJ. 1991. Large-scale pat-terns of forest succession as determined by remote sensing. Ecology 72:628–640.
Haxeltine A, Prentice IC. 1996. A general model for the light-use efficiencyof primary production. Functional Ecology 10: 551–561.
Hubbard RM, Bond BJ, Ryan MG. 1999. Evidence that hydraulic conductancelimits photosynthesis in old Pinus ponderosa trees. Tree Physiology 19:165–172.
Janisch JE, Harmon ME. 2002. Successional changes in live and dead woodcarbon stores: Implications for net ecosystem productivity. Tree Physi-ology 22: 77–89.
Jenkins JC, Birdsey RA, Pan Y. 2001. Biomass and NPP estimation for the mid-Atlantic region (USA) using plot-level forest inventory data. EcologicalApplications 11: 1174–1193.
Kasischke ES, Melack JM, Dobson MC. 1997. The use of imaging radars forecological applications—a review. Remote Sensing of Environment 59:141–156.
Kimball JS, Running SW, Saatchi SS. 1999. Sensitivity of boreal forest regionalwater flux and net primary production simulations to sub-grid scale land-cover complexity. Journal of Geophysical Research 104: 27789–27801.
Kimball JS, Keyser AR, Running SW, Saatchi SS. 2000. Regional assessmentof boreal forest productivity using an ecological process model and re-mote sensing parameter maps. Tree Physiology 20: 761–775.
Kimball JS, McDonald KC, Frolking S, Running SW. Radar remote sensingof the spring thaw transition across a boreal landscape. Remote Sensingof Environment. Forthcoming.
Law BE, Turner DP, Lefsky M, Campbell J, Guzy M, Sun O, Van Tuyl S,Cohen WB. Carbon fluxes across regions: Observational constraints atmultiple scales. In Wu J, Jones B, Li H, Loucks O, eds. Scaling and Un-certainty Analysis in Ecology. New York: Columbia University Press.Forthcoming.
Lefsky MA, Cohen WB. 2003. Selection of remotely sensed data. Pages 13–46in Wulder MA, Franklin SE, eds. Remote Sensing of Forest Environments:Concepts and Case Studies. Boston: Kluwer Academic.
Lefsky MA, Cohen WB, Acker SA, Parker GG, Spies TA, Harding D. 1999.Lidar remote sensing of the canopy structure and biophysical propertiesof Douglas-fir western hemlock forests. Remote Sensing of Environment70: 339–361.
Lefsky MA, Cohen WB, Parker GG, Harding DJ. 2002. Lidar remote sensingfor ecosystem studies. BioScience 52: 19–30.
Liu J, Chen JM, Cihlar J, Chen W. 1999. Net primary productivity distribu-tion in the BOREAS region from a process model using satellite and sur-face data. Journal of Geophysical Research 104: 27735–27754.
Luckman A, Baker J, Honzak M, Lucas R. 1998. Tropical forest biomassdensity estimation using JERS-1 SAR: Seasonal variation, confidence lim-its and application to image mosaics. Remote Sensing of Environment63: 126–139.
Moody A, Woodcock CE. 1995. The influence of scale and the spatial char-acteristics of landscapes on land-cover mapping using remote sensing.Landscape Ecology 10: 363–379.
Moran EF, Brondizio E, Mausel P, Wu Y. 1994. Integrating Amazonian veg-etation, land-use, and satellite data. BioScience 44: 329–338.
Ollinger SV, Aber JD, Federer CA. 1998. Estimating regional forest produc-tivity and water balances using an ecosystem model linked to a GIS. Land-scape Ecology 13: 323–34.
Raich JW, Rastetter EB, Mellilo JM, Kicklighter PA, Steudler PA, Peterson BJ,Grace AL, Moore BI, Vorosmarty CJ. 1991. Potential net primary pro-ductivity in South America: Application of a global model. Ecological Ap-plications 1: 399–429.
Reich PB, Walters MB, Ellsworth DS. 1997. From tropics to tundra: Globalconvergence in plant functioning. Proceedings of the National Academyof Sciences 94: 13730–13734.
Running SW, Nemani RR, Heinsch FA, Zhao M, Reeves M, Hashimoto H.2004.A continuous satellite-derived measure of global terrestrial primaryproduction. BioScience 54: 547–560.
Saatchi SS, Moghaddam M. 2000. Estimation of crown and stem water con-tent and biomass of boreal forests using polarimetric SAR imagery.IEEE Transactions on Geoscience and Remote Sensing 38: 697–709.
Sellers PJ, et al. 1997. BOREAS in 1997: Experiment overview, scientific re-sults, and future directions. Journal of Geophysical Research 102:28731–28769.
Smith ML, Ollinger SV, Martin ME, Aber JD, Hallett RA, Goodale CL. 2002.Direct estimation of aboveground forest productivity through hyper-spectral remote sensing of canopy nitrogen. Ecological Applications 12:1286–1302.
Steyaert LT, Hall FG, Loveland TR. 1997. Land cover mapping, fire regener-ation, and scaling studies in the Canadian boreal forest with 1 kmAVHRR and Landsat TM data. Journal of Geophysical Research 102:29581–29598.
Thornton PE, et al. 2002. Modeling and measuring the effects of disturbancehistory and climate on carbon and water budgets in evergreen needle-leaf forests. Agricultural and Forest Meteorology 113: 185–222.
Treuhaft RN,Asner GP, Law BE,Van Tuyl S. 2002. Forest leaf area density pro-files from the quantitative fusion of radar and hyperspectral data. Jour-nal of Geophysical Research 107: 4568–4580.
Treuhaft RN, Law BE, Asner GP. 2004. Forest attributes from radar inter-ferometric structure and its fusion with optical remote sensing. BioScience54: 561–571.
Turner DP, Koerper GJ, Harmon ME, Lee JJ. 1995.A carbon budget for forestsof the conterminous United States. Ecological Applications 5: 421–436.
Turner DP, Cohen WB, Kennedy RE, Fassnacht KS, Briggs JM. 1999. Rela-tionships between leaf area index and TM spectral vegetation indicesacross three temperate zone sites. Remote Sensing of Environment 70:52–68.
Turner DP, Cohen WB, Kennedy RE. 2000.Alternative spatial resolutions andestimation of carbon flux over a managed forest landscape in western Ore-gon. Landscape Ecology 15: 441–452.
Turner DP, Guzy M, Lefsky MA, Van Tuyl S, Sun O, Daly C, Law BE. 2003a.Effects of land use and fine-scale environmental heterogeneity on netecosystem production over a temperate coniferous forest landscape.Tellus 55B: 657–668.
June 2004 / Vol. 54 No. 6 • BioScience 583
Articles

Turner DP, Urbanski S, Bremer D, Wofsy SC, Meyers T, Gower ST, GregoryM. 2003b. A cross-biome comparison of light use efficiency for gross pri-mary production. Global Change Biology 9: 383–395.
Turner DP, Ritts WD, Cohen WB, Gower ST, Zhao M, Running SW, WofsySC, Urbanski S, Dunn A, Munger JW. 2003c. Scaling gross primary pro-duction (GPP) over boreal and deciduous forest landscapes in supportof MODIS GPP product validation. Remote Sensing of Environment 88:256–270.
Turner DP, Guzy M, Lefsky M, Ritts W, VanTuyl S, Law BE. 2004. Monitor-ing forest carbon sequestration with remote sensing and carbon cyclemodeling. Environmental Management 25: 1961–1979.
Ustin SL, Roberts DA, Gamon JA, Asner GP, Green RO. 2004. Using imag-ing spectroscopy to study ecosystem processes and properties. Bio-Science 54: 523–534.
Williams M, Rastetter EB, Fernandes DN, Goulden ML, Shaver GR, John-
son LC. 1997. Predicting gross primary productivity in terrestrial ecosys-
tems. Ecological Applications 7: 882–894.
Williams M, Bond BJ, Ryan MG. 2001. Evaluating different soil and plant hy-
draulic constraints on tree function using a model and sap flow data from
ponderosa pine. Plant, Cell and Environment 24: 679–690.
Wilson KB, Baldocchi DD, Hanson PJ. 2001. Leaf age affects the seasonal
pattern of photosynthetic capacity and net ecosystem exchange of
carbon in a deciduous forest. Plant, Cell and Environment 24: 571–583.
Zhang X, Friedl MA, Schaaf CB, Strahler AH, Hodges JCF, Gao F, Reed BC,
Huete A. 2003. Monitoring vegetation phenology using MODIS. Remote
Sensing of Environment 84: 471–475.
584 BioScience • June 2004 / Vol. 54 No. 6
Articles


![[REMOTE SENSING] 3-PM Remote Sensing](https://img.pdfslide.us/doc/110x75/61f2bbb282fa78206228d9e2/remote-sensing-3-pm-remote-sensing.jpg)