Embed Size (px)
Citation preview

Vol. 7(8), pp. 172-184, July, 2013
DOI: 10.5897/JGMR2013.0186
ISSN 2006 – 9766 © 2013 Academic Journals
http://www.academicjournals.org/JGMR
Journal of Geology and Mining
Research
Review
Processing and interpretation of 2d land seismic reflection survey over bishop wood Yorkshire, England
Maunde A.*, Nur A., Raji A. S. and Dio C. J.
Department of Geology, School of Pure and Applied Sciences, Modibbo Adama University of Technology, Yola, P.M.B. 2076, Yola, Nigeria.
Accepted 23 July 2013
A seismic reflection survey was carried out in Bishop Wood, Yorkshire to determine the subsurface structure and the depth to the prospective gypsum and coal measures. Four 24-channel Geodes were used with a PEG40 accelerated weight drop and 10 Hz geophones at 3 m intervals to shot a 1099 m spread. The final depth processed section shows some reflectors which are clearly visible and is geologically consistent with borehole information in the area. A strong reflector was found at 25 to 50 m depth, multiple reflections were seen between 70 and 150 m and a strong reflector was seen at 200 to 250 m on the processed seismic section. These were tentatively interpreted as the top of Bunter sandstone, multiple gypsum horizons and the top of coal measures respectively, these observations agreed with the borehole information obtained in the area. A southwards dipping fault was inferred in the section at approximately 600 m along the line, though this may be an artefact due to acquisition and or processing of the data. Key words: Reflection, gypsum, coal, geophones, borehole and bishop wood.
INTRODUCTION Reflection seismology is the most widely used geophysical techniques and has been since the 1930’s (Gadallah and Fisher, 1999). Its predominant applications are hydrocarbon exploration and research into crustal structure, with depths of penetration of many kilometres now been achieved. The current state of the techniques is largely as a result of enormous investment in its development made by the hydrocarbon industry, coupled with the development of advanced electronic and computing technology. Part of the spectacular success of the method lies in the fact that the raw data are processed to produce seismic section which is an image of the subsurface structure, although this image is fundamentally different from a depth section, only by
understanding how the reflection method is used and seismic sections are created the geologist makes informed interpretation (Yilmaz, 2001). The final interpretation of the seismic data is only as good as the validity of the processed data. It is imperative that the interpreter be aware of all the problems encountered in the field data acquisition and the data processing stage (Gadallah and Fisher, 1999). The typical data processing procedures applied for this work are stated and to some degree have been tailored to meet the special requirement of this specific data. Therefore the reflection survey at the Bishop Wood was carried out with the aim to assess the depth to the economic targets of coal and gypsum layers and to investigate the structure of the
*Corresponding author. E-mail: [email protected], [email protected]. Tel: 08161358265,
08032406656, 08033193848, 08065442839.
Maunde et al. 173
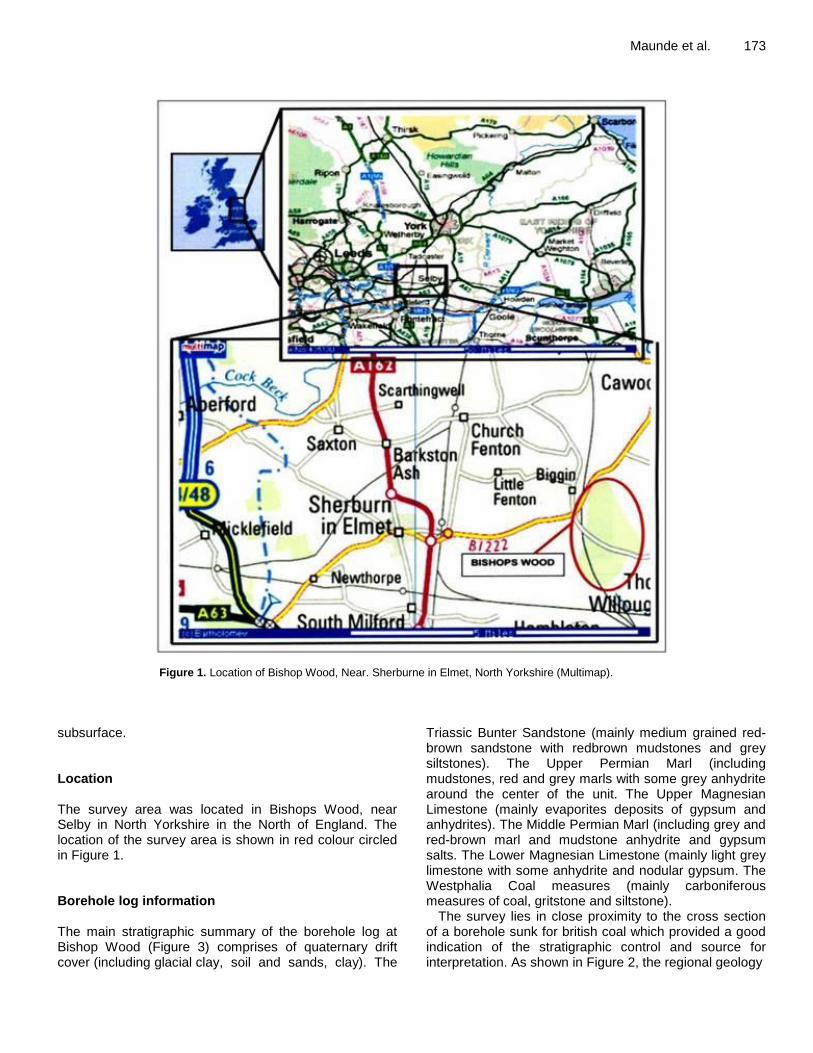
Figure 1. Location of Bishop Wood, Near. Sherburne in Elmet, North Yorkshire (Multimap).
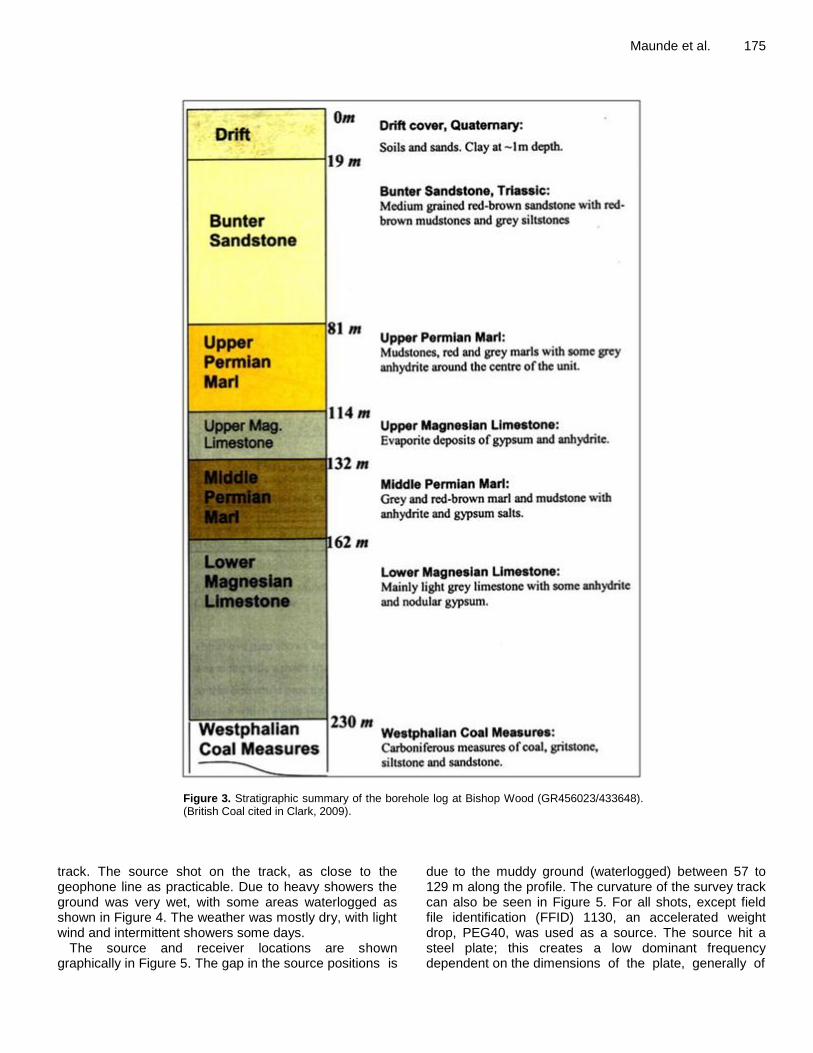
subsurface. Location The survey area was located in Bishops Wood, near Selby in North Yorkshire in the North of England. The location of the survey area is shown in red colour circled in Figure 1. Borehole log information The main stratigraphic summary of the borehole log at Bishop Wood (Figure 3) comprises of quaternary drift cover (including glacial clay, soil and sands, clay). The
Triassic Bunter Sandstone (mainly medium grained red-brown sandstone with redbrown mudstones and grey siltstones). The Upper Permian Marl (including mudstones, red and grey marls with some grey anhydrite around the center of the unit. The Upper Magnesian Limestone (mainly evaporites deposits of gypsum and anhydrites). The Middle Permian Marl (including grey and red-brown marl and mudstone anhydrite and gypsum salts. The Lower Magnesian Limestone (mainly light grey limestone with some anhydrite and nodular gypsum. The Westphalia Coal measures (mainly carboniferous measures of coal, gritstone and siltstone).
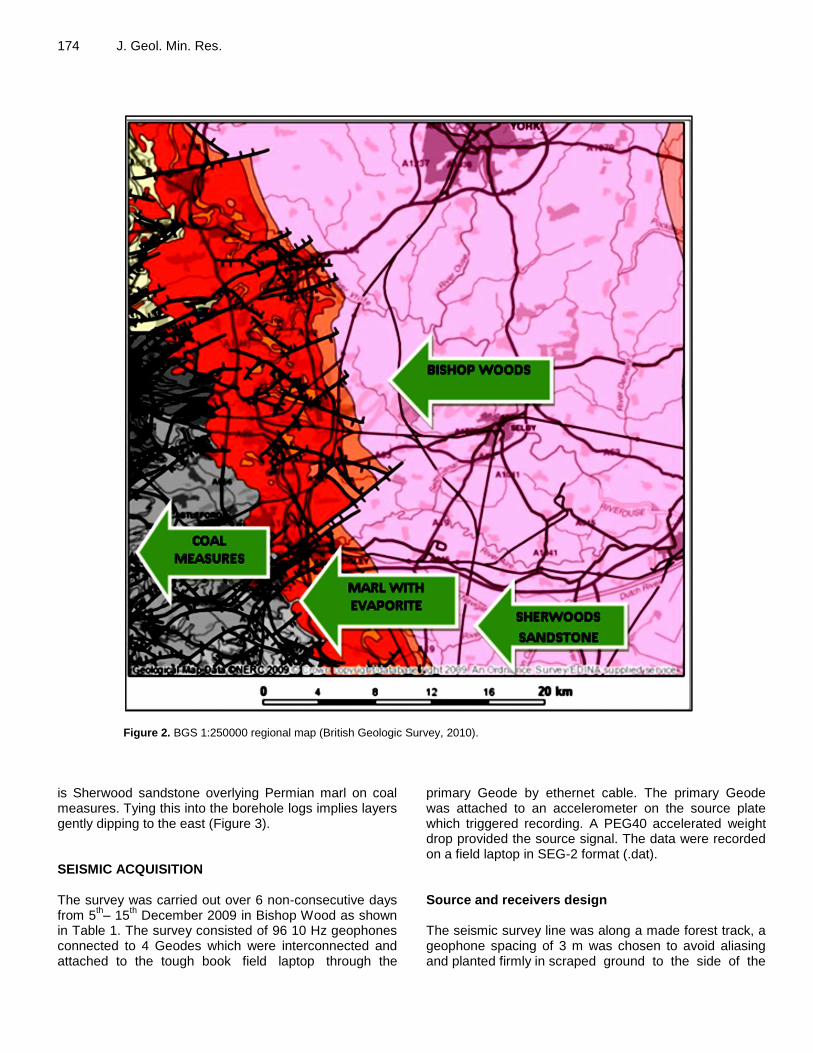
The survey lies in close proximity to the cross section of a borehole sunk for british coal which provided a good indication of the stratigraphic control and source for interpretation. As shown in Figure 2, the regional geology
174 J. Geol. Min. Res.
Figure 2. BGS 1:250000 regional map (British Geologic Survey, 2010).
is Sherwood sandstone overlying Permian marl on coal measures. Tying this into the borehole logs implies layers gently dipping to the east (Figure 3). SEISMIC ACQUISITION The survey was carried out over 6 non-consecutive days from 5
th– 15
th December 2009 in Bishop Wood as shown
in Table 1. The survey consisted of 96 10 Hz geophones connected to 4 Geodes which were interconnected and attached to the tough book field laptop through the
primary Geode by ethernet cable. The primary Geode was attached to an accelerometer on the source plate which triggered recording. A PEG40 accelerated weight drop provided the source signal. The data were recorded on a field laptop in SEG-2 format (.dat). Source and receivers design The seismic survey line was along a made forest track, a geophone spacing of 3 m was chosen to avoid aliasing and planted firmly in scraped ground to the side of the
Maunde et al. 175
Figure 3. Stratigraphic summary of the borehole log at Bishop Wood (GR456023/433648). (British Coal cited in Clark, 2009).
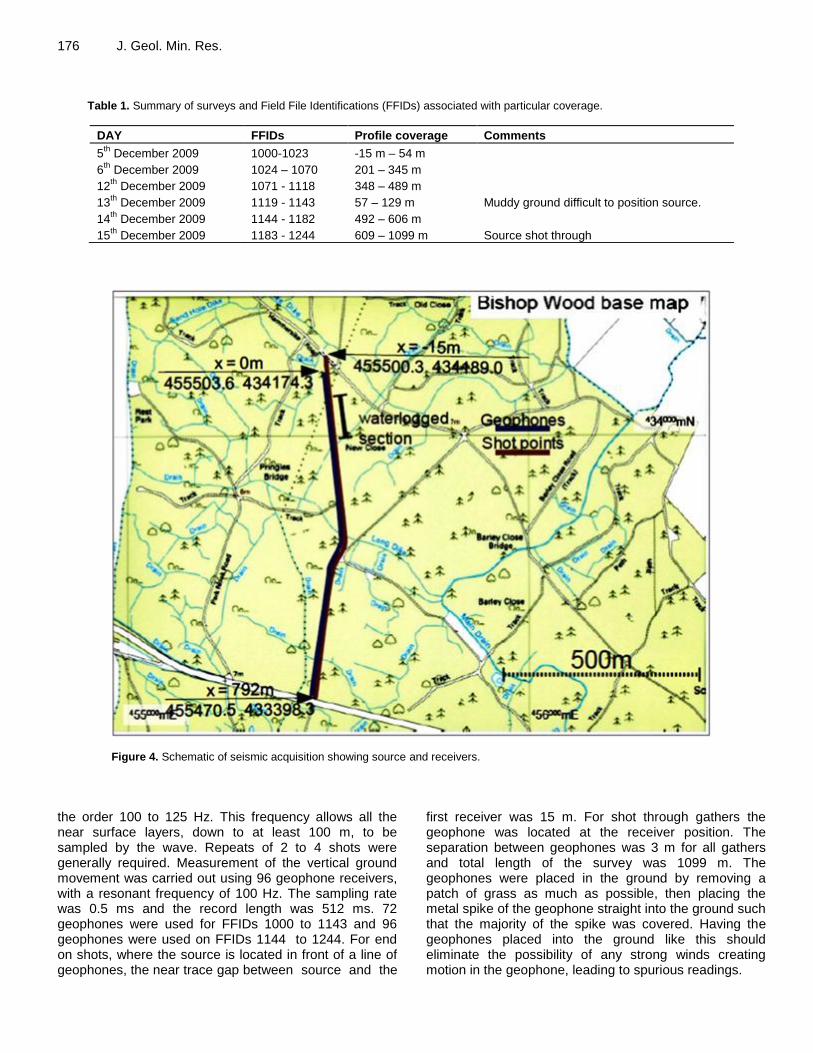
track. The source shot on the track, as close to the geophone line as practicable. Due to heavy showers the ground was very wet, with some areas waterlogged as shown in Figure 4. The weather was mostly dry, with light wind and intermittent showers some days.
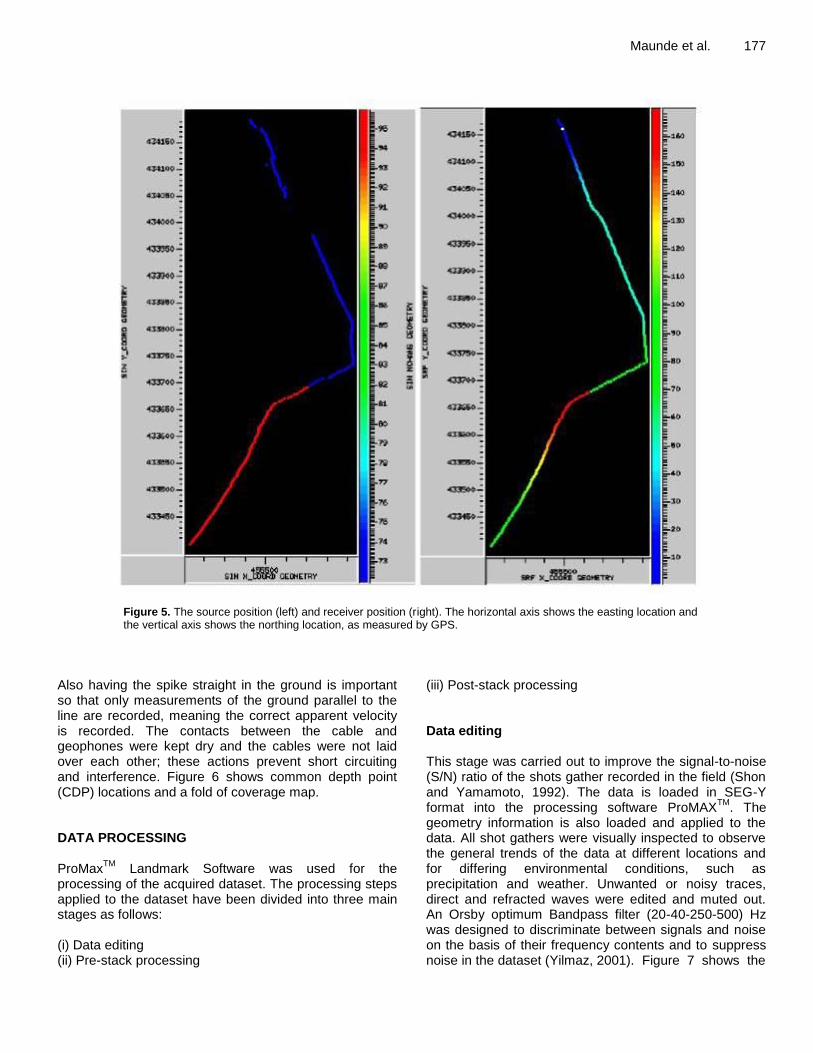
The source and receiver locations are shown graphically in Figure 5. The gap in the source positions is
due to the muddy ground (waterlogged) between 57 to 129 m along the profile. The curvature of the survey track can also be seen in Figure 5. For all shots, except field file identification (FFID) 1130, an accelerated weight drop, PEG40, was used as a source. The source hit a steel plate; this creates a low dominant frequency dependent on the dimensions of the plate, generally of
176 J. Geol. Min. Res.
Table 1. Summary of surveys and Field File Identifications (FFIDs) associated with particular coverage.
DAY FFIDs Profile coverage Comments
5th
December 2009 1000-1023 -15 m – 54 m
6th
December 2009 1024 – 1070 201 – 345 m
12th
December 2009 1071 - 1118 348 – 489 m
13th
December 2009 1119 - 1143 57 – 129 m Muddy ground difficult to position source.
14th
December 2009 1144 - 1182 492 – 606 m
15th
December 2009 1183 - 1244 609 – 1099 m Source shot through
Figure 4. Schematic of seismic acquisition showing source and receivers.
the order 100 to 125 Hz. This frequency allows all the near surface layers, down to at least 100 m, to be sampled by the wave. Repeats of 2 to 4 shots were generally required. Measurement of the vertical ground movement was carried out using 96 geophone receivers, with a resonant frequency of 100 Hz. The sampling rate was 0.5 ms and the record length was 512 ms. 72 geophones were used for FFIDs 1000 to 1143 and 96 geophones were used on FFIDs 1144 to 1244. For end on shots, where the source is located in front of a line of geophones, the near trace gap between source and the
first receiver was 15 m. For shot through gathers the geophone was located at the receiver position. The separation between geophones was 3 m for all gathers and total length of the survey was 1099 m. The geophones were placed in the ground by removing a patch of grass as much as possible, then placing the metal spike of the geophone straight into the ground such that the majority of the spike was covered. Having the geophones placed into the ground like this should eliminate the possibility of any strong winds creating motion in the geophone, leading to spurious readings.
Maunde et al. 177
Figure 5. The source position (left) and receiver position (right). The horizontal axis shows the easting location and the vertical axis shows the northing location, as measured by GPS.
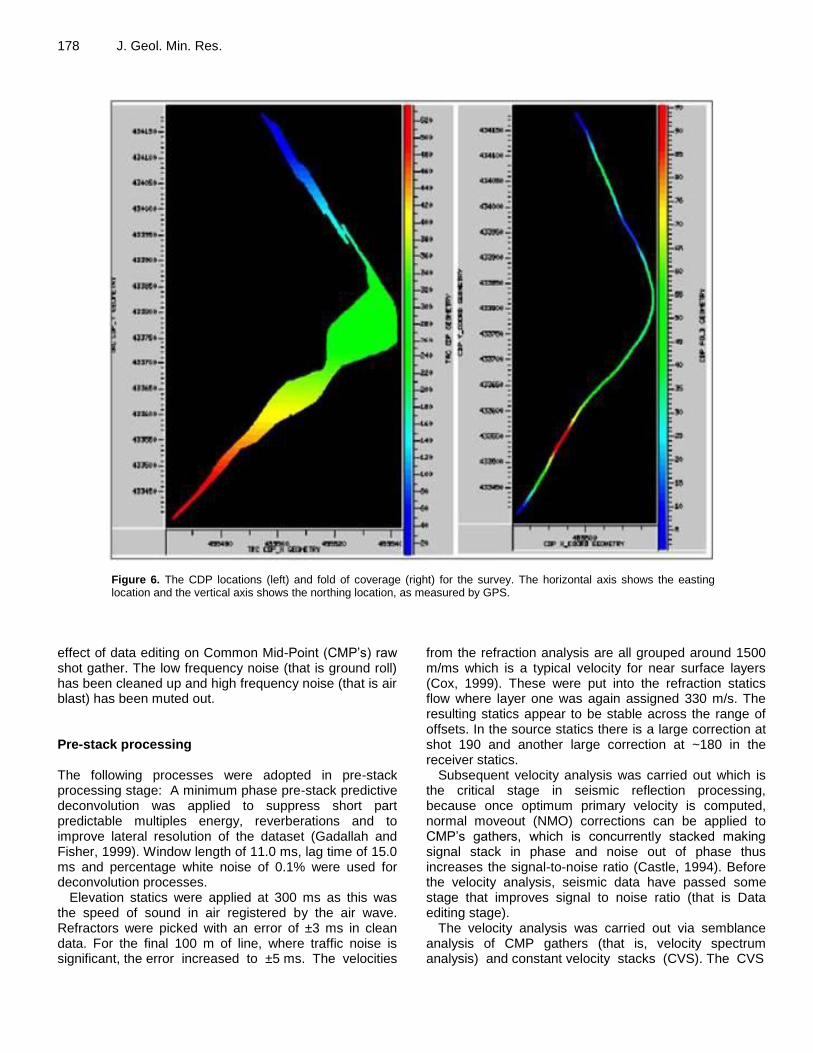
Also having the spike straight in the ground is important so that only measurements of the ground parallel to the line are recorded, meaning the correct apparent velocity is recorded. The contacts between the cable and geophones were kept dry and the cables were not laid over each other; these actions prevent short circuiting and interference. Figure 6 shows common depth point (CDP) locations and a fold of coverage map. DATA PROCESSING ProMax
TM Landmark Software was used for the
processing of the acquired dataset. The processing steps applied to the dataset have been divided into three main stages as follows: (i) Data editing (ii) Pre-stack processing
(iii) Post-stack processing Data editing This stage was carried out to improve the signal-to-noise (S/N) ratio of the shots gather recorded in the field (Shon and Yamamoto, 1992). The data is loaded in SEG-Y format into the processing software ProMAX
TM. The
geometry information is also loaded and applied to the data. All shot gathers were visually inspected to observe the general trends of the data at different locations and for differing environmental conditions, such as precipitation and weather. Unwanted or noisy traces, direct and refracted waves were edited and muted out. An Orsby optimum Bandpass filter (20-40-250-500) Hz was designed to discriminate between signals and noise on the basis of their frequency contents and to suppress noise in the dataset (Yilmaz, 2001). Figure 7 shows the
178 J. Geol. Min. Res.
Figure 6. The CDP locations (left) and fold of coverage (right) for the survey. The horizontal axis shows the easting location and the vertical axis shows the northing location, as measured by GPS.
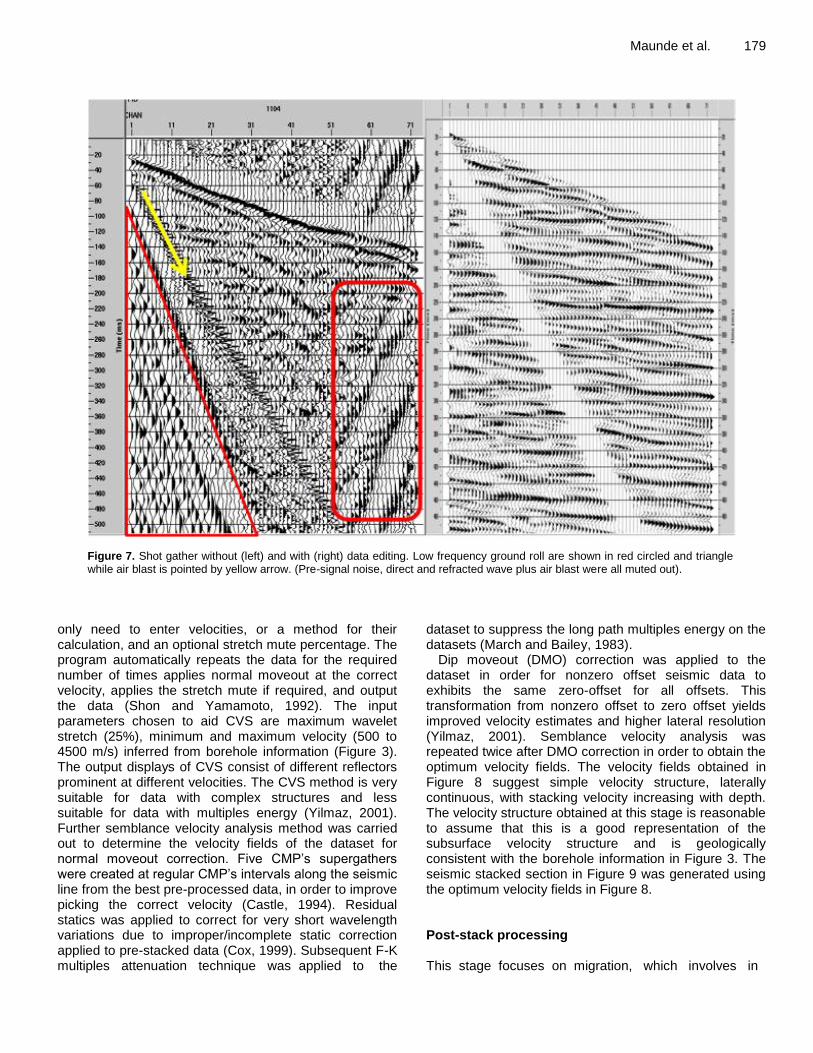
effect of data editing on Common Mid-Point (CMP’s) raw shot gather. The low frequency noise (that is ground roll) has been cleaned up and high frequency noise (that is air blast) has been muted out. Pre-stack processing The following processes were adopted in pre-stack processing stage: A minimum phase pre-stack predictive deconvolution was applied to suppress short part predictable multiples energy, reverberations and to improve lateral resolution of the dataset (Gadallah and Fisher, 1999). Window length of 11.0 ms, lag time of 15.0 ms and percentage white noise of 0.1% were used for deconvolution processes.
Elevation statics were applied at 300 ms as this was the speed of sound in air registered by the air wave. Refractors were picked with an error of ±3 ms in clean data. For the final 100 m of line, where traffic noise is significant, the error increased to ±5 ms. The velocities
from the refraction analysis are all grouped around 1500 m/ms which is a typical velocity for near surface layers (Cox, 1999). These were put into the refraction statics flow where layer one was again assigned 330 m/s. The resulting statics appear to be stable across the range of offsets. In the source statics there is a large correction at shot 190 and another large correction at ~180 in the receiver statics.
Subsequent velocity analysis was carried out which is the critical stage in seismic reflection processing, because once optimum primary velocity is computed, normal moveout (NMO) corrections can be applied to CMP’s gathers, which is concurrently stacked making signal stack in phase and noise out of phase thus increases the signal-to-noise ratio (Castle, 1994). Before the velocity analysis, seismic data have passed some stage that improves signal to noise ratio (that is Data editing stage).
The velocity analysis was carried out via semblance analysis of CMP gathers (that is, velocity spectrum analysis) and constant velocity stacks (CVS). The CVS
Maunde et al. 179
Figure 7. Shot gather without (left) and with (right) data editing. Low frequency ground roll are shown in red circled and triangle while air blast is pointed by yellow arrow. (Pre-signal noise, direct and refracted wave plus air blast were all muted out).
only need to enter velocities, or a method for their calculation, and an optional stretch mute percentage. The program automatically repeats the data for the required number of times applies normal moveout at the correct velocity, applies the stretch mute if required, and output the data (Shon and Yamamoto, 1992). The input parameters chosen to aid CVS are maximum wavelet stretch (25%), minimum and maximum velocity (500 to 4500 m/s) inferred from borehole information (Figure 3). The output displays of CVS consist of different reflectors prominent at different velocities. The CVS method is very suitable for data with complex structures and less suitable for data with multiples energy (Yilmaz, 2001). Further semblance velocity analysis method was carried out to determine the velocity fields of the dataset for normal moveout correction. Five CMP’s supergathers were created at regular CMP’s intervals along the seismic line from the best pre-processed data, in order to improve picking the correct velocity (Castle, 1994). Residual statics was applied to correct for very short wavelength variations due to improper/incomplete static correction applied to pre-stacked data (Cox, 1999). Subsequent F-K multiples attenuation technique was applied to the
dataset to suppress the long path multiples energy on the datasets (March and Bailey, 1983).
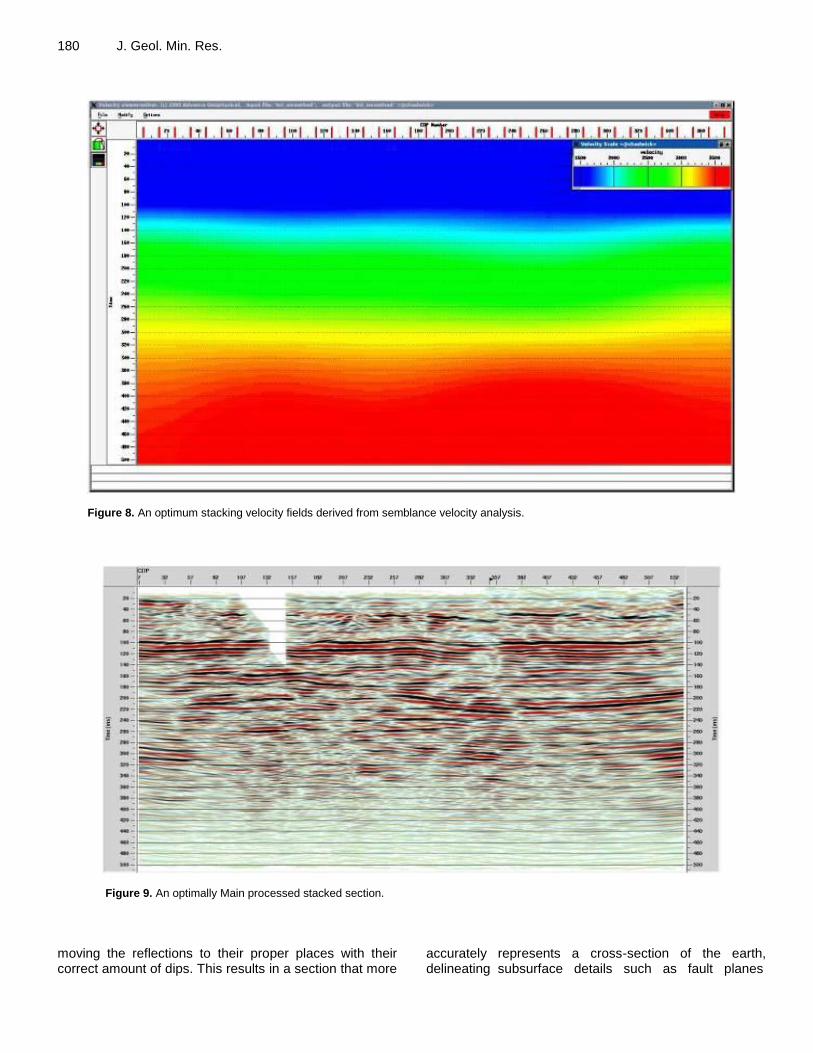
Dip moveout (DMO) correction was applied to the dataset in order for nonzero offset seismic data to exhibits the same zero-offset for all offsets. This transformation from nonzero offset to zero offset yields improved velocity estimates and higher lateral resolution (Yilmaz, 2001). Semblance velocity analysis was repeated twice after DMO correction in order to obtain the optimum velocity fields. The velocity fields obtained in Figure 8 suggest simple velocity structure, laterally continuous, with stacking velocity increasing with depth. The velocity structure obtained at this stage is reasonable to assume that this is a good representation of the subsurface velocity structure and is geologically consistent with the borehole information in Figure 3. The seismic stacked section in Figure 9 was generated using the optimum velocity fields in Figure 8. Post-stack processing This stage focuses on migration, which involves in
180 J. Geol. Min. Res.
Figure 8. An optimum stacking velocity fields derived from semblance velocity analysis.
Figure 9. An optimally Main processed stacked section.
moving the reflections to their proper places with their correct amount of dips. This results in a section that more
accurately represents a cross-section of the earth, delineating subsurface details such as fault planes
Maunde et al. 181
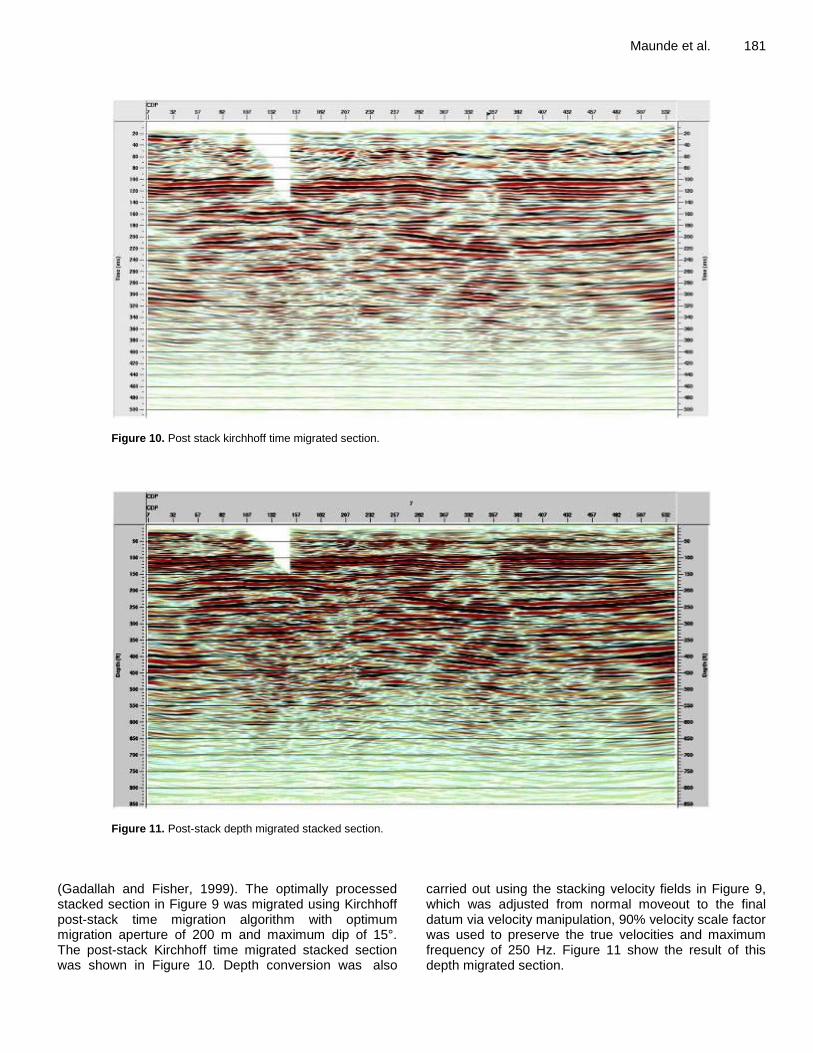
Figure 10. Post stack kirchhoff time migrated section.
Figure 11. Post-stack depth migrated stacked section.
(Gadallah and Fisher, 1999). The optimally processed stacked section in Figure 9 was migrated using Kirchhoff post-stack time migration algorithm with optimum migration aperture of 200 m and maximum dip of 15°. The post-stack Kirchhoff time migrated stacked section was shown in Figure 10. Depth conversion was also
carried out using the stacking velocity fields in Figure 9, which was adjusted from normal moveout to the final datum via velocity manipulation, 90% velocity scale factor was used to preserve the true velocities and maximum frequency of 250 Hz. Figure 11 show the result of this depth migrated section.
182 J. Geol. Min. Res.
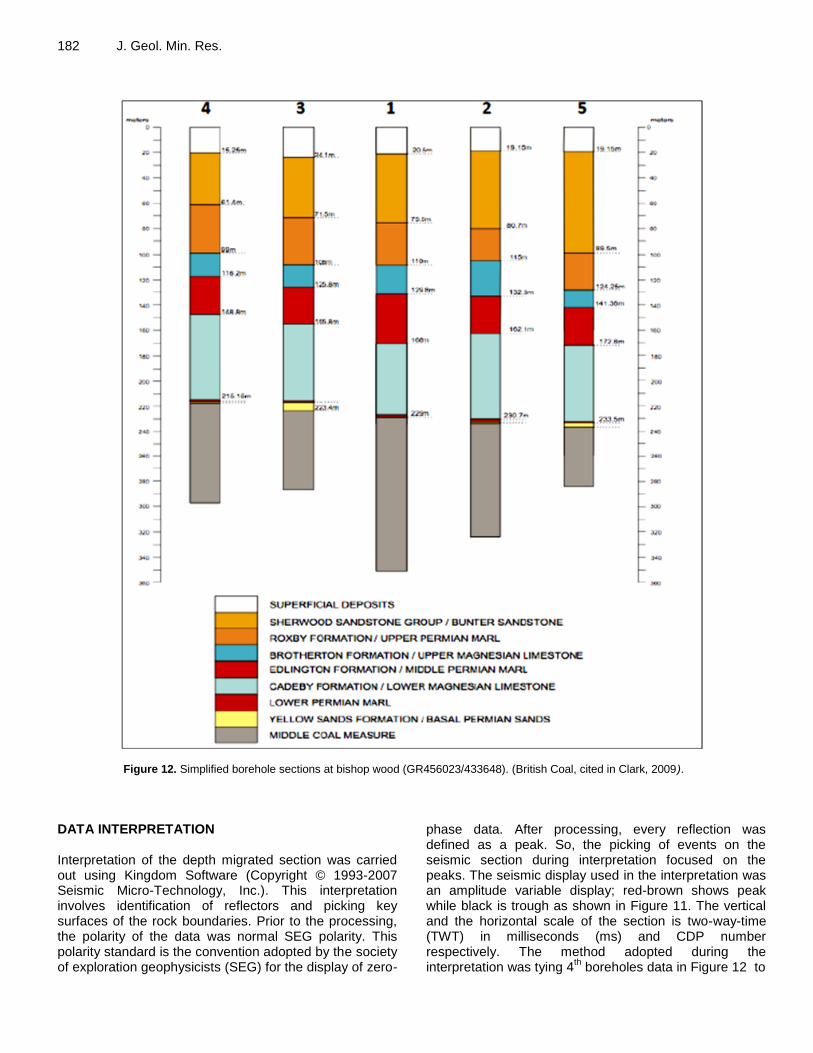
Figure 12. Simplified borehole sections at bishop wood (GR456023/433648). (British Coal, cited in Clark, 2009).
DATA INTERPRETATION Interpretation of the depth migrated section was carried out using Kingdom Software (Copyright © 1993-2007 Seismic Micro-Technology, Inc.). This interpretation involves identification of reflectors and picking key surfaces of the rock boundaries. Prior to the processing, the polarity of the data was normal SEG polarity. This polarity standard is the convention adopted by the society of exploration geophysicists (SEG) for the display of zero-
phase data. After processing, every reflection was defined as a peak. So, the picking of events on the seismic section during interpretation focused on the peaks. The seismic display used in the interpretation was an amplitude variable display; red-brown shows peak while black is trough as shown in Figure 11. The vertical and the horizontal scale of the section is two-way-time (TWT) in milliseconds (ms) and CDP number respectively. The method adopted during the interpretation was tying 4
th boreholes data in Figure 12 to
Maunde et al. 183
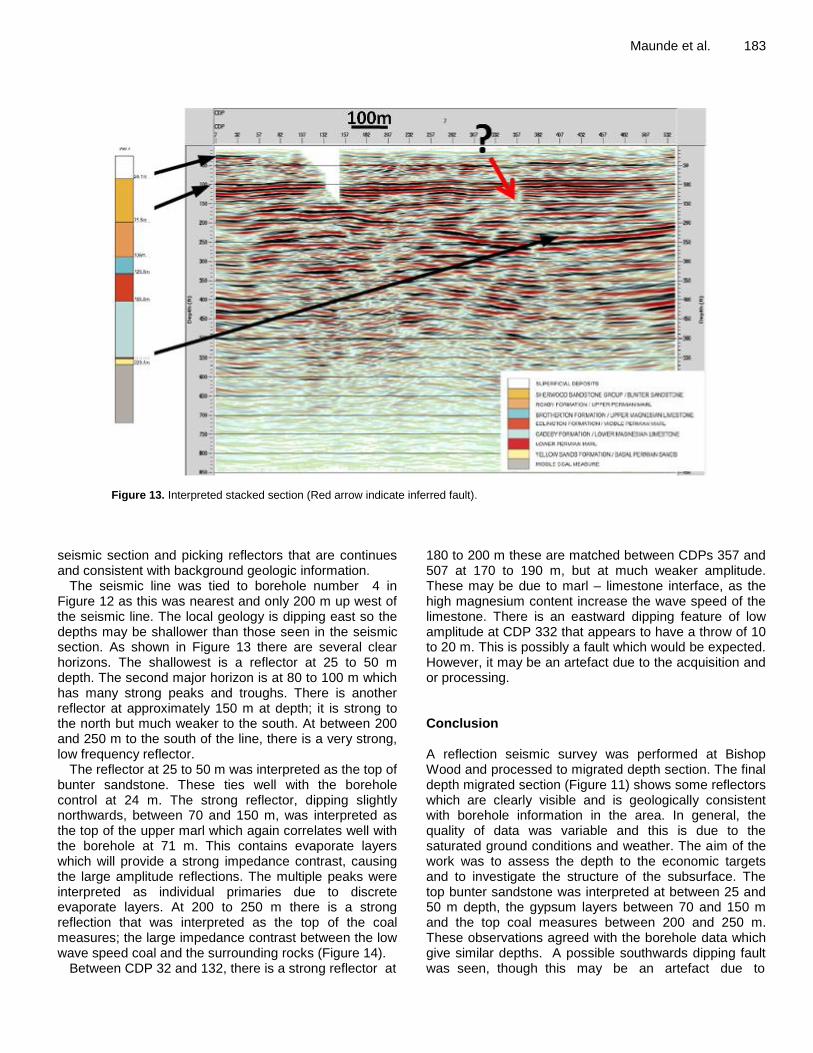
Figure 13. Interpreted stacked section (Red arrow indicate inferred fault).
seismic section and picking reflectors that are continues and consistent with background geologic information.
The seismic line was tied to borehole number 4 in Figure 12 as this was nearest and only 200 m up west of the seismic line. The local geology is dipping east so the depths may be shallower than those seen in the seismic section. As shown in Figure 13 there are several clear horizons. The shallowest is a reflector at 25 to 50 m depth. The second major horizon is at 80 to 100 m which has many strong peaks and troughs. There is another reflector at approximately 150 m at depth; it is strong to the north but much weaker to the south. At between 200 and 250 m to the south of the line, there is a very strong, low frequency reflector.
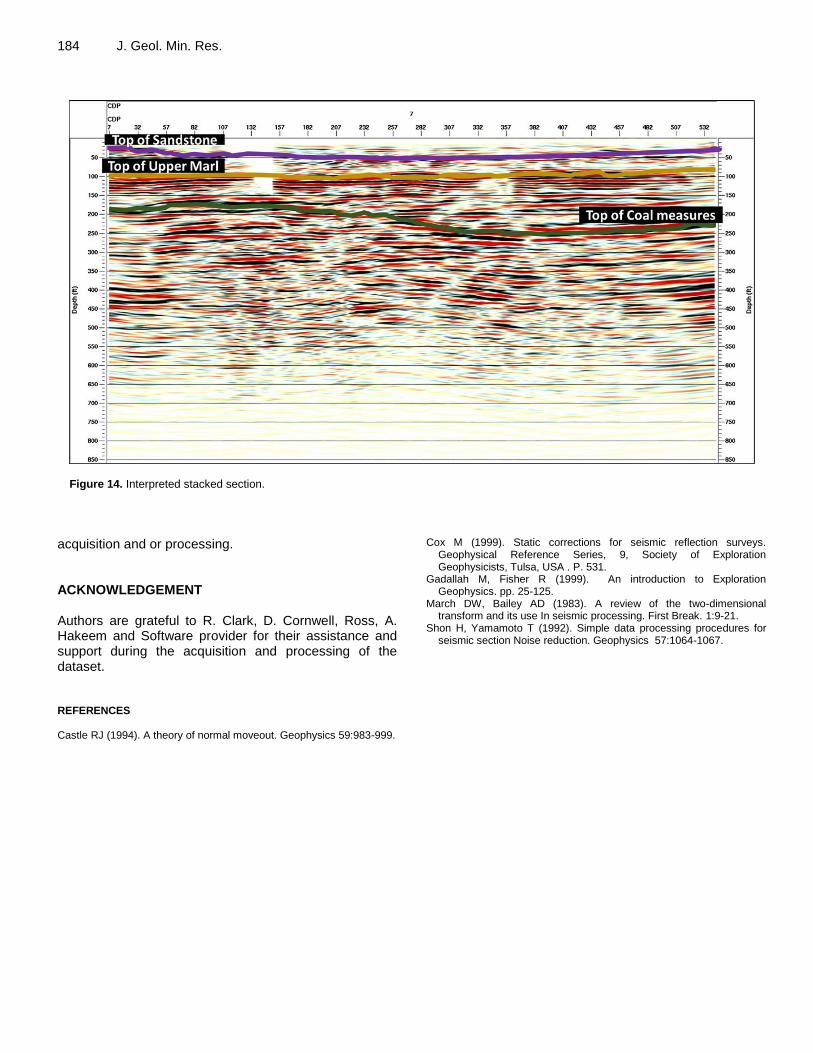
The reflector at 25 to 50 m was interpreted as the top of bunter sandstone. These ties well with the borehole control at 24 m. The strong reflector, dipping slightly northwards, between 70 and 150 m, was interpreted as the top of the upper marl which again correlates well with the borehole at 71 m. This contains evaporate layers which will provide a strong impedance contrast, causing the large amplitude reflections. The multiple peaks were interpreted as individual primaries due to discrete evaporate layers. At 200 to 250 m there is a strong reflection that was interpreted as the top of the coal measures; the large impedance contrast between the low wave speed coal and the surrounding rocks (Figure 14).
Between CDP 32 and 132, there is a strong reflector at
180 to 200 m these are matched between CDPs 357 and 507 at 170 to 190 m, but at much weaker amplitude. These may be due to marl – limestone interface, as the high magnesium content increase the wave speed of the limestone. There is an eastward dipping feature of low amplitude at CDP 332 that appears to have a throw of 10 to 20 m. This is possibly a fault which would be expected. However, it may be an artefact due to the acquisition and or processing. Conclusion A reflection seismic survey was performed at Bishop Wood and processed to migrated depth section. The final depth migrated section (Figure 11) shows some reflectors which are clearly visible and is geologically consistent with borehole information in the area. In general, the quality of data was variable and this is due to the saturated ground conditions and weather. The aim of the work was to assess the depth to the economic targets and to investigate the structure of the subsurface. The top bunter sandstone was interpreted at between 25 and 50 m depth, the gypsum layers between 70 and 150 m and the top coal measures between 200 and 250 m. These observations agreed with the borehole data which give similar depths. A possible southwards dipping fault was seen, though this may be an artefact due to
184 J. Geol. Min. Res.
Figure 14. Interpreted stacked section.
acquisition and or processing. ACKNOWLEDGEMENT Authors are grateful to R. Clark, D. Cornwell, Ross, A. Hakeem and Software provider for their assistance and support during the acquisition and processing of the dataset. REFERENCES Castle RJ (1994). A theory of normal moveout. Geophysics 59:983-999.
Cox M (1999). Static corrections for seismic reflection surveys. Geophysical Reference Series, 9, Society of Exploration Geophysicists, Tulsa, USA . P. 531.
Gadallah M, Fisher R (1999). An introduction to Exploration Geophysics. pp. 25-125.
March DW, Bailey AD (1983). A review of the two-dimensional transform and its use In seismic processing. First Break. 1:9-21.
Shon H, Yamamoto T (1992). Simple data processing procedures for seismic section Noise reduction. Geophysics 57:1064-1067.