Embed Size (px)
Citation preview
UNCORRECTEDPROOFClassi®cation of general audio data for content-based retrieval
Dongge Li a, Ishwar K. Sethi b,*, Nevenka Dimitrova c, Tom McGee c
a Department of Computer Science, Wayne State University, Detroit, MI 48202, USAb Intelligent Information Engineering Laboratory, Department of Computer Science and Engineering, Oakland University, Rochester, MI
48309-4478, USAc Image Processing and Network Architecture Department, Philips Research, 345 Scarborough Road, Briarcli� Manor, NY 10510, USA
Abstract
In this paper, we address the problem of classi®cation of continuous general audio data (GAD) for content-based
retrieval, and describe a scheme that is able to classify audio segments into seven categories consisting of silence, single
speaker speech, music, environmental noise, multiple speakers' speech, simultaneous speech and music, and speech and
noise. We studied a total of 143 classi®cation features for their discrimination capability. Our study shows that cepstral-
based features such as the Mel-frequency cepstral coe�cients (MFCC) and linear prediction coe�cients (LPC) provide
better classi®cation accuracy compared to temporal and spectral features. To minimize the classi®cation errors near the
boundaries of audio segments of di�erent type in general audio data, a segmentation±pooling scheme is also proposed
in this work. This scheme yields classi®cation results that are consistent with human perception. Our classi®cation
system provides over 90% accuracy at a processing speed dozens of times faster than the playing rate. Ó 2000 Elsevier
Science B.V. All rights reserved.
Keywords: Audio classi®cation; Audio segmentation; Content-based retrieval; Mel-frequency cepstral coe�cients; Pooling
1. Introduction
There are several groups engaged in researchand development of methods for automatic an-notation of images and videos for content-basedindexing and retrieval. The need for such methodsis increasingly becoming important as the desktopPC and the ubiquitous TV converge into a singleinfotainment appliance bringing an unprecedentedaccess to terabytes of video data via the Internet.Although most of the existing research in this areais image-based, there is a growing realization thatimage-based methods for content-based indexing
and retrieval of video need to be supplementedwith audio-based analysis. This has led to severale�orts related to the analysis of audio tracks invideos, particularly towards the classi®cation ofaudio segments into di�erent classes to representthe video content (Patel and Sethi, 1996, 1997;Saraceno and Leonardi, 1997; Liu et al., 1998).
The advances in automatic speech recognition(ASR) are also leading to an interest in classi®ca-tion of general audio data (GAD), i.e., audio datafrom sources such as news and radio broadcasts,and archived audiovisual documents. The moti-vation is that by performing audio classi®cation asa preprocessing step, an ASR system can employappropriate acoustic model for each homogenoussegment of audio data representing a single class,
www.elsevier.nl/locate/patrec
ELSEVIER SCIENCE B.V. [DTD 4.1.0]
JOURNAL PATREC ARTICLE No. 2 70 0
PAGES 01-12 DISPATCH 12 December 2000
PATREC 2700P R O D . T Y P E : F RO M D i sk A
Pattern Recognition Letters 000 (2000) 000±000
* Corresponding author.
E-mail address: [email protected] (I.K. Sethi).
0167-8655/00/$ - see front matter Ó 2000 Elsevier Science B.V. All rights reserved.
PII: S 0 1 6 7 - 8 6 5 5 ( 0 0 ) 0 0 1 1 9 - 7
UNCORRECTEDPROOF
resulting in an improved recognition performance(Spina and Zue, 1996; Gopalakrishnan et al.,1996).
Many audio classi®cation schemes have beeninvestigated in recent years. These schemes mainlydi�er from each other in two ways: the choice ofthe classi®er, and the set of the acoustical featuresused. The classi®ers that have been used in currentsystems include Gaussian model-based classi®ers(Spina and Zue, 1996), neural network-basedclassi®ers (Liu et al., 1998; Hansen and Womack,1996), decision trees (Zhang and Kuo, 1999), andthe hidden Markov model-based (HMM-based)classi®ers (Zhang and Kuo, 1999; Kimber andWilcox, 1996). Both the temporal and the spectraldomain features have been investigated. Examplesof the features used includes short-time energy(Zhang and Kuo, 1999; Li and Dimitrova, 1997;Wold and Blun et al., 1996), pulse metric (Pfei�eret al., 1996; Fischer et al., 1995), pause rate (Pateland Sethi, 1996), zero-crossing rate (Saraceno andLeonardi, 1997; Zhang and Kuo, 1999; Scheirerand Slaney, 1997), normalized harmonicity (Woldand Blun et al., 1996), fundamental frequency (Liuet al., 1998; Zhang and Kuo, 1999; Li and Di-mitrova, 1997; Wold and Blun et al., 1996; Pfei�eret al., 1996), frequency spectrum (Fischer et al.,1995), bandwidth (Liu et al., 1998; Wold and Blunet al., 1996), spectral centroid (Liu et al., 1998;Wold and Blun et al., 1996; Scheirer and Slaney,1997), spectral roll-o� frequency (SRF) (Li andDimitrova, 1997; Scheirer and Slaney, 1997), andband energy ratio (Patel and Sethi, 1996; Liu et al.,1998; Li and Dimitrova, 1997). Scheirer and Sla-ney (1997) evaluated various combinations of 13temporal and spectral features using several clas-si®cation strategies. They report a classi®cationaccuracy of over 90% for a two-way speech/musicdiscriminator, but only about 65% for a three-wayclassi®er that uses the same set of features to dis-criminate speech, music, and simultaneous speechand music. Hansen and Womack (1996), andSpina and Zue (1996) have investigated the ceps-tral-based features, which are widely used in thespeech recognition domain. In Hansen and Wo-mack (1996), the autocorrelation of the Mel-cepstral (AC-Mel) parameters are suggested assuitable features for the classi®cation of stress
conditions in speech. In Spina and Zue (1996),Spina and Zue used fourteen mel-frequency ceps-tral coe�cients (MFCC) to classify audio data intoseven categories. The categories in their work are:studio speech, ®eld speech, speech with back-ground music, noisy speech, music, silence, andgarbage, which covers the rest of audio patterns.They tested their algorithm on an hour of NPRradio news and achieved 80.9% classi®cation ac-curacy.
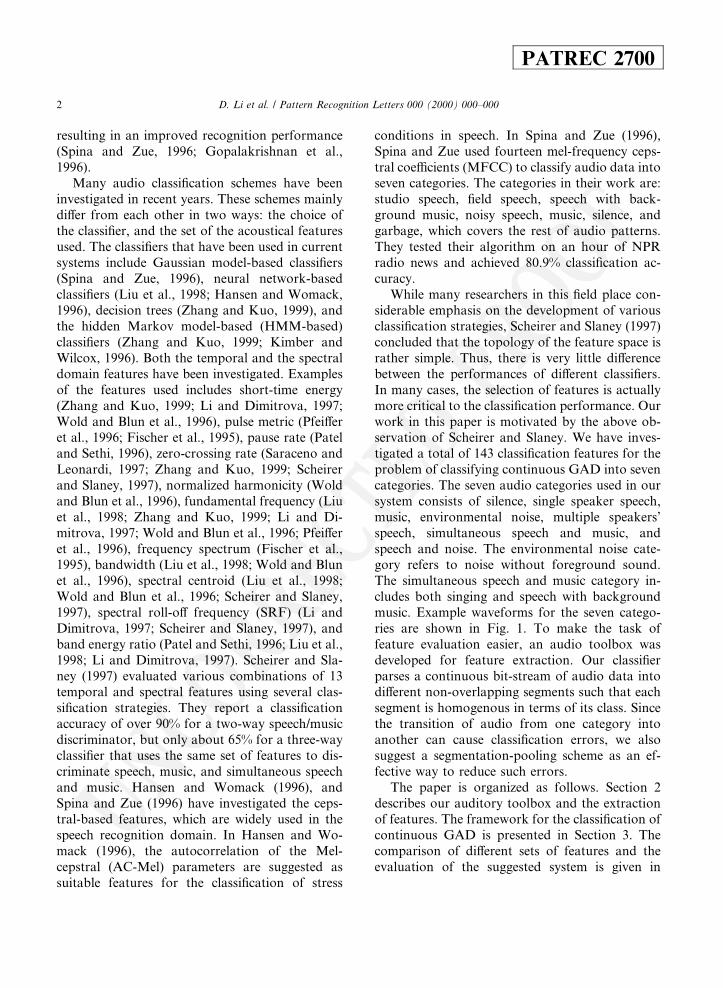
While many researchers in this ®eld place con-siderable emphasis on the development of variousclassi®cation strategies, Scheirer and Slaney (1997)concluded that the topology of the feature space israther simple. Thus, there is very little di�erencebetween the performances of di�erent classi®ers.In many cases, the selection of features is actuallymore critical to the classi®cation performance. Ourwork in this paper is motivated by the above ob-servation of Scheirer and Slaney. We have inves-tigated a total of 143 classi®cation features for theproblem of classifying continuous GAD into sevencategories. The seven audio categories used in oursystem consists of silence, single speaker speech,music, environmental noise, multiple speakers'speech, simultaneous speech and music, andspeech and noise. The environmental noise cate-gory refers to noise without foreground sound.The simultaneous speech and music category in-cludes both singing and speech with backgroundmusic. Example waveforms for the seven catego-ries are shown in Fig. 1. To make the task offeature evaluation easier, an audio toolbox wasdeveloped for feature extraction. Our classi®erparses a continuous bit-stream of audio data intodi�erent non-overlapping segments such that eachsegment is homogenous in terms of its class. Sincethe transition of audio from one category intoanother can cause classi®cation errors, we alsosuggest a segmentation-pooling scheme as an ef-fective way to reduce such errors.
The paper is organized as follows. Section 2describes our auditory toolbox and the extractionof features. The framework for the classi®cation ofcontinuous GAD is presented in Section 3. Thecomparison of di�erent sets of features and theevaluation of the suggested system is given in
2 D. Li et al. / Pattern Recognition Letters 000 (2000) 000±000
PATREC 2700
UNCORRECTEDPROOF
Section 4. Finally, summarizing remarks and po-tential applications are given in Section 5.
2. Auditory toolbox
To make our work easily reusable and ex-pandable and to facilitate our experiments ondi�erent feature extraction designs in this research,we have developed an auditory toolbox. In itscurrent implementation, it has more than twodozens of tools. Each tools is responsible for asingle basic operation that is frequently needed forthe analysis of audio data. By using the toolbox,many of the troublesome tasks related to theprocessing of streamed audio data, such as bu�er
management and optimization, synchronizationbetween di�erent processing procedures, and ex-ception handling, become transparent to users.Operations that are currently implemented in ourtoolbox include frequency-domain operations,temporal-domain operations, and basic mathe-matical operations such as short-time averaging,log operations, windowing, clipping, etc. Since acommon communication agreement is de®nedamong all of the tools, the results from one toolcan be shared with other types of tools withoutany limitation. Tools within the toolbox can thusbe organized in a very ¯exible way to accommo-date various applications and requirements.
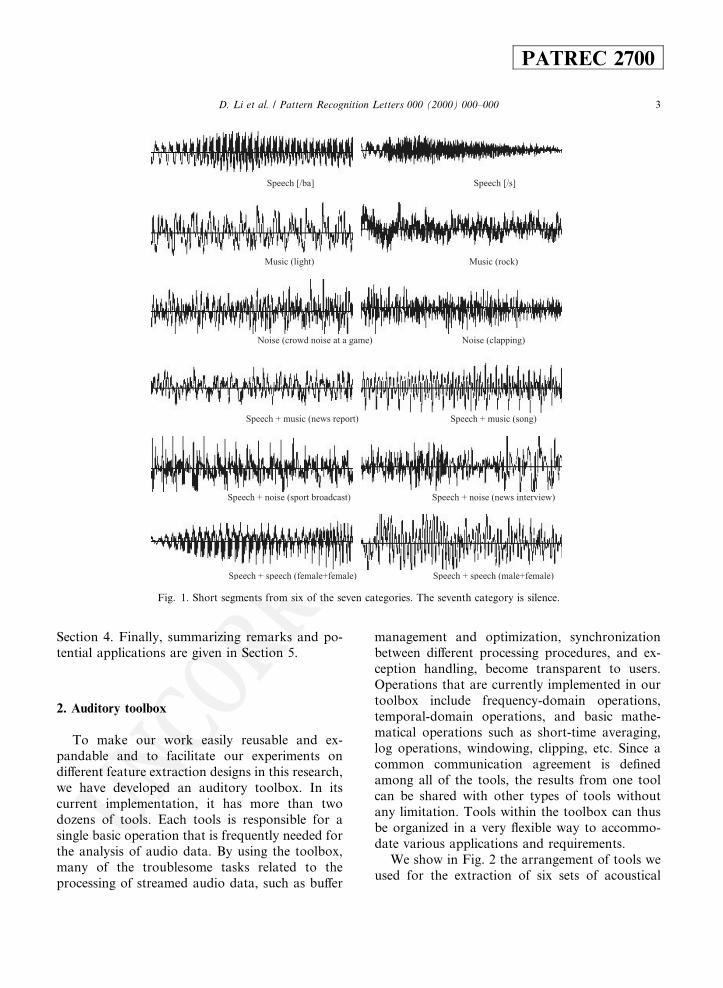
We show in Fig. 2 the arrangement of tools weused for the extraction of six sets of acoustical
Fig. 1. Short segments from six of the seven categories. The seventh category is silence.
D. Li et al. / Pattern Recognition Letters 000 (2000) 000±000 3
PATREC 2700
UNCORRECTEDPROOF
features, including MFCC, linear prediction coef-®cients (LPC), delta MFCC, delta LPC, autocor-relation MFCC, and several temporal and spectralfeatures. The de®nitions or algorithms adopted forthese features are given in the Appendix A
Based on the above acoustical features, manymore features that are used in the classi®cation ofaudio segments can be further extracted by ana-lyzing acoustical features of adjacent frames. Ac-cording to our experimental results, these features,which correspond to the characteristics of audiodata over a longer term, e.g., 600 ms, are moresuitable for the classi®cation of audio segments.The features used for audio segment classi®cationinclude:· The means and variances of acoustical features
over a certain number of successive frames cen-tered on the frame of interest.
· Pause rate: The ratio between the number offrames with energy lower than a threshold andthe total number of frames being considered.
· Harmonicity: The ratio between the number offrames with a valid pitch value and the totalnumber of frames being considered.
· Summations of energy of MFCC, delta MFCC,automation MFCC, LPC, and delta LPC.
3. Classi®cation framework for GAD
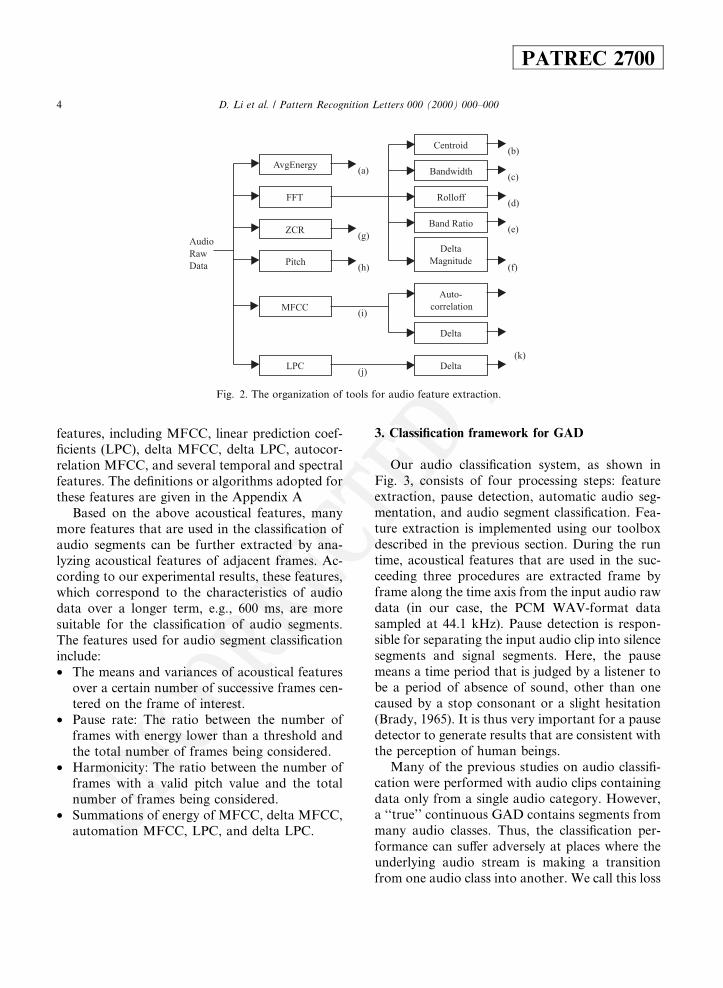
Our audio classi®cation system, as shown inFig. 3, consists of four processing steps: featureextraction, pause detection, automatic audio seg-mentation, and audio segment classi®cation. Fea-ture extraction is implemented using our toolboxdescribed in the previous section. During the runtime, acoustical features that are used in the suc-ceeding three procedures are extracted frame byframe along the time axis from the input audio rawdata (in our case, the PCM WAV-format datasampled at 44.1 kHz). Pause detection is respon-sible for separating the input audio clip into silencesegments and signal segments. Here, the pausemeans a time period that is judged by a listener tobe a period of absence of sound, other than onecaused by a stop consonant or a slight hesitation(Brady, 1965). It is thus very important for a pausedetector to generate results that are consistent withthe perception of human beings.
Many of the previous studies on audio classi®-cation were performed with audio clips containingdata only from a single audio category. However,a ``true'' continuous GAD contains segments frommany audio classes. Thus, the classi®cation per-formance can su�er adversely at places where theunderlying audio stream is making a transitionfrom one audio class into another. We call this loss
Fig. 2. The organization of tools for audio feature extraction.
4 D. Li et al. / Pattern Recognition Letters 000 (2000) 000±000
PATREC 2700
UNCORRECTEDPROOF
in accuracy the border e�ect. This loss in accuracydue to the border e�ect is also reported in (Spinaand Zue, 1996; Scheirer and Slaney, 1997). In or-der to minimize the performance losses due to theborder e�ect, we use a segmentation±pooling
scheme. The segmentation part of the segmenta-tion±pooling scheme is used to locate the bound-aries in the signal segments where a transitionfrom one type of audio to another type is takingplace. This part uses the onset and o�set measures,which indicate how fast the signal is changing, tolocate boundaries in the signal segments of theinput. The result of the segmentation processing isto yield smaller homogeneous signal segments. Thepooling component of the segmentation-poolingscheme is used at the time of classi®cation. It in-volves pooling of the frame-by-frame classi®cationresults to classify a segmented signal segment. Inthe following three subsections we will discuss thealgorithms adopted in our pause detection, audiosegmentation, and audio segment classi®cation.
3.1. Pause detection
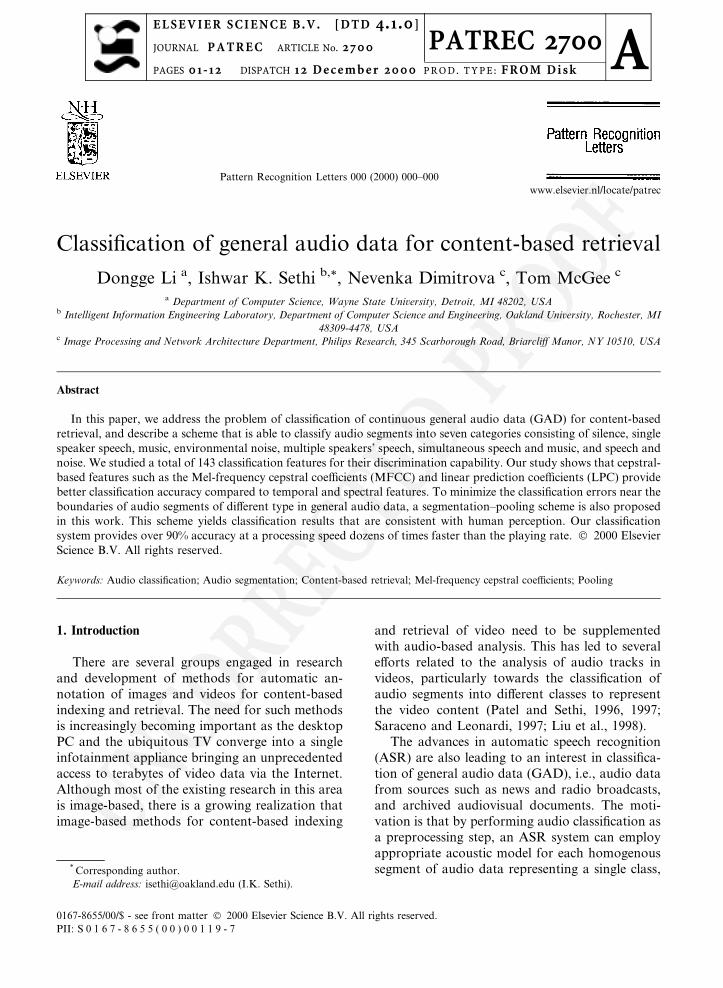
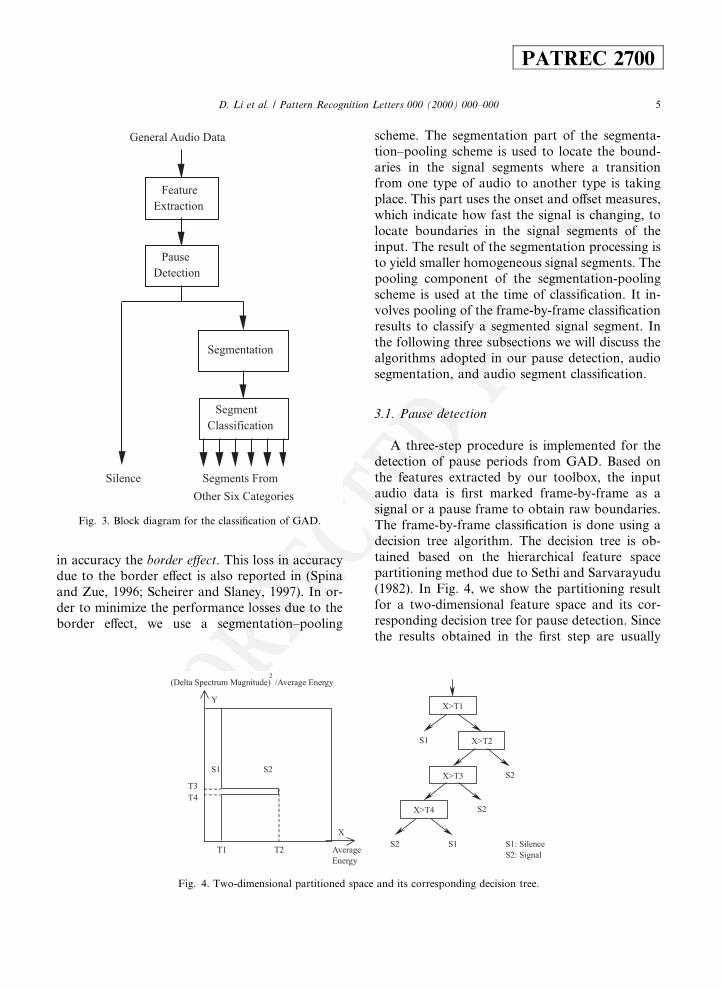
A three-step procedure is implemented for thedetection of pause periods from GAD. Based onthe features extracted by our toolbox, the inputaudio data is ®rst marked frame-by-frame as asignal or a pause frame to obtain raw boundaries.The frame-by-frame classi®cation is done using adecision tree algorithm. The decision tree is ob-tained based on the hierarchical feature spacepartitioning method due to Sethi and Sarvarayudu(1982). In Fig. 4, we show the partitioning resultfor a two-dimensional feature space and its cor-responding decision tree for pause detection. Sincethe results obtained in the ®rst step are usually
Fig. 4. Two-dimensional partitioned space and its corresponding decision tree.
Fig. 3. Block diagram for the classi®cation of GAD.
D. Li et al. / Pattern Recognition Letters 000 (2000) 000±000 5
PATREC 2700
UNCORRECTEDPROOF
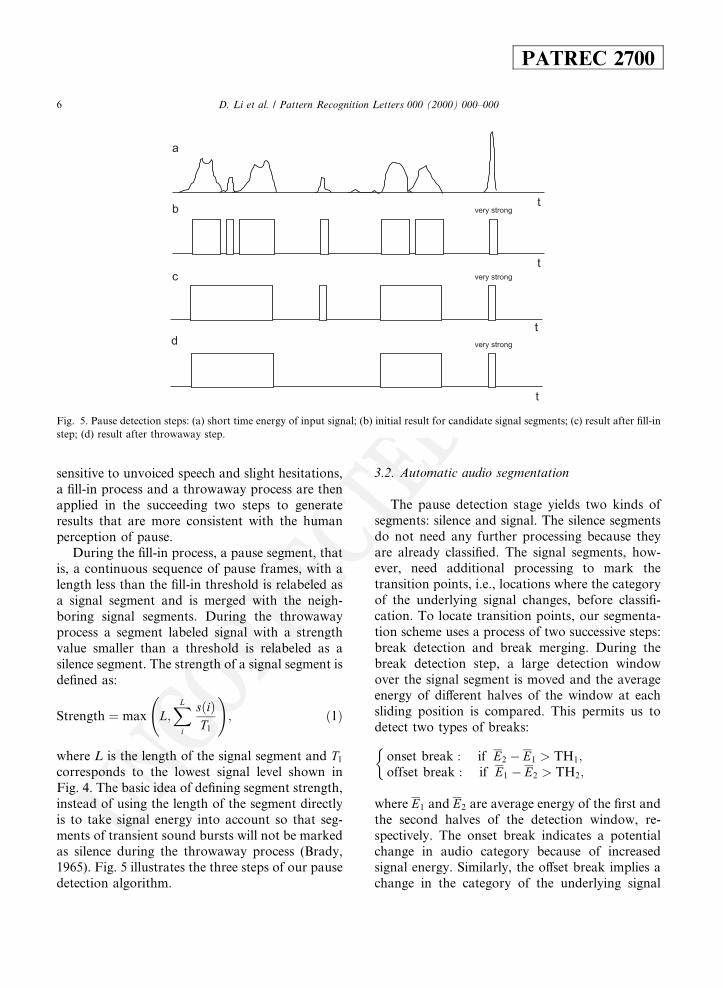
sensitive to unvoiced speech and slight hesitations,a ®ll-in process and a throwaway process are thenapplied in the succeeding two steps to generateresults that are more consistent with the humanperception of pause.
During the ®ll-in process, a pause segment, thatis, a continuous sequence of pause frames, with alength less than the ®ll-in threshold is relabeled asa signal segment and is merged with the neigh-boring signal segments. During the throwawayprocess a segment labeled signal with a strengthvalue smaller than a threshold is relabeled as asilence segment. The strength of a signal segment isde®ned as:
Strength � max L;XL
i
s�i�T1
!; �1�
where L is the length of the signal segment and T1
corresponds to the lowest signal level shown inFig. 4. The basic idea of de®ning segment strength,instead of using the length of the segment directlyis to take signal energy into account so that seg-ments of transient sound bursts will not be markedas silence during the throwaway process (Brady,1965). Fig. 5 illustrates the three steps of our pausedetection algorithm.
3.2. Automatic audio segmentation
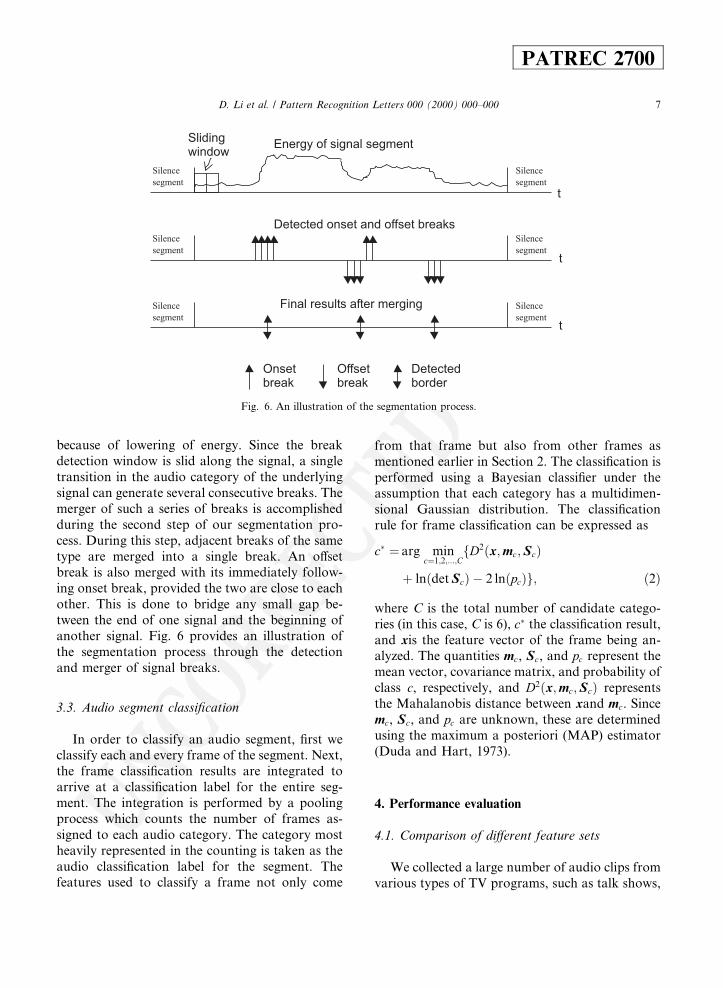
The pause detection stage yields two kinds ofsegments: silence and signal. The silence segmentsdo not need any further processing because theyare already classi®ed. The signal segments, how-ever, need additional processing to mark thetransition points, i.e., locations where the categoryof the underlying signal changes, before classi®-cation. To locate transition points, our segmenta-tion scheme uses a process of two successive steps:break detection and break merging. During thebreak detection step, a large detection windowover the signal segment is moved and the averageenergy of di�erent halves of the window at eachsliding position is compared. This permits us todetect two types of breaks:
onset break : if E2 ÿ E1 > TH1;offset break : if E1 ÿ E2 > TH2;
�where E1 and E2 are average energy of the ®rst andthe second halves of the detection window, re-spectively. The onset break indicates a potentialchange in audio category because of increasedsignal energy. Similarly, the o�set break implies achange in the category of the underlying signal
Fig. 5. Pause detection steps: (a) short time energy of input signal; (b) initial result for candidate signal segments; (c) result after ®ll-in
step; (d) result after throwaway step.
6 D. Li et al. / Pattern Recognition Letters 000 (2000) 000±000
PATREC 2700
UNCORRECTEDPROOF
because of lowering of energy. Since the breakdetection window is slid along the signal, a singletransition in the audio category of the underlyingsignal can generate several consecutive breaks. Themerger of such a series of breaks is accomplishedduring the second step of our segmentation pro-cess. During this step, adjacent breaks of the sametype are merged into a single break. An o�setbreak is also merged with its immediately follow-ing onset break, provided the two are close to eachother. This is done to bridge any small gap be-tween the end of one signal and the beginning ofanother signal. Fig. 6 provides an illustration ofthe segmentation process through the detectionand merger of signal breaks.
3.3. Audio segment classi®cation
In order to classify an audio segment, ®rst weclassify each and every frame of the segment. Next,the frame classi®cation results are integrated toarrive at a classi®cation label for the entire seg-ment. The integration is performed by a poolingprocess which counts the number of frames as-signed to each audio category. The category mostheavily represented in the counting is taken as theaudio classi®cation label for the segment. Thefeatures used to classify a frame not only come
from that frame but also from other frames asmentioned earlier in Section 2. The classi®cation isperformed using a Bayesian classi®er under theassumption that each category has a multidimen-sional Gaussian distribution. The classi®cationrule for frame classi®cation can be expressed as
c� � arg minc�1;2;...;C
fD2�x;mc;Sc�� ln�det Sc� ÿ 2 ln�pc�g; �2�
where C is the total number of candidate catego-ries (in this case, C is 6), c� the classi®cation result,and xis the feature vector of the frame being an-alyzed. The quantities mc, Sc, and pc represent themean vector, covariance matrix, and probability ofclass c, respectively, and D2�x;mc;Sc� representsthe Mahalanobis distance between xand mc. Sincemc, Sc, and pc are unknown, these are determinedusing the maximum a posteriori (MAP) estimator(Duda and Hart, 1973).
4. Performance evaluation
4.1. Comparison of di�erent feature sets
We collected a large number of audio clips fromvarious types of TV programs, such as talk shows,
Fig. 6. An illustration of the segmentation process.
D. Li et al. / Pattern Recognition Letters 000 (2000) 000±000 7
PATREC 2700
UNCORRECTEDPROOF
news, football games, weather reports, advertise-ments, soap operas, movies, late shows, etc. Theseaudio clips were recorded from four di�erent sta-tions (i.e., ABC, NBC, PBS, and CBS) and storedas 8-bit, 44.1 kHz WAV-format ®les. Care wastaken to obtain a wide variation in each category.For example, musical segments of di�erent typesof music were recorded. We selected half an hourof our corpus as training data and another hour astesting data. Both training and testing data werethen manually labeled with one of the seven cate-gories once every 10 ms. According to Brady(1965) and Agnello (1963), a minimum duration of200 ms was imposed on silence segments to ex-clude intraphase pauses that are normally notperceived by listeners. Further, the training datawas used to estimate the parameters of the classi-®er.
To investigate the suitability of di�erent featuresets, 68 acoustical features, including eight tem-poral and spectral features, and 12 each of MFCC,LPC, delta MFCC, delta LPC, and autocorrela-tion MFCC features, were extracted every 20 msfrom the input data. For each of these 68 features,we computed mean and variance over adjacentframes centered around the frame of interest.Thus, a total of 143 classi®cation features, 68mean values, 68 variances, pause rate, harmonici-ty, and ®ve summation features, were computedevery 20 ms.
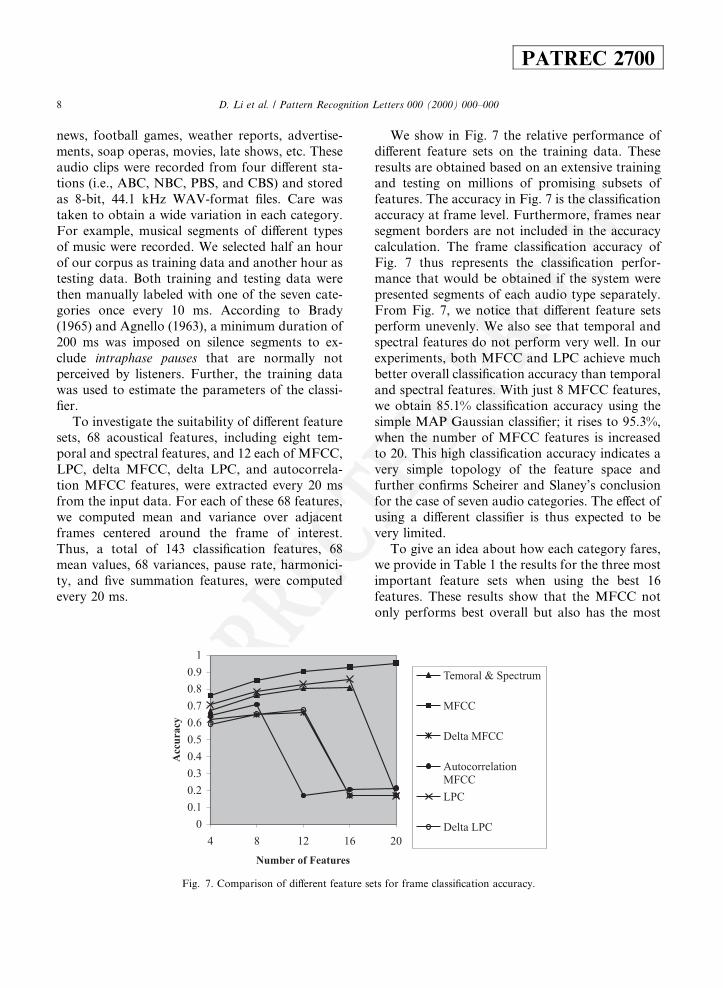
We show in Fig. 7 the relative performance ofdi�erent feature sets on the training data. Theseresults are obtained based on an extensive trainingand testing on millions of promising subsets offeatures. The accuracy in Fig. 7 is the classi®cationaccuracy at frame level. Furthermore, frames nearsegment borders are not included in the accuracycalculation. The frame classi®cation accuracy ofFig. 7 thus represents the classi®cation perfor-mance that would be obtained if the system werepresented segments of each audio type separately.From Fig. 7, we notice that di�erent feature setsperform unevenly. We also see that temporal andspectral features do not perform very well. In ourexperiments, both MFCC and LPC achieve muchbetter overall classi®cation accuracy than temporaland spectral features. With just 8 MFCC features,we obtain 85.1% classi®cation accuracy using thesimple MAP Gaussian classi®er; it rises to 95.3%,when the number of MFCC features is increasedto 20. This high classi®cation accuracy indicates avery simple topology of the feature space andfurther con®rms Scheirer and Slaney's conclusionfor the case of seven audio categories. The e�ect ofusing a di�erent classi®er is thus expected to bevery limited.
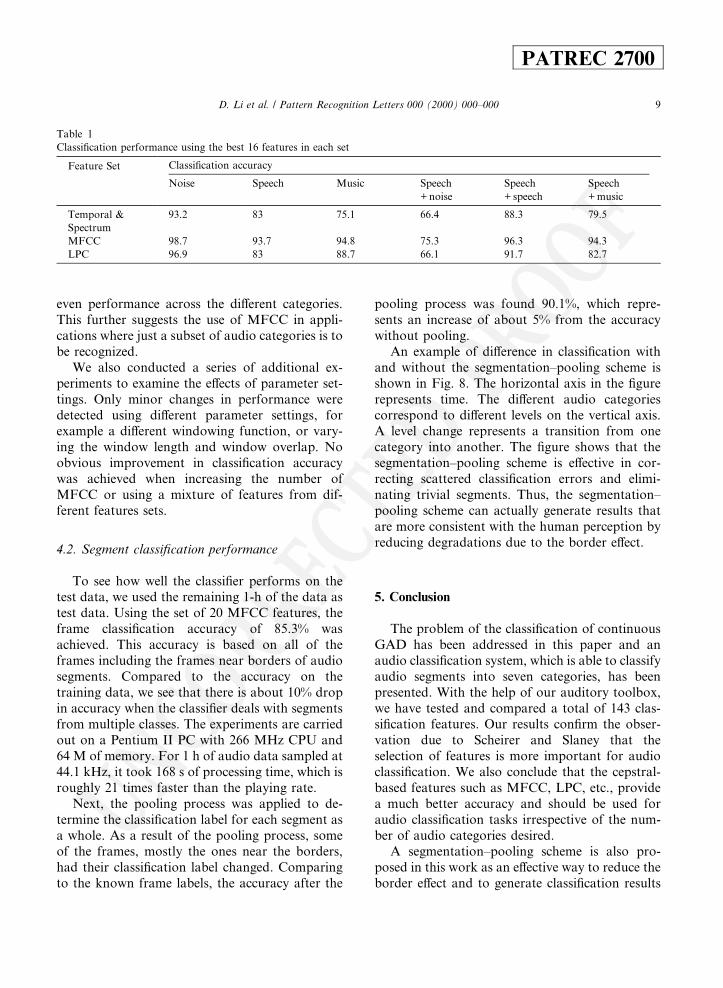
To give an idea about how each category fares,we provide in Table 1 the results for the three mostimportant feature sets when using the best 16features. These results show that the MFCC notonly performs best overall but also has the most
Fig. 7. Comparison of di�erent feature sets for frame classi®cation accuracy.
8 D. Li et al. / Pattern Recognition Letters 000 (2000) 000±000
PATREC 2700
UNCORRECTEDPROOF
even performance across the di�erent categories.This further suggests the use of MFCC in appli-cations where just a subset of audio categories is tobe recognized.
We also conducted a series of additional ex-periments to examine the e�ects of parameter set-tings. Only minor changes in performance weredetected using di�erent parameter settings, forexample a di�erent windowing function, or vary-ing the window length and window overlap. Noobvious improvement in classi®cation accuracywas achieved when increasing the number ofMFCC or using a mixture of features from dif-ferent features sets.
4.2. Segment classi®cation performance
To see how well the classi®er performs on thetest data, we used the remaining 1-h of the data astest data. Using the set of 20 MFCC features, theframe classi®cation accuracy of 85.3% wasachieved. This accuracy is based on all of theframes including the frames near borders of audiosegments. Compared to the accuracy on thetraining data, we see that there is about 10% dropin accuracy when the classi®er deals with segmentsfrom multiple classes. The experiments are carriedout on a Pentium II PC with 266 MHz CPU and64 M of memory. For 1 h of audio data sampled at44.1 kHz, it took 168 s of processing time, which isroughly 21 times faster than the playing rate.
Next, the pooling process was applied to de-termine the classi®cation label for each segment asa whole. As a result of the pooling process, someof the frames, mostly the ones near the borders,had their classi®cation label changed. Comparingto the known frame labels, the accuracy after the
pooling process was found 90.1%, which repre-sents an increase of about 5% from the accuracywithout pooling.
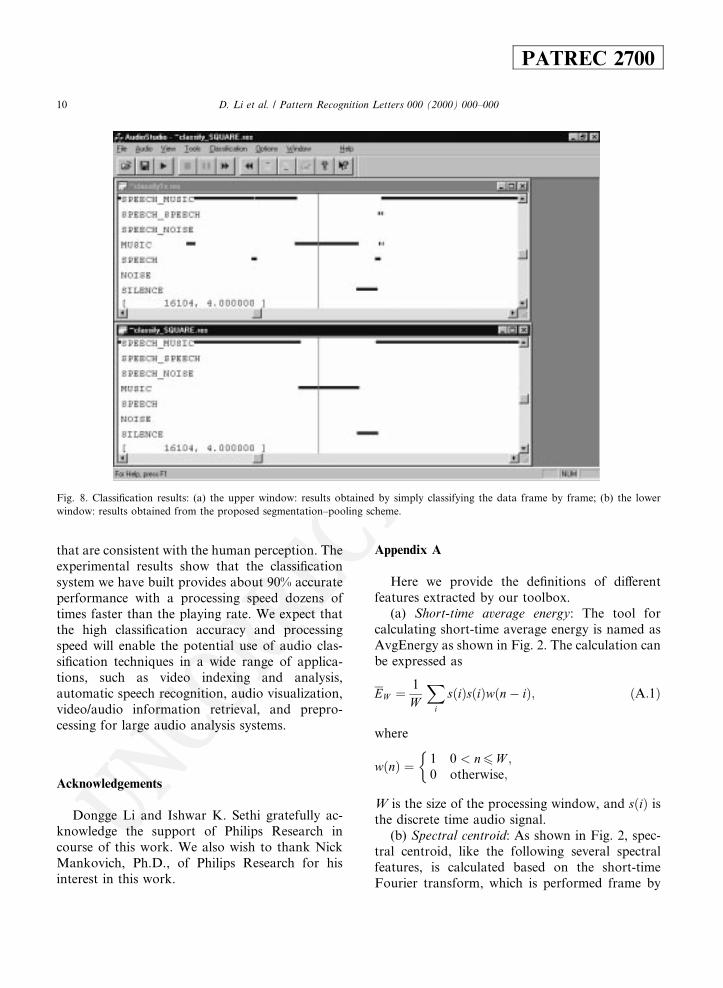
An example of di�erence in classi®cation withand without the segmentation±pooling scheme isshown in Fig. 8. The horizontal axis in the ®gurerepresents time. The di�erent audio categoriescorrespond to di�erent levels on the vertical axis.A level change represents a transition from onecategory into another. The ®gure shows that thesegmentation±pooling scheme is e�ective in cor-recting scattered classi®cation errors and elimi-nating trivial segments. Thus, the segmentation±pooling scheme can actually generate results thatare more consistent with the human perception byreducing degradations due to the border e�ect.
5. Conclusion
The problem of the classi®cation of continuousGAD has been addressed in this paper and anaudio classi®cation system, which is able to classifyaudio segments into seven categories, has beenpresented. With the help of our auditory toolbox,we have tested and compared a total of 143 clas-si®cation features. Our results con®rm the obser-vation due to Scheirer and Slaney that theselection of features is more important for audioclassi®cation. We also conclude that the cepstral-based features such as MFCC, LPC, etc., providea much better accuracy and should be used foraudio classi®cation tasks irrespective of the num-ber of audio categories desired.
A segmentation±pooling scheme is also pro-posed in this work as an e�ective way to reduce theborder e�ect and to generate classi®cation results
Table 1
Classi®cation performance using the best 16 features in each set
Feature Set Classi®cation accuracy
Noise Speech Music Speech
+ noise
Speech
+ speech
Speech
+ music
Temporal &
Spectrum
93.2 83 75.1 66.4 88.3 79.5
MFCC 98.7 93.7 94.8 75.3 96.3 94.3
LPC 96.9 83 88.7 66.1 91.7 82.7
D. Li et al. / Pattern Recognition Letters 000 (2000) 000±000 9
PATREC 2700
UNCORRECTEDPROOF
that are consistent with the human perception. Theexperimental results show that the classi®cationsystem we have built provides about 90% accurateperformance with a processing speed dozens oftimes faster than the playing rate. We expect thatthe high classi®cation accuracy and processingspeed will enable the potential use of audio clas-si®cation techniques in a wide range of applica-tions, such as video indexing and analysis,automatic speech recognition, audio visualization,video/audio information retrieval, and prepro-cessing for large audio analysis systems.
Acknowledgements
Dongge Li and Ishwar K. Sethi gratefully ac-knowledge the support of Philips Research incourse of this work. We also wish to thank NickMankovich, Ph.D., of Philips Research for hisinterest in this work.
Appendix A
Here we provide the de®nitions of di�erentfeatures extracted by our toolbox.
(a) Short-time average energy: The tool forcalculating short-time average energy is named asAvgEnergy as shown in Fig. 2. The calculation canbe expressed as
EW � 1
W
Xi
s�i�s�i�w�nÿ i�; �A:1�
where
w�n� � 1 0 < n6W ;0 otherwise;
�W is the size of the processing window, and s�i� isthe discrete time audio signal.
(b) Spectral centroid: As shown in Fig. 2, spec-tral centroid, like the following several spectralfeatures, is calculated based on the short-timeFourier transform, which is performed frame by
Fig. 8. Classi®cation results: (a) the upper window: results obtained by simply classifying the data frame by frame; (b) the lower
window: results obtained from the proposed segmentation±pooling scheme.
10 D. Li et al. / Pattern Recognition Letters 000 (2000) 000±000
PATREC 2700
UNCORRECTEDPROOF
frame along the time axis. Let Fi � ffi�u�gMu�0
represent the short-time Fourier transform of theith frame, where M is the index for the highestfrequency band. The spectral centroid of frame i iscalculated as
ci �PM
u�0 u � fi�u�j j2PMu�0 fi�u�j j2 : �A:2�
(c) Bandwidth: Following the de®nition ofspectral centroid given in (A.2), the bandwidth ofthe FFT of frame i is given as
b2i �
PMu�0�uÿ ci�2 � fi�u�j j2PM
u�0 fi�u�j j2 : �A:3�
(d) Spectral rollo� frequency: According to (Liand Dimitrova, 1997), SRF is normally very highfor low-energy, unvoiced speech segments andmuch lower for speech segments with relativelyhigher energy. Music and noise, however, do nothave a similar property, which makes this featurepotentially useful for discrimination betweenspeech and other types of audio signals. The de®-nition of SRF is given as
SRFi � max hXh
u�0
fi�u������
< TH �
XM
u�0
fi�u�!;
�A:4�where TH is a threshold between 0 and 1. Wechoose 0.92 for TH in our experiments.
(e) Band energy ratio: Although band energyratio may be de®ned in di�erent ways, there isessentially not much di�erence between variousde®nitions. In this work, the band energy ratio(BER) is calculated as
BERi �Ph
u�0 fi�u�PMu�0 fi�u�
; �A:5�
where h � M=4 for our experiments.(f) Delta spectrum magnitude: As demonstrated
in (Scheirer and Slaney, 1997), delta spectrummagnitude is a very suitable feature for a speech/music discriminator. It is given as
DFi �XM
u�0
fi�u�j jk ÿ fi�1�u�j jk: �A:6�
(g) Zero-crossing rate (ZCR): This feature is acorrelate of the spectral centroid. It is de®ned asthe number of time-domain zero-crossings withinthe processing window.
(h) Pitch: The knowledge of pitch contour isused in many applications such as speaker identi-®cation, speech analysis, and audio informationretrieval. Among the many available pitch detec-tion algorithms, we choose the classical autocor-relation-based pitch tracker due to its robustness(Ghias et al., 1995). To avoid most of the unnec-essary time-consuming autocorrelation calcula-tions and to optimize the detection accuracy, aseries of modi®cation strategies are adopted in ourpitch detection approach. These are described inmore detail in (Li and Dimitrova, 1997).
(i) Mel-frequency cepstral coe�cients: In ourimplementation, the MFCC are extracted usingthe DCT of ®lter-banked FFT spectra (Noll,1967). The calculations are performed frame byframe on the windowed input data along the timeaxis. The types of windows that are available in-clude square, and Hamming window.
(j) Linear prediction coe�cients: The extractionof LPC is implemented using the autocorrelationmethod, which can be found in (Ramachandran etal., 1995). At each processing step, 12 coe�cientsare extracted in our experiments.
(k) Delta MFCC, Delta LPC, and autocorrela-tion MFCC: These features provide quantitativemeasures to the movement of the MFCC or LPC.They have been adopted in some applications inthe speech domain. The de®nitions for these fea-tures are given as follows:
DMFCCi�v� �MFCCi�1�v� ÿMFCCi�v�; �A:7�
DLPCi�v� � LPCi�1�v� ÿ LPCi�v�; �A:8�
ACMFCC�l�i �v�
� 1
L
Xi�L
j�i
MFCCj�v� �MFCCj�l�v�ÿ �
; �A:9�
where MFCCi�v� and LPCi�v� represent the vthMFCC and LPC of frame i, respectively. L is thecorrelation window length. The superscript l is thevalue of correlation lag.
D. Li et al. / Pattern Recognition Letters 000 (2000) 000±000 11
PATREC 2700
UNCORRECTEDPROOF
References
Patel, N.V., Sethi, I.K., 1996. Audio characterization for video
indexing. In: Proc. IS & T/SPIE Conf. Storage and Retrieval
for Image and Video Databases IV, San Jose, CA, Febru-
ary, pp. 373±384.
Patel, N.V., Sethi, I.K., 1997. Video Classi®cation using
Speaker Identi®cation. In: Proc. IS & T/SPIE Conf. Storage
and Retrieval for Image and Video Databases V, San Jose,
CA, February, pp. 218±225.
Saraceno, C., Leonardi, R., 1997. Identi®cation of successive
correlated camera shots using audio and video information.
Proc. ICIP'97 3, 166±169.
Liu, Z., Wang, Y., Chen, T., 1998. Audio feature extraction and
analysis for scene classi®cation. J. VLSI Signal Processing
(Special issue on multimedia signal processing) October, 61±
79.
Spina, M., Zue, V.W., 1996. Automatic transcription of general
audio data: preliminary analyses. In: Proc. International
Conference on Spoken Language Processing, Philadelphia,
PA, October, pp. 594±597.
Gopalakrishnan, et al. P.S., 1996. Transcription of radio
broadcast news with the IBM large vocabulary speech
recognition system. In: Proc. DARPA Speech Recognition
Workshop, February.
Hansen, J.H.L., Womack, B.D., 1996. Feature analysis and
neural network-based classi®cation of speech under stress.
IEEE Trans. Speech Audio Processing 4(4), 307±313.
Zhang, T., Kuo, C.-C.J., 1999. Audio-guided audiovisual data
segmentation, indexing, and retrieval. In: IS & T/SPIE's
Symposium on Electronic Imaging Science & Technology ±
Conference on Storage and Retrieval for Image and Video
Databases VII, SPIE 3656, San Jose, CA, January, pp. 316±
327.
Kimber, D., Wilcox, L., 1996. Acoustic segmentation for audio
browsers. In: Proc. Interface Conference, Sydney, Australia,
July.
Li, D., Dimitrova, N., 1997. Tools for audio analysis and
classi®cation. Philips Technical Report, August.
Wold, E., Blum, et al. T., 1996. Content-based classi®cation,
search, and retrieval of audio. IEEE Multimedia, Fall, 27±
36.
Pfei�er, S., Fischer, S., E�elsberg, W., 1996. Automatic audio
content analysis. In: Proc. of ACM Multimedia'96, Boston,
MA, pp. 21±30.
Fischer, S., Lienhart, R., E�elsberg, W., 1995. Automatic
recognition of ®lm genres. In: Proc. of ACM Multime-
dia'95, San Francisco, CA, 295±304.
Scheirer, E., Slaney, M., 1997. Construction and evaluation of a
robust multifeature speech/music discriminator. In: Proc.
ICASSP'97, Munich, Germany, April, pp. 1331±1334.
Brady, P.T., 1965. A technique for investigating on-o� patterns
of speech. The Bell Syst. Tech. J. 44 (1), 1±22.
Sethi, I.K., Sarvarayudu, G.P.R., 1982. Hierarchical classi®er
design using mutual information. IEEE Trans. Pattern
Recognition Machine Intelligence 4 (4), 441±445.
Duda, R.O., Hart, P.E., 1973. Pattern Classi®cation and Scene
Analysis. Wiley, New York.
Agnello, J.G., 1963. A study of intra- and inter-phrasal pauses
and their relationship to the rate of speech. Ohio State
University Ph.D. Thesis.
Ghias, et al. A., 1995. Query by humming. In: Proc. ACM
Multimedia'95, San Francisco, pp. CA, 231±236.
Noll, A.M., 1967. Cepstrum pitch determination. J. Acoust.
Soc. Amer. 41 (2).
Ramachandran, R.P., Zilovic, M.S., Mammone, R.J., 1995. A
comparative study of robust linear predictive analysis
methods with applications to speaker identi®cation. IEEE
Trans. Speech Audio Processing 3 (2), 117±125.
12 D. Li et al. / Pattern Recognition Letters 000 (2000) 000±000
PATREC 2700