Embed Size (px)
Citation preview

Article
Influence of wheel size on muscle activity and triaxial accelerations during CrossCountry mountain biking
Hurst, Howard Thomas, Atkins, Stephen, Metcalfe, John, Sinclair, Jonathan Kenneth and Rylands, Lee
Available at http://clok.uclan.ac.uk/15408/
Hurst, Howard Thomas, Atkins, Stephen, Metcalfe, John, Sinclair, Jonathan Kenneth and Rylands, Lee (2016) Influence of wheel size on muscle activity and triaxial accelerations during CrossCountry mountain biking. Journal of Sports Sciences . ISSN 02640414
It is advisable to refer to the publisher’s version if you intend to cite from the work.http://dx.doi.org/10.1080/02640414.2016.1215497
For more information about UCLan’s research in this area go to http://www.uclan.ac.uk/researchgroups/ and search for <name of research Group>.
For information about Research generally at UCLan please go to http://www.uclan.ac.uk/research/
All outputs in CLoK are protected by Intellectual Property Rights law, includingCopyright law. Copyright, IPR and Moral Rights for the works on this site are retained by the individual authors and/or other copyright owners. Terms and conditions for use of this material are defined in the http://clok.uclan.ac.uk/policies/
CLoKCentral Lancashire online Knowledgewww.clok.uclan.ac.uk
For Peer Review O
nly
Influence of wheel size on muscle activity and tri-axial
accelerations during Cross-Country mountain biking
Journal: Journal of Sports Sciences
Manuscript ID RJSP-2014-1186.R2
Manuscript Type: Special Issue
Keywords: Vibration, Cycling, Mountain biking, electromyography
URL: http://mc.manuscriptcentral.com/rjsp
Journal of Sports Sciences

For Peer Review O
nly
Influence of wheel size on muscle activity and tri-axial accelerations during Cross-1
Country mountain biking 2
3
Running head: Mountain biking and muscle activity 4
Keywords: vibrations, cycling, mountain biking, electromyography 5
Word Count: 3989 6
7
8
Acknowledgments 9
We would like to acknowledge Santa Cruz Bicycles in the USA and UK for the loan of the 10
test equipment and their support in this project. We would also like to confirm there were no 11
conflicts of interest and that Santa Cruz Bicycles’ involvement was completely impartial. We 12
would also like to thank the participants for their time and effort in taking part in the study. 13
14
15
Page 1 of 28
URL: http://mc.manuscriptcentral.com/rjsp
Journal of Sports Sciences
123456789101112131415161718192021222324252627282930313233343536373839404142434445464748495051525354555657585960

For Peer Review O
nly
Abstract 1
2
This study aimed to investigate the influence of different mountain bike wheel diameters on 3
muscle activity and whether larger diameter wheels attenuate muscle vibrations during cross-4
country riding. Nine male competitive mountain bikers (age 34.7 ± 10.7 yrs; stature 177.7 ± 5
5.6 cm; body mass 73.2 ± 8.6 kg) participated in the study. Riders performed one lap at race 6
pace on 26”, 27.5” and 29” wheeled mountain bikes. sEMG and acceleration (RMS) were 7
recorded for the full lap and during ascent and descent phases at the gastrocnemius, vastus 8
lateralis, biceps brachii and triceps brachii. No significant main effects were found by wheel 9
size for each of the four muscle groups for sEMG or acceleration during the full lap and for 10
ascent and descent (p > .05). When data were analysed between muscle groups, significant 11
differences were found between biceps brachii and triceps brachii (p < .05) for all wheel sizes 12
and all phases of the lap with the exception of for the 26” wheel during the descent. Findings 13
suggest wheel diameter has no influence on muscle activity and vibration during mountain 14
biking. However, more activity was observed in the biceps brachii during 26” wheel 15
descending. This is possibly due to an increased need to manoeuvre the front wheel over 16
obstacles. 17
18
19
20
Page 2 of 28
URL: http://mc.manuscriptcentral.com/rjsp
Journal of Sports Sciences
123456789101112131415161718192021222324252627282930313233343536373839404142434445464748495051525354555657585960
For Peer Review O
nly
Introduction 1
2
The physiological demands of cross-country mountain biking have been well reported over 3
recent years (MacRae, Hise, & Allen, 2000; Lee, Martin, Anson, Grundy, & Hahn, 2002; 4
Stapelfeldt, Schwirtz, Schumacher, & Hillebrecht, 2004; Impellizzeri, Rampinini, Sassi, 5
Mognoni, & Marcora, 2005; Prins, Treblanche, & Myburgh, 2007). These studies focused 6
primarily on aerobic and anaerobic contributions to the activity. However, few studies have 7
investigated muscle activity during mountain biking. Hurst and Atkins (2006) proposed 8
mountain bike riders utilised a high level of isometric muscular contractions during racing to 9
aid postural control and control of the bicycle over obstacles. 10
11
Surface electromyography (sEMG) has been used to analyse muscle activity in road cyclists 12
(Egaña, Ryan, Warmington, & Green, 2010; Matsuura, Arimitsu, Yuncki, & Yano, 2011; 13
Blake, Champoux, & Wakeling, 2012). However, these studies focused on lower limb muscle 14
activity and were laboratory based. Duc, Bertucci, Pernin, and Grappe (2008) investigated the 15
influence of hand grip position on the handlebar drops compared to the tops, during uphill 16
cycling on upper body muscle activity. However, the activity observed does not reflect those 17
used in mountain biking, due to the more dynamic nature of upper body movements. Hurst et 18
al. (2012) investigated the influence of course terrain on upper body sEMG during downhill 19
riding in elite downhill and cross-country cyclist. They found significant differences in the 20
muscles recruited between the groups, with downhill riders exhibiting greatest triceps brachii 21
activity, whilst cross-country riders showed greater activity in the brachioradialis. Their study 22
concluded that the differences in bicycle design between downhill and cross-country bicycles 23
may in part have influenced the differences observed. 24
Page 3 of 28
URL: http://mc.manuscriptcentral.com/rjsp
Journal of Sports Sciences
123456789101112131415161718192021222324252627282930313233343536373839404142434445464748495051525354555657585960

For Peer Review O
nly
1
The standard mountain bike wheel diameter has long been 26”. However, in the past 10 years 2
two more wheel size standards have been introduced, 29” and more recently 27.5”. The 3
rationale for 29” wheels has been that the larger diameter improves roll over small trail 4
bumps and therefore improves contact with the ground and subsequent velocity. In addition, 5
it has been proposed by the cycling industry that the larger wheel will also reduce trail 6
vibrations observed in mountain biking (Levy & Smith, 2005; Faiss, Praz, Meichtry, Gobelet, 7
& Deriaz, 2007) being transmitted to the rider. Mester, Spitzenfeil, Schwarzer, & Seifriz 8
(1999) found that these vibrations lead to increased muscle activity to aid dampening of trail 9
shocks, resulting in reduced exercise efficiency. Justification for the newer 27.5” wheel 10
standard has been that it potentially provides a balance between the better handling 11
characteristics of the 26” wheel and the improved rolling properties of 29” wheels. However, 12
few academic studies exist determining the merits of these different wheel diameters on 13
performance. Macdermid, Fink, and Stannard (2014) did investigate differences in 3D 14
accelerations between 26” and 29” wheels and reported that 29” wheeled mountain bikes 15
resulted in significantly greater vibrations than the 26” wheel during a typical lap of a cross-16
country course, possibly due to the increase in velocity observed. However, Macdermid and 17
Stannard (2014) also point out that a key limitation of their study was that they used the same 18
29” bicycle fitted with 26” wheels, thus potentially influencing their findings, as frame 19
geometry may not have been optimised for the smaller wheel size. In addition, they did not 20
investigate the influence of 27.5” wheels. Therefore, the aims of this study were to 21
investigate the influence of the 3 primary wheel standards on tri-axial accelerations and 22
muscle activity in upper and lower limbs during cross-country mountain biking. It was 23
hypothesised that the larger wheel diameters would significantly attenuate the muscle activity 24
and vibrations experienced by the riders more than the 26” wheel. 25
Page 4 of 28
URL: http://mc.manuscriptcentral.com/rjsp
Journal of Sports Sciences
123456789101112131415161718192021222324252627282930313233343536373839404142434445464748495051525354555657585960

For Peer Review O
nly
1
Materials and methods 2
Participants 3
Nine male competitive mountain bikers (age 34.7 ± 10.7 yrs; stature 177.7 ± 5.6 cm; body 4
mass 73.2 ± 8.6 kg) participated in the study. All riders had a minimum of 5 years racing 5
experience and competed at a National level in their respective age category. Ethical approval 6
was granted by the University of Central Lancashire Ethics Committee and in accordance 7
with the Declaration of Helsinki. Participants were informed both verbally and in writing of 8
the test procedures and written informed consent was obtained. 9
10
Course Profile 11
All testing was completed on a purpose build cross-country mountain bike course at the 12
British National Cycle Centre (Clayton Vale, Manchester). The course comprised of 13
undulating technical sections and also featured one major climb and descent, for which data 14
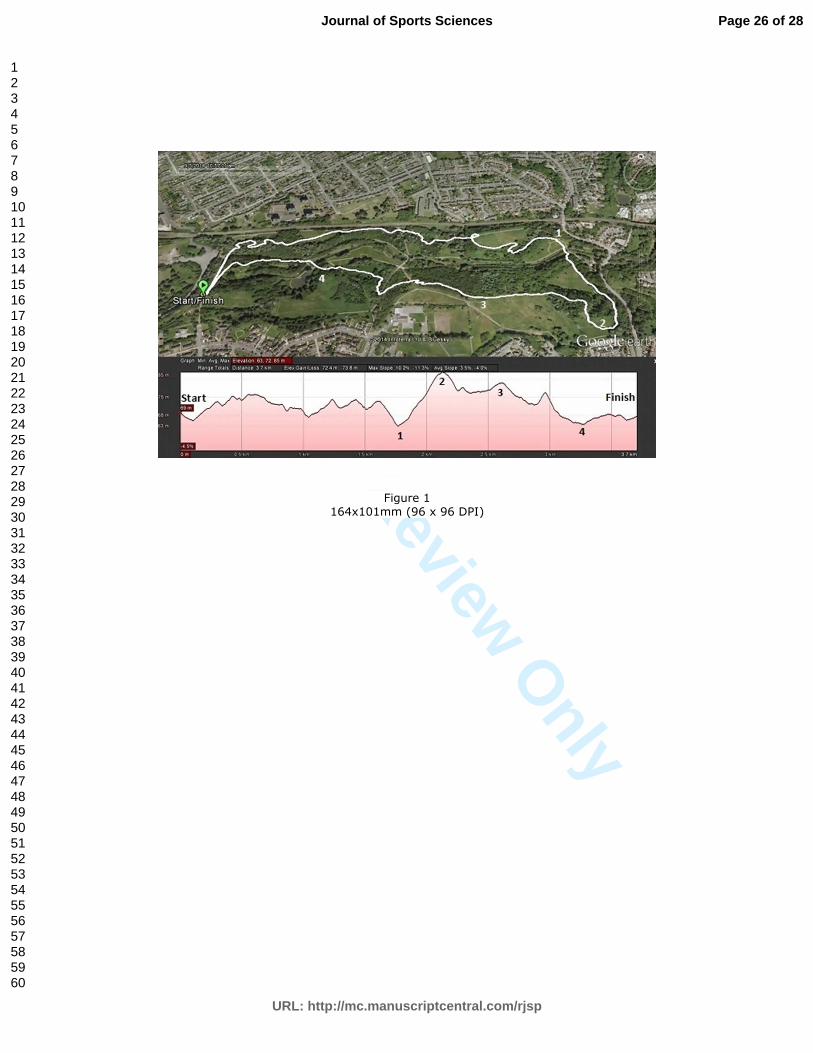
were analysed for these sections as well as the full lap. Figure 1 shows a global positioning 15
system (GPS) trace of the course and profile. A Garmin Edge 810 GPS computer was used to 16
record lap times and temperature. However, due to the level of tree cover and the 17
inaccuracies of GPS under tree cover, actual distances were recorded with a calibrated trundle 18
wheel. Distances of each section highlighted in figure 1 were; Start to 1 = 1.72 km; 1 to 2 = 19
0.38 km (Climb); 2 to 3 = 0.47 km; 3 to 4 = 0.66 km (Descent); and 4 to Finish = 0.25 km; 20
total lap distance = 3.48 km. Based on Ordinance Survey maps, the average gradient of the 21
climb was 5.8 ± 0.3 %, whilst the descent gradient was -6.1 ± 0.4 %. Testing took place over 22
a four week period between the months of June and July. Mean temperature was 18.5 ± 1.5 23
°C, with all test sessions being performed in sunny dry conditions. Therefore, course 24
conditions were consistent for all trials. 25
Page 5 of 28
URL: http://mc.manuscriptcentral.com/rjsp
Journal of Sports Sciences
123456789101112131415161718192021222324252627282930313233343536373839404142434445464748495051525354555657585960
For Peer Review O
nly
1
***Figure 1 near here*** 2
3
Surface EMG and Acceleration Analyses 4
Surface electromyography (sEMG) data were recorded using a mobile wireless sensor system 5
(Trigno Mobile, Delsys, USA) at 1926 Hz from the gastrocnemius, vastus lateralis, biceps 6
brachii and triceps brachii. Parallel bar electrodes with a 1 cm spacing between electrodes 7
were used. This method has been shown to significantly reduce the cross-talk between 8
muscles when compared to the use of disc electrodes (De Luca, Kuznetsoc, Gilmore, & Roy, 9
2012). All recordings were taken from the left hand side of the body. Prior to sensor 10
placement, the skin was prepared by shaving the area, lightly abrading and cleaning with 11
alcohol wipes in order to minimise skin impedance. Though impedance was not measured, it 12
is accepted that this may have changed during testing due to sweating by the participants. 13
However, in order to ensure the same muscles were assessed during each trial, the sEMG 14
sensors were not removed between laps. Sensors were positioned longitudinally in parallel to 15
the muscle fibres on the medial aspect of each muscle. Placement of the sensors was in 16
accordance with the Surface EMG for Non-Invasive Assessment of Muscles project 17
recommendations. Once positioned on the muscles, sensors were secured in place using 18
elasticated bandages. Though the use of elasticated bandages may have possibly reduced 19
tissue movement artefacts, this would potentially improve indirect measurement of 20
acceleration on the skeletal system. In addition, during pilot testing, sensors did not stay in 21
situ using just hypoallergenic tape as a result of increased sweating. As such bandaging was 22
deemed the most appropriate method for securing the sensors. Following data collection, 23
sEMG data were full-wave rectified then filtered at 20 Hz using a second order low pass 24
Butterworth filter. 25
Page 6 of 28
URL: http://mc.manuscriptcentral.com/rjsp
Journal of Sports Sciences
123456789101112131415161718192021222324252627282930313233343536373839404142434445464748495051525354555657585960
For Peer Review O
nly
1
According to Sinclair, Brooks, Edmundson, & Hobbs (2012), due to the nature of field-based 2
testing, normalisation of sEMG signals to a maximal voluntary isometric contraction are not 3
possible or appropriate, though their study looked at running. This was due to the dynamic 4
muscular activity involved. Therefore, they proposed that sEMG data should be normalised to 5
a dynamic peak task, that being the peak amplitude recorded during the field-based trials. As 6
cycling is also dynamic in nature, sEMG data in the present study are presented as a 7
percentage of the dynamic peak task for the full lap and the ascent and descent sections. 8
9
In addition to sEMG, the Delsys Trigno sensors also recorded wireless tri-axial acceleration 10
for measurement of muscle vibrations. The placement of accelerometers on soft tissue to 11
monitor vibrations has previously been validated (Lafortune et al. 1995; Coza et al 2010). 12
Nokes, Fairclough, Mintowt, Mackie, and Williams (1984) also reported that vibrations could 13
be reliably and validly recorded with muscle mounted accelerometers if they were preloaded 14
to overcome the influence of soft tissue properties. Given the use of elasticated bandages to 15
secure the sensors, an element of preload would have been applied to the accelerometers, 16
though the exact force could not be determined. In addition, Ziegert and Lewis (1979) found 17
that lower mass accelerometers had a minimal effect data acquisition. Sensors used in the 18
current study were 14 g in mass. Data were sampled at 148.1 Hz with a range of ± 9 g, and 19
analysed for total (XYZ) accelerations. Root mean squares (RMS) of the resultant XYZ data 20
were determined to analyse the vibrations experienced by the riders (ISO 1997). Similar 21
methods have been used in earlier studies of mountain biking vibrations (Macdermind et al., 22
2014). Data were processed using EMGWorks Version 4.0 (Delsys Inc., Boston, USA) to 23
Page 7 of 28
URL: http://mc.manuscriptcentral.com/rjsp
Journal of Sports Sciences
123456789101112131415161718192021222324252627282930313233343536373839404142434445464748495051525354555657585960

For Peer Review O
nly
determine mean sEMG and RMS for the full lap and the ascent and descent phases prior to 1
later statistical analyses. 2
Protocols 3
Following placement of the sensors participants were shown the course and allowed 1 hour to 4
familiarise themselves with the route. With the exception of one rider, all had previous 5
experience of racing or riding on the course used. Participants were required to complete one 6
lap of the course at self-determined race pace on each of the three wheel sizes. Thirty minutes 7
passive rest was given between trials to allow adequate recovery, this was then followed by a 8
10 minute re-warm, which consistent of low intensity cycling prior to the next trial. The test 9
bicycles were Santa Cruz Superlight full suspension mountain bikes (Santa Cruz Bicycles, 10
USA) with 120 mm and 100 mm of front and rear suspension respectively. All bicycles were 11
2014 models and were new and unused prior to the study. All three bicycles were fitted with 12
identical components, again new and unused, and differed component wise only in wheel 13
size, those being 26”, 27.5” and 29” diameter. Tyre pressure was 35 psi for all trials. 14
15
Frame size was a medium for all three bicycles. However, overall bicycle mass differed due 16
to the differences in wheel diameter and wheel mass (13.69 kg, 13.93 kg and 14.15 kg for the 17
26”, 27.5” and 29” wheeled bicycles respectively). Therefore, to account for this and to 18
eliminate any potential influence on results, bicycle mass was standardised to the heaviest 19
bicycle (29” wheeled) by adding small weights to the lower downtube of the 26” and 27.5” 20
wheeled bicycles. Subsequently, any observed differences could be attributed more to rolling 21
properties of the different wheel diameters than any differences in mass. Top tube lengths 22
were 590, 602 and 613 mm for the 26”, 27.5” and 29” wheels respectively, whilst bottom 23
bracket heights were 319, 326 and 337 mm, respectively. To accommodate differences in 24
Page 8 of 28
URL: http://mc.manuscriptcentral.com/rjsp
Journal of Sports Sciences
123456789101112131415161718192021222324252627282930313233343536373839404142434445464748495051525354555657585960

For Peer Review O
nly
rider stature a choice of two different stem lengths were offered (90 and 110 mm). Saddle 1
setback was also adjusted to ensure best fit. In addition, riders were allowed to use their own 2
pedals. Suspension systems were set up according to the manufacturers’ recommendations for 3
each rider’s individual weight and to allow for 10 percent sag in the travel. Both front and 4
rear suspension were run in fully open mode, whilst shock leverage ratios were optimised by 5
the manufacturer for each frame geometry. 6
7
Immediately prior to each trial participants lined up on the start line and were instructed to 8
perform a maximal vertical jump to provide a marker on the accelerometer data. This was 9
used to synchronise the accelerometer and sEMG data. Participants were then set off 10 s 10
post vertical jump. All sEMG and accelerometer data pre and 10 s post jump were discarded 11
from the analysis. The time the participants crossed the finish line was noted and all data after 12
this time was also discarded from the results. In the absence of a trigger system to help 13
identify where the climb and descents started and ended on the sEMG and accelerometer 14
traces, data were synchronised with the time date on the GPS unit attached to the handlebars. 15
The start and end of the main climb and descent were marked with signposts. Riders were 16
instructed to press the ‘lap’ button on the GPS at the start and end of these sections. This then 17
enabled the identification these sections on the sEMG and accelerometer traces by means of 18
the time stamps. When determining mean data in the EMGWorks software, these time blocks 19
were identified and subsequently analysed. Participants were randomly assigned to three 20
groups of three participants and trials were counterbalanced for each group. 21
22
Statistical Analyses 23
Page 9 of 28
URL: http://mc.manuscriptcentral.com/rjsp
Journal of Sports Sciences
123456789101112131415161718192021222324252627282930313233343536373839404142434445464748495051525354555657585960

For Peer Review O
nly
Normality of data were first confirmed by means of a Shaprio-Wilk test. Differences in 1
muscle activity and accelerations between wheel sizes and between muscle groups within 2
each wheel size were determined using within groups one-way repeated measures ANOVA’s. 3
Bonferroni corrections were used during post hoc analyses to control for type I errors. Where 4
the homogeneity assumption was violated, the degrees of freedom were adjusted using the 5
Greenhouse Geisser correction. Effect sizes were calculated using partial Eta2 (p2). 6
Significance was accepted at the p≤0.05 level (Sinclair, Taylor, & Hobbs, 2013) and data are 7
presented as mean ± standard deviation. All statistical procedures were conducted using 8
SPSS 20.0 (SPSS Inc., Chicago, IL, USA). 9
10
Results 11
Though riders performed each lap at a self-determined race pace, no significant difference 12
was found for mean velocity between wheel sizes (F(2, 16) = .70; p = .45; p2 = .08), with mean 13
values of 13.7 ± .8 (95% CI, 13.1, 14.3), 13.6 ± .8 (95% CI, 13.0, 14.2) and 13.9 ± .8 (95% 14
CI, 13.3, 14.5) km.h-1 being reported for the 26”, 27.5” and 29” wheeled bicycles 15
respectively. Additionally, no significant differences were found in lap times between wheel 16
sizes (F(2, 16) = .69; p = .45; p2 = .08). Mean lap times were 916.1 ± 54.5 (95% CI, 874.3, 17
957.6), 923.8 ± 52.9 (95% CI, 883.1, 964.5) and 904.2 ± 54.7 (95% CI, 862.1, 946.3) s for 18
the 26”, 27.5” and 29” wheeled bicycles respectively. 19
20
Surface electromyography data 21
Analysis of sEMG data revealed no significant main effects for wheel size when analysed 22
over the full lap for the gastrocnemius (F(2,16) = .29; p = .75; p2 = .04), vastus lateralis (F(2,16) = 23
Page 10 of 28
URL: http://mc.manuscriptcentral.com/rjsp
Journal of Sports Sciences
123456789101112131415161718192021222324252627282930313233343536373839404142434445464748495051525354555657585960
For Peer Review O
nly
1.42; p = .27; p2 = .15), biceps brachii (F(2,16) = .83; p = .40; p2 = .09) or triceps brachii (F(2,16) 1
= .12; p = .89; p2 = .02). When data were analysed for the climb alone, no significant main 2
effect was again reported for any muscle group by wheel size; gastrocnemius (F(2,16) = .39; p 3
= .69; p2 = .05), vastus lateralis (F(2,16) = .95; p = .41; p2 = .11), biceps brachii (F(2,16) = .44; p 4
= .65; p2 = .05) and triceps brachii (F(2,16) = .43; p = .66; p2 = .05) respectively. Analysis of 5
descent sEMG also found no significant main effect for wheel size; gastrocnemius (F(2,16) = 6
.23; p = .80; p2 = .03), vastus lateralis (F(2,16) = 1.64; p = .23; p2 = .17), biceps brachii (F(2,16) = 7
.94; p = .37; p2 = .11) or triceps brachii (F(2,16) = .13; p = .88; p2 = .02). Table 1 shows the 8
mean values for sEMG as a percentage of dynamic peak task and 95% CI. When muscles 9
were compared against each other within wheel sizes, significant differences (p < .05) were 10
found between the antagonistic muscles of the biceps brachii and triceps brachii within all 11
wheel sizes when analysed over the full lap and the climb. However, during the descent 12
section significant differences (p < .05) were only reported between biceps brachii and triceps 13
brachii within the 27.5” and 29” wheel sizes. 14
15
***Table 1 near here*** 16
17
Acceleration Data 18
Analysis of total XYZ acceleration amplitude (RMS) between muscles over the full lap 19
revealed no significant main effect for wheel sizes in the gastrocnemius (F(2,16) = 1.42; p = 20
.27; p2 = .15), vastus lateralis (F(2,16) = .48; p = .63; p2 = .06), biceps brachii (F(2,16) = .85; p = 21
.45; p2 = .10) or triceps brachii (F(2,16) = .70; p = .51; p2 = .08). Data from the climbing section 22
also showed no significant main effect for wheel size; gastrocnemius (F(2,16) = .87; p = .44; p2 23
Page 11 of 28
URL: http://mc.manuscriptcentral.com/rjsp
Journal of Sports Sciences
123456789101112131415161718192021222324252627282930313233343536373839404142434445464748495051525354555657585960

For Peer Review O
nly
= .10), vastus lateralis (F(2,16) = 2.73; p = .10; p2 = .25), biceps brachii (F(2,16) = 1.50; p = .25; 1
p2 = .16) or triceps brachii (F(2,16) = .90; p = .43; p2 = .10). Similarly, no significant main 2
effects were found for wheel size during the main descent section of the lap; gastrocnemius 3
(F(2,16) = 1.94; p = .18; p2 = .20), vastus lateralis (F(2,16) = .68; p = .52; p2 = .08), biceps brachii 4
(F(2,16) = .47; p = .64; p2 = .06) or triceps brachii (F(2,16) = .51; p = .61; p2 = .06). When 5
muscles were compared against each other within each wheel size, significant differences 6
existed (p < .001) in total acceleration between the gastrocnemius and vastus lateralis as 7
expected during the full lap, climb and descent sections. However, no significant differences 8
in acceleration were found between the biceps brachii and triceps brachii for any section of 9
the course or over the full lap. Table 2 shows the mean total acceleration amplitude (RMS) 10
for each muscle and wheel size along with 95% CI. 11
12
***Table 2 near here*** 13
Discussion 14
The purpose of this study was to determine the influence of three different mountain bike 15
wheel diameters on muscle activity and vibrations at different muscle sites during a typical 16
cross-country lap at race pace. The key findings were that no significant differences were 17
observed in muscle activity between the 26”, 27.5” and 29” wheeled bicycles when analysed 18
for the full lap and during the highlighted ascent and descent sections. Similarly, no 19
significant differences were found in accelerations at the four different muscle sites between 20
the three wheel sizes. Therefore, the hypothesis that larger wheels reduce muscle activity and 21
vibrations should be rejected. However, other factors may also have influenced the results of 22
the current study. 23
Page 12 of 28
URL: http://mc.manuscriptcentral.com/rjsp
Journal of Sports Sciences
123456789101112131415161718192021222324252627282930313233343536373839404142434445464748495051525354555657585960

For Peer Review O
nly
1
The present study found significantly lower sEMG values than those reported by Hurst et al. 2
(2012) in elite cross-country and downhill riders. Although the riders in the present study 3
were not performing at an elite level, the differences between these studies are less likely the 4
result of differences in athletic ability and more likely due to the limitation of normalising 5
muscle activity during dynamic tasks to a maximal voluntary isometric contraction. Mountain 6
biking involves numerous eccentric muscular contractions as a result of riding off drops to 7
aid dampening and control of the bicycle. This most likely resulted in the greater then 8
maximal voluntary isometric contraction values reported previously by Hurst et al. (2012). 9
However, the present study normalised on course muscle activity to the peak dynamic task 10
values elicited across all trials in accordance the methods previously reported (Sinclair et al., 11
2012). Results showed that irrespective of wheel size, mean muscle activity over the full lap, 12
ascent and descent sections were not significantly different and represented a very low 13
percentage of peak dynamic task, approximately 2-6 %. This low percentage may potentially 14
be skewed somewhat due to high peak values occurring when riding off drops to help control 15
the bicycle. The course used contained several drops of approximately 1 m in height. In 16
addition, differences between the current study and that of Hurst et al. (2012) may also be 17
attributed to the different sEMG methodologies used and the use of disc electrodes by Hurst 18
et al. (2012), as opposed to the parallel bar electrodes used in the current study. 19
20
Though values did not reach a level of significance, the results show that biceps brachii 21
activity was generally higher during all phases of the lap for the 26” wheel when compared to 22
the 27.5” and 29” wheels. This may be the result of riders having to pull more on the handle 23
bars increasing elbow flexion to lift the front wheel of the 26” wheel over obstacles and small 24
Page 13 of 28
URL: http://mc.manuscriptcentral.com/rjsp
Journal of Sports Sciences
123456789101112131415161718192021222324252627282930313233343536373839404142434445464748495051525354555657585960

For Peer Review O
nly
gaps. As a result of the larger wheel diameter, both the 27.5” and 29” wheels would 1
potentially roll over such obstacles more efficiently and would not drop into small gaps as 2
easily, thereby reducing muscle activity. This supposition would appear to be supported when 3
data were analysed between muscle groups. Significant differences were found between the 4
antagonistic muscles of the biceps brachii and triceps brachii over the full lap and the main 5
climbing section for all wheel sizes. However, during the descent section, only significant 6
differences were found between these two muscle groups when riding the 27.5” and 29” 7
wheeled bicycles. The non-significant difference between biceps brachii and triceps brachii 8
during downhill on the 26” wheel bicycles again potentially indicates a greater demand on the 9
biceps to manoeuvre the bicycle over and around obstacles. However, it is important to note 10
the relatively large standard deviations reported for the sEMG data. This may reflect 11
differences in riding styles of the participants, as riders may have adapted their riding styles 12
to suit the ride qualities of each bicycle. However, without video analysis of each ride, it is 13
difficult to quantify if or how much this differed between bicycles. 14
15
In addition, anthropometric differences may also have influenced the results and the large 16
standard deviations reported. Though not measured in the current study differences in limb 17
lengths between riders may have influenced these findings, as this would influence leverage 18
at the cranks and handlebars and thus affect how easily a rider could manoeuvre the bicycle 19
over or around trail obstacles. Given the lack of significant difference in mean velocity over 20
the course, difference between the three bicycles was less than 0.4 km.h-1, it is less likely that 21
would have influenced the muscle activity and vibrations encountered by the riders. 22
23
Page 14 of 28
URL: http://mc.manuscriptcentral.com/rjsp
Journal of Sports Sciences
123456789101112131415161718192021222324252627282930313233343536373839404142434445464748495051525354555657585960
For Peer Review O
nly
Lastly, upper limb sEMG may also have been influenced by braking activity. Hurst et al. 1
(2012) reported increased forearm activity in elite cross-country riders when compared to 2
downhill riders. This they proposed was possible the result of frame geometry differences and 3
smaller brake rotors. However, in the present study, equipment was the same on all bicycles 4
as was the head tube angle, therefore it is unlikely that these would have impacted on the 5
finding. Differences were more likely the result of riding style, as some riders may have 6
braked more into corners than other, resulting in the high standard deviations observed in 7
biceps brachii sEMG. Future research may seek to quantify the contribution of braking to 8
muscle sEMG activity. 9
10
Previous research has tried to evaluate the external load imposed on riders during mountain 11
biking (Hurst, Swarén, Hébert-Losier, Ericsson, Sinclair, Atkins, & Holmberg, 2013). Their 12
study used a tri-axial accelerometer positioned between the scapulae. However, they reported 13
values as a global index of load/vibration on the whole body, which did not reflect the 14
vibrations exerted on specific muscle groups or joint. As such, the present study analysed 15
total acceleration (XYZ) (RMS) as an indicator of vibrations imposed on muscles in the 16
upper and lower limbs. Other than the expected differences in vibrations between the 17
gastrocnemius and vastus lateralis, due to the different locations from the body/bicycle 18
interface, no significant differences were found for muscles between wheel sizes or within 19
muscle groups. This is in contrast to the findings of Macdermid et al. (2014) who found the 20
29” wheel resulted in significantly greater vibrations than the 26” wheeled mountain bike. In 21
addition, data for vibrations presented in the current study are approximately double the 22
magnitude of those reported by Macdermid et al. (2014). This may be the result of 23
differences in sensor placement, as Macdermid et al. (2014) positioned their accelerometers 24
on the bony processes of the wrist and ankle, whilst sensors in the present study were 25
Page 15 of 28
URL: http://mc.manuscriptcentral.com/rjsp
Journal of Sports Sciences
123456789101112131415161718192021222324252627282930313233343536373839404142434445464748495051525354555657585960
For Peer Review O
nly
positioned on soft tissue on the medial aspects of the muscles to be analysed. Chiementin, 1
Rigaut, Crequy, Bolaers, and Bertucci (2012) also state that in order to assess vibrations in 2
cycling the accelerometers should be located at the machine-hand interface. Though this is a 3
valid point, within the present study positioning of the sensors in this region would have 4
prevented the ability to determine muscle activity, due to the multi-sensor nature of the 5
Delsys Trigno system. Therefore, these differences may account for much of the differences 6
between Macdermid et al. (2014) and the present study. 7
Research by Lafortune, Hening, and Valiant (1995) and Coza, Nigg, and Fliri (2010) 8
previously validated the use accelerometers placed on soft tissue to monitor vibrations on 9
human muscle. Lafortune et al. (1995) did however reported values approximately double the 10
amplitude of those recorded by accelerometers placed on the bone. Additionally, Kim et al. 11
(1993) also found that skin mounted accelerometers increased vibrations by approximately 12 12
% when compared to bone mounted accelerometers. Though it is generally believed that 13
muscle would act as a damper and attenuate the accelerometer signals, during exercise the 14
increased eccentric activity of the muscles upon landing forces, or those experienced during 15
descending and jumping in mountain biking in our case, have been shown to increase 16
intramuscular tension and therefore augment acceleration signals (Mizrahi, Verbitsky, & 17
Isakov, 2000). This may in part account for some of the differences in results between the 18
current study and those of Macdermid et al. (2014). Arpinar-Avsar, Birlik, Sezgin, and Soylu 19
(2013) sought to quantify the vibrations imposed on the forearm of the rider when riding a 20
mountain bike. They reported RMS values for acceleration again approximately half those 21
reported in the present study. However, their study only involved riders riding over rough 22
road for a distance of 250 m and not terrain representative of off-road cycling. This most 23
likely contributed to the lower values reported. 24
25
Page 16 of 28
URL: http://mc.manuscriptcentral.com/rjsp
Journal of Sports Sciences
123456789101112131415161718192021222324252627282930313233343536373839404142434445464748495051525354555657585960

For Peer Review O
nly
Differences may also be attributed to the fact that full suspension bicycles were used in the 1
present study compared to the rigid hard tail mountain bike used by Macdermid et al. (2014). 2
As a consequence, this may have influenced riding dynamics. It is possible that the lower 3
accelerations observed by Macdermid et al. (2014) may have resulted from greater flexion of 4
the arms and legs to absorb trail shocks more effectively, whilst in the present study riders 5
may have relied more on the bicycle’s suspension to absorb the shocks. However, this 6
potentially could have led to participants riding with straighter arms and legs and 7
unknowingly increasing the vibrations transmitted to the muscles, possibly during the shocks 8
rebound phase. This idea may be supported by Hurst et al. (2012) who found downhill riders 9
had a smaller degree of elbow flexion compared to cross-country riders as a result of the 10
greater level of suspension travel used on downhill specific bicycles. 11
12
The non-significant differences in vibrations between the three wheel sizes in the present 13
study may again be due to the effects of the suspension systems effectively reducing trail 14
shock. In addition to the lack of rear suspension on the bicycle used in the Macdermid study, 15
they also fitted the 26” wheels to a frame designed for 29” wheels. This may have altered the 16
handling characteristics of the bicycle, as the bottom bracket and crank arms would have 17
been lower to the ground than when using frames designed specifically for the respective 18
wheel sizes. 19
20
Limitations 21
One potential limitation of the present study was the lack of gyroscopic and magnetometer 22
sensors within the sensor units used. The inclusion of such sensors could have aided in more 23
Page 17 of 28
URL: http://mc.manuscriptcentral.com/rjsp
Journal of Sports Sciences
123456789101112131415161718192021222324252627282930313233343536373839404142434445464748495051525354555657585960

For Peer Review O
nly
accurate determination of the directionality of the acceleration forces experienced by the 1
riders. Such information could have helped identify differences in riding styles between 2
wheel sizes and whether riders were required to use greater lateral, vertical or horizontal 3
efforts to manoeuvre the bicycles through different sections of the course. In addition, the 4
inclusion of these sensors may have allowed the use of spectral analyses to determine the 5
frequency of vibrations in the vertical and horizontal planes, as with the current sensor 6
configuration and the movement of the riders it would have been practically impossible to 7
identify these vertical and horizontal frequencies. 8
9
Conclusions and practical implications 10
In conclusion, this study revealed that larger wheel diameters did not significantly reduce 11
muscle activity or vibrations more so than the long standing traditional 26” wheel on the 12
particular course used. However, there appeared to be a trend for slightly greater biceps 13
brachii activity in the 26” wheel. This could have been the result of the need to lift the front 14
wheel over small obstacles more or differences in rider anthropometrics or a combination of 15
both. Additionally, differences in riding styles or adaptations to riding the different wheeled 16
bicycles may have played a part in muscle activity. Ultimately, the lack of statistical 17
differences between the measured parameters suggests that when ridden by trained mountain 18
bike riders all three wheel sizes are just as effective at controlling trail induced shocks and 19
that bicycle choice is largely a matter of personal preference. Within a field based setting, 20
there are likely to be a number of factors that influence muscle activity rather than wheel size 21
alone. 22
23
Page 18 of 28
URL: http://mc.manuscriptcentral.com/rjsp
Journal of Sports Sciences
123456789101112131415161718192021222324252627282930313233343536373839404142434445464748495051525354555657585960

For Peer Review O
nly
References 1
Arpinar-Avsar, P., Birlik, G., Sezgin, Ö.C., & Soylu, A.R. (2013) The effects of surface-2
induced loads on forearm muscle activity during steering a bicycle. Journal of Sports 3
Science and Medicine, 12, 512-520. 4
Blake, O.M., Champoux, Y., & Wakeling, J.M. (2012) Muscle Coordination Patterns for 5
Efficient Cycling. Medicine and Science in Sports and Exercise, 44, 926-938. 6
Chiementin, X., Rigaut, M., Crequy, S., Bolaers, F., & Bertucci, W. (2012) Hand-arm 7
vibration in cycling. Journal of Vibration Control, 19, 2551-2560. 8
Coza, A., Nigg, B.M., & Fliri, L. (2010) Quantification of soft-tissue vibrations in 9
running: accelerometry versus high-speed motion capture. Journal of Applied 10
Biomechanics, 26, 367-373. 11
De Luca, C.J., Kuznetsoc, M., Gilmore, L.D., & Roy, S.H. (2012) Inter-electrode spacing 12
of surface EMG sensors: Reduction of crosstalk contamination during voluntary 13
contractions. Journal of Biomechanics, 45, 555-561. 14
Duc, S., Bertucci, W., Pernin, J.N., & Grappe, F. (2008) Muscular activity during uphill 15
cycling: Effect of slope, posture, hand grip position and constrained bicycle lateral sways. 16
Journal of Electromyography and Kinesiology, 18, 116-127. 17
Egaña, M., Ryan, K., Warmington, S.A., & Green, S. (2010) Effect of body tilt angle on 18
fatigue and EMG activities in lower limbs during cycling. European Journal of Applied 19
Physiology. 108, 649–656. 20
Page 19 of 28
URL: http://mc.manuscriptcentral.com/rjsp
Journal of Sports Sciences
123456789101112131415161718192021222324252627282930313233343536373839404142434445464748495051525354555657585960
For Peer Review O
nly
Faiss, R., Praz, M., Meichtry, A., Gobelet, C., & Deriaz, O. (2007) The effect of 1
mountain bike suspensions on vibrations and off-road uphill performance. Journal of 2
Sports Medicine and Physical Fitness, 47, 151-158. 3
Hurst, H.T., & Atkins, S. (2006) Power output of field-based downhill mountain biking. 4
Journal of Sports Sciences, 24(10), 1047-1053. 5
Hurst, H.T., Swarén, M., Hébert-Losier, K., Ericsson, F., Sinclair, J., Atkins, A., & 6
Holmberg, HC. (2012) Influence of course type on upper body muscle activity in elite 7
cross-country and downhill mountain bikers during off road downhill cycling. Journal of 8
Science and Cycling, 1(2), 2-9. 9
Hurst, H.T., Swarén, M., Hébert-Losier, K., Ericsson, F., Sinclair, J., Atkins, A., & 10
Holmberg, HC. (2013) GPS-based evaluation of activity profiles in elite downhill 11
mountain biking and the influence of course type. Journal of Science and Cycling, 2(1), 12
25-32. 13
Impellizzeri, F.M., Rampinini, E., Sassi, A., Mognoni, P., & Marcora, S. (2005) 14
Physiological correlates to off-road cycling performance. Journal of Sports Sciences, 23, 15
41-47. 16
Kim, W., Volshin, A.S., Johnson, S.H., & Simkin, A. (1993) Measurement of impulsive 17
bone motion by skim-mounted accelerometers. Journal of Biomechanical Engineering, 18
115, 47-52. 19
Lafortune, M.A., Hennig, E., & Valiant, G.A. (1995). Tibial shock measured with bone 20
and skin mounted transducers. Journal of Biomechanics, 28, 989-993. 21
Page 20 of 28
URL: http://mc.manuscriptcentral.com/rjsp
Journal of Sports Sciences
123456789101112131415161718192021222324252627282930313233343536373839404142434445464748495051525354555657585960
For Peer Review O
nly
Lee, H., Martin, D.T., Anson, J.M., Grundy, D., & Hahn, A.G. (2002) Physiological 1
characteristics of successful mountain bikers and professional road cyclists. Journal of 2
Sports Sciences, 20, 1001-1008. 3
Levy, M., & Smith, G. (2005) Effectiveness of vibration damping with bicycle 4
suspension systems. Sports Engineering, 8, 99-106. 5
Macdermid, P.W., Fink, P.W., & Stannard R. (2014) Transference of 3D accelerations 6
during cross country mountain biking. Journal of Biomechanics, 47, 1829-1827. 7
MacRae, H.S-H., Hise, K.J., & Allen, P.J. (2000) Effects of Front and Dual Suspension 8
Mountain Bike Systems on Uphill Cycling Performance. Medicine and Science in Sports 9
and Exercise, Vol. 32, 1276-1280. 10
Matsuura, R., Arimitsu, T., Yuncki, T., & Yuno, T. (2011) Effects of resistive load on 11
performance and surface EMG activity during repeated cycling sprints on a non-12
isokinetic cycle ergometer. British Journal of Sports Medicine. 45, 820-824. 13
Mester, J., Spitzenfeil, P., Schwarzer, J., & Seifriz, F. (1999) Biological reaction to 14
vibration – implications for sport. Journal of Science and Medicine in Sport, 2, 211-226. 15
Mizrahi, J., Verbitsky, O., & Isakov, E. (2000) Shock accelerations and attenuation in 16
downhill and level running. Clinical Biomechanics, 15, 15-20. 17
Nokes, L., Fairclough, J.A., Minitowt, W.J., Mackie, I., & Williams, J. (1984) Vibration 18
analysis of human tibia: The effects of soft tissue on the output from skin-mounted 19
accelerometers. Journal of Biomechanical Engineering, 6, 223-226. 20
Page 21 of 28
URL: http://mc.manuscriptcentral.com/rjsp
Journal of Sports Sciences
123456789101112131415161718192021222324252627282930313233343536373839404142434445464748495051525354555657585960

For Peer Review O
nly
Prins, L., Terblanche, E., & Myburgh, K.H. (2007) Field and laboratory correlates of 1
performance in competitive cross-country mountain bikers. Journal of Sports Sciences, 2
25, 927 – 935. 3
Saha, S., & Lakes, R.S. (1977) The effect of soft tissue on wave-propagation and 4
vibration tests for determining the in vivo properties of bone. Journal of Biomechanics, 5
10, 393-401. 6
Sinclair, J., Brooks, D., Edmundson, C.J., & Hobbs S.J. (2012) The efficacy of EMG 7
MVC normalisation techniques for running analyses. Journal of Biomechanics, 45(1), 8
623. 9
Sinclair, J., Taylor, P.J., & Hobbs, S.J. (2013) Alpha level adjustments for multiple 10
dependent variable analyses and their applicability – A review. International Journal of 11
Sport Science and Engineering, 7, 17-20. 12
Stapelfeldt, B., Schwirtz, A., Schumacher, Y.O., & Hillebrecht, M. (2004) Workload 13
demands in mountain bike racing. International Journal of Sports Medicine, 25, 294-300. 14
Ziegert, J.C., & Lewis, J.L. (1979) The effects of soft tissue on measurements of 15
vibrational bone motion and skin-mounted accelerometers. Journal of Biomechanics, 101, 16
218. 17
18
Page 22 of 28
URL: http://mc.manuscriptcentral.com/rjsp
Journal of Sports Sciences
123456789101112131415161718192021222324252627282930313233343536373839404142434445464748495051525354555657585960

For Peer Review O
nly
1
Figure 1. GPS profile of course. Numbers indicate the different sections of the course. 2
3
Page 23 of 28
URL: http://mc.manuscriptcentral.com/rjsp
Journal of Sports Sciences
123456789101112131415161718192021222324252627282930313233343536373839404142434445464748495051525354555657585960

For Peer Review O
nly
1
Table 1. Mean ± standard deviation and 95 % CI for mean sEMG amplitude as a percentage 2
of dynamic peak task for different wheel size during (A) full lap; (B) climb; and (C) descent. 3
*Significantly different to triceps brachii (26”); � significantly different to triceps brachii 4
(27.5”); ¥ significantly different to triceps brachii (29”). 5
6
Page 24 of 28
URL: http://mc.manuscriptcentral.com/rjsp
Journal of Sports Sciences
123456789101112131415161718192021222324252627282930313233343536373839404142434445464748495051525354555657585960

For Peer Review O
nly
1
Table 2. Mean ± standard deviation and 95% CI of mean acceleration amplitude (RMS) for 2
different wheel size during (A) full lap; (B) climb; and (C) descent. 3
4
Page 25 of 28
URL: http://mc.manuscriptcentral.com/rjsp
Journal of Sports Sciences
123456789101112131415161718192021222324252627282930313233343536373839404142434445464748495051525354555657585960
For Peer Review O
nly
Figure 1
164x101mm (96 x 96 DPI)
Page 26 of 28
URL: http://mc.manuscriptcentral.com/rjsp
Journal of Sports Sciences
123456789101112131415161718192021222324252627282930313233343536373839404142434445464748495051525354555657585960

For Peer Review O
nly
26” Wheel 27.5” Wheel 29” Wheel
Mean ± sd (95% CI) Mean ± sd (95% CI) Mean ± sd (95% CI)
Full Lap
Gastrocnemius 4.71 ± 3.23 (2.22, 7.19) 4.86 ± 3.28 (2.33, 7.38) 4.83 ± 3.12 (2.43, 7.22)
Vastus Lateralis 4.56 ± 2.54 (2.61, 6.52) 4.94 ± 2.99 (2.64, 7.23) 4.62 ± 2.31 (2.84, 6.40)
Biceps Brachii 1.78 ± 1.66 (0.51, 3.06)* 1.17 ± 0.74 (0.61, 1.74)� 1.32 ± 0.67 (0.80, 1.85)
¥
Triceps Brachii 3.61 ± 1.28 (2.62, 4.59) 3.58 ± 1.34 (2.55, 4.61) 3.66 ± 1.70 (2.84, 4.48)
Climb
Gastrocnemius 4.91 ± 3.33 (2.35, 7.47) 4.68 ± 3.10 (2.30, 7.05) 4.81 ± 3.07 (2.46, 7.17)
Vastus Lateralis 4.62 ± 2.51 (2.70, 6.55) 4.95 ± 3.04 (2.61, 7.28) 4.60 ± 2.41 (2.74, 6.45)
Biceps Brachii 1.43 ± 1.04 (0.63, 2.22)* 1.18 ± 0.87 (0.51, 1.85)� 1.09 ± 0.78 (0.49, 1.69)
¥
Triceps Brachii 3.26 ± 1.20 (2.33, 4.18) 3.39 ± 1.17 (2.50, 4.29) 3.43 ± 1.02 (2.64, 4.21)
Descent
Gastrocnemius 4.70 ± 3.43 (2.07, 7.34) 4.56 ± 3.24 (2.07, 7.05) 4.63 ± 3.12 (2.23, 7.03)
Vastus Lateralis 4.64 ± 2.94 (2.37, 6.90) 4.78 ± 2.87 (2.58, 6.99) 4.30 ± 2.14 (2.65, 5.95)
Biceps Brachii 2.29 ± 3.05 (-0.06, 4.63) 1.19 ± 0.74 (0.62, 1.76)� 1.44 ± 0.75 (0.86, 2.02)¥
Triceps Brachii 3.91 ± 1.35 (2.88, 4.95) 3.85 ± 1.60 (2.62, 5.08) 3.79 ± 1.12 (2.93, 4.65)
Page 27 of 28
URL: http://mc.manuscriptcentral.com/rjsp
Journal of Sports Sciences
123456789101112131415161718192021222324252627282930313233343536373839404142434445464748495051525354555657585960

For Peer Review O
nly
26” Wheel 27.5” Wheel 29” Wheel
Mean ± sd (95% CI) Mean ± sd (95% CI) Mean ± sd (95% CI)
Full Lap
Gastrocnemius 68.50 ± 2.78 (66.37, 70.64) 66.28 ± 4.00 (63.21, 69.36) 67.35 ± 2.23 (65.64, 69.07)
Vastus Lateralis 57.66 ± 2.06 (56.08, 59.24) 57.26 ± 1.02 (56.47, 58.04) 57.26 ± 1.71 (55.95, 58.57)
Biceps Brachii 58.88 ± 5.39 (54.74, 63.03) 56.02 ± 7.12 (50.55, 61.49) 56.58 ± 5.70 (52.20, 60.96)
Triceps Brachii 62.48 ± 5.71 (58.09, 66.88) 61.44 ± 2.24 (59.71, 63.16) 61.10 ± 2.97 (58.82, 63.38)
Climb
Gastrocnemius 66.73 ± 4.27 (63.45, 70.01) 66.07 ± 3.98 (63.02, 69.13) 64.91 ± 2.43 (63.04, 66.78)
Vastus Lateralis 56.82 ± 2.87 (54.61, 59.03) 57.18 ± 1.89 (55.73, 58.64) 55.90 ± 1.74 (54.57, 57.24)
Biceps Brachii 57.08 ± 7.12 (51.61, 62.56) 54.02 ± 8.21 (47.11, 60.33) 52.75 ± 5.96 (48.17, 57.33)
Triceps Brachii 60.31 ± 6.84 (55.05, 65.56) 59.63 ± 3.90 (56.63, 62.63) 58.39 ± 4.04 (55.29, 61.50)
Descent
Gastrocnemius 69.68 ± 3.31 (67.13, 72.23) 66.91 ± 4.29 (63.61, 70.21) 68.28 ± 2.56 (66.31, 70.25)
Vastus Lateralis 58.05 ± 2.20 (56.36, 59.74) 57.34 ± 1.50 (56.19, 58.49) 57.64 ± 2.09 (56.03, 59.25)
Biceps Brachii 60.48 ± 6.21 (55.71, 65.25) 58.29 ± 7.99 (52.15, 64.44) 58.93 ± 6.04 (54.30, 63.57)
Triceps Brachii 64.45 ± 5.87 (59.93, 68.96) 63.38 ± 2.60 (61.38, 65.38) 63.31 ± 3.40 (60.70, 65.93)
Page 28 of 28
URL: http://mc.manuscriptcentral.com/rjsp
Journal of Sports Sciences
123456789101112131415161718192021222324252627282930313233343536373839404142434445464748495051525354555657585960