Embed Size (px)
Citation preview

1
2
3
4
5
6
789101112131415161718192021
22
23
24
25
26
27
28
29
30
31
32
33
34
35
36
37
38
39
40
41
42
43
44
45
46
47
NeuroImage xxx (2009) xxx–xxx
YNIMG-05886; No. of pages: 17; 4C: 10, 11
Contents lists available at ScienceDirect
NeuroImage
j ourna l homepage: www.e lsev ie r.com/ locate /yn img
ARTICLE IN PRESS
DPR
OOF
Evaluation of 14 nonlinear deformation algorithms applied to human brainMRI registration
Arno Klein a,⁎, Jesper Andersson b, Babak A. Ardekani c,d, John Ashburner e, Brian Avants f,Ming-Chang Chiang g, Gary E. Christensen h, Louis Collins i, Pierre Hellier j,k, Joo Hyun Song h,Mark Jenkinson b, Claude Lepage i, Daniel Rueckert m, Paul Thompson g, Tom Vercauteren n,l,Roger P. Woods o, J. John Mann a, Ramin V. Parsey a
a New York State Psychiatric Institute, Columbia University, NY, NY 10032, USAb FMRIB Centre, University of Oxford, Department of Clinical Neurology, John Radcliffe Hospital, Oxford OX3 9DU, UKc Nathan Kline Institute, Orangeburg, NY, 10962, USAd New York University School of Medicine, NY, NY 10016, USAe Functional Imaging Laboratory, Wellcome Trust Centre for Neuroimaging, London WC1N 3BG, UKf Penn Image Computing and Science Laboratory, Department of Radiology, University of Pennsylvania, Philadelphia, PA 19104–2644, USAg Laboratory of Neuro Imaging, UCLA School of Medicine, Los Angeles, CA 90095-7332, USAh Department of Electrical and Computer Engineering, University of Iowa, Iowa City, IA 52242, USAi McConnell Brain Imaging Center, Montreal Neurological Institute, Montreal, QC, Canada H3A 2B4j INRIA Rennes, Bretagne Atlantique Research Centre, Campus universitaire de Beaulieu, 35042 Rennes Cedex, Francek INSERM, Visages U746, IRISA, Campus de Beaulieu, Rennes, Francel NRIA Sophia Antipolis – Méditerranée, 06902 Sophia Antipolis, Francem Visual Information Processing, Department of Computing, Imperial College, London SW7 2BZ, UKn Mauna Kea Technologies, 75011 Paris, Franceo Department of Neurology, David Geffen School of Medicine at UCLA, Los Angeles, CA 90095, USA
UCO
⁎ Corresponding author.E-mail address: [email protected] (A. Klein).URL: http://www.binarybottle.com (A. Klein).
1053-8119/$ – see front matter © 2009 Published by Eldoi:10.1016/j.neuroimage.2008.12.037
Please cite this article as: Klein, A., et al.,NeuroImage (2009), doi:10.1016/j.neuroima
Ea b s t r a c t
a r t i c l e i n f oArticle history:
All fields of neuroscience t Received 7 October 2008Revised 8 December 2008Accepted 15 December 2008Available online xxxxRREC
That employ brain imaging need to communicate their results with reference toanatomical regions. In particular, comparative morphometry and group analysis of functional andphysiological data require coregistration of brains to establish correspondences across brain structures. Itis well established that linear registration of one brain to another is inadequate for aligning brain structures,so numerous algorithms have emerged to nonlinearly register brains to one another. This study is the largestevaluation of nonlinear deformation algorithms applied to brain image registration ever conducted. Fourteenalgorithms from laboratories around the world are evaluated using 8 different error measures. More than45,000 registrations between 80 manually labeled brains were performed by algorithms including: AIR,ANIMAL, ART, Diffeomorphic Demons, FNIRT, IRTK, JRD-fluid, ROMEO, SICLE, SyN, and four different SPM5algorithms (“SPM2-type” and regular Normalization, Unified Segmentation, and the DARTEL Toolbox). All ofthese registrations were preceded by linear registration between the same image pairs using FLIRT. One ofthe most significant findings of this study is that the relative performances of the registration methods undercomparison appear to be little affected by the choice of subject population, labeling protocol, and type ofoverlap measure. This is important because it suggests that the findings are generalizable to new subjectpopulations that are labeled or evaluated using different labeling protocols. Furthermore, we ranked the 14methods according to three completely independent analyses (permutation tests, one-way ANOVA tests, andindifference-zone ranking) and derived three almost identical top rankings of the methods. ART, SyN, IRTK,and SPM's DARTEL Toolbox gave the best results according to overlap and distance measures, with ART andSyN delivering the most consistently high accuracy across subjects and label sets.
© 2009 Published by Elsevier Inc.
N48
49
50
51
52
sevier Inc.
Evaluation of 14 nonlinearge.2008.12.037
Introduction
Brain mapping – mapping the structures, physiology, functions,and connectivity of brains in individuals and in different populations –is possible due to a diverse but often disconnected array of brainimaging technologies and analysis methods. To make the best use of
deformation algorithms applied to human brain MRI registration,

C
53
54
55
56
57
58
59
60
61
62
63
64
65
66
67
68
69
70
71
72
73
74
75
76
77
78
79
80
81
82
83
84
85
86
87
88
89
90
91
92
93
94
95
96
97
98
99
100
101
102
103
104
105
06
07
08
09
10
11
12
13
14
15
16
17
18
19
20
21
22
23
24
25
26
27
28
29
30
31
32
33 Q134
35
36
37
38
39
40
41
42
43
44
45
46
47
48
49
50
51
52
53
54
55
56
57
58
2 A. Klein et al. / NeuroImage xxx (2009) xxx–xxx
ARTICLE IN PRESS
CORR
E
brain image data, researchers have attempted for over 40 years toestablish a common reference frame such as a three-dimensionalcoordinate or labeling system to consistently and accurately commu-nicate the spatial relationships within the data (Talairach and Szikla,1967; Talairach and Tournoux, 1988; Drury et al., 1996; Fischl et al.,1999; Clouchoux et al., 2005). A common reference frame helps us to:
1. communicate and compare data (across subjects, time, conditions,and image types),
2. classify data (by meaningful spatial positions or extent), and3. findpatterns indata (to infer structural or functional relationships).
These three benefits are contingent on one serious premise:positions and sizes in one brain must correspond to positions andsizes in another brain to make comparisons.
This premise almost universally does not hold when brain imagedata are compared across individuals. The noise that this introduces isoften accepted by researchers who generally assume that if they havefound corresponding features across two brains, the interveningpoints between those features correspond to one another as well.Brains are so variable in shape that there simply may not exist a point-to-point correspondence across any two brains, or even in the samebrain over time.
Explicit manual labeling of brain regions is the preferred approachfor establishing anatomical correspondence, but it is too prohibitive interms of time and resources, particularly in cases where neuroana-tomists are not available, in intraoperative or other time-sensitivescenarios, and in high-throughput environments that need to processdozens to thousands of brain images.1
Automatically determining anatomical correspondence is almostuniversally done by registering brains to one another or to a template.There has been a proliferation of different approaches to performimage registration that demands a comparison to guide choicesregarding algorithms, software implementation, setup and para-meters, and data preprocessing options. To better enable individualsto make these choices, the Valmet software tool (http://www.ia.unc.edu/public/valmet/) (Gerig et al., 2001) and the Non-rigid ImageRegistration Evaluation Project (NIREP) (http://www.nirep.org) weredeveloped. The Windows-based Valmet was in 2001 the first publiclyavailable software tool for measuring (as well as visualizing) thedifferences between corresponding image segmentations, but hasreceived only one minor update since 2001 (in 2004). It uses severalalgorithms to compare segmentations: overlap ratio, Hausdorffdistance, surface distance, and probabilistic overlap. The NIREP project“has been started to develop, establish, maintain, and endorse astandardized set of relevant benchmarks and metrics for performanceevaluation of nonrigid image registration algorithms.” The initialphase of the project will include 16 manually labeled brain images (32labeled regions in 8men and 8women) and four evaluationmetrics: 1.relative overlap (equivalent to the “union overlap” defined in theMaterials and methods section), 2. variance of the registered intensityimages for an image population, 3. inverse consistency error betweena forward and reverse transformation between two images, and 4.transitivity (how well all the pairwise registrations of the imagepopulation satisfy the transitivity property).
UN 59
60
61
62
63
64
65
66
67
68
69
70
1 To indicate the level of investment required to manually label brain anatomy, theCenter for Morphometric Analysis (CMA) at the Massachusetts General Hospital (MGH)expects at least one month of training to train new technicians to the point ofacceptable inter-rater reliability using their Cardviews (Caviness et al., 1996) labelingprotocol and software; once trained, it takes hours to weeks to manually label a singlebrain. For 12 of the brains used in this study, a trained assistant took twoweeks to labeleach brain. At this rate, performing a modest imaging study with 20 subjects and 20controls would require 20 months devoted strictly to labeling. Manual labeling alsosuffers from inconsistencies within and across human labelers (Caviness et al., 1996;Fiez et al., 2000; Towle et al., 2003).
Please cite this article as: Klein, A., et al., Evaluation of 14 nonlinearNeuroImage (2009), doi:10.1016/j.neuroimage.2008.12.037
TEDPR
OOF
1In this study we set out to evaluate what we believe are the most1important nonlinear deformation algorithms that have been imple-1mented in fully automated software programs and applied to human1brain image registration. We measure accuracy at the scale of gross1morphological structures (gyri, sulci, and subcortical regions)1acquired by magnetic resonance imaging (MRI). There have been1two significant prior studies that comparedmore than three nonlinear1deformation algorithms for evaluating whole-brain registration.1The first was communicated in a series of publications by Hellier1et al. (2001a, 2002, 2003); they compared five different fully auto-1mated nonlinear brain image registration software programs using1the same set of quantitative measures. These included global1measures comparing 17 deformed MRI source images and one target1image: average brain volume, gray matter overlap, white matter1overlap, and correlation of a measure of curvature, and local measures1of distance and shape between corresponding principal sulci. Our1study includes a version of each of the five methods and is different1primarily because (1) all tests were conducted by a single individual1(the first author) who had not authored any of the software packages,1but received guidance from the principal architects of the respective1algorithms, (2) its focus is on manually labeled anatomical regions,1and (3) each and every brain was used as a source and as a target for1registration rather than selecting a single target.1The second is in a paper in press (Yassa and Stark, in press) that1compares nonlinear registration methods applied to regions in the1medial temporal lobe; six of the methods are fully automated and two1are semi-automated (requiring manual identification of landmarks;1see Supplementary section 1). They apply these methods either to1manually labeled brain regions, to weighted masks for these regions,1or to the original unlabeled brains, as in our study. The four methods1that they applied to unlabeled brains (and evaluated on regions in the1medial temporal lobe) are the Talairach piecewise linear approach1and three SPM programs (included in our study). Registering labeled1regions obviously requires that the regions be labeled; their ROI-AL1approach ‘labels to register’ rather than ‘registers to label’ or ‘registers1without labels.’ They used two evaluation measures on pairs of1images (20 MRI volumes total): an overlap measure (equivalent to the1“target overlap” defined in the Materials and methods section) and a1measure of blur in a group average of coregistered images.1What sets our study apart from both of these prior studies is the1unparalleled scale and thoroughness of the endeavor:
1• over 14 nonlinear algorithms1• each algorithm applied at least 2168 times (over 45,000 registra-1tions total)1• 80 manually labeled brain images1• 4 different whole-brain labeling protocols (56 to 128 labeled1regions)1• 8 different evaluation measures1• 3 independent analysis methods.
1This study evaluates 15 registration algorithms, one linear (FLIRT)1and 14 nonlinear: AIR, ANIMAL, ART, Diffeomorphic Demons, FNIRT,1IRTK, JRD-fluid, ROMEO, SICLE, SyN, and four different SPM51algorithms (“SPM2-type” and regular Normalization, Unified Segmen-1tation, and the DARTEL Toolbox; DARTEL was also run in a pairwise1manner and all four SPM algorithms were run with and without1removal of skulls from the images). The linear algorithmwas included1as an initialization step to establish a baseline prior to applying the1nonlinear algorithms. Comparisons among the algorithms and their1requirements are presented in Table 1 and in the Appendix B, software1commands are in Supplementary section 7, and brief descriptions are1in Supplementary section 8. Many of them are in common use for1registering structural MRIs to each other or to templates for1neuromorphometric research or as an intermediary to compare1functional or physiological data (Gholipour et al., 2007), but some of1them exist only as pre-release code made available by their respective
deformation algorithms applied to human brain MRI registration,

DPR
OOF
171
172
173
174
175
176
177
178
179
180
181
182
183
184
185
186
187
188
189
190
191
192
193
194
195
196
197
198
199
200
201
202
203
204
205
206
207
208
209
210
211
212
213
214
215
216
217
218
219
220
221
222
223
224
225
226
227
228
Table 1t1:1
Deformation model, approximate number of degrees of freedom (dof), similarity measure, and regularization method for each of the algorithms evaluated in this studyt1:2t1:3 Algorithm Deformation ⋍dof Similarity Regularization
t1:4 FLIRT Linear, rigid-body 9, 6 norm. CRt1:5 AIR 5th-order polynomial warps 168 MSD (opt. intensity scaling) Incremental increase of polynomial order;
MRes: sparse-to-fine voxel samplingt1:6 ANIMAL Local translations 69K CC MRes, local Gaussian smoothing; stiffness
parameter weights mean deformation vectorat each node
t1:7 ART FFD based on cubic splines(non-parametric, homeomorphic)
7 M norm. CC MRes median and low-pass Gaussian filtering
t1:8 Diffeomorphic Demons Non-parametric, diffeomorphicdisplacement field
21 M SSD MRes: Gaussian smoothing
t1:9 FNIRT Cubic B-splines 30 K SSD Membrane energy⁎ MRes: down- to up-sampling;number of basis components
t1:10 IRTK Cubic B-splines 1.4 M norm. MI None used in the study; MRes: control meshand image
t1:11 JRD-fluid Viscous fluid: variational calculus(diffeomorphic)
2 M Jensen–Rényi divergence Compressible viscous fluid governed by theNavier–Stokes equation for conservation ofmomentum; MRes
t1:12 ROMEO Local affine (12 dof) 2 M Displaced frame difference First-order explicit regularization method, brightnessconstancy constraint MRes: adaptive multigrid(octree subdivision), Gaussian smoothing
t1:13 SICLE 3-D Fourier series (diffeomorphic) 8 K SSD Small-deformation linear elasticity, inverseconsistency MRes: number of basis components
t1:14 SyN Bi-directional diffeomorphism 28 M CC MRes Gaussian smoothing of the velocity field,transformation symmetry
t1:15 SPM5:t1:16 “SPM2-type” Normalization Discrete cosine transforms 1 K MSD Bending energy, basis cutofft1:17 Normalization discrete cosine transforms 1 K MSD Bending energy, basis cutofft1:18 Unified Segmentation discrete cosine transforms 1 K Generative segmentation model Bending energy, basis cutofft1:19 DARTEL Toolbox finite difference model of a velocity
field (constant over time, diffeomorphic)6.4 M Multinomial model (“congealing”) Linear-elasticity; MRes: full-multigrid (recursive)
The dof is estimated based on the parameters and data used in the study; approximate equations, where available, are given in each algorithm's description in the Supplementarysection 8. Software requirements, input, and run time for the algorithms are in the Appendix B. ⁎Since this study was conducted, FNIRT uses bending energy as its defaultregularization method. MRes=multiresolution; norm=normalized; FFD=free-form deformation; MSD=mean squared difference; SSD=sum of squared differences; CC=cross-correlation; CR=correlation ratio; MI=mutual information.t1:20
3A. Klein et al. / NeuroImage xxx (2009) xxx–xxx
ARTICLE IN PRESS
UNCO
RREC
authors for this study. See the Algorithms excluded from the studysection for algorithms excluded from the study. Additional materialsand updated information will be made publicly available via thewebsite http://www.mindboggle.info/papers/.
Materials and methods
In this section, we first briefly describe the acquisition andpreparation of the brain image and label data. Then we outline thepreprocessing (brain extraction and formatting), linear registration,and nonlinear registration stages applied to the data, our evaluationmeasures, and our analysis methods. The first author performed theselatter steps on an OSX system (Mac Pro 2-Quad-Core (8-processor)Intel Xeon, 3 GHz, 6 GB RAM) with a 10.4 operating system, exceptwhere noted (see Supplementary section 7).Custom Python (http://www.python.org) andMatlab (http://www.mathworks.com) softwareprograms performed the preprocessing steps, called the differentprograms to process thousands of pairs of images, computed theresults for evaluation, and produced the visualizations in the Resultssection.
Data preparation: images, labels, brain extraction, and formatting
Image acquisition and manual labelsBrain image data (T1-weighted MRIs and corresponding manual
labels) for 80 normal subjects were acquired from four differentsources (see Fig. 1 and Table 2, and Caveats section regarding labelreliability):
LPBA40. 40 brain images and their labels used to construct the LONIProbabilistic Brain Atlas (LPBA40) at the Laboratory of Neuro Imaging(LONI) at UCLA (Shattuck et al., 2008) are available online (http://
Please cite this article as: Klein, A., et al., Evaluation of 14 nonlinearNeuroImage (2009), doi:10.1016/j.neuroimage.2008.12.037
TEwww.loni.ucla.edu/Atlases/Atlas_Detail.jsp?atlas_id=12). They werepreprocessed according to existing LONI protocols to produce skull-stripped brain volumes. These volumes were aligned to the MNI305atlas (Evans et al., 1993) using rigid-body transformation to correct forhead tilt and reduce bias in the manual labeling process. Thisproduced a transform from native space to labeling space and anassociated inverse transform. In each of the 40 subjects, 56 structuresweremanually labeled according to custom protocols (http://cms.loni.ucla.edu/NCRR/protocols.aspx?id=722) using BrainSuite software(http://brainsuite.usc.edu/). Brain masks were constructed from themanual labels and projected back to the native (labeling) space toproduce brain-only MRI volumes. These volumes were then correctedfor non-uniformity using BrainSuite's Bias Field Corrector. Sulci wereused as boundaries; white matter voxels that occurred between theboundaries of sulci and their surrounding gray matter were includedin the structure. This is the only dataset where white matter isincluded with gray-matter regions.
After all of the registrations were conducted, we found errors intwo of the LPBA40 subjects, particularly with the right putamen. Webrought this to LONI's notice and it is being corrected for futuredownloads. The impact of these errors on the present study appears tobe negligible, as may be seen in Figs. 7 and 13, where there appears tobe little difference between the average values for the left and rightputamen.
IBSR18. 18 brain images acquired at different laboratories are availablethrough the Internet Brain Segmentation Repository (http://www.cma.mgh.harvard.edu/ibsr/) as IBSR v2.0. The T1-weighted imageshave been rotated to be in Talairach alignment (Talairach andTournoux, 1988) and have been processed by the CMA (Center forMorphometric Analysis, Massachusetts General Hospital (MGH) inBoston) ‘autoseg’ bias field correction routines. They were manually
deformation algorithms applied to human brain MRI registration,

NCOR
RECT
EDPR
OOF
229
230
231
232
233
234
235
36
37
38
39
40
41
42
Fig. 1. Brain image data. The study used four different image datasets with a total of 80 brains. The datasets contain different numbers of subjects (n) and different numbers of labeledanatomical regions (r) derived from different labeling protocols: LPBA40 (LONI Probabilistic Brain Atlas: n=40, r=56), IBSR18 (Internet Brain Segmentation Repository: n=18, r=84),CUMC12 (Columbia University Medical Center: n=12, r=128), and MGH10 (Massachusetts General Hospital: n=10, r=74). A sample brain from each dataset is shown. For each brain,there are three columns (left to right): original T1-weighted MRI, extracted brain registered to nonlinear MNI152 space, and manual labels registered to nonlinear MNI152 space(used to extract the brain). Within each column the three rows (top to bottom) correspond to sagittal (front facing right), horizontal (front facing top, right on right side), and coronal(right on right side) views. The LPBA40 brains had already been extracted and registered toMNI (MNI305 vs. MNI152) space (Shattuck et al., 2008). The scale, position, and contrast ofthe MR images have been altered for the figure. The colors for themanual labels do not correspond across datasets. (For interpretation of the references to colour in this figure legend,the reader is referred to the web version of this article.)
4 A. Klein et al. / NeuroImage xxx (2009) xxx–xxx
ARTICLE IN PRESS
Ulabeled with NVM software (http://neuromorphometrics.org:8080/nvm/), resulting in 84 labeled regions.
CUMC12. 12 subjects were scanned at the Columbia UniversityMedical Center on a 1.5 T GE scanner. Images were resliced coronallyto a slice thickness of 3 mm, rotated into cardinal orientation, thensegmented and manually labeled by one technician trained accordingto the Cardviews labeling scheme (Caviness et al., 1996) created at
Please cite this article as: Klein, A., et al., Evaluation of 14 nonlinearNeuroImage (2009), doi:10.1016/j.neuroimage.2008.12.037
2the CMA, and implemented in Cardviews software (http://www.cma.2mgh.harvard.edu/manuals/parcellation/). The images have 1282labeled regions.
2MGH10.10 subjects were scanned at the MGH/MIT/HMS Athinoula A.2Martinos Center for Biomedical Imaging using a 3 T Siemens scanner2and standard head coil. The data were inhomogeneity-corrected,2affine-registered to the MNI152 template (Evans et al., 1992), and
deformation algorithms applied to human brain MRI registration,

243
244
245
246
247
248
249
250
251
252
253
254
255
256
257
258
259
260
261
262
263
264
265
266
267
268
269
270
271
272
273
274
275
276
277
278
279
280
281
282
283
284
285
286
287
288
289
290
291
292
293
294
295
296
Table 2t2:1
MRI acquisition parameterst2:2t2:3 Dataset Subjects Ages = mean Volume (mm) Voxel (mm) TR (ms) TE (ms) flip ∠t2:4 μ=mean
t2:5 LPBA40 40 (20 ♂, 20 ♀) 19–40 256×256×124 38=0.86×0.86×1.5 2 = 0.78 10–12.5 4.2–4.5 20°t2:6 μ=29.20 2=0.78×0.78×1.5t2:7 IBSR18 18 (14 , 4 ) 7–71 = 38.4 + 4 “juveniles” 256×256×128 8=0.94×0.94×1.5 6 = 0.84 1.5 4 = 1t2:8 6=0.84×0.84×1.5t2:9 μ=38.4+4 “juveniles” 4=1×1×1.5t2:10 CUMC12 12 (6 , 6 ) right-handed 26–41 256×256×124 0.86×0.86×1.5 34 5 45°t2:11 μ=32.7t2:12 MGH10 10 (4 , 6 ) 22–29 256×256×128 1×1×1.33 6.6 2.9 8°t2:13 μ=25.3
Dataset, number and ages of subjects, volume and voxel dimensions in native space, TR, TE, and flip angle. The imageswere registered to either the nonlinear MNI152 orMNI305 atlas(see text) in a 181×217×181 volume of 1 mm3 voxels.t2:14
5A. Klein et al. / NeuroImage xxx (2009) xxx–xxx
ARTICLE IN PRESS
ECsegmented using SPM2 software (Friston et al., 1995). The imageswere manually labeled by Tourville of Boston University usingGhosh's ASAP software (Nieto-Castanon et al., 2003); the labelingprotocol (Tourville and Guenther, 2003) is similar to Cardviews, andin the version used for this study produces 74 labeled regions.
Brain extractionTo register the brains with each other, we extracted each brain
from its whole-head image by constructing a mask from thecorresponding manually labeled image (see Fig. 1). However, sincewhitematter and cerebrospinal fluidwere not fully labeled in all of theimages, they had to be filled to create solid masks. For this, the non-background image in each sagittal slice was dilated by one pixel, anyholes were filled, and then the image was eroded by one pixel. Thisprocedure was repeated sequentially on the resulting volume for thecoronal, horizontal, and again for the sagittal slices, and resulted in avolume containing the filled brain mask. This manual label-basedskull-stripping procedure was performed on each MRI volume in theIBSR18, CUMC12, andMGH10 sets, but not for those in the LPBA40 set;the LPBA40 images had already been similarly prepared, but dilatedand eroded with a larger and spherical structural element (neighbor-hood) (Shattuck et al., 2008). All four SPM algorithmswere also run onwhole-head images.
File preparationAll image and label volumes were in right-handed orientation
and were converted to Analyze 7.5 (.img, .hdr) format (except forMINC format used by ANIMAL) because it was the most common
UNCO
RR
Fig. 2. Registration equations. The three stages of the study were to compute, apply, and evsource image Is to a target image It (both already in MNI space), resulting in a “linear source imEach nonlinear algorithm Ai then registered (warped) the linear source image to the same tanonlinear registration). We applied the linear transform to the source labels Ls to give the coproduce the final warped source labels L[s→t] t. Finally, we compared these labels to the m
Please cite this article as: Klein, A., et al., Evaluation of 14 nonlinearNeuroImage (2009), doi:10.1016/j.neuroimage.2008.12.037
TEDPR
OOFimage format accepted by the different software programs, and the
only format presently compatible with AIR, ART, JRD-fluid, and SICLE(see Appendix B). This itself was a cause of difficulties, because thedifferent software packages deal with Analyze header informationdifferently, in particular with respect to left–right flipping and originlocation. Because of this and because of discrepancies between brainand atlas origins for some of the data sets, origin and orientationinformation was removed from each of the image and label volumesusing FSL's “fslorient-deleteorient” and “fslchfiletype” commands.The NIfTI data format, accepted by most of the f/MRI softwarepackages, obviates these concerns and is recommended over theAnalyze format (http://nifti.nimh.nih.gov/). Exceptions to the abovesteps were made for SPM5's template-based algorithms (Normal-ization, Unified Segmentation, and DARTEL Toolbox, but not “SPM2-type” Normalization): Analyze images were flipped right-to-left toleft-handed orientation, and header orientation discrepancies werecorrected using spm_get_space.m (other algorithms were unaffectedafter the fslorient command above).
Some extra preparation had to be done to accommodate therecommendations for running the individual software packages (seeAppendix B), which included writing parameter files, intensitycorrection, padding, smoothing, and reorientation (in the case ofSPM).For example, parameter files were required for ROMEO, IRTK,and for each registration pair when using SICLE, and command-lineparameters had to be reset to make some of the programs run in lessthan an hour or so per registration. SICLE required considerable pre-paration: we wrote a Python script to generate the input parameterfiles and create output directories, normalized intensities in Matlab,
aluate registration transforms. To compute the transforms, we linearly registered eachage” Is→t as well as a linear transform Xs→t (a straight arrow denotes linear registration).rget image, generating a second, nonlinear transform X[s→t] t (a curved arrow denotesrresponding “linear source labels” Ls→t, and applied the nonlinear transform to Ls→t toanual labels for the target, Lt, using a set of evaluation measures Eq.
deformation algorithms applied to human brain MRI registration,

297
298
299
300
301
302
303
304
305
306
307
308
309
310
311
312
313
14
15
16
17
18
19
20
21
22
23
24
25
26
27
28
29
30
6 A. Klein et al. / NeuroImage xxx (2009) xxx–xxx
ARTICLE IN PRESS
and padded versions of all of the image volumes so that theirdimensions were divisible by 16 (e.g., 181×217×181 files were paddedto 224×224×192).
Linear registration as initialization
We linearly registered 40 of the brain images to a template usingFMRIB Software Library's (FSL) FLIRT (with the following settings:9-parameter, correlation ratio, trilinear interpolation; see Fig. 1). Thetemplate was the “nonlinear MNI152,” the nonlinear averagetemplate in MNI space used by FSL (MNI152_T1_1mm_brain:181×217×181 voxels, 1×1×1 mm/voxel). The remaining 40 imageswere from the LPBA40 set and had already been registered to theMNI305 atlas.
We then rigidly registered each of the 80 brains in MNI space, Is, toeach of the other brains in its group, It, again using FLIRT (6-parameter,correlation ratio, trilinear interpolation). This resulted in 2168 lineartransforms Xs→t and transformed images in MNI space Is→t (a straightarrow denotes linear registration), with 2088 of them representing
UNCO
RREC
Fig. 3. Overview. This diagram provides an overview of the study for a single nonlinear registr2. The three stages include linear registration, nonlinear registration, and evaluation (left toalong the left in four different versions: images, surfaces derived from the images, labels, andvolumes are shown as coronal slices for clarity). A source image Is is linearly then nonlinearlare applied to the corresponding source labels Ls. The resulting nonlinearly transformed labevolume overlap and volume similarity per region. The target surface St is intersected with thbetween each labeled region and all adjacent labeled regions are constructed from Lt and L[s→per region.
Please cite this article as: Klein, A., et al., Evaluation of 14 nonlinearNeuroImage (2009), doi:10.1016/j.neuroimage.2008.12.037
F
3non-identical source-target pairs (402+182+122+102−80). These3linearly transformed source images, or “linear source images,” serve3as the input to each of the algorithms under comparison.3We applied the above linear and rigid-body transforms (with3nearest-neighbor interpolation) to the corresponding manually3labeled volumes Ls, resulting in the “linear source labels” Ls→t below3(and in Figs. 2 and 3).
3Nonlinear registration
3Each of the nonlinear registration algorithms in the study then3registered each of the 2168 linear source images Is→t to its3corresponding target image It. We applied the resulting nonlinear3transformation X[s→t] t (with nearest-neighbor interpolation) to the3corresponding linear source labels Ls→t, producing warped source3labels L[s→t] t (a curved arrow denotes nonlinear registration). These3labels are compared against the manual labels of the target, Lt, for3evaluating registration performance. See Figs. 2 and 3 for the context3and Supplementary section 7 for the software commands used for
TEDPR
OO
ation algorithm, placing example preprocessed data from Fig.1 into the equations of Fig.right). The four different datasets (LBPA40, IBSR18, CUMC12, and MGH10) are alignedborders derived from the labels. A source and target are drawn from each version (imagey registered to a target image It. The linear and nonlinear transforms (Xs→t and X[s→t] t)ls L[s→t] t are compared against the target labels Lt. This comparison is used to calculatee target labels Lt and warped source labels L[s→t] t to calculate surface overlap. Borderst] t, and average distances between the resulting borders Bt and B[s→t] t are calculated
deformation algorithms applied to human brain MRI registration,

331
332
333
334
335
336
337
338
339
340
341
342
343
344
345
346
347
348
349
350
351
352353354
355
356357358
359
360
361
362
363364
365
366
367
368369370
371
372373374
375
376
377
378
379
380
381
382
383
384
385
386387388
389
390
391
392
393
394395
396
397
398
399
400
401
402
403
404
405
406
407
408
409
410
411
412
413
414 Q2415
416
417
418
419
Fig. 4. Overlap. This study uses volume and surface overlap, volume similarity, anddistance measures to evaluate the accuracy of registrations. The equations for the threeoverlapmeasures: target overlap, mean overlap, and union overlap use the terms in thisschematic Venn diagram of two partially overlapping objects, a source S and a target T.Their intersection is denoted by S∩T and their union by S∪T. S/T indicates the set(theoretic complement) of elements in S but not in T.
7A. Klein et al. / NeuroImage xxx (2009) xxx–xxx
ARTICLE IN PRESS
UNCO
RREC
each algorithm. Note that some structures were removed duringpreprocessing prior to computing the transforms, such as thecerebellum in the LPBA40 set, but were included when applying thetransforms to the source labels.
Evaluation measures
We used volume and surface overlap, volume similarity, anddistance measures to evaluate howwell individual anatomical regionsas well as total brain volumes register to one another. For this sectionand for Fig. 4, source S refers to a registered image to be comparedwith its registration target T (in our case, the warped source labelsL[s→t] t and the target labels Lt). These evaluation measures assumethe manual label sets are correct, or “silver standards.”
Volume overlapWe used three overlap agreement measures and two overlap error
measures, each quantifying some fraction of source S and target Tvolumes where their labels agree or disagree. For information onoverlap measures, including cases for multiple and fractional labels,see Crum et al. (2005). The first overlap agreement measure is the“target overlap,” TO, the intersection between two similarly labeledregions r in S and T divided by the volume of the region in T, where | |indicates volume computed as the number of voxels:
TOr =jSr \ Tr jjTr j : ð1Þ
Target overlap is a measure of sensitivity. When summed over a set ofmultiple labeled regions, we have the total overlap agreement measurefor a given registration:
TO =P
r jSr \ Tr jPr jTr j
: ð2Þ
Our second overlap agreement measure is the “mean overlap,”MO,a special case of the Kappa coefficient (Zijdenbos et al., 1994)sometimes called the Dice coefficient; it is the intersection dividedby the mean volume of the two regions, which may again be summedover multiple regions:
MO = 2P
r jSr \ Tr jPr jSrj + jTr jð Þ : ð3Þ
Please cite this article as: Klein, A., et al., Evaluation of 14 nonlinearNeuroImage (2009), doi:10.1016/j.neuroimage.2008.12.037
TEDPR
OOF
Our third overlap agreement measure is the “union overlap,” UO,or Jaccard coefficient (Gee et al., 1993; Jaccard, 1912), the intersectionover the union:
UO =P
r jSr \ Tr jPr jSr [ Tr j : ð4Þ
UO can be converted to MO by the following (Heckemann et al.,2006):
MO =2×UO1 +UO
: ð5Þ
To complement the above agreement measures, we also computedfalse negative (FN) and false positive (FP) errors. For these errors wecharacterize the source as a tentative set of labels for the target, andagain assume that the target's manual labels are correct. These errormeasures can range from zero to one; a value of zero is achieved forperfect overlap.
A false negative error for a given region is the measure of howmuch of that region is incorrectly labeled. It is computed as thevolume of a target region outside the corresponding source regiondivided by the volume of the target region. As before, it is computed invoxels and summed over a set of multiple labeled regions each withindex r:
FN =P
r jTr=Sr jPr jTrj
ð6Þ
where Tr/Sr indicates the set (theoretic complement) of elements in Trbut not in Sr.
A false positive error for a given region is themeasure of howmuchof the volume outside that region is incorrectly assigned that region'slabel. It is computed as the volume of a source region outside thecorresponding target region divided by the volume of the sourceregion:
FP =P
r jSr=Tr jPr jSr j
: ð7Þ
Surface overlapWe anticipated that imaging artifacts affecting cortical thickness
could bias our overlap measures, because (for the same cortical area)thicker regions will have relatively higher volume overlap agree-ments than thinner regions due to lower surface-to-volume ratios.We tried to reduce this bias by computing overlap agreement only onthe target surfaces of the brain images, not throughout the entiretarget volumes. Computing overlap agreement on the surfaces shouldalso decrease the impact of segmentation biases, when manual labelsextend into white matter, especially for the LPBA40 set, where whitematter between sulcal structures were also assigned the structures'labels.
We used Freesurfer software (http://surfer.nmr.mgh.harvard.edu/,version 1.41) to construct cerebral cortical surfaces (Dale et al., 1999)for each of the original 80 full-head images, and converted theFreesurfer-generated surfaces to each brain's native space withFreesurfer's “mri_surf2vol” command. We then linearly registeredeach surface to MNI space using the initial affine transform from theoriginal brain image to the MNI template (Supplementary section 2).Each resulting target surface was intersected with its correspondingtarget label volume Lt and warped source label volume L[s→t] t. Wecompared these target surface labels with the warped source surfacelabels using the same overlap agreement and error measures used forthe volumes.
deformation algorithms applied to human brain MRI registration,

C
420
421
422
423
424
425
426
427
428429
430
431
432
433
434
435
436
437
438439440
441
442
443
444
445
446
447
448
449
450
451
452
453
454
455
456
457
458
459
460
461
462
463
464
465
466
467
468
469
470
471
472
73
74
75
76
77
78
79
80
81
82
83
84
85
86
87
88
89
90
91
92
93
94
95
96
97
98
99
00
01
02
03
04
05
06
07
08
09
10
11
12
13
14
15
16
17
18
19
20
21
22
23
24
25
26
27
28
29
30
31
8 A. Klein et al. / NeuroImage xxx (2009) xxx–xxx
ARTICLE IN PRESS
UNCO
RRE
Volume similarityThe volume similarity coefficient, VS, is a measure of the similarity
between source and target volumes. Although this measure does notreflect registration accuracy (source and target regions can be disjointand still have equal volumes), it is a conventional measure includedfor retrospective evaluation of prior studies. It is equal to thedifferences between two volumes divided by their mean volume,here again summed over multiple regions:
VS = 2P
r jSr j−jTr jð ÞPr jSr j + jTr jð Þ : ð8Þ
Distance errorThe above overlap and volume similarity measures do not
explicitly account for boundary discrepancies between correspondingsource and target regions. So we chose our final evaluation measure,DE, the average distance error. DE is equal to the minimum distance,mindist, from each source region boundary point, SrBp, to the entireset of points making up the target region boundary, TrB, averagedacross P points:
DEr =1P
XP
p = 1
mindist SrBp; TrB� �
: ð9Þ
We extracted an approximation of the boundary points for eachregion of each of the 40 LPBA40 brains by applying a cityblockdistance transform2 in Matlab and retaining only those voxels ofneighboring regions that were within two voxels from the region.This resulted not in a complete shell about a region, but only theportion of the shell abutting other labeled regions. We repeated thisprocedure for each region of each of the warped LPBA40 source labelsgenerated by each registration algorithm. We chose to constructborders from the warped labels rather than warp borders constructedfrom the original labels because we were concerned about interpola-tion artifacts.
We applied the same distance function used to construct theborders to also compute DE between source and target borders. Wecomputed DE for each region as well as for the entire set of labelboundaries as a whole.
Analysis
Testing for significant differences in the performance of theregistration methods is not trivial because of non-independency ofsamples. For example, for the LPBA40 dataset, each of the 40 brainimages was registered to the 39 others, resulting in 1560 pairwiseregistrations. Each of the brains is represented 39 times as theregistration source and 39 times as the target. Because each brain isreused multiple times, independence of observations cannot beassumed. We determined that for most of the registration methods,there is a high correlation between overlap results obtained for pairsthat share one or more brains (see Supplementary section 6).
To get around this issue of non-independency of samples, weconducted two separate statistical tests, a permutation test and a one-way ANOVA test, on a small independent sample, and repeated thesetests on multiple such samples. We also conducted an indifference-zone ranking on the entire set of results, testing for practical ratherthan statistical significance (see below). For each test, the underlyingmeasure is target overlap averaged across all regions.
32
33 Q32 bwdist.m in the Image Processing toolbox uses the two-pass, sequential scanning
algorithm (Rosenfeld and Pfaltz, 1966; Paglieroni, 1992).
Please cite this article as: Klein, A., et al., Evaluation of 14 nonlinearNeuroImage (2009), doi:10.1016/j.neuroimage.2008.12.037
TEDPR
OOF
4Permutation tests4We performed permutation tests to determine if the means of a4small set of independent overlap values obtained by each of the4registration methods are the same, after Menke and Martinez (2004)4and according to the following permutation algorithm:
41. Select a subset of P independent brain pairs42. Select a pair of methods (two vectors of P total overlap values)43. Subtract the two vectors and compute the mean difference D44. Select a subset of the elements from one of the vectors45. Swap this subset across the two vectors46. Subtract the resulting vectors; compute the mean difference Dp
47. Repeat steps #4–6 N times48. Count the number of times n where3 abs(Dp)≥abs(D)49. Compute the exact p-value: p = n
N410. Repeat steps #1–9; compute the fraction of times where p≤0.05.
4The subset of brain pairs was selected so that each brain was used4only once, corresponding to the “no dependence” condition in4Supplementary section 6. There were 20, 9, 6, and 5 independent4brain pairs for the LPBA40, IBSR18, CUMC12, and MGH10 datasets,4respectively, as well as 20, 9, 6, and 5 corresponding average target4overlap values obtained by each method.4The number of permutations N for each subset of brain pairs was4either the exhaustive set of all possible permutations (212=4096 for4CUMC12 and 210=1024 for MGH10) or 1000 permutations (LPBA404and IBSR18) to keep the duration of the tests under 24 h. The number4of p-values calculated was either 100,000 (CUMC12 and MGH10) or410,000 (LPBA40 and IBSR18).
5One-way ANOVA5We also performed a standard one-way ANOVA to test if themeans5of similar subsets of independent average target overlap values5obtained by each of the registration methods are the same. We then5subjected these results to a multiple comparison test using Bonferroni5correction to determine which pairs of means are significantly5different (disjoint 95% confidence intervals about the means, based5on critical values from the t distribution). We repeated these ANOVA5andmultiple comparison tests 20 times, each time randomly selecting5independent samples from each of the datasets. These tests are not5expected to be as accurate as the permutation tests because some of5the overlap values have skew distributions and because the p-values5are not exact.
5Indifference-zone ranking5Our third evaluation between methods tested practical signifi-5cance rather than statistical significance. For example, if a region is5registered to another region of equal volume and results in an offset of5a single voxel, this is not considered a significant misregistration, but5offsets greater than this are considered significant. An evaluation5measure of registration accuracy for a given region within a given5brain pair is calculated for two different registration methods. If these5two values are within delta of one another (referred to as an5“indifference zone” when ranking tebechhofer-single-sample-1954),5they are considered equal. The delta must correspond to a practical5difference in registration. If wemodel a region as a cube, then a single-5voxel offset along the normal to one of its faces wouldmean the voxels5on that face of the cube reside outside of its target — this is equal to5one-sixth of its surface. We therefore set delta to one-sixth of a target5region's surface. For the IBSR18, CUMC12, and MGH10 datasets, we5assumed the surface to be that of a cube (6×edge2−12×edge, where5edge=the edge length of a cube with the volume of the target region,5in voxels). For the LPBA40 dataset, we set the surface to the number of5voxels bordering adjacent regions, extracted as in Supplementary5section 4.
3 abs() = absolute value.
deformation algorithms applied to human brain MRI registration,

534
535
536
537
538
539
540
541
542
543
544
545
546
547
548
549
550
551
552
553
554
555
556
557
558
559
560
561
562
563
9A. Klein et al. / NeuroImage xxx (2009) xxx–xxx
ARTICLE IN PRESS
Our implementation of indifference-zone ranking compared the 15different registration methods to each other in the following manner.For each of region in a given label set and for each pair of registeredbrains we constructed a 15×15 matrix, where each row and eachcolumn corresponded to a registration method. Each element of thematrix was assigned the value −1, 0, or 1, for the cases when theevaluation measure for the method corresponding to its row was atleast delta less than, within delta of, or at least delta greater than thatof the method corresponding to its column. Then we calculated themean of these {−1,0,1} values across all registration pairs for eachregion to construct Figs. 7, 8, 9, and 10 (the latter three in Supplemen-tary section 3).
Results
Results for the initial run are in Supplementary section 1, the trivialcase, where each brain was registered to itself, are in Supplementary
UNCO
RREC
Fig. 5. Overlap by registration method. These box and whisker plots show the target overlapthe regions in each label set (LPBA40, IBSR18, CUMC12, and MGH10) then across brain pairs.quartile, median, and upper quartile values; whiskers extend from each end of the box to thehave values beyond the ends of the whiskers. Target, union and mean overlap measures for vproduced results that are almost identical if corrected for baseline discrepancies. Similaritieshere across the label sets. (SPM_N⁎=“SPM2-type” normalization, SPM_N=SPM's Normalize
Please cite this article as: Klein, A., et al., Evaluation of 14 nonlinearNeuroImage (2009), doi:10.1016/j.neuroimage.2008.12.037
section 2, volume similarity results are in Supplementary section 4,and distance error results are in Supplementary section 5.
Overlap results
Whole-brain averagesAfter the initial run and changes described in Supplementary
section 1, out of 2168 registrations per algorithm, the only cases wheretarget overlap values were less than 25% were SPM's DARTEL (79cases; the majority were from one brain) Normalize (15 cases),ANIMAL (2 cases), and ROMEO (1 case) for the LPBA40 set andDiffeomorphic Demons (1 case) for the IBSR18 set.
The target, union, and mean overlap values for volumes as well assurfaces (and the inverse of their false positive and false negativevalues), averaged over all regions, gave almost identical results whencorrected for baseline discrepancies. Distributions of target overlapvalues are shown in Fig. 5. What is remarkable is that the relative
TEDPR
OOF
measures between deformed source and target label volumes averaged first across all ofEach box represents values obtained by a registration method and has lines at the lowermost extreme values within 1.5 times the interquartile range from the box. Outliers (+)olumes and surfaces (and the inverse of their false positive and false negative values) allbetween relative performances of the different registration methods can even be seen
, SPM_US=Unified Segmentation, SPM_D=DARTEL pairwise).
deformation algorithms applied to human brain MRI registration,

564
565
566
567
568
569
70
71
72
73
74
75
10 A. Klein et al. / NeuroImage xxx (2009) xxx–xxx
ARTICLE IN PRESS
performances of these methods appear to be robust not just to type ofoverlap measure, but also to subject population and labeling protocol,as evidenced by the similar pattern of performances of the methodsacross the label sets. This is particularly the case across IBSR18,CUMC12, and MGH10 sets. The pattern is more subtle in LPBA40because that label set has fewer labeled regions that are larger and
UNCO
RREC
Fig. 6. Volume and surface overlap by registration method: LPBA40 regions. These brain imagand (B) surface of each LPBA40 region, and depicts that mean as a color (blue indicates highebrains, seen from the left, looking down from 30°, with the frontal pole facing left. (SPSPM_D=DARTEL pairwise).
Please cite this article as: Klein, A., et al., Evaluation of 14 nonlinearNeuroImage (2009), doi:10.1016/j.neuroimage.2008.12.037
5extend into white matter, and therefore results in higher and more5similar absolute overlap values.5We ran all 2168 registrations again on whole-head images (before5skull-stripping) using SPM's Normalize, Unified Segmentation, and5DARTEL, and the results were comparable or better with the skull-5stripped images. The relative overlap performance of the SPM pro-
TEDPR
OOF
es show themean target overlap calculated across all 1560 brain pairs for the (A) volumer accuracy). The values for each registration method are projected on one of the LPBA40M_N⁎=“SPM2-type” Normalize, SPM_N=Normalize, SPM_US=Unified Segmentation,
deformation algorithms applied to human brain MRI registration,
576
577
578
579
580
581
11A. Klein et al. / NeuroImage xxx (2009) xxx–xxx
ARTICLE IN PRESS
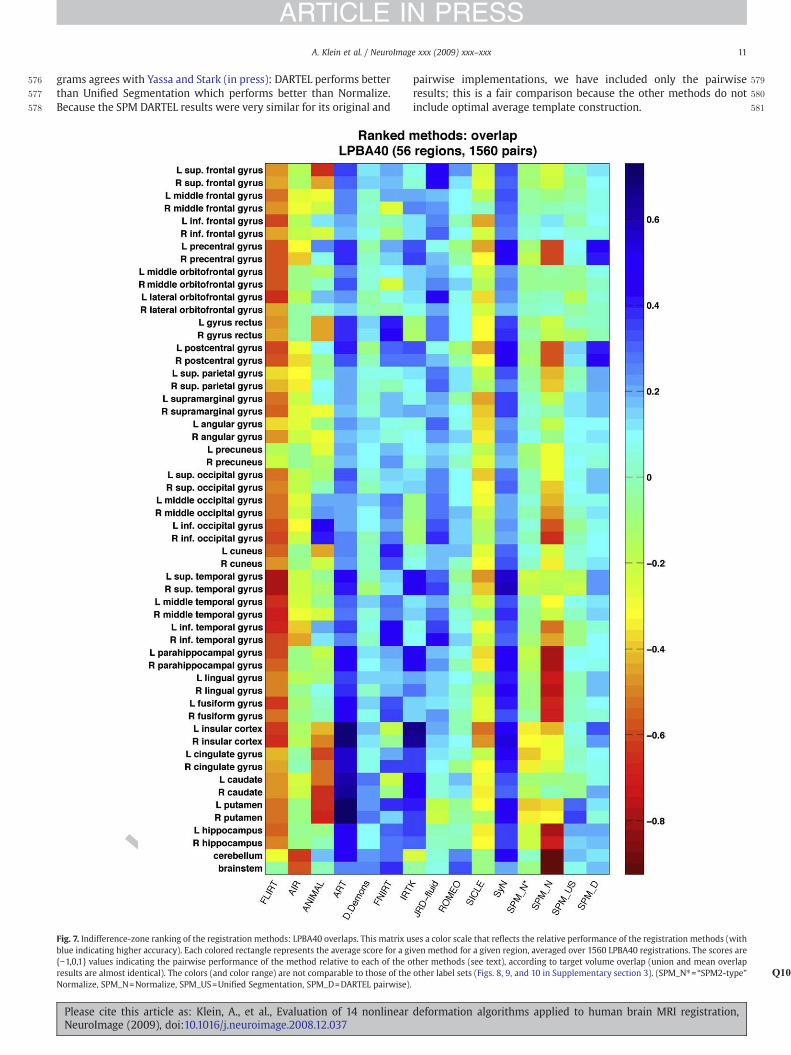
grams agrees with Yassa and Stark (in press): DARTEL performs betterthan Unified Segmentation which performs better than Normalize.Because the SPM DARTEL results were very similar for its original and
UNCO
RREC
Fig. 7. Indifference-zone ranking of the registration methods: LPBA40 overlaps. This matrix ublue indicating higher accuracy). Each colored rectangle represents the average score for a gi{−1,0,1} values indicating the pairwise performance of the method relative to each of the oresults are almost identical). The colors (and color range) are not comparable to those of theNormalize, SPM_N=Normalize, SPM_US=Unified Segmentation, SPM_D=DARTEL pairwise).
Please cite this article as: Klein, A., et al., Evaluation of 14 nonlinearNeuroImage (2009), doi:10.1016/j.neuroimage.2008.12.037
pairwise implementations, we have included only the pairwiseresults; this is a fair comparison because the other methods do notinclude optimal average template construction.
TEDPR
OOF
ses a color scale that reflects the relative performance of the registration methods (withven method for a given region, averaged over 1560 LPBA40 registrations. The scores arether methods (see text), according to target volume overlap (union and mean overlapother label sets (Figs. 8, 9, and 10 Q10in Supplementary section 3). (SPM_N⁎=“SPM2-type”
deformation algorithms applied to human brain MRI registration,

C
F
582
583
584
585
586
587
588
589
590
591
592
593
594
595Q4596
597
598
599
600
601
602
603
604
605
606
607
608
609
610
611
612
613
614
615
616
617
618
619
20
21
22
23
24
25
26
27
28
29
30
31
32
33
34
35
36
37
38
39
40
41
42
43
44
45
46
47
48
49
50
51
52
53
54
55
56
57
58
Table 3t3:1
Permutation test ranking of the registration methods by label sett3:2t3:3 LPBA40 μ (SD) IBSR18 μ (SD) CUMC12 μ (SD) MGH10 μ (SD)
t3:4 Rank 1 ART .82 (.35) SPM_D .83 (.27) SPM_D .76 (.24) SyN .77 (.37)t3:5 SyN .60 (.38) SyN .72 (.51) SyN .74 (.51) ART .72 (.45)t3:6 FNIRT .49 (.66) IRTK .67 (.53) IRTK .74 (.50) IRTK .61 (.51)t3:7 JRD-fluid .49 (.66) ART .60 (.70) ART .60 (.70)t3:8 2 IRTK .43 (.63) JRD-fluid .30 (.82) SPM_D .27 (.23)t3:9 D. Demons .13 (.82) D. Demons .27 (.69)t3:10 SPM_US .11 (.83) JRD-fluid .24 (.66)t3:11 ROMEO .06 (.63)t3:12 3 ROMEO .08 (.73) FNIRT .16 (.82) D. Demons .20 (.84)t3:13 SPM_D .07 (.29) D. Demons .05 (.84) FNIRT .18 (.81)t3:14 JRD-fluid .17 (.81)
This table lists the methods that attained the top three ranks after conducting permutation tests between mean target overlaps (averaged across regions) for each pair of methods,then calculating the percentage of p-values less than or equal to 0.05 (of 100,000 tests for CUMC12 and MGH10 or of 10,000 tests for LPBA40 and IBSR18; μ=mean, SD=standarddeviation). Methods within ranks 1, 2, and 3 have positive mean percentages lying within one, two, and three standard deviations of the highest mean, respectively. Values are notcomparable across label sets (columns). (SPM_D=DARTEL pairwise).t3:15
12 A. Klein et al. / NeuroImage xxx (2009) xxx–xxx
ARTICLE IN PRESS
UNCO
RRE
Region-based resultsThe pattern of region-based overlap values is almost indistinguish-
able across the methods, discounting baseline differences (data notshown). In Fig. 6 we present volume and surface target overlap datafor individual regions in their anatomical context (LPBA40 set). For themost part this figure suggests that the overlap values are approxi-mately the same for volume and surface measures, corroboratingwhole-brain averages, but also exposes discrepancies at the level ofregions (FLIRT and SICLE)4.
Most of the regions in the brain volume plots are hidden fromview,so for a complete picture at the scale of individual regions, Figs. 7, 8, 9,and 10 present relative performances of the different methods foreach region as color-coded tables for each of the four label sets (theirconstruction is described in Supplementary section 3; Figs. 8, 9, and 10are in Supplementary section 3). If all of the methods had performedequally well, the color tableswould be a uniform color. However, someof the methods performed better than average, particularly againstsimple linear registration (FLIRT). By visual inspection, we can see thatART, IRTK, SyN, and SPM's DARTEL have consistently high accuracy forthe IBSR18, CUMC12, and MGH10 label sets relative to the othermethods, and that in addition to ART, IRTK, and SyN, FNIRT and JRD-fluid also appear to have high relative accuracy for the LPBA40 set. Asexpected, we observed for all of the methods higher overlap values forlarger sized regions, because of smaller surface-to-volume ratios (notshown).
Rankings
We ranked the registration methods in three independent ways:permutation tests (One-was ANOVA), confidence intervals obtainedfrom one-way ANOVA tests with Bonferroni correction (One-wasANOVA), and indifference-zone ranking (Indifference-zone ranking).
Permutation, ANOVA, and indifference-zone rankingsTable 3 presents the top three ranks of registration methods
according to the percentage of permutation tests whose p-valueswere less than or equal to 0.05, and Table 4 according to relative targetoverlap scores. For both tables, members within ranks 1, 2, and 3 havemean percentages lying within one, two, and three standarddeviations of the highest mean, respectively. Only ART and SyN arein the top rank for all four label sets and for all tests.
59
60
61
62
63
64
4 The worse surface overlaps of the cerebellum (for all the methods except ROMEO)are probably due to the fact that the cerebellum was removed from the LPBA40 setprior to computing the registration transforms, but the transforms were applied to thefull label set (including the cerebellum).
Please cite this article as: Klein, A., et al., Evaluation of 14 nonlinearNeuroImage (2009), doi:10.1016/j.neuroimage.2008.12.037
TEDPR
OO
6For the one-way ANOVA tests, rank 1 methods have means lying6within the 95% confidence interval of the best method and rank 26methods have confidence intervals that overlap the confidence6interval of the best method. These rankings were in almost complete6agreement among the target, union, and mean overlap values (and6distance errors for the LPBA40 set). Because these results were very6similar to the permutation test ranks, and because these tests are6expected to be less accurate than the permutation tests, they are not6included.
6Discussion
6This study evaluates 15 registration algorithms (one linear, 146nonlinear) based primarily on overlap measures of manually labeled6anatomical regions. The scale and thoroughness are unprecedented6(over 45,000 registrations, 80 manually labeled brain images6representing 4 different labeling protocols, 8 different evaluation6measures, and 3 independent analysis methods). We hope that the6method of evaluation as well as the results will be useful to the6neuroscience community. As they become available, additional6materials and updated information will be made publicly available6via the website http://www.mindboggle.info/papers/.6One of the most significant findings of this study is that the6relative performances of the registration methods under comparison6appear to be little affected by the choice of subject population,6labeling protocol, and type of overlap measure. This is important6because it suggests that the findings are generalizable to new healthy6subject populations that are labeled or evaluated using different6labeling protocols. Furthermore, we ranked the methods according to6three completely independent analyses and derived three almost6identical top rankings. However, in order to make recommendations,6it is important to place these results in the context of the wider range6of software packages available and the caveats inherent in registra-6tion in general and with respect to this study in particular, as we do6below.6Although we were not able to see a pattern in the results that6would allow us to rank algorithms by deformation model, similarity6measure, or regularization method, there is a modest correlation6between the number of degrees of freedom of the deformation and6registration accuracy (0.29, or 0.45 if one excludes Diffeomorphic6Demons), and between the number of degrees of freedom and year6(0.55) (see Table 5). This finding corroborates Hellier's evaluation:6“The global measures used show that the quality of the registration is6directly related to the transformation's degrees of freedom” (Hellier6et al., 2003). The four algorithms whose mean rank is less than two6(SyN, ART, IRTK, and SPM's DARTEL Toolbox) all have millions of6degrees of freedom and all took at least 15 min per registration, and
deformation algorithms applied to human brain MRI registration,

665
666
667
668
669
670
671
672
673
674
675
676
677
678
679
680
681
682
683
684
685
686
687
688
689
690
691
692
693
694
695
696
697
698
699
700
701
702
703
704
705
706
707
708
709
710
711
712
713
t5:1
t5:2t5:3
t5:4
t5:5
t5:6
t5:7
t5:8
t5:9
t5:10
t5:11
t5:12
t5:13
t5:14
t5:15
t5:16
t5:17
t5:18
Table 4t4:1
Indifference-zone ranking of the registration methods by label sett4:2t4:3 LPBA40 μ (SD) IBSR18 μ (SD) CUMC12 μ (SD) MGH10 μ (SD)
t4:4 Rank 1 ART .35 (.07) SPM_D .50 (.19) SPM_D .47 (.17) SyN .39 (.06)t4:5 SyN .34 (.24) SyN .40 (.12) IRTK .42 (.07) ART .36 (.07)t4:6 IRTK .35 (.15) SyN .41 (.06)t4:7 ART .33 (.08) ART .35 (.05)t4:8 2 JRD-fluid .18 (.13)t4:9 3 JRD-fluid .20 (.08) FNIRT .06 (.11) JRD-fluid .07 (.07) IRTK .26 (.07)t4:10 IRTK .18 (.15) D. Demons .01 (.08) FNIRT .07 (.09) SPM_D .25 (.28)t4:11 FNIRT .17 (.08) ROMEO .01 (.28) D. Demons .05 (.05)t4:12 SPM_D .14 (.31)
This table lists the methods that attained the top three ranks after averaging scores across all brain regions then across all registration pairs (μ=mean, SD=standard deviation). Thescores reflect a pairwise comparison between methods, according to target overlap (see text). Methods within ranks 1, 2, and 3 have positive means lying within one, two, and threestandard deviations of the highest mean, respectively. Values are not comparable across label sets (columns). (SPM_D=DARTEL pairwise).t4:13
13A. Klein et al. / NeuroImage xxx (2009) xxx–xxx
ARTICLE IN PRESS
ECall but one (IRTK) were created in the last three years. Of theremaining 10 algorithms, seven have fewer than a million degrees offreedom, seven took less than 15 min, and six were created overthree years ago.
Algorithms excluded from the study
We excluded semi-automated approaches that require evenminimal manual intervention to reduce bias. A significant exampleis the forerunner of modern nonlinear registration methods, theoriginal Talairach coordinate referencing system (Talairach and Szikla,1967; Talairach and Tournoux, 1988), a piece-wise linear registrationmethod that requires the identification of landmarks in a brain image.Although the Talairach system is well suited to labeling regionsproximal to these landmarks (Grachev et al., 1998), it does not dealadequatelywith nonlinearmorphological differences, especiallywhenapplied to the highly variable cortex (Grachev et al., 1999; Mandl et al.,2000; Roland et al., 1997; Xiong et al., 2000). Other examples thatrequire landmarks includemodern nonlinear algorithms such as LargeDeformation Diffeomorphic Metric Mapping (personal communica-tionwithMichael Miller) (Beg et al., 2005) and Caret (http://brainmap.wustl.edu/, personal communicationwith David Van Essen and DonnaDierker) (Essen et al., 2001).
We also excluded some of the primary software programs forautomatically labeling cortical anatomy: Freesurfer (http://surfer.nmr.mgh.harvard.edu/) (Fischl et al., 2002, 2004), BrainVisa (http://
UNCO
RR 714
715
716
717
718
719
720
721
722
723
724
725
726
727
728
729
730
731
732
733
734
735
Table 5Mean rank, degrees of freedom (dof), average run time, and year of publication for eachalgorithm
Algorithm Mean rank dof Run time: min Year
SyN 1.00 28 M 77 (15.1) 2008ART 1.00 7 M 20.1 (1.6) [Linux] 2005IRTK 1.63 1.4 M 120.8 (29.3) 1999SPM5 DARTEL Toolbox 1.88 6.4 M 71.8 (6.3) 2007JRD-fluid 2.50 2 M 17.1 (1.0) [Solaris] 2007Diffeomorphic Demons 3.00 21 M 8.7 (1.2) 2007FNIRT 3.00 30 K 29.1 (6.0) 2008ROMEO 3.50 2 M 7.5 (0.5) 2001ANIMAL 69 K 11.2 (0.4) 1994SICLE 8 K 33.5 (6.6) 1999SPM5 Unified Segmentation 1 K ⋍1 2005“SPM2-type” Normalize 1 K ⋍1 1999SPM5 Normalize 1 K ⋍1 1999AIR 168 6.7 (1.5) 1998
The 14 nonlinear deformation algorithms are ordered bymean rank (best at top), whichwas computed for each algorithm by averaging the target overlap ranks in Tables 3 and 4(assigned by the permutation tests and indifference-zone rankings). The six algorithmsat the bottom are of equal rank (4) since they were not in the top three ranks. For detailson architecture and run time, see Appendix B. Except for FNIRT and DiffeomorphicDemons, the dof and mean rank sequences roughly match.
Please cite this article as: Klein, A., et al., Evaluation of 14 nonlinearNeuroImage (2009), doi:10.1016/j.neuroimage.2008.12.037
TEDPR
OOFbrainvisa.info) (Cointepas et al., 2001), HAMMER (https://www.rad.
upenn.edu/sbia/software/index.html) (Shen and Davatzikos, 2002),and Mindboggle (http://www.mindboggle.info) (Klein and Hirsch,2005; Klein et al., 2005), because their cortical labeling algorithmsare tied to their own labeled brain atlas(es). We considered thisproblematic for three reasons: (1) we wanted to evaluate brainregistration algorithms, not brain labeling algorithms or particularatlas-based approaches, (2) their atlas labels are inconsistent withthe protocols used to label the brains in this study which wouldmake evaluation difficult, and (3) creating new atlases for each ofthese requires considerable knowledge of the software. Freesurferand BrainVisa differ from all of the other methods mentioned in thispaper because they register surfaces rather than image volumes.Mindboggle differs from the others because it is based oncombinatoric feature-matching and uses multiple independentatlases. And of the four, HAMMER is the only one that can transforman arbitrary set of labels when registering a source brain to a targetbrain. However, because we were not able to obtain reasonableresults, we did not include it in the study. We also tested the PASHAalgorithm (Cachier et al., 2003) with and without intensity normal-ization but because we obtained very inconsistent results across thedatasets we decided not to include it in the study either. We alsoexcluded other programs that do not allow one to apply transformsto separate image volumes.
Caveats
General caveatsThere are numerous caveats that must be taken into account
when evaluating registration data. The very question of correspon-dence between brains that we raised at the beginning of this paper isrevisited at every stage: at the level of anatomy, image acquisition,image processing, registration (including similarity measure, trans-formation model, regularization method, etc.), evaluation measures,and analysis based on these measures. We will focus here on themost fundamental level of correspondence, at the primary levelof anatomy, and on the effects of registration on anatomicalcorrespondence.
If we consider the scale of gross anatomy or patterns of functionalactivity or physiological data, then we may seek correspondences atthe level of topographical, functional, or physiological boundarieswithout assuming one-to-onemapping of the points of the boundariesor the points within these regions of interest. In other words, anotherway of approaching this “correspondence problem,” and by extensionthe elusive common reference frame, is as a partial mapping betweenbrains, independent of naming or spatial conventions. The commonreference frame is used simply as a reference of comparison orevaluation, not as a rigid framework for comprehensively annotatingbrain image data, as is often done.
deformation algorithms applied to human brain MRI registration,

C
736
737
738
739
740
741
742
743
744
745
746
747
748
749
750
751
752
753
754
755
756
757
758
759
760
761
762
763
764
765
766
767
768
769
770
771
772
773
774
775
776
777
778
779
780
781
782
783
784
785
786
787
788
789
790
791
792
793
794
795
796
797
798
799
800
01
02
03
04
05
06
07
08
09
10
11
12
13
14
15
16
17
18
19
20
21
22
23
24
25
26
27
28
29
30
31
32
33
34
35
36
37
38
39
40
41
42
43
44
45
46
47
48
49
50
51
52
53
54
55
56
5 FNIRT is an exception: In the beta version used in this study, zero values areinterpreted as missing data; FNIRT will not use the information for the edge of thecortex in the registration with this setting, which may result in misregistration of thesurface of the brain.
6 Updated versions of these software packages were used after the authors of thepackages saw an image or two, or their recommended commands or parameter fileswere altered to set the number of iterations or control point spacing to reducecomputation time, or the authors needed to determine if intensity correction waswarranted (see Supplementary section 1).
14 A. Klein et al. / NeuroImage xxx (2009) xxx–xxx
ARTICLE IN PRESS
UNCO
RRE
If we cannot expect every brain to have a one-to-one mappingwith every other brain, then if possible we need to compare similarbrains. This can easily lead to the confound where imagecorrespondence is mistaken for anatomic correspondence (Crumet al., 2003; Rogelj et al., 2002). Choosing a representative brainwith which to establish correspondences with a given brain resultsin a Catch-22 where determining similarities itself entails deter-mining correspondences between the brains. A few approachesaround this dilemma include the use of an established averagetemplate or probabilistic atlas as an intermediary registration target(as is standardly done with SPM), construction of such a templatefrom the subject group that includes the brain in question, anddecision fusion strategies for combining multiple, tentative brainregistrations or labels for a given target brain (Kittler et al., 1998;Rohlfing et al., 2004; Warfield et al., 2004; Klein et al., 2005). With allof these approaches, however, there still remains the distinctpossibility that a given brain is not adequately represented by themajority of the set of brains to which it is being compared. Indeed, itis possible that substructures within a brain are most similar to aminority (or even a single, or no instance) of the set of brains, andwould be overridden by the majority.
The evaluation measures and analysis methods used in this paperare predicated on the assumption that, at the macroscopic scale oftopographic anatomical regions, there are correspondences across amajority of brains that can effectively guide registrations. It is veryimportant to stress that we cannot make inferences about theaccuracy of registrations within these macroscopic regions. Thereforeour overlap evaluation measures not only ignore misregistrationwithin a labeled region but are insensitive to folding in thedeformations, which would impact studies such as deformation-based morphometry. More generally, our evaluation measures rely oninformation which is not directly included in the images, which isgood for evaluating the registrations, but they do not inform us aboutthe intrinsic properties of the spatial transformations. Examplemeasures of the intrinsic properties of spatial transformations includeinverse consistency error, transitivity error, and “mean harmonicenergy” (where the Jacobian determinant of the transformation isaveraged over the volume).
Another general caveat comes from recent evidence that nonlinearregistration to average templates affects different brain regions indifferent ways that lead to relative distortions in volume that aredifficult to predict (Allen et al., 2008). The evidence was based onvarying the target template and registration method (AIR andpiecewise linear). Although our study was not concerned withabsolute volumetry, and nonlinear registrations were conductedfrom one brain to another without the use of a template, we sharethe caution raised by their study.
Specific caveatsCaveats that are specific to our study mirror the general caveats
raised above: anatomical and labeling variability of the subject brains,quality of their images, the preprocessing steps the images weresubjected to, the implementation of the registration algorithms, andour evaluation and analysis methods. With regard to the first threecaveats, we made the assumption that each label set consists of asubject group of normal individuals whose brain images wereacquired, preprocessed, and labeled in a consistent manner. Some ofthe co-authors have commented that the quality of the images in thisstudy is worse than the quality of the images that they are used toapplying their algorithms to. Some of the reasons for this are that theimages for these label sets were acquired years ago, are incomplete(for example, only the CUMC12 set includes the cerebellum inregistered images and labels), many are of low contrast, and all ofthemwere linearly transformed to a template space that involved twotrilinear interpolation steps (see below). All of the algorithmsperformed worst on the IBSR18 set, whose images were acquired
Please cite this article as: Klein, A., et al., Evaluation of 14 nonlinearNeuroImage (2009), doi:10.1016/j.neuroimage.2008.12.037
TEDPR
OOF
8from various sources and are of varying quality, flouting our8assumption above regarding consistency.8Each brain image was labeled only once. Because there are no8intra- or inter-labeler data for these images, we cannot know how8accurately and consistently theywere labeled, let alone have an idea of8the degree of confidence for any of the label boundaries. We can only8estimate based on labeling tests for two of the labeling protocols8(Caviness et al., 1996; Shattuck et al., 2008). We therefore had to treat8these label sets as “silver standards” whose hard label boundaries are8considered correct.8Regarding pre-processing, the brain images of each label set were8consistently preprocessed, and each registration method that per-8formed preprocessing steps did so in a consistent manner across all8images. However, these preprocessing steps may be suboptimal for8particular registration methods. For example, aside from SPM's8algorithms, we did not test registration accuracy for whole-head8images. Although most of the co-authors indicated that they believe8their registration methods would perform better on properly skull-8stripped images than onwhole-head images5, we are not aware of any8published study that has made this comparison. Likewise, we are8aware of no comparisons between the registration of interpolated8versus non-interpolated (bias-field corrected and uncorrected, inten-8sity normalized and non-normalized, etc.) images. All of the images in8this study were linearly interpolated twice, once to linearly register8each brain to a template, and a second time to linearly register each8source brain to a target brain in the template space, prior to nonlinear8registration. We did this to be consistent, because all of the8registration methods we compared do not accept an affine transform8to initialize registration. The first author has observed much more8accurate nonlinear registrations with ART (on a separate set of brain8images) when using nearest-neighbor (or no) interpolation on a8preliminary linear registration step, most noticeably in occipital–8parietal boundaries. This suggests that, at the very least, ART would8performmuch better than this study suggests. More work will need to8be conducted to see how consistent the improvements are and which8algorithms are affected most by interpolation.8Regarding the registration methods themselves, each one has a8similarity measure, transformationmodel, regularizationmethod, and8optimization strategy. Unfortunately, we could only evaluate each8algorithm in its entirety. A superior transformation model coupled8with an unsuitable similarity measure, for example, would most likely8lead to suboptimal results. By extension, a poor selection of parameter8settings will lead to poor registrations. We could only evaluate each8algorithm using the software parameters that were recommended by8their authors. Perhaps themost crucial assumption of our study is that8these parameter settings for each method were appropriate for all of8our brain images. We fully expect that each registration algorithm8could perform better given the opportunity to experiment with these8settings. This is one aspect of our study that sets it apart from8comparison studies such as Hellier's (Hellier et al., 2001a, 2002, 2003),8where the authors of the software packages were allowed to tweak8and run their own programs on the full test set of brain images. The8commands that were run for this study were recommended by the8authors of their respective software programs after having seen only8one or two of the 80 images from one of the four datasets (FNIRT, IRTK,8SICLE, SyN, and SPM's DARTEL Toolbox6), or no images at all.
deformation algorithms applied to human brain MRI registration,

857
858
859
860
861
862
863
864
865
866
867
868
869
870
871
872
873
874
875
876
877
878
879
880
881
882
883
884
885
886
887
888
889
890
891
892
893
894
895
896
897
898
899
900
901
902
903
904
905
906
907
908
909
910
911
912
913
914
915
916
917
918
919
920 Q5
921
922
923
924
925
926
927
928
929
930
931
932
933
934
935
936
937
938
939
940
941
942
943
944
945
946
947
948
949
950
951
952
953
954
955
956
957
958
959
960
961
962
963
964
965
966
967
968
969
970
971
972
973
974
15A. Klein et al. / NeuroImage xxx (2009) xxx–xxx
ARTICLE IN PRESS
UNCO
RREC
When reslicing the source label volumes, we used nearest-neighbor interpolation to preserve label values. An alternativeapproach is recommended where the source label volume is firstsplit into N binary volumes, with one label per volume (Collins,personal communication). Each volume is then resampled using thenonlinear transformation with a tricubic or truncated sync kernelinstead of nearest-neighbor interpolation. The resulting N temporaryvolumes are finally combined into a single volume, where each voxellabel is set to the label of the structure that has the highest value. Thispresumably gives more consistent behavior at structure edges,especially in areas where the deformation changes local volumes orwhere more than three structures meet. Others have implementedvariants of this approach (Crum et al., 2004; Shattuck et al., 2008). Wewere unable to follow this recommendation due to computational andstorage constraints, and were advised that the results would be onlymarginally different.
Recommendations
Bearing in mind the caveats mentioned above, particularly thoseregarding parameter settings, the first author makes the followingrecommendations based on the results of this study. All of thesoftware packages under comparison are freely available via theInternet or from the authors themselves (except for JRD-fluid, run onLONI's servers) and all but one (SICLE) are easy to install. They varyin the extent of their documentation, primarily because the pre-release software packages are new and very much under activedevelopment.
The highest-ranking registration methods were SyN, ART, IRTK,and SPM's DARTEL Toolbox (see Tables 3, 4, and 5). SyN and ART gaveconsistently high-ranking results and were the only methods thatattained top rank for all tests and for all label sets. IRTK and SPM'sDARTEL were competitive with these two methods.
All four of these methods are available on Unix-type systems, andall but ART are available for the Windows operating system. Of thefour, only SPM requires a commercial software package (Matlab) andhas a graphical user interface (which was not used in the study). Ifflexibility is desired, SyN provides the most options and the closestdocumentation to a manual for command-line parameters. Ifresources are an issue, note that SyN requires at least 1 GB RAM and87 MB storage per x, y, z set of transform files (followed by ART at67MB for our data). If time is a constraint, ART is the fastest of the four.If consistency is the top priority, ART had the fewest outliers andamong the tightest distributions of the four methods. If interested inparticular regions, please refer to Figs. 7, 8, 9, and 10 (the latter threeare in Supplementary section 3) to determine which of the 15methods had the highest relative accuracy for those regions across thelabel sets.
For time-sensitive scenarios, such as intraoperative imaging, and inhigh-throughput environments that need to process dozens tothousands of brain images, Diffeomorphic Demons and ROMEO arereasonable candidates.
With regard to the evaluation protocol, based on the experience ofconducting this study the first author recommends caution whenchoosing an image format and preprocessing steps, particularly whencomparing across methods, recommends avoiding interpolation priorto running nonlinear registration, and recommends the model ofPierre Jannin et al. for defining and reporting reference-basedvalidation protocols (Jannin et al., 2006).
With regard to designing and distributing registration algorithms,the first author recommends where possible creating separablecomponents for the similarity measure, transformation model,regularization method, and optimization strategy. This would aid
Please cite this article as: Klein, A., et al., Evaluation of 14 nonlinearNeuroImage (2009), doi:10.1016/j.neuroimage.2008.12.037
TEDPR
OOF
users and evaluators who would want to alter or improve upon theseindividual components.
Uncited references
Andersson et al., 2008Ardekani et al., 1995Ardekani et al., 2005Ashburner, 2007Ashburner and Friston, 1999Ashburner and Friston, 2005Avants et al., 2008Bechhofer, 1954Chiang et al., 2007Christensen, 1999Christensen and Johnson, 2001Collins and Evans, 1997Collins et al., 1994Collins et al., 1995Hellier et al., 2001bHorn and Schunck, 1981Jenkinson and Smith, 2001Johnson and Christensen, 2002Karacali and Davatzikos, 2004Robbins et al., 2004Rueckert et al., 1999Rueckert et al., 2006Studholme et al., 1999Thirion, 1998Toussaint et al., 2007Vercauteren et al., 2007Woods et al., 1998
Acknowledgments
The first author would like to extend his sincere gratitude to theparticipants in this study for their guidance and support in the use oftheir software, which in some cases took the form of new pre-releasesoftware and reslicing algorithms. He is grateful to his colleagues inthe Division of Molecular Imaging and Neuropathology, and thanksSteve Ellis, Todd Ogden, Satrajit Ghosh, and Jack Grinband for theirhelpful discussions. And of course he thanks his two closestcolleagues Deepanjana and Ellora. This work was partially fundedby the National Institutes of Health through NIH grant P50-MH062185. The LPBA40 MR and label data were provided by theLaboratory of Neuro Imaging at UCLA and are available at http://www.loni.ucla.edu/Atlases/Atlas_Detail.jsp?atlas_id=12. The IBSR18 MR andlabel data were provided by the Center for Morphometric Analysis atMassachusetts General Hospital and are available at http://www.cma.mgh.harvard.edu/ibsr/. The CUMC12 data were provided by BrettMensh, and the MGH10 data were provided by Satrajit Ghosh andJason Tourville. The contributions to this paper by Babak A. Ardekaniwere supported by Grant Number R03EB008201 from the NationalInstitute of Biomedical Imaging And Bioengineering (NIBIB) and theNational Institute of Neurological Disorders and Stroke (NINDS). Thecontributions to this paper by Gary E. Christensen and Joo Hyun Songwere supported by NIH grant EB004126. Mark Jenkinsonwould like tothank the UK BBSRC (David Phillips Fellowship).
Appendix A. Supplementary data
Supplementary data associated with this article can be found, inthe online version, at doi:10.1016/j.neuroimage.2008.12.037.
deformation algorithms applied to human brain MRI registration,

75
76781040104110421043104410451046104710481049105010511052105310541055105610571058105910601061106210631064106510661067106810691070
1036
1037103810391040104110421043104410451046104710481049105010511052105310541055105610571058105910601061106210631064106510661067106810691070107110721073107410751076
Q7
16 A. Klein et al. / NeuroImage xxx (2009) xxx–xxx
ARTICLE IN PRESS
9Appendix B. Algorithm requirements99
80
AlgorithmPlease cite this articleNeuroImage (2009), do
Code
as: Kleii:10.101
Computer
n, A., et al., Evaluation of 146/j.neuroimage.2008.12.037
Input
C036
037038039040041042043044045046047048049050051052053054055056057058059060061062063064065066067068069070071072073074075076077078079080
nonlinear deformation algori
Setup
P
thms applied to human brain MRI
9Run time: min
82 Q6
FLIRT (FSL 4.0) C++ OSX, Linux, Win,… Analyze, NiFTI 9 84 AIR 5.25 C OSX, Unix, Win,… ANSI C compiler Analyze 8-/16-bit Remove nonbrain structures 96.7 (1.5) 86 ANIMAL (AutoReg 0.98 k) C, Perl OSX, Linux, Unix MINC Intensity correction (option) 911.2 (0.4) 88 ART C++ OSX, Linux Analyze 920.1 (1.6) [Linux] 90 Diffeomorphic Demons C++ Most (ITK compilable) Analyze, NiFTI, DICOM,… (ITK) 98.7 (1.2) 92 FNIRT beta C++ OSX, Linux, Unix Analyze, NiFTI (writes to Analyze) 929.1 (6.0) 94 IRTK C++ OSX, Linux, Win Analyze, NiFTI, VTK, GIPL Parameter file 9120.8 (29.3) 96 JRD-fluid C++ Sun Analyze 917.1 (1.0) [Solaris] 98 ROMEO C++ OSX, Linux, Win Analyze, NiFTI, DICOM,… (ITK) Parameter file 97.5 (0.5) 000 900+MB RAM Intensity correction (Hellier, 2003) 002 SICLE C++ OSX, Linux, Solaris, Alpha, Win Analyze (7.5) 8-bit Dimensions divisible by 16 1133.5 (6.6) 1004 g77/gfortran Intensity correction 1006 lapack, f2c Isotropic 008 1+GB RAM Individual parameter files 010 SyN beta C++ Most (ITK compilable) Analyze, NiFTI, DICOM,… (ITK) 1177 (15.1) 012 1+ GB RAM 014 SPM5: Matlab Most (Matlab) 11 016017 “SPM2-type” Normalization Matlab 6.5 onwards Analyze, NiFTI Smooth targets (Gaussian 8 mm FWHM) 11b1 019020 Normalization Matlab 6.5 onwards Analyze, NiFTI FLeft-handed orientation 11b1 022 Unified Segmentation Matlab 6.5 onwards Analyze, NiFTI Left-handed orientation 1⋍1 024 DARTEL Toolbox (pairs) Matlab 7.0 onwards Analyze, NiFTI Left-handed orientation 171.8 (6.3)⁎ 10261027 OOrigin near anterior commissure028029030031032033035
RO
1The run time average (and standard deviation) is estimated from a sample of registrations and includes the time to compute the source-to-target transform but not to apply it to1resample the source labels. ⁎SPM's DARTELToolbox requires time to construct a template per subject group. The time listed is for the pairwise implementation; for the normal toolbox1implementation, it took 17 min per brain, or 17.5 h to run all 80 brains (LPBA40: 480 min., IBSR18: 220 min., CUMC12: 195 min., MGH10: 158 min.). All programs were run on an OSX1system (Mac Pro Quad-Core Intel Xeon, 3 GHz, 6 GB RAM)with a 10.4 operating system, except for ROMEO (10.5 operating system), ART (the OSX versionwasmade available after the1study; Dell PowerEdge 6600 Enterprise server with four 2.8 GHz Intel Xeon processors and 28 GB of RAM running Redhat linux, approximately 1.25–1.5 times slower than the OSX1machine), and JRD-fluid (run on LONI's servers: SUN Microsystem workstations with a dual 64-bit AMD Opteron 2.4 GHz processor running Solaris).1
081082083084085086087088 Q8089090091092093094095096097098099100101102103104105106107108109110111112113114115116117118119120121122123124125126
UNCO
RRE
1References
1Allen, J.S., Bruss, J., Mehta, S., Grabowski, T., Brown, C.K., Damasio, H., 2008. Effects of
1spatial transformation on regional brain volume estimates. NeuroImage 42,
1535–547.
1Andersson, J., Smith, S., Jenkinson, M., 2008. FNIRT — FMRIB' non-linear image
1registration tool. Hum. Brain Map. 2008, Poster #496.
1Ardekani, B., Braun, M., Hutton, B.F., Kanno, I., Iida, H., Aug. 1995. A fully automatic
1multimodality image registration algorithm. J. Comput. Assist. Tomogr.19, 615–623.
1Ardekani, B.A., Guckemus, S., Bachman, A., Hoptman, M.J., Wojtaszek, M., Nierenberg, J.,
1Mar. 2005. Quantitative comparison of algorithms for inter-subject registration of
13D volumetric brain MRI scans. J. Neurosci. Methods 142, 67–76.
1Ashburner, J., Oct. 2007. A fast diffeomorphic image registration algorithm. NeuroImage
138, 95–113.
1Ashburner, J., Friston, K.J., 1999. Nonlinear spatial normalization using basis functions.
1Hum. Brain Map. 7, 254–266.
1Ashburner, J., Friston, K.J., Jul. 2005. Unified segmentation. NeuroImage 26, 839–851.
1Avants, B.B., Epstein, C.L., Grossman, M., Gee, J.C., 2008. Symmetric diffeomorphic image
1registration with cross-correlation: evaluating automated labeling of elderly and
1neurodegenerative brain. Med. Image Anal. 12, 26–41.
1Bechhofer, R.E., Mar. 1954. A single-sample multiple decision procedure for ranking
1means of normal populations with known variances. Ann. Math. Stat. 25, 16–39.
1Beg, M.F., Miller, M.I., Trouvé, A., Younes, L., Feb. 2005. Computing large deformation
1metric mappings via geodesic flows of diffeomorphisms. Int. J. Comput. Vis. 61,
1139–157.
1Cachier, P., Bardinet, E., Dormont, D., Pennec, X., Ayache, N., 2003. Iconic feature based
1nonrigid registration: the PASHA algorithm. Comput. Vis. Image Underst. 89,
1272–298.
1Caviness, V., Meyer, J., Makris, N., Kennedy, D.,1996. MRI-based topographic parcellation
1of human neocortex: an anatomically specified method with estimate of reliability.
1J. Cogn. Neurosci. 8, 566–587.
1Chiang, M.-C., Dutton, R.A., Hayashi, K.M., Lopez, O.L., Aizenstein, H.J., Toga, A.W., Becker,
1J.T., Thompson, P.M., 2007. 3D pattern of brain atrophy in HIV/AIDS visualized using
1tensor-based morphometry. NeuroImage 34, 44–60.
1Christensen, G.E., 1999. Consistent linear-elastic transformations for image matching.
1Proceedings of Information Processing in Medical Imaging: IPMI 99 1613, 224–237.
1Christensen, G., Johnson, H., 2001. Consistent image registration. IEEE Trans. Med. Imag.
120, 568–582.
1Clouchoux Coulon, Rivière, Cachia, Mangin, Régis, 2005. Anatomically constrained
1surface parameterization for cortical localization. Medical Image Computing and
1Computer-Assisted Intervention: MICCAI 2005 3750, 344–351.
1Cointepas, Y., Mangin, J.-F., Garnero, L., Poline, J.-B., Benali, H., Jun. 2001. BrainVISA:
1software platform for visualization and analysis of multi-modality brain data.
1NeuroImage 13, 98.
1Collins, D.L., Evans, A.C., 1997. ANIMAL: validation and applications of non-linear
1registration-based segmentation. Int. J. Pattern Recogn. Artif. Intell. 11, 1271–1294.
TED 1Apr.Collins, D.L., Neelin, P., Peters, T.M., Evans, A.C., 1994. Automatic 3D intersubject
1registration of MR volumetric data in standardized Talairach space. J. Comput.
1Assist. Tomogr. 18, 192–205.
1Collins, D.L., Holmes, C.J., Peters, T.M., Evans, A.C., 1995. Automatic 3-d model-based
1neuroanatomical segmentation. Hum. Brain Mapp. 3, 190–208.
1Crum,W.R., Griffin, L.D., Hill, D.L.G., Hawkes, D.J., 2003. Zen and the art of medical image
1registration: correspondence, homology, and quality. NeuroImage 20, 1425–1437.
1Crum, Rueckert, Jenkinson, Kennedy, Smith, 2004. A framework for detailed objective
1comparison of non-rigid registration algorithms in neuroimaging. Medical Image
1Computing and Computer-Assisted Intervention: MICCAI 2004 3216, 679–686.
1Crum, W.R., Camara, O., Rueckert, D., Bhatia, K.K., Jenkinson, M., Hill, D.L.G., 2005.
1Generalised overlap measures for assessment of pairwise and groupwise image
1registration and segmentation. Medical Image Computing and Computer-Assisted
1Intervention: MICCAI 2005 3749, 99–106.
1Dale, A.M., Fischl, B., Sereno, M.I., Feb. 1999. Cortical surface-based analysis I:
1segmentation and surface reconstruction. NeuroImage 9, 179–194.
1Drury, H.A., Essen, D.C.V., Anderson, C.H., Lee, C.W., Coogan, T.A., Lewis, J.W., 1996.
1Computerized mappings of the cerebral cortex: a multiresolution flattening
1method and a surface-based coordinate system. J. Cogn. Neurosci. 8, 1–28.
1Essen, D.C.V., Drury, H.A., Dickson, J., Harwell, J., Hanlon, D., Anderson, C.H., 2001. An
1integrated software suite for surface-based analyses of cerebral cortex. J. Am. Med.
1Inform. Assoc.: JAMIA 8, 443–459.
1Evans, A.C., Collins, D.L., Milner, B., 1992. AnMRI-based stereotactic brain atlas from 300
1young normal subjects. Proc. of the 22nd Symposium of the Society for
1Neuroscience, Anaheim 408.
1Evans, A.C., Collins, D.L., Mills, S.R., Brown, E.D., Kelly, R.L., Peters, T.M., Oct. 1993. 3D
1statistical neuroanatomical models from 305 MRI volumes. Nucl. Sci. Symp. Med.
1Imaging Conf. 3, 1813–1817.
1Fiez, J.A., Damasio, H., Grabowski, T.J., 2000. Lesion segmentation and manual warping
1to a reference brain: intra- and interobserver reliability. Hum. Brain Mapp. 9,
1192–211.
1Fischl, B., Sereno, M.I., Tootell, R.B.H., Dale, A.M., 1999. High-resolution intersubject
1averaging and a coordinate system for the cortical surface. Hum. Brain Map. 8,
1272–284.
1Fischl, B., Salat, D.H., Busa, E., Albert, M., Dieterich, M., Haselgrove, C., van der Kouwe, A.,
1Killiany, R., Kennedy, D., Klaveness, S., Montillo, A., Makris, N., Rosen, B., Dale, A.M.,
12002. Whole brain segmentation: automated labeling of neuroanatomical
1structures in the human brain. Neuron 33, 341–355.
1Fischl, B., van der Kouwe, A., Destrieux, C., Halgren, E., Ségonne, F., Salat, D.H., Busa, E.,
1Seidman, L.J., Goldstein, J., Kennedy, D., Caviness, V., Makris, N., Rosen, B., Dale, A.M.,
12004. Automatically parcellating the human cerebral cortex. Cereb. Cortex 14,
111–22.
1Friston, K.J., Ashburner, J., Poline, J.B., Frith, C.D., Heather, J.D., Frackowiak, R.S.J., 1995.
1Spatial registration and normalization of images. Hum. Brain Map. 2, 165–189.
1Gee, J.C., Reivich, M., Bajcsy, R., 1993. Elastically deforming 3D atlas to match anatomical
1brain images. J. Comput. Assist. Tomogr. 17, 225–236.
registration,

11271128112911301131113211331134113511361137113811391140114111421143114411451146114711481149115011511152115311541155115611571158115911601161116211631164116511661167116811691170117111721173117411751176117711781179118011811182
11831184118511861187118811891190119111921193119411951196119711981199120012011202120312041205120612071208120912101211121212131214121512161217121812191220122112221223122412251226122712281229123012311232123312341235 Q9123612371238
1240
17A. Klein et al. / NeuroImage xxx (2009) xxx–xxx
ARTICLE IN PRESS
EC
Gerig, G., Jomier, M., Chakos, M., 2001. Valmet: a new validation tool for assessing andimproving 3D object segmentation. Lect. Notes Comput. Sci. 2208, 516–524.
Gholipour, A., Kehtarnavaz, N., Briggs, R., Devous, M., Gopinath, K., 2007. Brainfunctional localization: a survey of image registration techniques. IEEE Trans. Med.Imag. 26, 427–451.
Grachev, I.D., Berdichevsky, D., Rauch, S.L., Heckers, S., Alpert, N.M., 1998. Anatomiclandmark-based method for assessment of intersubject image registrationtechniques: Woods vs Talairach [abstract]. 8th Annual Meeting of the Organizationfor Hum. Brain Map., Brighton, England.
Grachev, I.D., Berdichevsky, D., Rauch, S.L., Heckers, S., Kennedy, D.N., Caviness, V.S.,Alpert, N.M., 1999. A method for assessing the accuracy of intersubject registrationof the human brain using anatomic landmarks. NeuroImage 9, 250–268.
Heckemann, R.A., Hajnal, J.V., Aljabar, P., Rueckert, D., Hammers, A., Oct. 2006.Automatic anatomical brain MRI segmentation combining label propagation anddecision fusion. NeuroImage 33, 115–126.
Hellier, P., 2003. Consistent intensity correction of MR images. International Conferenceon Image Processing: ICIP 2003 1, 1109–1112.
Hellier, P., Barillot, C., Corouge, I., Gibaud, B., Goualher, G.L., Collins, L., Evans, A.,Malandain, G., Ayache, N., 2001a. Retrospective evaluation of inter-subject brainregistration. Lect. Notes Comput. Sci. 2208, 258–266.
Hellier, P., Barillot, C., Mémin, E., Pérez, P., 2001b. Hierarchical estimation of a densedeformation field for 3D robust registration. IEEE Trans. Med. Imag. 20, 388–402.
Hellier, P., Ashburner, J., Corouge, I., Barillot, C., Friston, K., 2002. Inter subjectregistration of functional and anatomical data using SPM. Med. Image Comput.Comput.-Assist. Interv.: MICCAI 2002 2489, 590–597.
Hellier, P., Barillot, C., Corouge, I., Gibaud, B., Goualher, G.L., Collins, D.L., Evans, A.,Malandain, G., Ayache, N., Christensen, G.E., Johnson, H.J., Sep. 2003. Retrospectiveevaluation of intersubject brain registration. IEEE Trans. Med. Imag. 22, 1120–1130.
Horn, K., Schunck, B., 1981. Determining optical flow. Artif. Intell. 17, 185–203.Jaccard, P., 1912. The distribution of flora in the alpine zone. New Phytol. 11, 37–50.Jannin, Grova, Maurer, 2006. Model for defining and reporting reference-based validation
protocols in medical image processing. Int. J. Comput. Assist. Radiol. Surg. 1, 63–73.Jenkinson, M., Smith, S., Jun. 2001. A global optimisation method for robust affine
registration of brain images. Med. Image Anal. 5, 143–156.Johnson, H., Christensen, G., 2002. Consistent landmark and intensity-based image
registration. IEEE Trans. Med. Imag. 21, 450–461.Karacali, B., Davatzikos, C., 2004. Estimating topology preserving and smooth
displacement fields. IEEE Trans. Med. Imag. 23, 868–880.Kittler, J., Hatef, M., Duin, R.P.W., Matas, J., 1998. On combining classifiers. IEEE Trans.
Pattern Anal. Mach. Intell. 20, 226–239.Klein, A., Hirsch, J., 2005. Mindboggle: a scatterbrained approach to automate brain
labeling. NeuroImage 24 (2), 261–280.Klein, A., Mensh, B., Ghosh, S., Tourville, J., Hirsch, J., 2005. Mindboggle: automated
brain labeling with multiple atlases. BMC Med. Imaging 5, 7.Mandl, R., Jansma, J., Slagter, H., Collins, D., Ramsey, N., 2000. On the validity of
associating stereotactic coordinates with anatomical nomenclature. Hum. BrainMapp.: HBM S539.
Menke, J., Martinez, T., 2004. Using permutations instead of Student's t distribution forp-values in paired-difference algorithm comparisons. Neural Networks, 2004.Proceedings. IEEE International Joint Conference, Vol. 2, pp. 1331–1335.
Nieto-Castanon, A., Ghosh, S.S., Tourville, J.A., Guenther, F.H., 2003. Region of interestbased analysis of functional imaging data. NeuroImage 19, 1303–1316.
Paglieroni, D.W., 1992. Distance transforms: properties and machine vision applica-tions. CVGIP: Graph. Models Image Process 54, 56–74.
Robbins, S., Evans, A.C., Collins, D.L., Whitesides, S., Sep. 2004. Tuning and comparingspatial normalization methods. Med. Image Anal. 8, 311–323.
UNCO
RR
1239
Please cite this article as: Klein, A., et al., Evaluation of 14 nonlinearNeuroImage (2009), doi:10.1016/j.neuroimage.2008.12.037
TEDPR
OOF
Rogelj, P., Kovacic, S., Gee, J., 2002. Validation of a nonrigid registration algorithm formultimodal data. Proc. SPIE 4684, 299–307.
Rohlfing, T., Russakoff, D.B., Maurer, C.R., 2004. Performance-based classifier combina-tion in atlas-based image segmentation using expectation-maximization para-meter estimation. IEEE Trans. Med. Imag. 23, 983–994.
Roland, P., Geyer, S., Amunts, K., Schormann, T., Schleicher, A., Malikovic, A., Zilles, K.,1997. Cytoarchitectural maps of the human brain in standard anatomical space.Hum. Brain Map. 5, 222–227.
Rosenfeld, A., Pfaltz, J.L., 1966. Sequential operations in digital picture processing. J. ACM13, 471–494.
Rueckert, D., Sonoda, L., Hayes, C., Hill, D., Leach, M., Hawkes, D., 1999. Nonrigidregistration using free-form deformations: application to breast MR images. IEEETrans. Med. Imag. 18, 712–721.
Rueckert, D., Aljabar, P., Heckemann, R.A., Hajnal, J.V., Hammers, A., 2006. Diffeomorphicregistration using B-splines. 9th International Conference on Medical ImageComputing and Computer-Assisted Intervention: MICCAI 2006 4191, 702–709.
Shattuck, D.W., Mirza, M., Adisetiyo, V., Hojatkashani, C., Salamon, G., Narr, K.L.,Poldrack, R.A., Bilder, R.M., Toga, A.W., Feb. 2008. Construction of a 3D probabilisticatlas of human cortical structures. NeuroImage 39, 1064–1080.
Shen, D., Davatzikos, C., Nov. 2002. Hammer: hierarchical attribute matchingmechanism for elastic registration. IEEE Tansact. Med Imaging 21, 1421–1439.
Studholme, C., Hill, D.L.G., Hawkes, D.J., 1999. An overlap invariant entropy measure of3D medical image alignment. Pattern Recogn. 32, 71–86.
Talairach, J., Szikla, G., 1967. Atlas d'anatomie stereotaxique du telencephale: etudesanatomo-radiologiques. Masson & Cie, Paris.
Talairach, J., Tournoux, P., 1988. Co-planar Stereotaxic Atlas of the Human Brain. ThiemeMedical Publishers, New York.
Thirion, J.P., Sep. 1998. Image matching as a diffusion process: an analogy withMaxwell's demons. Med. Image Anal. 2, 243–260.
Tourville, J., Guenther, F., 2003. A cortical and cerebellar parcellation system for speechstudies. Boston University Technical Reports CAS/CNS-03-022.
Toussaint, N., Souplet, J.C., Fillard, P., 2007. MedINRIA: medical image navigation andresearch tool by INRIA. Proceedings of MICCAI'07 Workshop on Interaction inMedical Image Analysis and Visualization, 4791, pp. 1–8.
Towle, V.L., Khorasani, L., Uftring, S., Pelizzari, C., Erickson, R.K., Spire, J.-P., Hoffmann, K.,Chu, D., Scherg, M., 2003. Noninvasive identification of human central sulcus: acomparison of gyral morphology, functional MRI, dipole localization, and directcortical mapping. NeuroImage 19, 684–697.
Vercauteren, T., Pennec, X., Perchant, A., Ayache, N., 2007. Non-parametric diffeo-morphic image registration with the demons algorithm. Med. Image Comput.Comput.-Assist. Interv.: MICCAI 2007 4792, 319–326.
Warfield, S., Zou, K., Wells, W., 2004. Simultaneous truth and performance levelestimation (STAPLE): an algorithm for the validation of image segmentation. IEEETrans. Med. Imag. 23, 903–921.
Woods, R.P., Grafton, S.T., Holmes, C.J., Cherry, S.R., Mazziotta, J.C., Feb.1998. Automatedimage registration: I. general methods and intrasubject, intramodality validation. J.Comput. Assist. Tomogr. 22, 139–152.
Xiong, J., Rao, S., Jerabek, P., Zamarripa, F., Woldorff, M., Lancaster, J., Fox, P.T., Sep. 2000.Intersubject variability in cortical activations during a complex language task.NeuroImage 12, 326–339.
Yassa, M. A., Stark, C. E., in press. A quantitative evaluation of cross-participantregistration techniques for MRI studies of the medial temporal lobe. NeuroImage,(in press).
Zijdenbos, A., Dawant, B., Margolin, R., Palmer, A., 1994. Morphometric analysis of whitematter lesions in MR images: method and validation. IEEE Trans. Med. Imag. 13,716–724.
deformation algorithms applied to human brain MRI registration,