Embed Size (px)
Citation preview

ARTICLE IN PRESS
Journal of Biomechanics ] (]]]]) ]]]–]]]
Contents lists available at ScienceDirect
journal homepage: www.elsevier.com/locate/jbiomech
Journal of Biomechanics
0021-92
doi:10.1
n Corr
E-m
Pleastrabe
www.JBiomech.com
Precision of nanoindentation protocols for measurement of viscoelasticity incortical and trabecular bone
Hanna Isaksson a,n, Shijo Nagao b, Marta Ma"kiewicz a,b, Petro Julkunen c,Roman Nowak b, Jukka S. Jurvelin a
a Department of Physics and Mathematics, University of Eastern Finland, PO Box 1627, Kuopio 70211, Finlandb The Nordic Hysitron Laboratory, Faculty of Chemistry and Materials Science, Aalto University, FI-00076 Aalto, Finlandc Department of Clinical Neurophysiology, Kuopio University Hospital, Kuopio, Finland
a r t i c l e i n f o
Article history:
Accepted 16 April 2010Nanoindentation has recently gained attention as a characterization technique for mechanical
properties of biological tissues, such as bone, on the sub-micron level. However, optimal methods to
Keywords:
Nanoindentation
Viscoelastic
Creep
Strain-hardening
Dissipated energy
Semi-dynamic
Bovine
90/$ - see front matter & 2010 Elsevier Ltd. A
016/j.jbiomech.2010.04.017
esponding author. Tel.: +358 40 355 2079; fa
ail address: [email protected] (H. Isaksso
e cite this article as: Isaksson, H., etcular bone. Journal of Biomechanics
a b s t r a c t
characterize viscoelastic properties of bones are yet to be established. This study aimed to compare the
time-dependent viscoelastic properties of bone tissue obtained with different nanoindentation
methods. Bovine cortical and trabecular bone samples (n¼8) from the distal femur and proximal
tibia were dehydrated, embedded and polished. The material properties determined using nanoinden-
tation were hardness and reduced modulus, as well as time-dependent parameters based on creep,
loading-rate, dissipated energy and semi-dynamic testing under load control. Each loading protocol
was repeated 160 times and the reproducibility was assessed based on the coefficient of variation (CV).
Additionally, three well-characterized polymers were tested and CV values were calculated for
reference.
The employed methods were able to characterize time-dependent viscoelastic properties of bone.
However, their reproducibility varied highly (CV 9–40%). The creep constant increased with increasing
dwell time. The reproducibility was best with a 30 s creep period (CV 18%). The dissipated energy was
stable after three repeated load cycles, and the reproducibility improved with each cycle (CV 23%). The
viscoelastic properties determined with semi-dynamic test increased with increase in frequency. These
measurements were most reproducible at high frequencies (CV 9–10%). Our results indicate that several
methods are feasible for the determination of viscoelastic properties of bone material. The high
frequency semi-dynamic test showed the highest precision within the tested nanoindentation
protocols.
& 2010 Elsevier Ltd. All rights reserved.
1. Introduction
The mineral phase in bone controls its stiffness, whereas thecollagen contributes to the ultimate strength and toughness of thebone (Boivin et al., 2008; Wang et al., 2001). Bone becomes morebrittle with age (Burr, 2002). Most likely, this is due to decreasedductility, which may be related to viscoelasticity of the collagenfibers (Les et al., 2004, 2005). Hence, the changes in the collagenphase can contribute significantly to increased fragility of bone(Banse et al., 2002; Knott and Bailey, 1998; Wang et al., 2002).Optimal methods should be determined to sensitively evaluatethe time-dependent properties of bone, and to assess effectivelythe effects of experimental bone interventions.
Although nanoindentation is widely used in material science, itis a relatively new tool for testing biological tissues (Lewis and
ll rights reserved.
x: +358 1716 3032.
n).
al., Precision of nanoindenta(2010), doi:10.1016/j.jbiom
Nyman, 2008; Oyen and Cook, 2009). The obtained pertinentparameters, which have previously been quantified in bone(Hengsberger et al., 2002; Oyen et al., 2008; Rho et al., 1997;Roy et al., 1999; Zysset et al., 1999), include hardness and reducedelastic modulus. In contrast, determination of the viscoelasticproperties of bone or mineralized tissues by nanoindentation isless covered. The creep behavior of human enamel (He and Swain,2009) and bone (Bembey et al., 2006b) and the determination ofdissipated energy in cortical bone using repeated loading (Fan andRho, 2003), are the only subjects investigated so far. Also, theviscoelastic properties of a collagen scaffold were quantified withquasi-static indentation (Chaudhry et al., 2009). The aforemen-tioned studies used different indentation protocols to characterizedifferent physical parameters on various types of tissues. Asystematic extensive characterization of bone viscoelastic proper-ties and the reliability and precision of the different methodsusing nanoindentation have not yet been presented.
Bone is an inhomogeneous, anisotropic and viscoelasticmaterial. Hence, measurements on the nanoscale add new aspects
tion protocols for measurement of viscoelasticity in cortical andech.2010.04.017

ARTICLE IN PRESS
H. Isaksson et al. / Journal of Biomechanics ] (]]]]) ]]]–]]]2
to the inter-individual biological variation and require precisemeasurement protocols. This study aimed to characterize howdifferent nanoindentation methods quantify the mechanicalproperties of bovine cortical and trabecular bone tissue; specifi-cally, which of the following methods can be used to measure theviscoelastic mechanical properties with the highest precision, i.e.with the lowest intra-method variation: creep, effect of loading-rate, dissipated energy, or semi-dynamic testing.
2. Materials and methods
2.1. Sample preparation
Bovine knee joints were obtained from the local slaughter house (Atria Oyj,
Kuopio, Finland). Trabecular bone samples were taken from the proximal tibia and
cortical bone samples from the distal femur from 18-month-old animals (n¼8).
From both locations, one 10 mm thick bone disc was cut transversely with a high-
speed band saw (Fig. 1a). Cylindrical trabecular bone samples (f¼14 mm) were
drilled under PBS irrigation, and cortical bone samples were cut with the band saw
from the medial side of the bone disc (Fig. 1b). The samples were dehydrated in a
series of alcohol solutions and embedded in polymethylmetacrylate (PMMA). The
samples were cut to a final height of 5 mm using a diamond saw and were then
polished using silicon carbide paper of decreasing grid size (500, 800, 1000, 1200
and 4000 grid) under deionized water. Each polishing step was performed for
2 min, followed by washing in deionized water to remove debris. The result was
evaluated using an optical microscope. The average surface roughness of the
measurement grid area was 55 nm.
10 mm
10 mm
200 µm
10 µm
a
c
b
Fig. 1. The samples were harvested from bovine distal femur (cortical) and
proximal tibia (trabecular) (a). The samples were cut to 5 mm, glued onto glass
plates and polished (b). Nanoindentations were performed in the longitudinal
direction of the trabeculae, and in the circumferential direction of the cortical
samples. Twelve methods were repeated five times at each location, and at four
locations per sample. The distance between each measurement point in the grid
was 10 mm (c).
Please cite this article as: Isaksson, H., et al., Precision of nanoindentatrabecular bone. Journal of Biomechanics (2010), doi:10.1016/j.jbiom
In addition, three reference samples were prepared. Samples of low-density
polyethylene (LDPE) and polycarbonate (PC) were cut from 1 mm-thick sheets
(Goodfellow Cambridge Ltd., Huntingdon, England) with perfectly smooth
surfaces, and PMMA was mixed, cut and polished with the same protocol as the
bone samples.
Nanoindentation measurements were performed with a Hysitron TriboInden-
ter equipped with a cube corner diamond tip (radius 40 nm). High resolution
positioning of the tip was achieved using a piezoelectric scanner. Corrections were
made for thermal drift of this element. The temperature was controlled (70.1 1C),
and a custom built damping system was used to minimize vibration. Calibration of
the tip area function was conducted according to standard protocols by
performing a number of independent indentations on fused silica with different
applied forces and fitting the data to 5th order polynomial function (Oliver and
Pharr, 1992). The calibrated tip area function had three non-zero coefficients.
Twelve measurement protocols were applied (indentation probing, three creep
protocols, three loading-rates, repeated load cycles and semi-dynamic testing with
four frequencies). Indentations were performed in a pre-determined grid of 5�12
points (10 mm spacing) at four locations per sample (Fig. 1c). The trabecular bone
indentation grids were placed centrally on thick trabeculae (thickness4250 mm)
along the main fiber direction to avoid any effects of the embedding media (Mittra
et al., 2006). The indentations on the cortical bone were placed on the interstitial
lamellar bone.
2.2. Nanoindentation probing
To determine the hardness and reduced modulus of the bone tissue, a load
controlled indentation protocol with a maximum load of 100 mN was used. The
loading and the unloading rate was 20 mN/s, with a 5 s dwell time. The hardness H
and the reduced modulus Er were calculated from the unloading curve according
to Oliver and Pharr (1992). The Er was related to the modulus of the sample:
1
Er¼ð1�v2
s Þ
Esþð1�v2
i Þ
Eið1Þ
where the subscripts s and i refer to the sample and the indenter, respectively, and
n is Poisson’s ratio.
2.3. Viscoelastic measurement protocols
2.3.1. Creep
To model the behavior of the viscoelastic solid, a Burger model was applied
(Eq. (2)) (Fischer-Cripps, 2004b). According to this model, the penetration depth
(h) increases with time:
hðtÞ2 ¼p2
P0 cota 1
E1þ
1
E2ð1�e�tE2=Z1 Þþ
1
Z2
t
� �ð2Þ
where P0 is the peak force, a is the equivalent cone semi-angle (42.281 for cube
corner indenter), E1 and E2 are moduli (GPa), Z2 is the long term creep viscosity
(GPas) and Z1/E2 is the creep time constant (s).
The load–displacement curves were recorded using a loading and unloading
rate of 20 mN/s to a maximal load of 100 mN/s. A dwell time of 10, 30 or 60 s was
applied (Fig. 2a). E1, E2, Z1 and Z2 were determined by minimizing the mean square
error between the time–deformation curve and Eq. (2) using the Nelder–Mead-
simplex method (Matlab R2006a, Mathworks Inc., USA).
2.3.2. Load-rate dependency
To determine the sensitivity of mechanical parameters to loading rate,
indentation tests up to a maximum load of 100 mN were carried out with three
different loading rates (10, 50 and 100 mN/s) (Fig. 2b). The area under the force–
displacement curve and the reduced modulus during unloading were used as
indications of load-rate sensitivity. Additionally, to determine the strain-rate
sensitivity for bone, the stress and strain rate at the maximal load was calculated
for each indentation. Stress was defined as the ratio between the force and the
area at the given depth, and strain rate as the instantaneous displacement rate of
the indenter divided by the instantaneous displacement (Fan and Rho, 2003). The
stress (i)–strain rate ( _e) pairs were plotted on a log–log graph to obtain a measure
of the strain-rate sensitivity m (the slope of the graph) for each test (Mayo et al.,
1990).
2.3.3. Dissipated energy
Repeated loading curves were employed to separate the viscous response from
the elastic and plastic deformations (Fan and Rho, 2003). Four loading cycles were
applied repeatedly, with loading and unloading rates of 20 mN/s for 4 s and a 1 s
dwell period (Fig. 2c). The energy dissipated for irreversible deformation was
calculated from each loading cycle by integrating the area bound by the
displacement curve. The response appeared mainly viscous when there was no
significant change in energy between two consecutive load cycles.
tion protocols for measurement of viscoelasticity in cortical andech.2010.04.017

ARTICLE IN PRESS
0 20 40 60 800
20406080
100120
Time (s)
Forc
e (µ
N)
0 20 40 60 800
255075
100125150
Time (s)
Def
orm
atio
n (n
m)
0 50 100 1500
20406080
100120
Deformation (nm)
Forc
e (µ
N)
Creep 10sCreep 30sCreep 60s
0 10 20 300
20406080
100120
Time (s)
Forc
e (µ
N)
0 10 20 300
50
100
150
Time (s)
Def
orm
atio
n (n
m)
0 50 100 1500
20406080
100120
Deformation (nm)
Forc
e (µ
N)
Rate 100Rate 50Rate 10
0 10 20 30 400
20
40
60
80
Time (s)
Forc
e (µ
N)
0 10 20 30 400
20406080
100120
Time (s)
Def
orm
atio
n (n
m)
0 50 100 150-20
020406080
100
Deformation (nm)Fo
rce
(µN
)
0 5 10 15 200
20
40
60
80
100
Time (s)
Forc
e (µ
N)
0 5 10 15 200
50
100
150
Time (s)
Def
orm
atio
n (n
m)
13 14 1520
40
60
80
100Fo
rce
(µN
)
Time (s)
110
115
120
125
130
Def
orm
atio
n (n
m)
Force Deformation
Fig. 2. Time–force, time–deformation and deformation–force curves for the protocols used to determine the viscoelastic properties of bone. Creep was performed with
dwell time of 10, 30 or 60 s (a). Effect of strain rate was analyzed using three different strain rates: 10, 50 or 100 mN/s (b). Dissipated energy was quantified by applying four
consecutive load cycles of identical amplitude (c). Semi-dynamic testing was performed with an additional sinusoidal load with frequencies of 1, 5, 10 or 20 Hz (d).
H. Isaksson et al. / Journal of Biomechanics ] (]]]]) ]]]–]]] 3
2.3.4. Semi-dynamic test
The stress–strain (s–e) relationship for a linear viscoelastic material under
sinusoidal loading satisfies
s¼ e0E0sinotþe0E00 cosot ð3Þ
where e0, o and t are the strain amplitude, angular frequency and time,
respectively (Herbert et al., 2008). E0 and E00 are the storage and loss modulus,
respectively, and can be obtained as follows:
E0 ¼s0
e0cosf and E00 ¼
s0
e0sinf ð4Þ
where s0 and j are the stress amplitude and the phase lag between the stress
and the strain curve, respectively (Fischer-Cripps, 2004a). E0 is in phase with
the applied load and represents the material’s capacity to store energy. E00 is the
component that can be out of phase with the applied load and represents the
capacity of the material to dissipate energy, i.e. the viscous portion. The loss factor
(E00/E¼tan j) is often used as a measurement of damping in a linear viscoelastic
material (Chaudhry et al., 2009).
Load–displacement curves were recorded using a loading rate of 20 mN/s to a
maximal load of 80 mN, followed by a 10 s dwell period (Fig. 2d). During the
second half of the dwell, a second sinusoidal load function was applied with an
amplitude of 20 mN and a frequency of 1, 5, 10 or 20 Hz (Fig. 2d). It was confirmed
that the measurement protocol was sufficient to reach steady state at all
frequencies.
Please cite this article as: Isaksson, H., et al., Precision of nanoindentatrabecular bone. Journal of Biomechanics (2010), doi:10.1016/j.jbiom
2.4. Data analysis and statistical evaluation
Differences between the cortical and trabecular bone were examined using t-
test after pooling the repeated measurements for each method. Within each
method, the parameters calculated with different loading protocols were
compared using two-way ANOVA, where the factors were the parameter of
interest and the sample. The coefficient of variation (CV%) was calculated for each
method and sample, and the root mean squared average value (CVRMS%) was used
to compare all samples. Pair-wise comparisons of the CVs were conducted
between each technique using the Wilcoxin signed rank test. Pearson correlation
coefficients were used to study associations between the viscoelastic parameters
determined with different techniques. Statistical analysis was performed with
SPSS (v.14, SPSS Inc., Chicago, IL).
3. Results
3.1. Nanoindentation probing
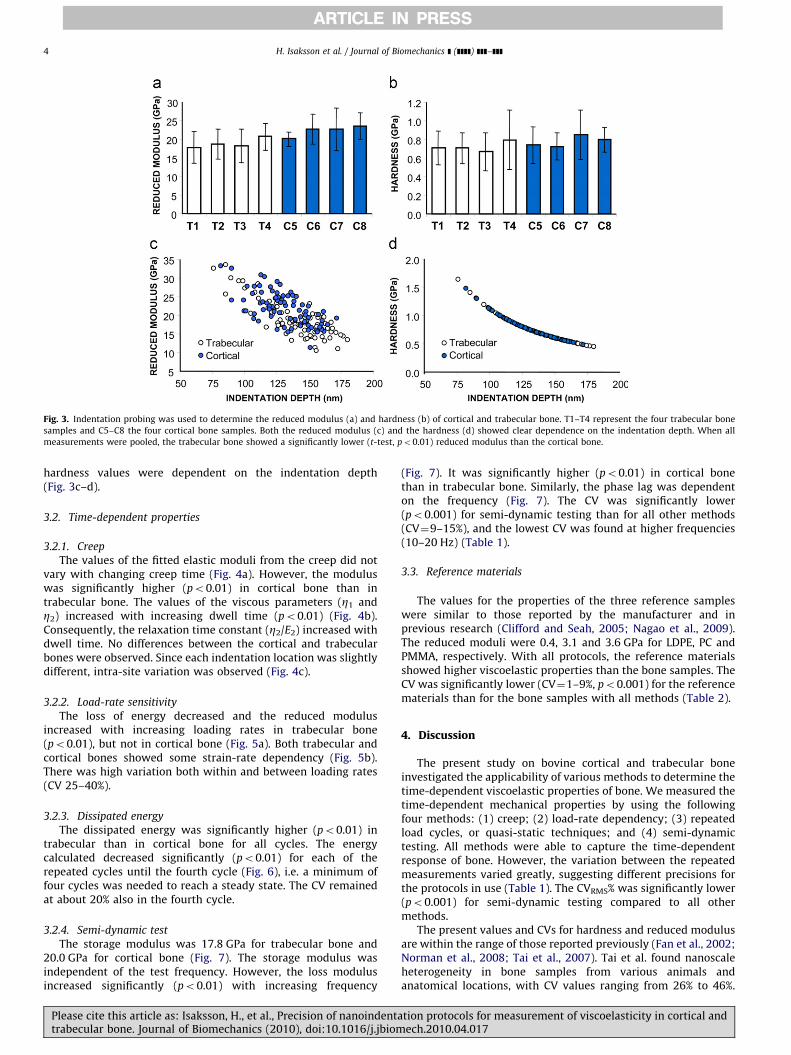
The reduced moduli were 18.974.2 GPa and 21.973.8 GPa fortrabecular bone and cortical bone, respectively (Fig. 3a). Themeasured hardness was 0.7270.22 GPa for trabecular bone and0.7970.19 GPa for cortical bone (Fig. 3b). Both modulus and
tion protocols for measurement of viscoelasticity in cortical andech.2010.04.017
ARTICLE IN PRESS
Fig. 3. Indentation probing was used to determine the reduced modulus (a) and hardness (b) of cortical and trabecular bone. T1–T4 represent the four trabecular bone
samples and C5–C8 the four cortical bone samples. Both the reduced modulus (c) and the hardness (d) showed clear dependence on the indentation depth. When all
measurements were pooled, the trabecular bone showed a significantly lower (t-test, po0.01) reduced modulus than the cortical bone.
H. Isaksson et al. / Journal of Biomechanics ] (]]]]) ]]]–]]]4
hardness values were dependent on the indentation depth(Fig. 3c–d).
3.2. Time-dependent properties
3.2.1. Creep
The values of the fitted elastic moduli from the creep did notvary with changing creep time (Fig. 4a). However, the moduluswas significantly higher (po0.01) in cortical bone than intrabecular bone. The values of the viscous parameters (Z1 andZ2) increased with increasing dwell time (po0.01) (Fig. 4b).Consequently, the relaxation time constant (Z2/E2) increased withdwell time. No differences between the cortical and trabecularbones were observed. Since each indentation location was slightlydifferent, intra-site variation was observed (Fig. 4c).
3.2.2. Load-rate sensitivity
The loss of energy decreased and the reduced modulusincreased with increasing loading rates in trabecular bone(po0.01), but not in cortical bone (Fig. 5a). Both trabecular andcortical bones showed some strain-rate dependency (Fig. 5b).There was high variation both within and between loading rates(CV 25–40%).
3.2.3. Dissipated energy
The dissipated energy was significantly higher (po0.01) intrabecular than in cortical bone for all cycles. The energycalculated decreased significantly (po0.01) for each of therepeated cycles until the fourth cycle (Fig. 6), i.e. a minimum offour cycles was needed to reach a steady state. The CV remainedat about 20% also in the fourth cycle.
3.2.4. Semi-dynamic test
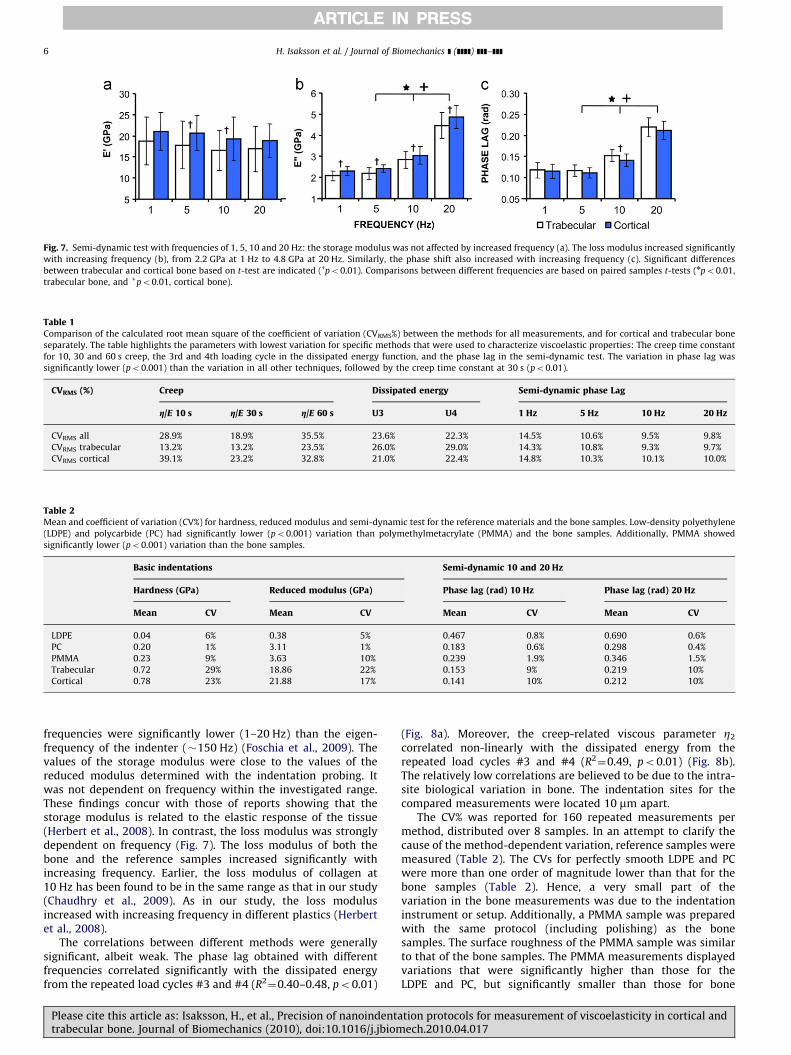
The storage modulus was 17.8 GPa for trabecular bone and20.0 GPa for cortical bone (Fig. 7). The storage modulus wasindependent of the test frequency. However, the loss modulusincreased significantly (po0.01) with increasing frequency
Please cite this article as: Isaksson, H., et al., Precision of nanoindentatrabecular bone. Journal of Biomechanics (2010), doi:10.1016/j.jbiom
(Fig. 7). It was significantly higher (po0.01) in cortical bonethan in trabecular bone. Similarly, the phase lag was dependenton the frequency (Fig. 7). The CV was significantly lower(po0.001) for semi-dynamic testing than for all other methods(CV¼9–15%), and the lowest CV was found at higher frequencies(10–20 Hz) (Table 1).
3.3. Reference materials
The values for the properties of the three reference sampleswere similar to those reported by the manufacturer and inprevious research (Clifford and Seah, 2005; Nagao et al., 2009).The reduced moduli were 0.4, 3.1 and 3.6 GPa for LDPE, PC andPMMA, respectively. With all protocols, the reference materialsshowed higher viscoelastic properties than the bone samples. TheCV was significantly lower (CV¼1–9%, po0.001) for the referencematerials than for the bone samples with all methods (Table 2).
4. Discussion
The present study on bovine cortical and trabecular boneinvestigated the applicability of various methods to determine thetime-dependent viscoelastic properties of bone. We measured thetime-dependent mechanical properties by using the followingfour methods: (1) creep; (2) load-rate dependency; (3) repeatedload cycles, or quasi-static techniques; and (4) semi-dynamictesting. All methods were able to capture the time-dependentresponse of bone. However, the variation between the repeatedmeasurements varied greatly, suggesting different precisions forthe protocols in use (Table 1). The CVRMS% was significantly lower(po0.001) for semi-dynamic testing compared to all othermethods.
The present values and CVs for hardness and reduced modulusare within the range of those reported previously (Fan et al., 2002;Norman et al., 2008; Tai et al., 2007). Tai et al. found nanoscaleheterogeneity in bone samples from various animals andanatomical locations, with CV values ranging from 26% to 46%.
tion protocols for measurement of viscoelasticity in cortical andech.2010.04.017

ARTICLE IN PRESS
Fig. 5. Load-rate dependency: the energy loss, quantified as the area under the
force–displacement curve (a), and the reduced modulus (b) were affected by the
loading rate in trabecular bone, but not in cortical bone. This was confirmed by
calculating the slope of the log[s] vs. log[ _e] curve (c). The slope of the curve (m)
was higher in trabecular bone than in cortical bone (0.095 and 0.028, respectively).
Significant differences between trabecular and cortical bone based on the t-test are
indicated (ypo0.01). Comparisons between parameter values with different
loading rates are based on paired t-tests (npo0.01, trabecular bone).
Fig. 6. Multiple cycles: the dissipated energy during repeated load cycles
decreased significantly during the first three cycles and then stabilized. Significant
differences between trabecular and cortical bone based on the t-test are indicated
(ypo0.01). Comparisons between different cycles are based on paired t-tests
(npo0.01, trabecular bone, and +po0.01, cortical bone).
Fig. 4. Analysis of creep during 10, 30 or 60 s. Based on the fitted parameters of
the four element viscoelastic model, the elastic parameters (E1 and E2) were not
influenced by increased dwell time (a), whereas the time-dependent properties (Z1
and Z2) increased with increasing dwell time (b). An example of the increasing
deformation with increasing creep time also shows the accuracy of the fit (c). This
graph also displays the intra-location variation (10 mm spacing) between each
indentation (c). The variations in creep time constant were lowest for 30 s creep
period (CV¼17.7%). Significant differences between trabecular and cortical bone
based on the t-test are indicated (ypo0.01). Comparisons between parameter
values with different dwell times are based on paired t-tests (npo0.01, trabecular
bone, and +po0.01, cortical bone).
H. Isaksson et al. / Journal of Biomechanics ] (]]]]) ]]]–]]] 5
The hardness and reduced modulus were dependent on theindentation depth in both cortical and trabecular bone. Thehardness showed less scatter than the modulus (Fig. 3c–d).Similar findings have been reported with the collagen type Iscaffolds, where hardness varied less than the reduced modulus(Chaudhry et al., 2009). They suggested that since the hardness,unlike the modulus, is related to the displacement squared,squaring the fractional displacement uncertainties leads tosmaller errors. However, when focusing on the variation inhardness and modulus values (rather than their dependence onindentation depth), the reduced modulus showed significantlylower CV (po0.01) than did the hardness (Table 2).
In the present study, a Burger model was chosen to simulatethe creep response of bone, since it enabled us to capture theimmediate elastic response during indentation (Fischer-Cripps,2004b; Zhang et al., 2008). The creep time constants (Z2/E2) werefound to range from 2.5 to 4.7 s. These findings agree with therecent studies on human cortical bone (Wu et al., 2009). However,they are an order of magnitude lower than those reported on themacroscale (Sasaki and Enyo, 1995). This may be due to severalreasons including the hydration state of the samples, the appliedscale of the deformation or differences in loading direction.
In conventional mechanical tests, the elastic modulus has beenfound to be proportional to strain rate raised to the power of 0.06
Please cite this article as: Isaksson, H., et al., Precision of nanoindentatrabecular bone. Journal of Biomechanics (2010), doi:10.1016/j.jbiom
(Carter and Hayes, 1977). Earlier, a slope of approximately 0.10was found based on nanoindentation (Fan and Rho, 2003). Ourresults for m ranged from �0.03 to �0.10 for cortical andtrabecular bones, respectively (Fig. 5). Hence, the trabecular boneshowed slightly higher strain-rate dependency than the corticalbone. In this study, this method resulted in significantly highervariation than did the other methods (CV 25–35%, po0.001).
Semi-dynamic behavior was evaluated by superimposing asinusoidal force to the specimen by using an alternating currentsignal onto the direct current signal responsible for loading thesample. It was confirmed that 5 s was sufficient to reach steadystate, without being so long that it caused instabilities due to non-negligible thermal drift. Moreover, the effect of the eigenfre-quency of the indenter was found negligible, since our testing
tion protocols for measurement of viscoelasticity in cortical andech.2010.04.017
ARTICLE IN PRESS
Fig. 7. Semi-dynamic test with frequencies of 1, 5, 10 and 20 Hz: the storage modulus was not affected by increased frequency (a). The loss modulus increased significantly
with increasing frequency (b), from 2.2 GPa at 1 Hz to 4.8 GPa at 20 Hz. Similarly, the phase shift also increased with increasing frequency (c). Significant differences
between trabecular and cortical bone based on t-test are indicated (ypo0.01). Comparisons between different frequencies are based on paired samples t-tests (npo0.01,
trabecular bone, and +po0.01, cortical bone).
Table 1Comparison of the calculated root mean square of the coefficient of variation (CVRMS%) between the methods for all measurements, and for cortical and trabecular bone
separately. The table highlights the parameters with lowest variation for specific methods that were used to characterize viscoelastic properties: The creep time constant
for 10, 30 and 60 s creep, the 3rd and 4th loading cycle in the dissipated energy function, and the phase lag in the semi-dynamic test. The variation in phase lag was
significantly lower (po0.001) than the variation in all other techniques, followed by the creep time constant at 30 s (po0.01).
CVRMS (%) Creep Dissipated energy Semi-dynamic phase Lag
g/E 10 s g/E 30 s g/E 60 s U3 U4 1 Hz 5 Hz 10 Hz 20 Hz
CVRMS all 28.9% 18.9% 35.5% 23.6% 22.3% 14.5% 10.6% 9.5% 9.8%
CVRMS trabecular 13.2% 13.2% 23.5% 26.0% 29.0% 14.3% 10.8% 9.3% 9.7%
CVRMS cortical 39.1% 23.2% 32.8% 21.0% 22.4% 14.8% 10.3% 10.1% 10.0%
Table 2Mean and coefficient of variation (CV%) for hardness, reduced modulus and semi-dynamic test for the reference materials and the bone samples. Low-density polyethylene
(LDPE) and polycarbide (PC) had significantly lower (po0.001) variation than polymethylmetacrylate (PMMA) and the bone samples. Additionally, PMMA showed
significantly lower (po0.001) variation than the bone samples.
Basic indentations Semi-dynamic 10 and 20 Hz
Hardness (GPa) Reduced modulus (GPa) Phase lag (rad) 10 Hz Phase lag (rad) 20 Hz
Mean CV Mean CV Mean CV Mean CV
LDPE 0.04 6% 0.38 5% 0.467 0.8% 0.690 0.6%
PC 0.20 1% 3.11 1% 0.183 0.6% 0.298 0.4%
PMMA 0.23 9% 3.63 10% 0.239 1.9% 0.346 1.5%
Trabecular 0.72 29% 18.86 22% 0.153 9% 0.219 10%
Cortical 0.78 23% 21.88 17% 0.141 10% 0.212 10%
H. Isaksson et al. / Journal of Biomechanics ] (]]]]) ]]]–]]]6
frequencies were significantly lower (1–20 Hz) than the eigen-frequency of the indenter (�150 Hz) (Foschia et al., 2009). Thevalues of the storage modulus were close to the values of thereduced modulus determined with the indentation probing. Itwas not dependent on frequency within the investigated range.These findings concur with those of reports showing that thestorage modulus is related to the elastic response of the tissue(Herbert et al., 2008). In contrast, the loss modulus was stronglydependent on frequency (Fig. 7). The loss modulus of both thebone and the reference samples increased significantly withincreasing frequency. Earlier, the loss modulus of collagen at10 Hz has been found to be in the same range as that in our study(Chaudhry et al., 2009). As in our study, the loss modulusincreased with increasing frequency in different plastics (Herbertet al., 2008).
The correlations between different methods were generallysignificant, albeit weak. The phase lag obtained with differentfrequencies correlated significantly with the dissipated energyfrom the repeated load cycles #3 and #4 (R2
¼0.40–0.48, po0.01)
Please cite this article as: Isaksson, H., et al., Precision of nanoindentatrabecular bone. Journal of Biomechanics (2010), doi:10.1016/j.jbiom
(Fig. 8a). Moreover, the creep-related viscous parameter Z2
correlated non-linearly with the dissipated energy from therepeated load cycles #3 and #4 (R2
¼0.49, po0.01) (Fig. 8b).The relatively low correlations are believed to be due to the intra-site biological variation in bone. The indentation sites for thecompared measurements were located 10 mm apart.
The CV% was reported for 160 repeated measurements permethod, distributed over 8 samples. In an attempt to clarify thecause of the method-dependent variation, reference samples weremeasured (Table 2). The CVs for perfectly smooth LDPE and PCwere more than one order of magnitude lower than that for thebone samples (Table 2). Hence, a very small part of thevariation in the bone measurements was due to the indentationinstrument or setup. Additionally, a PMMA sample was preparedwith the same protocol (including polishing) as the bonesamples. The surface roughness of the PMMA sample was similarto that of the bone samples. The PMMA measurements displayedvariations that were significantly higher than those for theLDPE and PC, but significantly smaller than those for bone
tion protocols for measurement of viscoelasticity in cortical andech.2010.04.017

ARTICLE IN PRESS
Fig. 8. Correlations between time-dependent parameters determined with different methods. The phase lag was positively correlated (npo0.01) with the dissipated
energy from cycle 3 (a). The viscous parameter determined by creep (Z2) correlated (npo0.01) with the dissipated energy from cycle 4 non-linearly (b).
H. Isaksson et al. / Journal of Biomechanics ] (]]]]) ]]]–]]] 7
samples (Table 2). The CV of the two perfectly smooth referencesamples (LDPE and PC) was 93% lower than that of the bone. TheCV of the PMMA sample was 80% lower than that of the bone(Table 2). Therefore, we believe the increased variationin the PMMA sample compared with the other reference samples(13% of total CV) can be attributed to the sample preparationprotocol, including the surface roughness of the sample.Based on the comparison between PMMA and bone, we furtherconclude that the main part of the variation in the bonesamples (80%) was due to biological variation (intrinsic hetero-geneity) and not the indentation technique or sample preparationprotocol.
Standardized coefficient of variation (sCV) can be used toaccount for the biological variation in parameter values within thesample population, and thereby better indicate the sensitivity ofthe method (Njeh et al., 2000). In this study, the sCV values weregenerally equal to or higher (20–200%) than the CVRMS values,indicating that the intra- and intersample variations were equallysmall within the tested samples. In total, the sCV values were thelowest for the semi-dynamic test parameters of both trabecular(41–65%) and cortical (41–65%) bone samples, as compared tothose for creep parameters (85–200%) or energy dissipation(51–110%), further supporting our findings.
It is important to emphasize that the different methodsapplied in this study measure different physical quantities. Inthat respect, it is reasonable that each physical quantity hasdifferent kinds of uncertainties and error distributions, and theseerrors do not just originate from the applied method itself, i.e.they are not ‘‘methods artifacts’’. However, they do reflect eachprotocol’s ability to sensitively detect properties of bone.
Surface roughness is known to influence any parametermeasured by nanoindentation (Donnelly et al., 2006). The averagesurface roughness of our measurement grid areas was 55 nm, andthe average indentation depth was 140 nm. Another study thatinvestigated the effect of the surface roughness-ratio reportedthat the CV remained similar regardless of the surface roughness(Tai et al., 2007). Therefore, any effect of surface roughness shouldaffect all measurement methods equally.
With several protocols, cortical bone displayed lower variationthan trabecular bone. This may be attributed to a more highlyorganized bone matrix. All cortical bone samples were orientedsimilarly and indented in the longitudinal direction. In trabecularbone, it was more challenging to determine the local direction ofthe trabeculae, which may explain the increased variation in thetrabecular bone samples (Fan et al., 2002).
The samples in this study were dehydrated and embedded inPMMA. In general, drying increases the modulus of elasticity,tensile and bending strength, while it reduces the fracturetoughness. A previous study showed that drying systematically
Please cite this article as: Isaksson, H., et al., Precision of nanoindentatrabecular bone. Journal of Biomechanics (2010), doi:10.1016/j.jbiom
increased the stiffness of the material, but did not affect thecomparative trends between the samples or indentation location(Hengsberger et al., 2002). Dehydration also affects the boneviscoelasticity. Previous studies performed creep measurementson bone with various degrees of dehydration and found that theviscoelastic properties decreased with increasing dehydration(Bembey et al., 2006a, 2006b). However, most studies still usedehydrated bone tissue to closely control the experimentalenvironment (Lewis and Nyman, 2008).
Low intra-site variation is important when detecting differ-ences in bone samples with various conditions and integrity.However, when investigating merely the material inhomogeneity,minimization of the variation may not be the best criterion forchoosing the method. This study shows that several differentmethods may be used to quantify the time-dependent viscoelasticproperties of bone material. However, CV% was the lowest for thesemi-dynamic test with a high frequency and for creep overlonger time periods.
Conflict of interest statement
None of the authors have any conflicts of interest.
Acknowledgements
Financial support was received from the Academy of Finland(128863 and 127867) and the European Commission (BONEQ-UAL–219980 and NANOINDENT–674002).
References
Banse, X., Devogelaer, J.P., Lafosse, A., Sims, T.J., Grynpas, M., Bailey, A.J., 2002.Cross-link profile of bone collagen correlates with structural organization oftrabeculae. Bone 31, 70–76.
Bembey, A.K., Bushby, A.J., Boyde, A., Ferguson, V.L., Oyen, M.L., 2006a. Hydrationeffects on the micro-mechanical properties of bone. Journal of MaterialsResearch 21, 1962–1968.
Bembey, A.K., Oyen, M.L., Bushby, A.J., Boyde, A., 2006b. Viscoelastic properties ofbone as a function of hydration state determined by nanoindentation.Philosophical Magazine 86, 5691–5703.
Boivin, G., Bala, Y., Doublier, A., Farlay, D., Ste-Marie, L.G., Meunier, P.J., Delmas,P.D., 2008. The role of mineralization and organic matrix in the microhardnessof bone tissue from controls and osteoporotic patients. Bone 43, 532–538.
Burr, D.B., 2002. The contribution of the organic matrix to bone’s materialproperties. Bone 31, 8–11.
Carter, D.R., Hayes, W.C., 1977. The compressive behavior of bone as a two-phaseporous structure. Journal of Bone and Joint Surgery 59, 954–962.
Chaudhry, B., Ashton, H., Muhamed, A., Yost, M., Bull, S., Frankel, D., 2009.Nanoscale viscoelastic properties of an aligned collagen scaffold. Journal ofMaterial Science: Materials in Medicine 20, 257–263.
tion protocols for measurement of viscoelasticity in cortical andech.2010.04.017

ARTICLE IN PRESS
H. Isaksson et al. / Journal of Biomechanics ] (]]]]) ]]]–]]]8
Clifford, C.A., Seah, M.P., 2005. Quantification issues in the identification ofnanoscale regions of homopolymers using modulus measurement via AFMnanoindentation. Applied Surface Science 252, 1915–1933.
Donnelly, E., Baker, S.P., Boskey, A.L., van der Meulen, M.C., 2006. Effects of surfaceroughness and maximum load on the mechanical properties of cancellousbone measured by nanoindentation. Journal of Biomedical Materials ResearchPart A 77, 426–435.
Fan, Z., Swadener, J.G., Rho, J.Y., Roy, M.E., Pharr, G.M., 2002. Anisotropic propertiesof human tibial cortical bone as measured by nanoindentation. Journal ofOrthopaedic Research 20, 806–810.
Fan, Z., Rho, J.Y., 2003. Effects of viscoelasticity and time-dependent plasticity onnanoindentation measurements of human cortical bone. Journal of BiomedicalMaterials Research Part A 67, 208–214.
Fischer-Cripps, A.C., 2004a. Nanoindentation. Springer, New York.Fischer-Cripps, A.C., 2004b. A simple phenomenological approach to nanoindenta-
tion creep. Materials Science and Engineering A—Structural Materials Proper-ties Microstructure and Processing 385, 74–82.
Foschia, R., Jobin, M., Hengsberger, S., 2009. Local dynamic mechanical analysis.Micron 40, 51–55.
He, L.H., Swain, M.V., 2009. Nanoindentation creep behavior of human enamel.Journal of Biomedical Materials Research Part A 91, 352–359.
Hengsberger, S., Kulik, A., Zysset, P., 2002. Nanoindentation discriminates theelastic properties of individual human bone lamellae under dry andphysiological conditions. Bone 30, 178–184.
Herbert, E.G., Oliver, W.C., Pharr, G.M., 2008. Nanoindentation and the dynamiccharacterization of viscoelastic solids. Journal of Physics D—Applied Physics41, 074021.
Knott, L., Bailey, A.J., 1998. Collagen cross-links in mineralizing tissues: a review oftheir chemistry, function, and clinical relevance. Bone 22, 181–187.
Les, C.M., Spence, C.A., Vance, J.L., Christopherson, G.T., Patel, B., Turner, A.S.,Divine, G.W., Fyhrie, D.P., 2004. Determinants of ovine compact boneviscoelastic properties: effects of architecture, mineralization, and remodeling.Bone 35, 729–738.
Les, C.M., Vance, J.L., Christopherson, G.T., Turner, A.S., Divine, G.W., Fyhrie, D.P.,2005. Long-term ovariectomy decreases ovine compact bone viscoelasticity.Journal of Orthopaedic Research 23, 869–876.
Lewis, G., Nyman, J.S., 2008. The use of nanoindentation for characterizing theproperties of mineralized hard tissues: state-of-the art review. Journal ofBiomedical Materials Research Part B: Applied Biomaterials 87, 286–301.
Mayo, M.J., Siegel, R.W., Narayanasamy, A., Nix, W.D., 1990. Mechanical-propertiesof nanophase TiO2 as determined by nanoindentation. Journal of MaterialsResearch 5, 1073–1082.
Mittra, E., Akella, S., Qin, Y.X., 2006. The effects of embedding material, loading rateand magnitude, and penetration depth in nanoindentation of trabecular bone.Journal of Biomedical Materials Research Part A 79, 86–93.
Please cite this article as: Isaksson, H., et al., Precision of nanoindentatrabecular bone. Journal of Biomechanics (2010), doi:10.1016/j.jbiom
Nagao, S., Fujikane, M., Tymiak, N., Nowak, R., 2009. Achieving consistency ofYoung’s modulus determination from nanoscale deformation of low-k films.Journal of Applied Physics 105, 106104.
Njeh, C.F., Hans, D., Li, J., Fan, B., Fuerst, T., He, Y.Q., Tsuda-Futami, E., Lu, Y., Wu,C.Y., Genant, H.K., 2000. Comparison of six calcaneal quantitative ultrasounddevices: precision and hip fracture discrimination. Osteoporosis International11, 1051–1062.
Norman, J., Shapter, J.G., Short, K., Smith, L.J., Fazzalari, N.L., 2008. Micromecha-nical properties of human trabecular bone: a hierarchical investigationusing nanoindentation. Journal of Biomedical Materials Research Part A 87A,196–202.
Oliver, W.C., Pharr, G.M., 1992. An improved technique for determining hardnessand elastic-modulus using load and displacement sensing indentationexperiments. Journal of Materials Research 7, 1564–1583.
Oyen, M.L., Ferguson, V.L., Bembey, A.K., Bushby, A.J., Boyde, A., 2008. Compositebounds on the elastic modulus of bone. Journal of Biomechanics 41,2585–2588.
Oyen, M.L., Cook, R.R., 2009. A practical guide for analysis of nanoindentation data.Journal of the Mechanical Behavior of Biomedical Materials 2, 396–407.
Rho, J.Y., Tsui, T.Y., Pharr, G.M., 1997. Elastic properties of human cortical andtrabecular lamellar bone measured by nanoindentation. Biomaterials 18,1325–1330.
Roy, M.E., Rho, J.Y., Tsui, T.Y., Evans, N.D., Pharr, G.M., 1999. Mechanical andmorphological variation of the human lumbar vertebral cortical and trabecularbone. Journal of Biomedical Materials Research 44, 191–197.
Sasaki, N., Enyo, A., 1995. Viscoelastic properties of bone as a function of watercontent. Journal of Biomechanics 28, 809–815.
Tai, K., Dao, M., Suresh, S., Palazoglu, A., Ortiz, C., 2007. Nanoscale heterogeneitypromotes energy dissipation in bone. Nature Materials 6, 454–462.
Wang, X., Bank, R.A., TeKoppele, J.M., Agrawal, C.M., 2001. The role of collagen indetermining bone mechanical properties. Journal of Orthopaedic Research 19,1021–1026.
Wang, X., Shen, X., Li, X., Agrawal, C.M., 2002. Age-related changes in the collagennetwork and toughness of bone. Bone 31, 1–7.
Wu, Z., Baker, T.A., Ovaert, T.C., Niebur, G.L., 2009. Viscoelastic propertiesof human cortical bone tissue depend on gender. In: Proceedings ofthe 55th Annual Conference of the Orthopaedic Research Society, LasVegas, USA.
Zhang, J., Niebur, G.L., Ovaert, T.C., 2008. Mechanical property determination ofbone through nano- and micro-indentation testing and finite elementsimulation. Journal of Biomechanics 41, 267–275.
Zysset, P.K., Guo, X.E., Hoffler, C.E., Moore, K.E., Goldstein, S.A., 1999. Elasticmodulus and hardness of cortical and trabecular bone lamellae measuredby nanoindentation in the human femur. Journal of Biomechanics 32,1005–1012.
tion protocols for measurement of viscoelasticity in cortical andech.2010.04.017