Embed Size (px)
Citation preview
Polymers 2020, 12, 1559; doi:10.3390/polym12071559 www.mdpi.com/journal/polymers
Article
An Integrated Approach to Optimizing Cellulose Mercerization
Monica Ferro 1,*, Alberto Mannu 1, Walter Panzeri 2, Con H.J. Theeuwen 3 and Andrea Mele 1,2,*
1 Department of Chemistry, Materials and Chemical Engineering “G. Natta”, Politecnico di Milano,
Piazza L. da Vinci 32, 20133 Milano, Italy; [email protected] 2 CNR–SCITEC, Istituto di Scienze e Tecnologie Chimiche, Via Alfonso Corti 12, 20133 Milano, Italy;
[email protected] 3 Nouryon Chemicals bv, Westervoortsedijk 73, 6827 AV Arnhem, The Netherlands;
* Correspondence: [email protected] (M.F.); [email protected] (A.M.);
Tel.: +39-02-2399-3010 (M.F.); +39-02-2399-3006 (A.M.)
Received: 1 July 2020; Accepted: 13 July 2020; Published: 14 July 2020
Abstract: An integrated approach, based on quantitative transmission mode powder X-ray
diffraction (PXRD) combined with multivariate statistical analysis, has been applied to cellulose
obtained from three different sources to correlate the mercerization degree and crystallinity with
the cellulose type, temperature, and reaction time. The effects of the experimental conditions on the
two outcomes were studied by design of experiments (DoE) and surface responding analysis (SRA)
combined with principal component analysis (PCA). SRA showed a marked influence of the type of
cellulose (wood cellulose from the kraft vs. sulfite process, WCK vs. WCS) on the conversion of
cellulose I to cellulose II (CII%) during mercerization. A counterintuitive simultaneous effect of
temperature and cellulose type was also highlighted. The data elaboration in the form of response
surface plots provided an easy predictive tool for the optimum conditions to maximize the
conversion. The simulation reported for WCK showed maximum conversion (96%) at 70 °C in 24 h
with 18%wt NaOH.
Keywords: Cellulose; mercerization; XRD; PCA; DoE
1. Introduction
Cellulose, the most abundant polysaccharide in nature, is formed of anhydroglucopyranose
(AGU) repeat units linked by β(1→4) glyosidic bonds. Cellulose can be obtained from several plant
fibres and through the delignification of woody plants [1]. It is characterized by a complex
supramolecular structure that is known to affect both the reactivity and macroscopic properties of
the cellulose polymer [2]. Native cellulose is a mixture of two crystalline forms, Iα and Iβ. Cellulose
Iα has a triclinic unit cell containing one chain (P1 space group) and is present in algae and bacteria,
while cellulose Iβ has a two-chain monoclinic cell (P21 space group) and is found in higher plants [3].
Cellulose is considered the main renewable source of C atoms as an alternative to fossil fuels.
Cellulose is also the starting material for several classes of derivatives, which are mainly produced
from dissolving-grade wood pulps (hardwood and softwood) containing hemicellulose and small
amounts of lignin. To a lesser extent, cotton linters are used when a refined pure raw material is
required with high cellulose content, low hemicellulose and lignin contents, and homogeneous
molecular weight distribution [4–6]. According to the literature [7], cotton and wood cellulose contain
predominantly the Iβ form, which, for clarity, will be referred to hereafter as cellulose I (CI). In
addition to CI, crystalline modification cellulose II (CII) is important industrially because it is the
starting material for the preparation of many cellulose derivatives, such as viscose [8] and cellulose

Polymers 2020, 12, 1559 2 of 15
ethers and esters [9]. The most important contributions to the global production of cellulose
derivatives come from cellulose acetate, used in coatings and membranes [10], cellulose xanthate,
used in textiles [11] and carboxymethylcellulose [12], used in coatings, paint, and pharmaceuticals
[13,14].
Cellulose chains tend to aggregate by forming an ordinate network of intermolecular hydrogen
bonds, as Figure 1 (green and red lines). Additionally, each cellulose chain of both CI and CII has
limited conformational flexibility for the presence of two types of intramolecular hydrogen bonds: (i)
those connecting O2–H hydroxyl groups to the O atom of the primary OH groups of the neighbouring
AGU (Figure 1, yellow lines) and ii) those connecting O3–H to the pyranosidic O atom (O6) of
neighbouring AGU (Figure 1, blue lines) [15].
Figure 1. Intermolecular and intramolecular hydrogen bonds in structures CI and CII: Intramolecular
2(OH) … O-6 (yellow dashes), intramolecular O(3)H–O pyranosidic (blue dots), intermolecular
O(6)H–O(3′) (green dashes and dots), and intermolecular O(2)H–O(2) and O(6)H–O(2′) (red lines).
These structural motives provide CI with a compact structure that makes cellulose, in its native
form, recalcitrant to reactions. To convert native cellulose into cellulose derivatives, good cellulose
accessibility and reactivity are desired [16]. The accessibility of CI, namely, the possibility for
reactants to reach and react with free OH groups on the polysaccharide backbone, leading to cellulose
derivatives, depends on: (i) surface area, as determined by the size of the accessible cellulose fibril
aggregates, (ii) cellulose macromolecular structure, which determines the hydroxyl groups that are
accessible and (iii) size and type of reagent used during derivatisation. The accessibility of the fibril
surface or fibril aggregates is limited by the compact structure of CI, which is determined by the
presence of highly ordered regions formed by strong hydrogen bond networks [17] (Figure 2). The
reactivity of cellulose can refer to its capacity to undergo diverse chemical reactions. Accordingly,
accessibility is a necessary, but not sufficient, condition for efficient cellulose derivatization. Each
AGU in a cellulose chain has three different types of hydroxyl groups (Figure 1), with hydroxyl
groups O(2)H and O(6)H as the main reactive groups that are susceptible to chemical attack and
functionalization[18].

Polymers 2020, 12, 1559 3 of 15
Figure 2. Cellulose fibrils in CI. Highly-ordered regions (crystalline domain) and disordered regions
(amorphous domain) are shown.
Several studies have attempted to overcome the problem of cellulose recalcitrance to chemical
modifications. However, due to the complexity of the cellulose structure, many aspects remain to be
considered altogether, such as wood species, morphology and pulping process [19]. The
unambiguous and quantitative evaluation of cellulose accessibility is difficult because it depends on
several factors, such as particle size, degree of polymerization (DP), crystallinity and cellulose purity
(presence of hemicellulose or lignin). Alkali treatment is a well-known approach to cellulose
activation, and is commonly referred to as mercerization [20–24]: in this process, the more reactive
and thermodynamically stable CII is formed from CI. When cellulose interacts with NaOH, Na+
cations penetrate intracrystalline spaces, causing the cellulose to swell. Consequently, intermolecular
hydrogen bonds (Figure 1) are broken. After washing, neutralizing and drying, cellulose undergoes
an irreversible morphological and structural change to CII that is characterized by an antiparallel
chain motif. This latter structural detail was confirmed by Langan et al. at 1 Å resolution [25]. This
structure is stabilized by a network of intermolecular hydrogen bonds of type O2-H---O6, O6-H---
O6, and O2-H---O2 (Figure 1) [26,27]. Some hydroxyl groups that are inaccessible in the CI crystalline
form become accessible in the more amorphous CII form. The number of available hydroxyl groups
in CII is increased by around 25% compared with CI, [28,29] making mercerization a fundamental
step for cellulose activation toward further transformations. As previously reported, the polymorphic
transformation of CI into CII is initiated at a sodium hydroxide concentration greater than 7–8 wt%
[30–33], but mercerization probably already starts at low NaOH concentration (between 5–7 wt%)
and low temperatures (near 0 °C) depending on the cellulose source [34,35].
The mercerization process has a non-negligible environmental impact [36,37], as treating
cellulose with strong alkali produces a large volume of dilute sodium hydroxide solution waste. This
is toxic to wildlife and cannot be discharged into groundwater for economic and ecological reasons.
An important approach to sustainability involves reducing the energy and chemicals used in this
process. In principle, this could be achieved by optimizing the mercerization process parameters.
This study aims to develop a general model based on analytical and statistical data to select the
optimum mercerization parameters. The present work does not aim to estimate the best
mercerization conditions that are already widely studied in the literature, nor the thorough
characterization of the interplay of CI and CII in the merceritazione process, recently investigated via
both PXRD and solid state 13C NMR spectroscopy [38,39]. Rather, the purpose of the work is to
provide analytical and predictive tools that allow to optimize the mercerization reaction in the range
of time and temperature mimicking that of the actual industrial production carried out in real plants.
To this end, we report on lab scale mercerization tests done on different types of cellulose and
exploring the time and temperature range compatible with that used in typical cellulose derivative
production [40].
Three commercially- and industrially-relevant cellulose types were considered, namely, cotton
linters cellulose (CLC), wood cellulose obtained from the kraft process (WCK) and wood cellulose
obtained from the sulfite process (WCS). Mercerization is strongly dependent on the reaction
conditions, such as temperature, NaOH concentration, and reaction time [41–43]. Cellulose samples
were treated on a laboratory scale by using 18 wt% NaOH solution at different mercerization times
and temperatures. Morphological and structural changes were studied by scanning electron

Polymers 2020, 12, 1559 4 of 15
microscopy (SEM) and transmission-mode powder X-ray diffraction (PXRD), respectively. For the
latter measurements, tailored and novel sample preparation is presented herein. The proposed
protocol has two main advantages: (i) Pellet sample preparation significantly improves the quality of
transmission mode data by reducing the effect of air scattering, which is known to lead to spectral
noise or problems with the baseline due to a diffuse background; [44] and (ii) the spectrum obtained
in transmission mode shows more defined peaks in the region of 2θ = 25–40° due to the preferred
orientation, generally referred to as texture, of well-oriented cellulose fibrils. In particular, we showed
that the reflection due to the 004 crystalline plane at 2θ = 34.8° can be conveniently exploited (vide
ultra) as an experimental descriptor of CI conversion to CII. Notably, this diffraction peak was hardly
detected in reflection mode.
Cellulose reactivity was also evaluated by multivariate analysis (principal component analysis,
PCA) of the PXRD data. The effects of temperature and time on different celluloses were evaluated
using a statistical approach by DoE analysis. The results of the present work provide information on
the influence of reaction parameters on the quality of the treated cellulose. This represents the starting
point for both process optimization strategies and the formulation of new strategies. Furthermore,
the method presented was conceptualized and set up to avoid incomplete or excessive mercerization,
which result in unwanted insoluble fractions and wasted time, energy and reagents (NaOH and
cellulose). From this standpoint, and considering the scenario of a real-time quality control in the
production line, it is important to stress that PXR diffraction represents an ideal source of input data
for both multivariate analysis and DoE, for the accuracy of the data, the running costs of a standard
powder diffractometer for routine analysis and the measurement time per sample.
2. Materials and Methods
2.1. Materials
Cellulose samples (WCS, CLC, and WCK) were supplied by Akzo Nobel Chemicals S.p.A.
Novara (Novara, Italy) and milled to a maximum particle size of 500 μm.
The reported composition of celluloses was provided by Innovhub (Milano, Italy) according to
the National Renewable Energy Laboratory protocol (NREL/TP-510-42618 2008) [45]. The relative
error on mass determination was in the range 2–4%.
The mass values were then converted in%wt leading to the following compositions:
WCS from softwood: 88.7% glucose, 8.6% mannose.
WCK from softwood: 80.9% glucose, 5.8% xylose, 4.1% arabinose, 9.2% mannose.
CLC from cotton linters: glucose ≥99%.
2.2. Mercerization Protocol
Cellulose mercerization was performed in a 50-mL Erlenmeyer flask. Powder milled cellulose
(200 mg) was completely soaked with NaOH solution (4 mL, 18 wt%) and allowed to react at different
temperatures (rt, 40 °C, 60 °C, and 80 °C) for different contact times (15 min, 30 min, 1 h and 48 h).
After 48 h, mercerization was considered complete, with the sample taken as the reference for totally
mercerized cellulose. After treatment, the mercerized samples were washed to neutral pH with
deionized water. The sample was then filtered using a Buchner funnel and the residue was air-dried
overnight. An example of morphological analysis of cotton linters cellulose is discussed in Section
3.3.
2.3. Wide-Angle X-Ray Diffraction: Sample Preparation and Data Collection
A novel, simple and efficient method for the characterization of cellulose and evaluation of CI
conversion to CII is proposed herein. Our approach was based on innovative sample preparation for
PXRD and the use of X-ray diffraction data collected in both reflection and transmission mode. PXRD
samples were prepared as compact pellets of compressed cellulose powder. The pellets, mounted
onto tailored sample holders, were then examined in both transmission and reflection geometry.

Polymers 2020, 12, 1559 5 of 15
Reflection mode is commonly used for PXRD data collection, [46–48], while data collection in
transmission mode is less common [49,50], although it has already been used for cellulose
characterization [51]. Cellulose pellets were prepared by pressing milled cellulose (150 mg) with a
KBr die set usually used to prepare KBr pellet samples for FT-IR analysis. The pellet was used for
transmission mode PXRD data collection instead of the usual powder sample by placing in the
sample holder of the diffractometer. This procedure improved XRD sensitivity by providing PXRD
spectra with better signal-to-noise (S/N) ratios. The pressure applied did not alter the crystal structure
of the cellulose sample.
Cellulose Iβ and II reflections were indexed according to French [52]. Data analysis was
performed with Fityk 0.9.8 [53]. Fityk is an open-source software developed by Marcin Wojdyr for
nonlinear fitting of analytical functions (especially peak-shaped) to data (usually experimental data).
It is used in crystallography, chromatography, photoluminescence and photoelectron spectroscopy
and infrared and Raman spectroscopy. Peak deconvolution was carried out with the following
method: the baseline points were added manually, Gaussian peaks were added in the positions
corresponding to the most prominent reflections and to the amorphous region in order to optimize
the total fitting curve. The main crystalline reflections (−110, 110, 102, 200, 004) were fitted with five
different Gaussian curves.
The crystallinity index (C.I.%) was evaluated from PXRD diffractograms obtained in reflection
geometry using a peak-fitting procedure [54–56] as performed by Fityk 0.9.8 software. The C.I.% was
calculated as the ratio of the area of crystalline peaks to the total area. Some examples of
deconvolution are reported in Figures S1 and S2.
PXRD data collection was performed on a Bruker D2 Phaser X-ray powder diffractometer using
CuKα radiation. Data were collected in the 2θ range of 4.7–40° using the following parameters: Step
size, 0.02°; counting time, 0.4 s per step; primary slit module, 0.6 mm; air scatter screen module, 1
mm; and secondary slit module, 8 mm.
2.4. Principal Component Analysis
PXRD diffractograms obtained in transmission mode were subjected to principal component
analysis (PCA). The two main advantages of this technique were that no calculations needed to be
performed on the spectra and the full PXRD diffractogram could be used as the input for PCA
analysis without any manipulation (known as binning). PCA was performed using the entire spectral
region of 2θ = 4–40°. Normalization and Pareto scaling were applied. Spectral data in the ASCII
format were imported into online tool Metaboanalyst 3.0. [57].
2.5. Design of Experiments
Data acquired through PXRD collection were subjected to multivariate analysis employing a
two-level full factorial nk model (n = 2 and K = 3) [58]. Three independent variables k, namely, the
specific process (type of cellulose used), temperature and time, were optimized to study the response
“conversion”, which corresponded to the degree of mercerization. Statgraphics Centurion v15.1.02
software (Statpoint Technologies Inc., The Plains, VA, USA) was used for experimental design data
analysis and to develop the response surface. All statistical analyses were performed by comparing
data with the unpaired Student’s t-test. The normal distribution of the data was checked by the
Kolmogorov–Smirnov and Shapiro tests. p < 0.5 was considered to be statistically significant.
2.6. Scanning Electron Microscopy
The morphology of cellulose before and after mercerization treatment was examined by
Cambridge stereoscan SEM S-360. The following instrumental parameters were used: high voltage:
10 kV, tilt: 0.00. The powdered samples were coated with a thin layer of palladium/gold and carbon
cement was used as adhesive.

Polymers 2020, 12, 1559 6 of 15
3. Results and Discussion
3.1. Structural Characterization
Structural characterization was performed by wide-angle X-ray diffraction of the powder
samples. After data collection, the peak deconvolution routine was applied to the entire spectrum.
An example of deconvolution is shown in Figure 3. The inclusion of further gaussian functions
corresponding to minor reflections (e.g., 211, 013, −113, −112) resulted in unrealistic fitting
characterized by overemphasis of the amorphous halo and physically meaningless negative Gaussian
contributions in the 22–35° 2θ region. A graphic representation is present in the Supplementary
Information as Example 1 and Example 2. Peak parameters were then exported.
Figure 3. XRD peak deconvolution of CLC: the black line is the experimental diffractogram, the red
line is the total fitting, the blue Gaussian peaks represent the main reflections and the orange Gaussian
curve represents the amorphous region.
The conversion of CI to CII (CII%) was evaluated from the experimental PXRD profiles
[25,52,59,60]. Cellulose samples were treated with 18 wt% NaOH for 15 min, 30 min, 1 h and 48 h.
The stacked PXRD profiles of cellulose obtained in transmission mode are shown in Figure 4.
The diffractograms showed changes in intensities of different peaks and a polymorphic
transformation with increasing mercerization time. In particular, a decrease in the intensity of
characteristic peaks of CI (14.7, 16.8, 22.7 and 34.8°) was observed after 15 and 30 min. Meanwhile,
an increase in the intensity of peaks belonging to CII (12.1, 20.1 and 21.9°) was clearly detected [61]
(Figure 4).The XRD diffractograms of CI and CII are reported in the Figure S3.
Polymers 2020, 12, 1559 7 of 15
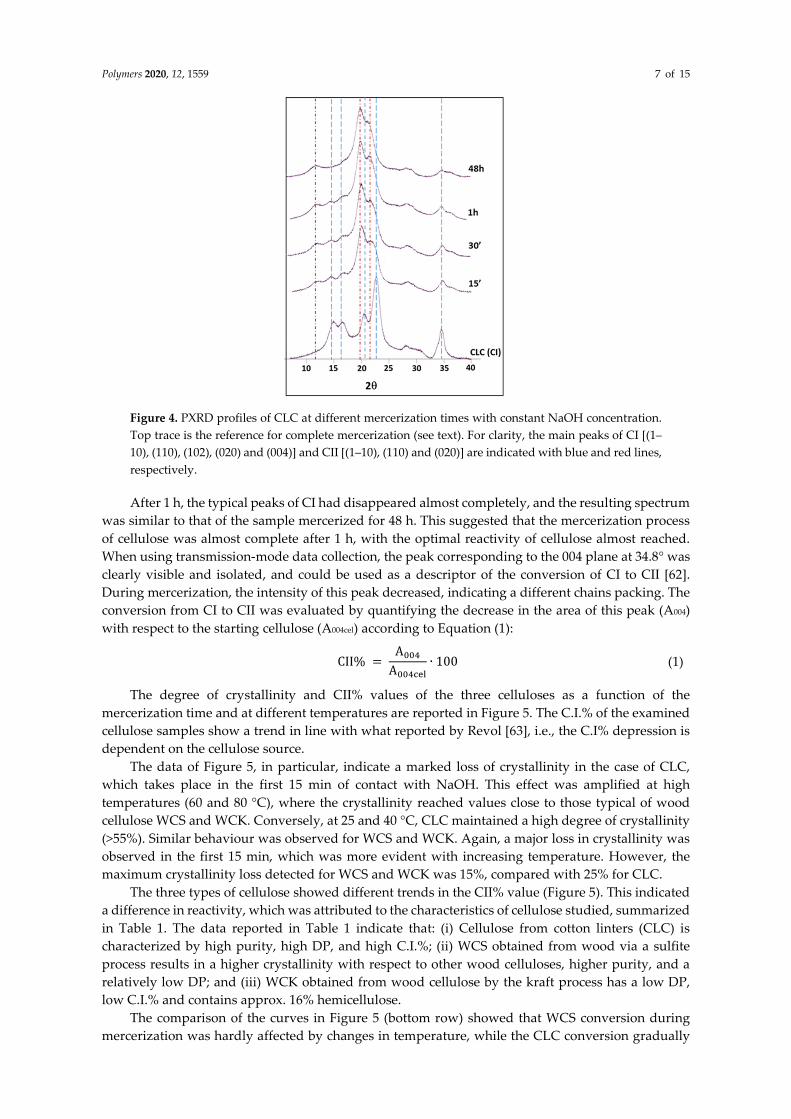
Figure 4. PXRD profiles of CLC at different mercerization times with constant NaOH concentration.
Top trace is the reference for complete mercerization (see text). For clarity, the main peaks of CI [(1–
10), (110), (102), (020) and (004)] and CII [(1–10), (110) and (020)] are indicated with blue and red lines,
respectively.
After 1 h, the typical peaks of CI had disappeared almost completely, and the resulting spectrum
was similar to that of the sample mercerized for 48 h. This suggested that the mercerization process
of cellulose was almost complete after 1 h, with the optimal reactivity of cellulose almost reached.
When using transmission-mode data collection, the peak corresponding to the 004 plane at 34.8° was
clearly visible and isolated, and could be used as a descriptor of the conversion of CI to CII [62].
During mercerization, the intensity of this peak decreased, indicating a different chains packing. The
conversion from CI to CII was evaluated by quantifying the decrease in the area of this peak (A004)
with respect to the starting cellulose (A004cel) according to Equation (1):
CII% = A���
A������
∙ 100 (1)
The degree of crystallinity and CII% values of the three celluloses as a function of the
mercerization time and at different temperatures are reported in Figure 5. The C.I.% of the examined
cellulose samples show a trend in line with what reported by Revol [63], i.e., the C.I% depression is
dependent on the cellulose source.
The data of Figure 5, in particular, indicate a marked loss of crystallinity in the case of CLC,
which takes place in the first 15 min of contact with NaOH. This effect was amplified at high
temperatures (60 and 80 °C), where the crystallinity reached values close to those typical of wood
cellulose WCS and WCK. Conversely, at 25 and 40 °C, CLC maintained a high degree of crystallinity
(>55%). Similar behaviour was observed for WCS and WCK. Again, a major loss in crystallinity was
observed in the first 15 min, which was more evident with increasing temperature. However, the
maximum crystallinity loss detected for WCS and WCK was 15%, compared with 25% for CLC.
The three types of cellulose showed different trends in the CII% value (Figure 5). This indicated
a difference in reactivity, which was attributed to the characteristics of cellulose studied, summarized
in Table 1. The data reported in Table 1 indicate that: (i) Cellulose from cotton linters (CLC) is
characterized by high purity, high DP, and high C.I.%; (ii) WCS obtained from wood via a sulfite
process results in a higher crystallinity with respect to other wood celluloses, higher purity, and a
relatively low DP; and (iii) WCK obtained from wood cellulose by the kraft process has a low DP,
low C.I.% and contains approx. 16% hemicellulose.
The comparison of the curves in Figure 5 (bottom row) showed that WCS conversion during
mercerization was hardly affected by changes in temperature, while the CLC conversion gradually

Polymers 2020, 12, 1559 8 of 15
increased with increasing temperature. WCK conversion was sensitive to temperature in the range
of 25–60 °C, with no further improvement in conversion observed above 60 °C. All C.I.% and CII%
values are reported in the SI (Tables S1–S3).
As mentioned previously, the reactivity of cellulose resulted from the correlation of several
parameters. This makes studying cellulose reactivity using a one-factor-at-a-time approach difficult.
Furthermore, effects related to the concomitant variation of more than one parameter on the system
cannot be analysed using classic 2D plots. Accordingly, multivariate statistical approaches, namely,
PCA and DoE, were used to evaluate the effect of multiple variations of different parameters on the
type of process, conversion, and loss of crystallinity.
Table 1. Main parameters of the studied cellulose.
Cellulose C.I.% DP a Hemicellulose Content% Particle Size (m)
WCK 58 500–700 19 500
WCS 54 1000–1300 9 500
CLC 73 1000–5000 - 500
a DP values were obtained from supplier.
Figure 5. Trends in the crystallinity index (C.I.%, top row) and conversion (CII%, bottom row) of
cellulose I to cellulose II at different mercerization times for CLC, WCS and WCK at different
temperatures.
3.2. Morphological Characterization
The SEM images reported in Figure 6 report the evolution of the morphology of the CLC fibres
before and after mercerization [64,65]. The morphological changes after NaOH treatment can be
summarized as follows: before the treatment, the fibres resulted thin and straight, and showed the
typical ribbon-like of native cellulose (Figure 6a).The fibres have an average diameters of 8–15 μm
[62] and a finer network of microfibres 1–2 μm in diameter was found among fibres. These finer fibres
are no longer visible after mercerization (Figure 6b) probably because of a re-aggregation of the larger
fibres during the alkaline treatment [62]. After mercerization, cellulose fibres were slightly thicker
and twisted (Figure 6b, red arrow). The diameter of the fibre are larger than the fibres before the
treatment (15–20 μm). The changes observed by SEM confirm the swelling of the fibres in alkali and
the shrinkage due to the rearrangement of the fibres. At a larger magnification (1000×) differences in
the fibres’ surfaces can be also detected. The native cellulose presents a smooth surface (Figure 6c),

Polymers 2020, 12, 1559 9 of 15
while mercerization shows a rough surface (Figure 6d, green arrow) [48,66]. These differences in
morphological structure and fibre surface were observed also in WCK and WCS samples.
Figure 6. SEM images of CLC sample before mercerization treatment at 400× magnification (a), 1000X
magnification (c) and after mercerization treatment at 400× magnification (b) and 1000× magnification
(d).
3.3. Principal Component Analysis
To achieve a fast and unbiased classification of samples in terms of reactivity, PCA was applied
to the PXRD diffractograms in transmission mode [67,68]. The score plot of mercerized cellulose
samples at different mercerization times (15 min, 30 min, 1 h, and 48 h) is shown in Figure 7. Each
data point in the score plot represents a spectrum. As the proximity of points indicates similarity,
scores closer to the mercerized samples (blue ellipse) were related to samples with higher reactivity.
The distances between scores and the ellipse allowed the sample reactivity to be discriminated.
Figure 7. 3D PCA scores plot of mercerization at 80 °C.
Notably, the samples allowed to react for 1 h were very close to the mercerized samples (blue
ellipse), while those subjected to reaction times of 15 and 30 min differed considerably, allowing
better discrimination of the sample reactivity. Scores representing reaction times of 15 and 30 min
showed that, at 80 °C, the order of conversion was WCK > WCS, CLC. The scores for CLC were the
most distant from the blue ellipse, indicating that the conversion after 15 and 30 min was low.

Polymers 2020, 12, 1559 10 of 15
Different cellulose samples clearly required different mercerization conditions. From this
perspective, this study aids the prediction and adjustment of process parameters for mercerization.
Although PCA analysis showed the similarity among the samples, it was difficult in this case to
integrate all variables in a single score plot. Therefore, different conditions influencing cellulose
reactivity should be studied simultaneously and correlated to each other. For this reason, design of
experiments was performed.
3.4. Design of Experiments
PCA of the PXRD data showed that the CII% value at a fixed temperature was influenced by the
specific treatment and processing time. By performing multivariate analysis, the simultaneous
influence of temperature (T) and time (t) on the process could be assessed and used to optimize the
mercerization conditions and enhance the process efficiency. This approach has already been
successful employed to improve industrial processes, such as wastewater treatment [69], grinding
optimization [70] and biological processes [71] in the production of biolubricants [72] and other areas
of industrial interest [73].
Each of the three mercerization procedures discussed above were subjected to multivariate
analysis. To demonstrate the power of the multivariate approach, we have reported the analysis of
mercerization involving only wood celluloses WCK and WCS. The temperature range considered
was 25 °C < T < 80 °C, while the reaction time range was 15 min < t < 48 h. Multivariate analysis of the
factors, as summarized in the Pareto chart in Figure 8, showed that temperature, process, time, and
the combination of process and temperature (AB in Figure 8) had relevant effects (p < 0.05). For clarity,
“process” in the DoE section refers to the type of cellulose tested (WCK and WCS).
Figure 8. Pareto chart for conversion related to the WCK and WCS processes.
The relevant effects of temperature and time were also obtained from the PCA data, while the
important effect of the process was not evident. In this respect, the WCK and WCS processes are
usually described as very similar because both derive from the same raw cellulose (wood pulp
cellulose). Furthermore, the relevant combined effect of process and temperature was only noted by
multivariate analysis.
The specific effects of each factor are better highlighted in the main effect plot shown in Figure
9.
Figure 9. Main effect plot for conversion relative to the WCK and WCS processes.

Polymers 2020, 12, 1559 11 of 15
From the main factors plot, the WCK process evidently allowed a higher cellulose conversion to
be reached compared with the sulfite treatment. From analysis of the slope of each curve, the
magnitude of the effects of each factor on the conversion could be compared. Temperature had the
greatest impact on the conversion, followed by the process and reaction time, which showed similar
slopes.
To optimize these parameters and increase the efficiency of the two processes, response surface
analysis was performed (Figure 10). The response surface model was implemented to maximize the
CII% value. This target was expressed as a function of desirability, which ranged from 0
(corresponding to the minimum desirability and a conversion of 60%) to 1 (corresponding to a
conversion of 96%).
By employing the statistical model developed and presented herein, many working conditions
could be simulated and the process of choice optimized for the mercerization of wood cellulose. By
setting the process temperature to 80 °C and mercerizing for at least 10 h, high conversions (96%)
could only be reached for cellulose from the WCK process (Figure 10, top left) while, for WCS, the
maximum desirability reached was about 60%, corresponding to 79% conversion, even after
mercerization for 48 h at 80 °C. The response surface model implemented showed that the maximum
desirability could be reached by the WCK process at 70 °C (Figure 9, top right). In fact, 70 °C was the
minimum temperature that led to the maximum possible conversion (96%). Furthermore, the model
allowed the mercerization time to be optimized. The simulation reported in Figure 10 (below left)
showed that 24 h was the minimum process time needed to reach the maximum conversion.
Further simulations based on the present model are reported in the Supporting Information
(Figures S4–S13 and Tables S4–S10).
Figure 10. Estimated response surface for cellulose produced through the WCK and WCS processes.
Temperature and time are expressed in °C and h, respectively.
4. Conclusions
A set of analytical tools for estimating and improving the efficiency of the mercerization process
applied to industrial cellulose samples was presented. Three industrial celluloses were mercerized
under different conditions, and the conversion from CI to CII (CII%) and crystallinity (CI%) were
determined by PXRD. The combination of tablet sample preparation and high-quality X-ray data
acquisition in transmission mode was conveniently exploited as the input for PCA and multivariate
analysis of the PXRD data by DoE. This approach allowed all relevant parameters influencing the
conversion in industrial mercerization processes to be determined. Furthermore, by combining the
statistical results with an implemented desirability function, a suitable model for the optimization of

Polymers 2020, 12, 1559 12 of 15
mercerization efficiency was formulated by performing response surface analysis. In particular, a
specific tool for tuning the conversion of different wood celluloses by properly modifying the
temperature, reaction time, and specific process was presented and discussed. The multivariate
model proposed allowed relevant hidden differences between celluloses, which apparently have
similar characteristics, to be determined.
Supplementary Materials: The following are available online at www.mdpi.com/2073-4360/12/7/1559/s1, Figure
S1. XRD peak deconvolution of WCS; Figure S2. XRD peak deconvolution of WCK; Figure S3. XRD
diffractogramms of CI (top) and CII (bottom); Figure S4. Estimated surface response after 1 h of mercerization;
Figure S5. Estimated surface response after 6 h of mercerization; Figure S6. Estimated surface response after 12
h of mercerization; Figure S7. Estimated surface response after 18 h of mercerization; Figure S8. Estimated
surface response after 24 h of mercerization; Figure S9. Estimated surface response after 36 h of mercerization;
Figure S10. Estimated surface response for the mercerization conducted at 25 °C; Figure S11. Estimated surface
response for the mercerization conducted at 50 °C; Figure S12. Estimated surface response for the mercerization
conducted at 70 °C; Figure S13. Estimated surface response for the mercerization conducted at 80 °C; Table S1.
Crystallinity (C.I.%) and conversion (CII%) values obtained from XRD for CLC; Table S2. Crystallinity (C.I.%)
and conversion (CII%) values obtained from XRD for WCS; Table S3. Crystallinity (C.I.%) and Conversion
(CII%) values obtained from XRD for WCK; Table S4. Independent and dependent variables considered; Table
S5. Response; Table S6. Randomized order and condition of the experiments; Table S7. Analysis of the factors;
Table S8. ANOVA table; Table S9. Main data for the multiple response implementation; Table S10. Data relative
to the implementation of the desirability function.
Author Contributions: The manuscript was written through contributions of all authors. All authors have read
and agreed to the published version of the manuscript.
Funding: This research was funded by Nouryon Chemicals bv, Westervoortsedijk 73, 6827 AV Arnhem, The
Netherlands
Acknowledgments: The Authors wish to thank H.J. Karlsson and P.P. de Wit (Nouryon Chemicals bv,
Westervoortsedijk 73, 6827 AV Arnhem, The Netherlands) for support and discussions. The Authors also thank
Alessandro Taras for support in the multivariate analysis.
Conflicts of Interest: The authors declare no conflict of interest
References
1. Fan, L.; Gharpuray, M.M.; Lee, Y. Nature of cellulosic material. In Cellulose Hydrolysis; Springer-Verlag
BeFlin Heidelberg, Germany, 1987; Volume 3.
2. Klemm, D.; Heublein, B.; Fink, H.P.; Bohn, A. Cellulose: Fascinating biopolymer and sustainable raw
material. Angew. Chem. Int. Ed. 2005, 44, 3358–3393.
3. Nishiyama, Y.; Langan, P.; Chanzy, H. Crystal Structure and Hydrogen-Bonding System in Cellulose Iβ
from Synchrotron X-ray and Neutron Fiber Diffraction. J. Am. Chem. Soc. 2002, 124, 9074–9082.
4. Klemm, D.; Philip, B.; Heinze, T.; Heinze, U.; Wagenknecht, W. Comprehensive Cellulose Chemistry, Volume
2: Derivatization of Cellulose; Wiley: Weinheim, Germany, 1998; Volume 2; ISBN 3527294899.
5. Zugenmaier, P. Crystalline Cellulose and Cellulose Derivatives: Characterization and Structures; Springer Science
& Business Media: Berlin, Germany, 2008; ISBN 9783540739333.
6. Stone, B. Cellulose : Structure and Distribution. Biotechnology 2001, 1, 1–8.
7. Atalla, R.H.; Vanderhart, D.L. Native Cellulose: A Composite of Two Distinct Crystalline Forms. Science
1984, 223, 283–285.
8. Mozdyniewicz, D.J.; Nieminen, K.; Sixta, H. Alkaline Steeping of Dissolving Pulp. Part I: Cellulose
Degradation Kinetics. Cellulose 2013, 20, 1437–1451.
9. Albán Reyes, D.C.; Gorzsás, A.; Stridh, K.; de Wit, P.; Sundman, O. Alkalization of dissolving cellulose pulp
with highly concentrated caustic at low NaOH stoichiometric excess. Carbohydr. Polym. 2017, 165, 213–220.
10. Fischer, S.; Thümmler, K.; Volkert, B.; Hettrich, K.; Schmidt, I.; Fischer, K. Properties and Applications of
Cellulose Acetate. Macromol. Symp. 2008, 262, 89–96.
11. Tait, C.W.; Vetter, R.J.; Swanson, J.M.; Debye, P. Physical characterization of cellulose xanthate in solution.
J. Polym. Sci. 1951, 7, 261–276.

Polymers 2020, 12, 1559 13 of 15
12. Ferro, M.; Castiglione, F.; Panzeri, W.; Dispenza, R.; Santini, L.; Karlsson, H.J.; Wit, P.P. De; Mele, A. Non-
destructive and direct determination of the degree of substitution of carboxymethyl cellulose by HR-MAS 13C NMR spectroscopy. Carbohydr. Polym. 2017, 169, 16–22, .
13. Hollabaugh, C.B.; Burt, L.H.; Walsh, A.P. Carboxymethylcellulose. Uses and Applications. Ind. Eng. Chem.
1945, 37, 943–947.
14. Wustenberg, T. Sodium Carboxymethylcellulose. Cellulose and Cellulose Derivatives in the Food Industry; John
Wiley & Sons: Hoboken, NJ, USA, 2014; 387–478.
15. Horii, F.; Hirai, A.; Kitamaru, R. Cross-Polarization-Magic Angle Spinning Carbon-13 NMR Approach to
the Structural Analysis of Cellulose. In The Structures of Cellulose; ACS Symposium Series; American
Chemical Society: Washington, DC, USA, 1987; Volume 340, pp. 119–134; ISBN 0-8412-1032-2.
16. Ye, D.; Farriol, X. Improving accessibility and reactivity of celluloses of annual plants for the synthesis of
methylcellulose. Cellulose 2005, 12, 507–515.
17. Maurer, A.; Fengel, D. Parallel orientation of the molecular chains in cellulose I and cellulose II deriving
from higher plants. Holz Roh Werkst. 1992, 50, 493.
18. Verlhac, C.; Dedier, J.; Chanzy, H. Availability of surface hydroxyl groups in valonia and bacterial cellulose.
J. Polym. Sci. Part A Polym. Chem. 1990, 28, 1171–1177.
19. Köpcke, V. Improvement on Cellulose Accessibility and Reactivity of Different Wood Pulps; KTH: Stockholm,
Sweden, 2008; ISBN 9789171789853.
(https://www.divaportal.org/smash/get/diva2:13984/FULLTEXT01.pdf)
20. Kolpak, F., Francis, J. Determination of the Structure of Cellulose II. Macromolecules 1976, 9, 273–278.
21. Kolpak, F.J.; Weih, M.; Blackwell, J. Mercerization Cellulose: 1. Determination of the structure of mercerized
cotton. Polymer 1978, 19, 123–131.
22. Dinand, E.; Vignon, M.; Chanzy, H.; Heux, L. Mercerization of primary wall cellulose and its implication
for the conversion of cellulose I to cellulose II. Cellulose 2002, 9, 7–18.
23. Gupta, P.K.; Uniyal, V.; Naithani, S. Polymorphic transformation of cellulose i to cellulose II by alkali
pretreatment and urea as an additive. Carbohydr. Polym. 2013, 94, 843–849.
24. Nishimura, H.; Okano, T.; Sarko, A. Mercerization of cellulose. Crystal and molecular structure of Na-
cellulose I. Macromolecules 1991, 24, 759–770.
25. Langan, P.; Nishiyama, Y.; Chanzy, H. X-ray Structure of Mercerized Cellulose II at 1 Å Resolution.
Biomacromolecules 2001, 2, 410–416.
26. Raymond, S.; Kvick The structure of cellulose II: A revisit. Macromolecules 1995, 28, 8422–8425.
27. Langan, P.; Nishiyama, Y.; Chanzy, H. A Revised Structure and Hydrogen-Bonding System in Cellulose II
from a Neutron Fiber Diffraction Analysis. J. Am. Chem. Soc. 1999, 121, 9940–9946.
28. Jeffries, R. The amorphous fraction of cellulose and its relation to moisture sorption. J. Appl. Polym. Sci.
1964, 8, 1213–1220.
29. Pönni, R.; Rautkari, L.; Hill, C.A.S.; Vuorinen, T. Accessibility of hydroxyl groups in birch kraft pulps
quantified by deuterium exchange in D2O vapor. Cellulose 2014, 21, 1217–1226.
30. Jin, E.; Guo, J.; Yang, F.; Zhu, Y.; Song, J.; Jin, Y.; Rojas, O.J. On the polymorphic and morphological changes
of cellulose nanocrystals (CNC-I) upon mercerization and conversion to CNC-II. Carbohydr. Polym. 2016,
143, 327–335.
31. Halonen, H.; Larsson, P.T.; Iversen, T. Mercerized cellulose biocomposites: A study of influence of
mercerization on cellulose supramolecular structure, water retention value and tensile properties. Cellulose
2013, 20, 57–65.
32. Hua Wang, Amjad Farooq, H.M. Influence of cotton fiber properties on the microstructural characteristics
of mercerized fibers by regression analysis. Wood Fiber Sci. 2020, 52, 13–27.
33. Younesi, M.; Wu, X.; Akkus, O. Controlled mercerization of bacterial cellulose provides tunability of
modulus and ductility over two orders of magnitude. J. Mech. Behav. Biomed. Mater. 2019, 90, 530–537.
34. Gralén, N. Cellulose and cellulose derivatives J. Polym. Sci. 1955, 18, 443–444.
35. Ranby, B. The Mercerisation of Cellulose. I. A Thermodynamic Discussion.Acta Chem. Scand. 1952, 6, 110–
115.
36. Shen, L.; Worrell, E.; Patel, M.K. Environmental impact assessment of man-made cellulose fibres. Resour.
Conserv. Recycl. 2010, 55, 260–274.

Polymers 2020, 12, 1559 14 of 15
37. George, M.; Bressler, D.C. Comparative evaluation of the environmental impact of chemical methods used
to enhance natural fibres for composite applications and glass fibre based composites. J. Clean. Prod. 2017,
149, 491–501.
38. Keshk, S.M.A.S. Effect of different alkaline solutions on crystalline structure of cellulose at different
temperatures. Carbohydr. Polym. 2015, 115, 658–662.
39. Nomura, S.; Kugo, Y.; Erata, T. 13C NMR and XRD studies on the enhancement of cellulose II crystallinity
with low concentration NaOH post-treatments. Cellulose 2020, 27, 3553–3563.
40. Sisson, W.; Saner, W. The Effect of the Temperature and the Concentration of Sodium Hydroxide on the X-
ray Diffraction Behavior of Raw and of Degraded Cotton. J. Phys. Chem. 2002, 45, 717–730.
41. Liu, Y.; Hu, H. X-ray diffraction study of bamboo fibers treated with NaOH. Fibers Polym. 2008, 9, 735–739.
42. Colom, X.; Carrillo, F. Crystallinity changes in lyocell and viscose-type fibres by caustic treatment. Eur.
Polym. J. 2002, 38, 2225–2230.
43. Reyes, D.; Sundman, O.; Svedberg, A.; Eliasson, The influence of different parameters on the mercerisation
of cellulose. Cellulose 2014, 23, 1061–1072.
44. Ottani, S.; Riello, P.; Polizzi, S. Complete sets of factors for absorption correction and air scattering
subtraction in X-ray powder diffraction of loosely packed sample. Powder Diffr. 1993, 8, 149–154, .
45. Sluiter, A.; Hames, B.; Ruiz, R.; Scarlata, C.; Sluiter, J.; Templeton, D.; Crocker, D.L.A.P. Determination of
Structural Carbohydrates and Lignin in Biomass. Natl. Renew. Energy Lab. 2008, 1617, 1–16.
46. Park, S.; Johnson, D.K.; Ishizawa, C.I.; Parilla, P.A.; Davis, M.F. Measuring the crystallinity index of
cellulose by solid state 13C nuclear magnetic resonance. Cellulose 2009, 16, 641–647.
47. Ju, X.; Bowden, M.; Brown, E.E.; Zhang, X. An improved X-ray diffraction method for cellulose crystallinity
measurement. Carbohydr. Polym. 2015, 123, 476–481.
48. Zhao, H.; Kwak, J.H.; Conrad Zhang, Z.; Brown, H.M.; Arey, B.W.; Holladay, J.E. Studying cellulose fiber
structure by SEM, XRD, NMR and acid hydrolysis. Carbohydr. Polym. 2007, 68, 235–241.
49. Leppänen, K.; Andersson, S.; Torkkeli, M.; Knaapila, M.; Kotelnikova, N.; Serimaa, R. Structure of cellulose
and microcrystalline cellulose from various wood species, cotton and flax studied by X-ray scattering.
Cellulose 2009, 16, 999–1015.
50. Andersson, S.; Serimaa, R.; Paakkari, T.; SaranpÄÄ, P.; Pesonen, E. Crystallinity of wood and the size of
cellulose crystallites in Norway spruce (Picea abies). J. Wood Sci. 2003, 49, 531–537.
51. Terinte, N.; Ibbett, R.; Schuster, K.C. Overview on Native Cellulose and Microcrystalline Cellulose I
Structure Studied By X-Ray Diffraction ( Waxd ): Comparison Between Measurement Techniques. Lenzing.
Ber. 2011, 89, 118–131.
52. French, A.D. Idealized powder diffraction patterns for cellulose polymorphs. Cellulose 2014, 21, 885–896.
53. Wojdyr, M. Fityk: A general-purpose peak fitting program. J. Appl. Crystallogr. 2010, 43, 1126–1128.
54. Chen, R.; Jakes, K.A.; Foreman, D.W. Peak-fitting analysis of cotton fiber powder X-ray diffraction spectra.
J. Appl. Polym. Sci. 2004, 93, 2019–2024.
55. Thygesen, A.; Oddershede, J.; Lilholt, H.; Thomsen, A.B.; Ståhl, K. On the determination of crystallinity and
cellulose content in plant fibres. Cellulose 2005, 12, 563–576.
56. Oh, S.Y.; Dong, I.Y.; Shin, Y.; Hwan, C.K.; Hak, Y.K.; Yong, S.C.; Won, H.P.; Ji, H.Y. Crystalline structure
analysis of cellulose treated with sodium hydroxide and carbon dioxide by means of X-ray diffraction and
FTIR spectroscopy. Carbohydr. Res. 2005, 340, 2376–2391.
57. Xia, J., Wishart, D. Using MetaboAnalyst 3.0 for Comprehensive Metabolomics Data Analysis. Curr. Protoc.
Bioinform. 2016, 55, 14.10.1–14.10.91.
58. Box, G.; Stuart Hunter, J.; Hunter, W.G. Statistics for Experimenters: Design, Innovation, and Discovery; Wiley:
Hoboken, NJ, USA, 2005; chapter 10, 363–424
59. Borysiak, S.; Garbarczyk, J. Applying the WAXS method to estimate the supermolecular structure of
cellulose fibres after mercerisation. Fibres Text. East. Eur. 2003, 11, 104–106.
60. Mansikkamäki, P.; Lahtinen, M.; Rissanen, K. The conversion from cellulose I to cellulose II in NaOH
mercerization performed in alcohol–water systems: An X-ray powder diffraction study. Carbohydr. Polym.
2007, 68, 35–43.
61. Mansikkamäki, P.; Lahtinen, M.; Rissanen, K. Structural changes of cellulose crystallites induced by
mercerisation in different solvent systems; determined by powder X-ray diffraction method. Cellulose 2005,
12, 233–242, .

Polymers 2020, 12, 1559 15 of 15
62. Duchemin, B.J.C. Mercerisation of cellulose in aqueous NaOH at low concentrations. Green Chem. 2015, 17,
3941–3947.
63. Revol, J.F.; Dietrich, A.; Goring, D.A.I. Effect of mercerization on the crystallite size and crystallinity index
in cellulose from different sources. Can. J. Chem. 1987, 65, 1724–1725.
64. Le Moigne, N.; Bikard, J.; Navard, P. Rotation and contraction of native and regenerated cellulose fibers
upon swelling and dissolution: The role of morphological and stress unbalances. Cellulose 2010, 17, 507–
519.
65. Tanimoto, T.; Nakano, T. Side-chain motion of components in wood samples partially non-crystallized
using NaOH-water solution. Mater. Sci. Eng. C 2013, 33, 1236–1241.
66. Fink, H.-P.; Hofmann, D.; Purz, H.J. Zur Fibrillarstruktur nativer Cellulose. Acta Polym. 1990, 41, 131–137.
67. Abdi, H.; Williams, L.J. Principal component analysis. Wiley Interdiscip. Rev. Comput. Stat. 2010, 2, 433–459.
68. Jolliffe, I.T. Principal Component Analysis, 2nd ed.; 2002. Springer-Verlag, Berlin, Germany
69. Dopar, M.; Kusic, H.; Koprivanac, N. Treatment of simulated industrial wastewater by photo-Fenton
process. Part I: The optimization of process parameters using design of experiments (DOE). Chem. Eng. J.
2011, 173, 267–279.
70. Alagumurthi, N.; Palaniradja, K.; Soundararajan, V. Optimization of Grinding Process Through Design of
Experiment (DOE)—A Comparative Study. Mater. Manuf. Process. 2006, 21, 19–21.
71. Mandenius, C.-F.; Brundin, A. Bioprocess optimization using design-of-experiments methodology.
Biotechnol. Prog. 2008, 24, 1191–1203.
72. Vlahopoulou, G.; Petretto, G.L.; Garroni, S.; Piga, C.; Mannu, A. Variation of density and flash point in acid
degummed waste cooking oil. J. Food Process. Preserv. 2018, 42, e13533.
73. Weissman, S.A.; Anderson, N.G. Design of Experiments (DoE) and Process Optimization. A Review of
Recent Publications. Org. Process Res. Dev. 2015, 19, 1605–1633.
© 2020 by the authors. Licensee MDPI, Basel, Switzerland. This article is an open access
article distributed under the terms and conditions of the Creative Commons Attribution
(CC BY) license (http://creativecommons.org/licenses/by/4.0/).