Embed Size (px)
Citation preview

Article 4Article 4
Service Encounter Problems: Service Encounter Problems: Which service providers are more Which service providers are more
likely to be blamedlikely to be blamed
Oscar HernandezOscar Hernandez
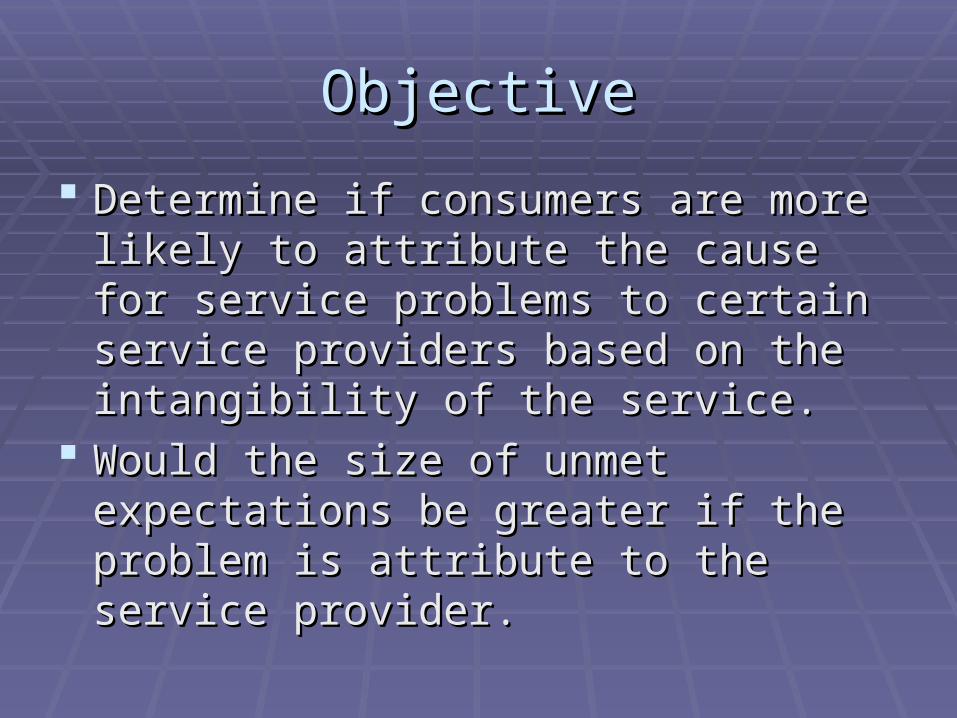
ObjectiveObjective
Determine if consumers are more likely to Determine if consumers are more likely to attribute the cause for service problems to attribute the cause for service problems to certain service providers based on the certain service providers based on the intangibility of the service.intangibility of the service.
Would the size of unmet expectations be Would the size of unmet expectations be greater if the problem is attribute to the greater if the problem is attribute to the service provider.service provider.

Previous ResearchPrevious Research
Folkes (1984) “Consumer reactions to Folkes (1984) “Consumer reactions to product failure”product failure”
Two experiments with 116 undergraduates examined Two experiments with 116 undergraduates examined how underlying causal properties or attribution how underlying causal properties or attribution dimensions influences consumer expectancy, dimensions influences consumer expectancy, marketplace equity, and anger reactions. Exp I marketplace equity, and anger reactions. Exp I utilized Ss' recall of critical incidents, while Exp II utilized Ss' recall of critical incidents, while Exp II obtained responses to hypothetical product failures.obtained responses to hypothetical product failures.
Previous ResearchPrevious Research
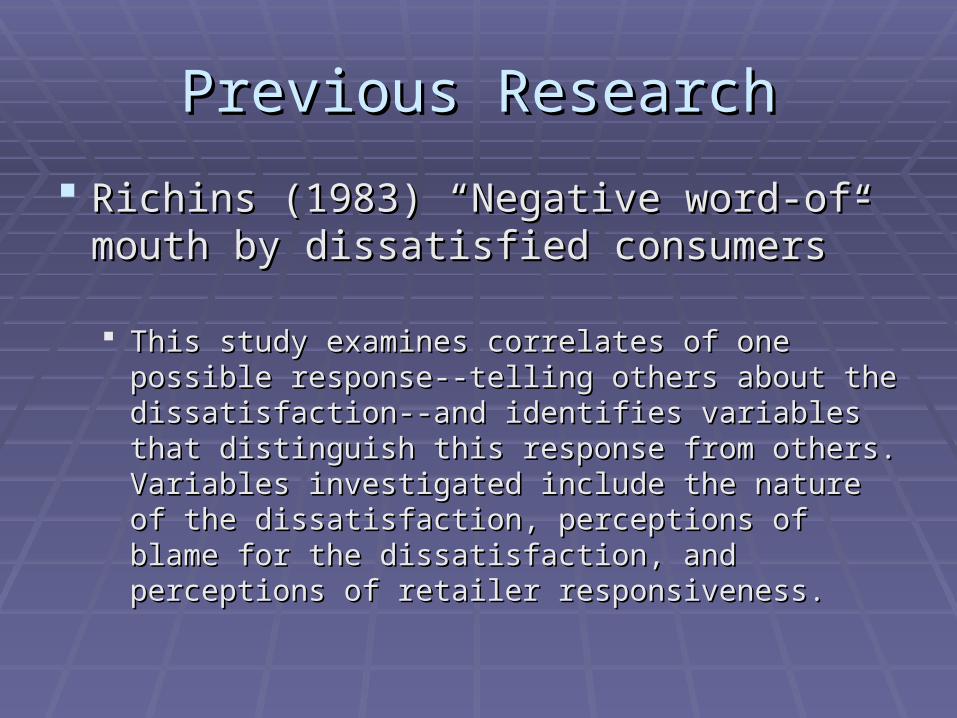
Richins (1983) “Negative word-of-mouth Richins (1983) “Negative word-of-mouth by dissatisfied consumers”by dissatisfied consumers”
This study examines correlates of one possible This study examines correlates of one possible response--telling others about the dissatisfaction--and response--telling others about the dissatisfaction--and identifies variables that distinguish this response from identifies variables that distinguish this response from others. Variables investigated include the nature of others. Variables investigated include the nature of the dissatisfaction, perceptions of blame for the the dissatisfaction, perceptions of blame for the dissatisfaction, and perceptions of retailer dissatisfaction, and perceptions of retailer responsiveness. responsiveness.

MethodologyMethodology
SurveySurvey 354 people participate in the research354 people participate in the research Only 326 completed the entire survey (28 Only 326 completed the entire survey (28
being eliminated because all the sections being eliminated because all the sections were not completed).were not completed).
The service quality used a seven point The service quality used a seven point Likert scale ranging from 1 (strongly Likert scale ranging from 1 (strongly disagree) to 7 (strongly agree)disagree) to 7 (strongly agree)

* 75 for the legal consultation* 75 for the legal consultation* 103 for the discount department store* 103 for the discount department store* 62 for the hair styling * 62 for the hair styling * 86 for the film processing* 86 for the film processing

Lower expectation

Higher expectations

There were no significant difference (p>0.05). In both instances, expectations were There were no significant difference (p>0.05). In both instances, expectations were not met, indicated by a negative score.not met, indicated by a negative score.
ResultsResults
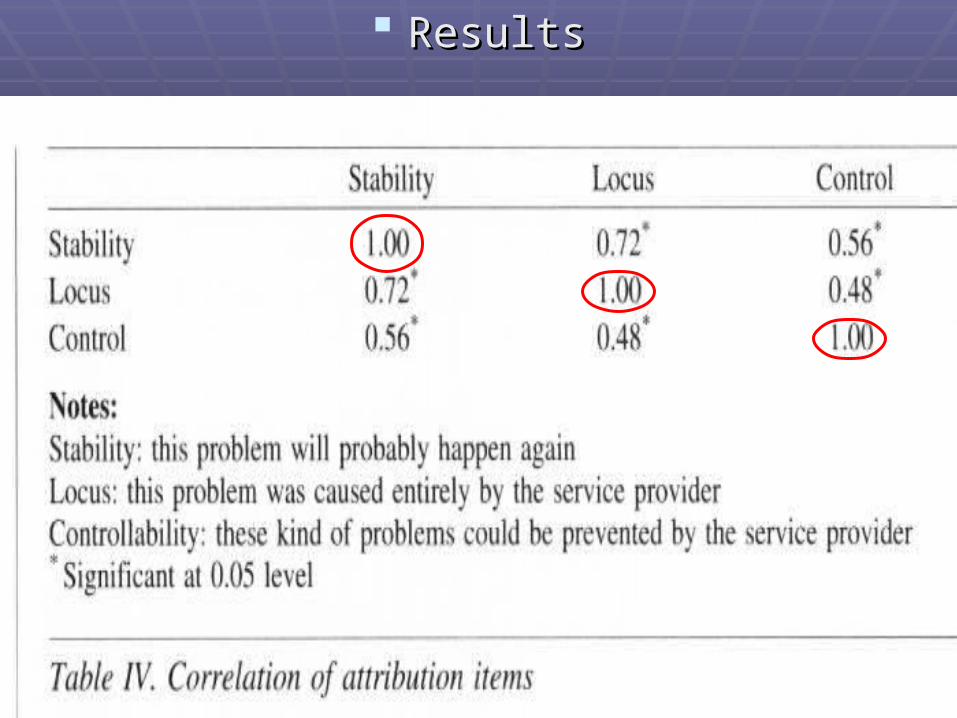
ResultsResults
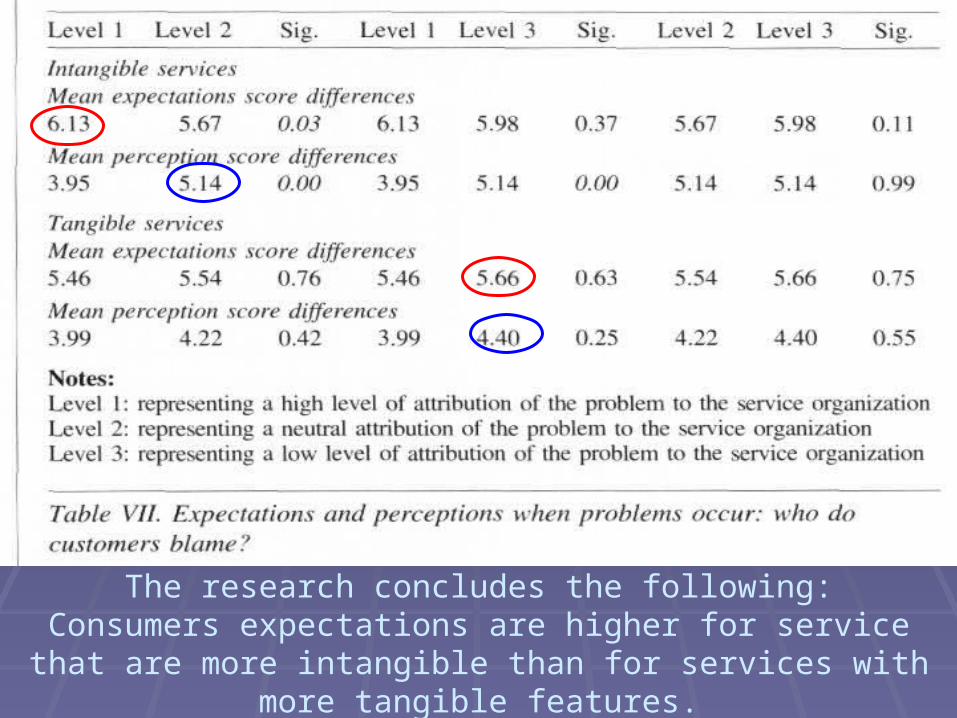
The research concludes the following:Consumers expectations are higher for service that are more
intangible than for services with more tangible features.

ConclusionsConclusions
Who gets blame? Who gets blame? When the service was intangible, the When the service was intangible, the
consumers was more likely to blame the consumers was more likely to blame the service providers.service providers.
Why?Why? Because the consumers can identify service Because the consumers can identify service
process failures which are not discernible when process failures which are not discernible when purchasing products.purchasing products.
Conclusions
What can the service provider do? Tangibilize the service (make the service more
evident). How? Making t This may be accomplished by showing the customer
the service process.
What can be done when the customer is not present? Pictures Videos Computer simulations