Embed Size (px)
Citation preview

With support from:
Afghanistan Reconstruction Trust Fund
1387 Annual Report
March 21, 2008 to March 20, 2009
Prepared by the Administrator (The World Bank)
ARTF Management Committee: Asian Development Bank, Islamic Development Bank,
United Nations Development Program, World Bank

Afghanistan Reconstruction Trust Fund
We are grateful to the Afghan calligraphers of the Turquoise Mountain Foundation for their design of the new ARTF logo: “Rebuilding Together.”

ARTF Annual Report SY 1387 (March 20, 2009)
i
CURRENCY EQUIVALENT
(Effective March 20, 2009) Currency Unit = Afghani (AFN)
US$ 1 = 52.39 AFN
GOVERNMENT’S FISCAL YEAR (SY1387) March 21, 2008 - March 20, 2009
Solar Year Period SY1381 March 21, 2002 – March 20, 2003 SY1382 March 21, 2003 – March 19, 2004 SY1383 March 20, 2004 – March 20, 2005 SY1384 March 21, 2005 – March 20, 2006 SY1385 March 21, 2006 – March 20, 2007 SY1386 March 21, 2007 – March 20, 2008 SY1387 March 20, 2008 – March 20, 2009
Contact Information for the ARTF
World Bank Kabul Office Street 15, House 19 Wazir Akbar Khan
Kabul, Islamic Republic of Afghanistan Telephone: 0700-27-60-02
Nicholas Krafft – Country Director – [email protected]
Mariam Sherman – Country Manager - [email protected]
Hugh Riddell – ARTF Coordinator – [email protected]
Paul Sisk – Task Team Leader, Recurrent Cost Financing - [email protected]
Nancy Zhao – Operations Advisor, Investment Financing - [email protected]
N. K. Thondaiman – Financial Management Analyst – [email protected]
All documents are available on: http://www.worldbank.org/artf

ARTF Annual Report SY 1387 (March 20, 2009)
ii
ABBREVIATIONS AND ACRONYMS
AEP Afghan Expatriate Program AFMIS Afghanistan Financial Management Information System AFN Afghanis – Local Currency of Afghanistan AISA Afghanistan Investment Support Agency ARDS Afghanistan Reconstruction and Development Services ARTF Afghanistan Reconstruction Trust Fund CAWSS Central Authority for Water Supply and Sewerage CDC Community Development Council CDP Community Development Plan DAB Da Afghanistan Bank EQUIP Educational Quality Improvement Program FS Fiduciary Standards GoA Government of Afghanistan IARCSC Independent Administrative Reform and Civil Service Commission IDA International Development Association IMF International Monetary Fund KfW Kreditanstalt für Wiederaufbau LEP Lateral Entry Program MA Monitoring Agent MC Management Committee MCP Management Capacity Program MDG Millennium Development Goal MEW Ministry of Energy and Water MFI Microfinance Institution MISFA Microfinance Investment and Support Facility for Afghanistan MoC Ministry of Communication MoE Ministry of Education
MoF Ministry of Finance MoFA Ministry of Foreign Affairs MoPW Ministry of Public Works MRRD Ministry of Rural Rehabilitation and Development MUDH Ministry of Urban Development and Housing NEEP National Emergency Employment Program NEEPRA National Emergency Employment Project for Rural Access NGO Non-Governmental Organization NPBSE Non-pension-based Salary Expenditure NPP National Priority Program NRAP National Rural Access Program NSP National Solidarity Program O&M Operations and Maintenance PAM Performance Assessment Matrix PBSE Pension-based Salary Expenditure PFEM Public Finance and Expenditure Management PFM Public Financial Management PPU Procurement Policy Unit PRR Priority Reform and Restructuring SOE Statement of Expenditures TAFS Technical Assistance and Feasibility Studies TSA Treasury Single Account UNAMA United Nations Assistance Mission in Afghanistan UNDP United Nations Development Program UNOPS United Nations Office for Project Services USAID United States Agency for International Development WB World Bank

ARTF Annual Report SY 1387 (March 20, 2009)
iii
TABLE OF CONTENTS
Administrator’s Statement………………………………………………………………………. 1 I. Summary of ARTF Activities in SY 1387………………………………………………………. 2 II. The ARTF in Relation to the Budget and Flow of Funds………………………………………6
III. ARTF Development Impact & Performance Assessment Matrix… ……………………………9 IV. The ARTF Recurrent Cost Window Financing ……………………………………………….25 ANNEXES ANNEX 1: Status of Active Investment Portfolio………………………………………………………31
ANNEX 2: Recurrent Cost Financing…………………………………………………………………...65
ANNEX 3: ARTF Financial Tables……………………………………………………………………...72

ARTF Quarterly Report (March 20, 2009)
1
ADMINISTRATOR’S STATEMENT
To all ARTF Donors:
I am pleased to present to you the 1387 Annual Report for the Afghanistan Reconstruction Trust Fund (ARFT). I would like to thank all ARTF donors for what have been a year of close and constructive engagement as well as very significant levels of contribution.
In 1387 the fund programmed US$640 million through the Afghan budget, covering around
half of the government’s non-security operating costs and over a quarter of development expenditure. ARTF financing continues to deliver results nationally. The ARTF Recurrent window is supporting teachers’ salaries in all 34 provinces and in conjunction is now pursuing quality-enhancing reforms in the ministry. On the development side, we continue to see positive impact from across the ARTF portfolio – and this report gives some of the highlights in section III. In particular, roll-out of the National Solidarity Program (NSP) continues and the program is now working with over 22,000 communities across the country. We look forward to the results of the NSP impact evaluation that will be available towards the end of 2009.
This year, donors agreed to extend the ARTF for a further ten years until 2020. The
extension was necessary to allow some of our programs to continue to sign contracts which the previous closing date would have disallowed. More importantly, the extension signals the willingness of donors and government to continue to utilize the ARTF mechanism. Of course, the extension is also a reflection of the extent of outstanding development challenges - in particular in terms of revenue collection.
As you know, this year we facilitated the fund’s second independent evaluation. We are
grateful to Scanteam of Norway for delivering a timely and professional report. ARTF Donors were right to call for the review at this time: the ARTF extension and the finalization of the ANDS in June 2008 made for a good opportunity to review and refine our work.
The evaluation has been a useful framework to guide the step-wise reform of ARTF
procedures, with the objective to improve our effectiveness. ARTF donors and the Ministry of Finance partners chose to focus initially on the Recurrent Cost Window, and in particular to position its work in the years ahead squarely behind the government’s reform program. A working group of five donors, the International Monetary Fund and the World Bank, had a constructive engagement with the Ministry of Finance over a 3 month period. We are very grateful to all who took part – and in particular to our partners in government. The ARTF Incentive Program, endorsed by donors and government in December 2008, is now the new framework for assisting the Ministry of Finance to leverage reforms linked to ongoing recurrent cost support.
Later in the year, we also initiated the working group on the ARTF Financing Strategy. The
strategy should ensure a common framework for our future work as well as align the ARTF behind government priorities. This work will continue and conclude during SY1388 – and we look forward to discussing the draft with many of you at our next Quarterly Meeting in June 2009.
Yours sincerely,
Nicholas Krafft

ARTF Quarterly Report (March 20, 2009)
2
I. SUMMARY OF ARTF ACTIVITIES IN SY1387 Donor Contributions: This report presents the ARTF’s financial and implementation status for the Solar Year (SY) 1387 which ended March 20, 2009. Nineteen donors contributed US$627 million during the year, roughly the same level as for SY1386. Since inception in 2002, donors have contributed a total of US$ 3.0 billion to the ARTF. Increased contributions have been driven mainly by increased preferencing for specific investment projects (see figure 1). In SY1387, preferences represented 46 percent of total contributions, the highest level of preferencing to date. The un-preferenced contribution declined in absolute terms.
ARTF Commitments: In SY1387 the ARTF Management Committee considered and approved a greater volume of financing than in previous years. This year the Management Committee considered on average two investment proposals at each monthly meeting. ARTF recurrent cost commitments were the highest in ARTF’s history. In January 2009,
the Management Committee approved an increase in the recurrent cost ceiling (set at $276 million at the start of the year) by an additional $40m (on an exceptional basis) to cover the costs of the salary increase for teachers. The resolution of this issue had been proposed by donors at the December 2008 ARTF Quarterly Meeting of Donors. The increase in the recurrent cost allocation was subject to agreeing education sector reform benchmarks – to be monitored by the Management Committee and reported to donors. The Management Committee discussed and approved proposals for nine investment projects in SY1387. The level of investment financing increased from $311m in SY1386 to $324m in SY1387.
Sector/program Commitment %
National Solidarity Program, Horticulture & Livestock , Rural Water Supply $192 59%
Microfinance $64 20%
Justice Sector Reform $28 9%
Kabul Roads & Kabul Urban Upgrade $24 7%
Basic & Higher Education $17 5%
Total $324 100%
This year ARTF broadened its involvement in the education sector with an allocation for the government’s higher education program focusing on upgrading facilities in Kabul Polytechnic and Balkh, Nangahar and Kandahar universities. ARTF also entered new sectors including agriculture (through the horticulture and livestock program), justice, and urban infrastructure including the upgrade of Kabul’s key road arteries. The last two years of ARTF operations have represented a considerable scaling up of ARTF development assistance and a fundamental shift in the portfolio away from recurrent cost support. Over these two
Figure 1: Donor contributions SY1381-SY1387, US$ m
$0
$100
$200
$300
$400
$500
$600
$700
1381 1382 1383 1384 1385 1386 1387
PreferencedUn-preferenced

ARTF Quarterly Report (March 20, 2009)
3
years investment financing has totaled US$634 million whereas recurrent window financing has totaled US$602 million. As a result, ARTF has become the largest single external financier of the core budget. In SY1387 ARTF accounted for over half of non-security operating budget and 27 percent of core development expenditures. All investments were included in SY1387 budget and were therefore in line with the national development strategy. ARTF Disbursements: ARTF operations use — and thereby seek to strengthen — the government’s public financial management systems. Figure 2 below demonstrates the high level of overall ARTF disbursements. As of March 20, 2009, overall disbursement of commitments made to the government was 88 percent, partly thanks to the rapid disbursement of the recurrent cost window.
Figure 2: Consolidated commitments and disbursements, SY1382-1387
$0
$100
$200
$300
$400
$500
$600
$700
SY1382 SY1383 SY1384 SY1385 SY1386 SY1387
Consolidated Allocations
Consolidated Disbursements
This year US$563 million was disbursed in total, of which US$250 million was for investments, US$310 million was for the operating budget and US$3 million was for fees for the Monitoring Agent. While ARTF disbursement rates remain strong, the ARTF investment window ended SY1387 with US$254 million in cumulative unspent commitments on the 17 active projects. These will continue to disburse in the coming years as planned. As the ARTF investment portfolio expands to include sectors like power and urban works, disbursement rates are equally expected to take on a different profile. Figures 3 and 4 give a month by month schedule of commitments and disbursements during SY1387. Commitments to the recurrent cost window were made in four tranches, roughly one a quarter. The final tranche in February 2009 included the additional allocation of US$40 million for teachers’ salaries. Although the government finances its recurrent costs regularly throughout the year, disbursements out of the ARTF are bundled into four packages, or withdrawal applications. In the investment window, allocations to the nine programs, took place in seven tranches. Disbursements got off to a slow start, partly reflecting some technical issues relating to the program budgeting initiative.

ARTF Quarterly Report (March 20, 2009)
4
Figure 3: SY1387 Financing of Recurrent Costs, US$ m
Figure 4: SY1387 Financing of Investments, US$m
$0
$30
$60
$90
$120
$150
$180
April
MayJu
ne July
Augus
t
Septem
ber
Octobe
r
Novem
ber
Decem
ber
Janu
ary
Februa
ryMarc
h
Commitments Disbursements
$0
$30
$60
$90
$120
$150
$180
April
MayJu
ne July
Augus
t
Septem
ber
Octobe
r
Novem
ber
Decem
ber
Janu
ary
Februa
ryMarc
h
Commitments Disbursements
Overview of the ARTF investment portfolio: As of the end of SY1387, the ARTF investment window comprised 17 active investment activities worth a cumulative total of US$872 million. In dollar terms, just under half of the investment window is in the agriculture and rural development sector, itself dominated by the National Solidarity Program, whose second phase has since SY1386 absorbed US$350 million in ARTF funds. With new investments in the North East Power system, the ARTF’s energy portfolio has increased in recent years, and is demonstrating capacity to implement.
Figure 5: ARTF Active Investment Portfolio: end SY1387
Agriculture & Rural Developmemt
48%
Capacity Development
5%
Energy10%
Microfinance21%
Justice3%
Education6%Urban Development
7%
Figure 6 presents the overview of the investment portfolio, in terms of year on year disbursements (bars) and commitments (line). The figure demonstrates the consistent growth of the portfolio over the six years of the ARTF. It also highlights that the ARTF has enabled a major scale up in the rural development sector, which have been able to absorb and disburse funding effectively.

ARTF Quarterly Report (March 20, 2009)
5
Figure 6: ARTF Disbursements (bars) and Commitments (line) SY1381 – SY1387 (US$m)
0
50
100
150
200
250
300
350
SY1381 SY1382 SY1383 SY1384 SY1385 SY1386 SY1387
Dis
burs
emen
ts
0
50
100
150
200
250
300
350
C'm
mts
Kabul Urban Roads Improvement ProjectJustice Sector Reform ProjectStrenghthening Higher Education ProjectKabul Urban Reconstruction ProjectHorticulture and Livestock ProgramMCPNaghlu Hydropower PlantKabul-Aybak/Mazar-e-Sharif Power ProjectRural water supply & sanitationKabul Roads and Drainage SystemStrengthening Financial Capacity of the GovtTelecom & Microwave LinkKabul powerEQUIPCivil service capacity buildingTAFSUrban water supply & sanitationNRAPMicrofinanceNSPCommitments
Note: includes both active and closed investment projects.

ARTF Quarterly Report (March 20, 2009)
6
II THE ARTF IN RELATION TO THE BUDGET AND FLOW OF FUNDS
Structure of the National Budget The national budget is the central tool for translating the Afghanistan National Development Strategy (ANDS) into policy and implementation. The national budget consists of a Core Budget and External Budget (see Figure 7 for SY1386). The Core Budget tracks those funds that flow through the government’s treasury system and includes core operating expenditures and core development expenditures. By contrast, the External Budget includes expenditures disbursed directly by donors outside the treasury system. The External Budget (according to the budget document) represents about half of all expenditures in the country, however there is a serious concern of underreporting of the External Budget. All ARTF investments utilize the treasury system and thus, are reflected in the Core Budget.
Results of the SY1387 Budget Revenue
Preliminary results show that revenues reached Af 41.6 billion (US$832 million). Revenue realization exceeded the revised IMF target (Af. 40 billion) by 4 percent, but missed the original target in the budget (Af. 44.4 billion) by 6 percent. While tax revenues significantly increased (about 30 percent), customs duty fell in absolute values.
Expenditures
Core budget expenditures increased in SY1387 by 18 percent over SY1386 to Af. 116.5 billion (US$2.3 billion). Due to additional teacher salaries, the bulk wheat purchase and increases in security expenditures, operating budget expenditures increased by 38 percent to Af 70.2 billion (US$1,404 million). However, development budget expenditures fell by 4 percent to Af 46.3 billion (US$926 million). As a result, the disbursement rates of core development expenditures deteriorated from 54 percent in SY1386 to 44 percent in SY1387. In addition to the structural issues of line ministry capacity and the overestimation in budget allocations, the execution rate suffered from technical problems related to the chart of accounts, as well as the absence of discretionary funds with which to finance project start-up.
Figure 7: Structure of the National Budget - SY1386 Resources Expenditure
External Budget44%
Loans and others (net)
5%
Grants to Development
Budget19%
Grants to Operating
Budget13%
Domestic Revenues
19% Operating Expenditures
29%
Development Expenditures
External Budget44%
Source: MoF

ARTF Quarterly Report (March 20, 2009)
7
Fiscal Sustainability
The indicator of fiscal sustainability (the ratio of domestic revenues to operating budget expenditures) deteriorated from 66 percent in SY1386 to 59 percent in SY1387. The sharp increase in the operating budget expenditures is the main cause of this deterioration.
SY1388 Approved Budget
Budget formulation process
The SY1388 budget was approved by parliament before the beginning of the fiscal year following the same good practice in the SY1387 budget. Looking ahead, the SY1389 budget formulation process should consider issuing budget ceilings to line ministries earlier to facilitate strategic thinking and consultation with stakeholders.
Revenues
The revenue target in the SY1388 budget is Af 50.7 billion (US$972 million), 22 percent higher than preliminary results of SY1387. Parliament passed the long-awaited amendment of the income tax law in March 2009. The amendment enables the Ministry of Finance (MoF) to commence the implementation of key policy measures including a Business Receipt Tax (BRT) on imports. The ongoing roll-out of the Large Taxpayers Offices (LTO) to key provinces is also expected to contribute to increased domestic revenue generation.
Expenditures
Core operating expenditures for SY1388 are budgeted at Af 93.9 billion (US$1.8 billion). The main factors’ driving the increase is the costs to implement Pay and Grading reforms; increase in security expenditures due to further expansion of the Afghan National Army; and pensions. Core development expenditures for SY1388 are budgeted at US$1,388 million, down from the SY1388 development budget which as of the mid-year review was Af 59.0 billion (US$1.1 billion). Medium-Term Projections The government adopted a Medium-Term Fiscal Framework (MTFF) in October 2005. Afghanistan’s fiscal sustainability prospects have deteriorated since that time. The January 2009 version of the MTFF significantly downgraded its projections of fiscal sustainability from the March 2008 MTFF (see Table 1 below). While, the March 2008 MTFF projected fiscal sustainability could be reached in 2012/13 the January 2009 MTFF version projected the ratio to be 69 percent in 2012/13, almost no change from 2007/08 actual.
Table 1: Fiscal Sustainability Indicator Comparison between March 2008 MTFF and January 2009 MTFF
2007/8
(Actual) 2008/9
(Proj/Actual) 2009/10 (Proj)
2010/11 (Proj)
2011/12 (Proj)
2012/13 (Proj)
2013/14 (Proj)
08-Mar 66% 68% 70% 79% 90% 101% - 09-Feb 66% 59% 54% 58% 63% 70% 79% Gap - -9% -16% -21% -27% -31%
Source: Ministry of Finance (MoF)

ARTF Quarterly Report (March 20, 2009)
8
Table 2: ARTF and the Core Budget: SY1381-SY1387 (US$ million)
SY1381 SY1382 SY1383 SY1384 SY1385 SY1386 SY13872002/3 2003/4 2004/5 2005/6 2006/7 2007/8 2008/9
A. Domestic Revenues 131 208 268 426 576 672 831B. Expenditures 346 613 965 1,118 1,567 1,978 2,331
Operating Expenditures 346 448 561 659 863 1,015 1,404Wage and Salaries n/a 282 373 421 529 671 n.aGoods and Services n/a 87 111 146 248 254 n.aCapital Expenditure n/a 61 41 49 40 28 n.aOther n/a 18 35 43 47 62 n.a
Development Expenditures 0 165 404 459 704 963 926C. Fiscal Balance (before grants) -215 -406 -697 -692 -990 -1,306 n.aD. Donor Grants 208 293 487 725 715 694 1,845
ARTF 59 230 294 337 465 517 576Recurrent 59 214 235 253 299 291 276Investment 0 16 59 84 166 226 300
Other 149 63 193 388 250 177 1,269E. Fiscal Balance (after grants) -7 -113 -210 33 -276 -612 n.aF. Financing 7 113 210 -33 276 612 n.a
External Financing (Net) n/a 100 309 107 27 169 n.aSale of Non-Financial Assets n/a 56 40 1 n.aDomestic Financing (net, including adjustment) n/a 13 -99 -196 209 442 n.a
Memorandum ItemsExternal Budget 927 1,978 2,350 1,482 1,443 1,530 185GDP 4,007 4,436 5,409 6,644 7,710 9,568 12,107 Exchange Rates 45 49 48 49 50 50 50Domestic Revenues (% GDP) 3.3% 4.7% 5.0% 6.4% 7.5% 7.0% 6.9%Expenditures (% GDP) 8.6% 13.8% 17.8% 16.8% 20.3% 20.7% 19.3%Fiscal Deficit (before grants, % GDP) -5.4% -9.1% -12.9% -10.4% -12.8% -13.7% n.a
<----------------------------Actual--------------------------------->
Source: MoF, World Bank, IMF

ARTF Quarterly Report (March 20, 2009)
9
III. ARTF DEVELOPMENT IMPACT
&
PERFORMANCE ASSESSMENT MATRIX
Introductory Note: This section reviews the development impact of selected investments as well the effectiveness of core operating budget expenditures as monitored by the Performance Assessment Matrix (PAM). As Administrator, the World Bank’s objective is to make available to our partners in Afghanistan and in the international community a clear presentation of the impact of funds contributed to the Government through the ARTF. This information will feed back into the broader funding policy and strategy of the ARTF. All projects in the portfolio are implemented by the Government of Afghanistan and supervised by the World Bank. A brief implementation status on each project is attached in Annex 1.

ARTF Quarterly Report (March 20, 2009)
10
National Solidarity Program II (NSP)1
ARTF Financing (SY1381-SY1387)
Committed (active & closed projects) Disbursed US$519 million US$467 million
Now in its second phase, NSP has proven to be an effective program that is able to deliver local development across Afghanistan. The program focuses on rural Afghanistan where 80 percent of the population is living. Covering 70 percent of rural Afghanistan, NSP is putting in place the basis for local economic development and social capital. NSP was created by the Ministry of Rural Rehabilitation and Development (MRRD) to develop the ability of Afghan communities to identify, plan, manage and monitor their own development projects. NSP empowers communities to make decisions and manage resources during all stages of the project cycle. The program lays the foundation for a sustainable form of inclusive local governance, rural reconstruction, and poverty alleviation. At the heart of NSP are the Community Development Councils (CDCs): a democratically-elected consultative decision making body. CDCs have mandated governance responsibilities and are an effective and national mechanism for ensuring more equitable development, representing the rights of all community members, female and male. The CDC 'bottom up' approach complements the government's 'top down' governance initiatives, which
is increasingly recognized to be of critical importance in combating corruption, ensuring oversight and generating social responsibility at local levels for development on multiple levels. NSP is now also benefiting from closer partnership with the Ministry of Agriculture, meaning that CDCs can be used to facilitate agricultural development. For example, the newly established Comprehensive Agriculture and Rural Development Facility (CARD-F) working across the Ministries of Rural Rehabilitation (MRRD) and Agriculture (MAIL) will leverage the CDCs’ to support licit agricultural development. NSP outputs & outcomes to date: As of March 21, 2009, the program (NSP I and NSP II) has contracted Facilitating Partners (FPs) for mobilization of 23,180 communities, exceeding the originally planned 21,600 communities. The reason for this increased rollout is a strong demand for the program from communities that had not benefited from NSP. Approximately 22,102 communities have been mobilized, of which 21,816 successfully elected CDCs and 21,664 created Community Development Plans (CDPs).
1 For up to date information on the NSP, visit www.nspafghanistan.org.

ARTF Quarterly Report (March 20, 2009)
11
CDCs have submitted 49,450 subproject proposals of which 97 percent were approved. Approximately 78 percent of the financed subprojects are productive infrastructure, including: rural roads (24 percent); water supply and sanitation (23 percent); irrigation (17 percent); and village electrification (14 percent). The remaining 22 percent of subprojects are human capital development projects, which include income generation and skills building. Sector Sub-projects financed (Mar 09) Transport 10,136 Water Supply & Sanitation 10,030 Irrigation 6,978 Power 5,787 Education 5,499 Livelihood 2,338 Rural Development 1,132 Other 147 Total 42,047
Transport23%
Water Supply & Sanitation
24%Irrigation17%
Pow er14%
Education13%
Other0%
Livelihood6%
Rural Development3%
Economic Rate of Return: The September 2008 economic analysis of NSP found that sub-projects are producing high rates of economic return: around 19 percent on average. Sub-projects in irrigation, drinking water, power and transport were assessed as part of the analysis. Communities implementing transportation projects saw motorized traffic triple, while those with power projects benefited from a 50 percent increase in power supply.
Box 1: Summary of Economic Rate of Return Analysis for NSP Based on the surveyed villages and sub-projects, the survey made the following findings: Irrigation
� Irrigated area increased by 31 percent, wheat area increased by 20 percent and wheat yield improved by 40 percent
� Expansion of area under cultivation & productivity improvement contributed 32 percent and 55 percent respectively of the incremental economic rate of return to irrigation projects.
� Incremental income impact is constrained by credit, technology and market constraints Drinking Water
� Weekly trips to get water for family increased by 35 percent & time taken per trip came down by 50 minutes
� Each family saves 85 labor days annually due to the location of water source in their locality � Now only 2 percent of the population is reporting water borne illness as against 7 percent before project
Power � Diesel generator power supply coverage increased from 9 percent to 91 percent of the families � Average monthly power availability more than doubled to 20 Kwh per family after the project � Power supply duration increased by 50 percent with improved power infrastructure
Transport � Market trips by beneficiary families increased by 23 percent and travel time per trip reduced by 110
minutes � Non-motorized traffic came down by 49 percent and motorized traffic tripled after improved roads � Unit transport costs have come down by 47 percent since the project

ARTF Quarterly Report (March 20, 2009)
12
NSP and Local Governance: According to the recent baseline survey of NSP, 89 percent of men and 77 percent of women rate CDCs as the main decision making body that addresses the critical development needs in their villages. To build CDC representatives' capacity in book keeping, accounting, and other areas, MRRD - the government entity responsible for NSP - has contracted some 28 NGOs and the UN-Habitat as Facilitating Partners for NSP. In addition to building CDC capacity, they are responsible for mobilizing the community, facilitating elections and community development planning through community consultation and assisting in sub-project preparations and implementation.
Impact Evaluation: The baseline study was presented to donors in September 2008 and was included in summary in the June quarterly report. The follow up impact evaluation is currently being undertaken in the field and the study is due towards the end of 2009. In the meantime, a website has been set up to disseminate papers, presentations, materials and general information about the evaluation and is located at: http://www.beath.org/NSP-IE
National Emergency Employment Project - NRAP
ARTF Financing (SY1381-1387) Committed Disbursed
US$53 million US$53 million
Through the ARTF, donors are supporting the government’s priority program for rural access: the National Rural Access Program (NRAP). NRAP is designed to tackle one of the key sources of poverty in Afghanistan: the lack of rural access. Together with funding from the European Commission, United States, Japan, United Kingdom, World Bank and from the Government of Afghanistan’s own resources, the ARTF-funded NEEP committed and disbursed US$52.8 million – and has now closed. The NRAP umbrella program has been supported programmatically by a number of investments in the past, of which NEEP was one.
The two implementing agencies: the Ministries of Rural Rehabilitation (MRRD) and Public Works (MPW) are preparing a follow up program for presentation to the ARTF Management Committee. This further evolution of ARTF support will continue to support the umbrella NRAP program.
The objective of NRAP is to improve accessibility, integrate the village economy with regional and national markets, leading to better allocation of resources, technology transfer, and higher productivity and outputs. It may also facilitate the expansion of rural non-farm activities. Households who can diversify their income sources will become less economically vulnerable and less dependent on opium poppy cultivation.
The ANDS identifies 27 benchmarks to be achieved within the next four years, and those that relate specifically to rural roads are: (i) by end-2010, provision of road connectivity would reach 40 percent of the country’s approximately 38,000 villages, thereby increasing access to markets, employment, and social services; and (ii) Afghanistan will have a fiscally sustainable system for road maintenance by end-2009. Currently only about 20 percent, i.e. 7,762 out of the approximately 38,000 villages have been connected, and it seems unlikely that the target set out in the ANDS will be met.
ARTF Quarterly Report (March 20, 2009)
13
ARTF National Emergency Employment Project Phase I (NEEP I): The implementation of the earlier ARTF funded rural access project in Afghanistan has been successful despite difficult circumstances. The project has helped to improve the delivery of services and access to markets across the country. In the process, a local contracting industry has emerged and is providing job opportunities in remote areas.
Outputs of ARTF NEEP I: NEEP 1 closed on March 31, 2009. For both the public works and the irrigation component, the output targets have been substantially met, or even surpassed. As of 28th February 2009, approximately 3,050 kms of rural access roads and 17,000 meters of cross drainage structures were completed. In addition 98 natural resource management sub-projects, 23 small irrigation sub-projects and four large irrigation sub-projects (rehabilitating 15,000 hectare in Shamalan area) have been completed. Out of the 538 contracts awarded, 504 contracts have been completed, and 34 contracts were terminated or cancelled for various reasons. Labor days generated under the project are 5.2 million, and it is expected that once final payments have been completed 5.4 million labor days would have been paid. Sub-projects under NEEP-1 (and with further continuous financing under follow-on NEEP/NRAP Projects) have now reached all 34 provinces of Afghanistan.
Outputs of NRAP: Achievements of the broader NRAP program have been quite impressive: the program has rehabilitated more than 9,400 kms of secondary and tertiary roads. In addition, and in earlier stages, the program also rehabilitated 8 airfields and 98 natural resource management sub-projects, 23 small irrigation sub-projects and four large irrigation sub-projects (rehabilitating 15,000 hectare in Shamalan area). It has created more than 12 million labor days and has provided tangible benefits to the rural population in the form of wages and improved infrastructure in all 34 provinces of Afghanistan.
NRAP Program Achievements up to January 2009 No Activity Total
1 KM of Road Rehabilitated since inception (Nov. 2002) till date 9,440 2 Labour Days Generated since inception till date 12,167,312 3 Running Meters of Structures Completed Since Inception till date 72,044 4 Number of Bridges Completed Since Inception till date 71 5 Running Meters of Bridges Completed Since Inception till date 2,172 6 Number of District covered by program 358 7 Number of Provinces Covered by program 34 8 Number of Villages Covered by program 7,762

ARTF Quarterly Report (March 20, 2009)
14
Microfinance for Poverty Reduction2
ARTF Financing (SY1381-1387) Committed Disbursed
US$183 million US$143 million This project was one of the first in the ARTF portfolio and has continued to receive consistent support from ARTF donors. During SY1387, the ARTF Management Committee allocated a further US$64 million to the program. The project aims to assist the government in developing a sustainable microfinance sector that will provide flexible, convenient, and affordable financial services to poor people. The goal is to build an integrated financial sector and remove the barriers that separate microfinance from the broader mainstream financial system.
Increasing Access to Financial Services: While the microfinance sector is at an early stage of development in Afghanistan, the apex model adopted in 2003 has demonstrated potential to scale up its reach across the country. The sector now has 15 microfinance institutions (MFIs) serving clients in 24 provinces (SY1387 has seen expansion into one further province) through a network of 286 branches. An agreement for the provision of microfinance services by BRAC in Ghor and Daykundi was signed in December 2008 and lending activities began in the first quarter of 2009. There are now around 440,000 active savings and loan clients with an outstanding gross loan portfolio of US$104 million as of February 2009. Since work began in 2003, the sector has cumulatively disbursed US$583 million through 1.3 million loans. Sixty-two percent of the clients are women, and the loan repayment rate is 94.4 percent.
The sector now employs 4,825 people; approximately 1,900 of whom are women, and over 90 percent of professional positions and 50 percent of management positions in the sector are occupied by Afghans. Despite increasing security costs, two of MISFA's MFI partners have achieved operational surpluses before even reaching five years of operation; 4 partners are above 70
percent or more operationally sustainable; and among the remaining 5 are 50 percent or more operationally sustainable. SME Window: Since 2006 MISFA has operated an SME window that on-lends funds through local banks for small and medium enterprise loans, with support from USAID. These SME loans range from
2 For up to date information, please visit www.misfa.org.af
Sector Outlook Actual Projected Jan-08 Feb-09 Dec-09 Clients 428,990 439,821 504,000 % women 68% 62% 61% Gross Loan Portfolio (US$m) $105 $104 $160 Loan outstanding per Borrower $288 $306 $371
Source: MISFA

ARTF Quarterly Report (March 20, 2009)
15
US$3,000 – US$300,000. Currently, MISFA has five partner banks that are actively providing access to finance for Afghan SMEs. The MISFA/SME partners are: First Microfinance Bank, Bank Alfalah, BRAC Afghanistan Bank, Afghanistan International Bank and the Afghanistan Rural Microfinance Program. Thus far, the program has provided training to more than 242 loan officers and managers, as well as strategic advice to four banks and/or financial institutions. As of February 28, 2009, MISFA/SME Partners combined to disburse 641 loans, with a collective value of US$18.1 million
Map of MISFA Activities
South Region: Helmand, Kandahar, Zabul, Uruzgan, Ghazni, Paktia,
Paktika No. %
MFIs 4 26.7% Clients 7,212 1.6% Portfolio 1,578,846 1.5%
North East Region (Badakhshan, Baghlan, Kunduz
and Takhar) No. %
MFIs 5 33% Clients 71,809 16.3% Portfolio $22,107,940 21.2%
West Region: Badghis, Herat, Farah, Ghor, Nimroz
No. % MFIs 5 33% Clients 41,030 9.3% Portfolio $8,342,935 8.03%
North West Region (Balkh, Jawajan, Samangan, Faryab and
Sari Pul) No. %
MFIs 6 40% Clients 105,198 23.9%
Portfolio $25,268,336 24.3%
Eastern Region (Nangarhar, Nooristan, Kunar and Laghman)
No. % MFIs 7 47% Clients 39,080 8.8% Portfolio $6,271,350 6.03%
Capital Region (Kabul, Parwan, Kapisa, Bamyan, Daikundi, Wardak
and Logar) No. %
MFIs 12 80% Clients 175,492 39.9% Portfolio $40,292,331 38.7%
Percentage
Overall Outreach
Total Rural Urban
# of MFIs 15
Provinces 24
Clients 439,821 29.8% 70.1%
Portfolio $103,861,799 26.7% 73.2%
Source: MISFA
Education Quality Improvement Project I (EQUIP I)
ARTF Financing (SY1381-1387) Committed Disbursed
US$44 million US$37 million EQUIP I & II, funded through ARTF and World Bank contributions, are the government’s core basic education program, covering all 34 provinces in the country. EQUIP I’s development objective has been to increase equitable access to quality basic education, with a special emphasis on girls.

ARTF Quarterly Report (March 20, 2009)
16
The context for basic education in Afghanistan: Demand for schools continues to grow, as basic education expands by approximately 500,000 new students each year; 30,000 to 50,000 students graduate from high school yearly and only one third of them are admitted to universities. Almost half of the school age population remains out of school with significant gender and provincial disparities. Only 57 percent of schools have usable buildings (42,003 out of 73,200 active schools). In addition, almost 700 schools were burned or closed due to violence and terrorism in the past 18 months. Even with the increase in girls’ enrollment from almost nil in 2001 to more than 2 million in 2008, boys’ enrolment in primary schools is nearly twice that of girls and three times higher in grades 7-9. Boys are almost four times more likely than girls to be enrolled at the higher secondary level, and ten times as likely to be enrolled in post-primary education. In rural areas, girls’ participation declines precipitously and female teachers are rare, especially in secondary education. Overall, only 28 percent of teachers are female and mostly located in urban centers. Yet, community-based education programs in Afghanistan (by NGOs and EQUIP I) have shown that increased community awareness and involvement is positively correlated to increased education for girls. Today, the MOE is engaged with local communities in insecure regions to reopen schools closed due to violence and to increase school enrollment and completion by girls.
ARTF in the sector: The ARTF has been a major contributor to the reconstruction and development of the education sector, through both its recurrent costs window and investment window. The recurrent cost window supports the financing of teacher salaries and operational costs. Through the investment window, the ARTF made available US$44 million for EQUIP I (first phase)—contributing to the construction of more than 800 schools; the organization of more than 8,000 School Management Committees and the financing of more than 2,500 school improvement plans (SIPs), through quality grants managed directly by schools. In addition, EQUIP I trained approximately 45,000 teachers and provided technical assistance to the MOE for curriculum and textbook development, infrastructure designs and quality controls, community awareness and mobilization, and improved fiduciary (financial and procurement) management.
EQUIP has supported this progress by financing school construction, teacher training and institutional development. The key characteristic of EQUIP is community-ownership. Communities have become close partners with the government in the delivery of education in their local area. Similar to NSP, EQUIP delivers block grants directly to schools and to communities. These block grants are used for the rehabilitation and construction of school buildings and for accessing quality inputs, such as teaching and learning materials, through Provincial Education Departments and, in four provinces,
the facilitation of non-governmental organizations (NGOs). The total number of schools nationwide which will be constructed with EQUIP financing will be 1,263.
Grade 1-12 Enrollment in Afghanistan School Year and Gender
1380 (2001)
1381 (2002)
1382 (2003)
1383 (2004)
Boys Girls Total Boys Girls Total Boys Girls Total Boys Girls Total 1,134,745 0 1,134,745 1,663,160 674,095 2,337,258 1,942,579 1,055,958 2,998,532 2,652,751 1,321,953 3,974,704
1384 (2005)
1385 (2006)
1386 (2007)
1387 (2008)
3,211,794 1,682,921 4,894,715 3,564,432 1,929,739 5,494,172 n.a n.a 5,675,951 3,930,073 2,182,380 6,112,453
ARTF Quarterly Report (March 20, 2009)
17
School grants for infrastructure development are used to rehabilitate existing government schools and construct new registered government schools based on priority criteria described in the project design. Schools will be rehabilitated and constructed based on improved building models developed by the construction department of the Ministry of Education. Thus far, 190 schools have been completed with 278 already under construction and 1,031 planned. The modality in which in-service teacher training is delivered has been redesigned based on the government's National Education Strategy Paper (NESP). The revised design uses NGOs to implement teacher training and provides for greater district based academic support to in-service teachers. A USAID project funded outside the government budget but with the same project design and performance indicators finances and implements the program in 11 out of 34 provinces, with IDA funds covering the rest. EQUIP is also helping to build the capacity of the Ministry of Education’s central, provincial and district departments. The Education Management Information System is being strengthened and a full nationwide survey was completed in November 2007. Updated school survey data can now be accessed in the Ministry of Education website. Looking ahead – EQUIP II: The EQUIP II widens the scope of ARTF education sector investments to a national – multi donor supported – project that is fully aligned with the vision and goals set out in the National Education Strategic Plan (NESP). EQUIP II seeks to: (i) increase access to schooling from Grades 1-12; (ii) strengthen the management capacity of communities to better manage teaching-learning activities; (iii) promote institutionalized district based teacher training activities nationwide; and, (iv) prioritize education for girls through a household scholarship scheme and the provision of high school teachers in underserved schools.
Management Capacity Program (MCP)
ARTF Financing (SY1381-1387) Committed Disbursed
US$10 million US$0.5 million The Management Capacity Program (MCP) was designed by the Independent Administrative Reform and Civil Service Commission and the Ministry of Finance as a consolidation and refinement of the earlier ARTF-funded Civil Service Strengthening Project. Specifically, MCP is designed to support the interim ‘buying in’ of critical management capacity in line ministries to complement donor-provided technical advisory assistance. The purpose is to improve the utilization and cost effectiveness of the GoA budget and
donor resources and generate faster and better development results on the ground. This is necessarily an interim solution to address the multiple capacity challenges facing Afghanistan including; a) competing demands from UN agencies and bilateral donors who continue to implement projects off budget and outside the government systems; and b) the ongoing distortion in the remuneration levels for skilled manpower.

ARTF Quarterly Report (March 20, 2009)
18
The project provides line ministries with the resources to use merit based recruitment for priority staff to fill key Tashkeel positions. The successful candidates undertake common management and executive functions, and they create a management team accountable to the minister that provides a critical mass to implement ministry reforms by strengthening systems and enhancing standards. The focus is primarily on supporting the execution of common functions at senior or managerial levels, including policy and strategy development, project management, financial management, procurement and human resource management. In addition, it also focuses on critical positions in the change management process in various ministries as well as senior key line management positions of core sector functionality in those ministries that contribute to economic development, such as education, health care and infrastructure sectors. Priority is given to requests that address needs at sub national levels of government and to those ministries/sub-national units whose service delivery is critical but where performance or standards have been lacking. Implementation Progress: Despite initial delays, program implementation has gained momentum and the funds under the first ARTF tranche of US$10 million have been committed. The program currently supports 12 key line ministries with about 70 positions of which 45 have been filled. Demand from ministries far exceeds available funding and prioritized positions were selected in accordance with the principles outlined in the original MCP proposal.
Summary of the Status of MCP Sl
Ministry / Agency Po
sitio
ns
requ
este
d
Posi
tions
an
noun
ced
Inte
rvie
we
d / S
elec
ted
1 Office of the President 9 5 4 2 Ministry of Finance 59 10 6 3 Independent Administrative Reform and Civil Service
Commission 18 4 3
4 Ministry of Counter Narcotics 21 9 6 5 Ministry of Information and Culture 11 7 4 6 Afghan National Standard Authority 30 10 6 7 Ministry of Higher Education 20 7 5 8 Ministry of Labor and Social Affairs 7 5 2 9 Ministry Communication and IT 4 3 3
10 Ministry of Economy 1 1 1 11 Ministry of Energy and Water 31 4 3 12 Ministry of Agriculture, Irrigation and Livestock 31 5 2
Total 242 70 45 MCP builds on the lessons learned from the ARTF funded Civil Service Capacity Building project that placed 130 Lateral Entry Program (LEP) individuals into Tashkeel positions into government structures and over 90 Afghan Expats (AEP) senior advisors, into over 20 ministries and agencies. (See box 2)

ARTF Quarterly Report (March 20, 2009)
19
Looking ahead: The Civil Service Commission is seeking the approval of the Management Committee to allocate further funds towards MCP during SY1388. These funds will be used for the second batch of 172 MCP common function positions. In addition, the ongoing support will aim to leverage the existing implementation arrangements to broaden the scope of support to include the ANDS implementation roles of the three oversight organizations: Ministry of Finance, Economy and the Government Coordinating Committee. This evolution of the MCP was agreed at the meeting of Standing Committee on Economic and Social Development of September 16, 2008 at which donors pledged to fund a total of 44 ANDS positions under the MCP. The objective of this support is to ensure effective implementation of the ANDS.
ARTF in the Power Sector
ARTF Financing (SY1381-1387) Committed Disbursed
Kabul Power Supply US$7.4 million US$7.1 million Rehabilitation of Naghlu US$20.0 million US$6.3 million
Kabul/Aybak/Mazar Power Supply
US$57.0 million US$14.7 million
Total US$84.4 million US$28.1 million
The poor condition of Afghanistan’s power sector is severely constraining the development of the country. The prevailing service consists of only a few hours of supply a day to a small percentage of the population which has access to the power grid. The situation worsens in winter, when the generation from hydropower resources drops due to reduced inflow of water. The larger towns situated on national highways are growing fast and have the potential to become economic hubs in the future. All these areas inherited dilapidated power distribution networks and limited power supply.
The development of the energy sector is a key pre-requisite for reducing poverty and stimulating private sector and rural development. The ANDS target over the medium-term, for the power sector, is for the electricity supply to reach at least 65 percent of households and 90 percent of non-residential establishments in major urban areas and at least 25 percent of households in rural areas.
Box 2: The lessons learned from LEP / AEP included in the design of MCP:
� All positions should be in the tashkeel of the ministries to provide authority, greater accountability and avoid creating parallel structures.
� Ministries should articulate their demands based on sector strategies and ministry reform plans. � To continue to support senior positions in Kabul but place a stronger emphasis on positions in the provinces
where service delivery takes place. � The need for greater predictability in funding to allow longer term contracts to provide sufficient support to
implement reform. � To establish a good working environment and adequate relationships in October 2008 a new form of request
and a new template for memoranda of understanding with user ministries has been introduced. � All job descriptions prepared under MCP now contain a requirement that the appointee transfers knowledge,
skills and necessary attitudes to ministry personnel.

ARTF Quarterly Report (March 20, 2009)
20
Combined donor efforts have helped to bring more power from Uzbekistan to the energy-starved capital Kabul which till recently received only a few hours of supply a day. Since late January 2009, the North East Power System has begun to stream 40 MW of additional power from the Central Asian neighbor to Kabul. The ARTF is currently financing the rehabilitation of the country’s two largest hydro-power plants -- Naghlu and Mahipar -- that supply the city of Kabul and surrounding areas, in collaboration with the European Commission, German KfW and the World Bank. The Mahipar plant is scheduled to be completed in 2009 while Naghlu is expected to be ready by mid 2011. More recently the ARTF has joined as one of the three major investors in the area of power distribution in the north of the country. From mid-2009 onwards, when the full 150 MW of power that Uzbekistan has agreed to supply under a new power purchase agreement begins to flow, the ARTF will facilitate its distribution among the populated urban centres that lie along the newly-commissioned transmission line. This will help to restore the hubs of Mazar-e-Sharif, Aybak, Pul-e-Khumari, Jabul-es-Seraj, Charikar and Gulbahar to their old economic vibrancy. This investment is in three stages, starting in SY1386 with the US$57 million investment in Kabul, Aybak and Mazar-e-Sharif and has been scaled up in SY1387 with a further investment of US$35 million in substation and distribution in other urban centers along NEPS. The ARTF is also working to introduce the concept of energy efficiency while Afghanistan’s power sector is still at a nascent stage. This is of particular significance given the pervasive use of polluting diesel generators to augment generation across the country. Accordingly, an energy efficiency unit in the government ministry is being set up and campaigns to educate consumers as well as a pilot project to demonstrate impact are planned.

ARTF Quarterly Report (March 20, 2009)
21
The Performance Assessment Matrix (PAM) is intended to provide a broad-based assessment of the effectiveness at the centre of government by tracking trends in government and donor performance across selected areas. The PAM is a useful measure of the impact of ARTF recurrent cost support, given that the ARTF recurrent cost window supports line ministries, and in particular the key spending and service delivery ministries. The PAM provides a platform for dialogue based on retrospective performance. It is therefore, a useful complement to the new ARTF Incentive Program, which is intended to put in place financial incentives for securing forward-looking policy and reform progress. This note on a selective basis summarizes and highlights areas of progress and challenges based on the PAM as of March 20, 2009, which is available in full on the ARTF website and which was presented to donors at the Quarterly ARTF Meeting of Donors in April 2009. 1. Public Financial Management The last two years have been a time of increasing fiscal pressure on the government and challenges remain on executing the core budget.
� On revenue mobilization, the government raised Af 41.6 billion (US$832 million) in SY1387 and met the revised revenue target (Af 40 billion). However, the revenue to GDP ratio was 6.9 percent, down from 7.0 percent in SY1386. The revenue to GDP ratio has now deteriorated across two consecutive years. Revenue performance affects the fiscal sustainability indicator (revenue as a percentage of operating expenditure). The fiscal sustainability indicator fell from 66 percent in SY1386 to 60 percent in SY1387;
� On budget execution, total core development expenditures in SY1387 fell in absolute terms by 8 percent to Af 44.4 billion (US$888 million) against SY1386. In addition, the budget execution ratio fell to 42 percent from 54 percent in SY1386. In SY1387, government had few discretionary resources for bridge financing which severely affected disbursement.
� On budget formulation, following the good practice of the SY1387 budget, parliament approved the SY1388 budget before the beginning of the fiscal year. Program budgeting, has seen some take-up: the number of ministries under pilot program budgeting increased from 7 in SY1387 to 14 in SY1388. However, the initiative will benefit from simplification, given a certain degree of confusion created by the program budgets at the start of the year.
� On procurement, only two ministries had developed a procurement monitoring schedule (Ministry of Agriculture and Ministry of Public Works) in SY1387. This good practice needs to be expanded to all key spending ministries;
The ARTF Performance Assessment Matrix
Box 3: DABM/S – The Corporatisation Process
Government and Donors all agree to the critical need for the electricity utility to operate under commercial principles, to be consumer responsive and to have a motivated management and workforce to achieve the challenging goals set for this sector. GoA has taken key steps to restructure the electricity utility through corporatization of DABM. The newly corporatized utility is Da Afghanistan Breshna Shirkat (DABS), creation of which was ratified by the Cabinet of Ministers in March, 2008. A high ranking Board of Directors, comprising four Cabinet Ministers and the head of the Afghanistan Investment Support Agency (AISA), and an interim Chief Executive Officer have been appointed to facilitate the transition from DABM to DABS. The corporatized Utility is planned to be brought under a new management structure with market-based staff salaries.

ARTF Quarterly Report (March 20, 2009)
22
� On the control framework, in SY1387 about 30 percent of civil servants (135,000) were paid salaries directly through their bank accounts3. Progress has been made in the past few years; however provinces lag in the Verified Payroll Program (VPP). Further progress of VPP is challenging due to inadequate banking facilities in provinces.
Selected PFM Indicators (Comparison between Target and Realization)
Indicators SY1384 Actual
SY1385 Actual
SY1386 Actual
SY1387 Projection (Mar 08) 1/
SY1387 Preliminary
Actual Revenue to GDP ratio (%) 6.4 7.5 7.0 8.4 1/ 6.9 Revenue to operating expenditure ratio (%) 64.6 66.8 66.2 67.9 1/ 59.5
Budget execution ratio (core development)
41 54 54 Increase from SY1386 42 2/
% of staff with individual salary payments 10 23 30 55 30
1/ Government target in the SY1387 budget 2/ MoF figure is 47% as US$367 million was excluded from MYR budget Source: World Bank Staff 2. Aid Effectiveness Challenges remain to secure national ownership of the reconstruction effort.
� On improving the predictability of resources delivered through ARTF, donors appear increasingly able to pledge un-preferenced funds towards the recurrent cost window at the start of the SY. This serves to improve the predictability of ARTF funding to the recurrent budget;
� However, on increasing national ownership, preferences have increased again as a share of total contributions, with some donors indicating real constraints in providing un-preferenced funds. The share of un-preferenced ARTF pledges declined to 51 percent in SY1387. In SY1388, the absolute value of the un-preferenced contribution is projected to decrease from US$351 million in SY1386 to US$275 million. Direct budget support as a share of total ODA disbursed (per Paris Declaration survey) stood at 21 percent in SY1386 (almost the same as for SY1384);
� Added to this, the flexibility of the core budget has decreased significantly. Due to operating budget deficits, there were no discretionary resources for the core development budget in SY13874. The same scenario is projected for SY1388 and SY1389.
3 Note that VPP until FY1386 was based on the total coverage of salary payments using banking (i.e. sum of DAB and Commercial Banks) channels, which included salary disbursements by DAB cashiers. Starting in FY1387, VPP is only based on salary payments using commercial banks. 4 Excluding drawdown from deposits in the central bank of around US$79 million according to the MoF.

ARTF Quarterly Report (March 20, 2009)
23
Selected Aid Effectiveness Indicators (Comparison between Target and Realization)
Indicators SY1384 Actual
SY1385 Actual
SY1386 Actual
SY1387 Projection (Mar 08)
SY1387 Preliminary
Actual % of ARTF estimated recurrent need for FY committed or pledged at start of FY
25 60 70 100 100
% of un-preferenced pledge (ARTF) 73 70 53
Increase over
previous year
51
Direct budget support as % of total ODA disbursed 1/ 20 - 21 - -
1/ Per Paris Declaration Survey 3. Public Administration Reforms (PAR) The situation in PAR reflects the complexity and challenge of the reform – but implementation of this core reform is now underway.
� Size and Cost of the Civil Service: The size of the civil service has been maintained at below 300,000 civil servants, of which c. 170,000 are teachers.5 The cost of the civil service has grown moderately by 3.3 percent (in real terms) in SY1387, mainly as a result of an increase in teacher salaries. Over the coming four years the roll out of the Pay and Grading reform (P&G), combined with the recruitment of an additional 37,000 teachers, will put upward pressure on wage bill expenditures. It is critical for MOF and the Independent Administrative Reform & Civil Service Commission (IARCSC) to actively manage these pressures to ensure P&G implementation stays within the parameters set in the Medium Term Fiscal Framework (MTFF) and is adjusted should the overall fiscal framework change; for example should shortfalls in revenues occur.
� Implementation of P&G: Progress in this area has been slower than planned, but momentum is now picking up. A total of about 30,000 non teaching positions (Tashkeel) have been regraded in the first five ministries (MOF, MOE, MOJ, MRRD, and MAIL) and regrading of the entire teaching force is underway. For SY1388 MOF has allocated US$32.8 million to P&G implementation which would cover roughly 80,000 civil servants (including teachers) who are planned to migrate to the new structure.
� Merit based appointments: In SY1387 the Independent Appointments Board (IAB) processed 744 senior level appointments and oversaw 4,205 lower level recruitments, which is a significant drop from previous years. The slow down is caused by IAB’s revised review procedures of ministry submissions that has led to a higher rejection rate. Going forward, the roll out of P&G will place additional demands on the IAB structure as all positions – except those at grade 8 – will have to undergo merit based appointment procedures.
4. Education The Afghan Government has continued to deliver on national access to education. Gross enrollment increased to 89 percent in SY1386 and is projected to increase to 120 percent in SY13876. Student numbers increased by almost 60 percent between SY1383 and SY1387 - with female students increasing
5 Including around 37,000 contract teachers. 6 The enrollment rates can exceed 100 percent as students include outside school ages.

ARTF Quarterly Report (March 20, 2009)
24
by 70 percent to 2.2 million. The percentage of schools with School Management Committees (SMCs) reached 100 percent (of registered schools) in SY1387. Considerable room for improvement remains, however, with regards quality of education, especially teacher training. 5. Health The Afghan Government continues to deliver steady progress on health indicators. Improved access to the Basic Package of Health Services (BPHS) is observed in the improved (i) % population of districts with financing and organizational arrangements to deliver BPHS (improved from 85 percent in SY1386 to 87 percent in SY1387) and (ii) balanced score card (improved from 70 percent in SY1386 to 72 percent in SY1387).

ARTF Quarterly Report (March 20, 2009)
25
IV. THE ARTF RECURRENT COST FINANCING
1. Introduction The ARTF, through recurrent cost financing, helps finance salaries and wages of over 260,000 non-uniformed civil servants (approximately 70 percent of whom are working outside Kabul), and government’s operating and maintenance (O&M) expenditures outside of the security sector, including purchases of essential supplies. As of March 20, 2009, a total of US$1,789 million had been made available to the government over six years for recurrent cost financing of which US$1,713 million has been disbursed. The ARTF Recurrent Cost Window generally disburses 100 percent of what it allocates every year. In SY1387, US$316 million was assigned to the Government (via the Recurrent Cost Trust Fund account) to finance the recurrent costs of government. This amount includes the US$276 million agreed at the start of the year, plus the US$40 million additional financing agreed at the January 21, 2009 MC meeting. The disbursements during SY1387 amounted to US$310 million while the remaining US$5.9 million was disbursed in the first month of SY1388. 2. SY1387 Operating Budget Execution Table 3 presents budget and actual expenditures for SY1387 for the government’s operating budget as of December 21, 2008 when the budgeted expenditures were last received, adjusted to exclude those ministries ineligible for ARTF financing. Full year figures will be reported in the June 2009 Quarterly Report. With ineligible ministries excluded, the eligible budgeted and actual expenditures are reflected in bold text below.
Table 3: SY1387 Budget versus Actual Expenditures
Payroll AFN m
O&M AFN m
SY1387 AFN m
SY1386 AFN m
Initial Budget SY1387 (1) 43,389 15,000 58,389 53,600 Add: Mid year budget review 0 0 0 1,215 Defense, Interior, National Security, Presidential Protection Services (23,393) (3,507) (26,900) (22,748) Budget in ministries qualified for financing 19,996 11,493 31,489 32,067 Actual expenditures for year 31,585 16,648 48,233 50,634 Defense, Interior, National Security, Presidential Protection Services
(17,021) (2,493) (19,514) (21,576)
Advances (34) (4,771) (4,805) (1,279) Expenditures in ministries qualified for financing
14,529 9,384 23,913 27,779
Actual expenditures in percentage of adjusted budgeted expenditures 72.7% 81.6% 75.9% 86.6% Remaining budget 5,467 2,109 7,576 4,288 Remaining budget in percentage of initial budget 27.3% 18.4% 24.1% 13.4%
(1) Ordinary budget for the year SY1387 Source: Monitoring Agent 2nd Quarter SY1387 Report

ARTF Quarterly Report (March 20, 2009)
26
3. SY1387 Distribution among Cost Categories Figure 8 presents the distribution of AFN 32,993 million in eligible expenditure for SY1387 among the four broad cost categories financed by the ARTF. Payroll expenditures are divided into Payroll-based salary expenditure (PBSE) comprising all payroll based salary expenditures including gross salary, food allowance, education level allowance, PRR payment and bonus payrolls. Non-payroll-based salary expenditure (NPBSE) comprises all expenditures classified in AFMIS as wages/payroll but supported by documents other than payroll, such as assistance payments to employees and transportation expenses. O&M expenditures are broken into O&M expenditure excluding pensions (OM-P) comprising all recurrent expenditures recorded in AFMIS not included in one of the other categories, and Pensions (P) comprising pension payments by the Ministry of Labor and Social Affairs. The difference between the data presented in Table 3 bolded line “Expenditures Ministries qualified for financing” and the amount in Figure 8 below is due to the fact that the initial budget figures (Table 5) do not provide sufficient details to be able to further adjust the budget for the category “other not qualified for financing”. In other words, Table 3 reflects some budgetary expenditure which is ineligible for reasons unrelated to their ministry of origin; these expenditures are not part of the amount of AFN 32,993 million whose breakdown is reflected below in Figure 8.
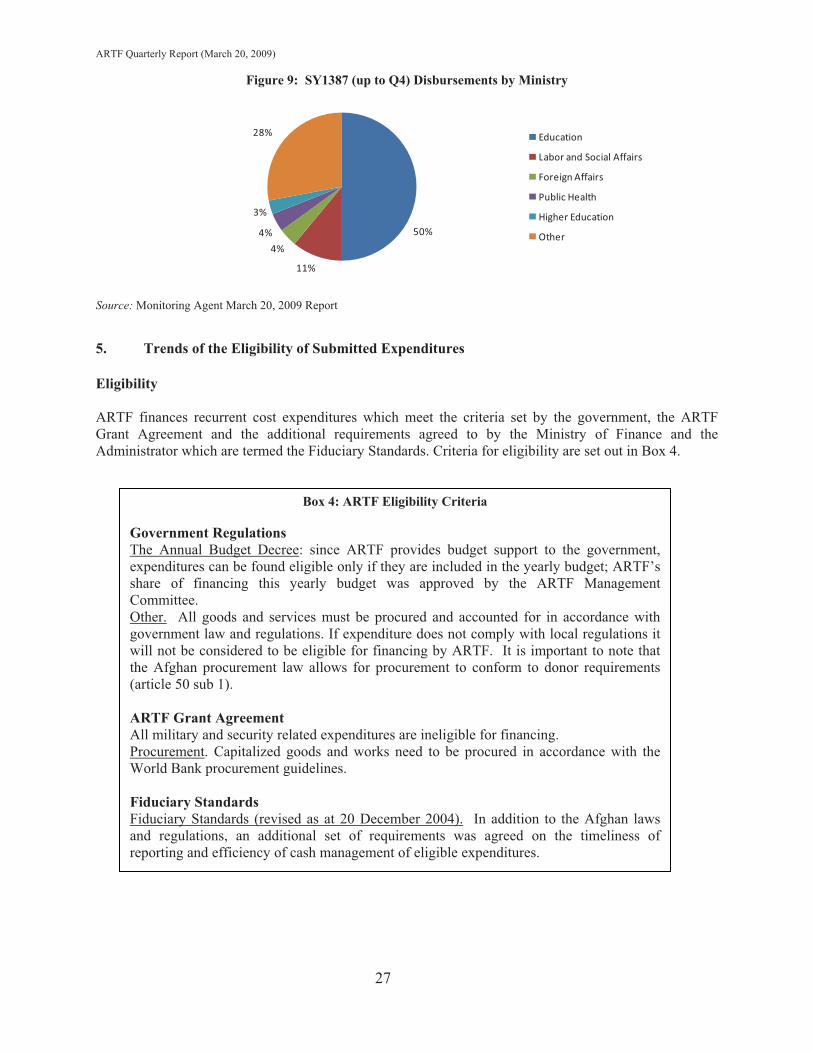
4. Recurrent Costs by Line Ministry As of March 20, 2009, 72 percent of total disbursements of payroll and O&M expenditures were related to 5 out of 49 line ministries and independent budget agencies as shown in the Figure 9 below. Fifty percent of the non-security spending was in the Ministry of Education, mainly for teachers’ salaries. Teachers represent almost half of all Afghan civil servants. The top six largest spending ministries comprised approximately 74 percent of the total non-security operating budget for SY1387.
Figure 8: SY 1387 (up to Q4) Expenditures by main category (excluding military and other ineligible expenditures) (in AFN million)
19,527 , 59%
789 , 3%
10,662 , 32%
2,015 , 6%
Payroll-based salaryNon payroll based salaryO&M excluding pensionPension
Source: Monitoring Agent March 20, 2009 Report
ARTF Quarterly Report (March 20, 2009)
27
Figure 9: SY1387 (up to Q4) Disbursements by Ministry
50%
11%
4%
4%
3%
28% Education
Labor and Social Affairs
Foreign Affairs
Public Health
Higher Education
Other
Source: Monitoring Agent March 20, 2009 Report 5. Trends of the Eligibility of Submitted Expenditures Eligibility ARTF finances recurrent cost expenditures which meet the criteria set by the government, the ARTF Grant Agreement and the additional requirements agreed to by the Ministry of Finance and the Administrator which are termed the Fiduciary Standards. Criteria for eligibility are set out in Box 4.
Box 4: ARTF Eligibility Criteria
Government Regulations The Annual Budget Decree: since ARTF provides budget support to the government, expenditures can be found eligible only if they are included in the yearly budget; ARTF’s share of financing this yearly budget was approved by the ARTF Management Committee. Other. All goods and services must be procured and accounted for in accordance with government law and regulations. If expenditure does not comply with local regulations it will not be considered to be eligible for financing by ARTF. It is important to note that the Afghan procurement law allows for procurement to conform to donor requirements (article 50 sub 1). ARTF Grant Agreement All military and security related expenditures are ineligible for financing. Procurement. Capitalized goods and works need to be procured in accordance with the World Bank procurement guidelines. Fiduciary Standards Fiduciary Standards (revised as at 20 December 2004). In addition to the Afghan laws and regulations, an additional set of requirements was agreed on the timeliness of reporting and efficiency of cash management of eligible expenditures.

ARTF Quarterly Report (March 20, 2009)
28
6. Eligibility Performance For each category—payroll or O&M—of recurrent cost, Table 4 overleaf presents comparative data on submitted expenditures and actual approved expenditures, over the life of the ARTF. Table 5 presents these for 1387 in more detail. Where payments are deemed ineligible it could be according to any of the criteria described in Box 4. The expenditure and eligibility figures for SY1384 and SY1385 were restated taking into account the final deductions based on the auditors’ findings for these years. Audit findings for 1386 are not yet reflected in the 1386 eligibility ratios7. Payroll eligibilities for the last three years were 84.9 percent (SY1384), 92.5 percent (SY1385), and 89.2 percent (SY1386). Reporting on O&M and non payroll-based compensation (phone cards etc) eligibility in SY 1387 presents a challenge. Amendments made to the public procurement law in July 2008 rendered it inadequate as a basis for eligibility of O&M and non payroll-based compensation under the ARTF. As a result no O&M expenditure was reimbursed in SY1387. Although acceptable provisions were restored in December 2008 the Administrator decided not to reimburse O&M expenditures through end of SY1387 in order to minimize the risk of reimbursing ineligible expenditures. This position explains the low approval ratios presented in Table 4. It should be noted, that if the basis for eligibility were in fact compliance with existing laws then the eligibility ratio would be the ratio of ineligible expenditures (reported in Table 5 below) to total O&M and non payroll-based compensation recorded as qualified under AFMIS. According to this alternative basis the eligibility ratio would come to 88.9 percent for Payroll and 75.6 percent for O&M for SY1387. However, either way, final eligibility will only be known following the conclusion of monitoring which will be on-going until July 2009. In payroll, the main cause of ineligibility in SY1387 is non-compliance with Government regulations and Fiduciary Standards. Lack of adequate supporting documents for embassies under the Ministry of Foreign Affairs is seen as one of the major causes of ineligibility. In O&M expenditure, non-compliance with local regulations is the major cause of ineligibility in SY1387. Most line ministries make direct purchases from state enterprise which is not permitted under the local law.
7 See Annex 2 on Audit.

ARTF Quarterly Report (March 20, 2009)
29
Table 4: SY1381-87 Summary of Statements of Expenditure: Submissions and Approvals (US$ thousand)
O&M Payroll Total O&M Payroll Total O&M Payroll TotalUSD USD USD USD USD USD % % %
1381 Total 42,239 87,917 130,157 27,318 87,690 115,007 64.7% 99.7% 88.4%1382 Total 300,478 120,204 420,682 41,737 111,241 152,978 13.9% 92.5% 36.4%
Total 82,164 202,038 284,202 61,433 186,199 247,633 74.8% 92.2% 87.1%Total 104,100 227,858 331,958 75,014 193,520 268,533 72.1% 84.9% 80.9%Q1 13,704 35,961 49,665 13,290 35,961 49,251 97.0% 100.0% 99.2%Q2 41,219 80,727 121,945 36,403 77,039 113,442 88.3% 95.4% 93.0%Q3 35,089 69,162 104,251 25,971 62,973 88,944 74.0% 91.1% 85.3%Q4 58,172 94,453 152,626 20,024 83,342 103,366 34.4% 88.2% 67.7%
Total 148,184 280,303 428,487 95,688 259,315 355,003 64.6% 92.5% 82.9%Q1 18,415 40,710 59,125 18,415 40,710 59,125 100.0% 100.0% 100.0%Q2 41,315 91,544 132,859 33,853 87,857 121,711 81.9% 96.0% 91.6%Q3 45,135 88,293 133,428 38,437 74,757 113,194 85.2% 84.7% 84.8%Q4 73,912 103,397 177,309 20,150 85,644 105,795 27.3% 82.8% 59.7%
Total 178,777 323,943 502,721 110,855 288,969 399,824 62.0% 89.2% 79.5%Q1 43,555 79,741 123,296 43,555 79,741 123,296 100.0% 100.0% 100.0%Q2 55,595 93,281 148,876 -24,055 83,710 59,655 -43.3% 89.7% 40.1%Q3 64,103 104,096 168,199 10,958 99,038 109,995 17.1% 95.1% 65.4%Q4 50,986 76,023 127,009 6,036 40,628 46,665 11.8% 53.4% 36.7%
Total 214,239 353,142 567,381 36,494 303,117 339,612 17.0% 85.8% 59.9%
1,070,182 1,595,405 2,665,586 448,540 1,430,050 1,878,590 41.9% 89.6% 70.5%
Submitted by MoF to MA Approved by MA and by WB
Grand total
1384
1383
1385
1387
1386
Source: SoEs submitted to the World Bank Notes: 1. Table excluding deductions for reaching the yearly budget cap as agreed between donors and GIRA.
2. Negative figure for O&M in the second quarter of SY 1387 is the result of recovery of expenditures reimbursed in the first quarter. Due to changes in procurement law O&M expenditure relating to SY 1387 is not reimbursable. The net figure USD 36.5m for O&M comprises expenditures on pensions. 3. SY1387 figures do not currently reflect eligibility ratios consistent with prior years since all O&M and non payroll based compensation are not qualified for reimbursement under ARTF due to amendments made to public procurement law which made it not acceptable. This is explained in detail above.
Table 5: SY1387 (up to Q4) Ineligibility by main cause and category of expenditure
AFN million GIRA ARTF FS Total PBSE 1,114.3 198.9 802.1 2,115.3 NPBSE 140.1 0.0 0.0 140.1 Payroll 1,254.4 198.9 802.1 2,255.4 O&M - Pension 3,078.0 0.0 2.6 3,080.6 Pension 10.0 0.0 1.3 11.3 O&M 3,088.0 0.0 3.9 3,091.9 Total 4,342.4 198.9 806.0 5,347.3
Table derived from monitoring site visit findings up to and including March 20, 2009.
For definitions of column headings see Box 4.

ARTF Quarterly Report (March 20, 2009)
30
Figure 10: SY1387 (up to Q4) Ineligibility by main cause (in AFN million)
Government Regulations,
4,342,81%
ARTF Grant Agreement,
199,4%
Fiduciary Standards,
806,15%
Figure 11: SY1387 (up to Q4) Ineligibility by category of expenditure (in AFN million)
Payroll-based salary,2,255,42%
O&M excluding pension,
3,092,58%

ARTF Quarterly Report (March 20, 2009)
31
ANNEX 1:
STATUS OF INVESTMENT PROJECTS

ARTF Quarterly Report (March 20, 2009)
32
Status and Ratings of Active and Disbursing ARTF Investment Projects (Amounts in US$ million)
Approved
Grant Amount
Amount
Disbursed
Amount
Available
Start Date
Closing
Date
Achievement
of Grant Objectives
Implemen-
tation
Civil Service Capacity Building (TF053940) 13.0 12.7 0.3 06/15/2005 02/28/2010 MS S
Management Capacity Program (TF090077) 10.0 0.5 9.5 10/17/2007 03/31/2010 NA NA
TA and Feasibility Study Project (TF050970) 18.5 16.9 1.6 03/08/2003 02/28/2010 MS MU
Micro-finance Support for Poverty Reduction (TF052452) 183.3 142.9 40.4 07/10/2003 06/30/2010 S S
Kabul Power Supply (TF052541) 7.4 7.1 0.3 02/02/2004 09/30/2009 MS MS
National Solidarity Program II (TF090205) 349.5 298.7 50.8 05/27/2007 09/30/2009 S S
Rehabilitation of Naghlu Hydropower Plant (TF54718) 20.0 6.3 13.7 02/13/2005 06/30/2010 MS MS
Urban Water and Sanitation (TF054729) 41.0 23.1 17.9 02/21/2005 12/31/2009 MU U
Education Quality Improvement Program (TF054730) 44.0 36.6 7.4 06/01/2005 03/31/2010 S S
Rural Water Supply And Sanitation (TF055447) 7.7 3.3 4.4 2/26/2006 12/31/2009 MS MS
Kabul-Aybak/Mazar-e-Sharif Power Project (TF091120) 57.0 14.7 42.3 12/26/2007 12/31/2009 S S
Horticulture and Livestock Program (TF091885) 11.0 1.6 9.4 05/26/2008 12/31/2009 U U
Kabul Urban Reconstruction Project (TF092073) 5.6 0.0 5.6 05/13/2008 03/31/2010 S MS
Justice Sector Reform Project (TF092160) 27.8 0.4 27.4 07/15/2008 12/31/2009 S MS
Strengthening Higher Education Project (TF092544) 5.0 1.0 4.0 08/05/2008 12/31/2012 S S
Kabul Urban Roads Improvement Project (TF093632) 18.0 0.0 18.0 02/25/2009 12/31/2010 S S
(S: Satisfactory MS: Moderately Satisfactory, MU: Moderately Unsatisfactory, U: Unsatisfactory)
Rating Definitions Highly Satisfactory (HS) There are likely to be no shortcomings in the project’s achievement of its objectives, in
its efficiency or in its relevance. Satisfactory (S) There are likely to be minor shortcomings in the project’s achievement of its objectives,
in its efficiency, or in its relevance. Moderately Satisfactory (MS)
There are likely to be moderate shortcomings in the project’s achievement of its objectives, in its efficiency, or in its relevance.
Moderately Unsatisfactory (MU)
There are likely to be significant shortcomings in the project’s achievement of its objectives, in its efficiency, or in its relevance.
Unsatisfactory (U) There are likely to be major shortcomings in the project’s achievement of its objectives, in its efficiency, or in its relevance.
Highly Unsatisfactory (HU) There are likely to be severe shortcomings in the project’s achievement of its objectives, in its efficiency, or in its relevance.

ARTF Quarterly Report (March 20, 2009)
33
1. CIVIL SERVICE CAPACITY BUILDING PROJECT (TF053940)
Contact: Ms. Monali Chowdhurie-Aziz
Approved: 02-May-05 Effective: 15-Jun-05 Closing: 28-Feb-10 [email protected] Allocated: US$13 million Disbursed: US$12.7 million Available: US$0.3 million Objective: To meet the short-term capacity needs of the Afghan Civil Service through two inter-related programs: the Afghanistan Expatriate Program (AEP) and the Lateral Entry Program (LEP). Component 1: The Afghan Expatriates Program (US$10 million) The "Afghan Expatriates" component enabled exceptionally well-qualified Afghan experts residing abroad to work as senior advisers to help key line ministries and apex agencies with institutional reforms, human resources development, and formulation and management of priority development programs. Component 2: The Lateral Entry Program (US$3 million) aims to recruit a significant number of qualified Afghan professionals to ‘act’ in line civil service positions between Grades 2 and 4, on a scale of up to US$2,000 on contract for a term of 2 years, renewable once for one year and no more, with the purpose of:
� Providing short to medium term capacity to ministries primarily in agencies where the PRR effort has been slow to take off.
� Laying the foundation for the reform process in ministries and government agencies, which are currently not under the PRR process.
Training, mentoring and motivating regular post holders to work more efficiently and more effectively for the government, providing an alternative to the continued extensive use of technical assistance and consultants. Implementation Progress (AEP): To date, 98 positions (including 3 women) have been filled through the AEP in over 20 ministries and agencies. (LEP): To date 139 lateral entrants (including 4 women) have been recruited to work in over 22 ministries and agencies. All funds have now been fully committed and all of the individual contracts will be completed within the next nine months. Issues and Actions Independent evaluations were conducted of the AEP and LEP. The results of the two reviews and subsequent discussions with government (MoF and the IARCSC) identified a new, unified program with a single set of criteria for identifying needs, recruitment, remuneration and supervision. The new Management Capacity Program (MCP) has significant advantages over maintaining two separate programs to respond to the short to medium-term management capacity needs of ministries and is described in project 2 below. Please visit the Afghanistan Expatriate Program website: http://www.artfexpat.gov.af/about.html

ARTF Quarterly Report (March 20, 2009)
34
$0.00
$2.00
$4.00
$6.00
$8.00
$10.00
$12.00
$14.00
Mill
ion
DisbursementRate: 98%
Achievement of Objectives: Implementation:
Moderately Satisfactory
Satisfactory
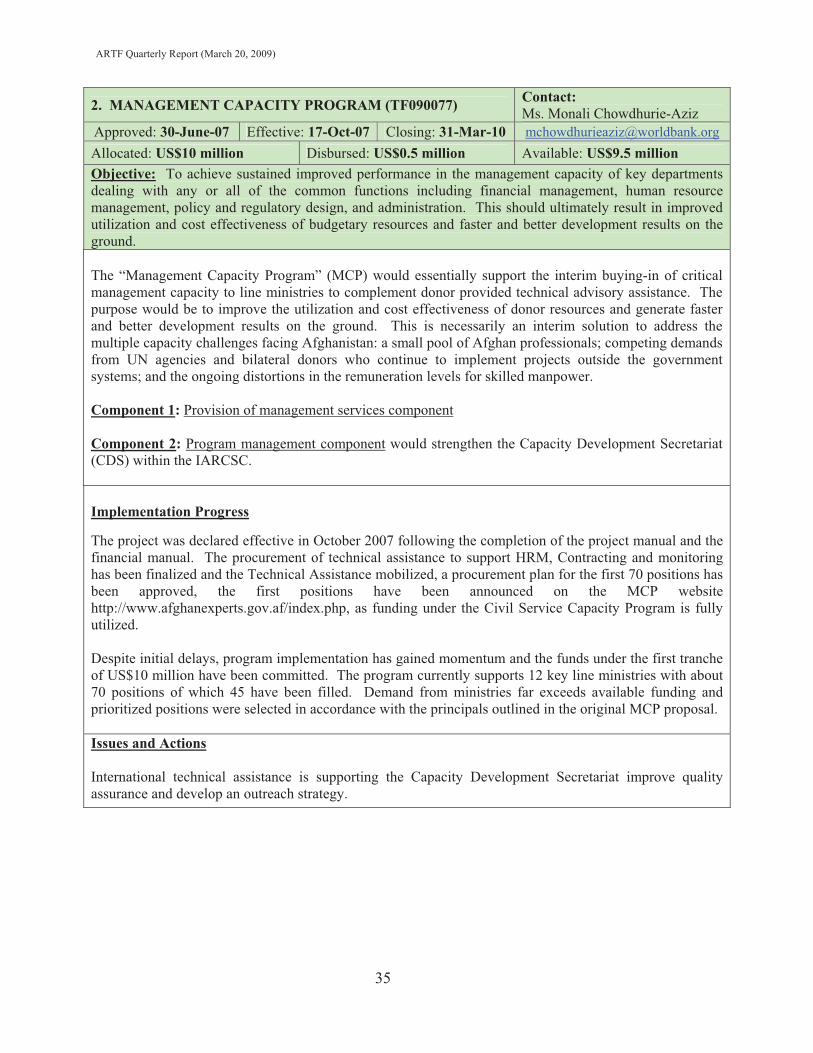
ARTF Quarterly Report (March 20, 2009)
35
2. MANAGEMENT CAPACITY PROGRAM (TF090077) Contact: Ms. Monali Chowdhurie-Aziz
Approved: 30-June-07 Effective: 17-Oct-07 Closing: 31-Mar-10 [email protected] Allocated: US$10 million Disbursed: US$0.5 million Available: US$9.5 million Objective: To achieve sustained improved performance in the management capacity of key departments dealing with any or all of the common functions including financial management, human resource management, policy and regulatory design, and administration. This should ultimately result in improved utilization and cost effectiveness of budgetary resources and faster and better development results on the ground. The “Management Capacity Program” (MCP) would essentially support the interim buying-in of critical management capacity to line ministries to complement donor provided technical advisory assistance. The purpose would be to improve the utilization and cost effectiveness of donor resources and generate faster and better development results on the ground. This is necessarily an interim solution to address the multiple capacity challenges facing Afghanistan: a small pool of Afghan professionals; competing demands from UN agencies and bilateral donors who continue to implement projects outside the government systems; and the ongoing distortions in the remuneration levels for skilled manpower. Component 1: Provision of management services component Component 2: Program management component would strengthen the Capacity Development Secretariat (CDS) within the IARCSC. Implementation Progress The project was declared effective in October 2007 following the completion of the project manual and the financial manual. The procurement of technical assistance to support HRM, Contracting and monitoring has been finalized and the Technical Assistance mobilized, a procurement plan for the first 70 positions has been approved, the first positions have been announced on the MCP website http://www.afghanexperts.gov.af/index.php, as funding under the Civil Service Capacity Program is fully utilized. Despite initial delays, program implementation has gained momentum and the funds under the first tranche of US$10 million have been committed. The program currently supports 12 key line ministries with about 70 positions of which 45 have been filled. Demand from ministries far exceeds available funding and prioritized positions were selected in accordance with the principals outlined in the original MCP proposal. Issues and Actions International technical assistance is supporting the Capacity Development Secretariat improve quality assurance and develop an outreach strategy.

ARTF Quarterly Report (March 20, 2009)
36
$0.00
$2.00
$4.00
$6.00
$8.00
$10.00
$12.00
Mill
ion
Disbursement Rate: 5%
Achievement of Objectives: Implementation:
NA
NA

ARTF Quarterly Report (March 20, 2009)
37
3. TECHNICAL ASSISTANCE AND FEASIBILITY STUDIES FACILITY (TF050970) Contact: Mr. Hugh Riddell
Approved: 08-Mar-03 Effective: 08-Mar-03 Closing: 28-Feb-10 [email protected] mailto:
Allocated: US$18.5 million Disbursed: US$16.9 million Available: US$1.6 million
Objective: To build capacity of government by providing expertise to line ministries and developing local technical and professional capacity to define reconstruction and development projects. Component 1: Feasibility Studies and Implementation Support: Aims to identify and prepare projects for financing and implementation. This component supports the recruitment of specialized firms to undertake the feasibility studies and provide management support in the implementation of IDA and ARTF funded projects in line ministries. Component 2: Recruitment of Individual Consultants: Aims at recruiting specialists to guide the preparation and supervision of reconstruction and development activities and supervise feasibility studies on behalf of the government. Implementation Progress The project is no longer taking on new projects and will close shortly. Component 1: A total of ten contracts have been awarded to consulting firms during the life of the project, which were mostly used for activities to support the Ministry of Mines, Ministry of Urban Reconstruction and Development, Kabul Municipality, and Ministry of Energy and Water, for a total commitment of US$18.5 million. The cumulative committed amount is almost fully disbursed, with only one contract remaining to be implemented and paid by the end of September 2008 (SMEC - Consulting Services for MUDH). Component 2: There are no individual experts currently working in the line ministries. Due to the changes in the circumstances and availability of funds directly related to the underlying sector interventions, individual TA support is being provided by the respective sector operations, both IDA and ARTF funded.
* Phase 2, amendment for which is being negotiated, would be planned to be financed under other funding
sources to MEW, if the project is identified in the first set of priority water infrastructure projects. ** TAFS financed portion of contract completed, Addendum 2 to the contract is under the IDA Natural Resources
Management Project.
Date Type US$ Million
Contractor Country Status
Jun-05 Baghdara Hydro Power Plant Feasibility Study for MEW 3.8
Fichtner GmBH& CoKG
Germany Phase I completed under TAFS*
Dec-05 Consulting Services for MUDH (Urban Plan) 2.6 SMEC Australia On-going
Mar-06 FM Consulting Services for Kabul Municipality (Urban Plan) 0.3 IPE India Completed
Jul-06 Aynak Copper Deposit Transaction Advisor 0.9 Gustavson
Associates USA Completed under TAFS**

ARTF Quarterly Report (March 20, 2009)
38
Issues and Actions Judging by the activities implemented, the project has had a lower than expected impact in terms of feasibility studies and its contribution to the preparation of the public investment pipeline. In many cases, individual consultants were employed for short term assignments. To what extent the engagements of individual consultants have contributed toward capacity building in Afghanistan is difficult to assess but the impact is likely to be limited. The consulting firms engaged have provided a sound contribution to the design and management of the projects that they were supporting. For example, Gustavson Associate’s work has been instrumental in the preparation of a transparent and efficient tender process for the Aynak copper deposit. The contract has been amended to include the support to the Ministry of Mines in the negotiations with the winning bidder; however additional scope of work is being financed under the IDA project.
$0.00
$3.00
$6.00
$9.00
$12.00
$15.00
$18.00
$21.00
Mill
ion Disbursement
Rate: 91%
Achievement of Objectives: Implementation:
Moderately Satisfactory
Moderately Unsatisfactory

ARTF Quarterly Report (March 20, 2009)
39
For more information on Microfinance in Afghanistan, please visit www.misfa.org.af.
4. MICROFINANCE SUPPORT FOR POVERTY REDUCTION (TF052452)
Contact: Mr. Niraj Verma, Mr. Stephen F. Rasmussen
Approved: 10-July-03 Effective: 10-July-03 Closing: 30-June-10 [email protected] [email protected]
Allocated: US$183.3 million Disbursed: US$142.9 million Undisbursed: US$40.4 million
Objective: To help Afghans improve their livelihoods using microfinance as a tool to make the transition from dependence on humanitarian assistance to economic independence and empowerment to build on entrepreneurial spirit and skills. Component 1: Microfinance Fund (Loan fund) Component 2: Capacity-building/training of Microfinance Providers Component 3: Implementation Support to MISFA and MFIs Implementation Progress Geographic Coverage: The sector has 286 branches across 24 provinces. An agreement for the provision of microfinance services by BRAC in Ghor and Daykundi was signed in December 2008 and lending activities began in the first quarter of 2009. ASA also began operations in Kabul, but it is anticipated that over time they will expand activities beyond Kabul. Sector Update: As of February 2009 and over five years of operation, the sector has more than 439,000 active clients out of which over 339,000 are active borrowers with an outstanding gross loan portfolio of over US$104 million. The sector has cumulatively disbursed 1,355,349 loans and an amount of more than US$583 million since start of the program. The current average loan size is US$306. Current repayment rate has come down slightly due to security constraints and staff management issues in some areas. Besides credit, MFIs have collected almost over US$25 million in small savings deposits. Gender / Special Clients: At present there are almost 273,874 female clients (62 percent of the total clients). Some of the microfinance partners specifically cater to women clients. The sector employs 4,825 staff, of which 40 percent are female. MISFA has trained over 700 Afghans in microfinance. There are also 13,519 returnee clients, although this number is probably understated and is not tracked by all MFIs. Projections: It is expected that by the end of SY1388 the sector will cover approximately 504,000 households and that growth in portfolio and number of clients will continue to be tepid due to security concerns, and a focus on portfolio quality. The majority of the clients will remain female, an increasing number of loans will be disbursed in rural areas, and it is anticipated that a broader selection of product types and conditions will be piloted or offered in 1388. Issues and Actions Tax Issues: MISFA’s tax advisor has provided information that a number of changes to the Afghan tax law is anticipated to go in to effect in 1388. The most significant of which is the removal of the 5% Business Receipt Tax on interest payments/earnings.

ARTF Quarterly Report (March 20, 2009)
40
$0.00
$30.00
$60.00
$90.00
$120.00
$150.00
$180.00
$210.00M
illio
n
Disbursement Rate: 78%
Achievement of Objectives: Implementation:
Satisfactory
Satisfactory

ARTF Quarterly Report (March 20, 2009)
41
5. IMPROVEMENT OF POWER SUPPLY TO KABUL (TF052541)
Contact: Mr. Sunil Kumar Khosla
Approved: 10-Dec-03 Effective: 02-Feb-04 Closing: 31-Mar-09 [email protected] Allocated: US$7.4 million Disbursed: US$7.1 million Available: US$0.3 million
Objective: The objectives of this project are to improve the availability and reliability of power supply in Kabul through the Mahipar hydropower station rehabilitation, including 110 kV of transmission lines. Measures will also be taken to improve street lighting. Component 1: Rehabilitation of Hydro Power Stations Component 2: Rehabilitation of Transmission Lines Sarobi-Kabul Component 3: Rehabilitation of Public Lighting in Kabul Implementation Progress Component 1: This component consists of the comprehensive rehabilitation of two units of 22 MW each at the Mahipar power station. The first unit was commissioned in May 2007. The rehabilitation work (delayed due to security problems) has started and is expected to be completed by June 2009. Power production in Mahipar is key for power supply in Kabul during the winter as the river feeding this power station has water only during this season from December to May, without any other competing usage. Energy produced in one unit in Mahipar can supply at least 16,000 households during the winter (assuming the average consumption of 200 kWh per month in Kabul). In addition, the alternative to produce this energy with thermal units would require 12 million liters of fuel, which would cost about US$10 million at the current oil prices Component 2: The 110 kV transmission line from the hydropower stations to Kabul was dilapidated and overloaded, and the Breshna Kot substation to which it is connected was destroyed during the war. The component funded by ARTF consisted of co-financing the rehabilitation of the nonfunctional transmission line between Sarobi and Breshna Kot sub-stations. The total cost of the project was Euro 5.5 million, and out of that amount, ARTF funded EUR 1 million, which represents 18 percent of the total. This component was completed in March 2006, and the benefit of rehabilitating this line and the Breshna-Kot substation is to provide power supply to southern part of Kabul city involving about 25,000 households. In addition, this line provides back-up support to the Naghlu-Kabul line, which provides the main power supply to Kabul.
Component 3: Kabul’s street lighting system has been largely destroyed by the war. At the time the project was initiated, Kabul was almost dark during the nights aggravating the general security in Kabul. The component funded by ARTF consisted of co-financing the rehabilitation of the main public lighting system in Kabul by providing new equipment and installations. The total cost of the project was Euro 3 million, and out of that amount, ARTF funded EUR 1 million, which represented 33 percent of the total. This component was completed in February 2005. The main benefit of the project was to rehabilitate about 116 kilometers of street-lighting circuits, which benefited about 30,000 premises in different areas of the city and improved security in these areas. Issues and Actions: Component 1 has been delayed due to: a) changes in the initial scope of work due to the need to run most units during the winter as this station only has water during this season; and b) security situation in the areas. The work on second unit has started in March 2009 and is progressing well. In order to complete that process, KfW has agreed to finance and order missing parts to complete rehabilitation of Unit 2, which is estimated to cost about Euro 1.7 million, and provide additional funds of about US$500,000 to cover a financing gap in VSHK contract due to Euro appreciation. The balance funds of US$350,000, are expected to be drawn by July, 2009 (the latest date to utilize the funds for activities completed before closing date of the project).

ARTF Quarterly Report (March 20, 2009)
42
$0.00
$1.50
$3.00
$4.50
$6.00
$7.50
$9.00
Mill
ion
Disbursement Rate: 96%
Achievement of Objectives: Implementation:
Moderately
Satisfactory
Moderately Satisfactory

ARTF Quarterly Report (March 20, 2009)
43
6. NATIONAL SOLIDARITY PROGRAM II (NSP II) TF090205 Contact: Ms. Susanne Holste or Mr. Azmat Isa
Approved: 07-Dec-06 Effective: 27-May-07 Closing: 30-Sep-09 [email protected] [email protected]
Allocated: US$349.5 million Disbursed: US$298.7 million Available: US$50.8 million
Objective: To lay the foundations for strengthening community level governance, and to support community reconstruction and development projects that improve access of the rural communities to social and productive infrastructure and services. Component 1: Block Grants for Communities to Implement Reconstruction and Development Sub-projects Component 2: Community Facilitation and Capacity Building Component 3: Program Implementation Management Support, Monitoring and Evaluation Implementation Progress: The Second National Solidarity Project (NSP II) became effective on May 15, 2007, following on from the first phase (NSP I) which closed on March 31, 2007. NSP II continues to support the 16,914 communities mobilized in NSP I while rolling-out to an additional 5,386 communities in secure areas and 1,500 communities in insecure areas. As of March 21, 2009, the program (NSP I and NSP II) has contracted Facilitating Partners (FPs) for mobilization of 23,180 communities, exceeding the originally planned 21,600 communities. The reason for this increased rollout is a strong demand for the program from communities that had not benefited from NSP. Approximately 22,102 communities have been mobilized, of which 21,777 successfully elected Community Development Councils (CDCs) and 21,605 created Community Development Plans (CDPs). 48,730 subproject proposals were submitted of which 47,498 were approved, 41,151 were partially or completely financed and 26,170 were completed. Approximately 79 percent of the financed subprojects are productive infrastructure, including: water supply and sanitation (24 percent); rural roads (24 percent); irrigation (17 percent); and, village electrification (14 percent). The remaining 21 percent of subprojects are human capital development projects, which include income generation and skills building. The November 2008 Supervision Mission assessed that NSP has made significant progress on the agreed actions during the Mid-term Review, as was elaborated in the December 20, 2008 ARTF Quarterly Report. The next supervision mission will take place in late April, 2009 and will focus on the quality of NSP infrastructure subprojects and on financial management.
Issues and Actions: 1) ARTF allocation for SY1387 and SY1388: In SY1387, NSP received US$178 million of ARTF financing, with the final tranche of US$38 million released in February 2008. In SY1388 US$100 million has been allocated for NSP in the Government of Afghanistan’s budget. A blanket approval for this amount will be requested at the Management Committee (MC) meeting in May or June 2009, depending on funding availability. 2) Funding shortfall: During the November supervision mission it was found that NSP is facing a funding gap of approximately US$264 million. It is anticipated that this funding shortfall will be reduced with an additional US$75 million from IDA, additional US$100 million from the ARTF in SY1388 and funding from bilateral sources.

ARTF Quarterly Report (March 20, 2009)
44
3) Security: Insecurity continues to be a concern for the NSP as many areas of current or planned implementation have experienced deteriorating security. The security situation in many districts is fluid and the communities, FPs and NSP must adjust accordingly. NSP has developed a strategy for implementation in high-risk areas and this strategy is currently being tested in Kandahar. During the April 2009 NSP supervision mission a half-day session is scheduled to discuss implementation in high-risk areas, lessons learned from NSP activities in Kandahar and Helmand and options for third-party monitoring in high-risk areas. 4) The future of CDCs: An identification mission for a possible NSP III is planned for late-May 2009. This mission will examine the role of CDCs in Afghanistan’s emerging sub-national governance framework, mechanisms for broadening the use of CDCs by other line ministries and other issues. 5) Payments to FPs: Delayed payments to NSP FPs have increasingly become an issue. In the past, a funding shortage was the key reason for these delays but more recently procedural delays in processing payments are an issue. NSP is planning to hold regular meetings between NSP finance, MRRD finance and the Ministry of Finance to identify the key bottlenecks in processing these payments and address them.
$0.00
$50.00
$100.00
$150.00
$200.00
$250.00
$300.00
$350.00
Mill
ion
Disbursement Rate: 85%
Achievement of Objectives: Implementation:
Satisfactory
Satisfactory
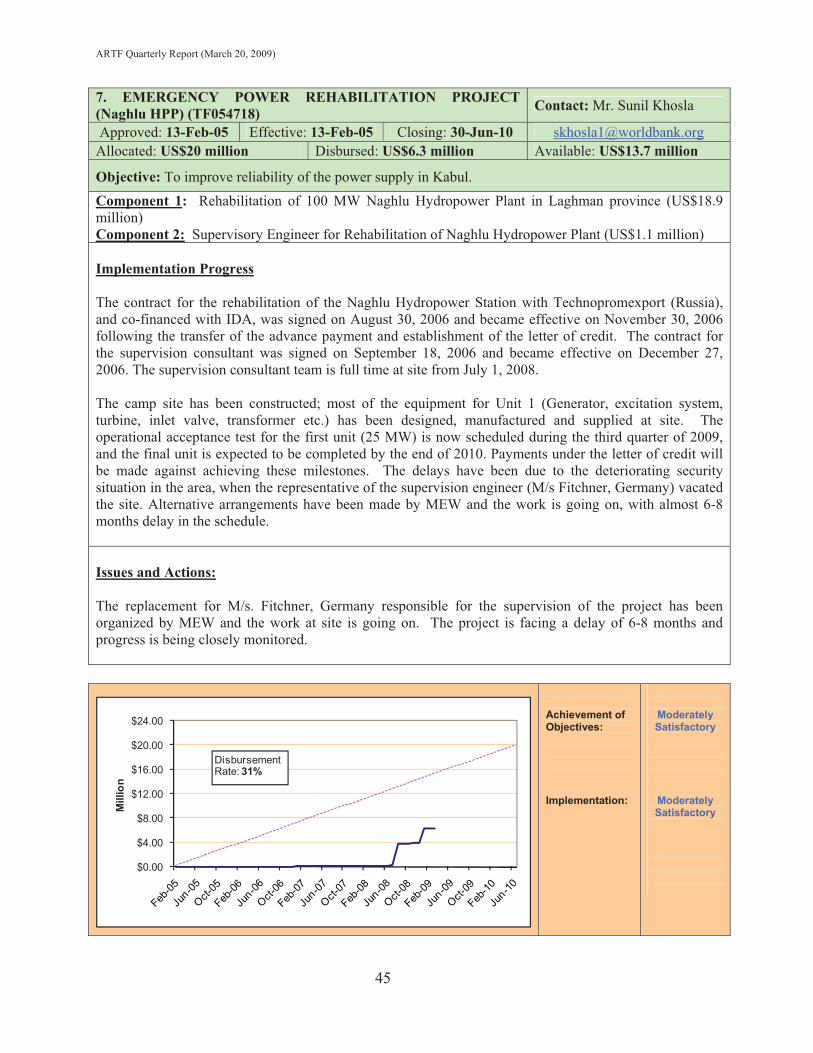
ARTF Quarterly Report (March 20, 2009)
45
$0.00
$4.00
$8.00
$12.00
$16.00
$20.00
$24.00
Mill
ion
DisbursementRate: 31%
Achievement of Objectives: Implementation:
Moderately Satisfactory
Moderately Satisfactory
7. EMERGENCY POWER REHABILITATION PROJECT (Naghlu HPP) (TF054718) Contact: Mr. Sunil Khosla
Approved: 13-Feb-05 Effective: 13-Feb-05 Closing: 30-Jun-10 [email protected] Allocated: US$20 million Disbursed: US$6.3 million Available: US$13.7 million
Objective: To improve reliability of the power supply in Kabul. Component 1: Rehabilitation of 100 MW Naghlu Hydropower Plant in Laghman province (US$18.9 million) Component 2: Supervisory Engineer for Rehabilitation of Naghlu Hydropower Plant (US$1.1 million) Implementation Progress The contract for the rehabilitation of the Naghlu Hydropower Station with Technopromexport (Russia), and co-financed with IDA, was signed on August 30, 2006 and became effective on November 30, 2006 following the transfer of the advance payment and establishment of the letter of credit. The contract for the supervision consultant was signed on September 18, 2006 and became effective on December 27, 2006. The supervision consultant team is full time at site from July 1, 2008. The camp site has been constructed; most of the equipment for Unit 1 (Generator, excitation system, turbine, inlet valve, transformer etc.) has been designed, manufactured and supplied at site. The operational acceptance test for the first unit (25 MW) is now scheduled during the third quarter of 2009, and the final unit is expected to be completed by the end of 2010. Payments under the letter of credit will be made against achieving these milestones. The delays have been due to the deteriorating security situation in the area, when the representative of the supervision engineer (M/s Fitchner, Germany) vacated the site. Alternative arrangements have been made by MEW and the work is going on, with almost 6-8 months delay in the schedule. Issues and Actions: The replacement for M/s. Fitchner, Germany responsible for the supervision of the project has been organized by MEW and the work at site is going on. The project is facing a delay of 6-8 months and progress is being closely monitored.

ARTF Quarterly Report (March 20, 2009)
46
8. URBAN WATER SUPPLY AND SANITATION (TF054729) Contact: Mr. Shyamal Sarkar Approved: 21-Feb-05 Effective: 21-Feb-05 Closing: 31-Dec-09 [email protected]
Allocated: US$41 million Disbursed: US$23.1 million Available: US$17.9 million
Objective: To provide sustainable, improved water supply and sanitation services to urban areas and to build the technical and institutional foundation for the medium term. Component 1: Kabul Water Supply – Upper Kabul River Well-field, Transmission Mains and Distribution Networks. Component 2: Kabul Sanitation – Construction of New Facilities for On-site Sanitation and Municipal Solid Waste. Component 3: Provincial Towns Water Supply/Sanitation – Rehabilitation and Extension of Systems in 13 Provincial Towns. Component 4: Engineering Support and Technical Assistance to Central Authority for Water Supply and Sewerage (CAWSS) and Kabul Municipality. Component 5: Financial Support to the government’s Central Authority for Water Supply and Sewerage (CAWSS) Operations. Implementation Progress Component 1: Kabul Water Supply – Upper Kabul River Well-field, Transmission Mains and Distribution Networks. The construction of boreholes in the Kabul River well-field has been completed. Bids for the pipelines and equipment for well fields and pumping stations, collector pipes and transmission mains, and principal and local mains packages, were nonresponsive, and estimated costs of these packages increased much beyond the allocation made under this component. The scope of this component will be revised to contain only the construction of boreholes. Equipment, pumping stations, transmission and distribution networks are proposed to be financed from other sources. KfW agreed to finance the packages for pipelines and equipment for well fields and pumping stations, collector pipes and transmission mains and the bids have been received by Ministry of Urban Development (MoUD) and are being evaluated. Construction of principal and local mains (estimated cost US$26.1 million) is proposed to be financed by restructuring the ongoing IDA assisted project. Bids for this package have been invited by MoUD and are due to be received on May 20, 2009. Component 2: Kabul Sanitation – Construction of New Facilities for On-site Sanitation and Municipal Solid Waste. The consultancies to assist Kabul Municipality in implementing the project were mobilized. Activities to provide Operations Support to the Department of Sanitation were completed. A few contracts for goods and small works including a co-composing pilot and the construction of a workshop for the Department of Sanitation were completed. Letter of acceptance of the bid for rehabilitation of Chamtala dumpsite has been issued by Kabul Municipality. This work is expected to be completed before the end of October 2009. No bids were received for construction of sludge/septage disposal station, and this item has been dropped due to lack of availability of funds. Component 3: Provincial Towns Water Supply/Sanitation – Rehabilitation and Extension of Systems in 13 Provincial Towns. This project component covers Sheberghan, Mazar-i-Sharif, Taloqan, Charikar, Jalalabad, Metherlam, Gardez, Ghazni, Kandahar, Qalat and Maimana, Pul-i- Khumri, and Zaranj. Supply of pipes, fitting and water meters for distribution networks is completed. Construction of office / warehouse buildings in Kabul, Pul-i-Khumri and Maimana, and the drilling of test wells in Zaranj, Maimana and Sheberghan are completed, and production boreholes in Taloqan are completed. Drilling and installation of

ARTF Quarterly Report (March 20, 2009)
47
production boreholes are ongoing at Sheberghan, Pul-i-Khumri and Maimana. Pipe laying activities have commenced in Qalat, Kandahar, Ghazni, Charikar, Metherlam, Jalalabad, Gardez, Mazar and Sheberghan. Component 4: Engineering Support and Technical Assistance to Central Authority for Water Supply and Sewerage (CAWSS) and Kabul Municipality. Contracts with technical support agencies are on-going on all project components. But, it is likely that the contract for Kabul Sanitation may not be extended further. Contracts with a total of seven individual advisors for MoUD, CAWSS and Kabul Municipality and nine individual consultants were funded under this project. This technical support has enabled the government to prepare follow-on operations for the medium-term program and the proposed Urban Waste Management Project. Implementation supervision support will have to be continued for the construction works in the provincial towns for period up to December 31, 2009. Estimated additional requirement is US$1.5 million (tentative). The Articles of Incorporation of the new Afghan Urban Water Supply and Sewerage Corporation (AUWSSC) were approved by Cabinet and immediately published in the official gazette in July 2007. Currently, the recruitment of a General Manager and other senior management staff is underway. The new corporation is expected to become operational in May 2009 beginning with the operation of water supply in Kabul. AUWSSC will gradually take over urban water and sewerage operation across Afghanistan as the CAWSS liquidation process makes progress town by town. Component 5: Financial Support to the government’s Central Authority for Water Supply and Sewerage (CAWSS) Operations. This component has been effective since August 2005 with about US$2 million utilized over 20 months, and the originally envisaged activities have been completed. This support contributed significantly to improve the management capacity in all 14 units of CAWSS, and generated detailed technical, financial and commercial data for the first time. The financial support to CAWSS operations was terminated on March 21, 2007 to prepare for the transition to the financial assistance to AUWSSC under the IDA-financed Urban Water Sector Project (P087860). However, AUWSSC is yet to be operational. As a result of the lack of continued support, some of the gains may have been lost. There is a need to resume financial support (of the order of US$100,000) until the AUWSSC becomes operational. Issues and Actions: � Due to lack of available funding under the ARTF grant, the scope of Component 1 of the Project is to be
revised. A request for project restructuring has been received from the Government in this regard and proposal for restructuring of this project in conjunction with the IDA financed Urban Water Sector Project (P087860) is expected to be submitted for approval in May 2009.
� Project implementation and procurement decision making gained momentum, and procurement of works is in the final stage (only one package remained for which the bids are under evaluation).
� The arrangements of provision of support by consultants to supervision of works in the provincial towns will have to be continued for orderly completion and commissioning of water supply schemes in the provincial towns.
� Several activities of the project have been dropped due to lack of resources. The activities being supported in the provincial towns are only those which are closely interlinked and dependent on each other to provide any benefit. Proposals to construct reservoirs at Qalat and Metherlam have been kept on hold due to lack of resources. An additional grant of US$3-4 million will be required.
� 6 of 24 contracts are not likely to be completed by current closing in the provincial towns. Further closing extension (6 -8 months) will be necessary.
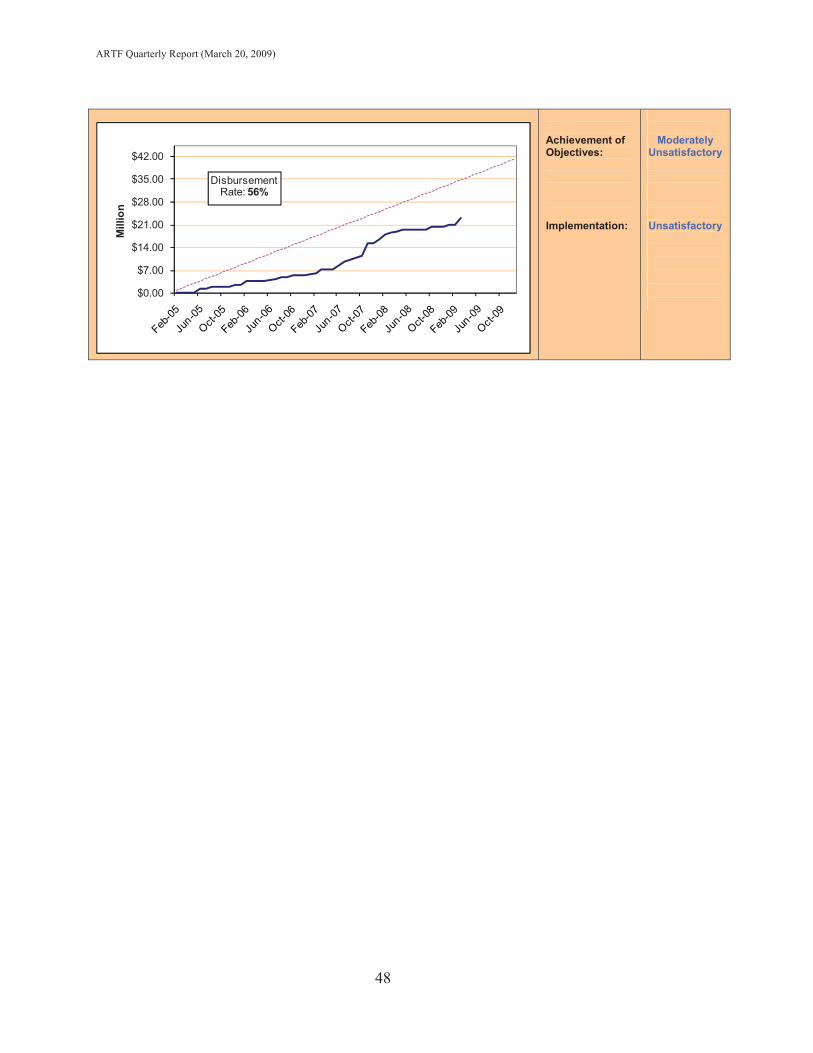
ARTF Quarterly Report (March 20, 2009)
48
$0.00
$7.00
$14.00
$21.00
$28.00
$35.00
$42.00
Mill
ion
Disbursement Rate: 56%
Achievement of Objectives: Implementation:
Moderately Unsatisfactory
Unsatisfactory

ARTF Quarterly Report (March 20, 2009)
49
9. EDUCATION QUALITY IMPROVEMENT PROGRAM (EQUIP) (TF054730) Contact: Mr Joel Reyes
Approved: 01-Jun-05 Effective: 01-Jun-05 Closing: 31-Mar-10 [email protected] [email protected]
Allocated: US$44.0 million Disbursed: US$36.6 million Available: US$7.4 million
Objective: To strengthen and support capacity of (a) schools and communities to better manage teaching/learning activities; (b) human resources (teachers, principals and educational administration personnel) and physical facilities; and (c) District Education Departments, Provincial Education Departments and the Ministry of Education (MoE). The program promotes education for girls by giving priority to female teachers and students within each component activity. Component 1: School Grants for Quality Enhancement and Infrastructure Development Component 2: Institutional and Human Resources Development Component 3: Policy Development, Monitoring and Evaluation Implementation Progress Implementation progress has been satisfactory. EQUIP has been declared a national program and is being implemented in all 34 provinces of the country. The second phase of EQUIP was effective in March 2008 with added emphasis on alignment, harmonization and capacity building for the implementation of the National Education Strategic Plan (NESP) of Afghanistan. � EQUIP has been very successful in mobilizing communities for establishing School
Management Committees and Parent Teacher Association under the quality grants enhancement subcomponent. Integrating the community participation systems within the larger institutions of the MOE (for example, quality of education, supervision and community mobilization, financial management and procurement, etc.) will be considered within EQUIP II. Strategies to deepen community understanding of quality education and to provide incentives for the sustainability of parental participation will also be included. Approximately 8000 school committees have been organized across the country and 3900 schools improvement plans developed.
� There has been satisfactory progress in infrastructure development, with increased emphasis on community participation in school construction. EQUIP I finances the construction of 828 schools (601 through community participation 190 through nationally contracted firms and 37 through provincial education departments); the last 10 percent of these schools will be contracted during 1388. EQUIP II has so far programmed the construction of 753 additional schools (655 through community participation and 98 through nationally contracted firms).
� Under EQUIP I, about 8,000 school committees were organized and trained, a number of 822 schools were built and reconstructed, more than 3,900 school improvement plans (SIPs) were implemented and 45,000 teachers and principals were trained. In regard with reform and implementation of NESP, MOE contracted technical assistance for curriculum and textbook development, infrastructure designs, monitoring evaluation, community mobilization, and improved fiduciary (financial and procurement) management.
� Implementation modality of a district based teacher training team scheme are being implemented through the support of NGOs. The MOE is seeking improved coordination and sharing of lessons learned between teacher training programs supported by key donors, in order to develop and integrated Teacher Professional Development Program. Registration has been completed and a survey of training needs has been prepared and analyzed, which will serve to better plan teacher training activities across the country. Teachers pay and grade with close coordination of donors and MOE is undergoing a process and certain bench marks have been developed to help in the achievement of systematic approach for this process by the end of 2009.

ARTF Quarterly Report (March 20, 2009)
50
� EQUIP has financed approximately 500 individual technical assistance contracts in the following departments: EQUIP Coordination Unit, Curriculum Development Department, Financial Department, Procurement Department, etc. To improved TA effectiveness, EQUIP II will seek improved coordination with the Public Administration Reform (PAR) program within the MOE, to continue to support the capacity building of the regular MOE staff and new staff to be hired through the PAR program. Presently, the MOE has setup a TA review and appointed a committee to align utilization of TA with the capacity building and institutionalization development of key institutions in the MOE for long term sustainability.
Issues and Actions: Security: A major issue affecting all investment programs in Afghanistan, including EQUIP, is the deterioration in security conditions. The MOE is defining strategies to guarantee the safety of students. EQUIP will need to adjust some of its education service delivery mechanism also, in line with increased safety needs. Maintaining the community-based management of schools approach will remain an important strategy. Disbursement: EQUIP is finalizing EQUIP I ARTF disbursements. Despite some delays in the disbursement of the US$44 million allocated to EQUIP I, disbursement rates have increased in line with the expedited school infrastructure program. The EQUIP II ARTF proposal was presented to the Management Committee at the end of SY1387. Planning and procurement activities for EQUIP II have already started to ensure disbursement of funds is efficient. Donor coordination: Improved donor harmonization mechanisms have been put in place, and the National Education Strategic Plan’s (NESP) indicators are being updated, to improve alignment, monitoring and evaluation. EQUIP’s own indicators will continue to align with NESP’s goals. Fiduciary: Fiduciary (Financial and Procurement) management improvement will continue to be supported, in the new institutionalized structures of the MOE (rather than in separate/parallel implementation units).

ARTF Quarterly Report (March 20, 2009)
51
$0.00
$6.00
$12.00
$18.00
$24.00
$30.00
$36.00
$42.00
$48.00M
illio
n
Disbursement Rate: 83%
Achievement of Objectives: Implementation:
Satisfactory
Satisfactory

ARTF Quarterly Report (March 20, 2009)
52
10. RURAL WATER SUPPLY AND SANITATION (TF055447) Contact: Mr. Srinivasa Podipireddy Approved: 15-Dec-05 Effective: 26-Feb-06 Closing: 31-Dec-09 [email protected] Allocated: US$7.7 million Disbursed: US$3.3 million Available: US$4.4 million
Objective: To improve the health of rural communities by increasing awareness through integration of health and hygiene education with the provision of safe and sustainable water supply and sanitation services in eight provinces (Baghlan, Takhar, Kunduz, Kabul, Badghis, Samangan, Jawzjan, and Sari Pul); to strengthen and build the capacities of government (central and provincial) for sector development and that of NGOs, the private sector and the communities to scale up provision of safe and sustainable water supply and sanitation services. Component 1: Strengthening Capacity of Entities and Communities Component 2: Construction of Water Points and Sanitary Latrines in Rural Areas Component 3: Carrying out Studies for Developing Service Delivery Mechanism Implementation Progress The Ministry of Rural Rehabilitation and Development (MRRD) recruited a Project Manager in August 2006 and shortly after established a Project Implementation Unit in the WatSan department. Support Organizations were mobilized in February 2007 and software activities could then be initiated. The planning phase (completed Spring 2007) resulted in the selection of four target districts in each of the eight provinces. In these 32 selected districts, action plans for selection of sub-projects were finalized at the community level together with necessary engineering designs during the summer 2007 and Support Organizations have moved into supervision of construction activities over the Winter of 2008. Hygiene and sanitation promotion and O&M training efforts have taken place in all the project villages through mobilization of hygiene promoters / visits to households and identification / training district mechanisms and water points caretakers. A total of 948 hygiene promoter couples have been trained (100 percent) and 97 percent of household visits have taken place. A total of 27 district mechanics have been trained (66 percent) and only 125 water point caretakers are yet to be trained (14 percent). Some 650 water points have been constructed (85 percent physical progress) and 1,415 demonstration latrines have been constructed (47 percent physical progress). During SY1387 MRRD requested additional funds to extend the project coverage further by taking advantage of the implementation arrangements. The ARTF Management Committee approved additional financing of US$2.65 million in August 2008 to fund an additional 420 water points and 1,260 demonstration latrines, together with associated hygiene promotion efforts in 14 districts. Special provisions were also made for project provinces affected by drought and for the insecure area of Musa Qala district in Helmand province. A total of 35 community contracts worth US$1.024 million are now finalized. The project closing date has been extended to December 31, 2009. An independent study of various different implementation models and M&E systems has been commissioned. The study will provide a platform for discussions on broader sector issues. Issues of concern to MRRD include: optimal approach to RWSS, institutional arrangements in the sector and sector development planning.

ARTF Quarterly Report (March 20, 2009)
53
$0.00
$1.00
$2.00
$3.00
$4.00
$5.00
$6.00
$7.00
$8.00
Mill
ion
Disbursement Rate: 43%
Achievement of Objectives: Implementation:
Moderately Satisfactory
Moderately Satisfactory
Issues and Actions: Deterioration in security conditions remain a concern and continue to affect implementation progress and quality of supervision. The construction of gravity pipe schemes is proving longer that initially expected. It also appeared that community contracting / funds flows through CDCs bank accounts and mobilization of staff in provincial MRRD offices have faced their own constraints. Hence additional works on schedule could not take place before the winter. The Government has requested a third extension of the closing date by another one year – which was granted, while taking immediate measures to improve implementation performance. In the meantime, broader sector work will continue to take place in parallel.

ARTF Quarterly Report (March 20, 2009)
54
$0.00
$10.00
$20.00
$30.00
$40.00
$50.00
$60.00
Mill
ion
Disbursement Rate: 26%
Achievement of Objectives: Implementation:
Satisfactory Satisfactory
11. KABUL/AYBAK/MAZAR-e-SHARIF POWER PROJECT (TF091120) Contact: Mr. Sunil Khosla
Approved: 26-Dec-07 Effective: 26-Dec-07 Closing: 31-Dec-09 [email protected] Allocated: US$57 million Disbursed: US$14.7 million Available: US$42.3 million
Objective: To provide reliable and quality power to the consumers in the target areas of the cities of Kabul, Aybak and Mazar-e-Sharif. Component 1: Distribution System Rehabilitation of part of Kabul City network. Component 2: 220 kV Substation at Aybak and interconnection with medium voltage system Component 3: Power System Rehabilitation for Mazar-e-Sharif Component 4: Institutional capacity building / support Implementation Progress Contractors for implementation of distribution rehabilitation work at Kabul, and Mazar-e-Sharif and 220/20 kV substation work for Aybak and Mazar have mobilized at site and the survey work are completed. The equipment vendors are under finalization. The equipment for testing the presence of hazardous polychlorinated biphenyls (PCB) has been dispatched and training provided to DABM staff. The last procurement for meters is under process. Some other equipments and material have been manufactured and undergone testing. The dispatch of material to site has started. Issues and Actions: In consultation with DABS and MEW, the metering strategy for the distribution system for these areas has been finalized. The technical specifications and bidding documents of meters have been finalized. MEW and the project management consultants are working to expedite equipment supply.

ARTF Quarterly Report (March 20, 2009)
55
12. HORTICULTURE AND LIVESTOCK PRODUCTIVITY PROJECT (TF091885) Contact: Mr. Usman Qamar
Approved: 26-May-08 Effective: 26-May-08 Closing: 31-Dec-09 [email protected] Allocated: US$11 million Disbursed: US$1.6 million Available: US$9.4 million
Objective: To stimulate perennial horticulture and livestock marketable output in focus areas by improving the incentives framework for private investments and strengthening institutional capacity in agriculture. Component 1: Increasing Productivity and Marketable Output of Perennial Horticulture; Component 2: Increasing Output and Productivity of Livestock; and Component 3: Capacity Building, and Monitoring and Evaluation Support Implementation Progress Since the last supervision mission in November 2008, the project has been a major focus of the Ministry of Agriculture, Irrigation and Livestock (MAIL). The Senior Advisor to the Minister is overseeing overall project management and another senior official from the Program and Coordination Unit has been designated as the Project Director. The Team Leader of the Lead Facilitating Partner has been replaced and most of the other key vacant positions in the Lead Facilitating Partner have been filled. Other significant developments include:
� Award and signing of the contract for the dairy component. � There has been good progress on the planting of new orchards with the targets for 2009 planting
almost completed. � The poultry contract is proceeding well; selection and training of beneficiary women has been
completed. � Commitments under the ARTF grant have increased steadily and the grant is now fully committed,
however actual disbursements remain low. � The National Union for Horticulture Development in Afghanistan (NUHDA) is being registered as
an NGO under a new name, the Afghanistan National Horticulture Development Organization (ANHDO).
The next supervision mission of the project will take place in June 2009 (dates are being finalized) to review progress on actions agreed in November 2008. If the desired progress and outcomes are evident during this review, and the project has a credible action plan for completing original or modified targets and achieving development objectives during an extended project period, a recommendation will be made to the Board for an extension of the closing date as part of a restructuring proposal. The action plan must include updated project cost estimations, financing plans, and work plans, and no legal covenants should be outstanding. Issues and Actions:
1. Work plans for the focus clusters are being prepared and would need to be completed before the next mission in June 2009.
2. The audit report for SY1386 needs to be submitted before June 2009, a further delay could jeopardize the extension of the closing date.
3. Gender mainstreaming still needs to be taken forward before the next review mission. 4. An overall update of actions agreed in November has been requested including the progress on
privatization of government clinics, the status of which is unclear in the last update received from the project.

ARTF Quarterly Report (March 20, 2009)
56
$0.00
$2.00
$4.00
$6.00
$8.00
$10.00
$12.00
Jun-0
8
Aug-08
Oct-08
Dec-08
Feb-09
Apr-09
Jun-0
9
Aug-09
Oct-09
Dec-09
Mill
ion
Disbursement Rate: 14%
Achievement of Objectives: Implementation:
Unsatisfactory
Unsatisfactory

ARTF Quarterly Report (March 20, 2009)
57
$0.00
$1.00
$2.00
$3.00
$4.00
$5.00
$6.00
Mill
ion
Disbursement Rate: 0%
Achievement of Objectives: Implementation:
Satisfactory
Moderately Satisfactory
13. KABUL URBAN RECONSTRUCTION PROJECT (TF092073) Contact: Ms. Soraya Goga
Approved: 13-May-08 Effective: 13-May-08 Closing: 31-Mar-10 [email protected] Allocated: US$5.6 million Disbursed: US$0 million Available: US$5.6 million
Objective: The project aims to provide improved delivery of basic urban services in vulnerable communities in Kabul through the upgrading of urban infrastructure and through enhancing the managerial capacity of Ministry of Urban Development (MoUD) and Kabul Municipality (KM). Component 1: Area Upgrading in Darwaze Lahori, Deh Afghanan, Andrabi, Murad Khanna (Kabul). Component 2: Engineering and Project Management Support. Component 3: Support on Cultural Heritage. Implementation Progress Planning and design is underway for all six works packages. In addition, Environment and Social Impact Assessments (ESIA’s) are complete for three of the four gozars. Work is set to begin in one neighborhood. Issues and Actions Cultural Heritage specialist should be hired as soon as possible
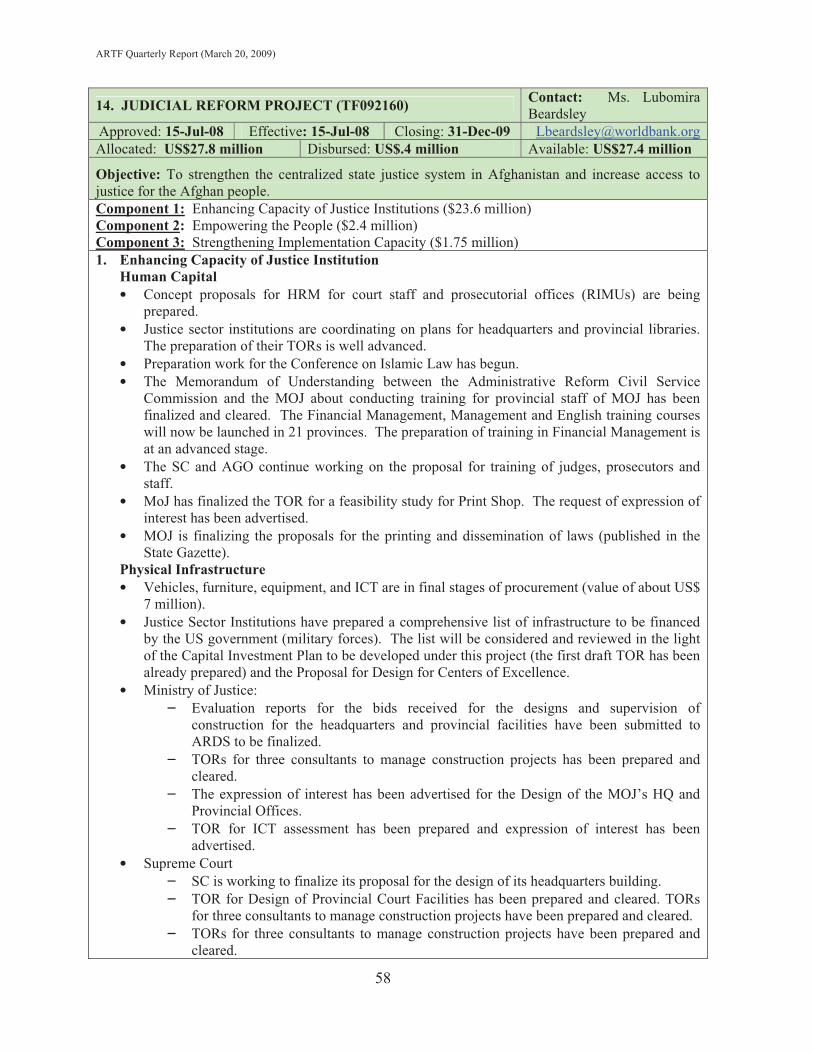
ARTF Quarterly Report (March 20, 2009)
58
14. JUDICIAL REFORM PROJECT (TF092160) Contact: Ms. Lubomira Beardsley
Approved: 15-Jul-08 Effective: 15-Jul-08 Closing: 31-Dec-09 [email protected]: US$27.8 million Disbursed: US$.4 million Available: US$27.4 million
Objective: To strengthen the centralized state justice system in Afghanistan and increase access to justice for the Afghan people. Component 1: Enhancing Capacity of Justice Institutions ($23.6 million) Component 2: Empowering the People ($2.4 million) Component 3: Strengthening Implementation Capacity ($1.75 million) 1. Enhancing Capacity of Justice Institution
Human Capital • Concept proposals for HRM for court staff and prosecutorial offices (RIMUs) are being
prepared. • Justice sector institutions are coordinating on plans for headquarters and provincial libraries.
The preparation of their TORs is well advanced. • Preparation work for the Conference on Islamic Law has begun. • The Memorandum of Understanding between the Administrative Reform Civil Service
Commission and the MOJ about conducting training for provincial staff of MOJ has been finalized and cleared. The Financial Management, Management and English training courses will now be launched in 21 provinces. The preparation of training in Financial Management is at an advanced stage.
• The SC and AGO continue working on the proposal for training of judges, prosecutors and staff.
• MoJ has finalized the TOR for a feasibility study for Print Shop. The request of expression of interest has been advertised.
• MOJ is finalizing the proposals for the printing and dissemination of laws (published in the State Gazette).
Physical Infrastructure • Vehicles, furniture, equipment, and ICT are in final stages of procurement (value of about US$
7 million). • Justice Sector Institutions have prepared a comprehensive list of infrastructure to be financed
by the US government (military forces). The list will be considered and reviewed in the light of the Capital Investment Plan to be developed under this project (the first draft TOR has been already prepared) and the Proposal for Design for Centers of Excellence.
• Ministry of Justice: – Evaluation reports for the bids received for the designs and supervision of
construction for the headquarters and provincial facilities have been submitted to ARDS to be finalized.
– TORs for three consultants to manage construction projects has been prepared and cleared.
– The expression of interest has been advertised for the Design of the MOJ’s HQ and Provincial Offices.
– TOR for ICT assessment has been prepared and expression of interest has been advertised.
• Supreme Court – SC is working to finalize its proposal for the design of its headquarters building. – TOR for Design of Provincial Court Facilities has been prepared and cleared. TORs
for three consultants to manage construction projects have been prepared and cleared. – TORs for three consultants to manage construction projects have been prepared and
cleared.

ARTF Quarterly Report (March 20, 2009)
59
– TOR for Design Standards for Courts has been prepared. The request of expression of
interest has been advertised. • Attorney General’s Office
– AGO is working with IDA to finalize its ToR for the completion of construction on its headquarters building.
– TOR for Design of Provincial Facilities has been prepared and advertised by ARDS. – TORs for three consultants to manage construction project has been prepared and
advertised. – The need for the ICT Assessment is been reconsidered in the light of the similar
assessment prepared by donors (mainly JSSP and UNDP). 2. Empowering the People
� Concept Proposals for Legal Aid and Legal Outreach Programs have been approved. Implementation of these programs will commence immediately (value of approximately US$ 2.4 million). Reallocation of grant proceeds of US$ 0.6 million to these activities has been agreed on. EC and USAID have agreed to contribute to this component by financing three international consultants who will advise the MOJ.
3. Strengthening Implementation Capacity
• Project Oversight Committee (POC) is meeting regularly. • Project Director in place since early December and Procurement Specialist hired. Recruitment is
ongoing for positions of Project Coordinator, International Procurement Specialist, Engineer, Financial Management Specialist, and three assistants.
• Draft TOR for Board of Donors (BOD) is under review. Joint POC-BOD meeting to be scheduled during the next quarter.
• Project Unit Assistants for all institutions have been hired and integrated into each institution. • PSU, Project Unit Assistants, and any interested staff working in the justice sector institutions
have received training in procurement and financial management. • The PSU is currently embedded in the MoJ but will be shifting to its own rental space during the
next quarter. Making the PSU operational (recruiting core staff, equipping office, and developing an operational manual) remains the project top priority.
Issues & Actions
• Positive evaluation of MOJ, in particular, and SC. • PSU capacity is likely to remain weak until the core staff is hired. The key issues are weak
executive leadership and a lack of understanding of and/or willingness to subscribe to the Bank and/or local mandatory procedures. The issue has been discussed with the POC and donors. The Bank will carefully monitor the performance of the PSU. Currently ARDS, the justice sector institutions, and the Bank are providing a lot of assistance to the PSU (e.g., drafting TORs, guiding procurement procedures, assisting in developing an operational manual).
• The AGO is moving forward and improving its internal organizational structure, despite substantial initial challenges, including the replacement of two Attorney Generals since the commencement of the project. Still, the AGO continues to lag behind the other institutions in terms of capacity and progress on project implementation. Leadership at the AGO has changed twice since the project was approved. The IDA conducted a workshop on the project for the new AGO staff and international consultants who assist the AGO. The IDA has also encouraged the POC to provide additional assistance and advice to the AGO.

ARTF Quarterly Report (March 20, 2009)
60
Phase 2 • Phase 2: Work is ongoing to develop a proposal for Phase 2 of this project. During the fifth
supervision mission to take place in May, the team will engage in detailed brainstorming sessions to determine the potential components of Phase 2 with the justice sector institutions and local experts. The team expects to produce a project concept note by early summer 2009.
$0.00
$5.00
$10.00
$15.00
$20.00
$25.00
$30.00
Jul-0
8
Sep-08
Nov-08
Jan-0
9
Mar-09
May-09
Jul-0
9
Sep-09
Nov-09
Mill
ion
Disbursement Rate: 1%
Achievement of Objectives: Implementation:
Satisfactory Moderately Satisfactory

ARTF Quarterly Report (March 20, 2009)
61
15. STRENGTHENING HIGHER EDUCATION PROGRAM (TF092544) Contact: Mr. Joel E. Reyes
Approved: 05-Aug-08 Effective: 05-Aug-08 Closing: 31-Dec-12 [email protected] [email protected]
Allocated: US$5.0 million Disbursed: US$1.0 million Available: US$4.0 million
Objective: The development objective of the program is to progressively restore basic operational performance at a group of core universities in Afghanistan, which will provide an institutional base for an agenda focusing on tertiary education development, capacity building and reform. Component 1: University Partnership Program Component 2: Block Grants to Universities and Faculties Component 3: Support for a new Higher Education Governance System Implementation Progress The ARTF resources are supporting components 1 and 2 of the Strengthening Higher Education Program, in four universities of Afghanistan: Balkh University, Kandahar University, Kabul Polytechnic University and Nangahar University. The ARTF Grant Agreement was signed in the summer of 2008, and the US$5 million provided for university partnerships and grants have been committed, and procurement of works, goods and services progressed. The Program is implementing a series of recommendations of the mid-term evaluation of the initial phase of the program (financed by IDA funds). These key actions, being implemented, include: (i) improve integration between partnership strategic support and use of block grants at the university level; (ii) identify lessons learned from the implementation of Partnerships and Block Grants to date, and incorporate learning in second phase of implementation; and (iii) improve support to the Ministry of Higher Education (MoHE) for strategic development of the higher education sector, and its management capacity and efficiency. As part of the strategic support to the beneficiary universities, the MoHE, and the overall Higher Education Sector, a series of consultations have been done with Chancellors, Deans, and Students of various universities in Afghanistan. The last six months of project supervision and technical assistance were focused on supporting the MoHE to revitalize its sector-wide strategic planning process. The World Bank and UNESCO formed an alliance to support the MoHE in updating its sector assessment; define with other higher education stakeholders the main areas of strategic development; and agree on an Action Plan to finalize the present revision of the Higher Education Sector Strategic Plan. Issues and Actions: The four universities supported by the ARTF have prepared and updated their strategic development plans and have revised their strategic plans, to better align project investments to the longer-term strategic plans of the faculties supported and of the university in general, to guarantee that the partnerships and block grants directly support the strategic efforts of the universities and faculties supported. This program has recently started its implementation. A comprehensive plan has been developed by the MOHE to guide smooth running of the program activities based on the agreed timeline with the WB. Education quality and management lessons learned from the university level implementation of partnerships and block grants investments will be documented and feed back to the general sector development strategy. Consultations with Chancellors, Deans, Teachers and Students will provide local feedback to the sector wide reforms to be defined. Participating international universities, participating as partners to Afghan Universities, have also pledged their support to the broader Higher Education sector reforms and improved policy development and quality monitoring capacity of the MoHE.

ARTF Quarterly Report (March 20, 2009)
62
The next semester will continue to support the strategic planning process of the HE sector. Sustainable improvements in Project Management and Lessons Learned from University level partnerships will continue to be supported. The M&E framework of SHEP will be improved. Discussions for additional donor support for Higher Education will be led by the Bank and UNESCO
$0.00
$1.00
$2.00
$3.00
$4.00
$5.00
Aug-08
Dec-08
Apr-09
Aug-09
Dec-09
Apr-10
Aug-10
Dec-10
Apr-11
Aug-11
Dec-11
Apr-12
Aug-12
Dec-12
Mill
ion
Disbursement Rate: 20%
Achievement of Objectives: Implementation:
Satisfactory
Satisfactory

ARTF Quarterly Report (March 20, 2009)
63
16. KABUL URBAN ROADS IMPROVEMENT PROJECT (TF093632)
Contact: Mr. Zafar Iqbal Raja
Approved: 19-Dec-08 Effective: 25-Feb-09 Closing: 31-Dec-10 [email protected] Allocated: US$18.0 million Disbursed: US$0 million Available: US$18.0 million
Objective: To improve traffic flow on priority corridors or segments of the main urban roads in Kabul. This will be achieved through rehabilitation of priority roads, improvement of some points/intersections, and side drains systems; which are critical for smooth flow of traffic in Kabul City. Component 1: Carrying out investments for the improvement of key city roads in Kabul, including: (i) rehabilitation of existing roads; (ii) construction and rehabilitation of road side drains and walkways; (iii) construction of roundabouts at key intersections; and (iv) installation of street lights. Component 2: (a) Provision of support to Kabul Municipality for the preparation, design, implementation and supervision of the Project; and (b) Establishment of a Project Management Unit within Kabul Municipality to strengthen the institutional capacity of Kabul Municipality. Implementation Progress The implementation progress is: Design: The Implementation Consultant (IC) has completed the design related component of their contract. This entailed detailed design of 75 kms of selected roads in Kabul city. The IC also undertook a comprehensive winter training program in December 2008 and January 2009. The training focuses on various aspects of civil engineering including 4 days of testing in the soils laboratory. 47 municipal staff attended the professional development course run in the SMEC KURIP project office. Four days of road safety / environmental awareness training was held for Municipal and Contractor staff on the 2/3/2009. There were approximately 20 attendees. Construction: The selected roads totaling approximately 12 kms have been divided into four contract packages (W-1 to W-4). Contract package W-1 and W-2 totaling 6.42 kms have already been awarded, and Contractors of these two packages have actually started work with effect from March 26, 2009. Bids were called for contract package W-3 and W-4 (totaling 5.52kms) and opened on February 8, 2009. The bid evaluation reports for W-3 and W-4 have been finally submitted to Special Procurement Review Committee to be taken up on April 26 2009. It is planned that the selected contractors would be able to mobilize and commence work by end May 2009. Issues and Actions: There are delays on the part of the Kabul Municipality in decision making. In addition the procurement and financial management capacity in the Municipality is low. The project has not started disbursement as Ministry of Finance has not yet opened the designated account in DAB. The Contractors of W-1 and W-2 have raised their mobilization invoices, and if these are not cleared, will lead to implementation delays. The implementation consultants also have payments pending with the Kabul Municipality. The Kabul Municipality needs to set-up the Project Management Unit to mitigate these issues.

ARTF Quarterly Report (March 20, 2009)
64
$0.00
$3.00
$6.00
$9.00
$12.00
$15.00
$18.00
$21.00M
illio
n
Disbursement Rate: 0%
Achievement of Objectives: Implementation:
Satisfactory
Satisfactory

ARTF Quarterly Report (March 20, 2009)
65
ANNEX 2: Recurrent Cost Financing

ARTF Quarterly Report (March 20, 2009)
66
ARTF Recurrent Cost Financing: Monitoring & Oversight Arrangements
1. Overview of the Monitoring Process The Administrator’s oversight of the ARTF’s recurrent cost financing includes the services of a Monitoring Agent (MA), employed by the Administrator. Figure 12 gives an overview of the monitoring process. The MA reviews recurrent cost expenditures through (i) desk review of all expenditures; and (ii) site visits to test a sample of expenditures. Desk Reviews Desk reviews are applied to 100 percent of all operating budget transactions recorded in the centralized integrated financial management system. Desk reviews are carried out before the government’s reimbursement request is submitted to the Administrator. Any identified inadmissible expenditures are deducted from that month’s request for reimbursement. Site Visits Site visits provide assurance that expenditures reimbursed by the ARTF comply with the fiduciary standards agreed between the Administrator and the Ministry of Finance. Ineligible expenditures detected during site visits are deducted from subsequent payment requests to be sent to the Administrator. This system ensures that all identified ineligible expenditures are promptly regularized and recovered from the Ministry of Finance, normally in the month following their detection in a site visit. Compliance Testing The MA verifies expenditure eligibility against three main sets of criteria:
� Government of Afghanistan (GoA) standards � ARTF Provisions (Legal agreement/Grant Agreement) � Fiduciary Standards (efficiency standards set by the Administrator)
Non-compliance with any of the above-mentioned sets of standards renders expenditure ineligible for reimbursement from the ARTF. There are various eligibility sub-criteria under each of the three broad sets of standards mentioned above; for instance head-count caps under GoA standards. All payroll head-counts are compared to authorized levels; payroll costs of head-counts above authorized levels are ineligible. If a certain ministry shows high trends of ineligibility in payroll, the MA then increases the frequency of site visits, thereby capturing and reviewing a larger share of the expenditures on site. Risk-based Approach The historic trends of ineligibility over the past four years provide a good basis for planning O&M monitoring on a risk basis, tailoring the approach based on each line ministry’s performance and by the cause of ineligibility. The resulting coverage puts greater emphasis on high risk entities and high risk operations. For example, expenditures from line ministries with a history of greater ineligibility are more intensely reviewed. Reporting The MA reports to the Administrator on a monthly basis, detailing its activities. These reports provide insight into the usage of funds and findings arising from the MA’s examination of expenditures. A summary report of the MA’s findings is also shared with the Ministry of Finance.

ARTF Quarterly Report (March 20, 2009)
67
Figure 12: ARTF Recurrent Cost Monitoring Process 2. Frequently Asked Questions on the ARTF Recurrent Costs Financing Why does the ARTF support the recurrent costs of the government? The government is gradually improving its own revenue base, through customs and taxation, so that it can pay its recurrent expenditures fully in the future. Improvements in revenue collection are being made. However it will take some time before the government is fully able to support its recurrent expenditures by domestic revenues. According to the MTFF (Medium-Term Fiscal Framework) as of March 2007, the government plans to cover 82 percent of recurrent expenditures by domestic revenues in SY1388. Therefore, ARTF finances part of the government’s approved recurrent expenditures except for security-related costs and land purchases. The annual budget is first approved by the Cabinet and, since SY1385, subsequently by the National Assembly. At the beginning of the fiscal year the Administrator and ARTF donors agree with the government on the volume of the financing gap in the recurrent expenditures budget to be financed by the ARTF.
Government incurs and pays recurrent cost
expenditures, comprising wages
(75%) and O&M (25%)
Monitoring Agent (MA) performs an automated Desk
Review of 100% of the recurrent cost
expenditures
Expenditures for non-qualified activities (e.g., military) and identified
ineligible expenditures by MA are deducted and a
Statement of Expenditure (SOE) is prepared for the
expenditures of the eligible activities
SOE is submitted to the Administrator and the Special (Working Capital) Account is
reimbursed
Monitoring Agent performs a risk-
based review of the SOE expenditures
Identified ineligible expenditures are
deducted from future Special (Working Capital) Account reimbursements
by the Administrator
Impact of External Audit: Ineligible expenditures identified in the annual external audit of the Government’s financial statements are reviewed by the Administrator and Monitoring Agent and deducted from future
Statements of Expenditures.

ARTF Quarterly Report (March 20, 2009)
68
Why does the ARTF not fund military or security related expenses? The Articles of Agreement of the International Development Association (IDA) and the International Bank for Reconstruction and Development (IBRD) (together, “the Bank”) prohibit the Bank from involvement in the political affairs of its member countries. In addition, the Articles of Agreement spell out the purposes of the Bank, which purposes have been interpreted by the Bank’s Board of Executive Directors not to permit involvement in military or security related activities of member countries. The Bank in its capacity as the trustee of the ARTF is guided by the overall purposes of the Bank, the political prohibition clause and the other provisions in the Articles of Agreement. Funding military or other security-related expenditures would be outside the Bank’s mandate and would violate the political involvement prohibition. What kinds of recurrent costs are financed by the ARTF? Each fiscal year the government and ARTF donors agree a proportion of government’s operating budget to be financed by the ARTF. Expenses up to this agreed amount are reimbursed by the ARTF during the year, as long as they adhere to the government's financial management regulations and the fiduciary standards stipulated in the ARTF Grant Agreement. To date, approximately 72 percent of recurrent costs have been for payroll expenses and 28 percent for operations and maintenance expenses. How does the ARTF Administrator monitor use of these funds? The Administrator has a contract with PriceWaterhouseCoopers (PWC) to serve as a Monitoring Agent (MA), which is responsible for reviewing expenses submitted to the ARTF by the government. The MA checks compliance with (i) government's internal controls; (ii) ARTF requirements; and (iii) efficiency standards. The MA reviews all of the expenditures codes to ensure they are eligible for ARTF funding and in line with the budget. The MA also reviews some expenses in more detail. The MA decides which expenses to examine more thoroughly by applying a carefully designed risk-based approach to monitoring. Is it possible that some expenditures are entirely unchecked by the MA? No, all expenditures are subject to certain minimum checks. How does the Bank monitor the work and performance of the Monitoring Agent? The MA is under contract with the Administrator which works closely with the MA to monitor their performance and work outputs. They meet regularly to review findings and determine follow up actions. In addition, as part of the Administrator's fiduciary framework for all operations (whether financed by the World Bank or the ARTF), an annual independent audit is conducted. The Bank follows up with the government and the MA on audit findings. The most recent audit covering SY1385 (March 21, 2006 – March 20, 2007), has been received by the administrator and reported on to the donors. The audit covering 1386 is underway. What are 'ineligible expenditures'? Firstly, as noted above, any security related expenditures are ineligible for ARTF financing. In addition, any expenditure that does not adhere to the government's budget and procurement rules, or to the reporting and cash management standards agreed with the Bank, would be ineligible. When an expenditure is found to be ‘ineligible’ it does not necessarily imply misuse or wrongdoing.

ARTF Quarterly Report (March 20, 2009)
69
Does the ARTF directly finance the government’s operating budget? No. The government first funds its operating budget and after an initial review of eligibility by the MA, then submits expenditure details to the Administrator which reimburses government for the eligible amounts authorized by the MA. Ineligible expenditures are frequently detected by the MA before any reimbursement takes place. However, the monitoring process reviews expenditures at later stages to detect any further ineligible expenditure which may have been reimbursed to the government at the first stage. What is the mechanism for recouping ineligible expenditures and for that matter, misused funds after they have already been paid by the ARTF? After ineligible expenditures are detected by the MA, they are deducted from the other eligible reimbursements made by the ARTF to the government. Sometimes this happens in the same month the expenditure is submitted but often it happens later due to the lag in the monitoring process. For this reason the ineligible expenditures reported each month can vary as amounts are reconciled through an ongoing process. The same process is followed if funds have been misused but in such cases the ARTF brings the issue to the direct attention of the Ministry of Finance so that controls may be strengthened in the future. Is the government's overall performance with regard to expenditure eligibility improving? Improvements have been made in the government's compliance with agreed fiduciary standards, as well as government's own control procedures. The Bank is providing capacity-building support to the Ministry of Finance and the Control and Audit office to further improve compliance. 3. Financial Management in the National Government Audit of SY1385 and SY1386 SY 1385 audited financial statements for the recurrent cost and investment trust funds were presented to the Administrator in December 2007. The Administrator found the reports acceptable and circulated to the donors on March 21, 2008 the results of its review. The 1386 Audit Report was due September 22, 2008 but difficulties in sourcing a qualified international firm to assist the Auditor General to perform the audits resulted in a delay in beginning the work. The audit firm is now appointed and the audit of the ARTF Recurrent Cost Trust Fund and the investment trust funds is underway likely to be received in June 2009. Public Financial Management Over the last three years the government of Afghanistan established a new framework for Public Finance Management (PFM) comprising: the national budget as the main policy instrument; a commitment to transparency; centralization of accounting and payments in MoF; and a centralized computerized system to issue checks and record revenues and expenditures of the ordinary and development budgets. Parallel improvements have been made in the Da Afghanistan Bank (DAB) payment systems. The government also established a Treasury Single Account (TSA) which ensures strong fiduciary controls (including regular sweeping of revenues to the center and bank reconciliations). External audit capacity was also developed; consequently, the 2004/5 financial statements of ARTF and IDA –financed operations have been audited to international standards.
ARTF Quarterly Report (March 20, 2009)
70
Procurement Management The government established a central facility for procurement that has finalized more than 527 contracts, with a total value above US$1.5 billion, using internationally accepted standards. Audit The Ministry of Finance has developed work practice tools and has carried out classroom training for 100 Internal Auditors with on-the-job-training to continue through 2008. Other ministries are developing similar programs. Analytical and Advisory Work A major review of Afghan public financial management/PEFA indicators was performed in 2005 by the Administrator. This PEFA study was updated to December 31, 2007 and a detailed report was shared with the Donors. The main findings of the assessment suggest that:
� Revenue Mobilization: On “sound and fair revenue policies; revenue projection”, revenue projections are regularly updated and they are incorporated into the budget process. However, key tax policy measures have not commenced as the National Assembly has not yet approved the amendment to the income tax law. On “effective revenue administration”, the performance of the Large Taxpayer Office (LTO) has significantly improved and it currently collects 35 percent of domestic tax revenues. The Income Tax Law stipulates that basic enforcement powers for the Revenue Department of the Ministry of Finance and Mustufiats (provincial branches of the Ministry of Finance).
� Budget Formulation: On “strategic, realistic, predictable multi-year framework”, the Medium-
Term Fiscal Framework (MTFF) was first formulated in 2005 to strengthen medium-term fiscal projections. The link between the Afghanistan National Development Strategy (ANDS) and the national budget is likely to be strengthened through the ongoing costing exercises. Also, the Ministry of Finance has been piloting initiatives on ‘program budgeting’ and ‘provincial budgeting’. With regard to “comprehensive, fully integrated budget”, the inclusion of data on municipalities and State-Owned Enterprises (SOEs) in the budget documentation requires further progress. On “orderly, open, participative budget process and revisions”, the budget circular must include indicative budget ceilings for the primary budgetary units and the budget process needs to be planned in such a way that the ministries and agencies have sufficient time to prepare their budget submissions. Also, despite progress on the part of the Ministry of Finance, strengthening capacities in the line ministries to prepare budget proposals is essential. On “adequate legislative scrutiny of the Annual Budget Law”, the Finance and Budget Commission is now providing training to its budget analysts and the members of the Commission.
� Budget Execution: On “effective cash management”, the cash management unit of Ministry of
Finance has annual cash plan with monthly update. And all discretionary funds flows are fully consolidated through Treasury Single Account (TSA). However, cash management of line ministries and Mustufiats has little progress. On “effective debt and guarantee management”, the Ministry of Finance completed a debt management strategy in October 2005 and debt review finished a fully reconciled. On “smooth, predictable budget implementation”, a survey of arrears as well as asset registry has not yet been conducted. On “internal controls”, capacity building of internal controllers of line ministries remains an issue. On “internal audit”, in the Ministry of Finance, PRR in the internal audit department of Ministry of Finance was implemented and 200 staff was trained. Capacity building of line ministries and municipalities are still of concern. On “payroll”, the coverage of Individualized Salary Payments was increased from 23,000 in 2005 to 88,000 in 2007. On “procurement”, the Procurement Policy Unit (PPU) was established in August

ARTF Quarterly Report (March 20, 2009)
71
2006 and Rules of Procedures for Public Procurement was issues in April 2007. Nevertheless, capacity constraints have prevented line ministries to progressively take responsibility for procurement transactions.
� Accounting and Reporting: On “accounting, in-year reporting”, reconciliation of government
accounting records with banking data and TSA is performing satisfactory. Undertaking roll-out of AFMIS to Mustufiats has been completed in two provinces and planned for 12 more provinces. However, developing accounting capacity of municipalities and SOEs has little progress. On “transparent and accessible external financial reporting”, the Harmonized reporting and financial reviews by the Aid Coordination Unit of Ministry of Finance in late 2007 has contributed to capture and report accurate expenditures of donor implemented projects. A remaining agenda is disclosure of SOEs annual financial results.
Treasury Operations at Present Treasury operations are advancing. Most middle management positions have been staffed. Similarly, the review of the internal controls being carried out by the MA indicates that the bank reconciliations have improved although weaknesses in payments and payroll persist. Progress on the extension of the Verified Payroll Program (VPP) has fallen short of plans. These problems are being addressed. Internal Control at MoF All payment requests are subject to internal control by the MoF. The main procedures are as follows: � All payment request forms are reviewed at the line ministries by the independent MoF controllers.
Treasury will only accept payment authorization forms that are authorized by the independent controllers.
� Budget availability is verified at the MoF prior to issuance of checks. � A check authorization process is in place. 4. Capacity Building in Public Financial Management The leading cause of ineligibility of O&M is non-compliance with procurement rules. To address this problem, the MoF engaged a procurement capacity-building consultant, Charles Kendall Partners. This firm has completed a needs assessment and begun the dissemination of the procurement law and training to procurement staff. The change in the Procurement Law in July, 2008 has hampered this work which nevertheless has adjusted to this difficult. The government has agreed to restore to provisions in line with best practices.

ARTF Quarterly Report (March 20, 2009)
72
ANNEX 3:
ARTF Financial Tables
These tables show the financial situation of ARTF at March 20, 2009. The tables are updated monthly and are available at the ARTF web site
http://www.worldbank.org/artf

AR
TF Q
uarte
rly R
epor
t (M
arch
20,
200
9)
73
8
SY 1
381
SY 1
382
SY 1
383
SY 1
384
SY 1
385
SY 1
386
SY 1
387
SY 1
381-
88SY
138
1-88
SY 1
381-
88SY
138
1-88
Don
orTo
tal
Tota
lTo
tal
Tota
lTo
tal
Tota
lTo
tal
Tota
lSi
gned
Un-
sign
edTo
tal
% o
f To
tal
Tota
l%
of T
otal
Paid
-inPa
id-in
Paid
-inPa
id-in
Paid
-inPa
id-in
Paid
-inPa
id-in
Pled
ges
Pled
ges
SY 1
388
SY 1
388
Paid
-inPa
id-in
Aus
tralia
0.00
02.
635
6.26
87.
654
5.83
62.
089
31.4
390.
000
0.00
013
.872
13.8
723.
1%69
.793
2.0%
55.9
211.
9%B
ahra
in0.
000
0.50
40.
000
0.00
00.
000
0.00
00.
000
0.00
00.
000
0.00
00.
000
0.0%
0.50
40.
0%0.
504
0.0%
Bel
gium
0.00
00.
000
0.00
00.
000
0.00
00.
000
2.60
60.
000
2.60
90.
000
2.60
90.
6%5.
216
0.2%
2.60
60.
1%C
anad
a11
.998
50.0
935.
491
72.3
4358
.863
213.
461
22.0
680.
000
13.3
142.
986
16.3
003.
6%45
0.61
613
.2%
434.
317
14.6
%D
enm
ark
5.00
05.
000
3.16
33.
916
4.34
38.
426
20.8
620.
000
0.00
00.
000
0.00
00.
0%50
.710
1.5%
50.7
101.
7%E
C/E
U15
.871
52.7
2047
.595
58.7
7152
.720
73.6
1511
.314
0.00
00.
000
15.9
0415
.904
3.5%
328.
509
9.6%
312.
606
10.5
%Fi
nlan
d2.
792
2.45
15.
946
0.00
02.
418
5.40
47.
915
0.00
00.
000
8.35
08.
350
1.8%
35.2
761.
0%26
.926
0.9%
Fran
ce0.
000
0.00
00.
000
0.00
00.
000
0.00
05.
133
0.00
00.
000
0.00
00.
000
0.0%
5.13
30.
1%5.
133
0.2%
Ger
man
y10
.068
11.4
4315
.941
1.23
020
.474
55.9
9274
.000
0.00
00.
000
32.6
1632
.616
7.2%
221.
764
6.5%
189.
148
6.4%
Indi
a0.
200
0.20
00.
000
0.40
00.
200
0.20
00.
193
0.00
00.
007
0.00
00.
007
0.0%
1.40
00.
0%1.
393
0.0%
Iran,
Isla
mic
Rep
u0.
000
0.98
90.
000
0.00
00.
000
0.00
00.
000
0.00
00.
000
0.00
00.
000
0.0%
0.98
90.
0%0.
989
0.0%
Irela
nd1.
000
1.69
91.
814
0.61
21.
276
1.45
81.
576
0.00
00.
000
0.00
00.
000
0.0%
9.43
40.
3%9.
434
0.3%
Italy
17.0
000.
000
6.53
90.
000
9.22
38.
804
34.0
730.
000
0.00
00.
000
0.00
00.
0%75
.638
2.2%
75.6
382.
5%Ja
pan
5.00
00.
000
0.00
00.
000
0.00
00.
000
0.00
00.
000
0.00
00.
000
0.00
00.
0%5.
000
0.1%
5.00
00.
2%K
orea
, Rep
ublic
o2.
000
2.00
02.
000
0.00
00.
000
0.00
00.
000
0.00
00.
000
0.00
00.
000
0.0%
6.00
00.
2%6.
000
0.2%
Kuw
ait
5.00
05.
000
5.00
00.
000
0.00
00.
000
0.00
00.
000
0.00
00.
000
0.00
00.
0%15
.000
0.4%
15.0
000.
5%Lu
xem
bour
g1.
000
0.00
00.
000
0.60
51.
563
1.07
01.
138
0.00
01.
044
0.00
01.
044
0.2%
6.42
00.
2%5.
377
0.2%
Net
herla
nds
33.6
6741
.151
46.4
1529
.664
50.8
0539
.765
39.4
630.
000
5.30
042
.434
47.7
3410
.6%
328.
663
9.6%
280.
930
9.5%
New
Zea
land
0.00
00.
000
0.00
00.
000
0.62
80.
000
0.00
00.
000
0.00
00.
000
0.00
00.
0%0.
628
0.0%
0.62
80.
0%N
orw
ay6.
818
29.6
309.
913
22.5
4423
.215
30.9
8031
.470
0.00
025
.997
0.00
025
.997
5.8%
180.
567
5.3%
154.
571
5.2%
Pol
and
0.00
00.
000
0.00
00.
000
0.29
00.
270
1.17
10.
000
0.00
00.
000
0.00
00.
0%1.
730
0.1%
1.73
00.
1%P
ortu
gal
0.00
00.
457
0.72
50.
000
0.00
00.
000
0.00
00.
000
0.00
00.
000
0.00
00.
0%1.
182
0.0%
1.18
20.
0%R
ussi
an F
eder
atio
0.00
00.
000
0.00
00.
000
0.00
00.
000
2.00
00.
000
2.00
00.
000
2.00
00.
4%4.
000
0.1%
2.00
00.
1%S
audi
Ara
bia
10.0
005.
000
5.00
00.
000
5.00
00.
000
0.00
00.
000
0.00
00.
000
0.00
00.
0%25
.000
0.7%
25.0
000.
8%S
pain
0.00
00.
000
0.00
00.
000
0.00
022
.038
0.00
00.
000
0.00
026
.093
26.0
935.
8%48
.131
1.4%
22.0
380.
7%S
wed
en3.
103
5.98
225
.905
12.8
3914
.680
20.1
7818
.354
0.00
00.
000
15.4
6315
.463
3.4%
116.
503
3.4%
101.
040
3.4%
Sw
itzer
land
0.67
30.
000
0.00
00.
000
0.00
00.
000
0.00
00.
000
0.00
00.
000
0.00
00.
0%0.
673
0.0%
0.67
30.
0%Tu
rkey
0.50
00.
000
0.00
00.
000
0.00
00.
000
0.00
00.
000
0.00
00.
000
0.00
00.
0%0.
500
0.0%
0.50
00.
0%U
ND
P0.
000
2.41
10.
000
0.00
00.
000
0.00
00.
000
0.00
00.
000
0.00
00.
000
0.0%
2.41
10.
1%2.
411
0.1%
Uni
ted
Kin
gdom
15.0
7947
.096
103.
062
131.
473
128.
487
151.
052
162.
544
0.00
05.
552
86.7
5092
.302
20.4
%83
1.09
424
.3%
738.
792
24.9
%U
nite
d S
tate
s38
.000
20.0
0089
.591
62.0
0073
.900
0.00
015
9.50
00.
000
0.00
015
1.50
015
1.50
033
.5%
594.
491
17.4
%44
2.99
114
.9%
TOTA
L 18
4.76
828
6.46
138
0.36
840
4.05
045
3.92
163
4.80
362
6.81
60.
000
55.8
2339
5.96
745
1.79
010
0.0%
3422
.976
100.
0%29
71.1
8610
0.0%
Tota
l%
of T
otal
Tabl
e 1
- Act
ual a
nd E
xpec
ted
Don
or C
ontr
ibut
ions
Pai
d-In
, Com
mitt
ed, P
ledg
ed
(US
$ M
illio
n)
SY 1
388
Mar
ch 2
0, 2
009
1.
U
nsig
ned
pled
ges
are
reco
rded
bas
ed o
n a
com
mun
icat
ion
from
the
Don
or to
the
AR
TF A
dmin
istra
tor.
2.
Sig
ned
pled
ges
are
com
mitm
ents
reco
rded
bas
ed o
n co
unte
rsig
ned
lega
l doc
umen
ts c
onfir
min
g th
e pl
edge
d am
ount
. 3.
P
aid
amou
nts
refle
ct re
ceip
t of f
unds
and
con
vers
ion
to U
S d
olla
rs.

AR
TF Q
uarte
rly R
epor
t (M
arch
20,
200
9)
74
SY
138
1S
Y 1
382
SY
138
3S
Y 1
384
SY
138
5S
Y 1
386
SY
138
7D
onor
Cur
rP
rogr
amP
aid-
inP
aid-
inP
aid-
inP
aid-
inP
aid-
inP
aid-
inP
aid-
inTo
tal
Exp
ress
edO
f whi
chU
S$
US
$U
S$
US
$U
S$
US
$U
S$
Ow
n C
urr.
US
$ E
st.
Ow
n C
urr.
US
$S
Y 1
388
Pre
fere
nce
Pai
d-in
Nor
way
NO
KC
ivil
Ser
vice
Cap
acity
Bui
ldin
g0.
000
0.00
02.
918
3.10
20.
000
0.00
00.
000
0.00
00.
000
0.00
00.
000
0.00
06.
020
6.02
0U
nite
d S
tate
sU
SD
Civ
il S
ervi
ce C
apac
ity B
uild
ing
0.00
00.
000
4.30
00.
000
0.00
00.
000
0.00
00.
000
0.00
00.
000
0.00
00.
000
4.30
04.
300
Tota
l C
ivil
Ser
vice
Cap
acity
Bui
ldin
g0.
000
0.00
07.
218
3.10
20.
000
0.00
00.
000
0.00
00.
000
0.00
00.
000
0.00
010
.320
10.3
20A
ustr
alia
AU
DE
duca
tion
- EQ
UIP
0.00
00.
000
0.00
00.
000
0.00
00.
000
7.62
22.
500
1.65
10.
000
0.00
01.
651
9.27
37.
622
Can
ada
CA
DE
duca
tion
- EQ
UIP
0.00
00.
000
0.00
00.
000
0.00
029
.797
0.00
011
.500
9.27
90.
000
0.00
09.
279
39.0
7729
.797
Ger
man
yE
UR
Edu
catio
n - E
QU
IP0.
000
0.00
00.
000
0.00
00.
000
0.00
015
.716
0.00
00.
000
0.00
00.
000
0.00
015
.716
15.7
16N
ethe
rland
sE
UR
Edu
catio
n - E
QU
IP0.
000
0.00
00.
000
0.00
00.
000
0.00
00.
000
5.50
07.
176
0.00
00.
000
7.17
67.
176
0.00
0N
ethe
rland
sU
SD
Edu
catio
n - E
QU
IP0.
000
0.00
00.
000
0.00
00.
000
4.00
00.
000
0.00
00.
000
0.00
00.
000
0.00
04.
000
4.00
0N
orw
ayN
OK
Edu
catio
n - E
QU
IP0.
000
0.00
04.
607
0.00
00.
000
5.13
00.
000
0.00
00.
000
0.00
00.
000
0.00
09.
738
9.73
8S
pain
EU
RE
duca
tion
- EQ
UIP
0.00
00.
000
0.00
00.
000
0.00
00.
000
0.00
01.
500
1.95
70.
000
0.00
01.
957
1.95
70.
000
Sw
eden
SE
KE
duca
tion
- EQ
UIP
0.00
00.
000
0.00
00.
000
0.00
00.
000
0.00
020
.000
2.37
90.
000
0.00
02.
379
2.37
90.
000
Uni
ted
Sta
tes
US
DE
duca
tion
- EQ
UIP
0.00
00.
000
0.00
00.
000
0.00
00.
000
12.0
000.
000
0.00
00.
000
0.00
00.
000
12.0
0012
.000
Tota
l E
duca
tion
- EQ
UIP
0.00
00.
000
4.60
70.
000
0.00
038
.928
35.3
3841
.000
22.4
420.
000
0.00
022
.442
101.
315
78.8
73C
anad
aC
AD
Hor
ticul
ture
and
Liv
esto
ck P
rogr
am0.
000
0.00
00.
000
0.00
00.
000
3.53
10.
000
0.00
00.
000
0.00
00.
000
0.00
03.
531
3.53
1U
nite
d K
ingd
omG
BP
Hor
ticul
ture
and
Liv
esto
ck P
rogr
am0.
000
0.00
00.
000
0.00
00.
000
1.97
74.
163
4.50
06.
246
0.00
00.
000
6.24
612
.386
6.14
0To
tal
Hor
ticul
ture
and
Liv
esto
ck P
rogr
am0.
000
0.00
00.
000
0.00
00.
000
5.50
84.
163
4.50
06.
246
0.00
00.
000
6.24
615
.917
9.67
1C
anad
aC
AD
Just
ice
Sec
tor R
efor
m P
roje
ct0.
000
0.00
00.
000
0.00
00.
000
0.00
00.
000
3.70
02.
986
0.00
00.
000
2.98
62.
986
0.00
0E
C/E
UE
UR
Just
ice
Sec
tor R
efor
m P
roje
ct0.
000
0.00
00.
000
0.00
00.
000
0.00
00.
000
10.0
0013
.047
0.00
00.
000
13.0
4713
.047
0.00
0Ita
lyE
UR
Just
ice
Sec
tor R
efor
m P
roje
ct0.
000
0.00
00.
000
0.00
00.
000
0.00
014
.790
0.00
00.
000
0.00
00.
000
0.00
014
.790
14.7
90N
orw
ayN
OK
Just
ice
Sec
tor R
efor
m P
roje
ct0.
000
0.00
00.
000
0.00
00.
000
0.00
02.
098
0.00
00.
000
0.00
00.
000
0.00
02.
098
2.09
8U
nite
d K
ingd
omG
BP
Just
ice
Sec
tor R
efor
m P
roje
ct0.
000
0.00
00.
000
0.00
00.
000
0.00
04.
904
0.00
00.
000
0.00
00.
000
0.00
04.
904
4.90
4U
nite
d S
tate
sU
SD
Just
ice
Sec
tor R
efor
m P
roje
ct0.
000
0.00
00.
000
0.00
00.
000
0.00
00.
000
1.50
01.
500
0.00
00.
000
1.50
01.
500
0.00
0To
tal
Just
ice
Sec
tor
Ref
orm
Pro
ject
0.00
00.
000
0.00
00.
000
0.00
00.
000
21.7
9215
.200
17.5
320.
000
0.00
017
.532
39.3
2421
.792
Uni
ted
Kin
gdom
GB
PM
anag
emen
t Cap
acity
Pro
gram
0.00
00.
000
0.00
00.
000
0.00
00.
000
7.38
72.
000
2.77
60.
000
0.00
02.
776
10.1
637.
387
Uni
ted
Sta
tes
US
DM
anag
emen
t Cap
acity
Pro
gram
0.00
00.
000
0.00
00.
000
0.00
00.
000
1.00
00.
000
0.00
00.
000
0.00
00.
000
1.00
01.
000
Tota
l M
anag
emen
t Cap
acity
Pro
gram
0.00
00.
000
0.00
00.
000
0.00
00.
000
8.38
72.
000
2.77
60.
000
0.00
02.
776
11.1
638.
387
Aus
tral
iaA
UD
Mic
rofin
ance
for
Pov
erty
Red
uctio
n0.
000
0.00
00.
000
0.00
00.
778
1.04
54.
764
2.00
01.
321
0.00
00.
000
1.32
17.
907
6.58
6C
anad
aC
AD
Mic
rofin
ance
for
Pov
erty
Red
uctio
n0.
000
4.70
85.
491
12.8
4724
.165
38.8
325.
413
0.00
00.
000
0.00
00.
000
0.00
091
.455
91.4
55D
enm
ark
DK
KM
icro
finan
ce fo
r P
over
ty R
educ
tion
0.00
00.
000
0.00
01.
625
2.11
01.
465
6.40
00.
000
0.00
00.
000
0.00
00.
000
11.6
0111
.601
Finl
and
EU
RM
icro
finan
ce fo
r P
over
ty R
educ
tion
0.00
00.
000
0.00
00.
000
0.00
01.
367
2.21
61.
600
2.08
70.
000
0.00
02.
087
5.67
03.
583
Net
herla
nds
EU
RM
icro
finan
ce fo
r P
over
ty R
educ
tion
0.00
00.
000
0.00
00.
000
0.00
00.
000
0.00
02.
025
2.64
20.
000
0.00
02.
642
2.64
20.
000
Net
herla
nds
US
DM
icro
finan
ce fo
r P
over
ty R
educ
tion
0.00
00.
000
0.00
00.
000
0.00
02.
500
0.00
05.
300
5.30
00.
000
0.00
05.
300
7.80
02.
500
Sw
eden
SE
KM
icro
finan
ce fo
r P
over
ty R
educ
tion
0.00
00.
000
2.22
00.
000
0.00
00.
000
0.00
00.
000
0.00
00.
000
0.00
00.
000
2.22
02.
220
Uni
ted
Kin
gdom
GB
PM
icro
finan
ce fo
r P
over
ty R
educ
tion
0.00
00.
000
3.78
214
.542
9.31
29.
846
27.4
520.
000
0.00
00.
000
0.00
00.
000
64.9
3564
.935
Uni
ted
Sta
tes
US
DM
icro
finan
ce fo
r P
over
ty R
educ
tion
0.00
00.
000
5.00
00.
000
0.00
00.
000
0.00
00.
000
0.00
00.
000
0.00
00.
000
5.00
05.
000
Tota
l M
icro
finan
ce fo
r P
over
ty R
educ
tion
0.00
04.
708
16.4
9329
.015
36.3
6555
.055
46.2
4510
.925
11.3
510.
000
0.00
011
.351
199.
232
187.
881
Aus
tral
iaA
UD
Nat
iona
l Em
erge
ncy
Em
ploy
men
t Pro
gram
0.00
00.
000
0.00
00.
000
0.77
80.
000
4.76
41.
000
0.66
10.
000
0.00
00.
661
6.20
25.
542
Can
ada
CA
DN
atio
nal E
mer
genc
y E
mpl
oym
ent P
rogr
am0.
000
0.00
00.
000
0.00
01.
277
3.36
30.
000
0.00
00.
000
0.00
00.
000
0.00
04.
640
4.64
0E
C/E
UE
UR
Nat
iona
l Em
erge
ncy
Em
ploy
men
t Pro
gram
0.00
00.
000
0.00
00.
000
0.00
00.
000
11.3
142.
190
2.85
70.
000
0.00
02.
857
14.1
7111
.314
Spa
inE
UR
Nat
iona
l Em
erge
ncy
Em
ploy
men
t Pro
gram
0.00
00.
000
0.00
00.
000
0.00
00.
000
0.00
06.
000
7.82
80.
000
0.00
07.
828
7.82
80.
000
Uni
ted
Kin
gdom
GB
PN
atio
nal E
mer
genc
y E
mpl
oym
ent P
rogr
am0.
000
0.00
00.
000
18.2
3813
.909
0.00
00.
000
0.00
00.
000
0.00
00.
000
0.00
032
.147
32.1
47U
nite
d S
tate
sU
SD
Nat
iona
l Em
erge
ncy
Em
ploy
men
t Pro
gram
0.00
00.
000
0.00
02.
000
0.00
00.
000
21.1
000.
000
0.00
00.
000
0.00
00.
000
23.1
0023
.100
Tota
l N
atio
nal E
mer
genc
y E
mpl
oym
ent P
rogr
am0.
000
0.00
00.
000
20.2
3815
.964
3.36
337
.177
9.19
011
.346
0.00
00.
000
11.3
4688
.088
76.7
42A
ustr
alia
AU
DN
atio
nal S
olid
arity
Pro
gram
0.00
00.
000
0.00
00.
000
0.77
80.
000
9.52
72.
000
1.32
10.
000
0.00
01.
321
11.6
2610
.305
Bel
gium
EU
RN
atio
nal S
olid
arity
Pro
gram
0.00
00.
000
0.00
00.
000
0.00
00.
000
1.30
31.
000
1.30
50.
000
0.00
01.
305
2.60
81.
303
Can
ada
CA
DN
atio
nal S
olid
arity
Pro
gram
0.00
010
.985
0.00
014
.339
17.8
3077
.238
9.99
30.
000
0.00
00.
000
0.00
00.
000
130.
385
130.
385
Den
mar
kD
KK
Nat
iona
l Sol
idar
ity P
rogr
am0.
000
0.00
00.
000
0.00
00.
000
3.66
30.
000
0.00
00.
000
0.00
00.
000
0.00
03.
663
3.66
3E
C/E
UE
UR
Nat
iona
l Sol
idar
ity P
rogr
am0.
000
0.00
09.
694
21.5
6813
.180
22.0
760.
000
0.00
00.
000
0.00
00.
000
0.00
066
.518
66.5
18Fi
nlan
dE
UR
Nat
iona
l Sol
idar
ity P
rogr
am0.
000
0.00
00.
000
0.00
00.
000
1.36
71.
741
1.60
02.
087
0.00
00.
000
2.08
75.
196
3.10
8G
erm
any
EU
RN
atio
nal S
olid
arity
Pro
gram
0.00
00.
000
6.13
10.
000
0.00
022
.397
23.3
1410
.000
13.0
470.
000
0.00
013
.047
64.8
8851
.841
Nor
way
NO
KN
atio
nal S
olid
arity
Pro
gram
0.00
00.
000
0.00
03.
102
9.01
810
.728
4.26
330
.000
4.45
70.
000
0.00
04.
457
31.5
6727
.111
Sw
eden
SE
KN
atio
nal S
olid
arity
Pro
gram
0.00
00.
000
0.00
00.
000
3.67
05.
236
5.84
035
.000
4.16
30.
000
0.00
04.
163
18.9
0914
.746
Uni
ted
Kin
gdom
GB
PN
atio
nal S
olid
arity
Pro
gram
0.00
05.
723
0.00
016
.394
9.31
230
.252
0.00
00.
000
0.00
00.
000
0.00
00.
000
61.6
8161
.681
Uni
ted
Kin
gdom
US
DN
atio
nal S
olid
arity
Pro
gram
0.00
00.
000
0.00
00.
000
0.00
00.
000
13.4
450.
000
0.00
00.
000
0.00
00.
000
13.4
4513
.445
Uni
ted
Sta
tes
US
DN
atio
nal S
olid
arity
Pro
gram
0.00
00.
000
10.0
000.
000
25.0
000.
000
65.0
0050
.000
50.0
000.
000
0.00
050
.000
150.
000
100.
000
Tota
l N
atio
nal S
olid
arity
Pro
gram
0.00
016
.707
25.8
2555
.403
78.7
8917
2.95
713
4.42
612
9.60
076
.380
0.00
00.
000
76.3
8056
0.48
748
4.10
7G
erm
any
EU
RP
rivat
e S
ecto
r Dev
elop
men
t0.
000
0.00
00.
000
0.00
03.
199
0.00
00.
000
0.00
00.
000
0.00
00.
000
0.00
03.
199
3.19
9To
tal
Pri
vate
Sec
tor
Dev
elop
men
t0.
000
0.00
00.
000
0.00
03.
199
0.00
00.
000
0.00
00.
000
0.00
00.
000
0.00
03.
199
3.19
9G
erm
any
EU
RP
ublic
Adm
in R
efor
m0.
000
0.00
00.
000
0.00
03.
199
0.00
00.
000
0.00
00.
000
0.00
00.
000
0.00
03.
199
3.19
9To
tal
Pub
lic A
dmin
Ref
orm
0.00
00.
000
0.00
00.
000
3.19
90.
000
0.00
00.
000
0.00
00.
000
0.00
00.
000
3.19
93.
199
Nor
way
NO
KR
ural
Wat
er S
uppl
y an
d S
anita
tion
0.00
00.
000
0.92
12.
326
0.00
00.
000
0.00
00.
000
0.00
00.
000
0.00
00.
000
3.24
83.
248
Uni
ted
Sta
tes
US
DR
ural
Wat
er S
uppl
y an
d S
anita
tion
0.00
00.
000
0.00
00.
000
0.00
00.
000
0.40
00.
000
0.00
00.
000
0.00
00.
000
0.40
00.
400
Tota
l R
ural
Wat
er S
uppl
y an
d S
anita
tion
0.00
00.
000
0.92
12.
326
0.00
00.
000
0.40
00.
000
0.00
00.
000
0.00
00.
000
3.64
83.
648
Nor
way
NO
KS
kills
Dev
elop
men
t Pro
gram
me
(NIM
A)
0.00
00.
000
0.00
00.
000
0.00
00.
000
2.79
725
.000
3.71
40.
000
0.00
03.
714
6.51
12.
797
Uni
ted
Sta
tes
US
DS
kills
Dev
elop
men
t Pro
gram
me
(NIM
A)
0.00
00.
000
0.00
00.
000
0.00
00.
000
3.00
00.
000
0.00
00.
000
0.00
00.
000
3.00
03.
000
Tota
l S
kills
Dev
elop
men
t Pro
gram
me
(NIM
A)
0.00
00.
000
0.00
00.
000
0.00
00.
000
5.79
725
.000
3.71
40.
000
0.00
03.
714
9.51
15.
797
Aus
tral
iaA
UD
Str
engt
heni
ng H
ealth
Act
iviti
es fo
r th
e R
ural
Poo
r(S
HA
RP
)0.
000
0.00
00.
000
0.00
00.
000
0.00
00.
000
2.50
01.
651
0.00
00.
000
1.65
11.
651
0.00
0To
tal
Str
engt
heni
ng H
ealth
Act
iviti
es fo
r th
e R
ural
Poo
r(S
0.00
00.
000
0.00
00.
000
0.00
00.
000
0.00
02.
500
1.65
10.
000
0.00
01.
651
1.65
10.
000
Rus
sian
Fed
erat
ioU
SD
Str
engt
heni
ng H
ighe
r E
duca
tion
Pro
ject
0.00
00.
000
0.00
00.
000
0.00
00.
000
1.00
01.
000
1.00
00.
000
0.00
01.
000
2.00
01.
000
Tota
l S
tren
gthe
ning
Hig
her
Edu
catio
n P
roje
ct0.
000
0.00
00.
000
0.00
00.
000
0.00
01.
000
1.00
01.
000
0.00
00.
000
1.00
02.
000
1.00
0U
nite
d S
tate
sU
SD
Tech
nica
l Ass
ista
nce
Feas
ibili
ty S
tudi
es0.
000
0.00
01.
500
0.00
00.
000
0.00
00.
000
0.00
00.
000
0.00
00.
000
0.00
01.
500
1.50
0To
tal T
echn
ical
Ass
ista
nce
Feas
ibili
ty S
tudi
es0.
000
0.00
01.
500
0.00
00.
000
0.00
00.
000
0.00
00.
000
0.00
00.
000
0.00
01.
500
1.50
0G
rand
Tot
al0.
000
21.4
1556
.565
110.
084
137.
516
275.
810
294.
725
240.
915
154.
437
0.00
00.
000
154.
437
1050
.553
896.
115
Tabl
e 2
- Exp
ress
ed D
onor
Pre
fere
nces
By
Pro
ject
s P
aid-
In, C
omm
itted
, Ple
dged
(U
S$
Mill
ion)
Mar
ch 2
0, 2
009
Ple
dged
Pai
d-in
SY
138
8S
Y 1
381-
88

AR
TF Q
uarte
rly R
epor
t (M
arch
20,
200
9)
75
As
of:
SY13
81-8
7C
omm
Dis
burs
edC
omm
Dis
burs
edC
omm
Dis
burs
edC
omm
Dis
burs
edC
omm
ited
Dis
burs
edC
omm
Dis
burs
edC
omm
Dis
burs
edSY
1381
-87
20-M
ar-0
9La
st M
onth
SY13
81SY
1381
SY13
82SY
1382
SY13
83SY
1383
SY13
84SY
1384
SY13
85SY
1385
SY13
86SY
1386
SY13
87SY
1387
Tota
lTo
tal
Dis
burs
edAv
aila
ble
Dis
b.Ye
ar E
ndYe
ar E
ndYe
ar E
ndYe
ar E
nd
Year
End
Ye
ar E
nd
Year
End
Ye
ar E
nd
Year
End
Year
End
Year
End
Year
End
Year
End
Year
End
Com
mite
dD
isbu
rsed
Rat
e(a
)(b
)(c
)(c
)(d
)(e
)(f)
(g)
(h)
(g) -
(h)
(h) /
(g)
TF0
5057
7 - R
ecur
rent
& C
apita
l Cos
ts C
ompo
nent
Wag
es40
.953
145.
769
179.
321
174.
213
216.
199
203.
000
281.
004
1240
.460
35.9
23 -
O
&M
13.6
5551
.164
55.2
7779
.035
84.0
1587
.549
29.0
5539
9.75
01.
888
-
Deb
t Ser
vice
, IM
F0.
767
0.00
00.
000
0.00
00.
000
0.00
00.
000
0.76
70.
000
-
Deb
t Ser
vice
, ID
A2.
770
3.87
00.
000
0.00
00.
000
0.00
00.
000
6.64
00.
000
-
Deb
t Ser
vice
, AD
B0.
000
0.55
70.
000
0.00
00.
000
0.00
00.
000
0.55
70.
000
-
Bulk
Con
tract
s1.
067
12.7
820.
557
0.00
00.
000
0.00
00.
000
14.4
050.
000
-
D
isbu
rsem
ents
(A)
59.2
1221
4.14
423
5.15
525
3.24
830
0.21
329
0.55
031
0.05
916
62.5
8037
.810
S
peci
al A
ccou
nt(O
peni
ng) B
alan
ce (B
)0.
000
51.5
0050
.603
50.0
0050
.000
50.0
0050
.000
50.0
00
Net
Dis
burs
emen
ts(In
cl. A
dvan
ces
& A
djus
tmen
ts)
(C)
155.
000
110.
712
195.
000
213.
246
258.
000
234.
553
280.
000
253.
248
299.
000
300.
213
286.
000
290.
550
316.
000
310.
059
1789
.000
1712
.580
37.8
1076
.420
96%
U
pdat
ed S
peci
al A
ccou
nt B
alan
ce *
51
.500
50.6
0350
.000
50.0
0050
.000
50.0
0050
.000
50.0
00
TF0
5057
8 - M
onito
ring
Age
nt [
2]2.
000
0.66
80.
777
1.40
72.
311
2.64
14.
640
2.15
87.
001
2.53
43.
500
4.79
83.
139
2.84
323
.367
17.0
490.
451
6.31
873
%
Clo
sed
Inve
stm
ent P
roje
cts [
3]TF
0508
55 -
UN
DP
Pol
ice
Pr. 1
& 2
4.83
64.
836
0.00
00.
000
0.00
00.
000
0.00
00.
000
0.00
00.
000
0.00
00.
000
0.00
00.
000
4.83
64.
836
0.00
00.
000
100%
TF05
2081
- M
icro
finan
ce fo
r Pov
erty
Red
uctio
n0.
000
0.00
01.
000
0.35
80.
000
0.33
50.
000
0.30
60.
000
0.00
00.
000
0.00
00.
000
0.00
01.
000
1.00
00.
000
0.00
010
0%TF
0523
66 -
UN
DP
Pol
ice
30.
000
0.00
016
.800
16.8
000.
000
0.00
00.
000
0.00
00.
000
0.00
00.
000
0.00
00.
000
0.00
016
.800
16.8
000.
000
0.00
010
0%TF
0524
75 -
Tele
com
& M
icro
wav
e Li
nk0.
000
0.00
03.
000
0.15
03.
130
1.02
90.
000
3.06
90.
000
1.52
2-0
.119
0.24
10.
000
0.00
06.
011
6.01
10.
000
0.00
010
0%TF
0524
82 -
Kabu
l Roa
ds a
nd D
rain
age
Syst
em0.
000
0.00
03.
000
0.00
00.
000
2.91
00.
000
0.00
0-0
.172
-0.1
13-0
.031
0.00
00.
000
0.00
02.
797
2.79
70.
000
0.00
010
0%TF
0527
35 -
Stre
ngth
enin
g Fi
nanc
ial C
apac
ity o
f the
Gov
ernm
ent
0.00
00.
000
5.10
02.
046
0.00
00.
255
0.00
01.
380
-1.0
410.
378
0.00
00.
000
0.00
00.
000
4.05
94.
059
0.00
00.
000
100%
TF05
3939
- N
atio
nal S
olid
arity
Pro
gram
0.00
00.
000
0.00
00.
000
27.0
0026
.618
71.9
0047
.582
58.5
0082
.038
12.2
9212
.454
0.00
00.
000
169.
692
168.
692
0.00
01.
000
99%
Subt
otal
Clo
sed
Inve
stm
ent P
roje
cts
[3]
4.83
64.
836
28.9
0019
.354
30.1
3031
.147
71.9
0052
.337
57.2
8783
.825
12.1
4212
.695
0.00
00.
000
205.
195
204.
195
0.00
01.
000
100%
Cur
rent
Inve
stm
ent P
roje
cts [
4]TF
0509
70 -
Tech
nica
l Ass
ista
nce
Feas
ibilit
y St
udie
s0.
000
0.00
08.
000
2.52
36.
000
3.88
14.
500
2.90
50.
000
3.28
10.
000
3.02
40.
000
1.28
718
.500
16.9
020.
110
1.59
891
%TF
0509
73 -
Nat
iona
l Em
erge
ncy
Empl
oym
ent P
rogr
am0.
000
0.00
016
.620
8.31
00.
000
8.31
020
.200
0.00
016
.000
20.2
000.
000
15.1
190.
000
0.88
152
.820
52.8
200.
000
0.00
010
0%TF
0524
52 -
Mic
rofin
ance
for P
over
ty R
educ
tion
0.00
00.
000
4.00
02.
202
12.0
0012
.635
38.3
0021
.207
32.0
0048
.477
33.0
0034
.219
64.0
0024
.141
183.
300
142.
882
0.87
340
.418
78%
TF05
2541
- Ka
bul P
ower
Sup
ply
0.00
00.
000
7.43
50.
000
0.00
02.
901
0.00
01.
508
0.00
01.
402
0.00
01.
029
0.00
00.
261
7.43
57.
101
0.26
10.
334
96%
TF05
3940
- C
ivil
Serv
ice
Cap
acity
Bui
ldin
g0.
000
0.00
00.
000
0.00
00.
000
0.00
08.
000
2.38
45.
000
4.24
30.
000
4.97
90.
000
1.08
113
.000
12.6
860.
000
0.31
498
%TF
0547
18 -
Reh
abili
tatio
n of
Nag
hlu
Hyd
ropo
wer
Pla
nt0.
000
0.00
00.
000
0.00
020
.000
0.00
00.
000
0.00
00.
000
0.16
00.
000
0.07
10.
000
6.05
120
.000
6.28
30.
000
13.7
1731
%TF
0547
29 -
Urb
an W
ater
Sup
ply
and
Sani
tatio
n0.
000
0.00
00.
000
0.00
020
.000
0.00
021
.000
3.62
80.
000
3.47
50.
000
11.5
060.
000
4.48
541
.000
23.0
951.
987
17.9
0556
%TF
0547
30 -
Educ
atio
n - E
QU
IP0.
000
0.00
00.
000
0.00
00.
000
0.00
05.
000
0.00
00.
000
0.49
027
.000
6.51
212
.000
29.5
4844
.000
36.5
505.
373
7.45
083
%TF
0554
47 -
Rur
al W
ater
Sup
ply
and
Sani
tatio
n0.
000
0.00
00.
000
0.00
00.
000
0.00
05.
000
0.00
00.
000
0.59
00.
000
0.63
32.
650
2.05
57.
650
3.27
80.
000
4.37
243
%TF
0900
77 -
Man
agem
ent C
apac
ity P
rogr
am0.
000
0.00
00.
000
0.00
00.
000
0.00
00.
000
0.00
00.
000
0.00
010
.000
0.00
00.
000
0.54
810
.000
0.54
80.
000
9.45
25%
TF09
0205
- N
atio
nal S
olid
arity
Pro
gram
0.00
00.
000
0.00
00.
000
0.00
00.
000
0.00
00.
000
0.00
00.
000
171.
500
136.
325
178.
000
162.
394
349.
500
298.
719
24.9
3450
.781
85%
TF09
1120
- Ka
bul-A
ybak
/Maz
ar-e
-Sha
rif P
ower
Pro
ject
0.00
00.
000
0.00
00.
000
0.00
00.
000
0.00
00.
000
0.00
00.
000
57.0
000.
000
0.00
014
.697
57.0
0014
.697
0.42
842
.303
26%
TF09
1885
- H
ortic
ultu
re a
nd L
ives
tock
Pro
gram
0.00
00.
000
0.00
00.
000
0.00
00.
000
0.00
00.
000
0.00
00.
000
0.00
00.
000
11.0
001.
566
11.0
001.
566
0.00
09.
434
14%
TF09
2073
- Ka
bul U
rban
Rec
onst
ruct
ion
Proj
ect
0.00
00.
000
0.00
00.
000
0.00
00.
000
0.00
00.
000
0.00
00.
000
0.00
00.
000
5.60
00.
000
5.60
00.
000
0.00
05.
600
0%TF
0921
60 -
Just
ice
Sec
tor R
efor
m P
roje
ct0.
000
0.00
00.
000
0.00
00.
000
0.00
00.
000
0.00
00.
000
0.00
00.
000
0.00
027
.750
0.40
027
.750
0.40
00.
000
27.3
501%
TF09
2544
- St
reng
then
ing
Hig
her E
duca
tion
Proj
ect
0.00
00.
000
0.00
00.
000
0.00
00.
000
0.00
00.
000
0.00
00.
000
0.00
00.
000
5.00
01.
000
5.00
01.
000
0.00
04.
000
20%
TF09
3632
- Ka
bul U
rban
Roa
ds Im
prov
emen
t Pro
ject
0.00
00.
000
0.00
00.
000
0.00
00.
000
0.00
00.
000
0.00
00.
000
0.00
00.
000
18.0
000.
000
18.0
000.
000
0.00
018
.000
0%Su
btot
al C
urre
nt In
vest
men
t Pro
ject
s [4
]0.
000
0.00
036
.055
13.0
3558
.000
27.7
2710
2.00
031
.632
53.0
0082
.320
298.
500
213.
418
324.
000
250.
395
871.
555
618.
526
33.9
6625
3.02
971
%
TO
TA
L C
OM
MIT
& D
ISB
. [1+
2+3+
4]16
1.83
611
6.21
726
0.73
224
7.04
234
8.44
129
6.06
745
8.54
033
9.37
541
6.28
846
8.89
260
0.14
252
1.46
164
3.13
956
3.29
728
89.1
1825
52.3
5072
.227
336.
767
88%
Not
e: *
Incl
udes
US
$50
mill
ion
Spe
cial
Acc
ount
adv
ance
plu
s ad
just
men
t for
any
tim
ing
diffe
renc
e.
(US$
mill
ion)
.
T
able
3 -
ARTF
Com
mitm
ents
& D
isbu
rsem
ents
Mar
ch 2
0, 2
009

AR
TF Q
uarte
rly R
epor
t (M
arch
20,
200
9)
76
US$
Mil.
R
epor
t Dat
e :
Mar
ch 2
0, 2
009
SY 1
381
SY 1
382
SY 1
383
SY 1
384
SY
138 5
SY
138
6SY
138
7SY
138
8To
tal
Tota
lTo
tal
Tota
lTo
tal
Tota
lTo
tal
Tota
lA
ctua
lA
ctu
alA
ctua
lA
ctua
lA
ctua
lA
ctua
lA
ctu
alFo
reca
st ², 3
SOU
RCES
OF
FUN
DS
(A+B
)A
. N
et D
onor
s C
ontr
ibut
ions
(A
1-A2
)18
4.24
028
4.38
237
8.77
440
4.09
445
9.99
665
4.24
663
2.80
446
1.79
0
A
.1.
Don
ors
Con
tribu
tions
18
4.76
828
6.46
138
0.36
840
4.05
045
3.92
163
4.80
362
6.81
645
1.79
0
A
.2.
IDA
fees
min
us In
vest
men
t Inc
ome
0.52
72.
079
1.59
4-0
.044
-6.0
76-1
9.44
3-5
.988
-10.
000
B.
Cas
h C
arri
ed-O
verr
(=D
pre
viou
s ye
ar)
119.
524
155.
966
238.
070
302.
789
293.
893
426.
679
496.
186
USES
OF
FUND
S (
C+D
)C
. D
isbu
rsem
ents
(C
1+C
2+C
3+C
4) ¹
64.7
1724
7.94
029
6.67
033
9.37
546
8.89
252
1.46
156
3.29
759
3.32
0
C
.1 R
ecur
rent
win
dow
- D
isbu
rsed
by
DA
B59
.212
214.
144
235.
155
253.
248
300.
213
290.
550
310.
059
290.
000
W
ages
40.9
5314
5.76
917
9.32
117
4.21
321
6.19
920
3.00
028
1.00
4
O&M
13.6
5551
.164
55.2
7779
.035
84.0
1587
.549
29.0
55
Oth
er4.
604
17.2
100.
557
0.00
00.
000
0.00
00.
000
C.2
. In
vest
men
t win
dow
15.5
8958
.873
83.9
6916
6.14
522
6.11
325
0.39
530
0.00
0
C
.3.
Pas
s-th
roug
h to
LO
TFA
(UN
DP
Pol
ice)
4.83
616
.800
0.00
00.
000
0.00
00.
000
0.00
00.
000
C.4
. F
ees
to m
onito
ring
agen
t0.
668
1.40
72.
641
2.15
82.
534
4.79
82.
843
3.32
0D
. C
ash
Bal
ance
(en
d-o
f-pe
riod
) (A
+B-C
=D1+
D2)
119.
524
155.
966
238.
070
302.
789
293.
893
426.
679
496.
186
364.
656
D.1
. C
omm
itted
Cas
h B
alan
ce:
97.1
2010
9.91
316
1.68
428
0.84
922
8.24
430
6.92
638
6.76
739
6.02
7
to re
curr
ent w
indo
w s
peci
al a
ccou
nt51
.500
50.6
0350
.000
50.0
0050
.000
50.0
0050
.000
50.0
00
to re
curr
ent w
indo
w T
rust
Fun
d44
.288
26.0
4249
.489
76.2
4275
.029
70.4
7976
.420
70.0
00
undi
sbur
sed
inve
stm
ent w
indo
w b
al
32.5
6661
.822
151.
753
95.8
9518
0.42
425
4.02
927
3.02
9
to M
onito
ring
Agen
t1.
332
0.70
20.
372
2.85
47.
321
6.02
36.
318
2.99
8
D
.2.
Una
lloca
ted
Cas
h B
alan
ce22
.404
46.0
5376
.386
21.9
4065
.649
119.
753
109.
418
-31.
372
(1) A
dvan
ce d
isbu
rsem
ents
rep
orte
d fo
llow
ing
stan
dard
Wor
ld B
ank
prac
tice.
(2) A
ssum
es a
ll ple
dge
s co
llect
ed,
and
estim
ates
of f
utur
e al
loca
tions
and
dis
burs
emen
ts a
re m
et.
(3) S
Y13
88 fo
reca
sted
bal
ance
(pr
evio
us b
alan
ce +
new
com
mitm
ents
- d
isbu
rsem
ents
) is
bas
ed o
n pr
ojec
ted
cont
ribut
ions
, com
mitm
ents
and
dis
burs
emen
ts.
(4) U
nallo
cate
d ca
sh b
alan
ce re
fers
to f
unds
in th
e AR
TF p
aren
t acc
ount
that
the
MC
has
not
form
ally
com
mitt
ed. D
urin
g th
e S
olar
Yea
r the
y w
ill b
e co
mm
itted
in li
ne
with
prio
ritie
s fo
r A
RTF
fund
s as
set
out
in th
e A
fgha
n N
atio
nal d
evel
opm
ent b
udge
t.
Tabl
e 4
- AR
TF C
onso
lidat
ed S
ourc
es &
Use
s of
Fun
ds