Embed Size (px)
Citation preview
Page 1/21
Tolerance at the genetic level of the brine shrimpArtemia salina to a wide range of salinityJunMo Lee
Kyungpook National UniversityJong Soo Park ( [email protected] )
Kyungpook National University https://orcid.org/0000-0001-6253-5199
Research
Keywords: Artemia salina, crustacean, differential expressed genes, euryhaline, halotolerant,transcriptome, osmoregulation
Posted Date: October 13th, 2020
DOI: https://doi.org/10.21203/rs.3.rs-91049/v1
License: This work is licensed under a Creative Commons Attribution 4.0 International License. Read Full License
Page 2/21
AbstractBackground: The brine shrimp Artemia salina can thrive in a variety of salinities and is commonlydistributed in natural hypersaline lakes and solar salterns. The zooplankter A. salina proves to be a �lterfeeder, consuming the alga Dunaliella and prokaryotes and plays a critical role in the hypersaline foodweb. However, the high salinity adaptation mechanisms of A. salina remain poorly understood throughtranscriptome analysis. Here, we examined the gene expression patterns of A. salina adults that were salt-adapted for 2–4 weeks at �ve salinities (35, 50, 100, 150, and 230 psu), and generated long-read isoformsequencing (IsoSeq) data to construct a high-quality transcriptome assembly of A. salina. The patterns ofA. salina along the salinity gradient provide evidence for halotolerant and euryhaline adaptations at thegenetic level.
Results: We con�rmed that the activity of sodium/potassium ATPase was up-regulated at the geneticlevel in high salinity waters. Interestingly, genes related to beta-mannosidase and mannose activities werealso up-regulated, suggesting that mannose and mannose derivatives may be accumulated as organicosmolytes. Alternatively, considering that glucose and galactose-related activities were suppressed athigh salinities, mannose may be the primary sugar involved in the glycolytic pathway under suchconditions. This result further supports the theory that mannose is the main energy source used by A.salina in highly saline environments. The gene expression patterns of A. salina may also be affected byincreased thickness of the cuticle, increased numbers of mitochondria, and low dissolved oxygen in highsalinity waters. Furthermore, the cellular response of A. salina to acclimation to intermediate salinitiesdepends on the number and type of genes expressed; differential expression patterns are likely to�uctuate at the population level.
Conclusions: Our results provide a high-quality transcriptome assembly of the cosmopolitan brine shrimpArtemia salina at �ve different salinities (35, 50, 100, 150, and 230 psu) for the �rst time. The geneexpression patterns of salt-adapted A. salina display greater osmoregulation process complexity than wethought. Furthermore, A. salina represents a potential model organism to study locally adaptedpopulations at various salinities.
BackgroundHypersaline environments have existed on Earth since before the Cambrian period, providingextraordinary habitats for all domains of life [1]. Prokaryotes are the most abundant life forms in extremesaline environments, whereas eukaryotes rarely inhabit them [2–4]. Previously, a simpli�ed grazing foodchain was proposed for hypersaline environments [3]: phytoplankton (Dunaliella) → zooplankton(Artemia). More recently, however, several halotolerant and halophilic protozoa have been reported or re-described in these environments, revealing a more complex food chain than previously understood [4–16]. Regardless of those reports, the zooplankter Artemia salina is undoubtedly a predominant part of thefood chain in high salinity waters that transfers energy to higher trophic levels (e.g., birds) aroundhypersaline environments worldwide [3, 17].
Page 3/21
The brine shrimp A. salina (Branchiopoda; Pancrustacea; Crustacea) is often observed in naturalhypersaline lakes (e.g., the Great Salt Lake) as well as in arti�cial solar salterns [18, 19]. This zooplanktercan survive in saline waters ranging from 5 psu (practical salinity unit) to > 300 psu, demonstrating that itis a halotolerant and euryhaline species [20–22]. A. salina is a �lter feeder, consuming phytoplankton(e.g., Dunaliella) and prokaryotes in these high salinity waters. Thus, this extremophile species must be astrict osmoregulator, as it regularly ingests high salinity water along with prey [23–26]. Several studiesreport that an increase in salinity stimulates Na+ /K+-ATPase activity in multiple organs (e.g.,metepipodites, maxillary glands, and gut) of adult A. salina for the excretion of accumulated salts [23–26]. In addition, the hemolymph of A. salina is maintained at a constant ~ 300 mOsm/kg (9 psu salinity),which is similar to the osmolality of teleost �shes, when exposed to a range of external high salinities [25,27]. However, the differential gene expression patterns in adult A. salina along salinity gradients have notbeen investigated [22]. Moreover, other adaptive osmoregulatory mechanisms of A. salina to differingsalinity ranges remain poorly understood.
Here, we generated a de novo transcriptome assembly of adult A. salina using a hybrid assemblyapproach, with long-read isoform sequencing and high-throughput RNA sequencing data, to analyze thedifferential gene expression patterns in a variety of salinities (i.e., 35, 50, 100, 150, and 230 psu). In thepresent study, A. salina signi�cantly up-regulated genes (e.g., Na+/K+-ATPase gene) related toosmoregulation with increasing salinity from 35 psu to 230 psu. In addition, we note that low oxygenconcentration and thickness of A. salina’s body surface may greatly affect its metabolic processes athigh salinities.
MethodsSample preparation, isoform, and RNA sequencing of Artemia salina
Artemia salina was isolated from 140 psu saline water collected from a solar saltern in Uiseong(36°60′20.86″N, 126°29′71.16″E), Republic of Korea, in April 2018 (Fig. 1; an additional movie �le showsthis in more detail [see Additional File 1]). A population of male and female A. salina in a 20-L aquarium,also containing sediment from the saltern and 15 L arti�cial saline water made by dilution of Medium V(300 psu) [28], was maintained at 150 psu. Approximately 20 adults with a half-and-half sex ratio weretransferred and maintained in arti�cial saline water at 35, 50, 100, 150, and 230 psu for 2–4 weeks. Afterthis time, we collected 10 adults (�ve males and �ve females) from each salinity medium to performtranscriptome-level analyses of isoforms. Total RNA was extracted from A. salina using the RNeasy PlusMini Kit (Qiagen, Hilden, Germany). The RNA sequencing libraries were constructed using the IlluminaTruseq Standard mRNA Prep Kit (Illumina Inc., San Diego, CA, USA), and the qualities of the libraries werechecked using a 2100 Bioanalyzer (Agilent Technologies, Santa Clara, CA, USA). The RNA sequencinglibraries were sequenced using 100-bp paired-end reagents with an Illumina Novaseq6000 (Table S1 inAdditional File 2). The isoform sequencing (IsoSeq) library was constructed using a SMARTer PCR cDNASynthesis Kit and DNA Template Prep Kit 1.0; the IsoSeq data were generated (1.0 Gbp; 780,667 reads)using the PacBio Sequel platform (Paci�c Biosciences, Menlo Park, CA, USA). The high-quality (HQ)
Page 4/21
isoform consensus (16.6 Mbp; 16,555 reads) of the IsoSeq data was constructed using a SMRT Link5.1.0 with the Iso-Seq2 application platform. Raw reads of RNA sequencing and high-quality Isoformconsensus data were uploaded to the NCBI SRA (Sequence Read Archive) database with accessionnumbers (SRR12358297 – SRR12358302; BioProject PRJNA649341).
De novo transcriptome assembly, protein predictions, and functional annotations
To construct high-quality isoform sequences, we generated a hybrid de novo transcriptome assembly ofArtemia salina using a long-read HQ isoform consensus (16.6 Mbp; 16,555 reads; PacBio Sequel) andhigh-throughput RNA sequencing (a total of 34.6 Gbp; 100 × 100 bp Illumina Novaseq6000 reads). Toimprove sequence accuracy, the error correction step of the IsoSeq consensus was performed using thehigh-accuracy Illumina sequencing reads, which were aligned by Bowtie2, and variant calling in thealignment was processed using the Samtools program (Figure S1 in Additional File 3) [29, 30]. Thecorrected IsoSeq reads were assembled with the short-read Illumina sequencing data using the Trinityassembler (v2.8.4; default option of de novo transcriptome assembly with ‘--long_reads’) [31, 32]. Toreduce redundancy, the assembled transcripts were clustered using the cd-hit-EST program (v4.6; -c 0.95 -aS 0.95 -n 10; https://github.com/weizhongli/cdhit). The RNA-seq raw reads were mapped into theassembled transcripts using the Salmon program (default options) [33], and the potential false-positivetranscripts including zero-tpm (transcripts per million) values were excluded. Potential ribosomal RNAfragments in the assembled transcripts were excluded based on the results of a local BLASTn search (e-value cutoff = 1.e-10) using Artemia salina ribosomal RNA sequences (X01723.1 and AF169697.1).
All possible open reading frames (ORFs) in the assembled transcriptome data were predicted by a 6-frame translation by Python (minimum length of protein-coding sequences = 150 bp), so that all threeforward and reverse transcript frames were translated with the standard code (NCBI genetic code table 1).From the predicted ORFs, only homologous pancrustacean proteins were selected for downstreamanalysis, based on the results of a local BLASTp search (e-value cutoff = 1.e-05). The reference proteindatabase for the BLASTp search was constructed from pancrustacean species as follows: Armadillidiumnasatum (NCBI, SEYY00000000.1), Artemia franciscana (https://antagen.kopri.re.kr/), Catajapyxaquilonaris (BCM-HGSC; https://i5k.nal.usda.gov), Daphnia magna (NCBI, QYSF00000000.1), Daphniapulex (NCBI, FLTH00000000.2), Eulimnadia texana (NCBI, NKDA00000000.1), Eurytemora a�nis (NCBI,AZAI00000000.2), Folsomia candida (NCBI, LNIX00000000.1), Lepidurus arcticus (NCBI,RJJB00000000.1), Lepidurus apus lubbocki (RJJA00000000.1), Orchesella cincta (NCBI,LJIJ00000000.1), Penaeus vannamei (NCBI, NIUR000000000.1), Tigriopus californicus (NCBI,VCGU00000000.1), Tribolium castaneum (NCBI, AAJJ00000000.2), and Zootermopsis nevadensis (NCBI,AUST00000000.1) [34–45]. The predicted proteins and their coding sequences are available in AdditionalFile 4. Functional annotations of the predicted proteins from the assembled transcriptome of A. salinawere carried out using eggNOG-mapper [46] and KEGG blast (http://www.genome.jp/tools/blast/).
Analyses of conserved eukaryotic gene sets and phylogeny
Page 5/21
Conserved eukaryotic gene set completeness analyses were conducted using BUSCO (BenchmarkingUniversal Single-Copy Orthologs; v3.0.2) [47, 48]. Sixteen taxa from Pancrustacea, including A. salina,were used to reconstruct the molecular phylogenetic tree. The phylogenetic position of A. salina wasinferred using 5,604 concatenated protein sequences, which were related to Pancrustacea (local BLASTpe-value cutoff = 1.e-05). All protein sequences were aligned using MAFFT v7.313 (default options: --auto)[49]. Each alignment was trimmed when an aligned locus included more than 70% gap sequences. Thephylogenetic analysis was inferred using maximum likelihood (ML) analysis. The ML tree was estimatedusing IQ-tree v.1.6.12 [50] with the best-�t evolutionary model, and statistical support was estimatedusing bootstrapping with 1,000 replicates.
Differentially expressed gene analysis of Artemia salina
Mapping of RNA-seq raw reads was performed using Salmon (default option) [33] for differentiallyexpressed gene (DEG) analyses of A. salina at 35, 50, 100, 150, and 230 psu. The tpm (transcripts permillion) values were normalized by the z-score [(’Expression’ - ‘Average expression of all conditions ineach gene’) / ‘Standard deviation of all conditions in each gene’]. Based on the z-score dynamics of eachgene candidate, we analyzed up- and down-regulated gene expression patterns using customized Pythonscripts, and sorted the genes by salinity-dependent gene expression patterns including only those withfollowing criteria: maximum fold-change ≥ 2-fold between the highest and the lowest tpm value, and thelowest tpm ≥ 5 in a target gene. Gene ontology (GO) terms were extracted from the functionalannotations of the target genes described by the eggNOG-mapper results, and the enrichment of GOterms was performed using the topGO package in R (Fisher test, p-value < 0.05).
ResultsDe novo transcriptome assembly and phylogenomic analysis
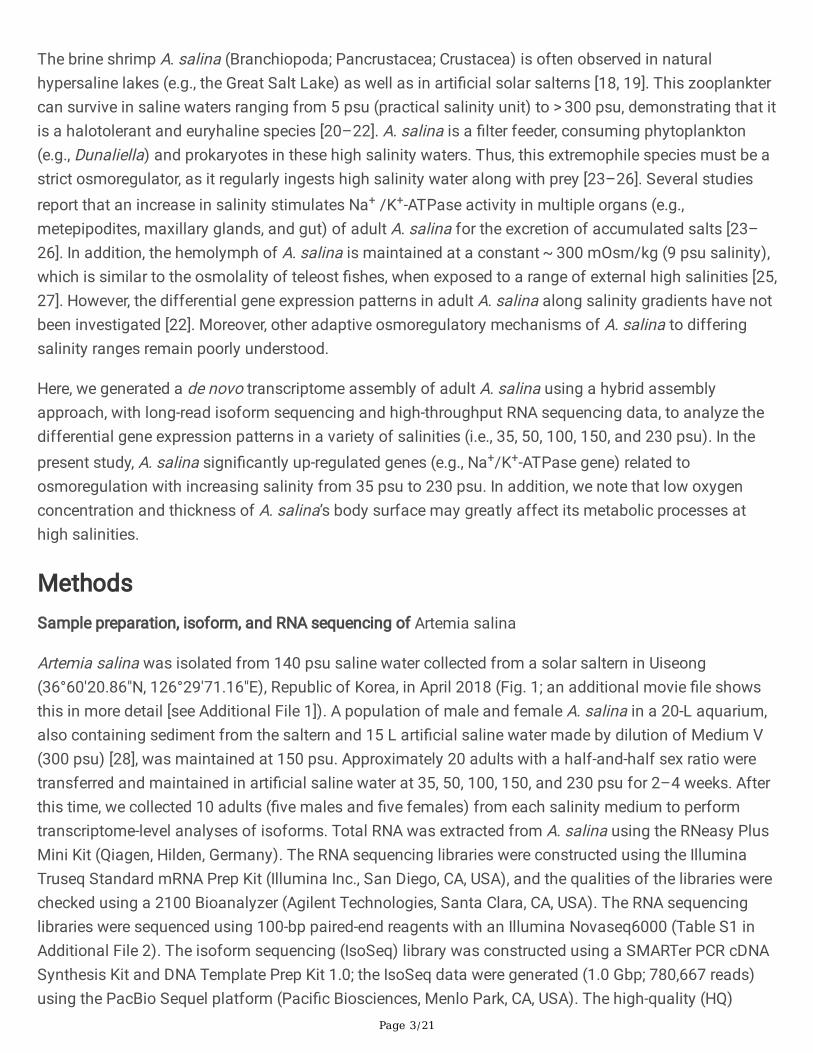
A total of 18,301 protein-coding sequences from Artemia salina were obtained through �ltration of theassembled transcripts (i.e., removing too-short, redundant, and false-positive transcripts). Reference datawere used for the homologous pancrustacean sequences (Figure S1 in Additional File 3; see above).Based on the BUSCO analysis, the protein pro�les of A. salina included 92.3% conserved eukaryotic genesets, a reliability quality comparable to those of other crustaceans (85–94% of BUSCOs; Table S2 inAdditional File 2). The class Branchiopoda, which includes A. salina, formed a robust clade, and A. salinawas closest to A. franciscana with maximal bootstrap support (ML: 100%; Fig. 2). Branchiopoda was thesister group to the class Hexapoda (ML: 100%), which also formed a monophyletic group (Fig. 2).
Differentially expressed gene patterns along the salinitygradientDue to the wide salinity tolerance range of A. salina, we evaluated variations in the gene expressionpatterns of salt-adapted cells along a salinity gradient (35 psu to 230 psu) based on z-scores using
Page 6/21
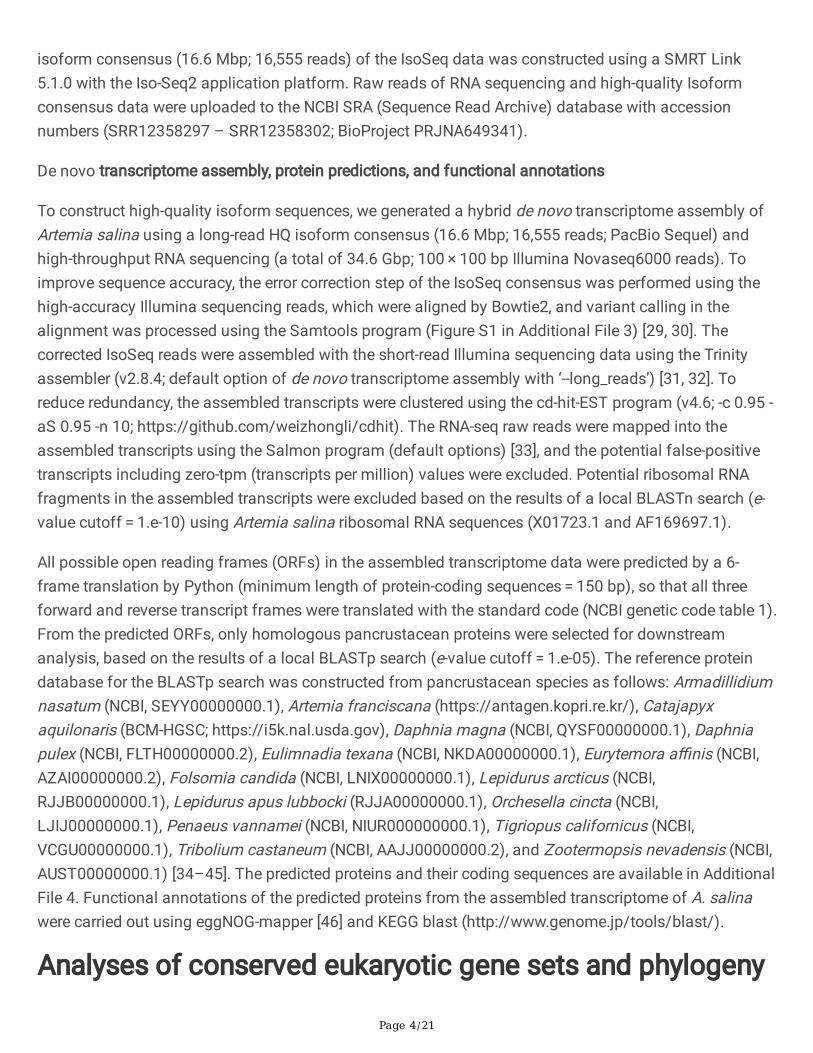
custom Python scripts (Python v2.7.16; Fig. 3). The enriched GO terms of the salinity-dependent genes(topGO package in R, Fisher test, p-value < 0.05) revealed that A. salina signi�cantly up-regulated genesrelated to Na+/K+-ATPases, mannose and carotenoid metabolism, and monocarboxylate transmembranetransporters with an increase in salinity from 35 psu to 230 psu (Fig. 3; Table S3 and S4 in Additional File2; Figure S2 in Additional File 3). Conversely, A. salina signi�cantly down-regulated genes associated withgalactose, and glucose metabolism, N-acetylgalactosamine-4-sulfatases, amino acid symporters, andamino acid transmembrane transporters in a salinity-dependent trend (Fig. 3; Table S3, and S4 inAdditional File 2; Figure S2 in Additional File 3). Interestingly, the frequency of acidic, basic, hydrophilic,and hydrophobic amino acids in A. salina was identical to that of other pancrustacean species (Table S5in Additional File 2). This result suggests that the osmoregulation system of the extremely euryhaline A.salina may operate by excreting excess salts instead of involving conformational changes to theproteomes within the animal’s cells.
In addition to the those involving osmoregulatory processes of A. salina (e.g., Na+/K+-ATPase), transcriptsrelated to the visual cycle and mitochondrial morphogenesis were also up-regulated in hypertonic waters(Fig. 3; Table S4 in Additional File 2). Furthermore, genes involved in oxidative stress regulation andglycoprotein catabolic processes were up-regulated at high salinities (Fig. 3; Table S4 in Additional File 2).In contrast, the transcript encoding N-acetylgalactosamine-4-sulfatase, which hydrolyzes sulfates, wasdown-regulated in high salinity waters (Fig. 3; Table S4 in Additional File 2). Furthermore, A. salinanoticeably down-regulated genes related to diverse transporter activities in response to high salinity(Fig. 3; Table S4 in Additional File 2). This indicates that the transporter systems in adult A. salina may berepressed in highly saline environments.
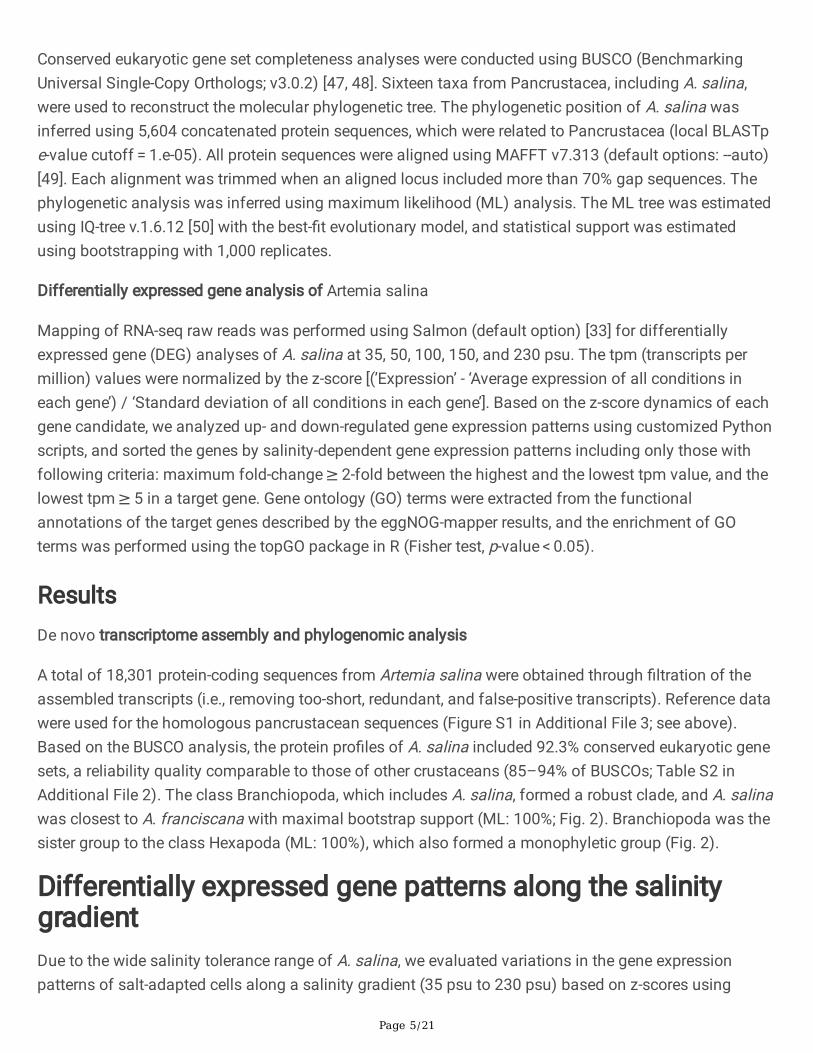
U-shaped or inverted U-shaped expression patternsArtemia spp. grow best in a salinity range of 100–150 psu and can tolerate < 5 psu or > 300 psu [20–22,51, 52]. Therefore, some genes may be expressed in a quadratic pro�le, such as a U-shaped (i.e., up-regulated at the two salinity extremes) or inverted U-shaped (i.e., down-regulated at the two salinityextremes) curve. A total of 326 A. salina genes were expressed in U-shaped curves with the lowest pointat 50 psu; 222 and 411 genes were expressed in U-shaped curves with the lowest points at 100 and 150psu, respectively (Fig. 4; Table S6 in Additional File 2). Furthermore, inverted U-shaped expressionpatterns were observed in 379 genes with the highest point at 50 psu; 289 and 63 genes were detectedwith the highest points at 100 and 150 psu, respectively (Fig. 4; Table S6 in Additional File 2).
Several studies report that selected Artemia genes were up-regulated or down-regulated in response tohigh salinity [22, 53–58]. Among the previously identi�ed genes, transcripts related to chloride channelprotein, ecdysone receptor isoform A, fatty acid hydroxylase domain-containing protein 2, pancreatictriacylglycerol lipase, sphingomyelin phosphodiesterase, tribbles homolog 2, and putative inorganicphosphate cotransporter displayed U-shaped patterns along salinity gradients (Fig. 5; Table S7 inAdditional File 2). Moreover, genes related to the small heat shock protein ArHsp22, CCAA/enhancer-binding protein, epithelial discoidin domain-containing receptor, PAS domain-containing serine/threonine-

Page 7/21
protein kinase, copper-zinc superoxide dismutase, and putative inorganic phosphate cotransporterdisplayed an inverted U-shaped expression pattern along salinity gradients (Fig. 5; Table S7 in AdditionalFile 2). The gene encoding group 3 late embryogenesis abundant protein, which is down-regulated at highsalinities, also showed a U-shaped pattern (Fig. 5; Table S7 in Additional File 2).
DiscussionHalophilic and halotolerant organisms are capable of adapting to high salinity waters and maintainingtheir internal osmotic balance in order to thrive in harsh environments. In general, the salt-in and salt-outprocesses are regarded as two distinct osmoregulation strategies. Salt-in organisms typically utilizepotassium as the main intracellular cation in high salinity waters, while salt-out organisms accumulateorganic solutes (e.g., betaines, glycerol, ectoine, sucrose, and mannitol) as the main osmolytes [17, 59]. Inaddition, salt-in organisms characteristically contain acidic proteins with a negative charge, which are notobserved in the salt-out organisms, to avoid protein aggregation [17, 60]. In the present study, Artemia(class Branchiopoda) may be considered a salt-in organism due to increased Na+/K+-ATPase activity inhigh salinity water (230 psu). However, the notable absence of acidic protein pro�les in the brine shrimpArtemia was identical to other crustaceans in seawater. Thus, our transcriptomic analysis con�rms thatA. salina is a strict hyporegulator [24–26, 61].
In crustaceans, the enzyme Na+/K+-ATPase serves to maintain sodium and potassium ion homeostasisacross cell membranes [62–65]. Several studies have used the silver staining method to demonstrate thatthe metepipodites, digestive gut, and maxillary glands in A. salina exhibit high Na+/K+-ATPase activityunder highly saline conditions [24, 26, 61]. This con�rms that the enzyme Na+/K+-ATPase plays anessential role in A. salina osmoregulation at the genetic level. Interestingly, genes related to beta-mannosidase and other enzymes involved with mannose metabolism were up-regulated in high salinitymedia. This result implies that A. salina may accumulate mannose or mannose derivatives as organicosmolytes. Mannose and mannitol are widely recognized as organic osmolytes in diatoms, brown algae,green algae, and terrestrial plants [66, 67]. However, most marine animals accumulate betaine, taurine,trimethylamine oxide, glycine, alanine, proline, homarine, or arginine as organic osmolytes [68]. Thus, theaccumulation of mannose and mannose derivatives at high salinities in A. salina is particularlyinteresting. Alternatively, considering that glucose and galactose-related activities were suppressed athigh salinities, mannose may be the primary sugar involved in the glycolytic pathway under suchconditions. Furthermore, A. salina down-regulated UDP-glucose:hexose-1-phosphate uridylyltransferase(synonym: galactose-l-phosphate uridylyltransferase), which converts galactose-1-phosphate intoglucose-1-phosphate, at high salinities. This result further supports the theory that mannose is the mainenergy source used by A. salina in highly saline environments. Bunn & Higgins [69] reported thatorganisms that accumulate high concentrations of aldohexoses with unstable ring structures (i.e.,mannose and galactose) may experience enzymatic malfunctions as a result of covalent modi�cationsto individual proteins. Therefore, the covalent modi�cation of A. salina proteins may also be detected inhigh salinity waters. Furthermore, Horst [70] noted that mannose and mannose derivatives in A. salina are
Page 8/21
substantially involved in glycoprotein catabolic processes, suggesting that exposure to increased salinitymay result in an increased activity of mannose-related processes. Investigation of the primary role ofmannose and mannose derivatives in A. salina under various salinities is warranted.
While Artemia can maintain ion homeostasis in its cells as the external salinity increases, more energy isrequired for growth and reproduction [71]. Theoretically, the dissolved oxygen (DO) concentration in 35psu media at 25 °C is 3.2 times lower than that in 220 psu media [72]. In this study, we present severalpieces of evidence that suggest that low oxygen may substantially impact the growth and reproductionof A. salina when salinity increases from 35 psu to 230 psu. Additionally, marine invertebrate vision isone of the most energetically demanding functions and is highly susceptible to dissolved oxygen�uctuations [73]. In high-salinity waters, transcripts related to retinal metabolic processes weresigni�cantly up-regulated; A. salina signi�cantly up-regulated ninaB homologous genes in high-salinitymedia. Many diverse metazoan species contain ninaB homolog genes (Figure S3 in Additional File 3),which are associated with the synthesis of visual pigment and oxidative stress [74–76]. Moreover, the up-regulation of genes related to oxidative stress suggests that A. salina can adapt to waters simultaneouslyhigh in salinity and low in oxygen. The activity of N-acetylgalactosamine-4-sulfatase, which was one ofthe down-regulated genes in A. salina, can decline when exposed to low oxygen [77]. Therefore, it is likelythat the gene expression patterns of A. salina are greatly affected by low dissolved oxygen levels in itsmedia.
Few mitochondria and a thin body surface cuticle are characteristic of Artemia in low salinity waters,whereas many mitochondria and a thick cuticle have been observed in high salinity waters [23, 27, 54]. Inthis study, transcripts related to mitochondrion morphogenesis and glycoprotein catabolic processeswere up-regulated at high salinities, which is consistent with previous investigations. It is reasonable toinfer that the rate of mitochondrion morphogenesis is inversely related to the dissolved oxygenconcentration in saline waters. Meanwhile, the increased thickness of the A. salina cuticle associatedwith glycoprotein catabolic processes lowers the water permeability of the body surface, resulting in arelatively low rate of oxygen diffusion [23, 54]. Thus, A. salina may require more mitochondria in highsalinity than low salinity environments. Most sugar (i.e., glucose and galactose) transport systems, aswell as those for nucleotides and amino acids, were repressed in A. salina at high salinities. These resultsimply that Artemia may be unable to properly use these essential macromolecules for growth andreproduction under highly saline conditions. Even though Artemia spp. are extremely halotolerant andeuryhaline, signi�cant energy expenditures are likely required to accommodate these adaptations.However, the increased thickness of A. salina body surface layers at high salinities indicates that thereduction in permeability to water, oxygen, and essential nutrients occurs passively. Moreover, severalstudies have reported decreased protein, carbohydrate, and glycogen contents in some crustaceanspecies with increasing salinity [78–80].
The cellular response of A. salina required for acclimation to intermediate salinities depends on thenumber and type of genes expressed. A U-shaped gene expression pattern observed along the salinitygradient in A. salina implies that it can adapt well to intermediate salinities [81, 82], whereas an inverted

Page 9/21
U-shaped pattern indicates the presence of salinity response at intermediate salinities [83]. At 150 psu,411 genes were expressed at low points in U-shaped patterns and only 63 genes were expressed at highpoints in inverted U-shaped patterns, implying that A. salina is well-adapted to 150 psu; most genes wereactively expressed to tolerate this salinity. Furthermore, the U-shaped expression patterns observed in A.salina represent cellular responses related to cellular signaling, catabolic processes, morphogenesis, anddevelopment. Meanwhile, the inverted U-shaped expression patterns were related to diverseenvironmental response factors (e.g., salt aversion, sensory perception of salty taste, cellular response tolight intensity, UV-B, ozone, response to oxidative stress, and starvation). Based on enriched GO terms andKEGG metabolic pathways, the functional annotations of the U-shaped expression pattern genes wereusually different from those of the inverted U-shaped expression pattern genes (Fig. 4; Table S6 inAdditional File 2; Figure S4 in Additional File 3). This result indicates that the genes related to U-shapedand inverted U-shaped patterns are unequally expressed, and the expression pattern observed at aspeci�c salinity is related to the physiological characteristics of A. salina.
Within the genus Artemia, the gene expression patterns we observed with increasing salinity were notalways consistent with previously identi�ed patterns (Fig. 5; Table S7 in Additional File 2). Intriguingly, thetypes of genes displaying U-shaped and inverted U-shaped expression patterns were usuallydifferentiated at each intermediate salinity (i.e., 50, 100, and 150 psu). These results demonstrate that A.salina could be a potential model organism to study locally adapted populations called ‘local adaptation’[19, 84, 85], and differential expression patterns of Artemia are likely to �uctuate at the population level.Campillo et al. [85] reported that rotifer populations (Brachionus plicatilis) might present different cellularresponses depending on the salinity of their medium. Thus, the gene expression of A. salina could also�uctuate depending on the occurrence of ecological specialization in each population at speci�csalinities. Further study is needed to con�rm that A. salina can provide a model for local adaptation.
ConclusionsThe gene expression patterns of salt-adapted A. salina at �ve different salinities (35, 50, 100, 150, and230 psu) displayed greater osmoregulation process complexity than previously thought. A. salina alongthe salinity gradient could differentially express the genes related to the environmental variables (e.g.,high salinity and low oxygen) and morphological transformations (e.g., the thickness of the cuticle andthe numbers of mitochondria). Moreover, the types of genes displaying U-shaped and inverted U-shapedexpression patterns suggested that A. salina appeared to have substantially differential adaptiveosmoregulatory mechanisms to intermediate salinities.
AbbreviationsIsoSeqIsoform sequencing; HQ isoform:High-quality isoform; SRA database:Sequence read archive database;ORFs:Open reading frames; BUSCO:Benchmarking universal single-copy orthologs; ML:Maximumlikelihood; DEG:Differentially expressed gene; GO:Gene ontology; DO:Dissolved oxygen
Page 10/21
Declarations
Ethics approval and consent to participateNot applicable.
Consent for publication
Not applicable.
Competing interests
The authors declare that they have no competing interests.
FundingThis study was supported by the National Research Foundation of Korea (NRF) grant, funded by theKorea government to JSP (NRF-2019R1A2C2002379), and JML (NRF-2020R1C1C1010193).
Authors’ contributionsJSP designed and supervised the transcriptome sequencing project. JML led the transcriptome analysisincluding transcriptome assembly, phylogenetic analysis, and differentially expressed gene analysis. JMLand JSP led the writing of the manuscript. All authors contributed critically to the drafts and gave �nalapproval for publication.
AcknowledgementsWe thank Dr. Aaron Heiss at American Museum of Natural History for the valuable comments on themanuscript.
References1. Javor B. Geology and Chemistry. In: Brock TD, editor. Hypersaline Environments: microbiology and
biogeochemistry. Heidelberg: Springer-Verlag; 1989. pp. 5–25.
2. Antón J, Rosselló-Mora R, Rodríguez-Valera F, Amann R. Extremely halophilic bacteria in crystallizerponds from solar salterns. Appl Environ Microbiol. 2000;66:3052–7.
3. Pedrós-Alió C, Calderón-Paz JI, MacLean MH, Medina G, Marrasé C, Gasol JM, et al. The microbialfood web along salinity gradients. FEMS Microbiol Ecol. 2000;32:143–55.
Page 11/21
4. Park JS, Choi DH, Hwang CY, Park GJ, Cho BC. Seasonal study on ectoenzyme activities,carbohydrate concentrations, prokaryotic abundance and production in a solar saltern in Korea.Aquat Microb Ecol. 2006;43:153–63.
5. Park JS, Kim H, Choi DH, Cho BC. Active �agellates grazing on prokaryotes in high salinity waters ofa solar saltern. Aquat Microb Ecol. 2003;33:173–9.
�. Park JS, Cho BC, Simpson AGB. Halocafeteria seosinensis gen. et sp. nov. (Bicosoecida), a halophilicbacterivorous nano�agellate isolated from a solar saltern. Extremophiles. 2006;10:493–504.
7. Park JS, Simpson AGB, Lee WJ, Cho BC. Ultrastructure and phylogenetic placement withinHeterolobosea of the previously unclassi�ed, extremely halophilic heterotrophic �agellatePleurostomum �abellatum (Ruinen 1938). Protist. 2007;158:397–413.
�. Park JS, Simpson AGB, Brown S, Cho BC. Ultrastructure and molecular phylogeny of twoheterolobosean amoebae, Euplaesiobystra hypersalinica gen. et sp. nov. and Tulamoebaperonaphora gen. et sp. nov., isolated from an extremely hypersaline habitat. Protist. 2009;160:265–83.
9. Cho BC, Park JS, Xu K, Choi JK. Morphology and molecular phylogeny of Trimyema koreanum n. sp.,a ciliate from the hypersaline water of a solar saltern. J Eukaryot Microbiol. 2008;55:417–26.
10. Park JS, Simpson AGB. Characterization of Pharyngomonas kirbyi (= “Macropharyngomonashalophila” nomen nudum), a very deep-branching, obligately halophilic heterolobosean �agellate.Protist. 2011;162:691–709.
11. Park JS, De Jonckheere JF, Simpson AGB. Characterization of Selenaion koniopes n. gen., n. sp., anamoeba that represents a new major lineage within Heterolobosea, isolated from the Wieliczka saltmine. J Eukaryot Microbiol. 2012;59:601–13.
12. Harding T, Brown MW, Plotnikov A, Selivanova E, Park JS, Gunderson JH, et al. Amoeba stages in thedeepest branching heteroloboseans, including Pharyngomonas: evolutionary and systematicimplications. Protist. 2013;164:272–86.
13. Foissner W, Jung JH, Filker S, Rudolph J, Stoeck T. Morphology, ontogenesis and molecularphylogeny of Platynematum salinarum nov. spec., a new scuticociliate (Ciliophora, Scuticociliatia)from a solar saltern. Eur J Protistol. 2014;50:174–84.
14. Kirby WA, Tikhonenkov DV, Mylnikov AP, Janouškovec J, Lax G, Simpson AGB. Characterization ofTulamoeba bucina n. sp., an extremely halotolerant amoebo�agellate heterolobosean belonging tothe Tulamoeba-Pleurostomum clade (Tulamoebidae n. fam.). J Eukaryot Microbiol. 2015;62:227–38.
15. Jhin SH, Park JS. A new halophilic heterolobosean �agellate, Aurem hypersalina gen. n. et sp. n.,closely related to the Pleurostomum-Tulamoeba clade: implications for adaptive radiation ofhalophilic eukaryotes. J Eukaryot Microbiol. 2019;66:221–31.
1�. Tikonenkov DV, Jhin SH, Eglit Y, Miller K, Plotnikov A, Simpson AGB, et al. Ecological and evolutionarypatterns in the enigmatic protist genus Percolomonas (Heterolobosea; Discoba) from diversehabitats. PLoS One. 2019;14:e0216188.

Page 12/21
17. Oren A. Organic Compatible Soultes. In: Seckbach J, editor. Halophilic microorganisms and theirenvironments. Dordrecht: Springer; 2002. pp. 279–305.
1�. Triantaphyllidis GV, Abatzopoulos TJ, Sorgeloos P. Review of the biogeography of the genus Artemia(Crustacea, Anostraca). J Biogeogr. 1998;25:213–26.
19. Gajardo GM, Beardmore JA. The brine shrimp Artemia: adapted to critical life conditions. FrontPhysiol. 2012;3:185.
20. Post FJ, Youssef NN. A procaryotic intracellular symbiont of the Great Salt Lake brine shrimp Artemiasalina (L.). Can J Microbiol. 1977;23:1232–6.
21. Sung YY, Pineda C, MacRae TH, Sorgeloos P, Bossier P. Exposure of gnotobiotic Artemia franciscanalarvae to abiotic stress promotes heat shock protein 70 synthesis and enhances resistance topathogenic Vibrio campbellii. Cell Stress Chaperones. 2008;13:59–66.
22. De Vos S, Stappen GV, Sorgeloos P, Vuylsteke M, Rombauts S, Bossier P. Identi�cation of salt stressresponse genes using the Artemia transcriptome. Aquaculture. 2019;500:305–14.
23. Copeland DE. A study of salt secreting cells in the brine shrimp (Artemia salina). Protoplasma.1967;63:363–84.
24. Holliday CW, Roye DB, Roer RD. Salinity-induced changes in branchial Na+/K+-ATPase activity andtransepithelial potential difference in the brine shrimp Artemia salina. J Exp Biol. 1990;151:279–96.
25. Bradley TJ. Animal osmoregulation. New York: Oxford University Press; 2009.
2�. Sellami I, Charmantier G, Naceur HB, Kacem A, Lorin-Nebel C. Osmoregulatory performance andimmunolocalization of Na+/K+-ATPase in the branchiopod Artemia salina from the Sebkha of Sidi ElHani (Tunisia). Tissue Cell. 2020;63:101340.
27. Croghan PC. The survival of Artemia salina (L.) in various media. J Exp Biol. 1958;35:213–8.
2�. Park JS. Effects of different ion compositions on growth of obligately halophilic protozoanHalocafeteria seosinensis. Extremophiles. 2012;16:161–4.
29. Li H, Handsaker B, Wysoker A, Fennell T, Ruan J, Homer N, et al. The sequence alignment/mapformat and SAMtools. Bioinformatics. 2009;25:2078–9.
30. Langmead B, Salzberg SL. Fast gapped-read alignment with Bowtie2. Nat Methods. 2012;9:357–9.
31. Grabherr MG, Haas BJ, Yassour M, Levin JZ, Thompson DA, Amit I, et al. Full-length transcriptomeassembly from RNA-Seq data without a reference genome. Nat Biotechnol. 2011;29:644–52.
32. Haas BJ, Papnicolaou A, Yassour M, Grabherr M, Blood PD, Bowden J, et al. De novo transcriptsequence reconstruction from RNA-Seq: reference generation and analysis with Trinity. Nat Protoc.2013;8:1494.
33. Patro R, Duggal G, Love MI, Irizarry RA, Kingsford C. Salmon provides fast and bias-awarequanti�cation of transcript expression. Nat Methods. 2017;14:417–9.
34. Tribolium Genome Sequencing Consortium. The genome of the model beetle and pest Triboliumcastaneum. Nature. 2008;452:949–55.

Page 13/21
35. Regier JC, Shultz JW, Zwick A, Hussey A, Ball B, Wetzer R, et al. Arthropod relationships revealed byphylogenomic analysis of nuclear protein-coding sequences. Nature. 2010;463:1079–83.
3�. Colbourne JK, Pfrender ME, Gilbert D, Thomas WK, Tucker A, Oakley TH, et al. The ecoresponsivegenome of Daphnia pulex. Science. 2011;331:555–61.
37. Terrapon N, Li C, Robertson HM, Ji L, Meng X, Booth W, et al. Molecular traces of alternative socialorganization in a termite genome. Nat Commun. 2014;5:3636.
3�. Faddeeva-Vakhrusheva A, Derks MFL, Anvar SY, Agamennone V, Suring W, Smit S, et al. Gene familyevolution re�ects adaptation to soil environmental stressors in the genome of the collembolanOrchesella cincta. Genome Biol Evol. 2016;8:2106–17.
39. Faddeeva-Vakhrusheva A, Kraaijeveld K, Derks MFL, Anvar SY, Agamennone V, Suring W, et al. Copingwith living in the soil: the genome of the parthenogenetic springtail Folsomia candida. BMC Genom.2017;18:493.
40. Baldwin-Brown JG, Weeks SC, Long ADA. New standard for crustacean genomes: the highlycontiguous, annotated genome assembly of the clam shrimp Eulimnadia texana reveals HOX geneorder and identi�es the sex chromosome. Genome Biol Evol. 2017;10:143–56.
41. Barreto F, Watson ET, Lima TG, Willett CS, Edmands S, Li W, et al. Genomic signatures of mitonuclearcoevolution across populations of Tigriopus californicus. Nat Ecol Evol. 2018;2:1250–7.
42. Savojardo C, Luchetti A, Martelli PL, Casadio R, Mantovani B. Draft genomes and genomicdivergence of two Lepidurus tadpole shrimp species (Crustacea, Branchiopoda, Notostraca). MolEcol Resour. 2018;19:235–44.
43. Becking T, Chebbi MA, Giraud I, Moumen B, Laverré T, Caubet Y, et al. Sex chromosomes controlvertical transmission of feminizing Wolbachia symbionts in an isopod. PLOS Biol.2019;17:e3000438.
44. Lee BY, Choi BS, Kim MS, Park JC, Jeong CB, Han J, et al. The genome of the freshwater water �eaDaphnia magna: a potential use for freshwater molecular ecotoxicology. Aquat Toxicol.2019;210:69–84.
45. Zhang X, Yuan J, Sun Y, Li S, Gao Y, Yu Y, et al. Penaeid shrimp genome provides insights intobenthic adaptation and frequent molting. Nat Commun. 2019;10:356.
4�. Huerta-Cepas J, Forslund K, Coelho LP, Szklarczyk D, Jensen LJ, Von Mering C, et al. Fast genome-wide functional annotation through orthology assignment by eggNOG-mapper. Mol Biol Evol.2017;34:2115–22.
47. Simão FA, Waterhouse RM, Ioannidis P, Kriventseva EV, Zdobnov EM. BUSCO: assessing genomeassembly and annotation completeness with single-copy orthologs. Bioinformatics. 2015;19:3210–2.
4�. Waterhouse RM, Seppey M, Simão FA, Manni M, Ioannidis P, Klioutchnikov G, et al. BUSCOapplications from quality assessments to gene prediction and phylogenomics. Mol Biol Evol.2018;35:543–8.
Page 14/21
49. Yamada KD, Tomii K, Katoh K. Application of the MAFFT sequence alignment program to large data-reexamination of the usefulness of chained guide trees. Bioinformatics. 2016;32:3246–51.
50. Nguyen LT, Schmidt HA, Von Haeseler A, Minh BQ. IQ-TREE: a fast and effective stochastic algorithmfor estimating maximum-likelihood phylogenies. Mol Biol Evol. 2015;32:268–74.
51. Browne RA, Wanigasekera G. Combined effects of salinity and temperature on survival andreproduction of �ve species of Artemia. J Exp Mar Biol Ecol. 2000;244:29–44.
52. Sorgeloos P, Dhert P, Candreva P. Use of the brine shrimp, Artemia spp., in marine �sh larviculture.Aquaculture. 2001;200:147–59.
53. Jorgensen PL, Amat F. Regulation and function of lysine-substituted Na,K pumps in salt adaptationof Artemia franciscana. J Membr Biol. 2008;221:39–49.
54. Mahfouz ME, El-Gamal MM, Shraby SM. Morphology and anatomical structure of the larval saltgland of Artemia tunisiana under different salinities. Afr J Biotechnol. 2013;12:6032–41.
55. Zhang Q, Hou M, Li Q, Han L, Yuan Z, Tan J, et al. Expression patterns of As-ClC gene of Artemiasinica in early development and under salinity stress. Mol Biol Rep. 2013;40:3655–64.
5�. Maniatsi S, Farmaki T, Abatzopoulos TJ. The study of fkbp and ubiquitin reveals interesting aspectsof Artemia stress history. Comp Biochem Physiol B. 2015;186:8–19.
57. Vikas PA, Thomas PC, Sajeshkumar NK, Chakraborty K, Sanil NK, Vijayan KK. Effect of salinity stresson biochemical constituents and ArHsp22 gene expression in Artemia franciscana. Indian J Fish.2016;63:150–6.
5�. Zhao W, Yao F, Zhang M, Jing T, Zhang S, Hou L, et al. The potential roles of the G1LEA and G3LEAproteins in early embryo development and in response to low temperature and high salinity inArtemia sinica. PLoS One. 2016;11:e0162272.
59. Galinski EA. Osmoadaptation in bacteria. Adv Microb Physiol. 1995;37:273–328.
�0. Oren A, Larimer F, Richardson P, Lapidus A, Csonka LN. How to be moderately halophilic with broadsalt tolerance: clues from the genome of Chromohalobacter salexigens. Extremophiles. 2005;9:275–9.
�1. Conte FP. Molecular domains in epithelial salt cell NaCl of crustacean salt gland (Artemia). Int RevCell Mol Biol. 2008;268:39–57.
�2. McNamara JC, Torres AH. Ultracytochemical location of Na+/K+-ATPase activity and effect of highsalinity acclimation in gill and renal epithelia of the freshwater shrimp Macrobrachium olfersii(Crustacea, Decapoda). J Exp Zool. 1999;284:617–28.
�3. Thabet R, Ayadi H, Koken M, Leignel V. Homeostatic responses of crustaceans to salinity changes.Hydroboiologia. 2017;799:1–20.
�4. Faleiros RO, Garçon DP, Lucena MN, McNamara JC, Leone FA. Short- and long-term salinitychallenge, osmoregulatory ability, and (Na+, K+)-ATPase kinetics and α-subunit mRNA expression inthe gills of the thinstripe hermit crab Clibanarius symmetricus (Anomura, Diogenidae). CompBiochem Physiol Part A Mol Integr Physiol. 2018;225:16–25.

Page 15/21
�5. Bozza DC, Freire CA, Prodocimo V. Osmo-ionic regulation and carbonic anhydrase, Na+/K+-ATPaseand V-H+- ATPase activities in gills of the ancient freshwater crustacean Aegla schmitti (Anomura)exposed to high salinities. Comp Biochem Physiol Part A Mol Integr Physiol. 2019;231:201–8.
��. Paul JS. Osmoregulation in the marine diatom Cylindrotheca fusiformis. J Phycol. 1979;15:280–4.
�7. Wegmann K. Osmoregulation in eukaryotic algae. FEMS Microbiol Rev. 1986;39:37–43.
��. Burg MB, Ferraris JD. Intracellular organic osmolytes: function and regulation. J Biol Chem.2008;283:7309–13.
�9. Bunn HF, Higgins PJ. Reaction of monosaccharides with proteins: possible evolutionary signi�cance.Science. 1981;213:222–4.
70. Horst MN. The biosynthesis of crustacean chitin. Isolation and characterization of polyprenol-linkedintermediates from brine shrimp microsomes. Arch Biochem Biophys. 1983;223:254–63.
71. Dana GL, Lenz PH. Effects of increasing salinity on an Artemia population from Mono Lake,California. Oecologia. 1986;68:428–36.
72. Sherwood JE, Stagnitti F, Kokkinn MJ, Williams WD. Dissolved oxygen concentrations in hypersalinewaters. Limnol Oceanogr. 1991;36:235–50.
73. McCormick LR, Levin LA, Oesch NW. Vision is highly sensitive to oxygen availability in marineinvertebrate larvae. J Exp Biol. 2019;222:jeb200899.
74. Arnouk H, Lee H, Zhang R, Chung H, Hunt RC, Jahng WJ. Early biosignature of oxidative stress in theretinal pigment epithelium. J Proteomics. 2011;74:254–61.
75. Jahng WJ. New biomarkers in the retina and RPE under oxidative stress. In: Adio A, editor. OcularDiseases. Rijeka: INTECH; 2012. pp. 1–36.
7�. Poliakov E, Uppal S, Rogozin IB, Gentleman S, Redmond TM. Evolutionary aspects and enzymologyof metazoan carotenoid cleavage oxygenases. Biochim Biophys Acta, Mol Cell Biol Lipids.2020;158665.
77. Bhattacharyya S, Tobacman JK. Hypoxia reduces arylsulfatase B activity and silencing arylsulfataseB replicates and mediates the effects of hypoxia. PLoS One. 2012;7:e33250.
7�. Frolov AV, Pankov KN, Geradze KN, Pankova SA. In�uence of salinity on the biochemical compositionof the rotifer Brachionus plicatilis (Muller). aspects of adaptation. Comp Biochem Physiol Part A MolIntegr Physiol. 1991;99:541–50.
79. Verslycke T, Janssen CR. Effects of a changing abiotic environment on the energy metabolism in theestuarine mysid shrimp Neomysis integer (Crustacea: Mysidacea). J Exp Mar Biol Ecol.2002;279:61–72.
�0. Anger K. Salinity as key parameter in the larval biology of decapod crustaceans. Invertebr ReprodDev. 2003;43:29–45.
�1. Jensen MK, Madsen SS, Kristiansen K. Osmoregulation and salinity effects on the expression andactivity of Na+, K+-ATPase in the gills of European sea bass, Dicentrarchus labrax (L.). J Exp ZoolPart B. 1998;282:290–300.

Page 16/21
�2. Tine M, Guinand B, Durand JD. Variation in gene expression along a salinity gradient in wildpopulations of the euryhaline black-chinned tilapia Sarotherodon melanotheron. J Fish Biol.2012;80:785–801.
�3. Jeffries KM, Fangue NA, Connon RE. Multiple sub-lethal thresholds for cellular responses to thermalstressors in an estuarine �sh. Comp Biochem Physiol Part A Mol Integr Physiol. 2018;225:33–45.
�4. Gajardo GM, Abatzopoulos TJ, Kappas I, Beardmore JA. Evolution and speciation. In: AbatzopoulosTJ, Beardmore JA, Clegg JS, Sorgeloos P, editors. Artemia: basic and applied biology. Dordrecht:Springer; 2002. pp. 225–50.
�5. Campillo S, García-Roger EM, Carmona MJ, Serra M. Local adaptation in rotifer populations. EvolEcol. 2011;25:933–47.
Figures
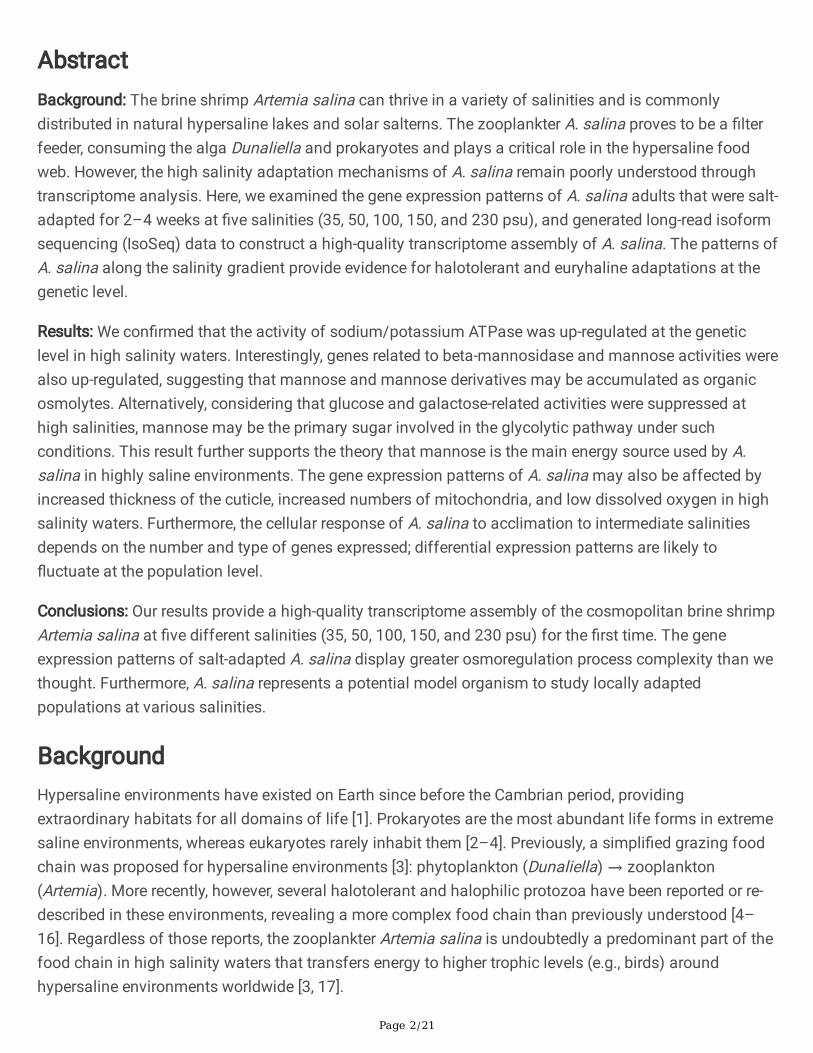
Figure 1
Photographs of a) male and b) female Artemia salina specimens from present study.

Page 17/21
Figure 2
Phylogenetic tree of Pancrustacea. A total of 5,604 homologous protein sets were present in all sampledBranchiopoda species.
Page 18/21
Figure 3
Heatmap of expression patterns of up- and down-regulated genes with increasing salinity from 35 psu to230 psu. Normalized expressions indicate z-scores. Molecular functions of enriched gene ontology termsare shown (Fisher test, p-value < 0.05).
Page 19/21
Figure 4
Hypothetical U-shaped and inverted U-shaped responses with increasing salinity from 35 psu to 230 psu.Normalized values (z-scores) were used to identify the U-shaped or inverted U-shaped patterns.

Page 20/21
Figure 5
Comparative analysis of Artemia salina gene expressions with previously identi�ed salinity-dependent up-and down-regulated response genes. Normalized expressions indicate z-scores.
Supplementary Files

Page 21/21
This is a list of supplementary �les associated with this preprint. Click to download.
Additional�le1.mp4
Additional�le2.xlsx
Additional�le3.pdf
Additional�le4.xlsx


![The occurrence of the brine shrimp, Artemia franciscana ... · America [25], other Artemia species include: Artemia persimilis of South America [26], Artemia salina in the Mediterranean](https://img.pdfslide.us/doc/110x75/5c4b6a7093f3c3117d72c1b0/the-occurrence-of-the-brine-shrimp-artemia-franciscana-america-25-other.jpg)