Embed Size (px)
Citation preview
AUSTRALIAN RAIL TRACK CORPORATION LTD
HUNTER VALLEY ACCESS UNDERTAKING 2009
EXPLANATORY GUIDE – SUPPLEMENTARY INFORMATION (OCTOBER 2009)
INTERIM INDICATIVE ACCESS CHARGES
EXCESS NETWORK OCCUPANCY COMPONENT ALLOWANCES
2
TABLE OF CONTENTS
1. Introduction 1
1.1 Hunter Valley Coal Network Access Undertaking 3
1.2 Access Pricing Principles 3
2. Interim Indicative Access Charges 6
2.1 Proposed Interim Indicative Access Charges 6
2.2 Pricing Approach and Modelling 8
2.3 Operating Cost Elements 9
2.3.1 Maintenance Expenditure (costs directly attributed to a Segment) 10
2.3.2 Non-Segment Specific Costs and allocated to Segments in
accordance with section 4.5(a)(ii) and (iii) of the HVAU 11
2.4 Asset Related Cost Elements 14
2.4.1 Asset Valuation and Roll Forward of the Regulatory Asset Base 14
2.4.2 RAB Roll Forward Results 18
2.4.3 Depreciation 19
2.4.4 Rate of Return 19
2.4.5 Return 20
2.5 Coal Volume Forecasts 20
2.6 Non-Coal Volume Forecasts 21
2.7 The Ceiling Test & Setting Interim Indicative Access Charges 21
2.7.1 Constrained Group of Mines and Constrained Network 21
2.7.2 Forecast 2010 Cost Base 22
2.7.3 Cost Base Comparison 23
2.7.4 Determining Interim Indicative Access Charges 26
3. Excess Network Occupancy Component Allowances 30
3.1 Proposed Allowances 30
3.2 Determination of Allowance 31
3.3 Determination of ENOC 31
ATTACHMENT 1 – 1 July 2008 Opening RAB Value Assumptions 33
ATTACHMENT 2 – Network Segment Capital Expenditure Assumptions 2007-08 to 2010 34
3
1. INTRODUCTION
1.1 Hunter Valley Access Undertaking
This Explanatory Guide is presented as a companion to the 2009 ARTC Hunter Valley
Access Undertaking (HVAU) Supplementary Information submitted to the Australian
Competition and Consumer Commission (ACCC) on 13 October 2009 to expand on the
content of the HVAU Supplementary Information and provide context where appropriate that
aids understanding of the key features of the HVAU Supplementary Information.
The HVAU stipulates the processes, responsibilities and obligations of ARTC and an
applicant seeking access to the ARTC Hunter Valley network (Network). The
Supplementary Information provided relates to the proposal of Interim Indicative Access
Charges forming part of the table at Clause 4.16(e) of the HVAU, and the proposal of
allowances for operational activities applicable to the excess network occupancy component
(ENOC) of pricing for Non-Coal Access Rights forming part of the table at Clause 4.11(b) of
the HVAU. The Supplementary Information forms part of ARTC’s Application in relation to
the HVAU made to the ACCC on 22 April 2009.
Once accepted by the ACCC the terms of the HVAU will be binding and enforceable by law
on ARTC. It should be noted however, that the HVAU does not diminish existing contractual
rights nor preclude parties agreeing to principles outside the scope of the undertaking.
This Guide does not comprise part of the HVAU Supplementary Information, nor does it seek
to repeat the contents thereof, but rather to aid understanding through provision of further
information and clarification. To the extent there may be any apparent inconsistency
between this Guide and the HVAU, the HVAU shall prevail. ARTC may, during the term of
the HVAU update this Guide, without reference to the ACCC, if feedback suggests it is
warranted. Terms used in this Guide are as per definitions in the HVAU unless otherwise
obvious from the context.
1.2 Access Pricing Principles
The Access Pricing Principles are detailed at Clause 4 of the HVAU.
Explanation in relation to the Access Pricing Principles can be found in the Explanatory
Guide accompanying ARTC’s HVAU Application on 22 April 2009. The Guide is located on
the ACCC website:
http://www.accc.gov.au/content/item.phtml?itemId=870155&nodeId=ff9452fd1948a80806fec
3ec2f48bdce&fn=ARTC%20Hunter%20Valley%20Access%20Undertaking%20Explanatory%
20Guide.pdf
4
Interim Indicative Access Charges
The Access Pricing Principles provide for ARTC to develop Indicative Access Charges for
Indicative Services for Coal Access Rights. Clause 4.13(a) of the HVAU requires ARTC to
establish Indicative Access Charges having regard to the delivery of optimal Coal Chain
Capacity in consultation with the Hunter Valley Coal Chain Coordinator (HVCCC), given
certain coal chain assumptions agreed with the HVCCC.
ARTC recognises that, at the Commencement Date, it may be unable to determine
Indicative Services and Indicative Access Charges in accordance with the Access Pricing
Principles. This largely relates to the early stage of development by the industry of the
concept of Coal Chain Capacity and determining the ‘optimal’ use of Coal Chain Capacity.
To address this uncertainty in the HVAU, ARTC has proposed to develop Interim Indicative
Access Charges for a number of prescribed Interim Indicative Services in the Hunter Valley
intended to represent the existing predominant coal train service configurations.
The HVAU provides, during the period between the Commencement Date and the time
when ARTC is satisfied it is able to determine Indicative Services and Indicative Access
Charges in accordance with the Pricing Principles (Interim Period) for ARTC to use
reasonable endeavours to determine Interim Indicative Access Charges (IIAC) for the
prescribed Interim Indicative Services, having regard to available information and the
following constraints:
• the institutional arrangements in place for the management and development of Coal
Chain Capacity;
• the availability of appropriate modelling tools, and necessary input information for such
tools, enabling the determination of Coal Chain Capacity and optimum utilisation of Coal
Chain Capacity; and
• the availability, cost of obtaining, and quality of information reasonably required by ARTC
for the purpose of determining Interim Indicative Services and Interim Indicative Access
Charges and Charges for other Services associated with Coal Access Rights applicable
during the Interim Period.
ARTC has developed and proposed in this Supplementary Information IIACs which it
considers are consistent with the relevant aspects of the Access Pricing Principles.
ARTC has proposed that the IIACs apply during the calendar year commencing 1 January
2010. The Access Pricing Principles provide for ARTC to determine revised IIACs for Coal
Access Rights with Interim Indicative Service characteristics for each calendar year of the
Interim Period.
The development of the proposed IIACs is described at Section 2 of this Explanatory Guide.
5
ENOC – Allowances for Operational Activities
The Access Pricing Principles detailed in the proposed HVAU forming part of ARTC’s
Application to the ACCC on 22 April 2009 indicated that allowances for operational activities
applicable to the determination of any ENOC to form part of the structure of Charges for
Non-Coal Access Rights were ‘to be advised’.
ARTC has developed and proposed in this Supplementary Information allowances relating to
ENOC which it considers are consistent with the relevant aspects of the Access Pricing
Principles.
The development of the proposed allowances has been described at Section 3 of this
Explanatory Guide.
6
2. INTERIM INDICATIVE ACCESS CHARGES
2.1 Proposed Interim Indicative Access Charges
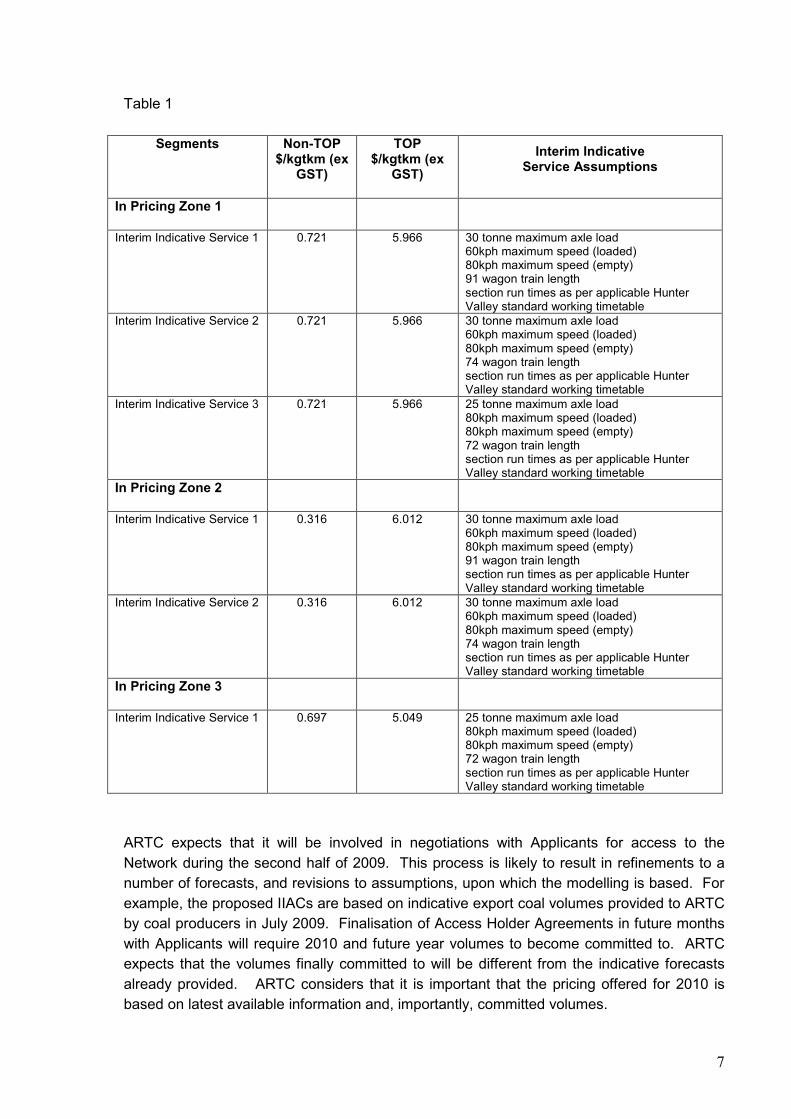
ARTC has proposed IIACs to apply from 1 January 2010 for all Interim Indicative Services1
prescribed at clause 4.16(e) of the HVAU, as described in Table 1 below.
It should be noted that the proposed IIACs have been developed by ARTC using
spreadsheet modelling that is based on 2010 calendar year forecasts and assumptions
based on information available to ARTC as at July 2009. This spreadsheet modelling has
been provided to the ACCC on a confidential basis, so that the ACCC can satisfy itself that
the proposed approach and methodology for determining IIACs at clause 4 of the HVAU is
reasonable, and that IIACs have been determined in accordance with that approach and
methodology.
It is important to recognise that the modelling has been prepared by ARTC in order to
determine 2010 pricing based on relevant forecasts and assumptions for that year. As is the
case under the existing NSW Rail Access Undertaking, the HVAU provides a further
opportunity for the ACCC to carry out an Annual Compliance assessment of the revenue
collected by ARTC for 2010, in early 2011. This assessment will be based on actual volume
and cost information, where the ACCC will again be able to satisfy itself that Access revenue
has been collected in accordance with the HVAU.
Further detail in relation to the forecasts and assumptions is provided in section 2.3.
1 It should be noted that Interim Indicative Service 2 has been incorrectly prescribed as having 72 wagon train length.
This should read 74 wagon train length.
7
Table 1
Segments Non-TOP $/kgtkm (ex
GST)
TOP $/kgtkm (ex
GST)
Interim Indicative Service Assumptions
In Pricing Zone 1
Interim Indicative Service 1 0.721 5.966 30 tonne maximum axle load 60kph maximum speed (loaded) 80kph maximum speed (empty) 91 wagon train length section run times as per applicable Hunter Valley standard working timetable
Interim Indicative Service 2
0.721 5.966 30 tonne maximum axle load 60kph maximum speed (loaded) 80kph maximum speed (empty) 74 wagon train length section run times as per applicable Hunter Valley standard working timetable
Interim Indicative Service 3
0.721 5.966 25 tonne maximum axle load 80kph maximum speed (loaded) 80kph maximum speed (empty) 72 wagon train length section run times as per applicable Hunter Valley standard working timetable
In Pricing Zone 2
Interim Indicative Service 1 0.316 6.012 30 tonne maximum axle load 60kph maximum speed (loaded) 80kph maximum speed (empty) 91 wagon train length section run times as per applicable Hunter Valley standard working timetable
Interim Indicative Service 2 0.316 6.012 30 tonne maximum axle load 60kph maximum speed (loaded) 80kph maximum speed (empty) 74 wagon train length section run times as per applicable Hunter Valley standard working timetable
In Pricing Zone 3
Interim Indicative Service 1 0.697 5.049 25 tonne maximum axle load 80kph maximum speed (loaded) 80kph maximum speed (empty) 72 wagon train length section run times as per applicable Hunter Valley standard working timetable
ARTC expects that it will be involved in negotiations with Applicants for access to the
Network during the second half of 2009. This process is likely to result in refinements to a
number of forecasts, and revisions to assumptions, upon which the modelling is based. For
example, the proposed IIACs are based on indicative export coal volumes provided to ARTC
by coal producers in July 2009. Finalisation of Access Holder Agreements in future months
with Applicants will require 2010 and future year volumes to become committed to. ARTC
expects that the volumes finally committed to will be different from the indicative forecasts
already provided. ARTC considers that it is important that the pricing offered for 2010 is
based on latest available information and, importantly, committed volumes.
8
As a result, ARTC may propose a further set of refined IIACs before 1 January 2010 if there
are material variances to the volumes or assumptions or IIACs. It is not ARTC’s intention,
however, to alter the methodology proposed.
2.2 Pricing Approach and Modelling
The approach that ARTC has adopted to develop the 2010 pricing is similar to that used in
the past in order to determine whether revenue collected, which is based on pricing and
volumes satisfies the ceiling test. That is, ARTC has sought to develop pricing in 2010 such
that, if 2010 volumes forecasted by producers in July 2009 materialise and ARTC’s 2010
operating and capital budgets are achieved, revenue collected by ARTC will be close to
ceiling limit, thereby minimising any unders or overs for 2010. To the extent producer
forecasts or expenditure budgets are not achieved it is likely that an under or over to be
allocated to Access Holders will arise.
The pricing model proposed in the HVAU is essentially a standard ‘building block’ model.
ARTC’s cost base, giving rise to a ceiling revenue limit, consists of maintenance expenditure
(variable and fixed), network control and terminal management, an allocation of asset
management (engineering) and corporate overheads, depreciation based on proposed
remaining mine life estimates, and a return on assets based on proposed asset valuation
and proposed rate of return.
ARTC has sought to develop the 2010 cost base and ceiling limit in accordance with the
Pricing principles proposed at section 4 of the HVAU.
Differences to the approach currently used for compliance assessment in the Hunter Valley,
arising from the proposed Pricing Principles include:
• The introduction of 3 Pricing Zones.
• The inclusion of infrastructure between Dartbrook mine and The Gap.
• The use of separate remaining mine life estimates for the purposes of determining
depreciation in each Pricing Zone.
• The use of separate rates of return for existing assets and new investments.
• The specification of two part prices (non-Take or Pay (variable) and Take or Pay (TOP)).
Aspects of the current approach used for compliance assessment in the Hunter Valley that
have remained largely unchanged include:
• Establishment of variable and fixed maintenance expenditure for each segment.
• The approach used to allocate engineering and corporate overheads to the Network and
its Segments.
• The approach used to roll forward the asset base.
9
• The application of the stand-alone combinatorial test to establish the Constrained Group
of Mines and the Constrained Network.
It should be noted that the development of pricing assumes that the HVAU will become
effective as at 1 January 2010. As such, it has been assumed that the pricing principles
detailed at Schedule 3 of NSW Rail Access Undertaking (NSWRAU) are operable for the
period up to 31 December 2009, and the HVAU Pricing Principles are operable from 1
January 2009.
It should be noted that arrangements for transition between regulatory instruments, in
particular the scope of compliance assessments undertaken by IPART and the ACCC over
the period is not yet resolved, and will to some extent depend on the actual Commencement
Date of the HVAU.
It should also be noted that, as pricing is being developed for the first year of the Term of the
HVAU, the approach proposed by ARTC to capitalise economic losses (Loss
Capitalisation) has no direct bearing on the pricing outcomes. This is because Pricing
Zone 1 and Pricing Zone 2, together, currently form the Constrained Network, and whilst
more relevant in Pricing Zone 3 where revenue remains well below a building blocks ceiling,
it has little bearing on the pricing decision for coal in that Pricing Zone.
As such, ARTC has elected not to incorporate the approach in the roll forward of the asset
base for the purposes of development of 2010 IIACs. ARTC will however, incorporate the
approach for asset roll forward in developing financial model supporting its 2010 asset roll
forward and ceiling test compliance submission to the ACCC in early 2011.
It should also be noted that ARTC intends to provide illustrative 5 year and 10 year forecasts
of costs, asset base and pricing to give some indication to stakeholders of future variation in
access pricing given materialisation of a number of assumptions upon which the forecasts
are based. As Loss Capitalisation may have a bearing on forecasted costs and asset value,
Loss Capitalisation has been incorporated in the forecast modelling.
The following sections will provide explanation of each of these cost elements forming the
2010 cost base.
2.3 Operating Cost Elements
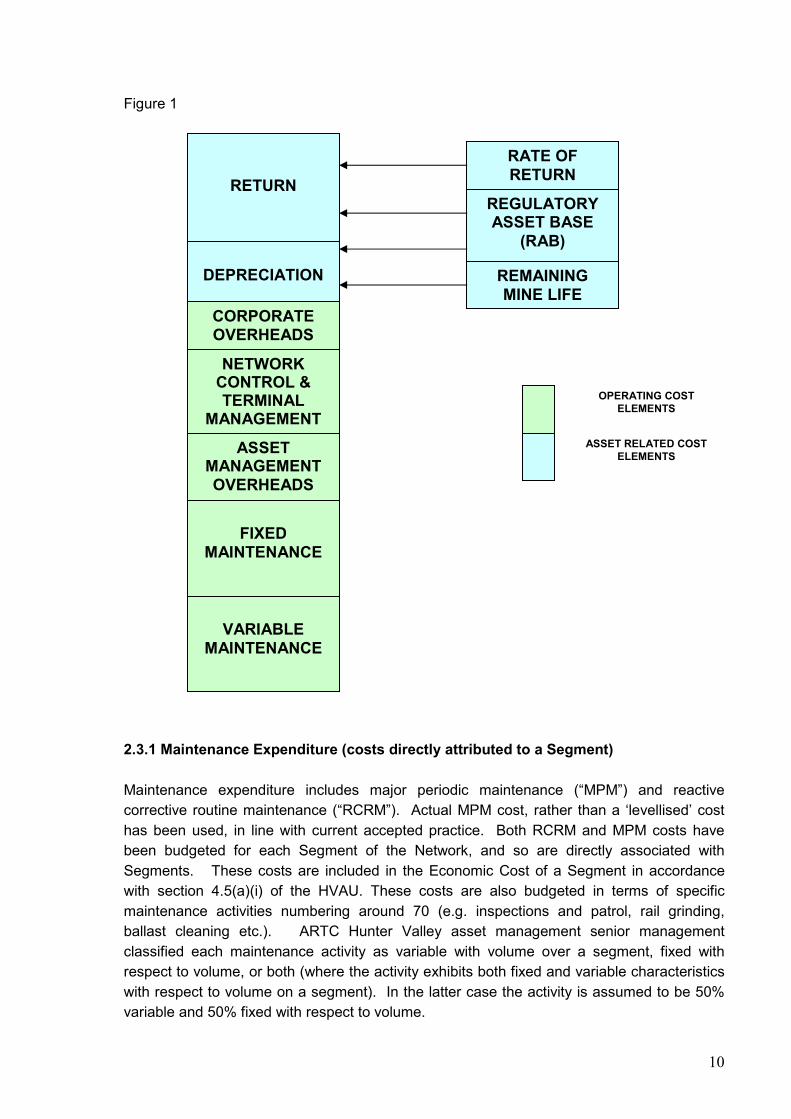
Figure 1 below shows the cost elements that make up ARTC forecasted cost base for 2010.
10
Figure 1
2.3.1 Maintenance Expenditure (costs directly attributed to a Segment)
Maintenance expenditure includes major periodic maintenance (“MPM”) and reactive
corrective routine maintenance (“RCRM”). Actual MPM cost, rather than a ‘levellised’ cost
has been used, in line with current accepted practice. Both RCRM and MPM costs have
been budgeted for each Segment of the Network, and so are directly associated with
Segments. These costs are included in the Economic Cost of a Segment in accordance
with section 4.5(a)(i) of the HVAU. These costs are also budgeted in terms of specific
maintenance activities numbering around 70 (e.g. inspections and patrol, rail grinding,
ballast cleaning etc.). ARTC Hunter Valley asset management senior management
classified each maintenance activity as variable with volume over a segment, fixed with
respect to volume, or both (where the activity exhibits both fixed and variable characteristics
with respect to volume on a segment). In the latter case the activity is assumed to be 50%
variable and 50% fixed with respect to volume.
RETURN
DEPRECIATION
CORPORATE OVERHEADS
NETWORK CONTROL & TERMINAL
MANAGEMENT
ASSET MANAGEMENT OVERHEADS
FIXED
MAINTENANCE
VARIABLE
MAINTENANCE
REGULATORY ASSET BASE
(RAB)
RATE OF RETURN
REMAINING MINE LIFE
OPERATING COST ELEMENTS
ASSET RELATED COST ELEMENTS
11
For each Segment, expenditure associated with each activity is classified as variable or
fixed, resulting in total variable maintenance and total fixed maintenance for each Segment.
In order to determine maintenance cost applicable to Hunter Valley coal on a stand alone
basis, the total GTK (for all coal and non-coal traffic) for each Segment is applied to a the
variable maintenance for each Segment to determine a variable maintenance unit cost
(c/GTK). Then only the coal allocation of variable maintenance (coal GTK x variable
maintenance unit cost) is retained in cost base.
Table 2 shows the variable and fixed maintenance expenditure, based on the above
assumptions, included in the 2010 forecast cost base for the Network and Constrained
Network.
Table 2
$m Network Constrained Network
(Ports – Ulan)
Variable Maintenance (coal) 18.85 14.91
Fixed Maintenance 18.75 15.94
Ongoing drivers of maintenance expenditure in the Network are normally:
• network volumes (particularly in relation to variable maintenance, and less so in relation
to fixed maintenance);
• wages and material inflation;
• maintenance productivity; and
• network availability (that is, the frequency and nature of possession opportunities, can
impact significantly on the cost of undertaking a maintenance activity, where ARTC, in
undertaking its maintenance program, is committed to working with the industry with a
view to minimising impact on coal throughput).
2.3.2 Non-Segment Specific Costs and allocated to Segments in accordance with
section 4.5(a)(ii) and (iii) of the HVAU
Costs incurred by ARTC to operate the Network but are not directly identifiable with Network
Segments include costs associated with ARTC’s Asset Management, Network Control,
Terminal Management, and Corporate Management and Support functions.
Asset Management expenditure included in the cost base relates to:
• maintenance related expenditure that cannot be directly indentified with Hunter Valley
Segments (for example provisioning centres);
12
• Hunter Valley asset management and support (for example, management, project staff,
office support staff);
• NSW asset management and support (as above); and
• ARTC asset management and support (for example, management, asset performance,
systems and standards).
This type of expenditure is often identified as relating to a part of the ARTC network (eg
Hunter Valley, Newcastle region, NSW region or ARTC region) and is incurred at certain
locations (eg Newcastle, Sydney, Adelaide etc). Depending on these elements, asset
management expenditure will be allocated over certain parts of the ARTC network on the
basis of GTKs in accordance with section 4.5(a)(iii)(A) of the HVAU.
For example, asset management expenditure incurred at Newcastle relating to the
Newcastle lease region will be allocated to the Network on a prorate basis of
GTK(Network)/GTK(Newcastle lease region). A further example is asset performance
expenditure incurred in Adelaide. As this relates to the whole of the ARTC network, it is
allocated to the Network on a prorate basis of GTK(Network)/GTK(whole of ARTC network).
Expenditure identified as relating exclusively to other parts of the ARTC network in NSW, or
outside of NSW is not allocated to the Network.
Expenditure allocated to the Network is then allocated to Segments on the basis of GTK.
Network Control & Terminal Management expenditure primarily includes labour related
expenditure associated with delivery of network and yard control, terminal management,
signalling, path scheduling and incident management.
Expenditure is primarily incurred in Newcastle and Port Waratah (terminal). Network control
costs are apportioned to the Network on the basis of area of coverage of the network control
and signalling function and where this is not relevant, on a train kilometre basis. Terminal
management expenditure is identified as a stand alone cost of operation of the Hunter Valley
coal network.
Both network control and terminal management apportioned to the Network have been
allocated to Segments on the basis of train kilometres in accordance with section
4.5(a)(iii)(B) of the HVAU.
In recent year’s both the network control & terminal management functions have been
rationalised by ARTC as part of a wider NSW Train Control Consolidation Project completed
by ARTC in 2006-07. The project involved the following key elements
• Modernisation of signalling and communications systems in NSW to enable the remote
operation of control functions performed at 30 locations in NSW.
• The consolidation of network control positions of train controller, signaller and area
controllers.
13
• The consolidation of network control function into Northern and Southern centres
operated by ARTC.
• The transfer of terminal management functions performed under contract by PN to
ARTC.
• The direct employment of network control and terminal management staff by ARTC. The
resource to perform these functions was previously provided by PN [under contract] and
Rail Infrastructure Corporation [secondment].
A key project benefit was a reduction in expenditure associated with delivery of these
functions in NSW. This benefit has manifested in reduced network control and terminal
management expenditure associated with the Hunter Valley coal network in subsequent
years. However, some fluctuation in this expenditure remains as the new approach to these
functions resulting from the project is bedded down.
Corporate Management and Support expenditure primarily includes labour related
expenditure associated with ARTC’s IT, property management, legal services, human
resources and training, billing/credit and financial management, security and property
management, safety and risk management, executive, research and regulation, customer
and access contract management functions and the Board. Expenditure also includes some
non-labour related expenditure such as insurance, external consultancies and systems.
This type of expenditure is often identified as relating to a part of the ARTC network (eg
Newcastle region, NSW region or ARTC region) and is incurred at certain locations (eg
Newcastle, Sydney, Adelaide etc). Depending on these elements, corporate overhead
expenditure will be allocated over certain parts of the ARTC network on the basis of train
kilometres in accordance with section 4.5(a)(iii)(B) of the HVAU.
For example, corporate overhead expenditure incurred at Newcastle relating to the
Newcastle lease region will be allocated to the Network on a prorate basis of train kilometres
(Network)/train kilometres (Newcastle lease region). A further example is expenditure
relating to ARTC’s Executive incurred in Adelaide. As this relates to the whole of the ARTC
network, it is allocated to the Network on a prorate basis of train kilometres (Network)/train
kilometres (whole of ARTC network).
Expenditure identified as relating exclusively to other parts of the ARTC network in NSW, or
outside of NSW is not allocated to the Network.
Expenditure allocated to the Network is then allocated to Segments on the basis of train
kilometres.
Importantly, ARTC’s approach seeks to ensure that:
• Expenditure that does not relate to the Network is not allocated the Network; and
• Expenditure that is related to the Network is allocated to the Network on an appropriate
prorate GTK basis in accordance with the HVAU.
14
The approach used by ARTC is consistent with the approach used to allocate overhead
expenditure to the interstate network covered by ARTC’s Interstate Access Undertaking in
confidential financial modelling provided to the ACCC as part of its application in 2007, and
subsequently endorsed by the ACCC in 2008.
The approach is also consistent with the approach used to allocate overhead expenditure
underpinning the cost base submitted by ARTC to IPART as part of its annual revenue
compliance assessment under the NSWRAU in each year since ARTC’s lease on NSW
commenced. The approach was endorsed by IPART initially in 2004-05 as part of a detailed
public review of ARTC’s costs in that year to satisfy stakeholder concerns. ARTC is not
aware of any further concerns in relation to the approach in subsequent years.
Table 3 shows the Non-Segment Specific Costs allocated to the Network and Constrained
Network, based on the above assumptions, included in the 2010 forecast cost base.
Table 3
$m Network Constrained Network
(Ports – Ulan)
Non-Segment Specific Costs 33.57 28.68
Ongoing drivers of Non-Segment Specific Costs allocated to the Network are normally:
• changes in Network volumes (GTK) and activity (train kilometres) compared to other
parts of the ARTC network;
• wages inflation; and
• productivity improvements.
2.4 Asset Related Cost Elements
2.4.1 Asset Valuation and Roll Forward of the Regulatory Asset Base (RAB)
The HVAU provides for ARTC to determine RAB values to be used for the calculation of a
return on assets to be included in the cost base, as follows.
• Separation of the RAB into Pricing Zones.
• Separation of the RAB into assets existing as at the Commencement Date (ERAB) and
assets commissioned during the Term (IRAB).
• In relation to ERAB, setting ERAB (as at the Commencement Date) for assets in those
Segments that have been ascribed a regulatory asset value in accordance with the
NSWRAU to the value of those assets that would be determined in accordance with the
NSWRAU as at the Commencement Date.
15
• In relation to ERAB, setting ERAB (as at the Commencement Date) for assets in those
Segments that have not been ascribed a regulatory asset value in accordance with the
NSWRAU to a value determined on a depreciated optimised replacement cost (DORC)
basis.
As stated earlier, ARTC has assumed that the HVAU will become effective as at 1 January
2010. As such, RAB values as at 1 January 2010, being the start date for 2010 pricing are
initially sought.
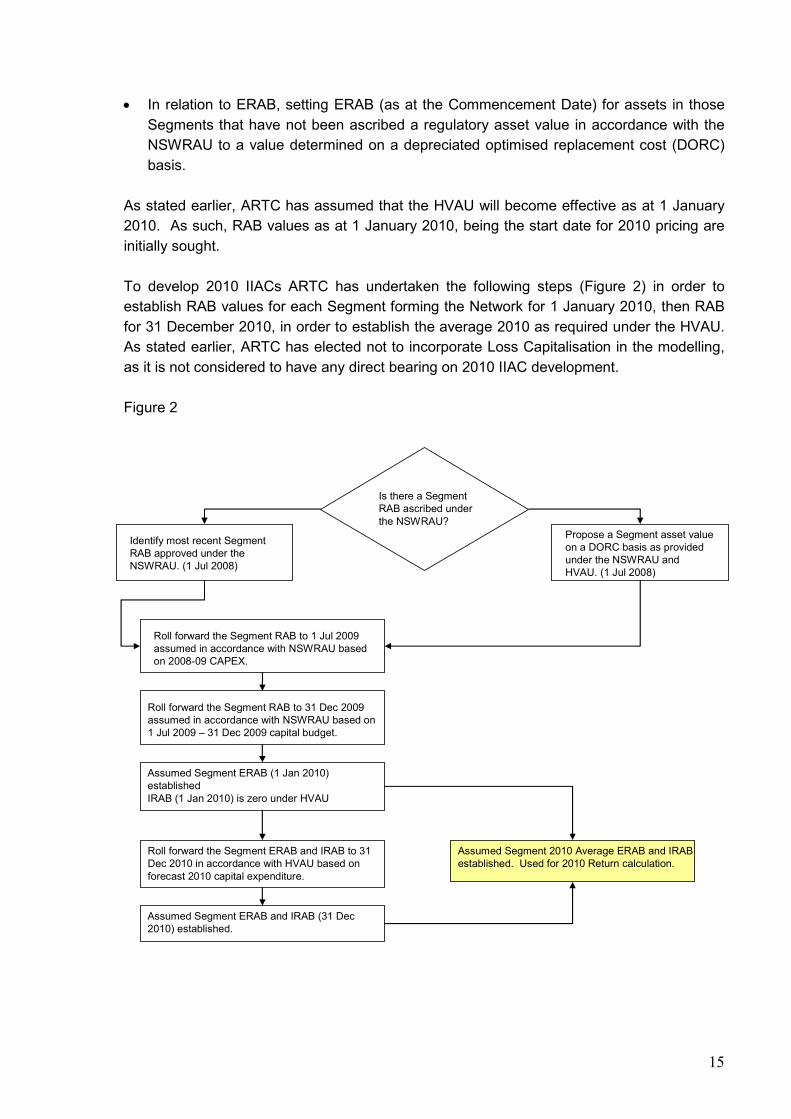
To develop 2010 IIACs ARTC has undertaken the following steps (Figure 2) in order to
establish RAB values for each Segment forming the Network for 1 January 2010, then RAB
for 31 December 2010, in order to establish the average 2010 as required under the HVAU.
As stated earlier, ARTC has elected not to incorporate Loss Capitalisation in the modelling,
as it is not considered to have any direct bearing on 2010 IIAC development.
Figure 2
Identify most recent Segment RAB approved under the NSWRAU. (1 Jul 2008)
Propose a Segment asset value on a DORC basis as provided under the NSWRAU and HVAU. (1 Jul 2008)
Is there a Segment RAB ascribed under the NSWRAU?
Roll forward the Segment RAB to 1 Jul 2009 assumed in accordance with NSWRAU based on 2008-09 CAPEX.
Roll forward the Segment RAB to 31 Dec 2009 assumed in accordance with NSWRAU based on 1 Jul 2009 – 31 Dec 2009 capital budget.
Assumed Segment ERAB (1 Jan 2010) establishedIRAB (1 Jan 2010) is zero under HVAU
Assumed Segment ERAB (1 Jan 2010) establishedIRAB (1 Jan 2010) is zero under HVAU
Roll forward the Segment ERAB and IRAB to 31 Dec 2010 in accordance with HVAU based on forecast 2010 capital expenditure.
Assumed Segment ERAB and IRAB (31 Dec 2010) established.
Assumed Segment 2010 Average ERAB and IRAB established. Used for 2010 Return calculation.
16
Regulatory Asset Base valuation and roll forward in each year has been undertaken in
accordance with the NSWRAU and HVAU as is applicable to that year, using the roll forward
formulae prescribed in each undertaking. The assumption made in determining RAB for
2010 pricing is that actual and forecast capital expenditure is endorsed.
Assumptions in relation to each parameter used in the roll forwards (as applicable) are as
follows:
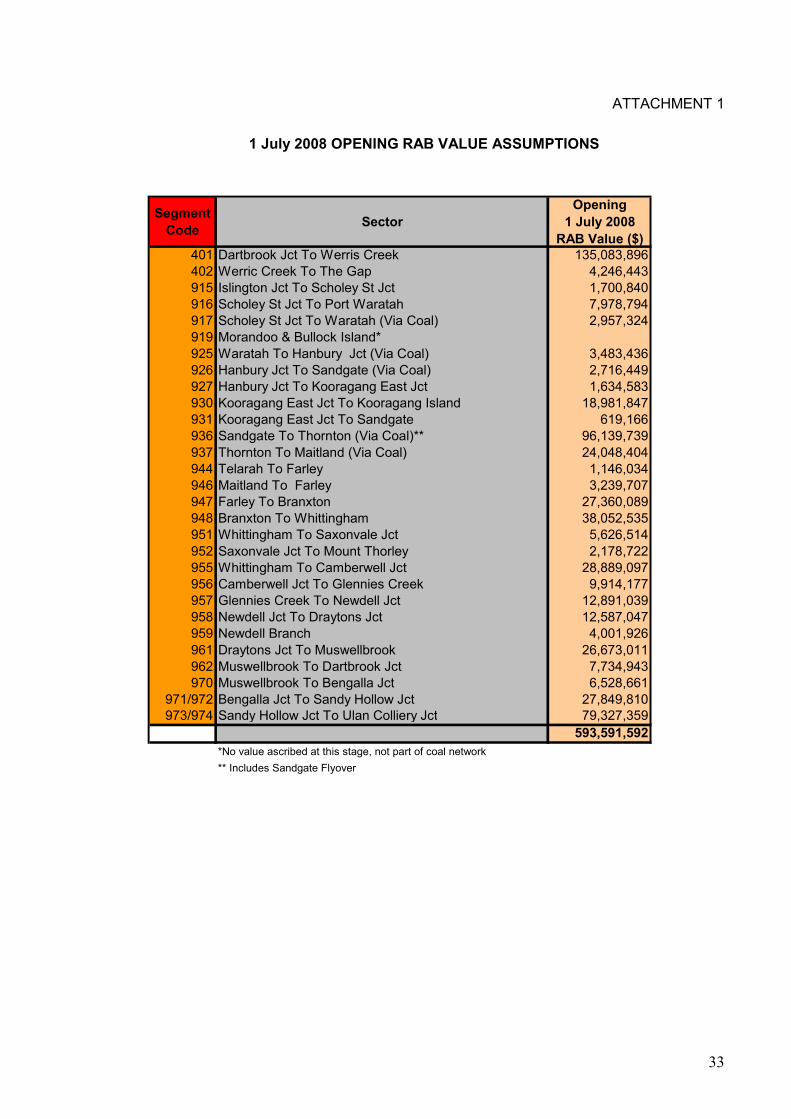
1 July 2008 opening RAB.
For assets in Segments ascribed a RAB under the NSWRAU, the closing RAB value for
2007-08 approved by IPART as part of ARTC’s 2007-08 ceiling test submission have been
assumed as the 1 July 2008 opening RAB.
2007-08 closing RAB values for each Segment are detailed at Attachment 1.
For assets in Segments not ascribed a RAB under the NSWRAU, the 1 July 2008 RAB value
is equivalent to the DORC valuation proposed by ARTC as part of its HVAU application.
These values are shown at Table 4.
Table 4
Pricing Zone Segment Description 1 July 2008 RAB
3 0401 Dartbrook – Werris Creek 135.1
3 0402 Werris Creek - Gap 4.2
CPI
CPI assumptions used for RAB roll forward in each period is described in Table 5.
Table 5
Period CPI Assumption Comment
2008-09 Financial Year 2.96% Determined in accordance with
NSWRAU
1 Jul 2009 – 31 Dec 2009 1.55% 50% of 2008-09 CPI determined in
accordance with NSWRAU
2010 Calendar Year 2.30% ARTC Corporate Plan Forecast
Additions
Apart from inclusion in the 2007-08 opening RAB value of assumed 1 July 2008 asset values
for prescribed Segments (0401 and 0402 above) that had no previous DORC value under
the NSWRAU, there have been no additions assumed over the period.
17
Capital Expenditure
For the purpose of developing 2010 IIACs, ARTC has incorporated actual and forecast
capital expenditure for each Segment over the period as shown in Attachment 2.
ARTC has assumed that actual capital expenditure incurred in 2008-09 will be endorsed to
be included in the 2008-09 RAB roll forward under the NSWRAU. ARTC has assumed
planned capital expenditure for the period between 1 July 2009 and 31 December 2009 will
be endorsed to be included in the half year RAB roll forward under the NSWRAU. ARTC
has assumed that forecast 2010 capital expenditure will be endorsed to be included in the
2010 IRAB roll forward under the HVAU.
ARTC understands that these are assumptions only and that capital expenditure may not be
endorsed or incurred as planned. This is a normal variation that may give rise to unders and
overs at the end of 2010.
In each year, capital expenditure assumptions for each Segment include expenditure
associated with ARTC’s annual minor capital program in the Hunter Valley as well as
expenditure associated with major projects undertaking by ARTC consistent with the Hunter
Valley Corridor Capacity Strategy.
ARTC has also included at Attachment 2, details of capital expenditure assumptions in each
Segment for major projects. For the purposes of 2010 pricing, ARTC has not included any
financing costs associated with major projects that may arise through delivery over extended
periods in the capital expenditure assumptions.
Depreciation
Both the NSWRAU and the HVAU provide for depreciation is to be calculated on a straight
line basis based on the remaining mine life. Remaining mine life assumptions used are
consistent with current settings under the HVAU (as approved by IPART), or as proposed
under the HVAU. Consistent with current practice, depreciation with respect to assets
commissioned in a year will be based on half a year for the year of commissioning.
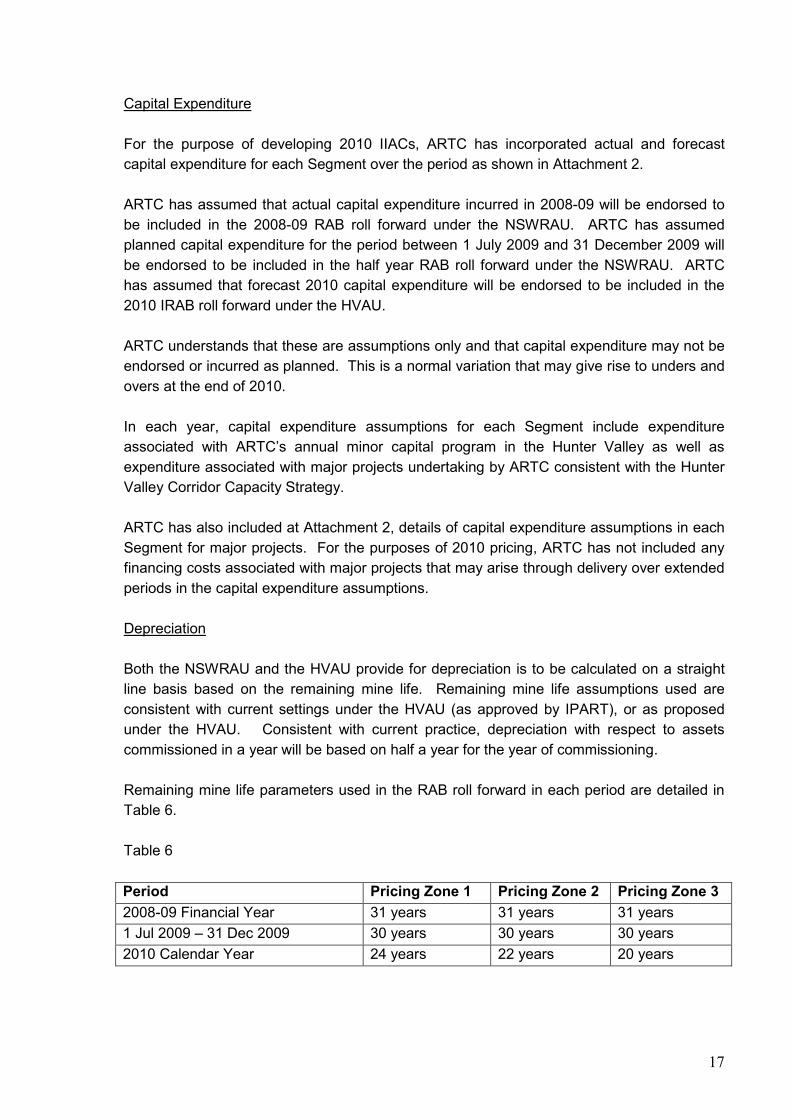
Remaining mine life parameters used in the RAB roll forward in each period are detailed in
Table 6.
Table 6
Period Pricing Zone 1 Pricing Zone 2 Pricing Zone 3
2008-09 Financial Year 31 years 31 years 31 years
1 Jul 2009 – 31 Dec 2009 30 years 30 years 30 years
2010 Calendar Year 24 years 22 years 20 years
18
For the half year roll forward, only half depreciation (compared to a full year) has been
assumed.
Disposals
For the purposes of 2010 pricing, ARTC has not assumed any write-off of assets disposed
that may result from capital expenditure over the period. Disposals will be incorporated in
any ceiling test submissions provided by ARTC to the regulator under the NSWRAU or
HVAU.
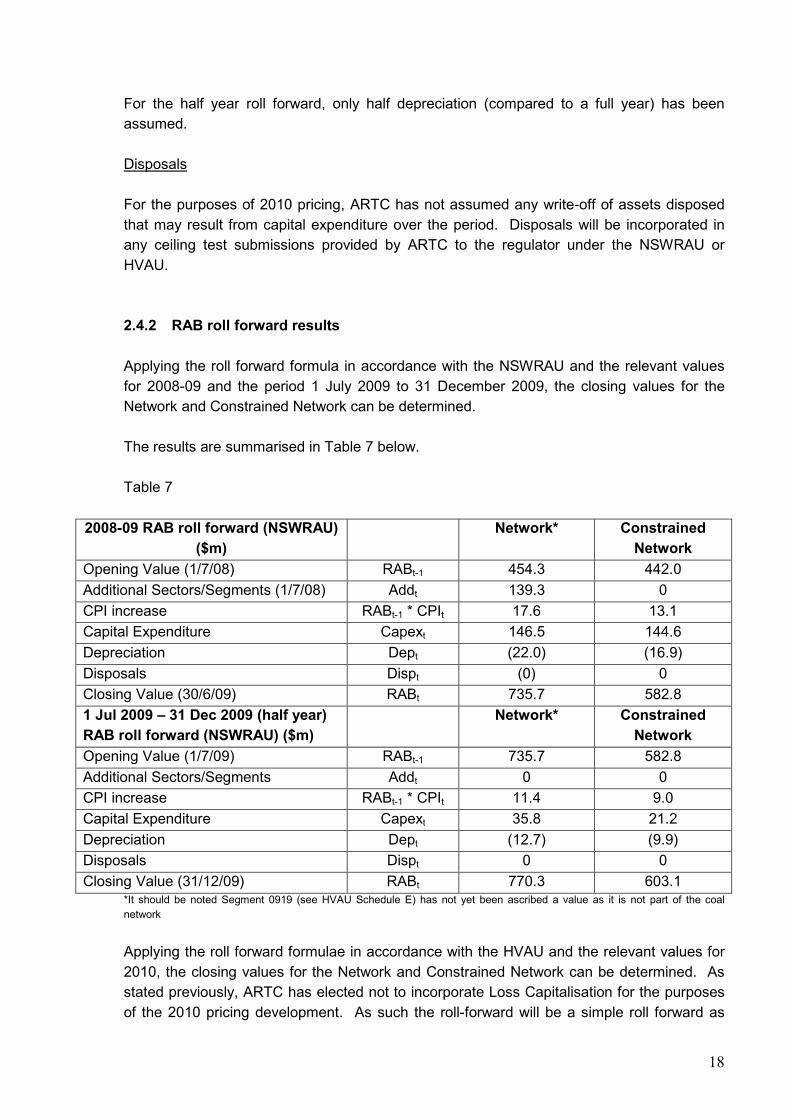
2.4.2 RAB roll forward results
Applying the roll forward formula in accordance with the NSWRAU and the relevant values
for 2008-09 and the period 1 July 2009 to 31 December 2009, the closing values for the
Network and Constrained Network can be determined.
The results are summarised in Table 7 below.
Table 7
2008-09 RAB roll forward (NSWRAU)
($m)
Network* Constrained
Network
Opening Value (1/7/08) RABt-1 454.3 442.0
Additional Sectors/Segments (1/7/08) Addt 139.3 0
CPI increase RABt-1 * CPIt 17.6 13.1
Capital Expenditure Capext 146.5 144.6
Depreciation Dept (22.0) (16.9)
Disposals Dispt (0) 0
Closing Value (30/6/09) RABt 735.7 582.8
1 Jul 2009 – 31 Dec 2009 (half year)
RAB roll forward (NSWRAU) ($m)
Network* Constrained
Network
Opening Value (1/7/09) RABt-1 735.7 582.8
Additional Sectors/Segments Addt 0 0
CPI increase RABt-1 * CPIt 11.4 9.0
Capital Expenditure Capext 35.8 21.2
Depreciation Dept (12.7) (9.9)
Disposals Dispt 0 0
Closing Value (31/12/09) RABt 770.3 603.1 *It should be noted Segment 0919 (see HVAU Schedule E) has not yet been ascribed a value as it is not part of the coal
network
Applying the roll forward formulae in accordance with the HVAU and the relevant values for
2010, the closing values for the Network and Constrained Network can be determined. As
stated previously, ARTC has elected not to incorporate Loss Capitalisation for the purposes
of the 2010 pricing development. As such the roll-forward will be a simple roll forward as
19
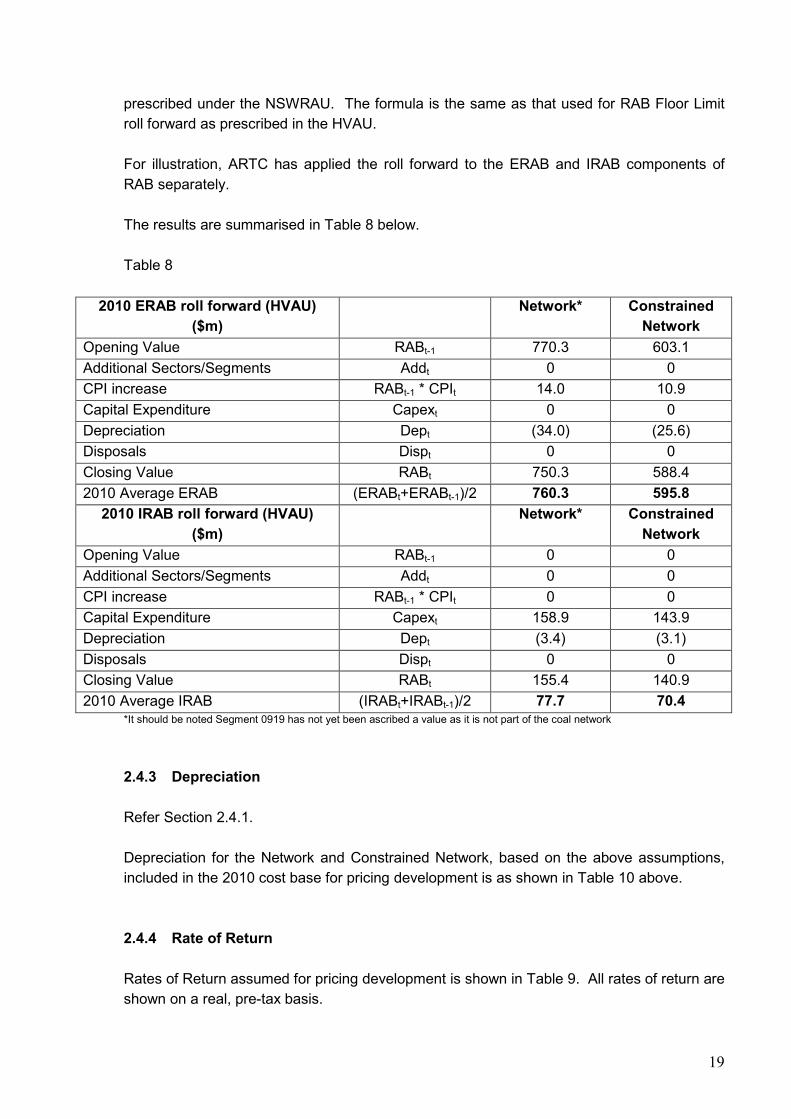
prescribed under the NSWRAU. The formula is the same as that used for RAB Floor Limit
roll forward as prescribed in the HVAU.
For illustration, ARTC has applied the roll forward to the ERAB and IRAB components of
RAB separately.
The results are summarised in Table 8 below.
Table 8
2010 ERAB roll forward (HVAU)
($m)
Network* Constrained
Network
Opening Value RABt-1 770.3 603.1
Additional Sectors/Segments Addt 0 0
CPI increase RABt-1 * CPIt 14.0 10.9
Capital Expenditure Capext 0 0
Depreciation Dept (34.0) (25.6)
Disposals Dispt 0 0
Closing Value RABt 750.3 588.4
2010 Average ERAB (ERABt+ERABt-1)/2 760.3 595.8
2010 IRAB roll forward (HVAU)
($m)
Network* Constrained
Network
Opening Value RABt-1 0 0
Additional Sectors/Segments Addt 0 0
CPI increase RABt-1 * CPIt 0 0
Capital Expenditure Capext 158.9 143.9
Depreciation Dept (3.4) (3.1)
Disposals Dispt 0 0
Closing Value RABt 155.4 140.9
2010 Average IRAB (IRABt+IRABt-1)/2 77.7 70.4 *It should be noted Segment 0919 has not yet been ascribed a value as it is not part of the coal network
2.4.3 Depreciation
Refer Section 2.4.1.
Depreciation for the Network and Constrained Network, based on the above assumptions,
included in the 2010 cost base for pricing development is as shown in Table 10 above.
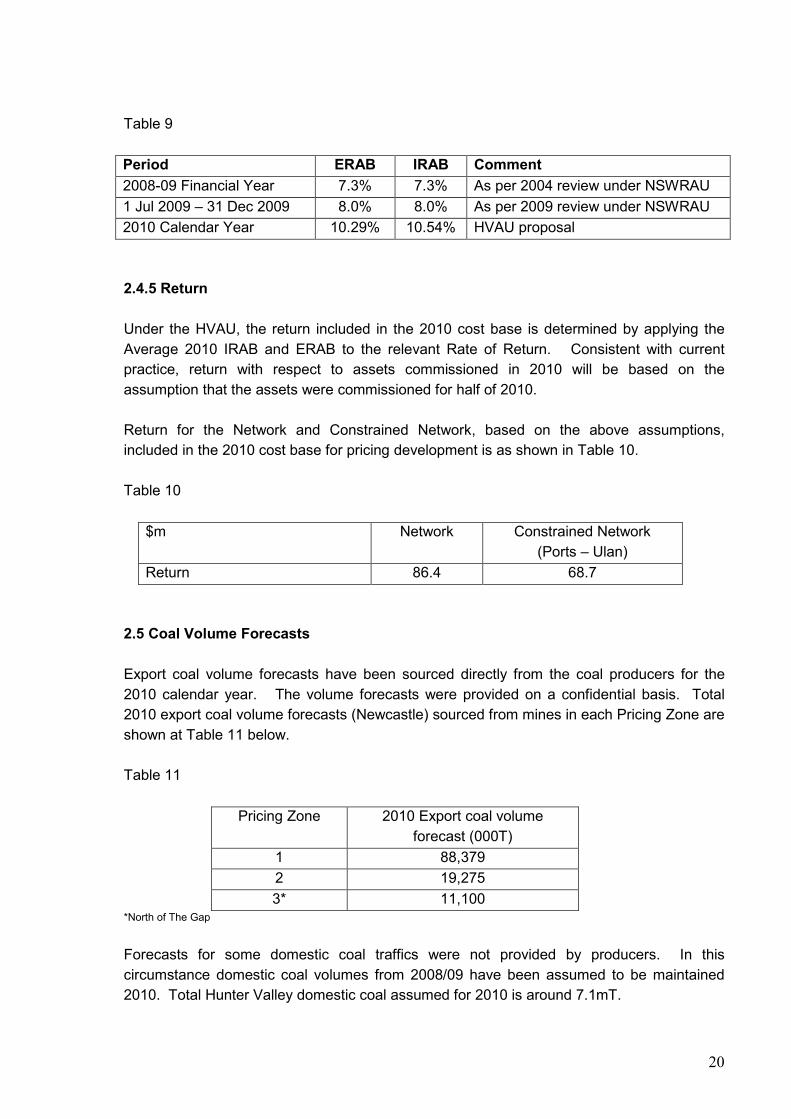
2.4.4 Rate of Return
Rates of Return assumed for pricing development is shown in Table 9. All rates of return are
shown on a real, pre-tax basis.
20
Table 9
Period ERAB IRAB Comment
2008-09 Financial Year 7.3% 7.3% As per 2004 review under NSWRAU
1 Jul 2009 – 31 Dec 2009 8.0% 8.0% As per 2009 review under NSWRAU
2010 Calendar Year 10.29% 10.54% HVAU proposal
2.4.5 Return
Under the HVAU, the return included in the 2010 cost base is determined by applying the
Average 2010 IRAB and ERAB to the relevant Rate of Return. Consistent with current
practice, return with respect to assets commissioned in 2010 will be based on the
assumption that the assets were commissioned for half of 2010.
Return for the Network and Constrained Network, based on the above assumptions,
included in the 2010 cost base for pricing development is as shown in Table 10.
Table 10
$m Network Constrained Network
(Ports – Ulan)
Return 86.4 68.7
2.5 Coal Volume Forecasts
Export coal volume forecasts have been sourced directly from the coal producers for the
2010 calendar year. The volume forecasts were provided on a confidential basis. Total
2010 export coal volume forecasts (Newcastle) sourced from mines in each Pricing Zone are
shown at Table 11 below.
Table 11
Pricing Zone 2010 Export coal volume
forecast (000T)
1 88,379
2 19,275
3* 11,100 *North of The Gap
Forecasts for some domestic coal traffics were not provided by producers. In this
circumstance domestic coal volumes from 2008/09 have been assumed to be maintained
2010. Total Hunter Valley domestic coal assumed for 2010 is around 7.1mT.
21
Forecasts for other export coal volumes that utilise the Network (but sources from mines, or
going to ports, outside the Network) total around 5.9mT.
As stated earlier, the total of volumes provided by producers may exceed average port and
coal chain capacity for that year. As such, it is possible that volumes finally contracted and
achieved for 2010 will be less than that which has been assumed for development of 2010
IIACs.
ARTC expects that final committed volumes will become clearer and better aligned to port
and coal chain capacity towards the latter half of 2009. As such, whilst the IIACs proposed at
this time are based on current volume forecasts, it is possible that these will change later in
2009, if there are material variations in volumes committed.
Providing for this flexibility during consultation may mitigate the possibility of substantial
under-recovery of access revenue during 2010 and a large under at the end of the year to be
recovered from relevant producers.
2.6 Non-coal volume forecasts
ARTC has developed assumptions in relation to 2010 non-coal freight and passenger
volumes and trains based on the existing level of operations and assumptions with respect
to expected 2010 volume growth in each of the relevant markets.
2.7 The Ceiling Test & Setting Interim Indicative Access Charges
As stated earlier, ARTC has sought to develop pricing which will, among other objectives,
minimise the likelihood of a substantial under or over arising following the annual ACCC
compliance assessment to be conducted following the completion of the 2010 calendar year.
In order to do this, ARTC has determined a forecast 2010 cost base against which a set of
prices can be tested, adopting the combinatorial stand alone approach proposed in the
HVAU. This approach and methodology/modelling used for the test are, by and large, the
same as that currently used under the NSWRAU.
As actual outcomes can deviate from forecast assumptions in relation to volumes, operating
expenditure and capital expenditure, a substantial under or over at the end of 2010 could
arise in any event.
2.7.1 Constrained Group of Mines and Constrained Network
The nature of the combinatorial, stand alone ceiling test (as proposed in the HVAU and
currently used under the NSWRAU) is such that it is required to test a range of combinations
of Access Holders to ensure that the ceiling test is satisfied for all of those combinations.
22
For each combination, the practical test is to ensure that pricing for all traffics operated by
any combination of Access Holders generates revenue that does not exceed the Economic
Cost of the Segments utilised by those traffics, on a stand-alone basis (as if those traffics
where operated in isolation).
Given the number of Access Holders involved, the number of combinations is extremely
large and likely to be beyond the capability of many standard computational resources (such
as spreadsheets). However, the experience obtained by ARTC and its predecessor)
through operating the combinatorial, ceiling test as part of annual compliance assessments
over a number of years has informed that only a relatively few number of combinations will
result in revenue that is near stand alone Economic Cost for that combination. The vast
majority of combinations (such as combinations of only a few Access Holders) result in
revenue that is only a fraction of stand alone Economic Cost for the combination.
The combinations that result in revenue somewhere near stand alone Economic Cost for the
combination include combinations of close to all Access Holders. In practice, testing of
combinations is more about removing from the combination of all traffics operated by Access
Holders, some traffics often operating near the extremity of the Network.
This approach will result in revenue for a particular combination of coal traffics that is nearest
to, or exceeds, the Economic Cost of the Segments used by that combination. Revenue for
this combination of traffics must be no more than the relevant Economic Cost or revenue
(and prices) is therefore constrained. This combination is known as the Constrained Group
of Mines and the Segments covered by the Constrained Group of Mines forms the
Constrained Network. Revenue and pricing for all coal traffic occurring entirely within the
Constrained Network is constrained to the Economic Cost of the Constrained Network. This
would include any coal traffic from mines within the Constrained Network to the Newcastle
ports (export), or to domestic coal destinations within the Constrained Network.
With the proposed IIACs, the Constrained Network forecast in 2010 is the same as that in
2007-08 (and expected in 2008-09). The Constrained Network includes Segments between
Newcastle Ports, Muswellbrook and Ulan. These Segments together form Pricing Zones 1
and 2 as defined in the HVAU. A listing of Segments forming the 2010 forecast Constrained
Network is shown at Attachment 3.
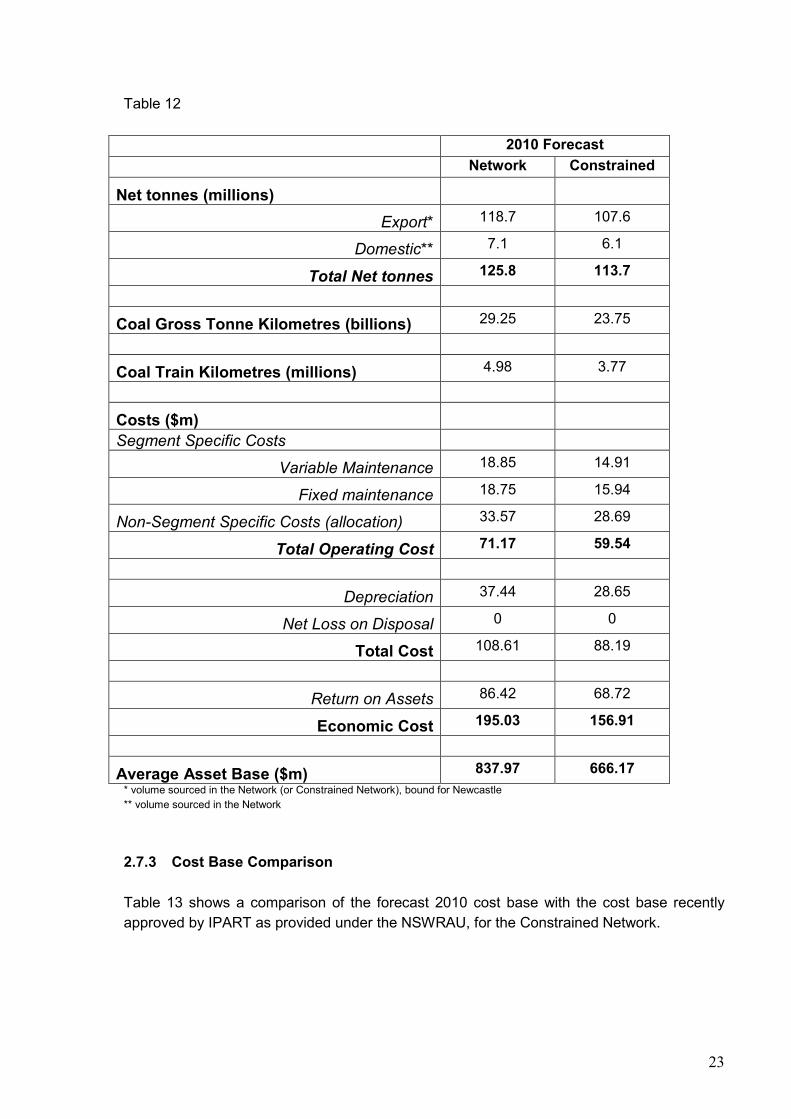
2.7.2 Forecast 2010 Cost Base
The forecast 2010 cost base established by ARTC for the purpose of setting 2010 pricing is
shown at Table 12 below.
23
Table 12
2010 Forecast
Network Constrained
Net tonnes (millions)
Export* 118.7 107.6
Domestic** 7.1 6.1
Total Net tonnes 125.8 113.7
Coal Gross Tonne Kilometres (billions) 29.25 23.75
Coal Train Kilometres (millions) 4.98 3.77
Costs ($m)
Segment Specific Costs
Variable Maintenance 18.85 14.91
Fixed maintenance 18.75 15.94
Non-Segment Specific Costs (allocation) 33.57 28.69
Total Operating Cost 71.17 59.54
Depreciation 37.44 28.65
Net Loss on Disposal 0 0
Total Cost 108.61 88.19
Return on Assets 86.42 68.72
Economic Cost 195.03 156.91
Average Asset Base ($m) 837.97 666.17
* volume sourced in the Network (or Constrained Network), bound for Newcastle
** volume sourced in the Network
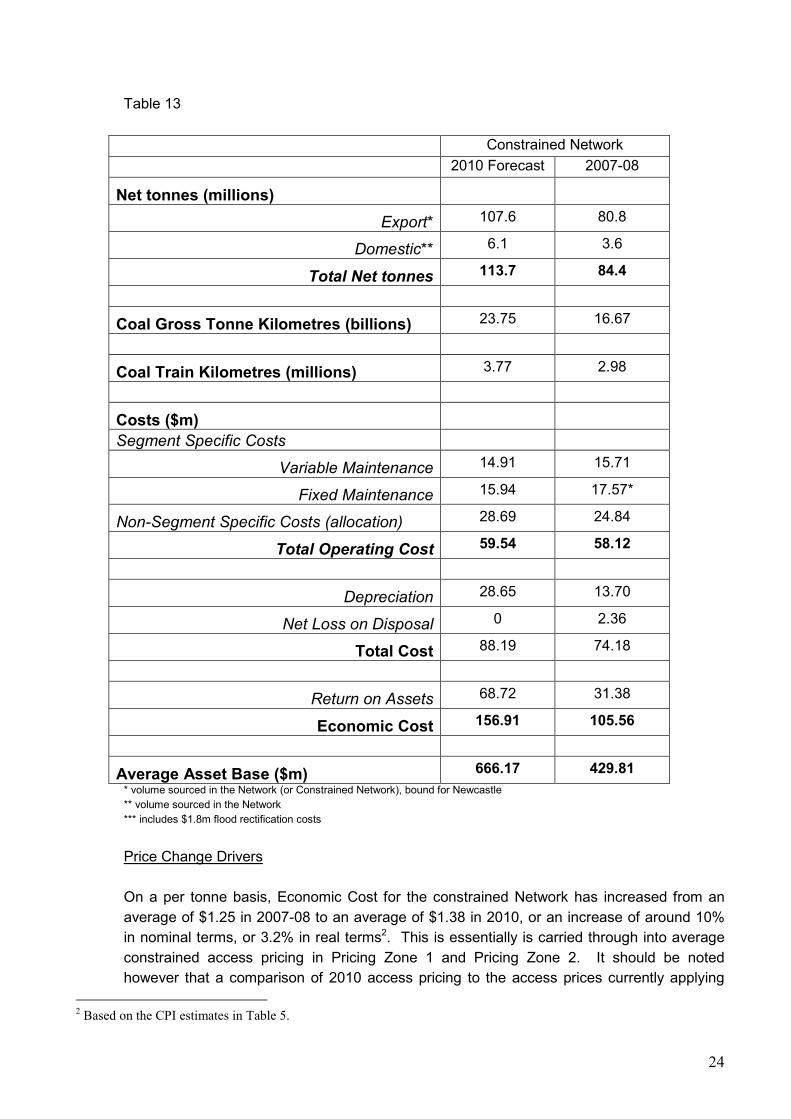
2.7.3 Cost Base Comparison
Table 13 shows a comparison of the forecast 2010 cost base with the cost base recently
approved by IPART as provided under the NSWRAU, for the Constrained Network.
24
Table 13
Constrained Network
2010 Forecast 2007-08
Net tonnes (millions)
Export* 107.6 80.8
Domestic** 6.1 3.6
Total Net tonnes 113.7 84.4
Coal Gross Tonne Kilometres (billions) 23.75 16.67
Coal Train Kilometres (millions) 3.77 2.98
Costs ($m)
Segment Specific Costs
Variable Maintenance 14.91 15.71
Fixed Maintenance 15.94 17.57*
Non-Segment Specific Costs (allocation) 28.69 24.84
Total Operating Cost 59.54 58.12
Depreciation 28.65 13.70
Net Loss on Disposal 0 2.36
Total Cost 88.19 74.18
Return on Assets 68.72 31.38
Economic Cost 156.91 105.56
Average Asset Base ($m) 666.17 429.81
* volume sourced in the Network (or Constrained Network), bound for Newcastle
** volume sourced in the Network
*** includes $1.8m flood rectification costs
Price Change Drivers
On a per tonne basis, Economic Cost for the constrained Network has increased from an
average of $1.25 in 2007-08 to an average of $1.38 in 2010, or an increase of around 10%
in nominal terms, or 3.2% in real terms2. This is essentially is carried through into average
constrained access pricing in Pricing Zone 1 and Pricing Zone 2. It should be noted
however that a comparison of 2010 access pricing to the access prices currently applying
2 Based on the CPI estimates in Table 5.
25
(effective 1 July 2009) show a general reduction in prices in Pricing Zone 1 and Pricing Zone
2 (see section 2.7.4 below). Key drivers of this change in average access pricing for the
constrained Network over this 2.5 year period are as follows.
• Return on Assets – Any increase in return is influenced by the level of investment in the
network over the 2.5 year period, as well as the higher Rate of Return that has been
proposed by ARTC. Over the 2.5 year period, the average RAB (average of opening
and closing RAB for the period) increased by $236.4m, or 55%.
• Depreciation – Under the HVAU, ARTC has proposed to base depreciation on an
estimate of remaining mine life proposed to be 20-24 years depending on Pricing Zone.
This compares to a remaining mine life applicable in 2007-08 under the NSWRAU of 32
years.
• Maintenance Expenditure (Segment Specific Cost) - Drivers of maintenance expenditure
include:
o network volumes (GTK);
o wages and materials inflation;
o productivity improvements; and
o network accessibility.
Over the 2.5 year period, constrained Network coal volume, in terms of GTK, increased
by 42%. With the volumes currently being hauled in the Hunter Valley, ARTC would
expect around 50% of maintenance expenditure to be variable with volume
Over the last 5 years, national wages inflation has averaged around 4%pa3.
A further common indicator in inflationary impacts on labour and materials impacts on
infrastructure maintenance is the Road and Bridge Construction Producer Price Index4.
The index has grown at an average 5.2%pa over the 4 years to June 2009. This is likely
to reflect significant materials cost increases in recent years (steel, concrete etc).
On a c/GTK basis, overall maintenance unit cost (including allocated overheads) has
decreased by around 30% from 0.19c/GTK to 0.13c/GTK over the 2.5 year period.
• Non-Segment Specific Cost (allocated)
As described in section 2.3.2 above, asset management expenditure is allocated to the
Network Segments on a GTK basis depending on the type and location of expenditure
incurred, whilst non-maintenance related expenditure (including network control, terminal
management, and corporate management and support expenditure) is allocated to
Network Segments on a train kilometre basis depending on the type and location of
3 Australian Bureau of Statistics, 6345.0 4 Australian Bureau of Statistics, 6427.0 (4121)
26
expenditure incurred. The amount of Non-Segment Specific Cost allocated to the
constrained Network has increased by 15% over the 2.5 year period between 2007-08
and 2010.
Drivers of Non-Segment Specific Cost allocated to the Network are normally:
o changes in Network volumes (GTK) and traffic (train kilometres) compared to
other parts of the ARTC network;
o wages inflation; and
o productivity improvements.
Coal GTK for the constrained Network is forecast to increase by 42% over the 2.5 year
period between 2007-08 and 2010. The compares to an average increase in GTK of 9%
over the same period for the remainder of the ARTC network, largely resulting from
reduced intermodal volumes over the last few years in line with economic circumstances.
Similarly, coal train kilometres in the constrained Network are forecast to increase by
26% over the 2.5 year period between 2007-08 and 2010, due to higher coal volume.
This compares to an average increase in train kilometres of only 15% over the same
period for the remainder of the ARTC’s network.
The combined effect of these changes in activity would see an increase in expenditure
allocated to the constrained network.
In addition to this, as stated earlier, over the last 5 years, national wages inflation has
averaged around 4% pa. Over a 2.5 year period this could increase unit labour cost by
around 10%.
As a result, ARTC would see an increase in Non-Segment Specific Cost allocated to the
constrained network of around 15% as reasonable in these circumstances. On a unit
volume or activity basis, the allocated cost has fallen.
2.7.4 Determining Interim Indicative Access Charges
The HVAU Pricing Principles serve to constrain revenue in the Constrained Network (Pricing
Zones 1 and 2). Within this constraint, the HVAU permits some flexibility in developing
pricing for Coal Access Rights generally and IIACs specifically.
ARTC considerations under the HVAU
In determining the proposed IIACs, ARTC has taken into account a range of considerations,
many of which are provided for by the Pricing Principles of the HVAU. Relevant
considerations are as follows.
• IIACs are structured as a non-TOP component and a TOP component.
27
• Both the non-TOP component and the TOP component of IIACs are based on GTKs
based, with the non-TOP component varying with actual GTK and the TOP component
determined based on forecast GTK.
• IIACs are specified for Interim Indicative Services in each Pricing Zone.
• The variable component of costs (VCC) being Direct Costs will be recovered through the
non-TOP component of IIACs.
• Maximum recovery of fixed and new capital components of costs (FCC and NCC) is an
objective. To this end, IIACs should be set such that revenue closely matches the
Ceiling Limit for the Constrained Network. Otherwise, IIACs should be such that revenue
is maximised in the circumstances.
• The TOP component of IIACs should aim to recover all of NCC and some or all of FCC
(which should otherwise be recovered through the non-TOP component of IIACs).
• The proportion of FCC recovered through the TOP component of IIACs should be
applied consistently to all Access Holders holding Coal Access Rights in a Pricing Zone.
• Differentiation between IIACs should have regard to the range of factors specified in
section 4.14 and 4.15 of the HVAU.
Other ARTC considerations
Other relevant considerations not explicitly provided for in the Pricing Principles of the HVAU
are as follows.
• A commitment made to the industry in a letter dated 6 June 2009 that ARTC would not
differentiate access pricing (on a per GTK basis) for 74 or 91 wagon coal services
operated with maximum axle load of 30T for the next 5 years.
• Avoidance of price shocks for the industry as a result of the introduction of IIACs in 2010.
That is, seeking to achieve IIACs that are consistent with the existing level of pricing for
Hunter Valley coal in the first instance is seen as desirable.
Resulting characteristics of the Interim Indicative access Charges
Following its consideration of all of the above, the proposed IIACs have the following
characteristics.
• IIACs have been proposed for each Interim Indicative Service prescribed in the table at
section 4.16(e) of the HVAU.
28
• The proposed IIACs will result in revenue that closely matches the Ceiling Limits at
section 4.2 of the HVAU, subject to the volume and cost assumptions described above.
Specifically, if the IIACs were applied to all constrained traffic operated in the
Constrained Network, the resulting revenue does not exceed the Economic Cost of the
Constrained Network.
• Revenue arising from the application of the proposed IIACs in Pricing Zone 3 falls well
short of the Economic Cost of Zone 3.
• In all Pricing Zones, the non-TOP component of the proposed IIACs is aligned to VCC.
In other words, ARTC has not sought to recover any part of FCC through the non-TOP
component of the proposed IIACs in any Pricing Zone. This is consistent with the Pricing
Objectives at section 4.12(b) of the HVAU. The proportion of the proposed IIACs
represented by the non-TOP component ranges between 5% and 15% depending on the
Pricing Zone.
• Consistent with section 4.12(b)(iv) of the HVAU, the proportion of FCC recovered
through the TOP component of proposed IIACs is consistently applied to all Access
Holders holding Coal Access Rights with a Pricing Zone.
• Consistent with section 4.15(b) of the HVAU, the proposed IIACs satisfy the limits on
pricing differentiation.
• Consistent with its commitment to the industry in a letter dated 6 June 2009, the
proposed IIACs are identical for Interim Indicative Services 1 and 2 in Pricing Zone 1,
and also in Pricing Zone 2. These services are not currently operated in Pricing Zone 3.
• The proposed IIAC for Interim Indicative Service 3 (25 Tonne axle load) in Pricing Zone 1
is identical to the proposed IIACs for Interim Indicative Services 1 and 2 in Pricing Zone
1. The higher Gross:Nett ratio for Interim Indicative Service 3 would imply that the cost
of access (on a per tonne basis) is higher. ARTC considers this is reasonable and within
reasonable scope of charge differentiation proposed at section 4.14 of the HVAU. ARTC
has not, at this time, elected to differentiate pricing for this indicative service type on any
other basis.
• ARTC has sought to propose IIACs for Pricing Zone 1 and 2 where the TOP component
of the IIACs is very close. This could be expected to give rise to pricing that is closely
aligned to the distance from Newcastle ports of loading points in Pricing Zones 1 and 2.
• As the proposed IIACs apply to all Coal Access Rights with Interim Indicative Service
characteristics on the Network, there is no differentiation between any type of coal, nor
between export and domestic coal carried by Interim Indicative services.
• ARTC has sought to propose IIACs for Interim Indicative Services in 2010 such that
differences in 2010 pricing for Coal Access Rights with Interim Indicative Service
29
characteristics operating within Pricing Zones 1 and 2, and current access pricing for the
same services is minimal (on a per tonne basis).
In developing the IIACs for Coal Access Rights with Interim Indicative Service
characteristics operating from Pricing Zone 3, ARTC has reduced the TOP component
from what would required to recover VCC and NCC to a level such that any difference to
current access pricing for these services is minimal (on a per tonne basis).
ARTC has done this so that introduction of the IIACs under the HVAU in 2010 does not
create substantial price shocks for Access Holders in that year.
Due to the confidential nature of current pricing, ARTC is unable to provide a detailed
traffic by traffic comparison of proposed IIACs and current pricing.
In Pricing Zone 1 and Pricing Zone 2, variations in access pricing (on a per tonne basis)
for Coal Access Rights with Interim Indicative Service characteristics range from a 15%
reduction in price to a 12% increase in price, with reduced access pricing for nearly 80%
of such services, and 83% of coal volume hauled by such services. For these services
there is no increase greater than 5c/tonne.
The adjustments result primarily from a shift to consistent distance based pricing in these
Pricing Zones.
In Pricing Zone 3, the proposed IIACs will not result in pricing for any unconstrained
traffic increasing by more than 3%. It should also be noted that the proposed IIACs in
Pricing Zone 3 do not generate sufficient revenue to recover the Economic Cost of that
part of the Network. As such the proposed IIACs should be taken as being subject to the
endorsement by the ACCC of the Loss Capitalisation approach proposed by ARTC as
described at section 4.3 of the HVAU.
For other unconstrained traffics with Interim Indicative Services characteristics that
operate for part of their journey on the Network, the IIACs result in reduced cost of
access for that part of the journey on the Network. It should be noted that additional
charges for such traffics will apply to the remainder of journeys on the ARTC network but
not on the Network.
It should be noted that the proposed IIACs have been developed in the context of
information available to ARTC at the present time. Specifically, 2010 volume forecasts
were provided to ARTC for almost all traffics in July 2009. ARTC is presently working
with the industry to finalise contractual arrangements prior to commencement of the new
commercial framework expected on 1 January 2010.
30
3. EXCESS NETWORK OCCUPANCY COMPONENT ALLOWANCES
3.1 Proposed Allowances
Section 4.11 of the HVAU provides for the structure of Charges for Non-Coal Access Rights
to include an excess network occupancy component (ENOC).
ARTC is seeking to identify relative consumption of capacity by usage outside of standard
path prescription, and to better match this with relativity in pricing.
ARTC’s objective is to encourage efficient utilisation and rationing of Network capacity, so as
to provide better signals for future investment in Network capacity.
ARTC recognises that in order to meet end market or above rail operational requirements,
an Applicant may seek to incorporate time in the schedule for a Train Path that is in excess
of a reasonable and normal allowance for above rail activities required to operate Trains.
Additional time occupying the Network consumes greater Capacity. In order to better reflect,
in pricing, the consumption of Capacity on the Network of Train Paths designed to meet an
Applicant’s specific needs by taking more time than a normal allowance for above rail
activities, an ENOC is proposed to be included in Charges for Non-Coal Access Rights.
The ENOC that may be applied to a Train Path will be charged on the basis of any hour (or
part thereof) of time allowed in the schedule for the Train Path, in a Pricing Zone, in excess
of:
• section run times for the applicable train service type
• dwells for crossing and passing other Trains, and,
• a specified allowance for reasonable above rail operating requirements.
The excess network occupancy component of pricing will be applied to a scheduled path
only (irrespective of whether the path is used). It does not relate to actual usage of the
path or the actual running of a train on the path on a particular day. As such, it is
entirely up to the Applicant, at the time of negotiation a Train Path, whether or not excess
time, which will attract an ENOC, is incorporated into the Train Path.
Effectively, the ‘base transit time’ (to which the flagfall component of the Charge applies) =
Section run times for the applicable flagfall category
plus Dwells for crossing/passing other trains
plus A specified corridor allowance for above reasonable above-rail activities.
31
The excess network occupancy component of pricing only applies to operator requests for
excess time on the network eg time in excess of standard section run times and time in
excess of specified above-rail allowances. Time on the network includes time on the
mainline or in loops, all of which impact on capacity. It does relate to time spent off the
network.
Application of the excess network occupancy component of pricing does not relate to
schedules with excessive transit times due to unavailability of a better path.
ARTC has sought to align the approach and methodology to ENOC with that currently used
by ARTC on the network covered by ARTC’s Interstate Access Undertaking endorsed by the
ACCC.
3.2 Determination of Allowance
Corridor allowances for reasonable above-rail activities have been determined following
review of existing allowances in schedules for normal activities such as crew changing, loco
fuelling etc. The allowances proposed by ARTC (and to be incorporated in the HVAU) are
detailed in Table 14 below.
Table 14
Pricing Zone Allowance for reasonable requirements for
operational activities (hour or part thereof)
Pricing Zone 1 0.0
Pricing Zone 2 0.0
Pricing Zone 3 0.16
ARTC’s review of existing allowances in schedules for Non-Coal Access Rights on the
Network show there is no evidence of time in schedules required for operational activities in
Pricing Zone 1 and pricing Zone 2. ARTC has also noted, and reflected in its proposal for
Pricing Zone 3, that some schedules incorporate a 10 minute allowance for operational
activities.
3.3 Determination of ENOC
Where an Applicant seeks to incorporate an allowance in a schedule that will attract an
ENOC, ARTC will determine the ENOC by pro-rating back the flagfall component of the
Charge for the particular service type in a Pricing Zone to an amount per hour by reference
to the total of section running times applicable in a Pricing Zone. To aid understanding, an
example is provided below.
32
Example
An applicant seeks to incorporate excess time into a schedule for, say, a crew change of 30
minutes in Pricing Zone 3. For the particular type of service sought, the flagfall component
of the applicable Charge is $100 in Pricing Zone 3, and the total of Pricing Zone 3 section
running times is 2 hours 30 minutes in the up direction and 2 hours 40 minutes in the down
direction.
ARTC would determine ENOC (on a per hour basis) as follows:
ENOC (per hour) = Flagfall / Average of up and down transit
= $100 / ((2 hr 20 m + 2 hr 40 m)/2)
= $100 / 2.5 hours
= $40 per hour or part thereof.
The Applicant is seeking 20 minutes in excess of the allowance for Pricing Zone 3, and so
the schedule sought by the Applicant will attract an ENOC of $40. The ENOC is part of the
Charge for the contracted Train Path, similar to the flagfall component and, like the flagfall
component, will be applied to the contracted Train Path irrespective of whether the Train
Path is utilised.
33
ATTACHMENT 1
1 July 2008 OPENING RAB VALUE ASSUMPTIONS
Segment
CodeSector
Opening
1 July 2008
RAB Value ($)401 Dartbrook Jct To Werris Creek 135,083,896
402 Werric Creek To The Gap 4,246,443
915 Islington Jct To Scholey St Jct 1,700,840
916 Scholey St Jct To Port Waratah 7,978,794
917 Scholey St Jct To Waratah (Via Coal) 2,957,324
919 Morandoo & Bullock Island*
925 Waratah To Hanbury Jct (Via Coal) 3,483,436
926 Hanbury Jct To Sandgate (Via Coal) 2,716,449
927 Hanbury Jct To Kooragang East Jct 1,634,583
930 Kooragang East Jct To Kooragang Island 18,981,847
931 Kooragang East Jct To Sandgate 619,166
936 Sandgate To Thornton (Via Coal)** 96,139,739
937 Thornton To Maitland (Via Coal) 24,048,404
944 Telarah To Farley 1,146,034
946 Maitland To Farley 3,239,707
947 Farley To Branxton 27,360,089
948 Branxton To Whittingham 38,052,535
951 Whittingham To Saxonvale Jct 5,626,514
952 Saxonvale Jct To Mount Thorley 2,178,722
955 Whittingham To Camberwell Jct 28,889,097
956 Camberwell Jct To Glennies Creek 9,914,177
957 Glennies Creek To Newdell Jct 12,891,039
958 Newdell Jct To Draytons Jct 12,587,047
959 Newdell Branch 4,001,926
961 Draytons Jct To Muswellbrook 26,673,011
962 Muswellbrook To Dartbrook Jct 7,734,943
970 Muswellbrook To Bengalla Jct 6,528,661
971/972 Bengalla Jct To Sandy Hollow Jct 27,849,810973/974 Sandy Hollow Jct To Ulan Colliery Jct 79,327,359
593,591,592
*No value ascribed at this stage, not part of coal network
** Includes Sandgate Flyover
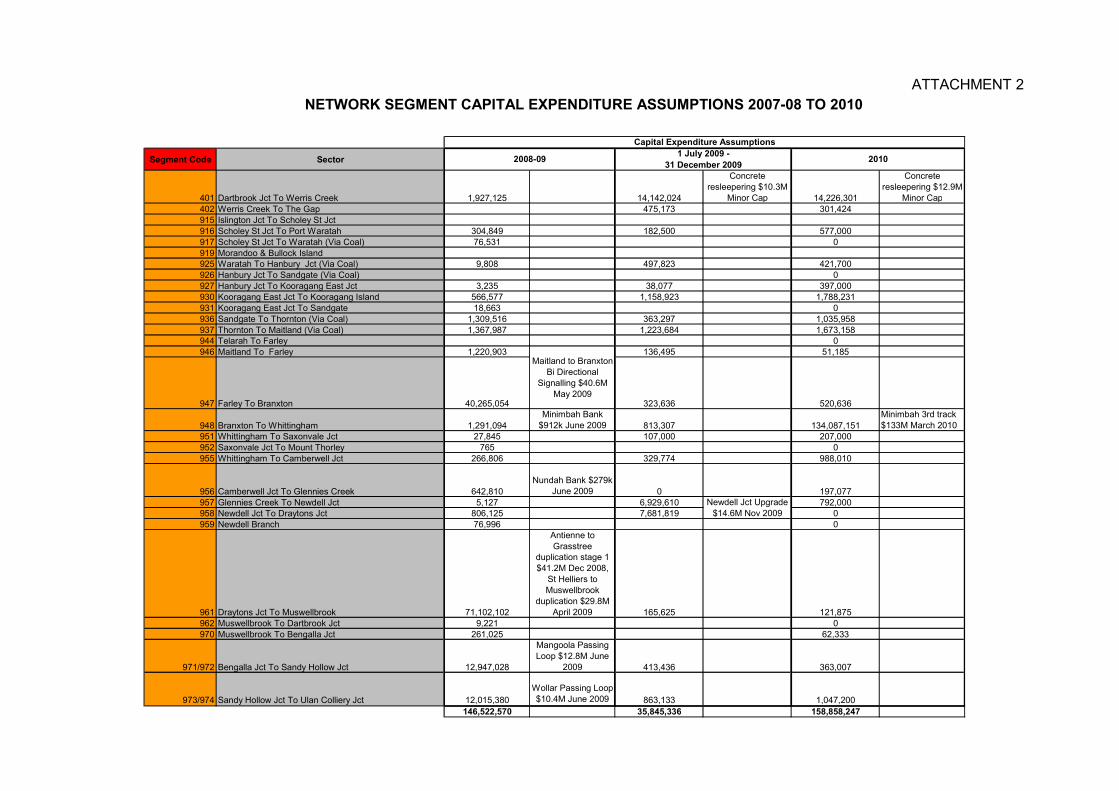
ATTACHMENT 2
NETWORK SEGMENT CAPITAL EXPENDITURE ASSUMPTIONS 2007-08 TO 2010
Segment Code Sector
401 Dartbrook Jct To Werris Creek 1,927,125 14,142,024
Concrete
resleepering $10.3M
Minor Cap 14,226,301
Concrete
resleepering $12.9M
Minor Cap
402 Werris Creek To The Gap 475,173 301,424
915 Islington Jct To Scholey St Jct
916 Scholey St Jct To Port Waratah 304,849 182,500 577,000
917 Scholey St Jct To Waratah (Via Coal) 76,531 0
919 Morandoo & Bullock Island925 Waratah To Hanbury Jct (Via Coal) 9,808 497,823 421,700
926 Hanbury Jct To Sandgate (Via Coal) 0
927 Hanbury Jct To Kooragang East Jct 3,235 38,077 397,000
930 Kooragang East Jct To Kooragang Island 566,577 1,158,923 1,788,231
931 Kooragang East Jct To Sandgate 18,663 0
936 Sandgate To Thornton (Via Coal) 1,309,516 363,297 1,035,958
937 Thornton To Maitland (Via Coal) 1,367,987 1,223,684 1,673,158944 Telarah To Farley 0
946 Maitland To Farley 1,220,903 136,495 51,185
947 Farley To Branxton 40,265,054 323,636 520,636
948 Branxton To Whittingham 1,291,094
Minimbah Bank
$912k June 2009 813,307 134,087,151
Minimbah 3rd track
$133M March 2010
951 Whittingham To Saxonvale Jct 27,845 107,000 207,000
952 Saxonvale Jct To Mount Thorley 765 0
955 Whittingham To Camberwell Jct 266,806 329,774 988,010
956 Camberwell Jct To Glennies Creek 642,810
Nundah Bank $279k
June 2009 0 197,077
957 Glennies Creek To Newdell Jct 5,127 6,929,610 792,000958 Newdell Jct To Draytons Jct 806,125 7,681,819 0
959 Newdell Branch 76,996 0
961 Draytons Jct To Muswellbrook 71,102,102
Antienne to
Grasstree duplication stage 1
$41.2M Dec 2008,
St Helliers to
Muswellbrook
duplication $29.8M
April 2009 165,625 121,875
962 Muswellbrook To Dartbrook Jct 9,221 0
970 Muswellbrook To Bengalla Jct 261,025 62,333
971/972 Bengalla Jct To Sandy Hollow Jct 12,947,028
Mangoola Passing
Loop $12.8M June
2009 413,436 363,007
973/974 Sandy Hollow Jct To Ulan Colliery Jct 12,015,380
Wollar Passing Loop
$10.4M June 2009 863,133 1,047,200
146,522,570 35,845,336 158,858,247
Newdell Jct Upgrade
$14.6M Nov 2009
Maitland to Branxton
Bi Directional
Signalling $40.6M
May 2009
Capital Expenditure Assumptions
2008-091 July 2009 -
31 December 20092010


![AUSTRALIAN COMPETITION AND CONSUMER COMMISSION … Interstate Network - 201… · 35570130_10 ARTC Interstate Access Undertaking [ ] 2018 PART 1 ACCESS UNDERTAKING dated 2018 BY AUSTRALIAN](https://img.pdfslide.us/doc/110x75/5fa2463fa3197f762c5ce1a4/australian-competition-and-consumer-commission-interstate-network-201-3557013010.jpg)