Embed Size (px)
Citation preview

ARSENIC IN FOOD CHAIN: REMEDIAL POSSIBILITIES
S.M. Imamul Huq1, Ray Correll2, Ravi Naidu3, J.C. Joardar1, Marzia B.Abdulalh1 and Umme K.Shila 1
1Department of Soil, Water & Environment, University of Dhaka, Dhaka-1000, Bangladesh; 2CMIS, CSIRO, Adelaide, Australia, 3University of South Australia, Adelaide, Australia

Our hypothesis is that water-soil-crop-food transfer, cooking water and the direct ingestion of contaminated water are the three major exposure pathways to As

RationaleHigh yielding variety (HYV) rice
cultivation is encouraged-cereal production increased from 11 m t in 1975 to 25 m t in 2004.
HYV cultivation mostly needs irrigation water
85% of total groundwater withdrawn is utilized in agricultural sector
Most groundwater is contaminated with Arsenic

Rationale-contd.~ 40% of the NCA is under irrigation –
Boro Rice, Wheat, Vegetables need irrigation
~20% crop loss has been reported due to high arsenic concentration in growth medium
Boro rice accounts for about 37% of total rice production in Bangladesh

METHODOLOGYFAMILY
INDIVIDUALAGRI FIELD
SymptomsNUTRIOTIOANAL STATUSQUANTITY OF DRINKING WATER
QUANTITY OF FOOD
FOOD HABITINCOME/MONTH
WATERSOILPLANTS/VEGETABLEGRAINSGPS
FOOD CHAINTRANSFER PATHWAYNUTRITIONSYMTOMS
REMEDIATION
COOKING WATER QUALITYCOOKED FOODUNCOOKED FOODVEGETABLE FROM KITCHEN GARDENDRINKING THROUGH FOODDRINKING WATER SOURCESOIL FROM KITCHEN GARDEN
AR
SE
NIC
ARSENIC
ARSENIC
GENERAL

Dietary intake was assessed by surveying the food consumption of villagers. A questionnaire was developed that included a list of all the dietary components
Overall 60 households from 3 districts were interviewed in the initial survey
A subsequent survey interviewed an additional 255 households from 30 villages
Over 100 food types were recorded
The two most important components were drinking water and cooking water, followed by rice and other vegetables

• To assess the contribution of As-contaminated water to the cooked rice (Bhat), a laboratory experiment was carried out with 13 different rice samples procured from a local wholesale market.
• All the rice samples showed levels of As below the detection level of the machine (2 g/kg).
• 5.0 g each of the rice samples were cooked in the laboratory by two conventional methods;
• Method I – 50 ml water and rice were cooked so that all the water is absorbed by the rice by the time it is well cooked (Bhat);
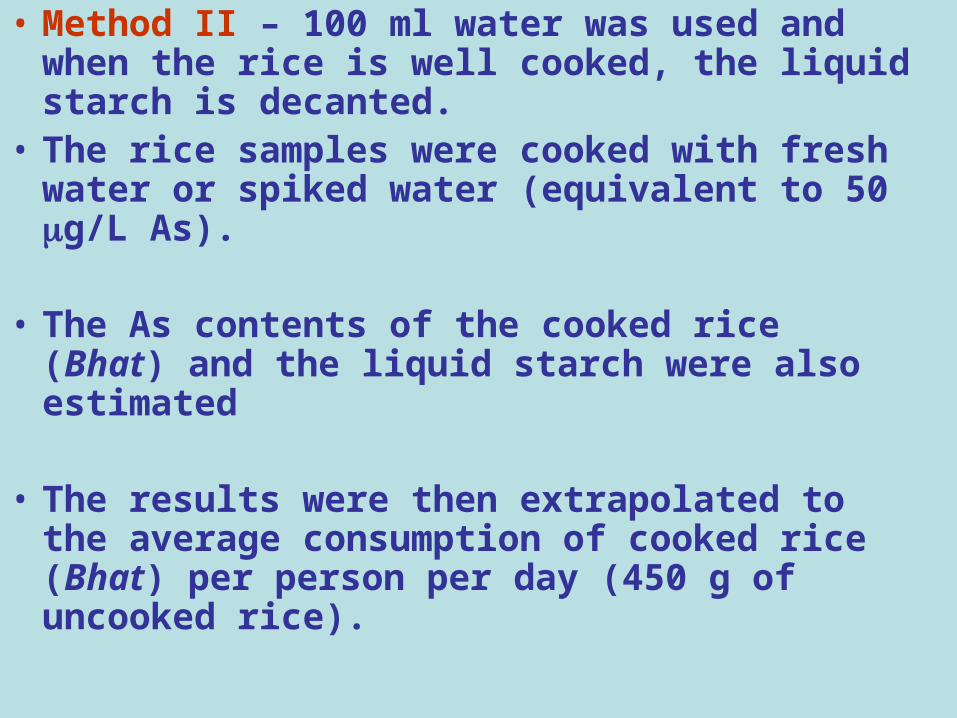
• Method II – 100 ml water was used and when the rice is well cooked, the liquid starch is decanted.
• The rice samples were cooked with fresh water or spiked water (equivalent to 50 g/L As).
• The As contents of the cooked rice (Bhat) and the liquid starch were also estimated
• The results were then extrapolated to the average consumption of cooked rice (Bhat) per person per day (450 g of uncooked rice).

• The basic model for the daily arsenic load LW from water was
sum of drinking and cooking water sources
• The basic model for the daily arsenic load LF of food was
iicookingdrinkingiiW acwL
_,
iii
iiF acmwL typesfood
1

• The total daily arsenic load L was simply the sum of arsenic load from water and food
• where wi is the daily intake of the ith food type, mi the moisture content , ci the arsenic concentration and ai the bioavailability. The distribution of each wi was calculated as the product of a binomial distribution, indicating whether that food was eaten on that day, multiplied by a lognormal distribution fitted to the data obtained from the diet survey. The concentration was modelled using a lognormal distribution. The moisture content and bioavailability were modelled using a Beta distribution.
FW LLL

Scenario 1: typical diet + safe water• As safe drinking-water in conjunction with a typical diet is
considered. Water near the maximum value within the Bangladesh guideline of 0.05 mg/L–1 was chosen, a standard error of 0.02 mg/L–1 was allowed. It was assumed that the cooking water is gathered from surface water because that is known to have a low As content and biological contaminants would be destroyed in the cooking process
• Food consumption and the As content of food are assumed to be some average values, but with the As content of 0.25 mg/kg–1
• The simulations show the mean As load of the average villager is 161 μg/day–1, with 104 μg/day coming from the water. Of the remaining 57 μg/day–1, 49 μg/day–1 came from rice and 8 μg/day–1 from vegetables
• In this scenario there was less than 1% chance of exceeding the 220 μg/day–1 guideline

Scenario 2: typical food + 3 L drinking-water
This scenario differs from Scenario 1
in that the drinking-water consumption
is assumed to be 3 L/ day – a very
reasonable scenario in the hot weather
of Bangladesh.
The average load was then 212
μg/day–1 with a 6% chance of
exceeding the 220 μg/day–1 limit.

Scenario 3: typical food + 3 L good drinking-water
In this scenario, very good water (As
content 0.005 mg/L–1) is considered
The food (including rice) is assumed to be
typical with the same distribution as in
Scenario 2
Under these conditions As load does not
present a risk.
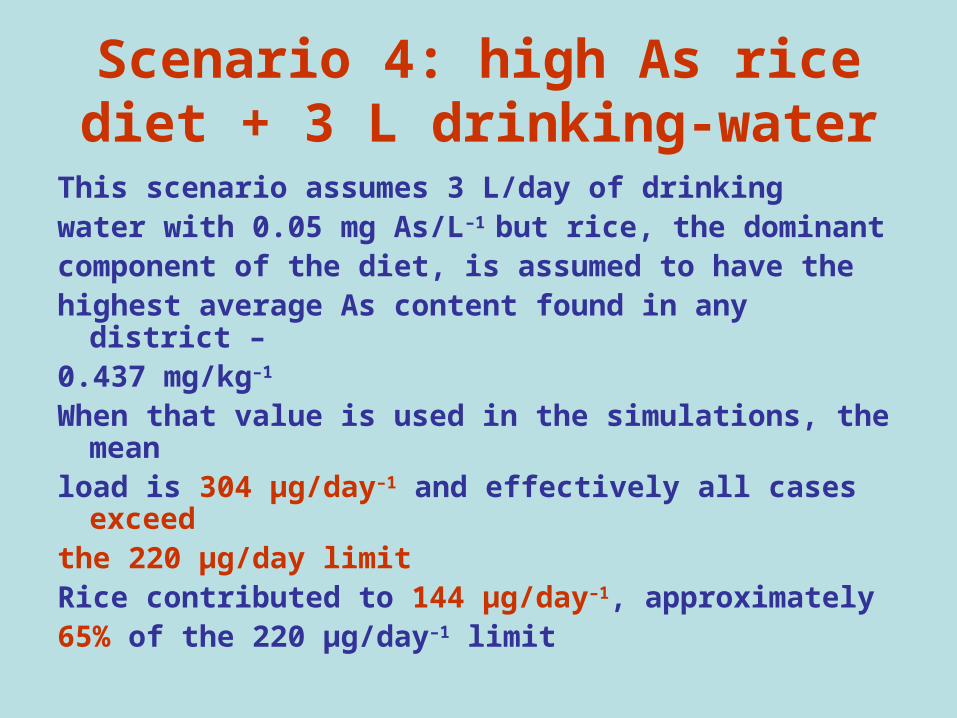
Scenario 4: high As rice diet + 3 L drinking-water
This scenario assumes 3 L/day of drinkingwater with 0.05 mg As/L–1 but rice, the dominantcomponent of the diet, is assumed to have thehighest average As content found in any district –0.437 mg/kg–1
When that value is used in the simulations, the meanload is 304 μg/day–1 and effectively all cases exceedthe 220 μg/day limitRice contributed to 144 μg/day–1, approximately65% of the 220 μg/day–1 limit

Scenario 5: high leafy vegetable diet + 3 L good drinking-water
- This scenario is equivalent to Scenario 2 butwith the typical meal of 152 g of arum eatenevery second day. - This fairly minor perturbation in the dietincreases the daily average load to 219 μg/day–1,with 25% of cases exceeding the 220 μg/day–1
threshold.- Similar results would be obtained byincreasing the consumption of other leafyvegetables that have been found to accumulateelevated amount of As
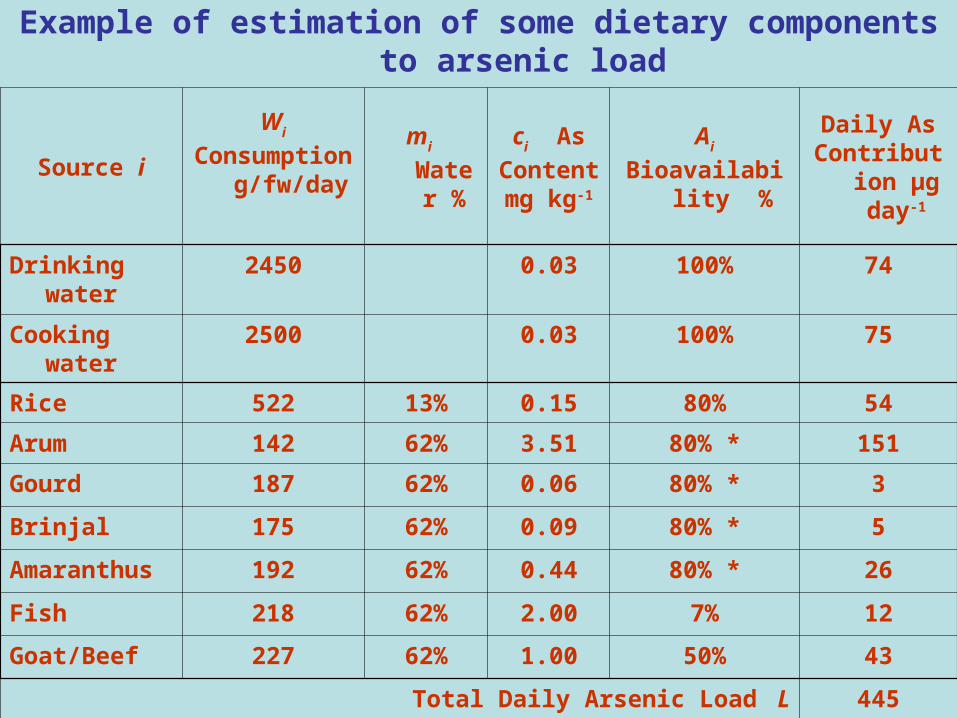
Example of estimation of some dietary components to arsenic load
Source iWi
Consumption g/fw/day
mi
Water %
ci As
Contentmg kg-1
Ai
Bioavailability %
Daily AsContribution
μg day-1
Drinking water 2450 0.03 100% 74
Cooking water 2500 0.03 100% 75
Rice 522 13% 0.15 80% 54
Arum 142 62% 3.51 80% * 151
Gourd 187 62% 0.06 80% * 3
Brinjal 175 62% 0.09 80% * 5
Amaranthus 192 62% 0.44 80% * 26
Fish 218 62% 2.00 7% 12
Goat/Beef 227 62% 1.00 50% 43
Total Daily Arsenic Load L 445

Arsenic content in cooked rice by different methods
Rice variety Source location
As in cooked rice (Bhat) (mg/0.45kg) As in liquid
starch (mg/kg)Method I Method II
Najirshail Savar 0.021 0.01 0.068
Najirshail Bogura 0.046 0.006 0.064
Najirshail Dinajpur 0.027 0.014 0.094
Paripaijam Nowga 0.062 0.018 0.059
Paripaijam Natore 0.05 0.01 0.069
Paripaijam Chapainowabgonj 0.04 0.009 0.056
Paripaijam Dinajpur 0.12 0.041 0.080
BR28 Sherpur 0.035 0.016 0.095
Bashful Shylhet 0.035 0.003 0.076
Minicate Kushtia 0.049 0.008 0.062
BR28 Kushtia 0.034 0.015 0.064
Paijam Sherpur 0.054 0.013 0.071
BR28 Mymensingh 0.031 0.016 0.071
SD at 5% 0.025 0.009 0.012

• Even if a rice sample does not contain any detectable amount of As, the cooked rice (Bhat) however, contains a substantial amount of the element when it is cooked with As contaminated water
• The amount of As in cooked rice (Bhat) plus an average consumption of four litres of the same source of water as drinking water with the Bangladesh standard of 50 g/L As along with As rich vegetables is sufficient to bring the value of daily ingestion of As above the MADL of 0.22 mg per day

• The per cent of population risking the exposure to excess of MADL, has been calculated
• For Jessore (representing Gangetic Alluvium) 32% of the people are above the MADL
• In a separate study, with a different model, it has been calculated that in Jessore, the daily ingestion of As in adult is more than 4mg and in children it is more than 2 mg
• In Rangpur area the value is only 2%• Extrapolated for the whole country (as
represented by the average of the two areas), the value comes to 19% of the population

• The above information asserts that arsenic ingestion in human body besides drinking water is through food chain
• Based on our survey and modeling studies, it is apparent that food can contribute to more than a third of the total daily intake of As
• Crops receiving arsenic contaminated irrigation water take up this toxic element and accumulate it in different degrees depending on the species and variety
• While much work still needs to be done to get a better picture of exposure to As of human in Bangladesh our preliminary results demand further detailed study and also the need for development of strategies that minimize the water-soil-plant transfer of As.

In a recent study, Williams et al.(2005) have found that the mean arsenic level from Bangladeshi rice was 0.13 mg As kg-1, in a range from 0.03 to 0.30 mg As kg-1. They have also found that the main species detected in Bangladesh rice were As III, DMA V, and As V of which more than 80% of the recovered arsenic was in the inorganic form.

Remedial possibilities

Use of fresh water
0
1
2
3
4
5
6
7
8
F.W F.W.+ I.W.(50%)
I. W. F,W F.W.+ I.W.(50%)
I. W.
Treatment
As in
pla
nt (m
g/kg
)
Arum
Kalmi

Amendments
0
2
4
6
8
10
Control Irrigation Org.Matter P-fertilizer
Treatment
As i
n pl
ant (
mg/
kg)
Amaranthus
Arum
Kalmi

Bioremediation by algae
Bioaccumulation was significantly positive; y = 6.521+49.287x,
R = 0.9578**
010203040506070
0 2.5 12.5 25.0 50.0
Arsenic applied in water (mg)
As
cont
ent i
n al
gae,
mg
kg-1

Bioremediation by algae
0
50
100
150
0 0.5 1 2
As treatment in mg/l
As
in ro
ot, m
g/kg
d.
m. Algae +
Algae -

0
2
4
6
8
10
0 0.5 1 2
As treatment in mg/l
As
in s
traw
, mg/
kg d
.m.
Algae +
Algae -

y = 12.593x - 17.925R2 = 0.8593
-10
0
10
20
30
40
50
60
T(0.0) T(0.05) T(0.5) T(1.0) T(5.0)Treatment
Co
nce
ntr
atio
n
(g
/100
pla
nts
)Consequence of bioremediation
As accumulation in Kang kong ( Ipomea aquatica ) after 30 d

Water Management?
0
5
10
15
20
0 10 20 40 0 10 20 40
Treatment (mg/l)
As co
nc. i
n ro
ot (m
g/kg
)
75 % F.C. 100 % F.C.
Arsenite Arsenate
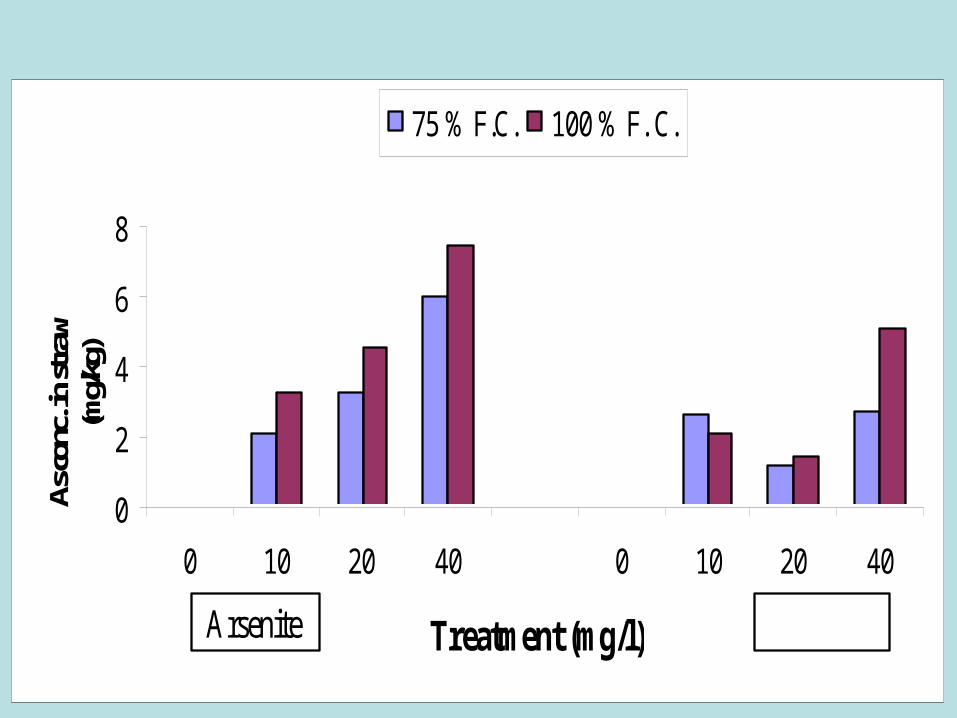
0
2
4
6
8
0 10 20 40 0 10 20 40
Treatment (mg/l)
As co
nc. i
n str
aw
(mg/
kg)
75 % F.C. 100 % F. C.
Arsenite Arsenate

0
0.1
0.2
0.3
0.4
0 10 20 40 0 10 20 40
Treatment (mg/l)
As co
nc. i
n gr
ain
(mg/
kg)
75 % F. C. 100 % F. C.
Arsenite Arsenate
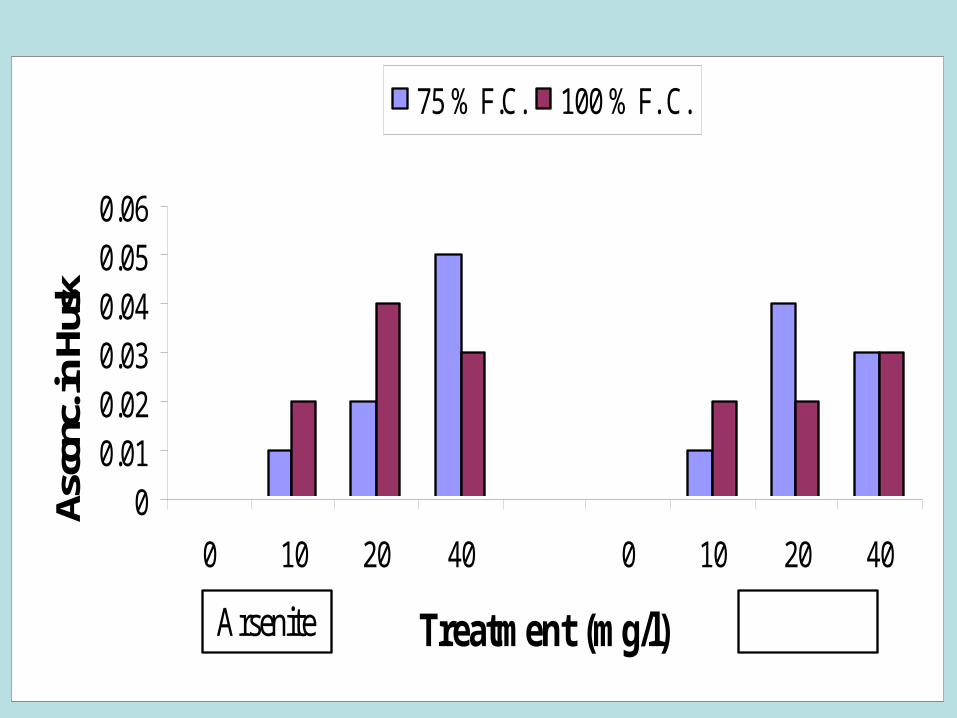
00.010.020.030.040.050.06
0 10 20 40 0 10 20 40
Treatment (mg/l)
As co
nc. i
n H
usk75 % F.C. 100 % F. C.
Arsenite Arsenate

0
5
10
15
20
0 10 20 40 0 10 20 40
Treatment (mg/l)
As c
onc.
in ro
ot
(mg/
kg)
Arsenite Arsenate
75 % F. C. 100 % F. C.

0
2
4
6
8
0 10 20 40 0 10 20 40
Treatment (mg/kg)
As c
onc.
in st
raw
(mg/
kg)
Arsenite Arsenate
75 % F. C. 100 % F. C.

0
0.1
0.2
0.3
0.4
0 10 20 40 0 10 20 40
Treatment (mg/l)
As co
nc. i
n G
rain
(m
g/kg
)Arsenite Arsenate
75 % F. 100 % F. C.

0
0.02
0.04
0.06
0 10 20 40 0 10 20 40
Treatment (mg/l)
As co
nc. in
Hus
k (m
g/kg
)Arsenite Arsenate
75 % F. C. 100 % F. C.

Phytoremediation of Soil Arsenic
(by Marigold-Tagetes patula)
0
1
2
3
4
5
1 2 3 4 5
So
il A
rsen
ic (
mg
/kg
) Initial soil As (mg/kg)
Soil As after harvest (mg/kg)
Ref: Imamul Huq, S.M. et.al., 2005. Marigold (Tagetes patula) and ornamental arum (Syngonia sp.) as phytoremediators for arsenic in pot soil. Bangladesh J. Bot. 34(2):65-70.
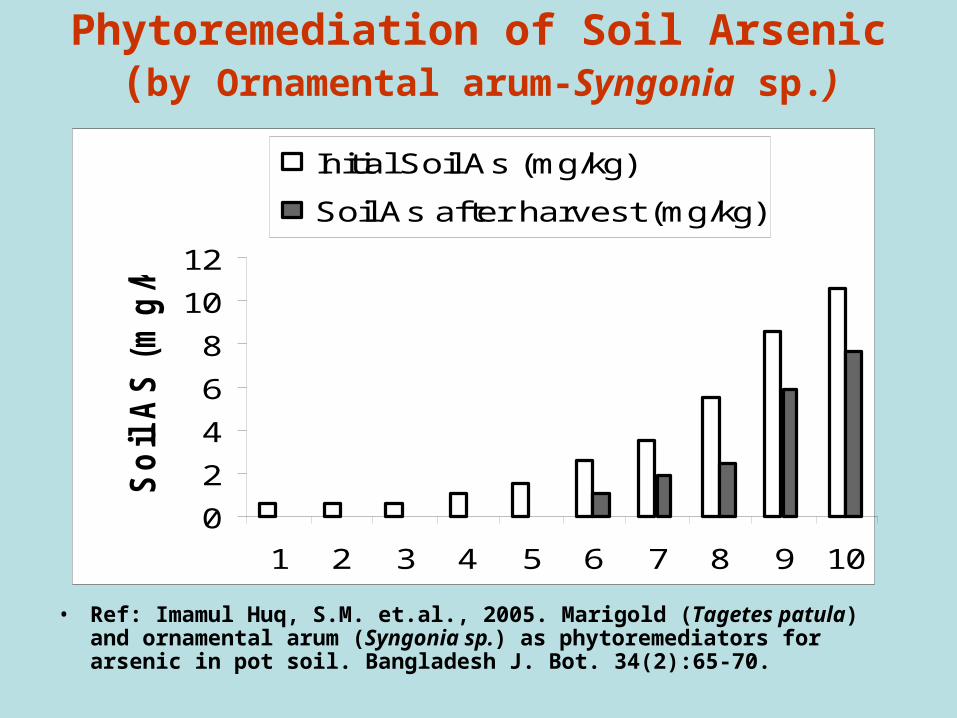
Phytoremediation of Soil Arsenic(by Ornamental arum-Syngonia sp.)
• Ref: Imamul Huq, S.M. et.al., 2005. Marigold (Tagetes patula) and ornamental arum (Syngonia sp.) as phytoremediators for arsenic in pot soil. Bangladesh J. Bot. 34(2):65-70.
0
2
4
6
8
10
12
1 2 3 4 5 6 7 8 9 10
So
il A
S (
mg
/kg
)Initial Soil As (mg/kg)
Soil As after harvest (mg/kg)

CONCLUSION
• We conclude that the largest contributor to As intake by Bangladesh villagers in affected regions is contaminated drinking-water
• The second-largest contributor is food, notably rice
• Followed by vegetables

CONCLUSION (contd.)
• Dietary loads of As in Bangladesh needs to be considered a public health problem
• Steps to reduce this load, on the farm and in the kitchen, are recommended as a matter of urgency
• Possible mitigation strategies need to be assessed
• Further detailed study and need for development of strategies that minimize the water-soil-plant transfer of As are proposed

Arsenic in the EnvironmentArsenic is an element that occurs naturally in the environment. Since arsenic is a natural part of the environment everyone is exposed to small amounts. These sources are shown below. Bangladeshi people are likely to be exposed to higher amounts of arsenic through drinking arsenic contaminated water or consuming foods like vegetables that accumulate high concentrations of arsenic.


Acknowledgement
• The authors acknowledge the services rendered by the Bangladesh Australia Centre for Environmental Research (BACER-DU) and the MoE, the Govt. of Bangladesh and ACIAR, Australia for financing part of the research.


![· XLS file · Web view · 2016-08-03arti mall shital mal[0064] bishakha mal kalubiddin mandol[0020] ... masum ali mandal[0113] hasen bhanu jiyaruddin mandol[0025] ... imamul mondol[0107]](https://img.pdfslide.us/doc/110x75/5a9e62437f8b9a62178b490e/xls-fileweb-view2016-08-03arti-mall-shital-mal0064-bishakha-mal-kalubiddin-mandol0020.jpg)


![1 1 1 1 1 1 1 ¢ 1 , ¢ 1 1 1 , 1 1 1 1 ¡ 1 1 1 1 · 1 1 1 1 1 ] ð 1 1 w ï 1 x v w ^ 1 1 x w [ ^ \ w _ [ 1. 1 1 1 1 1 1 1 1 1 1 1 1 1 1 1 1 1 1 1 1 1 1 1 1 1 1 1 ð 1 ] û w ü](https://img.pdfslide.us/doc/110x75/5f40ff1754b8c6159c151d05/1-1-1-1-1-1-1-1-1-1-1-1-1-1-1-1-1-1-1-1-1-1-1-1-1-1-w-1-x-v.jpg)


![$1RYHO2SWLRQ &KDSWHU $ORN6KDUPD +HPDQJL6DQH … · 1 1 1 1 1 1 1 ¢1 1 1 1 1 ¢ 1 1 1 1 1 1 1w1¼1wv]1 1 1 1 1 1 1 1 1 1 1 1 1 ï1 ð1 1 1 1 1 3](https://img.pdfslide.us/doc/110x75/5f3ff1245bf7aa711f5af641/1ryho2swlrq-kdswhu-orn6kdupd-hpdqjl6dqh-1-1-1-1-1-1-1-1-1-1-1-1-1-1.jpg)


![1 $SU VW (G +LWDFKL +HDOWKFDUH %XVLQHVV 8QLW 1 X ñ 1 … · 2020. 5. 26. · 1 1 1 1 1 x 1 1 , x _ y ] 1 1 1 1 1 1 ¢ 1 1 1 1 1 1 1 1 1 1 1 1 1 1 1 1 1 1 1 1 1 1 1 1 1 1 1 1 1 1](https://img.pdfslide.us/doc/110x75/5fbfc0fcc822f24c4706936b/1-su-vw-g-lwdfkl-hdowkfduh-xvlqhvv-8qlw-1-x-1-2020-5-26-1-1-1-1-1-x.jpg)