Embed Size (px)
Citation preview
Supplementary Materials for
Facet-Dependent Interfacial Charge Separation and Transfer in
Plasmonic Photocatalysts
Jieyuan Li, ‡, a, b Xing’an Dong, ‡, b Yanjuan Sun,b Wanglai Cen,a, * and Fan Dongb, *
a College of Architecture and Environment, Institute of New Energy and Low Carbon Technology,
Sichuan University, Chengdu, Sichuan 610065, P. R. China.
b Chongqing Key Laboratory of Catalysis and New Environmental Materials, College of
Environment and Resources, Chongqing Technology and Business University, Chongqing
400067, P. R. China.
‡ Jieyuan Li and Xing’an Dong contributed equally to this work.
*Corresponding authors:
Wanglai Cen ([email protected]), Fan Dong ([email protected])
1
Experimental section
DFT calculations. All the spin-polarized DFT-D2 calculations were conducted in the “Vienna ab
initio simulation package” (VASP code 5.4.1), utilizing the generalized gradient correlation
functional.[1, 2] The projector-augmented wave method was used with a plane-wave basis.[3, 4]
The cut-off energy and Gaussian smearing width were respectively set to 500 eV and 0.2 eV. The
Brillouin zone was sampled with a 5 × 5 × 1 K points. All structures and energy are allowed to
relax below 0.01 eV Å-1. The Heyd-Scuseria-Ernzerhof (HSE06) method was used to estimate the
exact band structures.[5, 6] A 3 × 3 × 2 supercell containing 120 atoms was relaxed with the
(001) and (010) facets exposure, respectively.
Electromagnetic field simulation. The simulation of the electromagnetic field distribution
around Bi metal was performed with a rigorous Maxwell solver based on the finite integration
techniques.[7, 8] The refractive index of Bi element in the UV to near-infrared spectra was fitted
to the Drude model of the empirical data. The real and imaginary parts of the refractive index
over Bi are set to 1.76 and 2.38, respectively.
Photocatalysts fabrication. All chemicals used in this study were analytical grade (Sigma
Aldrich) without further purification. 001 samples of BiOBr was synthesized using a
modification of a reported protocol.[9] In a typical measurement of synthesis, 2 mmol of
Bi(NO3)3·5H2O and 2 mmol of KBr were added to 60 mL distilled water at room temperature
with continuous stirring, and then 5 M NaOH solution was injected to this mixture in order to
adjust its pH value to 6.0. The mixture was stirred for 30 min and then moved into a 100 mL
Teflon lined stainless autoclave to perform a hydrothermal process at 160 for 24 h. After the℃
mixture was cooled to room temperature, the resultant precipitates was collected by
centrifugation, washed thoroughly with deionized water and ethanol respectively for 3 times and
dried at 60 .℃
BiOBr with Bi nanowires deposited (Bi-BOB) was prepared by an in situ reduction reaction.
2
Typically, 2 mmol of BiOBr was added into 100 mL of deionized water containing 1.0 g PVP
(polyvinyl pyrrolidone) and stirred for 20 min; then a certain concentration of NaBH4 (30 mL)
was dropwise added into this solution. Then the resulting suspension was stirred for 1 h and
further aged for another 1 h. The resultant precipitates were gathered, rinsed four 3 times with
ethanol and deionized water, and dried at 50 C. When the concentration of NaBH4 was 30, 50, 70
and 90 mmol L-1, using 001 as precursor material, the obtained samples were denoted as 001-
30,001-50,001-70 and 001-90, respectively, while for 010, the obtained samples were labeled as
010-30, 010-50, 010-70 and 010-90, respectively.
Ag nanoparticles deposited BiOBr (Ag-BOB) was prepared through a reported photo-reduction
approach.[10, 11] In a typical synthesis, two glass sheets coated with BiOBr films were placed
into 50 mL methyl alcohol solution containing AgNO3 with the Ag/Bi molar ratio at 3%. Then the
solution was irradiated by an ultraviolet light (365 nm, 8W) for 30 min. Finally, the films were
washed with ethanol and water respectively for three times.
Characterization. The X-ray diffraction (XRD) with Cu Kα radiation (model D/max RA,
Rigaku Co. Japan) was utilized to analyze the crystal phases of the samples. The surface
properties were investigated using the X-ray photoelectron spectroscopy (XPS) with Al Kα X-
rays (Thermo ESCALAB 250, U. S. A.). The morphologies were examined with scanning
electron microscopy (SEM, model JSM-6490, JEOL, Japan) and transmission electron
microscopy, JEM-2010, Japan). A scanning UV-vis spectra-photometer (TU-1901, China)
equipped with an integrating sphere was used to characterize the UV-vis diffuse reflectance
spectrometry, using 100% BaSO4 as the reflectance sample. Time-resolved fluorescence emission
spectra were measured using a fluorescence spectrophotometer (Edinburgh Instruments, FLSP-
920) at room temperature. The surface photovoltage (SPV) measurement was carried out on the
basis of the lock-in amplifier.[12] The measurement system consists of a source of
monochromatic light, a lock-in amplifier (SR830, Stanford Research Systems, Inc.) with a light
3
chopper (SR540, Stanford Research Systems, Inc.), and a sample chamber. The monochromatic
light is provided by passing light from a 500 W xenon lamp (CHFXQ500 W, Global Xenon Lamp
Power) though a grating monochromator (Omni-5007, No.09010, Zolix), which chopped with a
frequency of 24 Hz. All the measurements were operated at room temperature and under ambient
pressure. The electron paramagnetic resonance (EPR) characterization (FLsp920, England) of the
as-prepared photocatalysts were carried out at 77 K. Electron spin resonance (ESR) spectra of
chemical radicals were obtained on a JES FA200 spectrometer to determine the involvement of
the reactive oxygen species (ROS), respectively in in methanol dispersion for DMPO-●O2- and in
aqueous dispersion for DMPO-●OH.
Photocatalytic efficiency evaluation. The photocatalytic activities were investigated via the
removal ratio of NO at ppb levels in a continuous-flow reactor (Scheme S1) at ambient
temperatures. The volume of the rectangular reactor, which was made of polymeric glass and
covered with satin glass, was 4.5 L (30 cm × 15 cm × 10 cm). A 150 W commercial tungsten
halogen lamp was vertically placed outside the reactor. A UV cutoff filter (420 nm) was utilized
to remove UV light in the light beam. For each test, 0.20 g of prepared sample was dispersed in
distilled water (50 mL) in a beaker via ultrasonic treatment for dispersion and then coated onto
two glass dishes (12.0 cm in diameter). The coated dishes were dried at 60 C to remove water and
then cooled to room temperature before the tests.
The NO gas was obtained from a compressed gas cylinder and the concentration of NO was
diluted to about 600 ppb by the air stream. The desired relative humidity level of the NO flow
was controlled at 50% by passing the zero air streams through a humidification chamber. The gas
streams were premixed completely using a gas blender, and the flow rates of the air stream and
NO were controlled at 2.4 L min-1 and 24 mL min-1, respectively, using a mass flow controller.
After adsorption–desorption equilibrium was achieved, the lamp was turned on. The
concentration of NO was continuously measured using a NOX analyzer (Thermo Environmental
4
Instruments Inc., model 42c-TL). The removal ratio (η) of NO was defined as
η (%) = (1 – C/C0) × 100% (1)
where C and C0 stand for the concentrations of NO in the outlet and feeding stream,
respectively.
Scheme S1. Schematic illustration for the continuous photocatalytic reactor for NO removal.
Fig. S1. Relaxed micro-structures of BiOBr with (001) facet (a) and (010) facet (b) exposure,
respectively. Blue, grey and red spheres depict Bi, Br and O atoms.
5
Fig. S2. XPS survey spectra of 001, 010, 001-70 and 010-70.
Fig. S3. SEM images of 001 (a and b) and 001-70 (c). TEM images of 001 (d) and 001-70 (e).
Fig. S4. SEM images of 010 (a and b) and 010-70 (c). TEM images of 010 (d) and 010-70 (e).
6
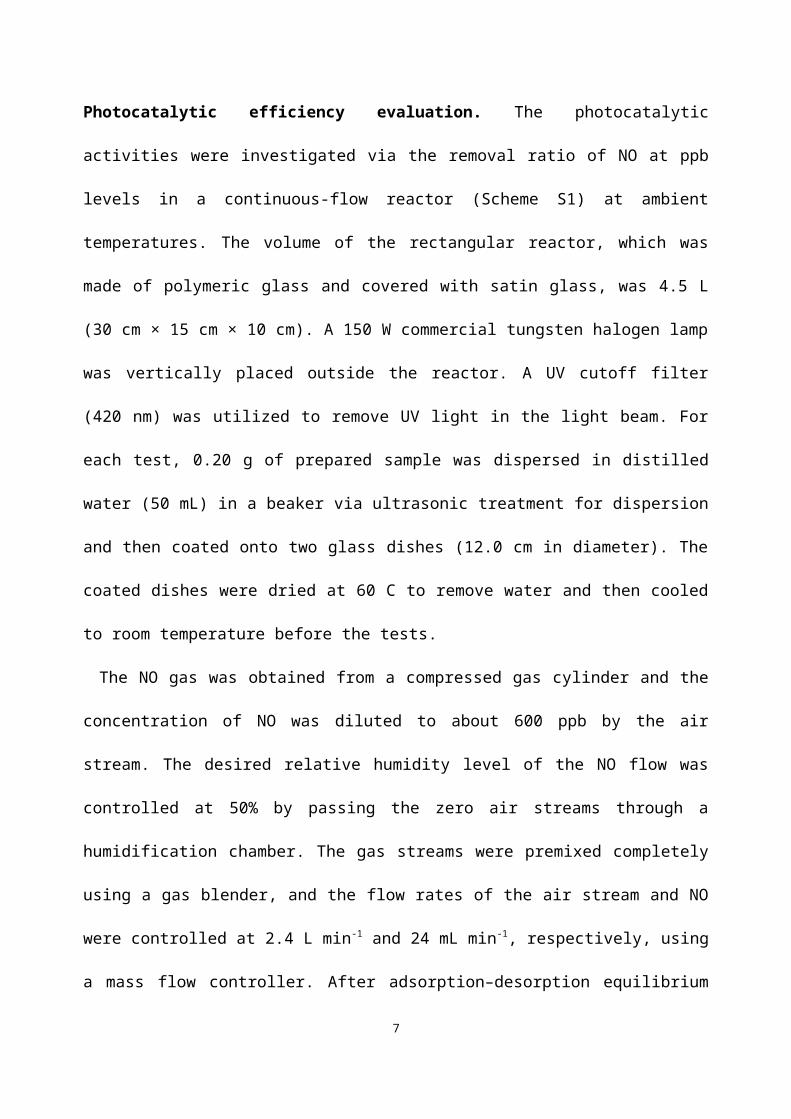
Fig. S5. FESEM-EDX adopted from a typical SEM image (a) for Bi (b), O (c) and Br (d)
elements in the 001 sample.
Fig. S6. FESEM-EDX adopted from a typical SEM image (a) for Bi (b), O (c) and Br (d)
elements in the 010 sample.
Fig. S7. Specific surface area of 001, 010, 001-70 and 010-70.
7
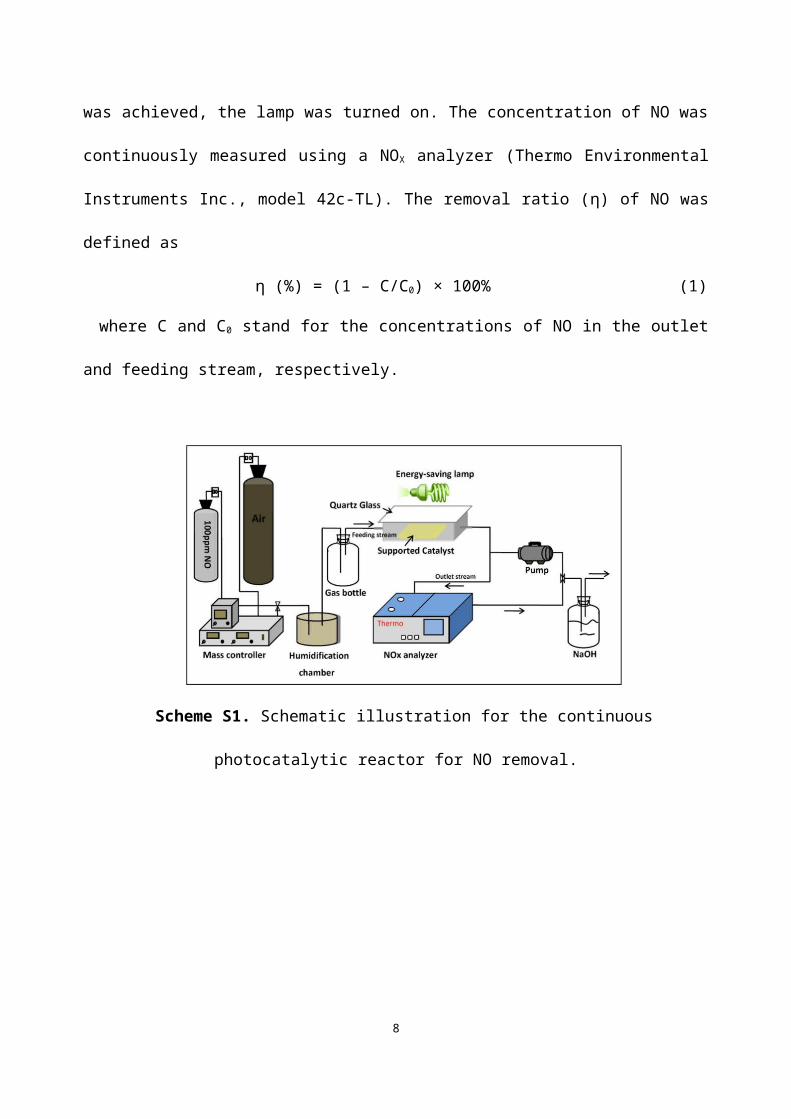
Fig. S8. Photocatalytic activity evaluations of 001, 001-50, 001-70 and 001-90 (a) and 010, 010-
50, 010-70 and 010-90 (b).
8
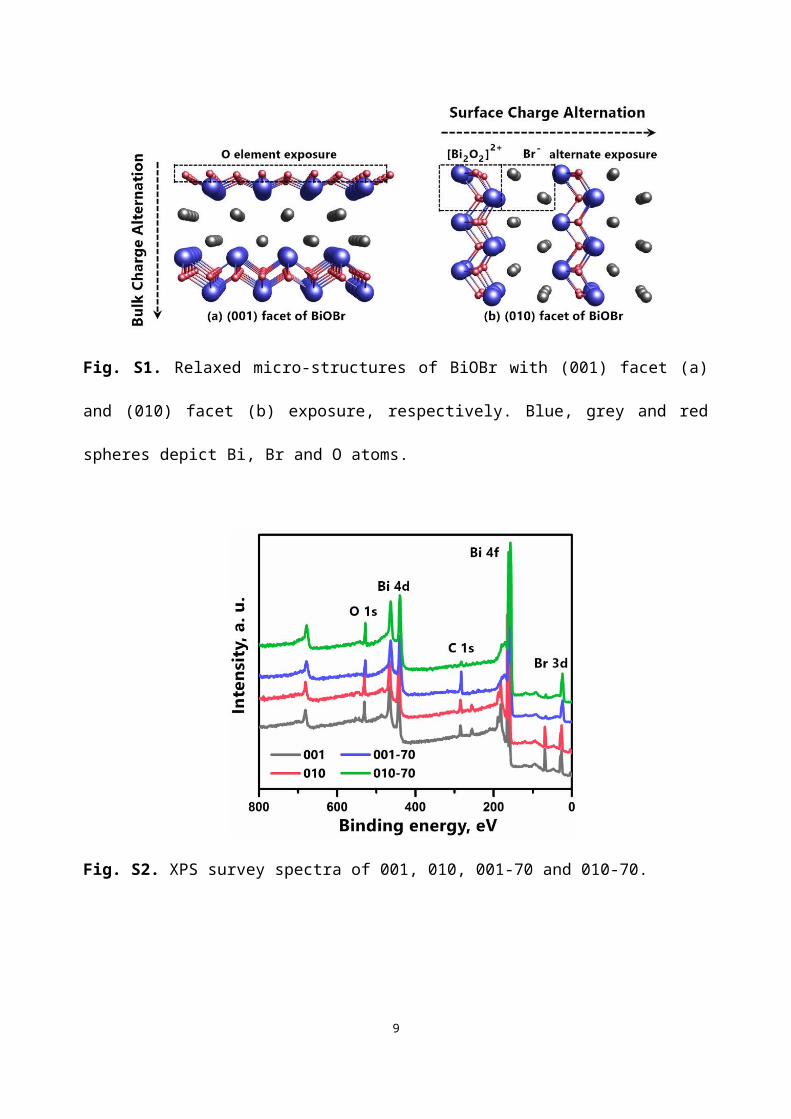
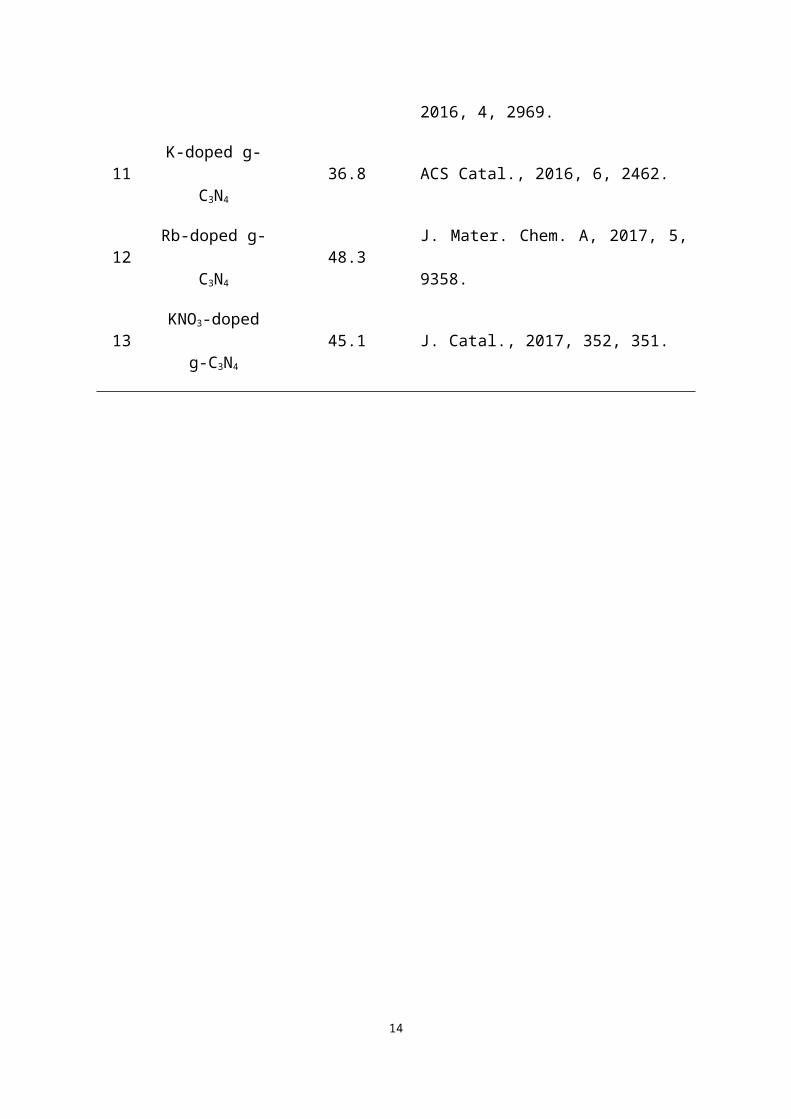
Table S1 Comparison of the photocatalytic efficiency for NO removal under visible-light
irradiation with different catalysts reported.
No. CatalystsNO removal ratio,
%References
1 Bi@BiOBr 60.4 This work
2 Bi@BiOCl 50.0 J. Catal., 2016, 344, 401.
3N-doped
(BiO)2CO3
41.6 Chem. Eng. J., 2013, 214, 198.
4 g-C3N4 32.1 J. Colloid Interface Sci., 2013, 401, 70.
5 BiOBr 21.3 Ind. Eng. Chem. Res., 2013, 52, 6740.
6 Bi metal 46.0 Chem. Commun., 2014, 50, 10386.
7 GO/BiOIO3 50.9 J. Colloid Interface Sci., 2015, 447, 16.
8Self-doped
(BiO)2CO3
48.0 ACS Catal., 2015, 5, 4094.
9 Bi/g-C3N4 59.7 Environ. Sci. Technol., 2015, 49, 12432
10 Bi/(BiO)2CO3 50.3ACS Sustainable Chem. Eng., 2016, 4,
2969.
11 K-doped g-C3N4 36.8 ACS Catal., 2016, 6, 2462.
12 Rb-doped g-C3N4 48.3 J. Mater. Chem. A, 2017, 5, 9358.
13KNO3-doped g-
C3N4
45.1 J. Catal., 2017, 352, 351.
9
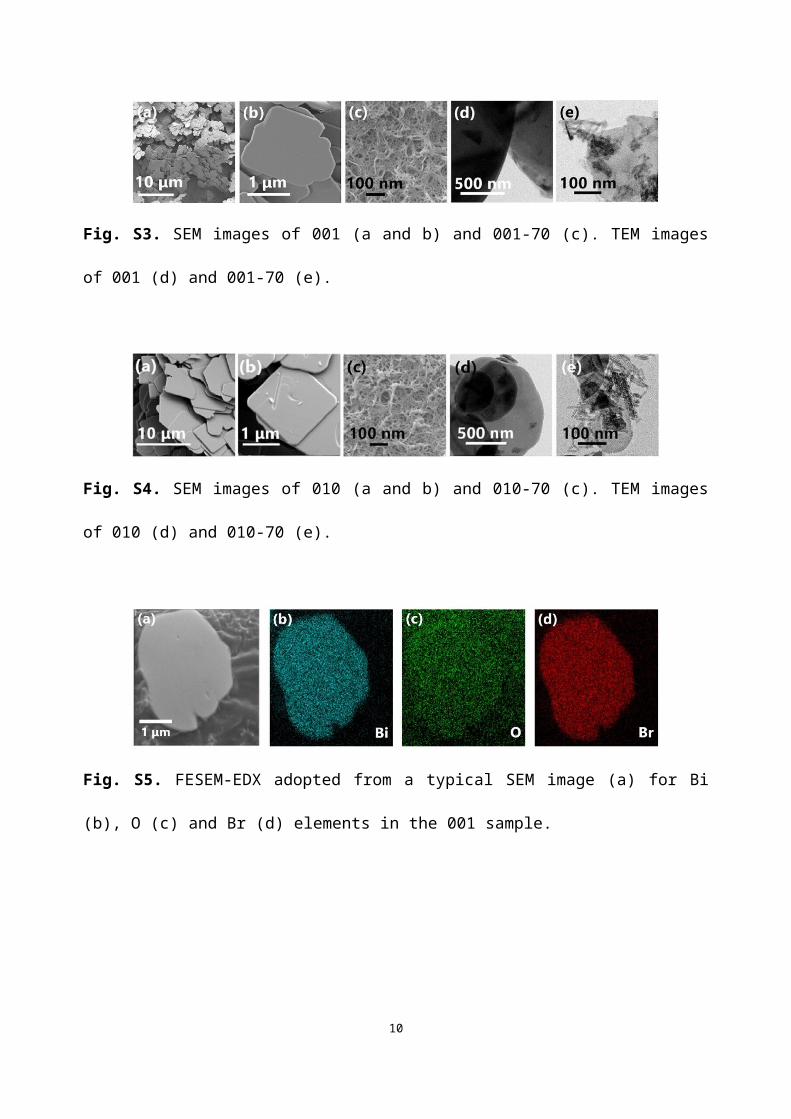
Fig. S9. PL spectra for 001, 001-70, 010 and 010-70.
10
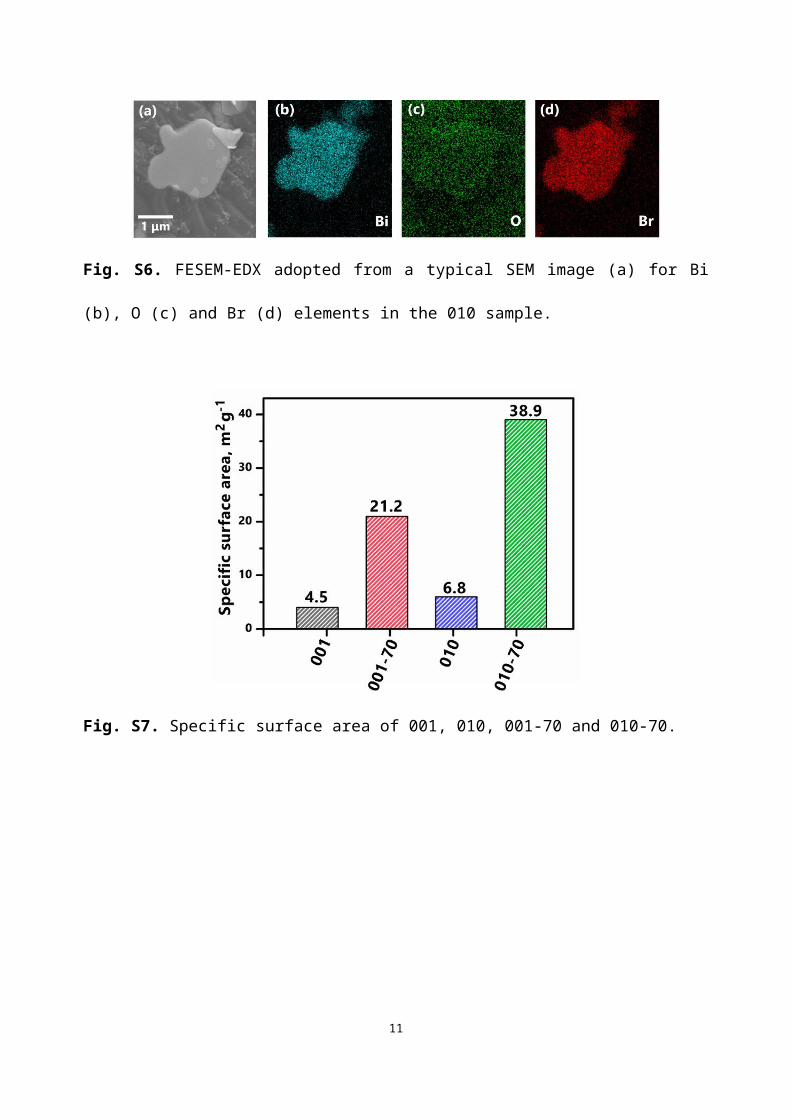
Fig. S10. SEM images for Ag-BiOBr001 (a and b), FESEM-EDX adopted from a typical SEM
image (c) for Bi (d), Br (e) and Ag (f) elements in the Ag- BiOBr001 sample.
11
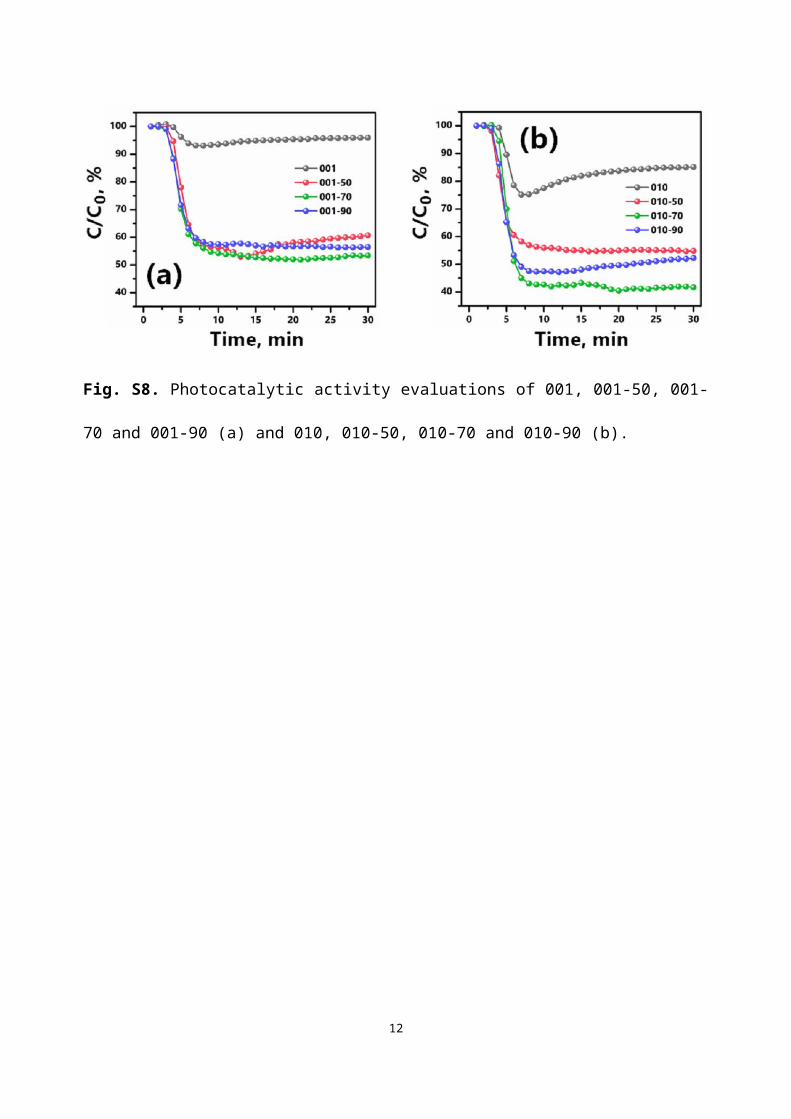
Fig. S11. SEM images for Ag- BiOBr010 (a and b), FESEM-EDX adopted from a typical SEM
image (c) for Bi (d), Br (e) and Ag (f) elements in the Ag- BiOBr010 sample.
Fig. S12. UV-vis DRS spectra of BiOBr001 and Ag- BiOBr001 (a), BiOBr010 and Ag-BiOBr010
(b).
12
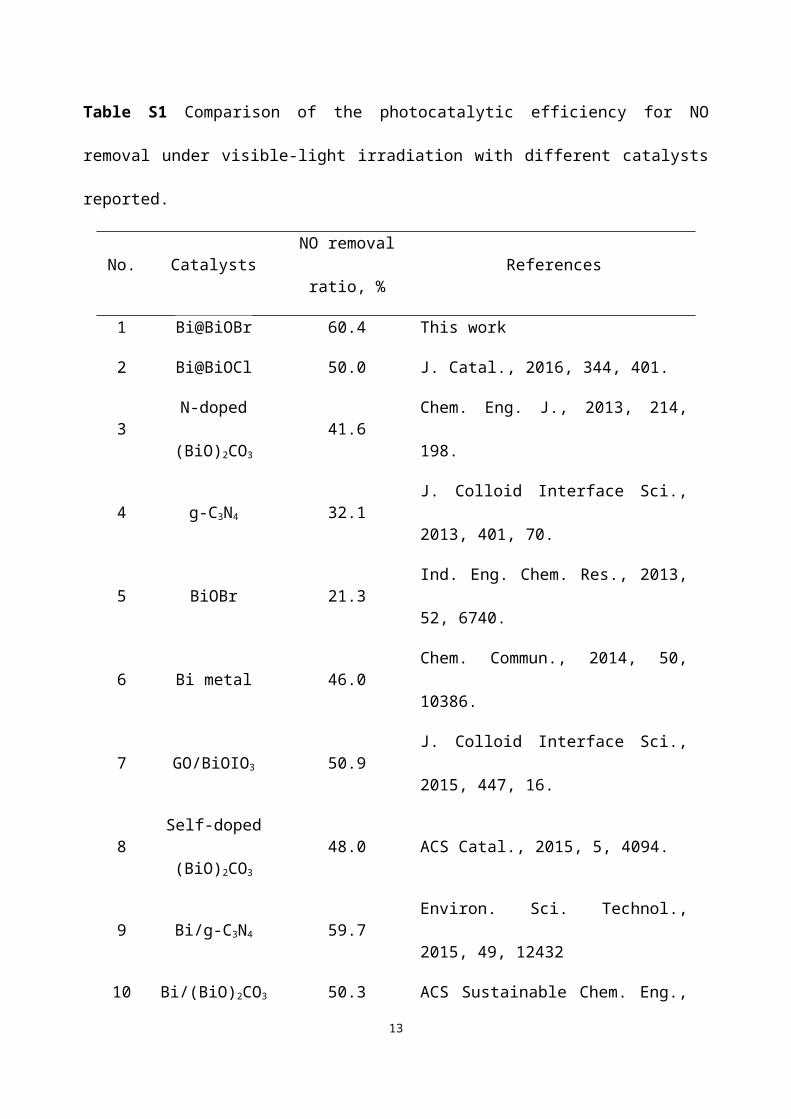
Fig. S13. Photocatalytic activity evaluations of BiOBr001 and Ag-BiOBr001 (a), BiOBr010 and
Ag-BiOBr010 (b).
Table S2 Comparison of the photocatalytic efficiency for NO removal under visible-light
irradiation with Bi deposited at the (001) and (010) facet of BiOCl. The results are reprinted from
our previous work.[13] Copyright Elsevier 2016.
Catalysts NO removal ratio, %
BiOCl-001 4.0
BiOCl-010 7.3
Bi- BiOCl-001 35.5
Bi-BiOCl-010 50.0
References:
[1] G. Kresse, J. Furthmuller, Comput. Mater. Sci. 6 (1996) 15-50.
[2] J.P. Perdew, K. Burke, M. Ernzerhof, Physical Review Letters 77 (1996) 3865.
[3] P.E. Blochl, Phys. Rev. B: Condens. Matter Mater. Phys. 50 (1994) 17953.
[4] G. Kresse, D. Joubert, Phys. Rev. B: Condens. Matter Mater. Phys. 59 (1999) 1758.
[5] J. Heyd, G.E. Scuseria, M.J.J. Ernzerhof, Chem. Phys. 188 (2003) 8207.
[6] J. Heyd, G.E. Scuseria, M.J.J. Ernzerhof, Chem. Phys. 124 (2006) 219906.
13
[7] T. Weiland, AEU-Int. J. Electron. C 31 (1977) 116-120.
[8] S. Yan, J. Krantz, K. Forberich, C. Pflaum, C.J. Brabec, J. Appl. Phys. 115 (2013) 154303.
[9] X. Wu, H.N. Yun, L. Wang, Y. Du, S.X. Dou, R. Amal, J. Scott, J. Mater. Chem. A 5 (2017) 8117.
[10] H. Yin, X. Chen, R. Hou, H. Zhu, S. Li, Y. Huo, H. Li, Acs Appl. Mater. Interfaces 7 (2015) 20076-20082.
[11] Y. Huo, R. Hou, X. Chen, H. Yin, Y. Gao, H. Li, J. Mater. Chem. A 3 (2015) 14801-14808.
[12] Q. Zhao, T. Xie, L. Peng, Y. Lin, P. Wang, L. Peng, D. Wang, J. Phys. Chem. C 111 (2013) 17136-17145.
[13] F. Dong, T. Xiong, S. Yan, H. Wang, Y. Sun, Y. Zhang, H. Huang, Z. Wu, J. Catal. 344 (2016) 401-410.
14