Embed Size (px)
Citation preview
Supporting Information
Solar Conversion of Seawater Uranium (VI) Using TiO2 Electrodes
Young Kwang Kim,1 Seunghoon Lee,2 Jungho Ryu,3 and Hyunwoong Park2,*
1Department of Physics and 2School of Energy Engineering, Kyungpook National
University, Daegu 702-701, Korea
3Mineral Resources Research Division, Korea Institute of Geoscience and Mineral
Resources, Daejeon 305-350, Korea
*To whom correspondence should be addressed (H. Park)
Tel: +82-53-950-8973; Fax: +82-53-950-8979
E-mail: [email protected]
S1

Table S1. Mean composition of seawater.
Species Concentration (mmol/kg)
Na+ 546
Cl- 469
Mg2+ 53
SO42- 28.1
Ca2+ 10.3
K+ 10.2
HCO3- 2.34
Br- 0.83
BO33- 0.46
F- 0.068
Sr2+ 0.091
Ref) A.G. Dickson and C. Goyet, Handbook of methods for the analysis of the various parameters of the carbon dioxide system in sea water, Department of Energy, U.S.A., 1994
Table S2. Was uranium removed?PECa ECa PCa
Airb N2b Airb N2
b Airb N2b
Ebias(VSCE) 0.4 0.7 1.0 1.0 0.4 0.7 1.0 n.ae n.apH 3 Noc No No No Noc No No n.m No NopH 6 Yes Yesf Yes No n.md n.m n.m n.m Yes NopH 8.2 Yes Yes Yes No No Yes Yes n.m Yes Noa: photoelectrochemical, electrochemical, and photocatalyticb: air-equilibrated and N2-purgedc: not removed or significantly decreased in uranium removald: not measurede: not applicablef: removed
S2

Figure S1. Quantification of U(VI) in seawater at varying pH using arsenazo III. Free arsenazo III exhibits an absorption band at 539 nm, whereas arsen azo III-U(VI) complexes display new absorption bands at 605 and 653 nm.
Figure S2. Cyclic voltammograms of TiO2 electrodes without and with irradiation in natural seawater with 100 ppm U(VI). pH 8.2; AM 1.5G (400 mW/cm2); air-equilibrated.
S3
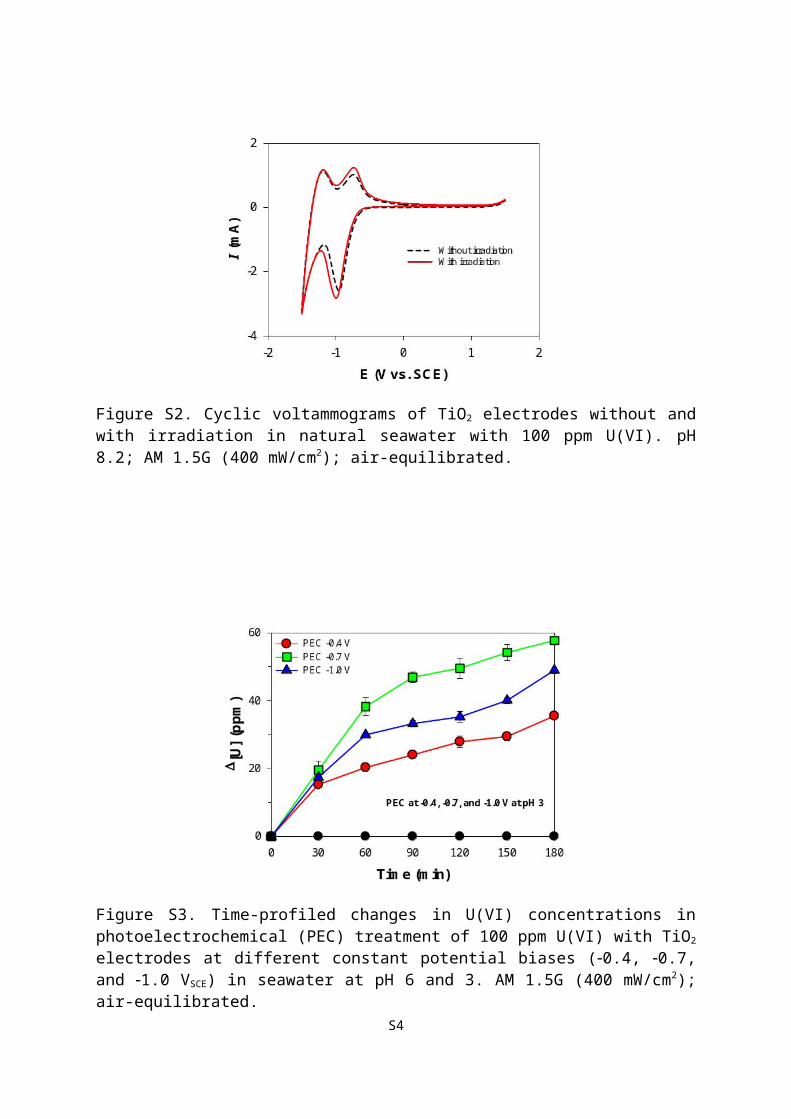
Figure S3. Time-profiled changes in U(VI) concentrations in photoelectrochemical (PEC) treatment of 100 ppm U(VI) with TiO2 electrodes at different constant potential biases (0.4, 0.7, and 1.0 VSCE) in seawater at pH 6 and 3. AM 1.5G (400 mW/cm2); air-equilibrated.
Figure S4. Time-profiled current generations of TiO2 electrodes at varying Ebiass without (EC) or with irradiation (PEC) in natural seawater with U(VI) of 100 ppm. Air-equilibrated; AM 1.5G (400 mW/cm2).
S4
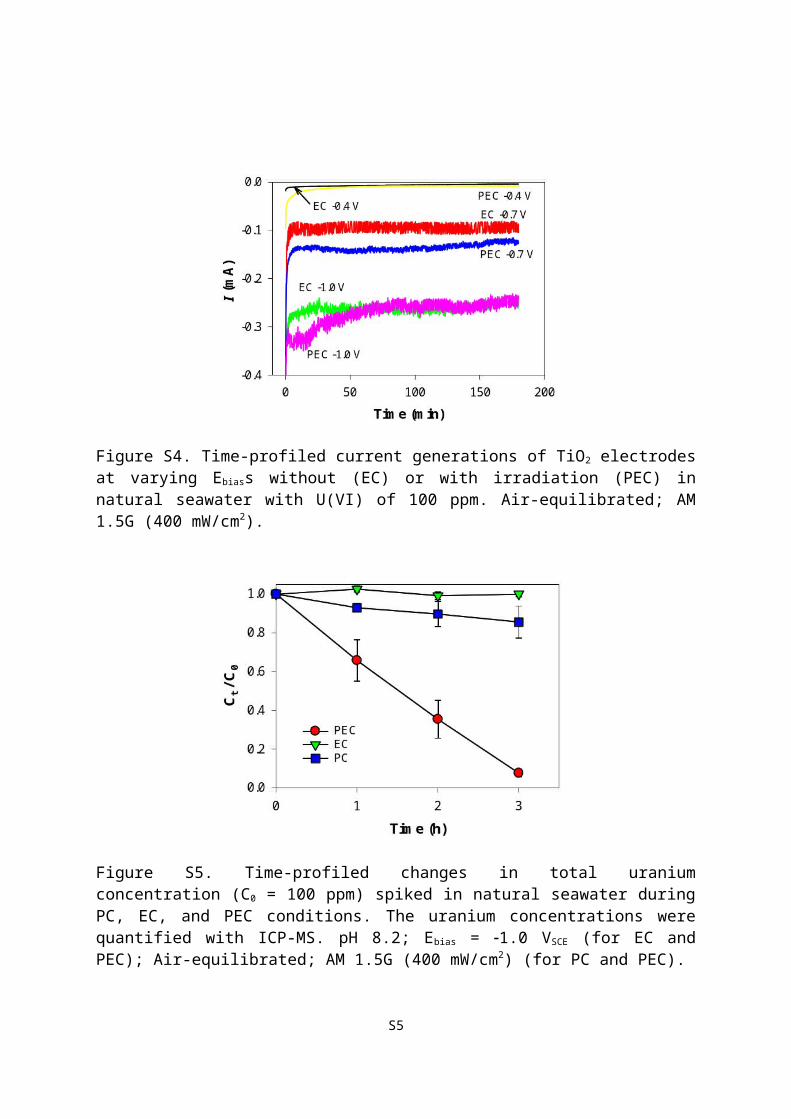
Figure S5. Time-profiled changes in total uranium concentration (C0 = 100 ppm) spiked in natural seawater during PC, EC, and PEC conditions. The uranium concentrations were quantified with ICP-MS. pH 8.2; Ebias = 1.0 VSCE (for EC and PEC); Air-equilibrated; AM 1.5G (400 mW/cm2) (for PC and PEC).
S5
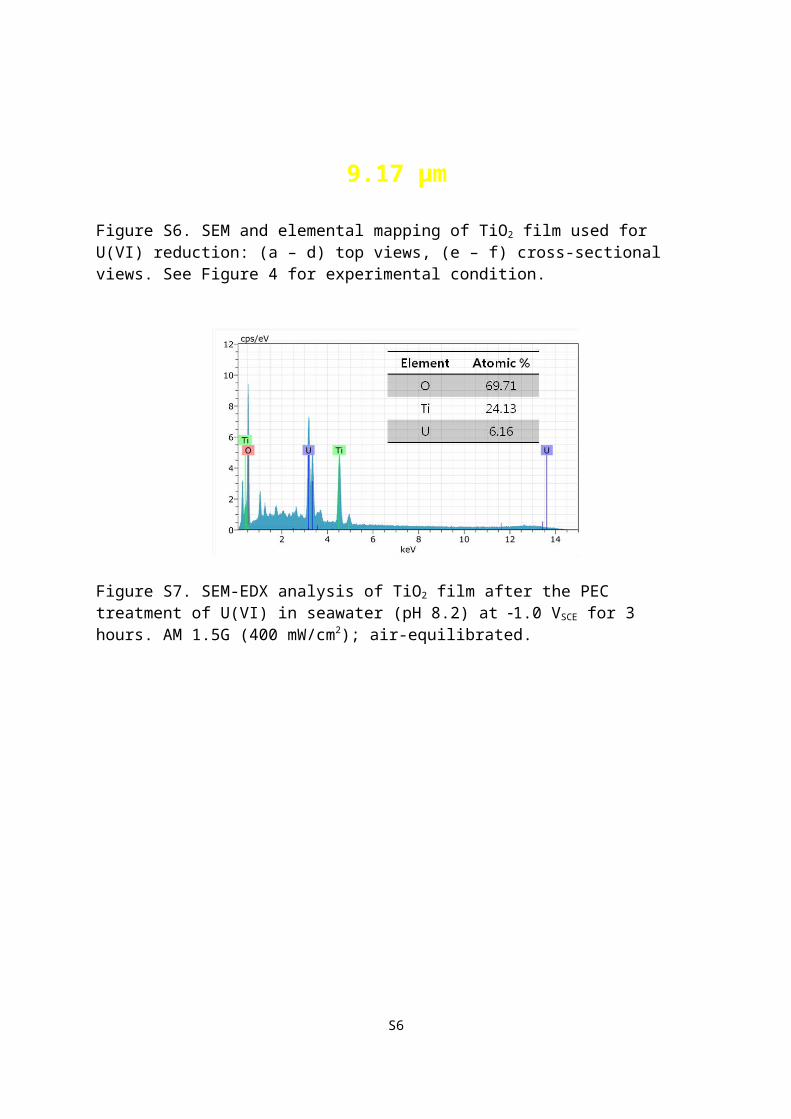
Figure S6. SEM and elemental mapping of TiO2 film used for U(VI) reduction: (a – d) top views, (e – f) cross-sectional views. See Figure 4 for experimental condition.
Figure S7. SEM-EDX analysis of TiO2 film after the PEC treatment of U(VI) in seawater (pH 8.2) at 1.0 VSCE for 3 hours. AM 1.5G (400 mW/cm2); air-equilibrated.
S6
a
b
c
d
e
f
g
h
9.17 μm

Figure S8. (a) XPS analysis of uranium remaining in solution after PC, EC, and PEC treatment of U(VI) in seawater. The uranium in solution phase was collected using hydrous titania. (b – d) Deconvoluted U4f XPS bands (b: PC, c: EC, and d: PEC). See Figure 4 for experimental condition.
S7
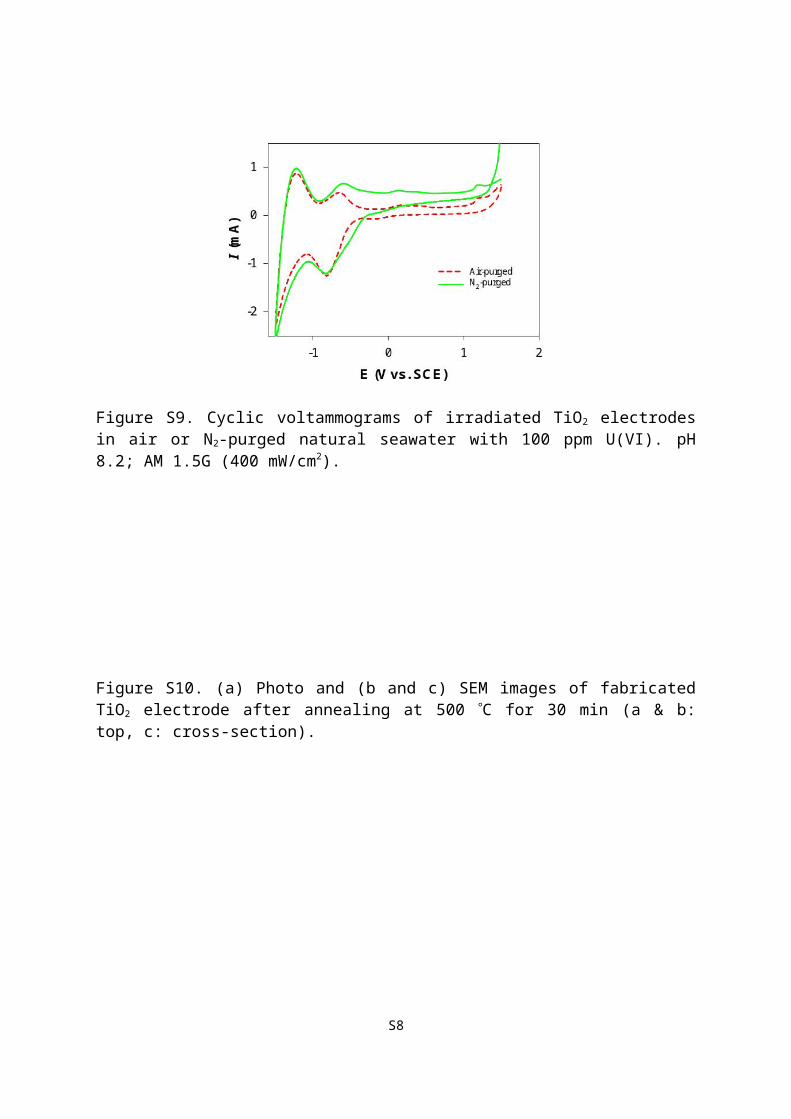
Figure S9. Cyclic voltammograms of irradiated TiO2 electrodes in air or N2-purged natural seawater with 100 ppm U(VI). pH 8.2; AM 1.5G (400 mW/cm2).
S8

Figure S10. (a) Photo and (b and c) SEM images of fabricated TiO2 electrode after annealing at 500 C for 30 min (a & b: top, c: cross-section).
S9
(b)
(c)
(a)