Embed Size (px)
Citation preview
ARRT & Other DIGITAL
Terms Defined
April 2009
Wk 9/10 RT 255

Display Workstations• Conventional film/screen
radiography uses large multiviewer lightboxes.
• With early PACS, radiologists thought that they needed 4-6 monitors.
• Now, the number of monitors has dropped to an average of 2.
• Development of viewing software and better hardware.

Name the 3 types of monitors
Name the 3 types of monitors
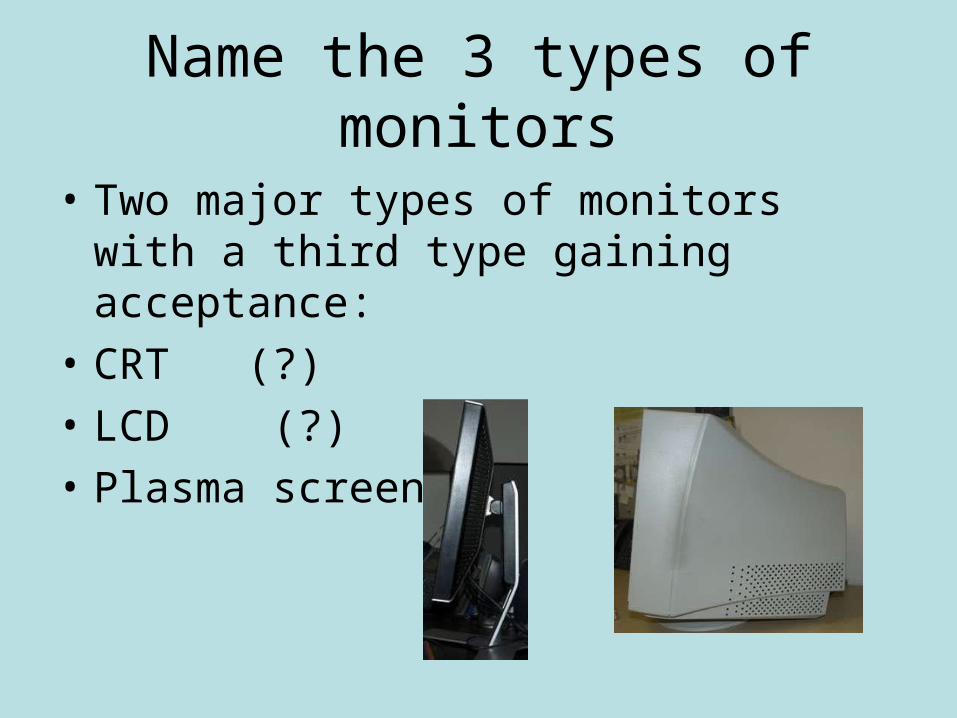
• Two major types of monitors with a third type gaining acceptance:
• CRT (?)
• LCD (?)
• Plasma screen
3 types of monitors
• CRT (cathode ray tube)
• LCD (liquid crystal display)
• Plasma screen
Medical Use of Monitors
• Most medical monitors used to display radiographic images are monochrome high-resolution monitors.
• Early displays used were primarily CRTs, but as the LCD technology has gotten better, more LCDs are taking the place of the older CRTs.

Image Display= MONITORS
• viewing conditions– (i.e.,luminance,ambient lighting)
• spatial resolution
• contrast resolution/dynamic range
• DICOM gray scale function
• window level and width function
ARRT DEFINITIONS
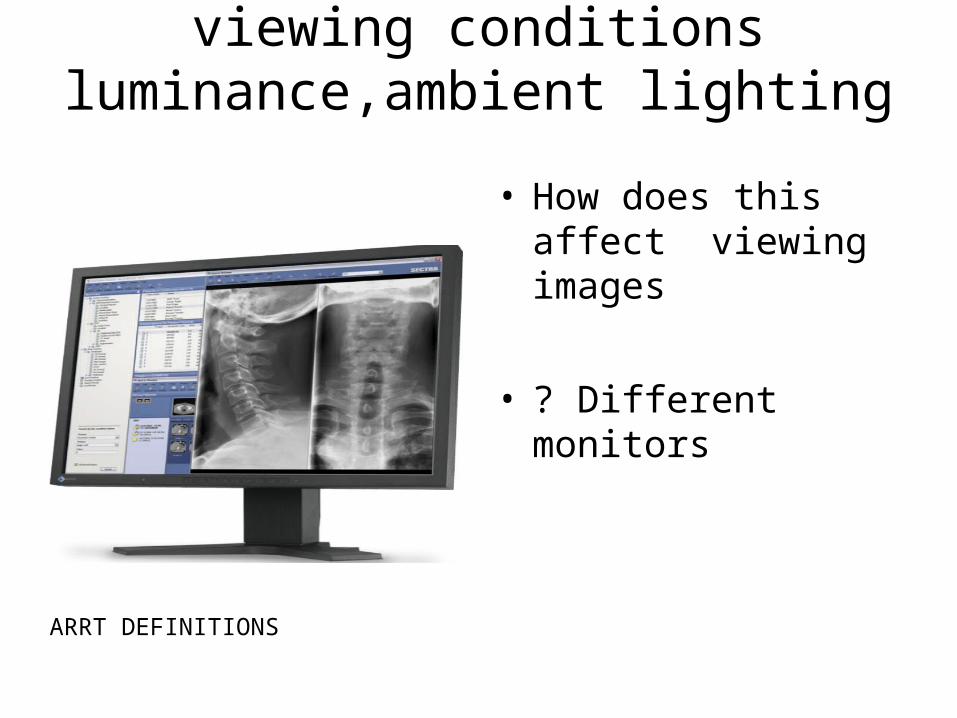
viewing conditions luminance,ambient lighting
• How does this affect viewing images
• ? Different monitors
ARRT DEFINITIONS
viewing conditions luminance,ambient lighting
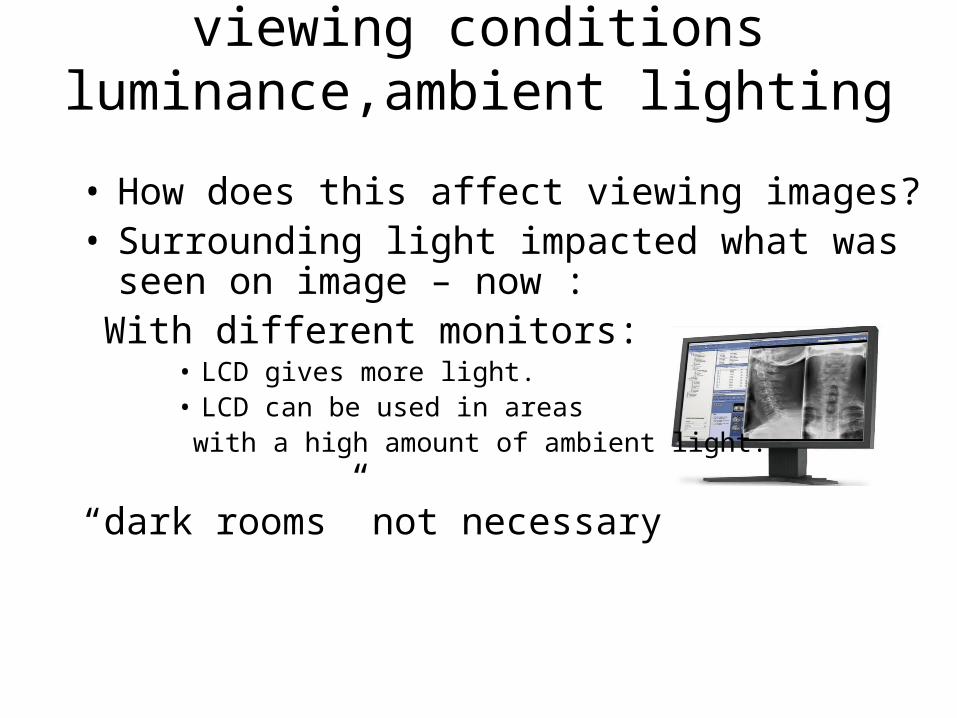
• How does this affect viewing images?• Surrounding light impacted what was seen on
image – now : With different monitors:
• LCD gives more light.• LCD can be used in areas with a high amount of ambient light.
“dark rooms” not necessary
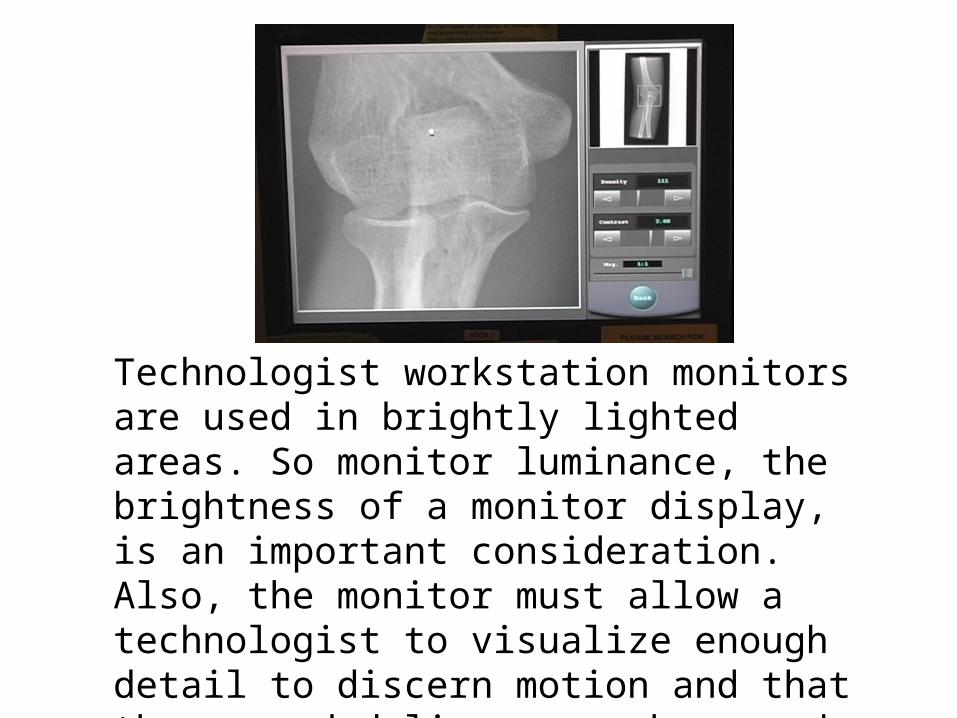
Technologist workstation monitors are used in brightly lighted areas. So monitor luminance, the brightness of a monitor display, is an important consideration. Also, the monitor must allow a technologist to visualize enough detail to discern motion and that the recorded lines are sharp and visible.

Monitor Advantages and Disadvantages
• Most consumers want a monitor that can provide the highest resolution for the best price.
• Most radiology applications have traditionally used the CRT because of its superior resolution, but as the LCD technology has progressed, more and more departments are buying the more slim and light weight LCDs to replace the bulky CRTs.
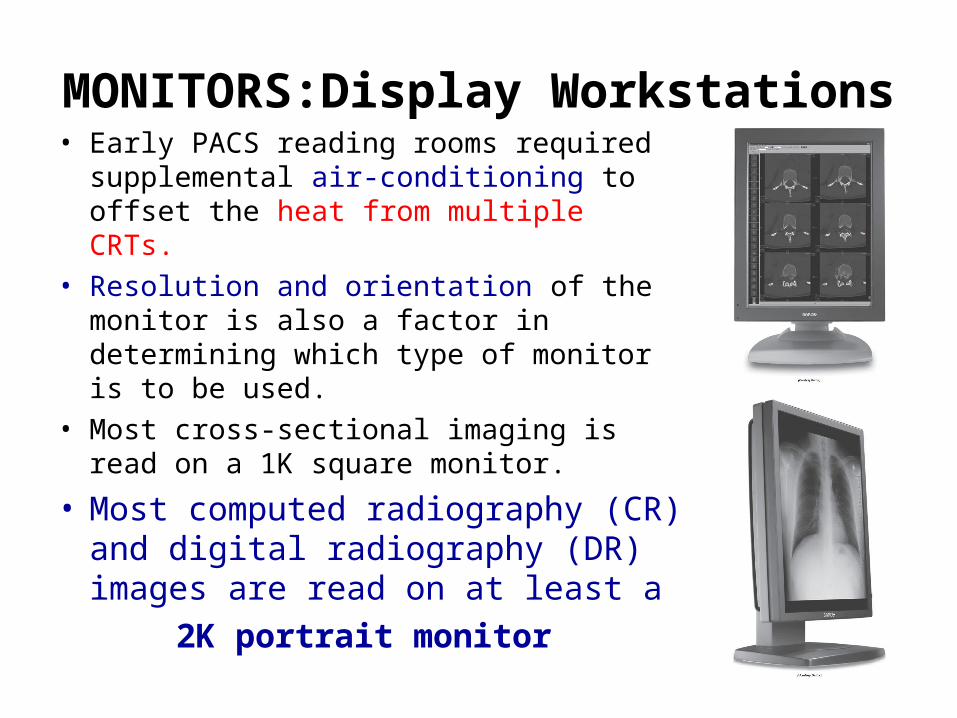
MONITORS:Display Workstations• Early PACS reading rooms required
supplemental air-conditioning to offset the heat from multiple CRTs.
• Resolution and orientation of the monitor is also a factor in determining which type of monitor is to be used.
• Most cross-sectional imaging is read on a 1K square monitor.
• Most computed radiography (CR) and digital radiography (DR) images are read on at least a
2K portrait monitor
LCD
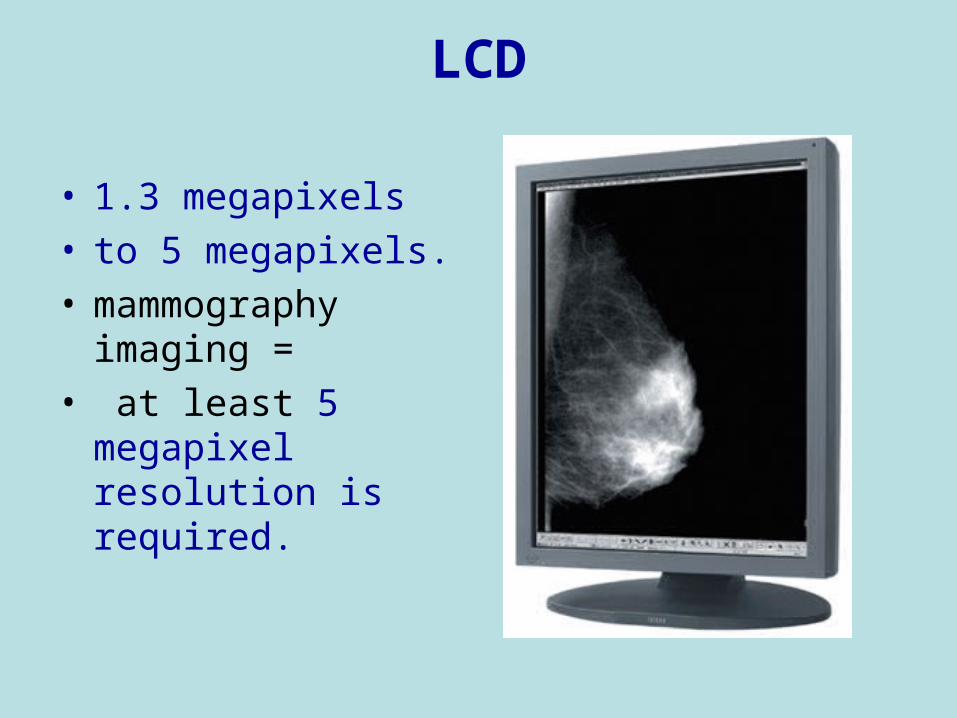
• 1.3 megapixels • to 5 megapixels. • mammography
imaging =• at least 5 megapixel
resolution is required.

CRT• The CRT is the most popular
monitor on the market.• It consists of a cathode and
anode within a vacuum tube.
• Cathode boils off a cloud of electrons, and then a potential difference is placed on the tube.
• A stream of electrons is sent across to the anode, which in the case of the monitor is a sheet of glass coated with a phosphor layer.

CRT
• Electrons strike the phosphor on the glass.
• Impact causes the glass to emit a color based on the intensity of impact and area that the electrons strike.
• The electrons interact with a red, green, or blue dot to form the color and image that is being sent from the video card signal.
CRT
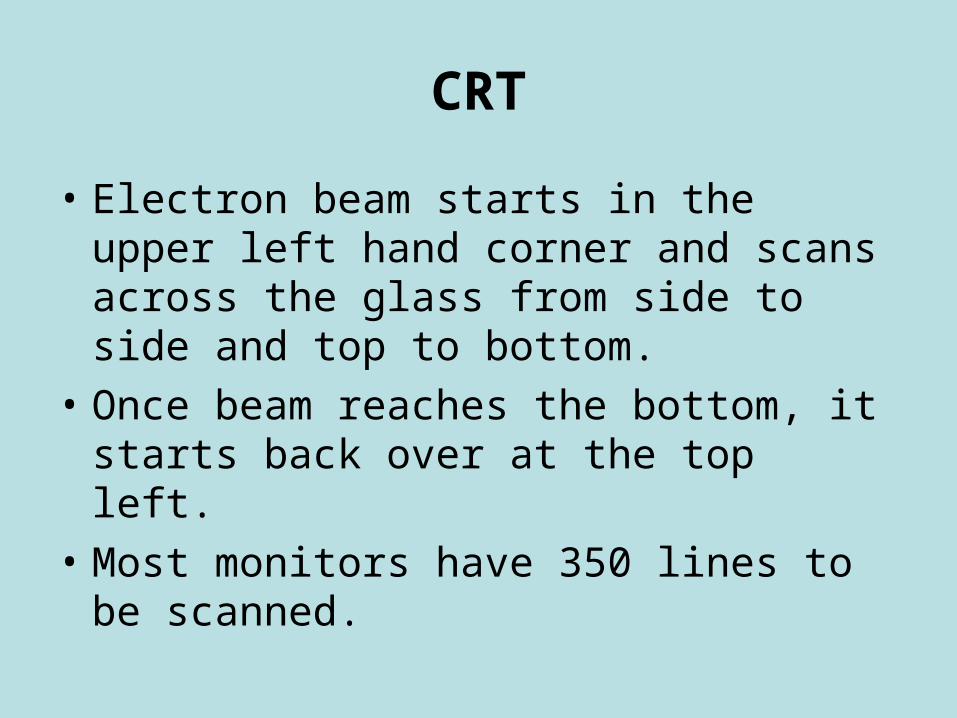
• Electron beam starts in the upper left hand corner and scans across the glass from side to side and top to bottom.
• Once beam reaches the bottom, it starts back over at the top left.
• Most monitors have 350 lines to be scanned.
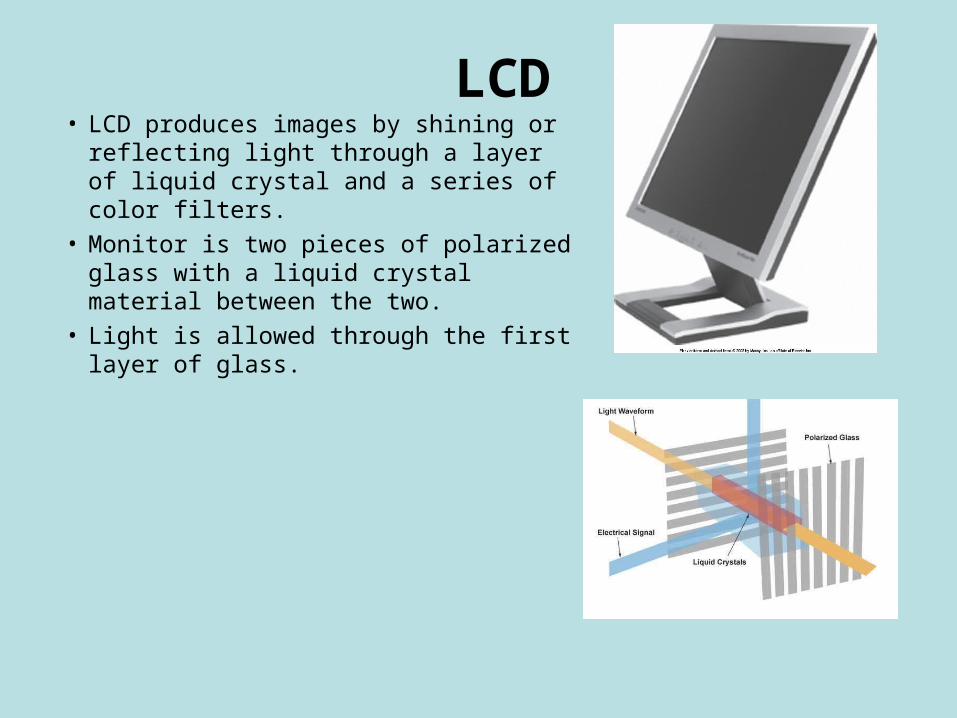
LCD• LCD produces images by shining or
reflecting light through a layer of liquid crystal and a series of color filters.
• Monitor is two pieces of polarized glass with a liquid crystal material between the two.
• Light is allowed through the first layer of glass.

LCD
• When a current is applied to the liquid crystal, it aligns and allows light in varying intensities through to the next layer of glass through color filters.
• Light forms the colors and images seen on the display.

LCD: Display Workstations
• LCD has dropped in price and has risen in quality.
• LCD will soon take over PACS display market because of its size, resolution, and lack of heat production.
• LCD requires less maintenance.

CRT vs LCD• CRT• Luminance higher in the
center• Lower measurable black
levels• Phosphor granularity
adds to spatial noise• Viewable area smaller
than stated size • Better color reproduction• More responsive on
redraw• More rugged• Aspect ratio 4:3
• LCD• Less veiling glare• Consumes less energy• Increased spatial
resolution• Larger viewing area by
described size• Display limited to
designed resolution• Can position screen• Smaller footprint and
lighter• Widescreen aspect ratio
16:9

Monitors – more terms…
• Aspect ratio• Ratio is the width of the
monitor to the height of the monitor.
• Most CRT monitors have an aspect ratio of 4:3, and LCD monitors have a ratio of 16:9.
• Viewable area• The viewable area is
measured from one corner of the display to the opposite corner diagonally.

Plasma Display
• Plasma monitors are new to the consumer market.
• They have been used in government and military applications since the late 1960s.
• They are made up a many small fluorescent lights that are illuminated to form the color of the image.
• Monitor varies the intensities of the various light combinations to produce a full range of color.

Image Display= MONITORS
• viewing conditions– (i.e.,luminance,ambient lighting)
• spatial resolution
• contrast resolution/dynamic range
• DICOM gray scale function
• window level and width function
MONITORS: Spatial Resolution
• Spatial resolution refers to the amount of detail present in any image.
• Phosphor layer thickness and pixel size determines resolution in CR.
• The thinner the phosphor layer is, the higher resolution.
• Film/screen radiography resolution at its best is limited to 10 line pairs per millimeter (lp/mm).
• CR resolution is 2.55 lp/mm to 5 lp/mm, resulting in less detail.
ARRT DEFINITIONS
MONITOR RESOLUTION
digital image characteristics
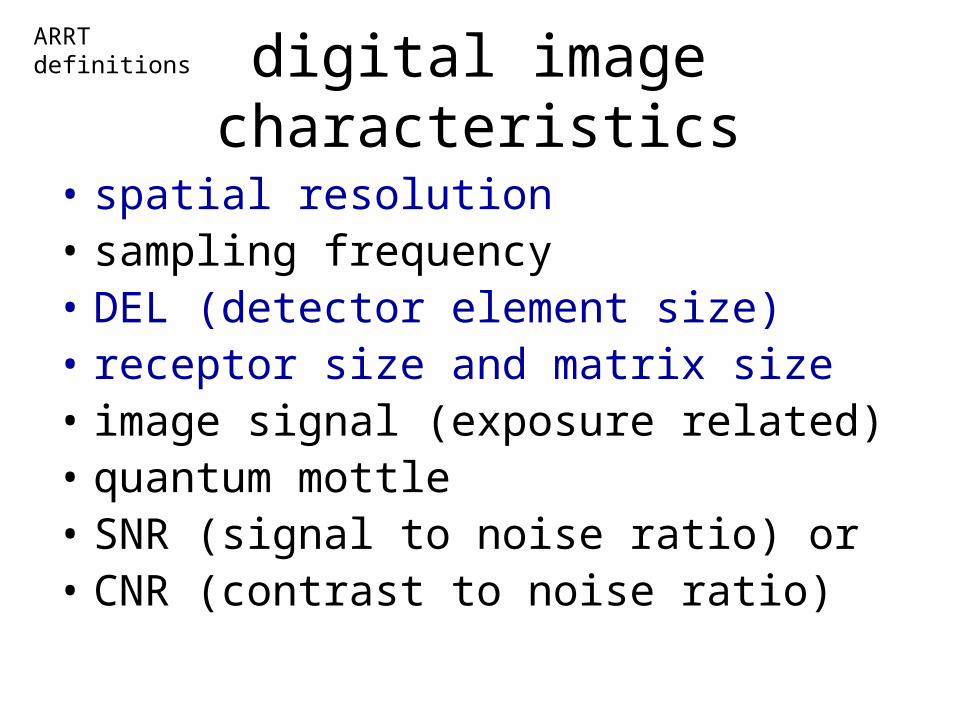
• spatial resolution• sampling frequency• DEL (detector element size)• receptor size and matrix size• image signal (exposure related)• quantum mottle• SNR (signal to noise ratio) or• CNR (contrast to noise ratio)
ARRT definitions

Spatial Resolution• A radiograph typically
does not show soft tissue structures
• Digital image shows not only the soft tissue but also the edge of the skin.
• Giving the appearance of more detail.
MONITORScontrast resolution
/dynamic range
• Appearance of more detail is due to the wider dynamic recording range / contrast resolution
• and does not mean that there is additional detail
• Because so many more densities are recorded in CR (wide dynamic range), images appear more detailed.
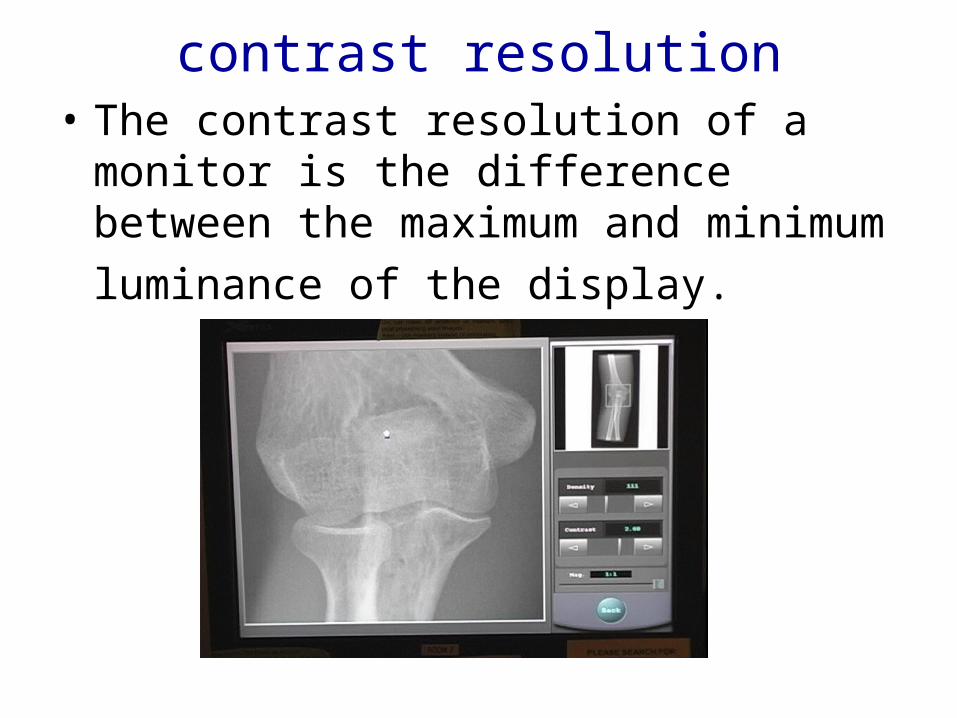
contrast resolution• The contrast resolution of a monitor is the
difference between the maximum and
minimum luminance of the display.

Exposure Latitudeor Dynamic Range
• CR and DR• Contain a detector that
can respond in a linear manner
• as compared to S shape of H&D Curve
• Exposure latitude is wide, allowing the single detector to be sensitive to a wide range of exposures.
Why do digital systems havesignificantly greater latitude?
• Linear response give the imaging plates greater latitude
• Area recieving little radiation can be enhanced by the computer
• Higher densities can be separated and brought down to the visibile density ranges
• (Brightness in DR replaces density)

Monitors - RESOLUTION• Pixel is a basic picture element on a display.
• A pixel is “any of the small discrete elements that together constitute an image.”
• Resolution -# of pixels contained on a display • Relationship:• More pixels in an image, the higher the
resolution & more information that can be displayed.
• Resolution also is defined as the process or capability of distinguishing between individual parts of an image that are adjacent.
Nyquist frequency• The highest spatial frequency that can be
recorded by a digital detector.
• is determined by the pixel pitch.
• The Nyquist frequency is half the number of pixels/mm.
• A digital system with a pixel density of 10 pixels/mm would have a Nyquist frequency of 5 line pair/mm.
sampling frequency
• The frequency that a data sample is acquired from the exposed detector.
• It is expressed in pixel pitch and pixels per mm. • Sampling frequency may be determined by
receptor size depending on the vendor. • KODAK 8x10 better detail than 14x17• Use of the smallest imaging plate possible for
each exam results in the highest sampling rate.• When the smallest possible imaging plate is selected, a corresponding matrix is used
by the computer algorithm to process the image.
ARRT definitions

Pixel “picture element,” • the smallest area represented in a digital
image.
• A digital radiography image consists of a matrix of pixels which is typically several thousand pixels in each direction.
• Pixel density – A term that describes the number of pixels/mm in an image. Pixel density is determined by the pixel pitch.

• a pixel or picture element.
• The typical number of pixels in a matrix range from about 512 × 512 to 1024 × 1024 and can be as large as 2500 × 2500.
• The more pixels there are, the greater the image resolution.
• The image is digitized by position (spatial location) and by intensity (gray level).
DEL (detector element size)receptor size and matrix size
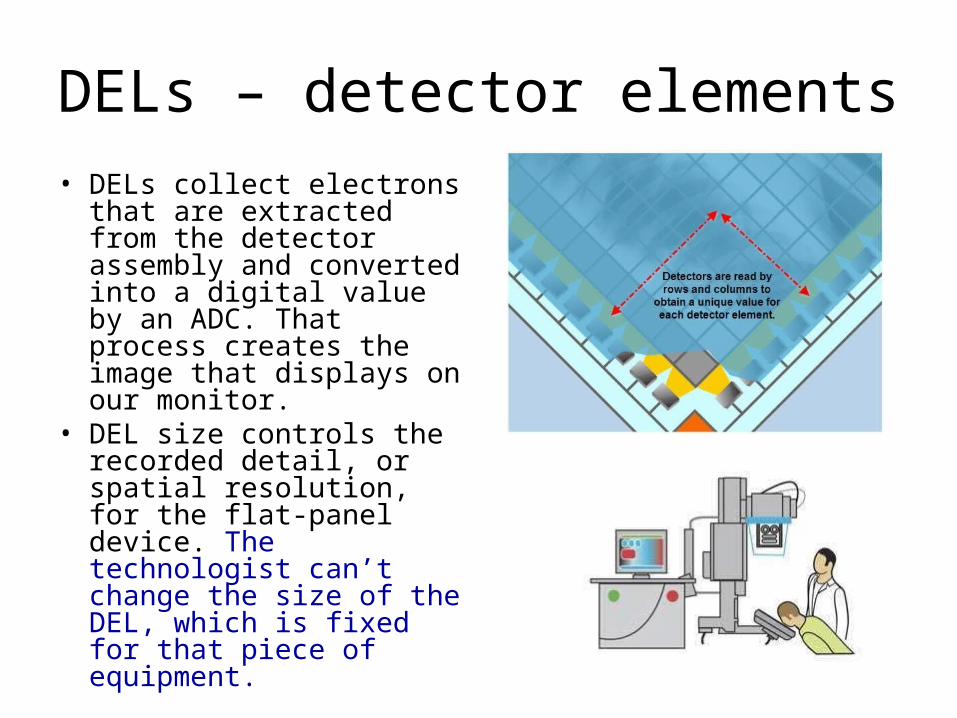
DELs – detector elements
• DELs collect electrons that are extracted from the detector assembly and converted into a digital value by an ADC. That process creates the image that displays on our monitor.
• DEL size controls the recorded detail, or spatial resolution, for the flat-panel device. The technologist can’t change the size of the DEL, which is fixed for that piece of equipment.
• .

Detective Quantum Efficiency
• Known as the fill factor, the larger the area of the TFT photodiodes, the more radiation can be detected and the greater amount of signal generated.
• Consequently, the greater the area of the TFT array, the higher the DQE.
• Over 1 million pixels are read & converted

FILL FACTOR• A field-effect transistor (FET) or silicon TFT
• Isolates each pixel element • Reacts like a switch to send the electrical charges to
the image processor

Detective Quantum Efficiency
• How efficiently a system converts the x-ray input signal into a useful output image is known as detective quantum efficiency, or DQE.
• DQE is a measurement of the percentage of x-rays that are absorbed when they hit the detector.

Detective Quantum Efficiency
• In other words, CR records all of the phosphor output. Systems with higher quantum efficiency can produce higher-quality images at a lower dose.
• Indirect and direct DR capture technology has increased DQE over CR.
• However, DR direct capture technology, because it does not have the light conversion step and consequently no light spread, increases DQE the most.
SNR (signal to noise ratio) orCNR (contrast to noise ratio)
• SNR (signal to noise ratio): there is always a very small electric current flowing in any circuit - is called background electronic noise.
• It is similar to the fog on a radiograph in that it conveys no information and serves only to obscure the electronic signal.
• CNR (contrast to noise ratio): measure for assessing the ability of imaging an procedure to generate clinically useful image contrast.
• gives an objective measure of useful contrast.
ARRT definitions
Image Display
• spatial resolutioncontrast resolution/dynamic range

• What is a 3-D array of Pixels ?
• A voxel (a volumetric pixel) is a volume element, representing a 3-D value space. A pixel which represents 2D image data.

Pixel Pitch
• The space from the center of a pixel to the center of the adjacent pixel. It is measured in microns (μm).
• Pixel pitch is determined by sampling frequency for cassette-based PSP systems and by DEL spacing for TFT flat panel.

The Nyquist Theorem
• Theorem states that when sampling a signal, the sampling frequency must be greater than twice the bandwidth of the input signal so that the reconstruction of the original image will be nearly perfect.
• At least twice the number of pixels needed to form the image must be sampled.
• If too few pixels are sampled, the result is a lack of resolution.

Monitors: Display Workstations
• Pixels are arranged in a matrix. • Common screen resolutions found on today’s
monitors are the following:• 1280 × 1024 (1K)• 1600 × 1200 (2K)• 2048 × 1536 (3K)• 2048 × 2560 (5K)

Monitors – DOT PITCH
• Dot pitch is the measurement of how close the dots are located to one another within a pixel.• The smaller the dot pitch of a display, the finer the
resolution. • Dot pitch may be expressed as aperture grille pitch or
slot pitch.

Monitors – REFRESH RATE
• Refresh rate or vertical scanning rate• Refresh rate is a measure of how fast the monitor
rewrites the screen or the number of times that the image is redrawn on the display each second.
• Refresh rate helps to control the flicker seen by the user.
• The higher the refresh rate, the less flicker will be seen.
• Most refresh rates on today’s computer are set between 60 and 75 Hz; the image is redrawn 60 to 75 timers per second.

Image Display= MONITORS
• viewing conditions– (i.e.,luminance,ambient lighting)
• spatial resolution
• contrast resolution/dynamic range
• DICOM gray scale function
• window level and width function

MONITOR RESOLUTIONDICOM gray scale function – calibration of monitors to the same standard & communication of images•Window level affects brightness (density) - B•Window width function affects contrast/gray scale - A
“windowing and level”
MONITOR Image Manipulation and Enhancement Functions
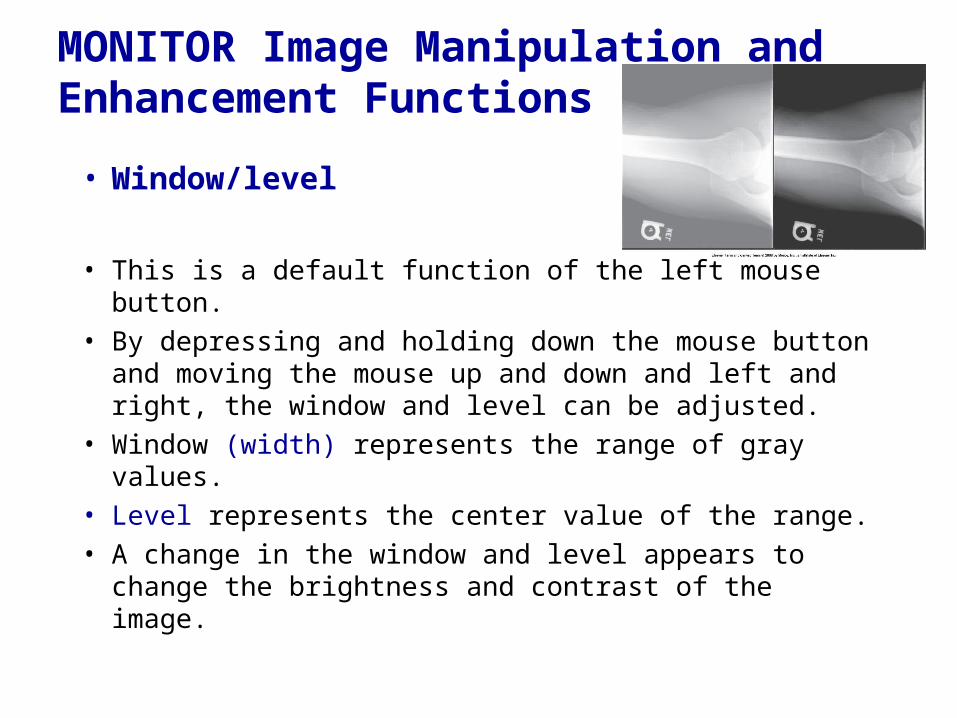
• Window/level
• This is a default function of the left mouse button.• By depressing and holding down the mouse button
and moving the mouse up and down and left and right, the window and level can be adjusted.
• Window (width) represents the range of gray values.• Level represents the center value of the range. • A change in the window and level appears to change
the brightness and contrast of the image.

Image Manipulation and Enhancement Functions
• Other Tools: Annotations• Annotations are NOT to be used • to label left or right to indicate the patient’s side.• Annotations are used to indicate prone or
supine, 30 minutes, upright or flat.• Any other image information is appropriate.• Radiologist will place arrows or circles around
pathologic or questionable areas.

MONITOR Image Manipulation and Enhancement Functions
• Pan, zoom, and magnify • Tools are used primarily by the
radiologist to increase the size of an area on the image.
• Magnify usually magnifies a square area of the image
• Pan and zoom functions are usually used together.
• Image is first zoomed up to the desired magnification level then Pan icon is activated.
• Zoomed image can be moved around to view the different areas of the image.

Image Manipulation and Enhancement Functions
• Measurements• Size of a pixel is a known
so the software
has the ability to measure
structures on the image
based on this.• Angle measurement.
– Can give an angle measurement between two structures
– Commonly used when reading spine studies

Image Manipulation and Enhancement Functions
• Measurements– Region of interest– Measurement tool determines the pixel intensity of a
certain area.– Each type of tissue or fluid has a different intensity of
reading.– Radiologist can make a determination whether
something is solid or fluid.
– Each pixel can have a gray level between 0 (20) and 4096 (212). The gray level will be a factor in determining the quality of the image

DR
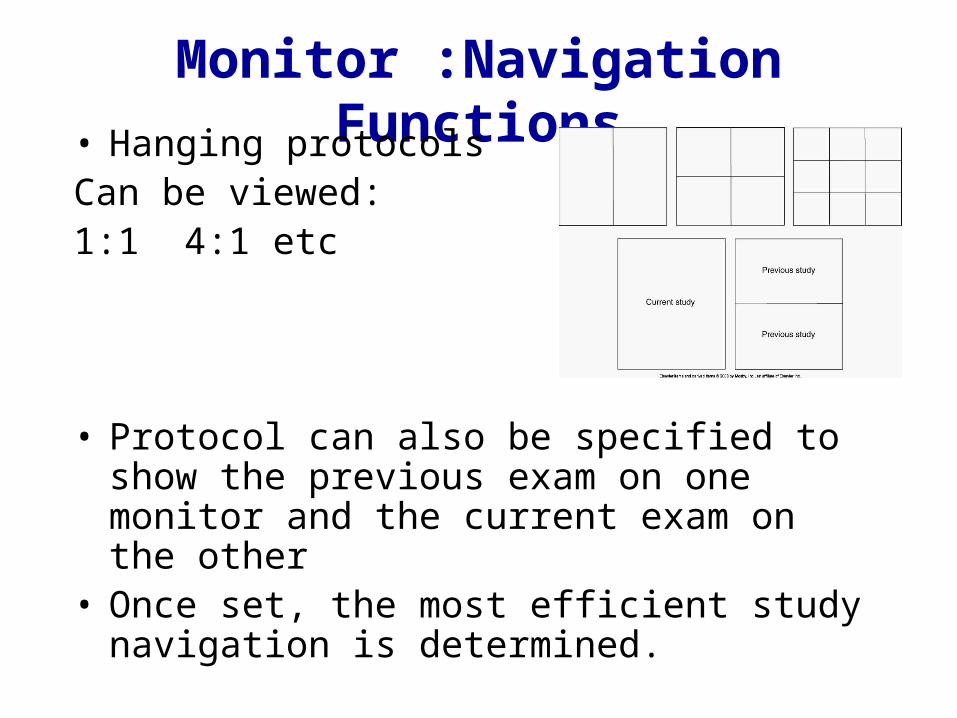
Monitor :Navigation Functions• Hanging protocolsCan be viewed:1:1 4:1 etc
• Protocol can also be specified to show the previous exam on one monitor and the current exam on the other
• Once set, the most efficient study navigation is determined.
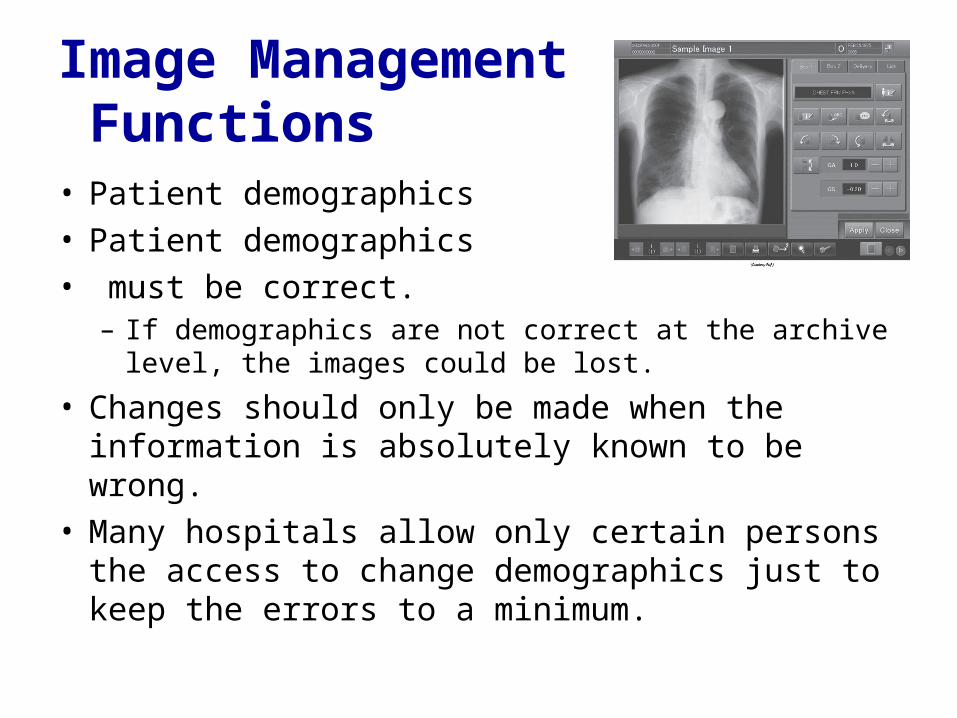
Image Management Functions • Patient demographics• Patient demographics• must be correct.
– If demographics are not correct at the archive level, the images could be lost.
• Changes should only be made when the information is absolutely known to be wrong.
• Many hospitals allow only certain persons the access to change demographics just to keep the errors to a minimum.
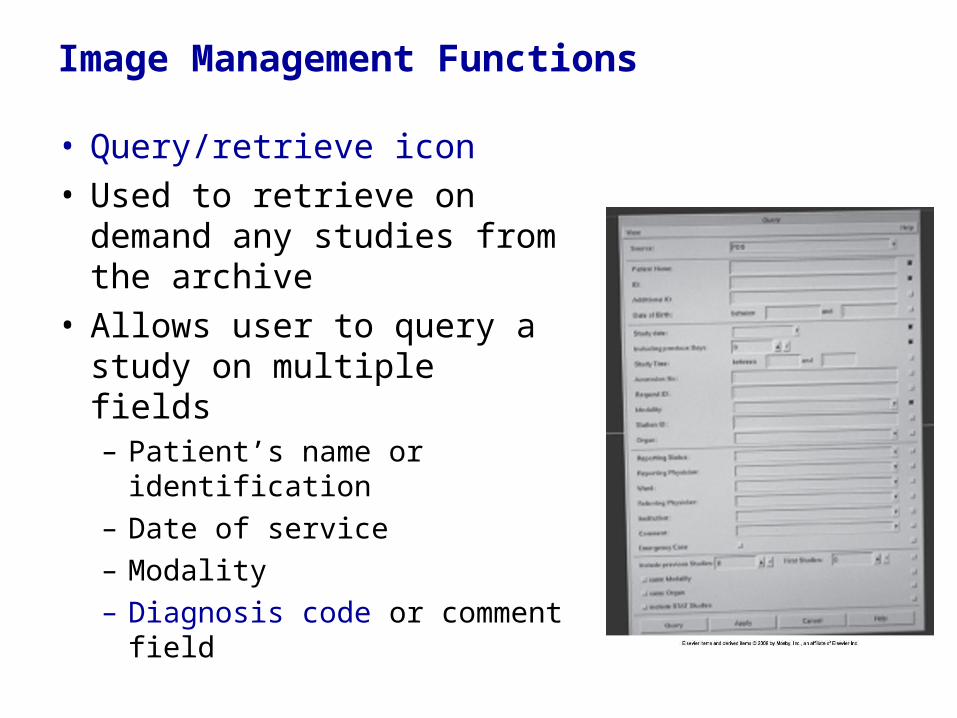
Image Management Functions
• Query/retrieve icon• Used to retrieve on demand
any studies from the archive• Allows user to query a study
on multiple fields– Patient’s name or identification– Date of service– Modality– Diagnosis code or comment
field

WINDOW LEVEL / WIDTHWhich one controls
Denisty (brightness) ?Contrast
What else control these in DIGITAL IMAGING?

Enhanced Visualization Image Processing
• Takes image diagnostic quality to a new level• Increases latitude while preserving contrast• Process decreases windowing and leveling• Virtually eliminates detail loss in dense tissues

Contrast / Denisty (Brightness)
• CR and DR• Kilovoltage peak still influences subject
contrast, but radiographic contrast is primarily controlled by an image processing look-up table. LUT
• Milliampere-second setting has more control over image noise, whereas density is controlled by image-processing algorithms.

Physician Review Stations Monitors• Step-down model of the radiologist’s reading
station (lower res)• Some functions reduced• One of the most important features • is ability to view current and previous reports
with images.• Many vendors are integrating • the RIS functions • with PACS software.

Technologist QC Stations• review images after acquisition but
before sending them to the radiologist• May be used to improve or adjust
image-quality characteristics • May be used to verify patient
demographic information• Placed between the CR and DR
acquisition modalities as a pass-through to ensure that the images have met the departmental quality standard
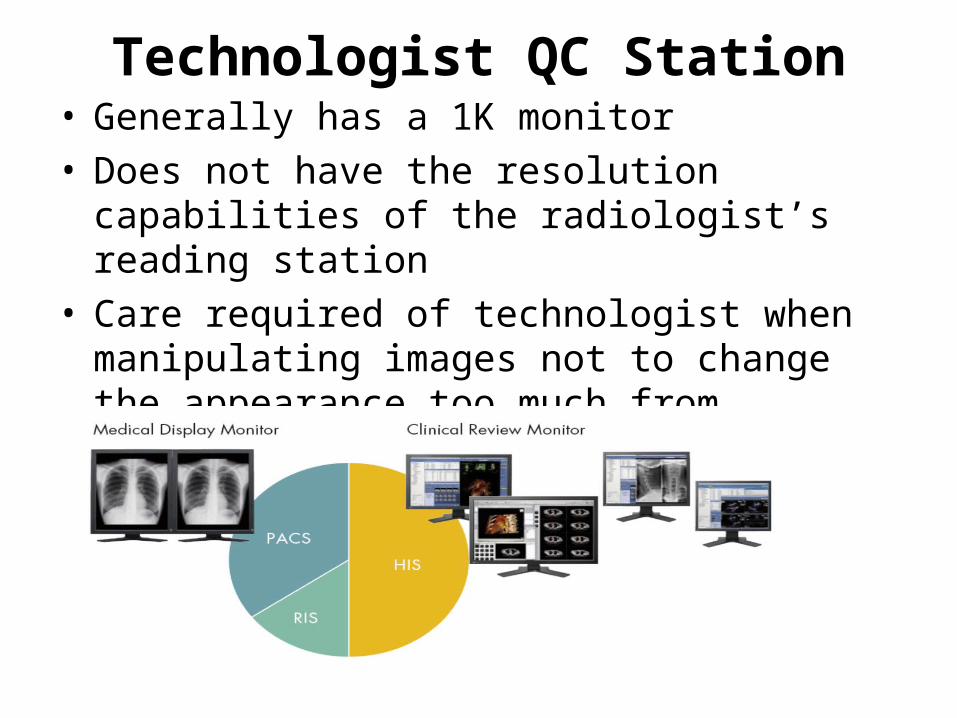
Technologist QC Station• Generally has a 1K monitor• Does not have the resolution capabilities of the
radiologist’s reading station• Care required of technologist when manipulating
images not to change the appearance too much from original acquired image
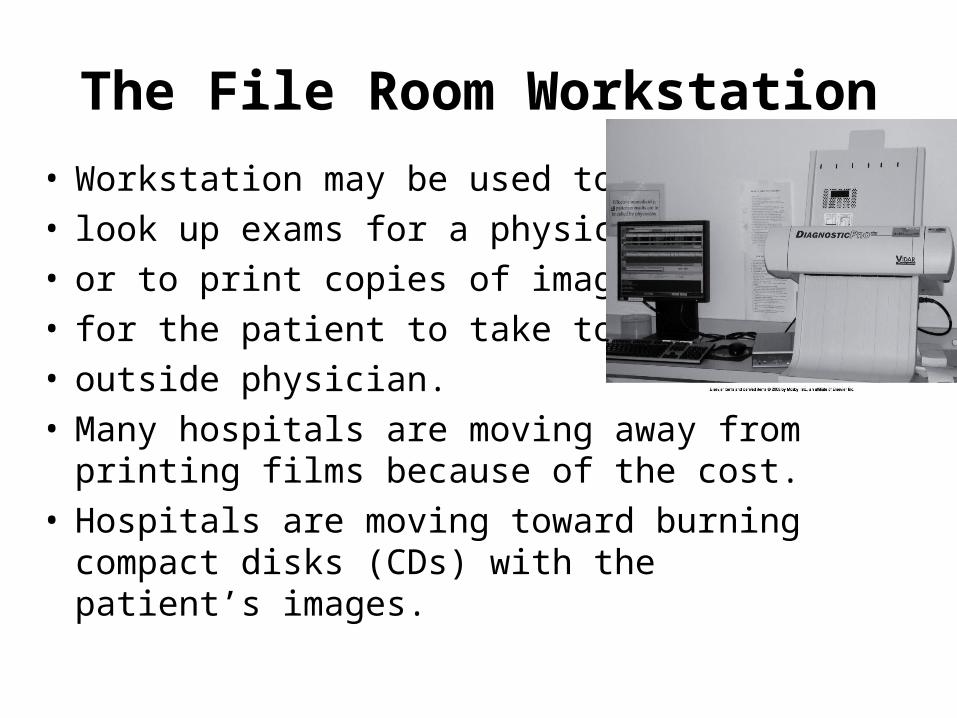
The File Room Workstation
• Workstation may be used to • look up exams for a physician • or to print copies of images • for the patient to take to an • outside physician.• Many hospitals are moving away from
printing films because of the cost.• Hospitals are moving toward burning
compact disks (CDs) with the patient’s images.
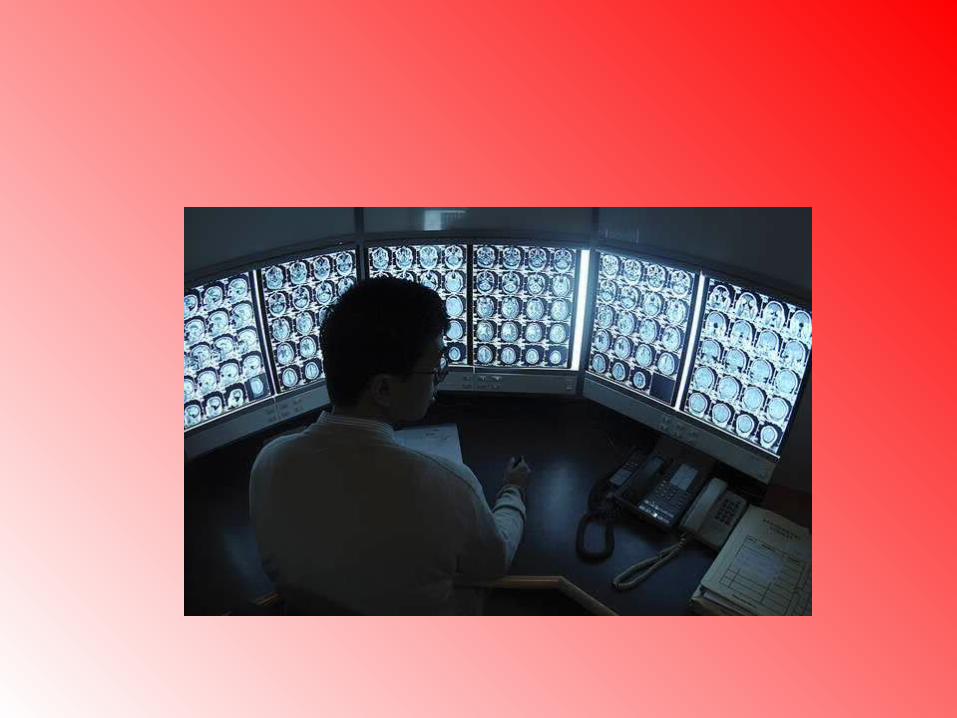
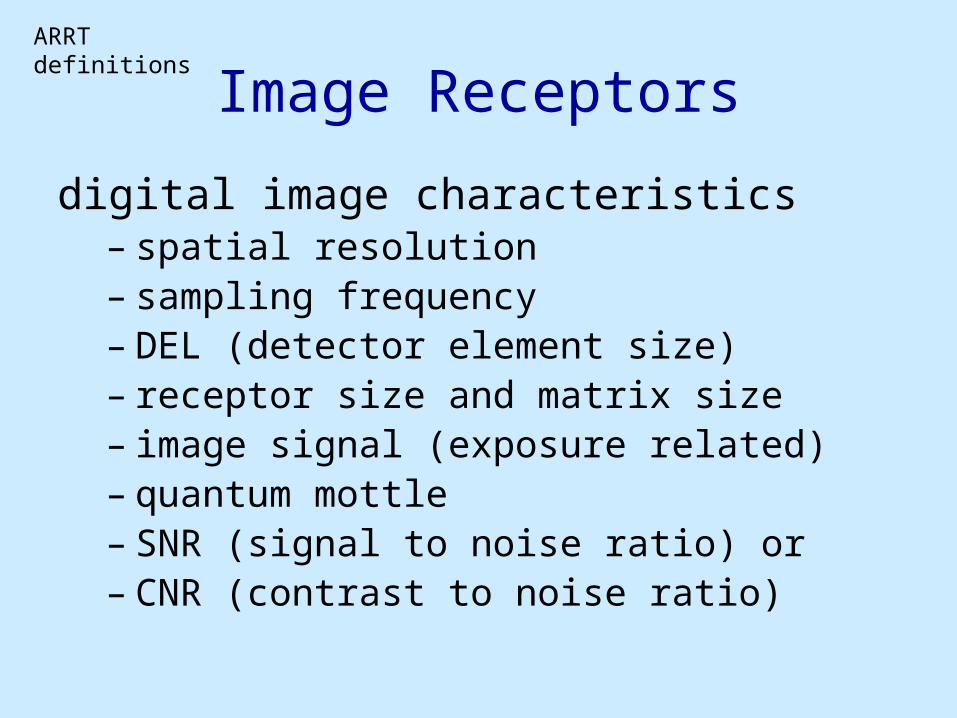
Image Receptors
digital image characteristics– spatial resolution– sampling frequency– DEL (detector element size)– receptor size and matrix size– image signal (exposure related)– quantum mottle– SNR (signal to noise ratio) or– CNR (contrast to noise ratio)
ARRT definitions

image signal (exposure related) Exposure Indicators
• The amount of light given off by the imaging plate is a result of the radiation exposure that the plate has received.
• The light is converted into a signal that is used to calculate the exposure indicator number, which is a different number from one vendor to another.

Digital artifacts
• Grid Lines: Appear as grid cutoff. • Moire (Aliasing)
– wavy artifact occurs because the grid lines and the scanning laser are parallel.
– When the spatial frequency is greater than the Nyquist frequency
• Maintenance (e.g., detector fog): When errors occur in equipment performance, corrective action must occur. These corrections will generally be done by service personnel employed by the vendor.
• non-uniformity, erasure - blub problems

How else can Morie OCCUR?

quantum mottleARRT definitions
failure of an imaging system to record densities usually caused by a lack of x-ray photons.
“PHOTON STARVED”
KVP & MAS HOW IS THIS AFFECTED IN DR / CR?

Image Receptors
digital image characteristics– spatial resolution– sampling frequency– DEL (detector element size)– receptor size and matrix size– image signal (exposure related)– quantum mottle– SNR (signal to noise ratio) or– CNR (contrast to noise ratio)
ARRT definitions

Image Acquisition and Readout
• PSP (photo-stimulable phosphor)
• flat panel detectors – (direct and indirect)
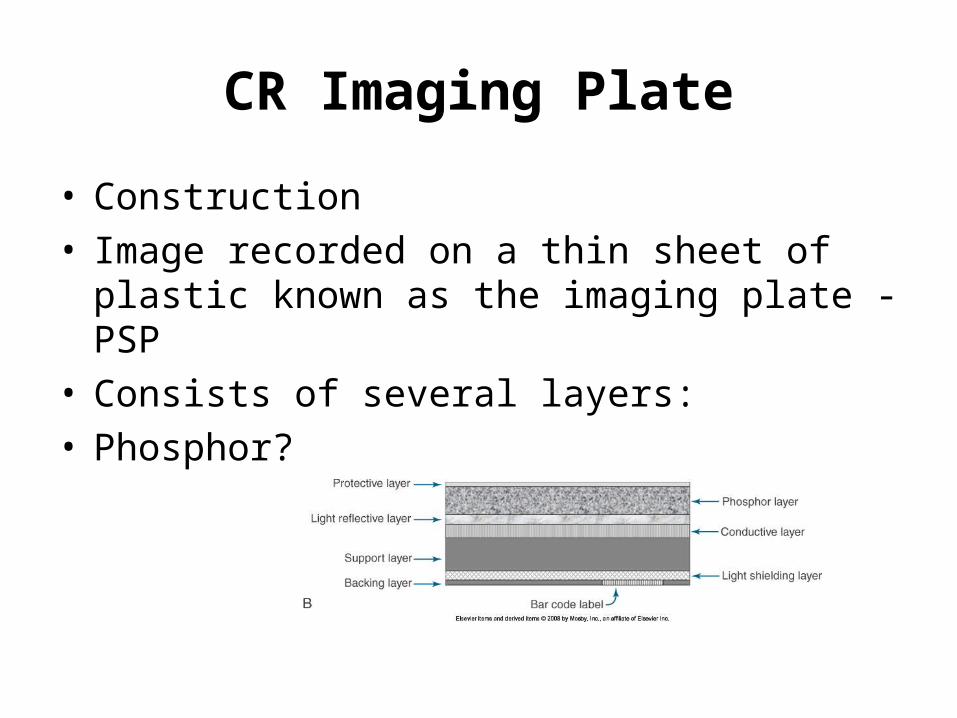
CR Imaging Plate
• Construction• Image recorded on a thin sheet of plastic known
as the imaging plate - PSP• Consists of several layers:• Phosphor?

Imaging Plate
• Phosphor?
• BARIUM FLUORO HALIDE WITH A EUROPIUM BASE

• Two types of digital radiography• Indirect capture DR
• Machine absorbs x-rays and converts them to light.
• CCD or thin-film transistor (TFT) converts light to electric signals.
• Computer processes electric signals.• Images are viewed on computer
monitor.
Digital Radiography

• Direct capture DR• Photoconductor
absorbs x-rays.• TFT collects signal.• Electrical signal is
sent to computer for processing.
• Image is viewed on computer screen.
Digital Radiography

Image Acquisition and Readout
flat panel detectors
Phosphors? – direct = Am SELENIUM
– indirect = Am SILICON
• Digital Systems• electronic collimation• grayscale rendition or look-up table (LUT)• edge enhancement/
– noise suppression
• contrast enhancement• system malfunctions (e.g., ghost image,
banding, erasure, dead pixels, readout problems, printer distortion)

Image Data Recognitionand Preprocessing shutter
• Agfa uses the term collimation, Kodak uses the term segmentation, and Fuji uses the phrase “exposure data recognition.”
• All systems use a region of interest to define the area where the part to be examined is recognized and the exposure outside the region of interest is subtracted.

• Excessive exposure to receptor without rescaling.
• Excessive exposure to receptor with rescaling.
•So in essence, rescaling provided an acceptable image, despite an excess level of exposure to the receptor.
What about the dose to the patient?

• Rescaling the image pixel values to appear appropriate, display properly, can lead to overexposing a patient. The visual cue to the technologist that overexposure has occurred isn’t present. With an analog system, a technologist would have seen the image on the left as it came out of the processor and used the excessive density of the image as a visual cue to repeat the image. Rescaling forces a technologist to look elsewhere for signs that a proper exposure was used to produce an image.
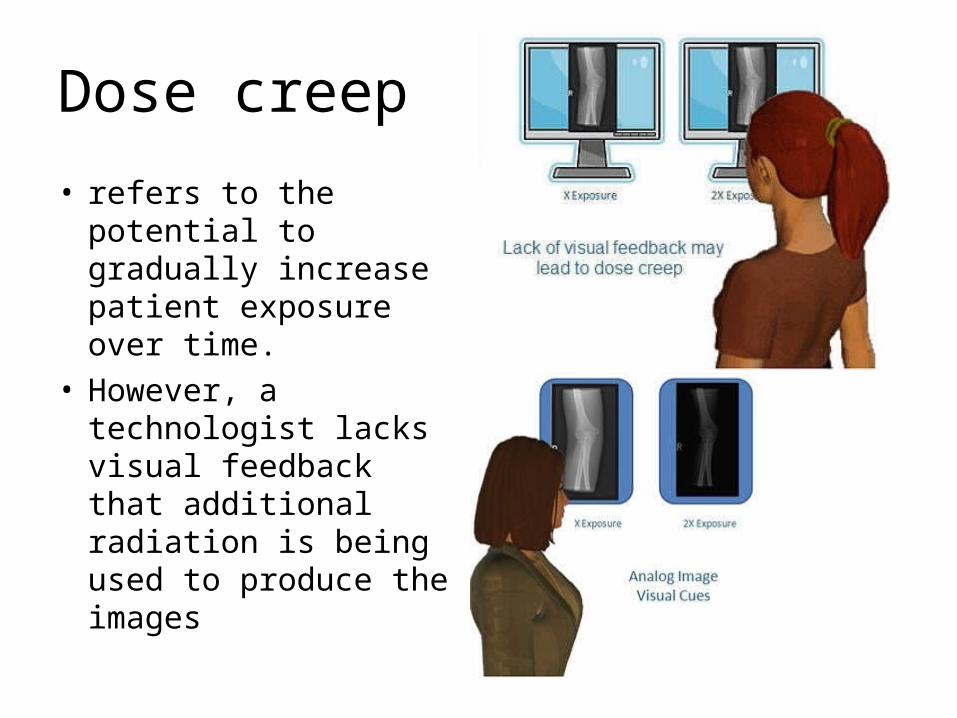
Dose creep
• refers to the potential to gradually increase patient exposure over time.
• However, a technologist lacks visual feedback that additional radiation is being used to produce the images

DAP
• The dose area product (DAP) meter is a device that may be interlinked with the x-ray unit to determine the actual patient entrance skin exposure dose with accurately calibrated equipment. Currently, no standards are established for using a dose area product meter
These two radiographs show the difference in entrance skin exposure measured by the DAP meter. The area with a smaller exposure field size carries a lower exposure without reducing image quality
Image Evaluation:Brightness and Contrast in Images
• Exposure Field Recognition Error
• Gross Overexposure
• Excessive Scatter Striking the Receptor
• Excessive Fog on the Receptor
• Grid Cutoff
• Intra-Field or Off-Focus Radiation
• Wrong Menu Selection
ARRT SPECS - DIGITAL
• PACS
• HIS (hospital information system) - work list
• RIS (radiology information system)
• DICOM
• Workflow (inappropriate documentation, lost images, mismatched images, corrupt data)
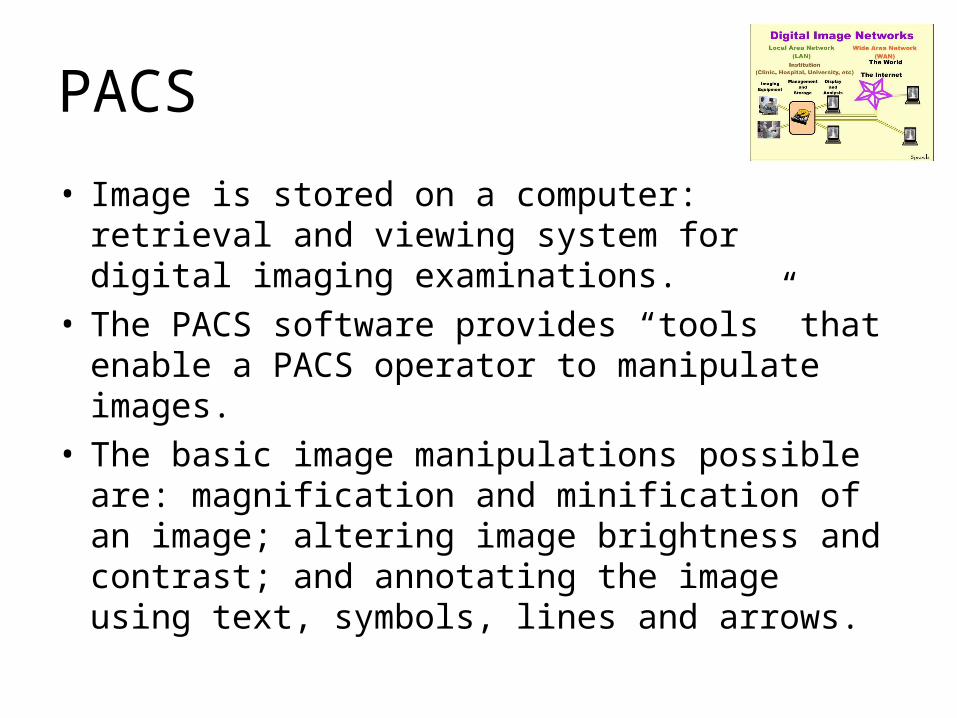
PACS
• Image is stored on a computer: retrieval and viewing system for digital imaging examinations.
• The PACS software provides “tools” that enable a PACS operator to manipulate images.
• The basic image manipulations possible are: magnification and minification of an image; altering image brightness and contrast; and annotating the image using text, symbols, lines and arrows.

Picture Archival andCommunication Systems
• Networked group of computers, servers, and archives to store digital images
• Can accept any image that is in DICOM format
• Serves as the file room, reading room, duplicator, and courier
• Provides image access to multiple users at the same time, on-demand images, electronic annotations of images, and specialty image processing
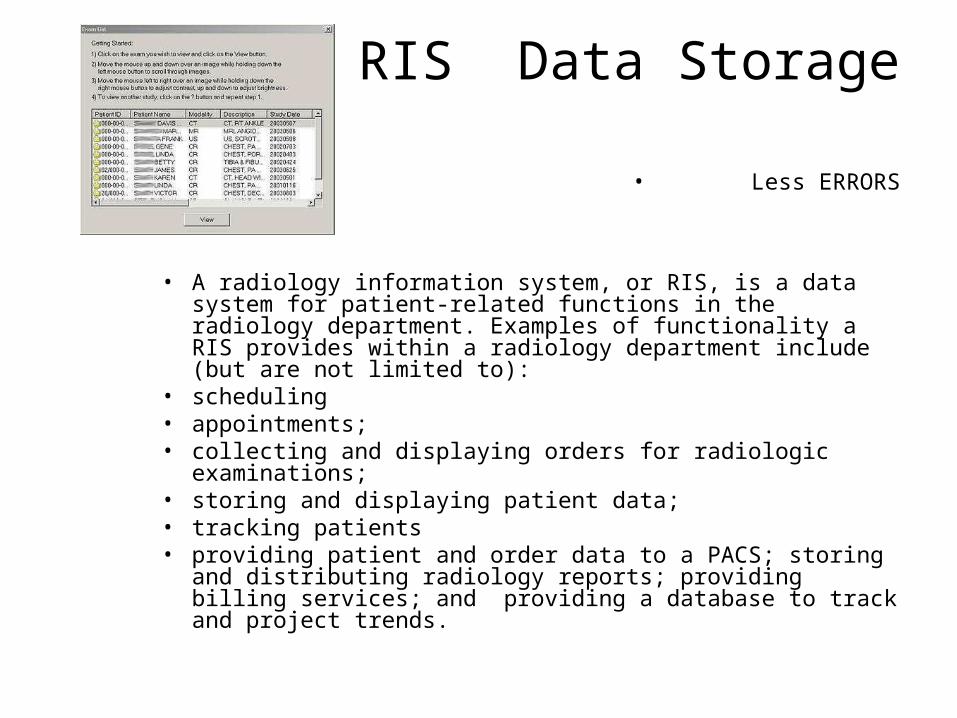
RIS Data Storage
• Less ERRORS
• A radiology information system, or RIS, is a data system for patient-related functions in the radiology department. Examples of functionality a RIS provides within a radiology department include (but are not limited to):
• scheduling • appointments; • collecting and displaying orders for radiologic
examinations;• storing and displaying patient data; • tracking patients • providing patient and order data to a PACS; storing and
distributing radiology reports; providing billing services; and providing a database to track and project trends.

HIS
• A hospital information system, or HIS, is a paper and/or data system that manages the administrative, financial and clinical information necessary to operate a hospital or health care system
Health Level 7 (HL7)
• HL7 are the software standards established for exchanging electronic information in health care. PACS is mainly concerned with images and data associated with images, whereas HL7 sets standards for transmitting text-based information throughout a medical center.

Next
• ODIA - Register
• Review Modules 5 & 6 (& 11 ??)
• Do study test at end of modules -
• ?Print out certificate of completion