Embed Size (px)
Citation preview
STRUCTURED FINANCE
SECTOR IN-DEPTH18 September 2017
TABLE OF CONTENTS
Contacts
Alena Chen 612-9270-8131VP-Senior [email protected]
CLIENT SERVICES
Americas 1-212-553-1653
Asia Pacific 852-3551-3077
Japan 81-3-5408-4100
EMEA 44-20-7772-5454
RMBS - Australia
Mortgage delinquency map: Home loanarrears rise to five-year highSummaryThe proportion of Australian residential mortgages that were more than 30 days in arrears(30+ delinquency rate) increased to 1.62% in May 2017, the highest rate in five years.Higher delinquencies raise the risk of mortgage defaults and are therefore credit negative forAustralian residential mortgage-backed securities (RMBS).
Mortgage delinquencies increased to record highs in Western Australia, the NorthernTerritory and South Australia, and were also up in Queensland and the Australian CapitalTerritory (ACT) over the year to May 2017. Delinquencies declined in New South Wales(NSW) and Victoria, and fell slightly from record high levels in Tasmania.
We expect mortgage delinquencies to continue to increase through the remainder of 2017.Weaker conditions in states reliant on the mining industry, high underemployment, and lessfavourable housing market and income dynamics will continue to drive delinquencies higher.
Regions with exposure to the resource and mining sectors dominated the list of areaswith the highest delinquencies in May 2017. Eight of the 10 regions with the highest 30+delinquency rates were in either Western Australia or Queensland, and many of these regionsare exposed to employment industries directly or indirectly related to mining and resources.
The ten regions with the lowest mortgage delinquencies in Australia in May 2017 were allin Sydney and Melbourne, where housing market and economic conditions were the mostsupportive for mortgage borrowers.
Our semi-annual mortgage delinquency map report provides a detailed analysis of the rate ofresidential mortgage arrears at a national, regional and postcode level in Australia. This reportis based on the data contained in our supplementary excel report, titled “Australian residentialmortgage delinquency map – May 2017” published on 18 September 2017.
MOODY'S INVESTORS SERVICE STRUCTURED FINANCE
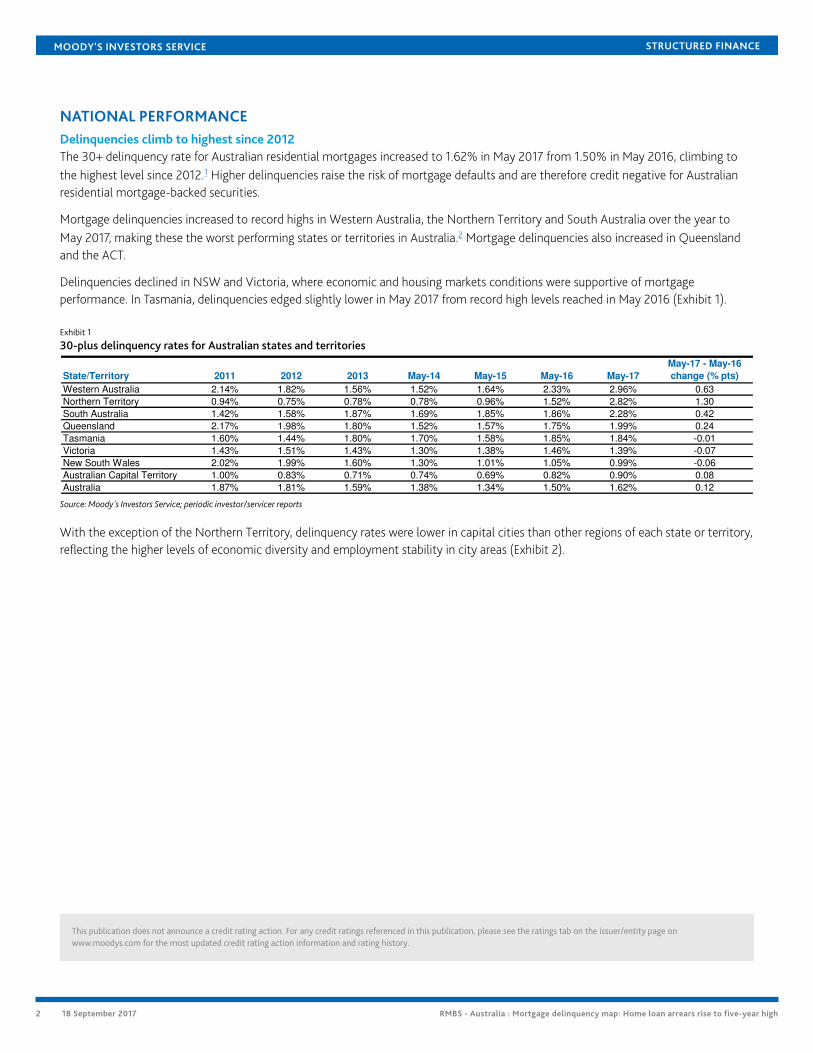
NATIONAL PERFORMANCEDelinquencies climb to highest since 2012The 30+ delinquency rate for Australian residential mortgages increased to 1.62% in May 2017 from 1.50% in May 2016, climbing tothe highest level since 2012.1 Higher delinquencies raise the risk of mortgage defaults and are therefore credit negative for Australianresidential mortgage-backed securities.
Mortgage delinquencies increased to record highs in Western Australia, the Northern Territory and South Australia over the year toMay 2017, making these the worst performing states or territories in Australia.2 Mortgage delinquencies also increased in Queenslandand the ACT.
Delinquencies declined in NSW and Victoria, where economic and housing markets conditions were supportive of mortgageperformance. In Tasmania, delinquencies edged slightly lower in May 2017 from record high levels reached in May 2016 (Exhibit 1).
Exhibit 1
30-plus delinquency rates for Australian states and territories
State/Territory 2011 2012 2013 May-14 May-15 May-16 May-17
May-17 - May-16
change (% pts)
Western Australia 2.14% 1.82% 1.56% 1.52% 1.64% 2.33% 2.96% 0.63
Northern Territory 0.94% 0.75% 0.78% 0.78% 0.96% 1.52% 2.82% 1.30
South Australia 1.42% 1.58% 1.87% 1.69% 1.85% 1.86% 2.28% 0.42
Queensland 2.17% 1.98% 1.80% 1.52% 1.57% 1.75% 1.99% 0.24
Tasmania 1.60% 1.44% 1.80% 1.70% 1.58% 1.85% 1.84% -0.01
Victoria 1.43% 1.51% 1.43% 1.30% 1.38% 1.46% 1.39% -0.07
New South Wales 2.02% 1.99% 1.60% 1.30% 1.01% 1.05% 0.99% -0.06
Australian Capital Territory 1.00% 0.83% 0.71% 0.74% 0.69% 0.82% 0.90% 0.08
Australia 1.87% 1.81% 1.59% 1.38% 1.34% 1.50% 1.62% 0.12
Source: Moody's Investors Service; periodic investor/servicer reports
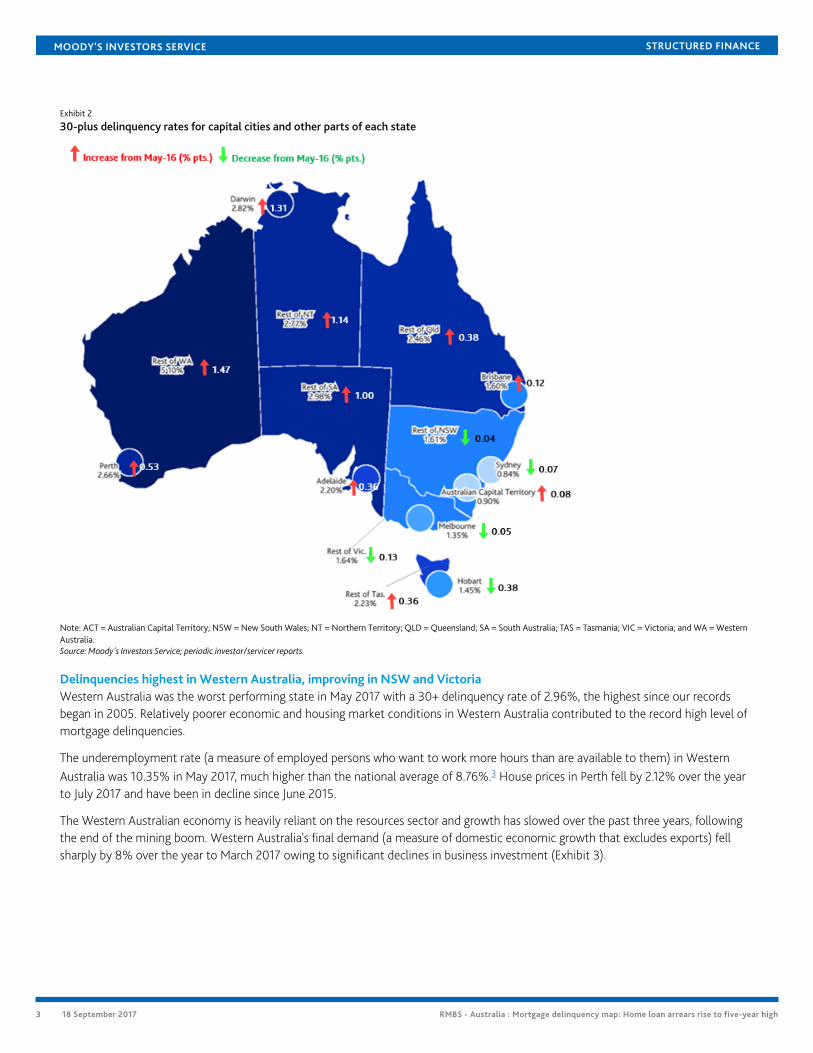
With the exception of the Northern Territory, delinquency rates were lower in capital cities than other regions of each state or territory,reflecting the higher levels of economic diversity and employment stability in city areas (Exhibit 2).
This publication does not announce a credit rating action. For any credit ratings referenced in this publication, please see the ratings tab on the issuer/entity page onwww.moodys.com for the most updated credit rating action information and rating history.
2 18 September 2017 RMBS - Australia : Mortgage delinquency map: Home loan arrears rise to five-year high
MOODY'S INVESTORS SERVICE STRUCTURED FINANCE
Exhibit 2
30-plus delinquency rates for capital cities and other parts of each state
Note: ACT = Australian Capital Territory; NSW = New South Wales; NT = Northern Territory; QLD = Queensland; SA = South Australia; TAS = Tasmania; VIC = Victoria; and WA = WesternAustralia.Source: Moody's Investors Service; periodic investor/servicer reports
Delinquencies highest in Western Australia, improving in NSW and VictoriaWestern Australia was the worst performing state in May 2017 with a 30+ delinquency rate of 2.96%, the highest since our recordsbegan in 2005. Relatively poorer economic and housing market conditions in Western Australia contributed to the record high level ofmortgage delinquencies.
The underemployment rate (a measure of employed persons who want to work more hours than are available to them) in WesternAustralia was 10.35% in May 2017, much higher than the national average of 8.76%.3 House prices in Perth fell by 2.12% over the yearto July 2017 and have been in decline since June 2015.
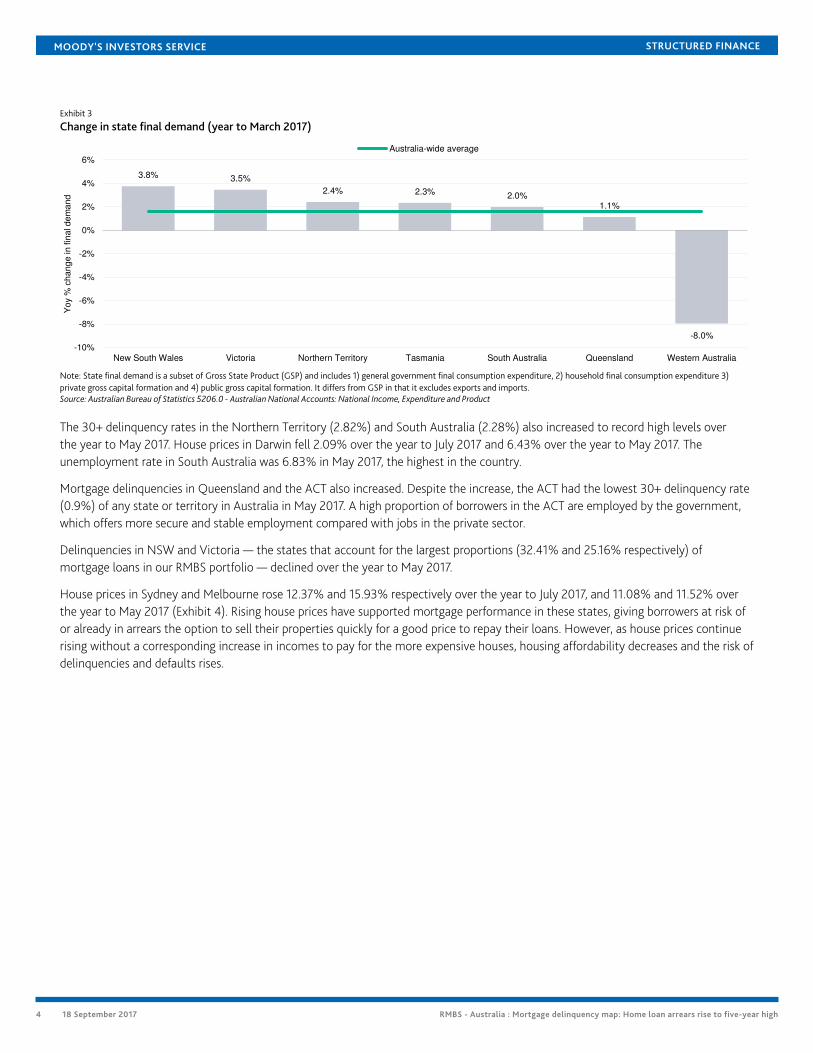
The Western Australian economy is heavily reliant on the resources sector and growth has slowed over the past three years, followingthe end of the mining boom. Western Australia's final demand (a measure of domestic economic growth that excludes exports) fellsharply by 8% over the year to March 2017 owing to significant declines in business investment (Exhibit 3).
3 18 September 2017 RMBS - Australia : Mortgage delinquency map: Home loan arrears rise to five-year high
MOODY'S INVESTORS SERVICE STRUCTURED FINANCE
Exhibit 3
Change in state final demand (year to March 2017)
3.8% 3.5%
2.4% 2.3% 2.0%1.1%
-8.0%
-10%
-8%
-6%
-4%
-2%
0%
2%
4%
6%
New South Wales Victoria Northern Territory Tasmania South Australia Queensland Western Australia
Yo
y %
ch
an
ge
in
fin
al d
em
an
d
Australia-wide average
Note: State final demand is a subset of Gross State Product (GSP) and includes 1) general government final consumption expenditure, 2) household final consumption expenditure 3)private gross capital formation and 4) public gross capital formation. It differs from GSP in that it excludes exports and imports.Source: Australian Bureau of Statistics 5206.0 - Australian National Accounts: National Income, Expenditure and Product
The 30+ delinquency rates in the Northern Territory (2.82%) and South Australia (2.28%) also increased to record high levels overthe year to May 2017. House prices in Darwin fell 2.09% over the year to July 2017 and 6.43% over the year to May 2017. Theunemployment rate in South Australia was 6.83% in May 2017, the highest in the country.
Mortgage delinquencies in Queensland and the ACT also increased. Despite the increase, the ACT had the lowest 30+ delinquency rate(0.9%) of any state or territory in Australia in May 2017. A high proportion of borrowers in the ACT are employed by the government,which offers more secure and stable employment compared with jobs in the private sector.
Delinquencies in NSW and Victoria — the states that account for the largest proportions (32.41% and 25.16% respectively) ofmortgage loans in our RMBS portfolio — declined over the year to May 2017.
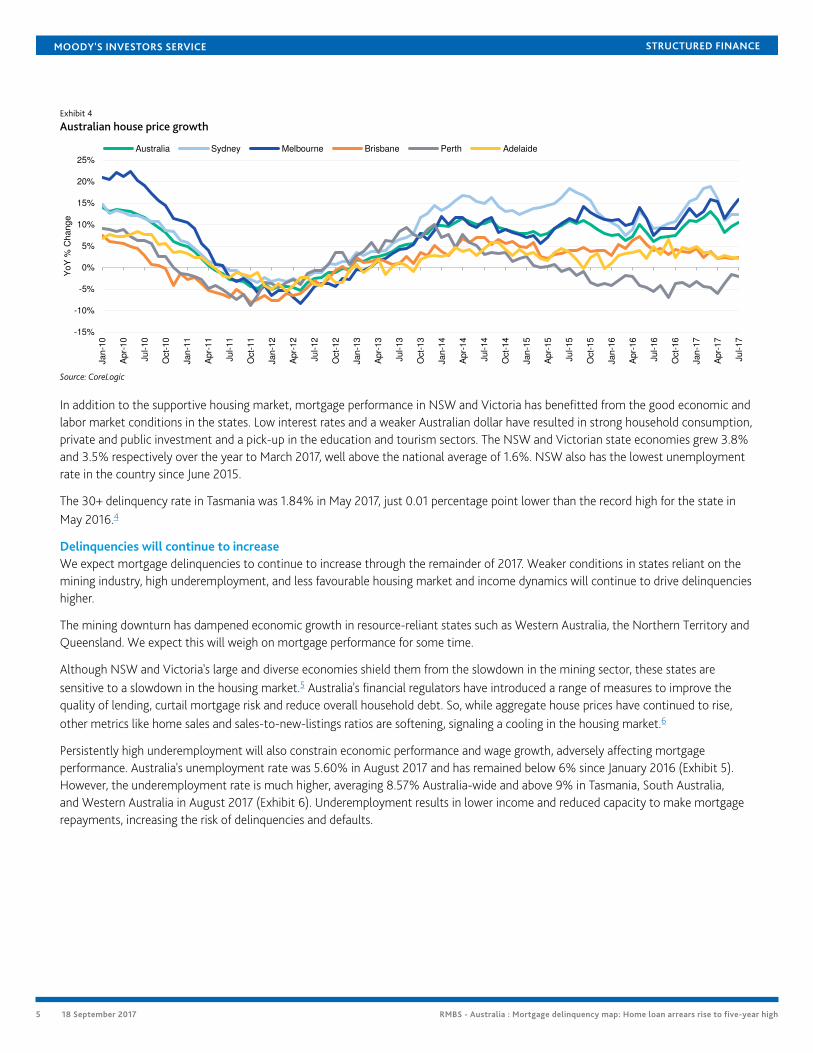
House prices in Sydney and Melbourne rose 12.37% and 15.93% respectively over the year to July 2017, and 11.08% and 11.52% overthe year to May 2017 (Exhibit 4). Rising house prices have supported mortgage performance in these states, giving borrowers at risk ofor already in arrears the option to sell their properties quickly for a good price to repay their loans. However, as house prices continuerising without a corresponding increase in incomes to pay for the more expensive houses, housing affordability decreases and the risk ofdelinquencies and defaults rises.
4 18 September 2017 RMBS - Australia : Mortgage delinquency map: Home loan arrears rise to five-year high
MOODY'S INVESTORS SERVICE STRUCTURED FINANCE
Exhibit 4
Australian house price growth
-15%
-10%
-5%
0%
5%
10%
15%
20%
25%
Ja
n-1
0
Ap
r-1
0
Ju
l-10
Oct-
10
Ja
n-1
1
Ap
r-1
1
Ju
l-11
Oct-
11
Ja
n-1
2
Ap
r-1
2
Ju
l-12
Oct-
12
Ja
n-1
3
Ap
r-1
3
Ju
l-13
Oct-
13
Ja
n-1
4
Ap
r-1
4
Ju
l-14
Oct-
14
Ja
n-1
5
Ap
r-1
5
Ju
l-15
Oct-
15
Ja
n-1
6
Ap
r-1
6
Ju
l-16
Oct-
16
Ja
n-1
7
Ap
r-1
7
Ju
l-17
Yo
Y %
Ch
an
ge
Australia Sydney Melbourne Brisbane Perth Adelaide
Source: CoreLogic
In addition to the supportive housing market, mortgage performance in NSW and Victoria has benefitted from the good economic andlabor market conditions in the states. Low interest rates and a weaker Australian dollar have resulted in strong household consumption,private and public investment and a pick-up in the education and tourism sectors. The NSW and Victorian state economies grew 3.8%and 3.5% respectively over the year to March 2017, well above the national average of 1.6%. NSW also has the lowest unemploymentrate in the country since June 2015.
The 30+ delinquency rate in Tasmania was 1.84% in May 2017, just 0.01 percentage point lower than the record high for the state inMay 2016.4
Delinquencies will continue to increaseWe expect mortgage delinquencies to continue to increase through the remainder of 2017. Weaker conditions in states reliant on themining industry, high underemployment, and less favourable housing market and income dynamics will continue to drive delinquencieshigher.
The mining downturn has dampened economic growth in resource-reliant states such as Western Australia, the Northern Territory andQueensland. We expect this will weigh on mortgage performance for some time.
Although NSW and Victoria's large and diverse economies shield them from the slowdown in the mining sector, these states aresensitive to a slowdown in the housing market.5 Australia's financial regulators have introduced a range of measures to improve thequality of lending, curtail mortgage risk and reduce overall household debt. So, while aggregate house prices have continued to rise,other metrics like home sales and sales-to-new-listings ratios are softening, signaling a cooling in the housing market.6
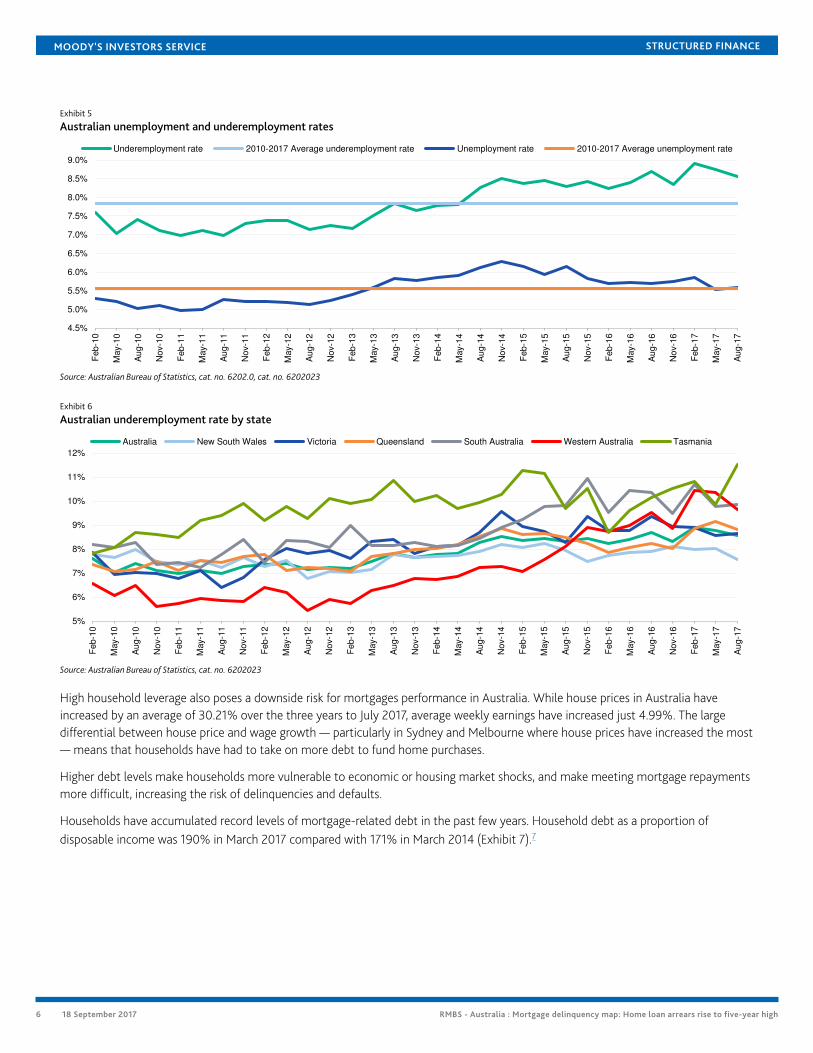
Persistently high underemployment will also constrain economic performance and wage growth, adversely affecting mortgageperformance. Australia's unemployment rate was 5.60% in August 2017 and has remained below 6% since January 2016 (Exhibit 5).However, the underemployment rate is much higher, averaging 8.57% Australia-wide and above 9% in Tasmania, South Australia,and Western Australia in August 2017 (Exhibit 6). Underemployment results in lower income and reduced capacity to make mortgagerepayments, increasing the risk of delinquencies and defaults.
5 18 September 2017 RMBS - Australia : Mortgage delinquency map: Home loan arrears rise to five-year high
MOODY'S INVESTORS SERVICE STRUCTURED FINANCE
Exhibit 5
Australian unemployment and underemployment rates
4.5%
5.0%
5.5%
6.0%
6.5%
7.0%
7.5%
8.0%
8.5%
9.0%
Feb
-10
May-1
0
Au
g-1
0
Nov-1
0
Feb
-11
May-1
1
Aug-1
1
Nov-1
1
Feb
-12
May-1
2
Au
g-1
2
Nov-1
2
Feb
-13
May-1
3
Aug-1
3
Nov-1
3
Feb
-14
May-1
4
Au
g-1
4
Nov-1
4
Feb
-15
May-1
5
Aug-1
5
Nov-1
5
Feb
-16
May-1
6
Au
g-1
6
Nov-1
6
Feb
-17
May-1
7
Aug-1
7
Underemployment rate 2010-2017 Average underemployment rate Unemployment rate 2010-2017 Average unemployment rate
Source: Australian Bureau of Statistics, cat. no. 6202.0, cat. no. 6202023
Exhibit 6
Australian underemployment rate by state
5%
6%
7%
8%
9%
10%
11%
12%
Feb
-10
May-1
0
Au
g-1
0
No
v-1
0
Feb
-11
May-1
1
Au
g-1
1
No
v-1
1
Feb
-12
May-1
2
Au
g-1
2
No
v-1
2
Feb
-13
May-1
3
Au
g-1
3
No
v-1
3
Feb
-14
May-1
4
Au
g-1
4
No
v-1
4
Feb
-15
May-1
5
Au
g-1
5
No
v-1
5
Feb
-16
May-1
6
Au
g-1
6
No
v-1
6
Feb
-17
May-1
7
Au
g-1
7
Australia New South Wales Victoria Queensland South Australia Western Australia Tasmania
Source: Australian Bureau of Statistics, cat. no. 6202023
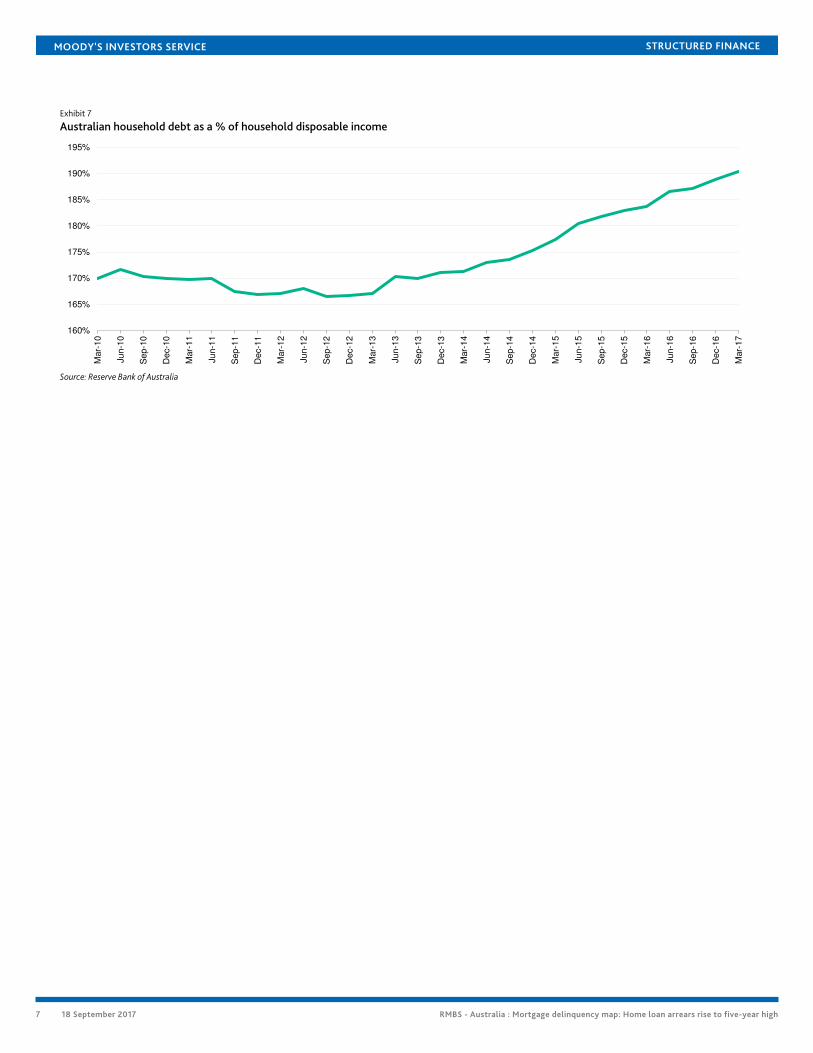
High household leverage also poses a downside risk for mortgages performance in Australia. While house prices in Australia haveincreased by an average of 30.21% over the three years to July 2017, average weekly earnings have increased just 4.99%. The largedifferential between house price and wage growth — particularly in Sydney and Melbourne where house prices have increased the most— means that households have had to take on more debt to fund home purchases.
Higher debt levels make households more vulnerable to economic or housing market shocks, and make meeting mortgage repaymentsmore difficult, increasing the risk of delinquencies and defaults.
Households have accumulated record levels of mortgage-related debt in the past few years. Household debt as a proportion ofdisposable income was 190% in March 2017 compared with 171% in March 2014 (Exhibit 7).7
6 18 September 2017 RMBS - Australia : Mortgage delinquency map: Home loan arrears rise to five-year high
MOODY'S INVESTORS SERVICE STRUCTURED FINANCE
Exhibit 7
Australian household debt as a % of household disposable income
160%
165%
170%
175%
180%
185%
190%
195%
Mar-
10
Ju
n-1
0
Sep-1
0
Dec-1
0
Mar-
11
Ju
n-1
1
Sep-1
1
Dec-1
1
Mar-
12
Ju
n-1
2
Se
p-1
2
Dec-1
2
Mar-
13
Ju
n-1
3
Sep-1
3
Dec-1
3
Mar-
14
Ju
n-1
4
Sep-1
4
Dec-1
4
Mar-
15
Ju
n-1
5
Se
p-1
5
Dec-1
5
Mar-
16
Ju
n-1
6
Sep-1
6
Dec-1
6
Mar-
17
Source: Reserve Bank of Australia
7 18 September 2017 RMBS - Australia : Mortgage delinquency map: Home loan arrears rise to five-year high
MOODY'S INVESTORS SERVICE STRUCTURED FINANCE
PERFORMANCE BY REGIONMortgage performance varied significantly between different regions in Australia over the year to May 2017. The 30+ delinquency rateincreased in 55 regions and fell in 32 regions over the year.
Worst regions: Mining-related areas underperformRegions with exposure to the resource and mining sectors dominated the list of areas with the highest delinquencies in May 2017. Eightof the 10 regions with the highest 30+ delinquency rates were in either Western Australia or Queensland, and many of these regionsare exposed to employment industries directly or indirectly related to mining and resources.
Six of the 10 worst regions — Western Australia Outback, Queensland Outback, Mackay, Western Australia Wheat Belt, Mandurahand Fitzroy — have consistently been among the worst performing regions in the country over the last three to four years (Exhibit 8).Western Australia Outback and South Australia Outback recorded the biggest increases in delinquencies over the year to May 2017.
The weighted average current loan to value ratios for the worst performing regions were typically higher than the national average of62.4%.
Exhibit 8
Australia's 10 worst performing regions
Region State/Territory WACLTV
May-16
30-plus delinquency
May-17
30-plus delinquency
May-17 - May-16
change (% pts)
Western Australia - Outback Western Australia 64.4% 4.72% 7.63% 2.91
Queensland - Outback Queensland 67.1% 4.68% 5.26% 0.58
South Australia - Outback South Australia 66.9% 2.48% 4.89% 2.41
Mackay Queensland 65.9% 3.41% 4.57% 1.16
Western Australia - Wheat Belt Western Australia 60.4% 3.01% 3.87% 0.86
Mandurah Western Australia 65.1% 3.05% 3.82% 0.77
Fitzroy Queensland 65.8% 2.72% 3.74% 1.02
Perth - North East Western Australia 63.6% 2.60% 3.40% 0.80
West and North West Tasmania 64.5% 1.95% 3.25% 1.30
Townsville Queensland 65.8% 2.77% 3.25% 0.48
Note: WACLTV - Weighted average current loan to value ratio, weighted by current balanceSource: Moody's Investors Service; periodic investor/servicer reports
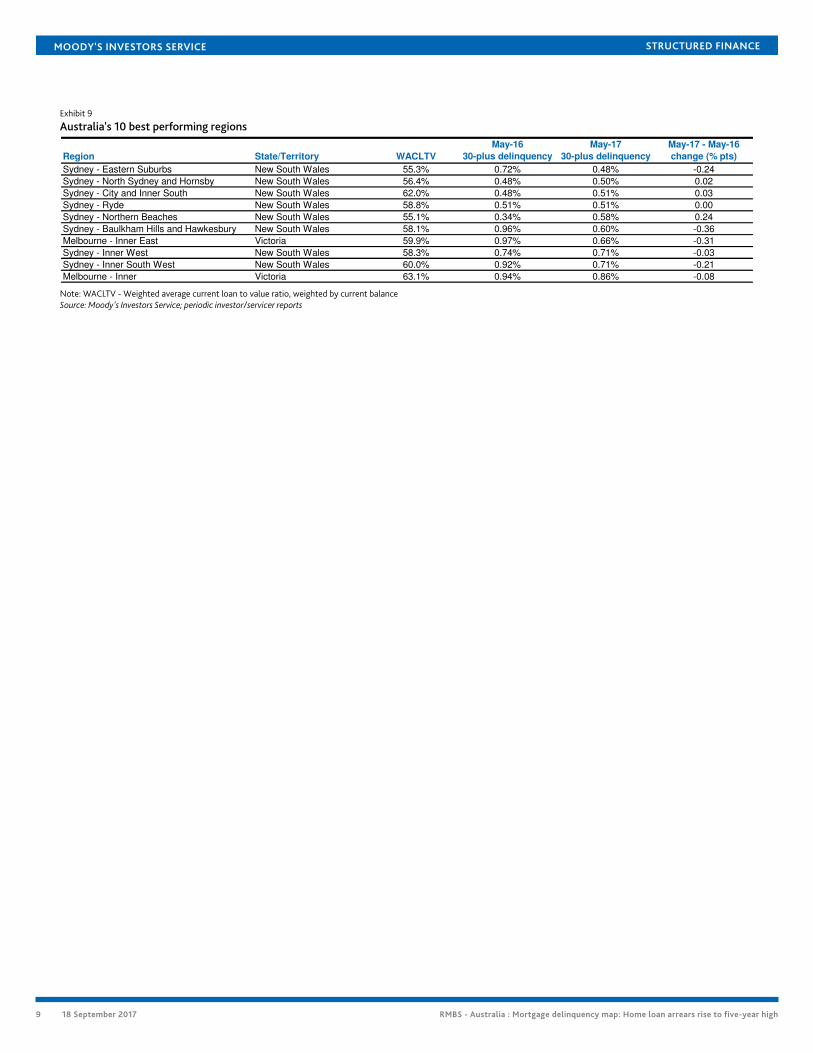
Best regions: Sydney and Melbourne areas perform stronglyThe ten regions with the lowest mortgage delinquencies in Australia in May 2017 were all in Sydney and Melbourne, where housingmarket and economic conditions were the most supportive for mortgage borrowers.
House prices in Sydney and Melbourne have increased strongly. In addition, mortgage borrowers in these best-performing regions aremost likely to be employed in professional services industries. These occupations tend to pay higher wages and are more stable thanmining and construction-related employment.
Eight of the 10 best performing regions where in Sydney, while two were in Melbourne (Exhibit 9).
The weighted average current loan to value ratios for the best-performing regions were typically lower than the national average of62.4%.
8 18 September 2017 RMBS - Australia : Mortgage delinquency map: Home loan arrears rise to five-year high
MOODY'S INVESTORS SERVICE STRUCTURED FINANCE
Exhibit 9
Australia's 10 best performing regions
Region State/Territory WACLTV
May-16
30-plus delinquency
May-17
30-plus delinquency
May-17 - May-16
change (% pts)
Sydney - Eastern Suburbs New South Wales 55.3% 0.72% 0.48% -0.24
Sydney - North Sydney and Hornsby New South Wales 56.4% 0.48% 0.50% 0.02
Sydney - City and Inner South New South Wales 62.0% 0.48% 0.51% 0.03
Sydney - Ryde New South Wales 58.8% 0.51% 0.51% 0.00
Sydney - Northern Beaches New South Wales 55.1% 0.34% 0.58% 0.24
Sydney - Baulkham Hills and Hawkesbury New South Wales 58.1% 0.96% 0.60% -0.36
Melbourne - Inner East Victoria 59.9% 0.97% 0.66% -0.31
Sydney - Inner West New South Wales 58.3% 0.74% 0.71% -0.03
Sydney - Inner South West New South Wales 60.0% 0.92% 0.71% -0.21
Melbourne - Inner Victoria 63.1% 0.94% 0.86% -0.08
Note: WACLTV - Weighted average current loan to value ratio, weighted by current balanceSource: Moody's Investors Service; periodic investor/servicer reports
9 18 September 2017 RMBS - Australia : Mortgage delinquency map: Home loan arrears rise to five-year high
MOODY'S INVESTORS SERVICE STRUCTURED FINANCE
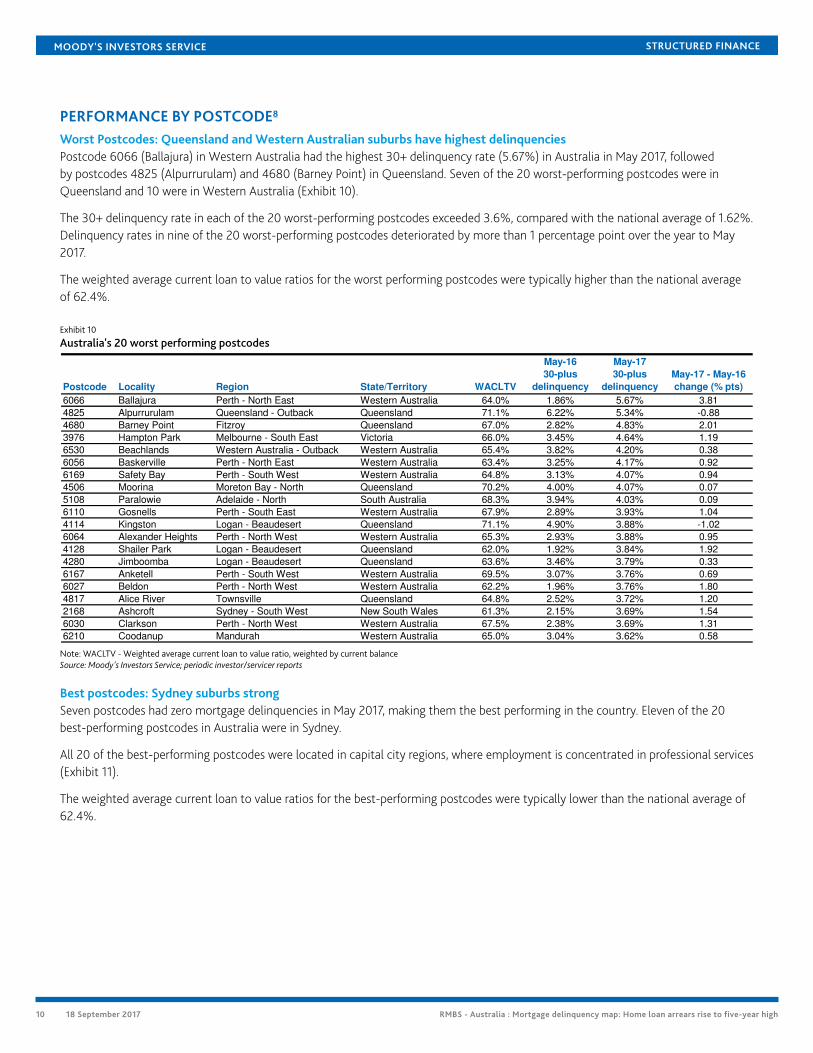
PERFORMANCE BY POSTCODE8
Worst Postcodes: Queensland and Western Australian suburbs have highest delinquenciesPostcode 6066 (Ballajura) in Western Australia had the highest 30+ delinquency rate (5.67%) in Australia in May 2017, followedby postcodes 4825 (Alpurrurulam) and 4680 (Barney Point) in Queensland. Seven of the 20 worst-performing postcodes were inQueensland and 10 were in Western Australia (Exhibit 10).
The 30+ delinquency rate in each of the 20 worst-performing postcodes exceeded 3.6%, compared with the national average of 1.62%.Delinquency rates in nine of the 20 worst-performing postcodes deteriorated by more than 1 percentage point over the year to May2017.
The weighted average current loan to value ratios for the worst performing postcodes were typically higher than the national averageof 62.4%.
Exhibit 10
Australia's 20 worst performing postcodes
Postcode Locality Region State/Territory WACLTV
May-16
30-plus
delinquency
May-17
30-plus
delinquency
May-17 - May-16
change (% pts)
6066 Ballajura Perth - North East Western Australia 64.0% 1.86% 5.67% 3.81
4825 Alpurrurulam Queensland - Outback Queensland 71.1% 6.22% 5.34% -0.88
4680 Barney Point Fitzroy Queensland 67.0% 2.82% 4.83% 2.01
3976 Hampton Park Melbourne - South East Victoria 66.0% 3.45% 4.64% 1.19
6530 Beachlands Western Australia - Outback Western Australia 65.4% 3.82% 4.20% 0.38
6056 Baskerville Perth - North East Western Australia 63.4% 3.25% 4.17% 0.92
6169 Safety Bay Perth - South West Western Australia 64.8% 3.13% 4.07% 0.94
4506 Moorina Moreton Bay - North Queensland 70.2% 4.00% 4.07% 0.07
5108 Paralowie Adelaide - North South Australia 68.3% 3.94% 4.03% 0.09
6110 Gosnells Perth - South East Western Australia 67.9% 2.89% 3.93% 1.04
4114 Kingston Logan - Beaudesert Queensland 71.1% 4.90% 3.88% -1.02
6064 Alexander Heights Perth - North West Western Australia 65.3% 2.93% 3.88% 0.95
4128 Shailer Park Logan - Beaudesert Queensland 62.0% 1.92% 3.84% 1.92
4280 Jimboomba Logan - Beaudesert Queensland 63.6% 3.46% 3.79% 0.33
6167 Anketell Perth - South West Western Australia 69.5% 3.07% 3.76% 0.69
6027 Beldon Perth - North West Western Australia 62.2% 1.96% 3.76% 1.80
4817 Alice River Townsville Queensland 64.8% 2.52% 3.72% 1.20
2168 Ashcroft Sydney - South West New South Wales 61.3% 2.15% 3.69% 1.54
6030 Clarkson Perth - North West Western Australia 67.5% 2.38% 3.69% 1.31
6210 Coodanup Mandurah Western Australia 65.0% 3.04% 3.62% 0.58
Note: WACLTV - Weighted average current loan to value ratio, weighted by current balanceSource: Moody's Investors Service; periodic investor/servicer reports
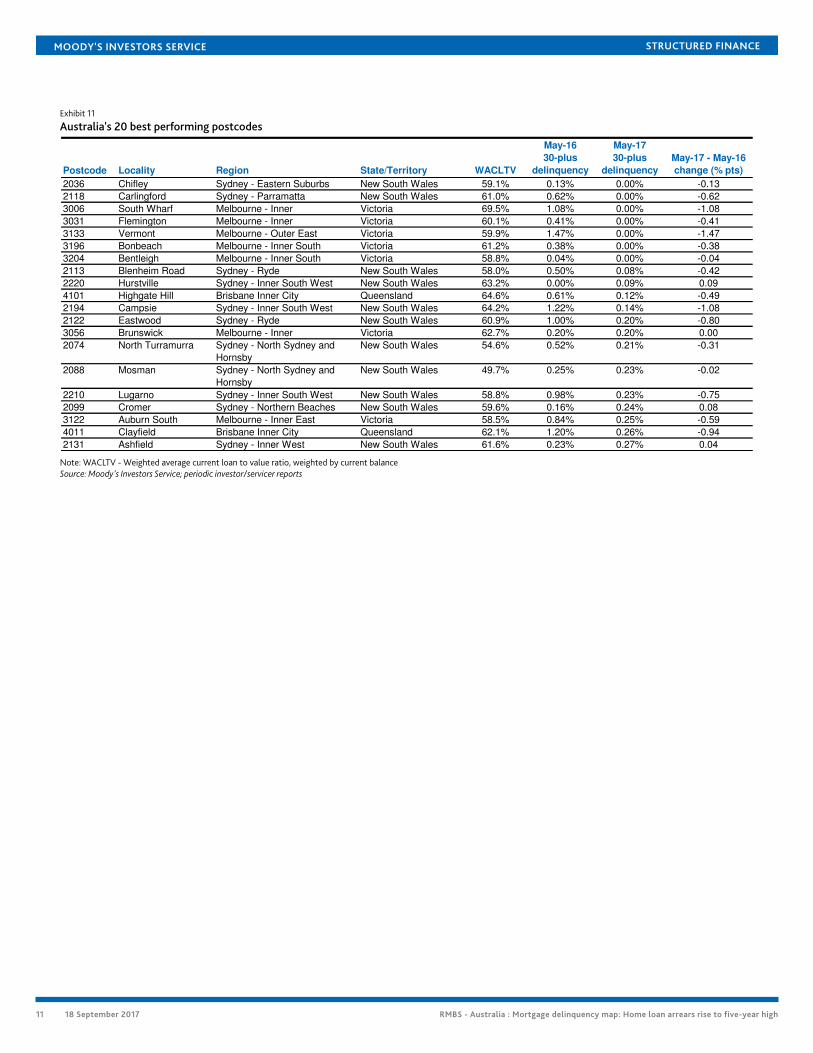
Best postcodes: Sydney suburbs strongSeven postcodes had zero mortgage delinquencies in May 2017, making them the best performing in the country. Eleven of the 20best-performing postcodes in Australia were in Sydney.
All 20 of the best-performing postcodes were located in capital city regions, where employment is concentrated in professional services(Exhibit 11).
The weighted average current loan to value ratios for the best-performing postcodes were typically lower than the national average of62.4%.
10 18 September 2017 RMBS - Australia : Mortgage delinquency map: Home loan arrears rise to five-year high
MOODY'S INVESTORS SERVICE STRUCTURED FINANCE
Exhibit 11
Australia's 20 best performing postcodes
Postcode Locality Region State/Territory WACLTV
May-16
30-plus
delinquency
May-17
30-plus
delinquency
May-17 - May-16
change (% pts)
2036 Chifley Sydney - Eastern Suburbs New South Wales 59.1% 0.13% 0.00% -0.13
2118 Carlingford Sydney - Parramatta New South Wales 61.0% 0.62% 0.00% -0.62
3006 South Wharf Melbourne - Inner Victoria 69.5% 1.08% 0.00% -1.08
3031 Flemington Melbourne - Inner Victoria 60.1% 0.41% 0.00% -0.41
3133 Vermont Melbourne - Outer East Victoria 59.9% 1.47% 0.00% -1.47
3196 Bonbeach Melbourne - Inner South Victoria 61.2% 0.38% 0.00% -0.38
3204 Bentleigh Melbourne - Inner South Victoria 58.8% 0.04% 0.00% -0.04
2113 Blenheim Road Sydney - Ryde New South Wales 58.0% 0.50% 0.08% -0.42
2220 Hurstville Sydney - Inner South West New South Wales 63.2% 0.00% 0.09% 0.09
4101 Highgate Hill Brisbane Inner City Queensland 64.6% 0.61% 0.12% -0.49
2194 Campsie Sydney - Inner South West New South Wales 64.2% 1.22% 0.14% -1.08
2122 Eastwood Sydney - Ryde New South Wales 60.9% 1.00% 0.20% -0.80
3056 Brunswick Melbourne - Inner Victoria 62.7% 0.20% 0.20% 0.00
2074 North Turramurra Sydney - North Sydney and
Hornsby
New South Wales 54.6% 0.52% 0.21% -0.31
2088 Mosman Sydney - North Sydney and
Hornsby
New South Wales 49.7% 0.25% 0.23% -0.02
2210 Lugarno Sydney - Inner South West New South Wales 58.8% 0.98% 0.23% -0.75
2099 Cromer Sydney - Northern Beaches New South Wales 59.6% 0.16% 0.24% 0.08
3122 Auburn South Melbourne - Inner East Victoria 58.5% 0.84% 0.25% -0.59
4011 Clayfield Brisbane Inner City Queensland 62.1% 1.20% 0.26% -0.94
2131 Ashfield Sydney - Inner West New South Wales 61.6% 0.23% 0.27% 0.04
Note: WACLTV - Weighted average current loan to value ratio, weighted by current balanceSource: Moody's Investors Service; periodic investor/servicer reports
11 18 September 2017 RMBS - Australia : Mortgage delinquency map: Home loan arrears rise to five-year high
MOODY'S INVESTORS SERVICE STRUCTURED FINANCE
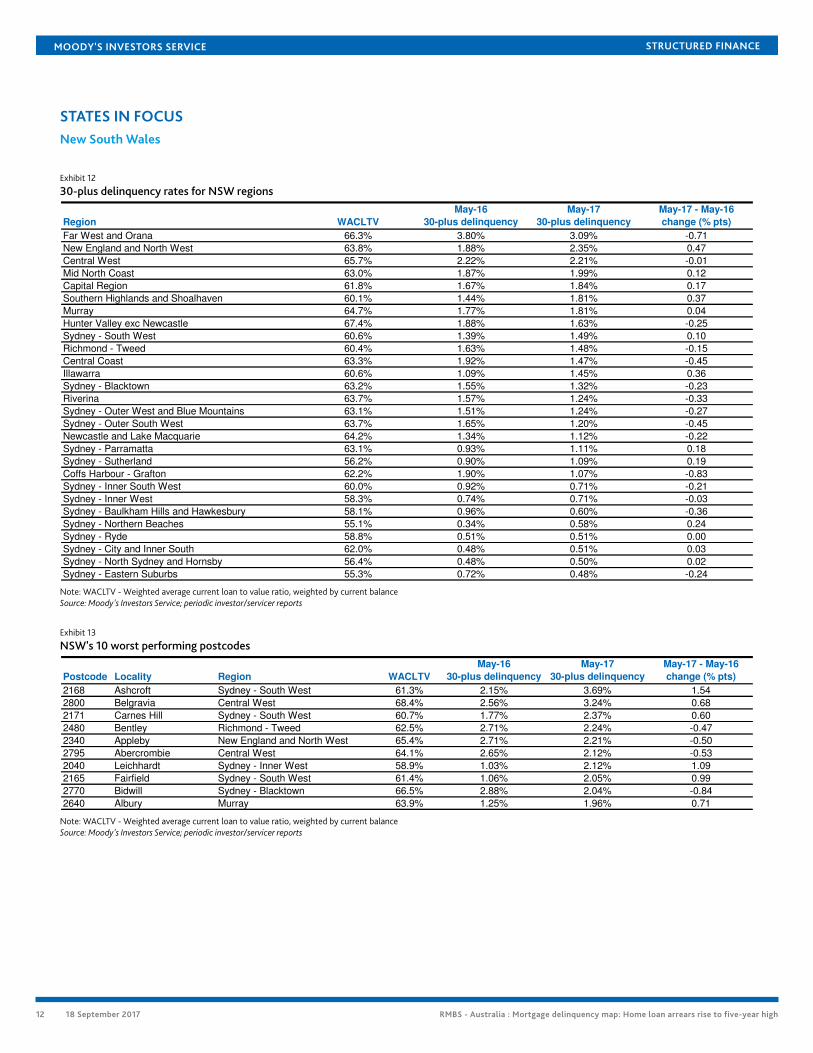
STATES IN FOCUSNew South Wales
Exhibit 12
30-plus delinquency rates for NSW regions
Region WACLTV
May-16
30-plus delinquency
May-17
30-plus delinquency
May-17 - May-16
change (% pts)
Far West and Orana 66.3% 3.80% 3.09% -0.71
New England and North West 63.8% 1.88% 2.35% 0.47
Central West 65.7% 2.22% 2.21% -0.01
Mid North Coast 63.0% 1.87% 1.99% 0.12
Capital Region 61.8% 1.67% 1.84% 0.17
Southern Highlands and Shoalhaven 60.1% 1.44% 1.81% 0.37
Murray 64.7% 1.77% 1.81% 0.04
Hunter Valley exc Newcastle 67.4% 1.88% 1.63% -0.25
Sydney - South West 60.6% 1.39% 1.49% 0.10
Richmond - Tweed 60.4% 1.63% 1.48% -0.15
Central Coast 63.3% 1.92% 1.47% -0.45
Illawarra 60.6% 1.09% 1.45% 0.36
Sydney - Blacktown 63.2% 1.55% 1.32% -0.23
Riverina 63.7% 1.57% 1.24% -0.33
Sydney - Outer West and Blue Mountains 63.1% 1.51% 1.24% -0.27
Sydney - Outer South West 63.7% 1.65% 1.20% -0.45
Newcastle and Lake Macquarie 64.2% 1.34% 1.12% -0.22
Sydney - Parramatta 63.1% 0.93% 1.11% 0.18
Sydney - Sutherland 56.2% 0.90% 1.09% 0.19
Coffs Harbour - Grafton 62.2% 1.90% 1.07% -0.83
Sydney - Inner South West 60.0% 0.92% 0.71% -0.21
Sydney - Inner West 58.3% 0.74% 0.71% -0.03
Sydney - Baulkham Hills and Hawkesbury 58.1% 0.96% 0.60% -0.36
Sydney - Northern Beaches 55.1% 0.34% 0.58% 0.24
Sydney - Ryde 58.8% 0.51% 0.51% 0.00
Sydney - City and Inner South 62.0% 0.48% 0.51% 0.03
Sydney - North Sydney and Hornsby 56.4% 0.48% 0.50% 0.02
Sydney - Eastern Suburbs 55.3% 0.72% 0.48% -0.24
Note: WACLTV - Weighted average current loan to value ratio, weighted by current balanceSource: Moody's Investors Service; periodic investor/servicer reports
Exhibit 13
NSW's 10 worst performing postcodes
Postcode Locality Region WACLTV
May-16
30-plus delinquency
May-17
30-plus delinquency
May-17 - May-16
change (% pts)
2168 Ashcroft Sydney - South West 61.3% 2.15% 3.69% 1.54
2800 Belgravia Central West 68.4% 2.56% 3.24% 0.68
2171 Carnes Hill Sydney - South West 60.7% 1.77% 2.37% 0.60
2480 Bentley Richmond - Tweed 62.5% 2.71% 2.24% -0.47
2340 Appleby New England and North West 65.4% 2.71% 2.21% -0.50
2795 Abercrombie Central West 64.1% 2.65% 2.12% -0.53
2040 Leichhardt Sydney - Inner West 58.9% 1.03% 2.12% 1.09
2165 Fairfield Sydney - South West 61.4% 1.06% 2.05% 0.99
2770 Bidwill Sydney - Blacktown 66.5% 2.88% 2.04% -0.84
2640 Albury Murray 63.9% 1.25% 1.96% 0.71
Note: WACLTV - Weighted average current loan to value ratio, weighted by current balanceSource: Moody's Investors Service; periodic investor/servicer reports
12 18 September 2017 RMBS - Australia : Mortgage delinquency map: Home loan arrears rise to five-year high
MOODY'S INVESTORS SERVICE STRUCTURED FINANCE
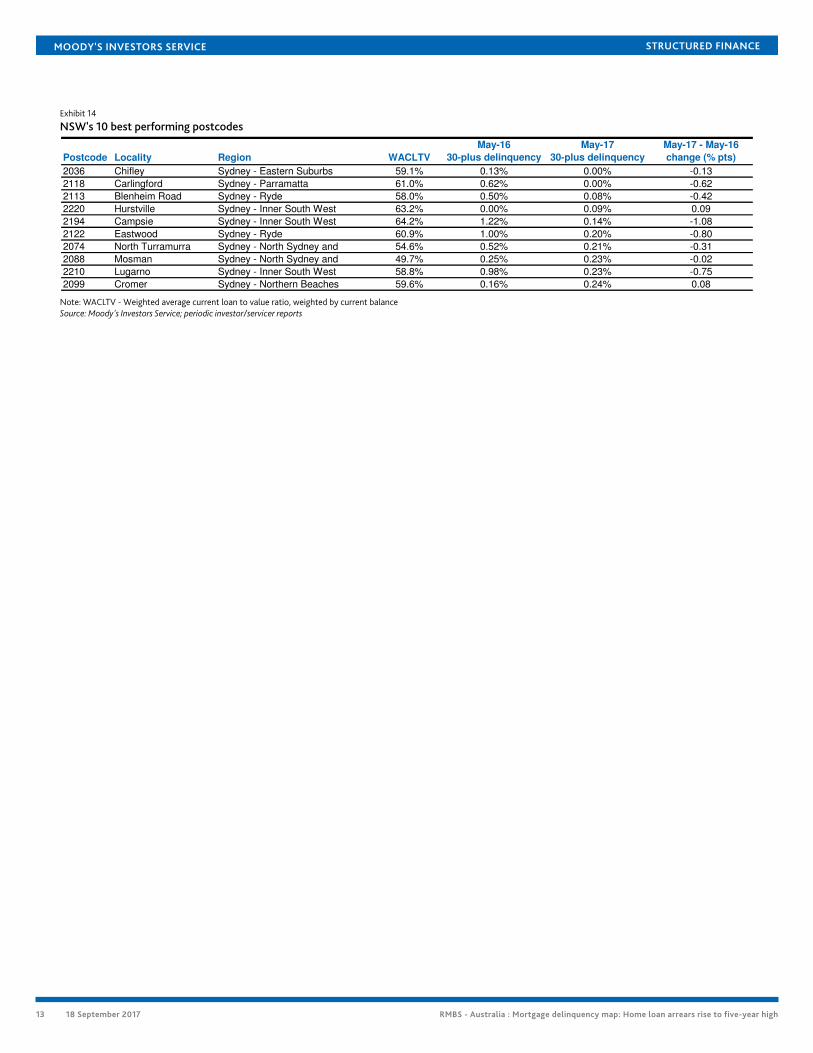
Exhibit 14
NSW's 10 best performing postcodes
Postcode Locality Region WACLTV
May-16
30-plus delinquency
May-17
30-plus delinquency
May-17 - May-16
change (% pts)
2036 Chifley Sydney - Eastern Suburbs 59.1% 0.13% 0.00% -0.13
2118 Carlingford Sydney - Parramatta 61.0% 0.62% 0.00% -0.62
2113 Blenheim Road Sydney - Ryde 58.0% 0.50% 0.08% -0.42
2220 Hurstville Sydney - Inner South West 63.2% 0.00% 0.09% 0.09
2194 Campsie Sydney - Inner South West 64.2% 1.22% 0.14% -1.08
2122 Eastwood Sydney - Ryde 60.9% 1.00% 0.20% -0.80
2074 North Turramurra Sydney - North Sydney and 54.6% 0.52% 0.21% -0.31
2088 Mosman Sydney - North Sydney and 49.7% 0.25% 0.23% -0.02
2210 Lugarno Sydney - Inner South West 58.8% 0.98% 0.23% -0.75
2099 Cromer Sydney - Northern Beaches 59.6% 0.16% 0.24% 0.08
Note: WACLTV - Weighted average current loan to value ratio, weighted by current balanceSource: Moody's Investors Service; periodic investor/servicer reports
13 18 September 2017 RMBS - Australia : Mortgage delinquency map: Home loan arrears rise to five-year high
MOODY'S INVESTORS SERVICE STRUCTURED FINANCE
Victoria
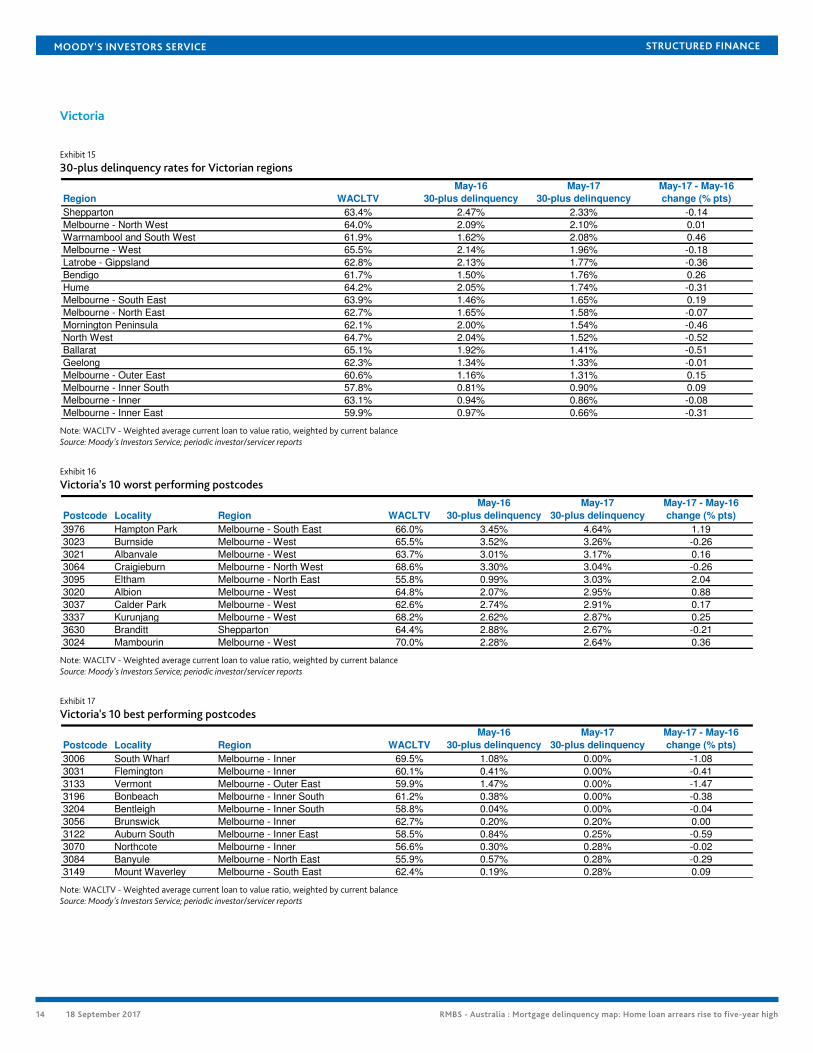
Exhibit 15
30-plus delinquency rates for Victorian regions
Region WACLTV
May-16
30-plus delinquency
May-17
30-plus delinquency
May-17 - May-16
change (% pts)
Shepparton 63.4% 2.47% 2.33% -0.14
Melbourne - North West 64.0% 2.09% 2.10% 0.01
Warrnambool and South West 61.9% 1.62% 2.08% 0.46
Melbourne - West 65.5% 2.14% 1.96% -0.18
Latrobe - Gippsland 62.8% 2.13% 1.77% -0.36
Bendigo 61.7% 1.50% 1.76% 0.26
Hume 64.2% 2.05% 1.74% -0.31
Melbourne - South East 63.9% 1.46% 1.65% 0.19
Melbourne - North East 62.7% 1.65% 1.58% -0.07
Mornington Peninsula 62.1% 2.00% 1.54% -0.46
North West 64.7% 2.04% 1.52% -0.52
Ballarat 65.1% 1.92% 1.41% -0.51
Geelong 62.3% 1.34% 1.33% -0.01
Melbourne - Outer East 60.6% 1.16% 1.31% 0.15
Melbourne - Inner South 57.8% 0.81% 0.90% 0.09
Melbourne - Inner 63.1% 0.94% 0.86% -0.08
Melbourne - Inner East 59.9% 0.97% 0.66% -0.31
Note: WACLTV - Weighted average current loan to value ratio, weighted by current balanceSource: Moody's Investors Service; periodic investor/servicer reports
Exhibit 16
Victoria's 10 worst performing postcodes
Postcode Locality Region WACLTV
May-16
30-plus delinquency
May-17
30-plus delinquency
May-17 - May-16
change (% pts)
3976 Hampton Park Melbourne - South East 66.0% 3.45% 4.64% 1.19
3023 Burnside Melbourne - West 65.5% 3.52% 3.26% -0.26
3021 Albanvale Melbourne - West 63.7% 3.01% 3.17% 0.16
3064 Craigieburn Melbourne - North West 68.6% 3.30% 3.04% -0.26
3095 Eltham Melbourne - North East 55.8% 0.99% 3.03% 2.04
3020 Albion Melbourne - West 64.8% 2.07% 2.95% 0.88
3037 Calder Park Melbourne - West 62.6% 2.74% 2.91% 0.17
3337 Kurunjang Melbourne - West 68.2% 2.62% 2.87% 0.25
3630 Branditt Shepparton 64.4% 2.88% 2.67% -0.21
3024 Mambourin Melbourne - West 70.0% 2.28% 2.64% 0.36
Note: WACLTV - Weighted average current loan to value ratio, weighted by current balanceSource: Moody's Investors Service; periodic investor/servicer reports
Exhibit 17
Victoria's 10 best performing postcodes
Postcode Locality Region WACLTV
May-16
30-plus delinquency
May-17
30-plus delinquency
May-17 - May-16
change (% pts)
3006 South Wharf Melbourne - Inner 69.5% 1.08% 0.00% -1.08
3031 Flemington Melbourne - Inner 60.1% 0.41% 0.00% -0.41
3133 Vermont Melbourne - Outer East 59.9% 1.47% 0.00% -1.47
3196 Bonbeach Melbourne - Inner South 61.2% 0.38% 0.00% -0.38
3204 Bentleigh Melbourne - Inner South 58.8% 0.04% 0.00% -0.04
3056 Brunswick Melbourne - Inner 62.7% 0.20% 0.20% 0.00
3122 Auburn South Melbourne - Inner East 58.5% 0.84% 0.25% -0.59
3070 Northcote Melbourne - Inner 56.6% 0.30% 0.28% -0.02
3084 Banyule Melbourne - North East 55.9% 0.57% 0.28% -0.29
3149 Mount Waverley Melbourne - South East 62.4% 0.19% 0.28% 0.09
Note: WACLTV - Weighted average current loan to value ratio, weighted by current balanceSource: Moody's Investors Service; periodic investor/servicer reports
14 18 September 2017 RMBS - Australia : Mortgage delinquency map: Home loan arrears rise to five-year high
MOODY'S INVESTORS SERVICE STRUCTURED FINANCE
Queensland
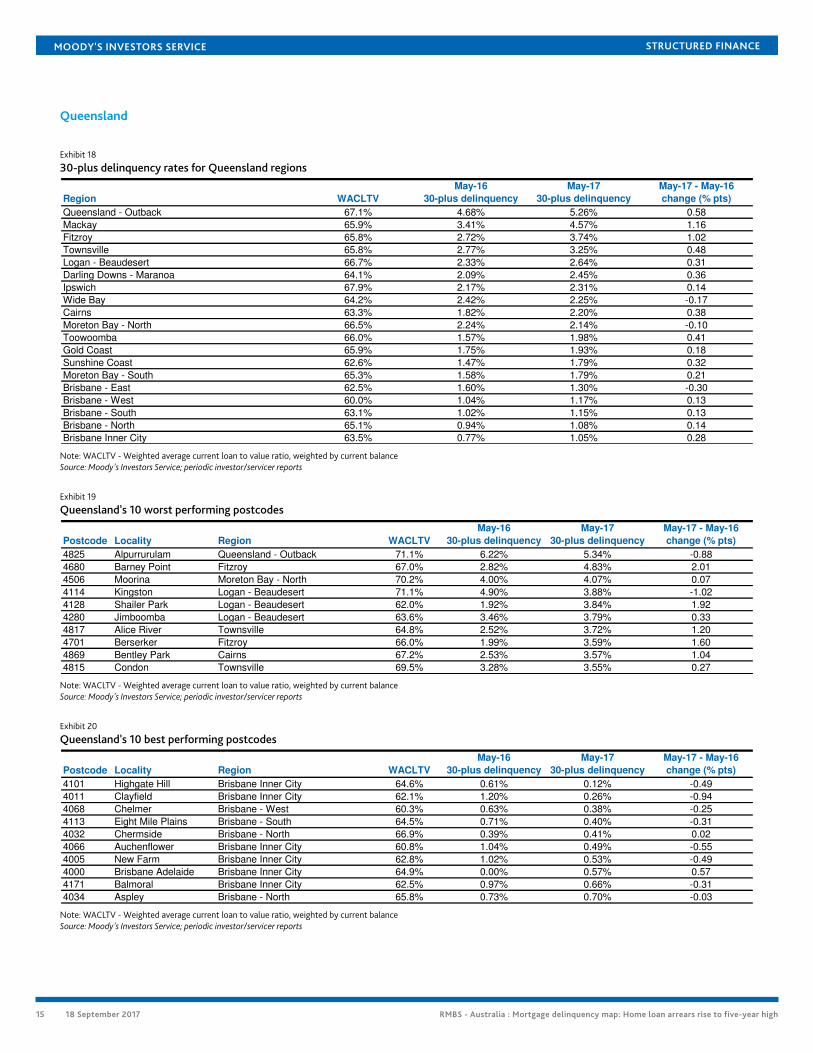
Exhibit 18
30-plus delinquency rates for Queensland regions
Region WACLTV
May-16
30-plus delinquency
May-17
30-plus delinquency
May-17 - May-16
change (% pts)
Queensland - Outback 67.1% 4.68% 5.26% 0.58
Mackay 65.9% 3.41% 4.57% 1.16
Fitzroy 65.8% 2.72% 3.74% 1.02
Townsville 65.8% 2.77% 3.25% 0.48
Logan - Beaudesert 66.7% 2.33% 2.64% 0.31
Darling Downs - Maranoa 64.1% 2.09% 2.45% 0.36
Ipswich 67.9% 2.17% 2.31% 0.14
Wide Bay 64.2% 2.42% 2.25% -0.17
Cairns 63.3% 1.82% 2.20% 0.38
Moreton Bay - North 66.5% 2.24% 2.14% -0.10
Toowoomba 66.0% 1.57% 1.98% 0.41
Gold Coast 65.9% 1.75% 1.93% 0.18
Sunshine Coast 62.6% 1.47% 1.79% 0.32
Moreton Bay - South 65.3% 1.58% 1.79% 0.21
Brisbane - East 62.5% 1.60% 1.30% -0.30
Brisbane - West 60.0% 1.04% 1.17% 0.13
Brisbane - South 63.1% 1.02% 1.15% 0.13
Brisbane - North 65.1% 0.94% 1.08% 0.14
Brisbane Inner City 63.5% 0.77% 1.05% 0.28
Note: WACLTV - Weighted average current loan to value ratio, weighted by current balanceSource: Moody's Investors Service; periodic investor/servicer reports
Exhibit 19
Queensland's 10 worst performing postcodes
Postcode Locality Region WACLTV
May-16
30-plus delinquency
May-17
30-plus delinquency
May-17 - May-16
change (% pts)
4825 Alpurrurulam Queensland - Outback 71.1% 6.22% 5.34% -0.88
4680 Barney Point Fitzroy 67.0% 2.82% 4.83% 2.01
4506 Moorina Moreton Bay - North 70.2% 4.00% 4.07% 0.07
4114 Kingston Logan - Beaudesert 71.1% 4.90% 3.88% -1.02
4128 Shailer Park Logan - Beaudesert 62.0% 1.92% 3.84% 1.92
4280 Jimboomba Logan - Beaudesert 63.6% 3.46% 3.79% 0.33
4817 Alice River Townsville 64.8% 2.52% 3.72% 1.20
4701 Berserker Fitzroy 66.0% 1.99% 3.59% 1.60
4869 Bentley Park Cairns 67.2% 2.53% 3.57% 1.04
4815 Condon Townsville 69.5% 3.28% 3.55% 0.27
Note: WACLTV - Weighted average current loan to value ratio, weighted by current balanceSource: Moody's Investors Service; periodic investor/servicer reports
Exhibit 20
Queensland's 10 best performing postcodes
Postcode Locality Region WACLTV
May-16
30-plus delinquency
May-17
30-plus delinquency
May-17 - May-16
change (% pts)
4101 Highgate Hill Brisbane Inner City 64.6% 0.61% 0.12% -0.49
4011 Clayfield Brisbane Inner City 62.1% 1.20% 0.26% -0.94
4068 Chelmer Brisbane - West 60.3% 0.63% 0.38% -0.25
4113 Eight Mile Plains Brisbane - South 64.5% 0.71% 0.40% -0.31
4032 Chermside Brisbane - North 66.9% 0.39% 0.41% 0.02
4066 Auchenflower Brisbane Inner City 60.8% 1.04% 0.49% -0.55
4005 New Farm Brisbane Inner City 62.8% 1.02% 0.53% -0.49
4000 Brisbane Adelaide Brisbane Inner City 64.9% 0.00% 0.57% 0.57
4171 Balmoral Brisbane Inner City 62.5% 0.97% 0.66% -0.31
4034 Aspley Brisbane - North 65.8% 0.73% 0.70% -0.03
Note: WACLTV - Weighted average current loan to value ratio, weighted by current balanceSource: Moody's Investors Service; periodic investor/servicer reports
15 18 September 2017 RMBS - Australia : Mortgage delinquency map: Home loan arrears rise to five-year high
MOODY'S INVESTORS SERVICE STRUCTURED FINANCE
Western Australia
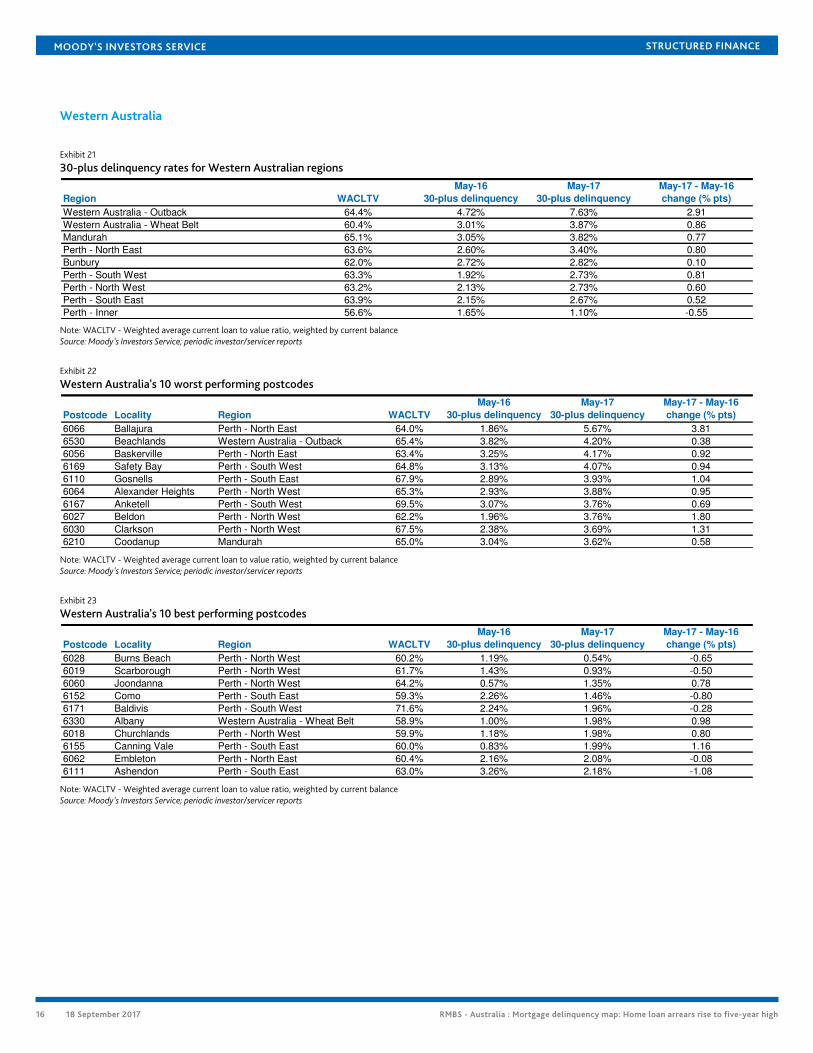
Exhibit 21
30-plus delinquency rates for Western Australian regions
Region WACLTV
May-16
30-plus delinquency
May-17
30-plus delinquency
May-17 - May-16
change (% pts)
Western Australia - Outback 64.4% 4.72% 7.63% 2.91
Western Australia - Wheat Belt 60.4% 3.01% 3.87% 0.86
Mandurah 65.1% 3.05% 3.82% 0.77
Perth - North East 63.6% 2.60% 3.40% 0.80
Bunbury 62.0% 2.72% 2.82% 0.10
Perth - South West 63.3% 1.92% 2.73% 0.81
Perth - North West 63.2% 2.13% 2.73% 0.60
Perth - South East 63.9% 2.15% 2.67% 0.52
Perth - Inner 56.6% 1.65% 1.10% -0.55
Note: WACLTV - Weighted average current loan to value ratio, weighted by current balanceSource: Moody's Investors Service; periodic investor/servicer reports
Exhibit 22
Western Australia's 10 worst performing postcodes
Postcode Locality Region WACLTV
May-16
30-plus delinquency
May-17
30-plus delinquency
May-17 - May-16
change (% pts)
6066 Ballajura Perth - North East 64.0% 1.86% 5.67% 3.81
6530 Beachlands Western Australia - Outback 65.4% 3.82% 4.20% 0.38
6056 Baskerville Perth - North East 63.4% 3.25% 4.17% 0.92
6169 Safety Bay Perth - South West 64.8% 3.13% 4.07% 0.94
6110 Gosnells Perth - South East 67.9% 2.89% 3.93% 1.04
6064 Alexander Heights Perth - North West 65.3% 2.93% 3.88% 0.95
6167 Anketell Perth - South West 69.5% 3.07% 3.76% 0.69
6027 Beldon Perth - North West 62.2% 1.96% 3.76% 1.80
6030 Clarkson Perth - North West 67.5% 2.38% 3.69% 1.31
6210 Coodanup Mandurah 65.0% 3.04% 3.62% 0.58
Note: WACLTV - Weighted average current loan to value ratio, weighted by current balanceSource: Moody's Investors Service; periodic investor/servicer reports
Exhibit 23
Western Australia's 10 best performing postcodes
Postcode Locality Region WACLTV
May-16
30-plus delinquency
May-17
30-plus delinquency
May-17 - May-16
change (% pts)
6028 Burns Beach Perth - North West 60.2% 1.19% 0.54% -0.65
6019 Scarborough Perth - North West 61.7% 1.43% 0.93% -0.50
6060 Joondanna Perth - North West 64.2% 0.57% 1.35% 0.78
6152 Como Perth - South East 59.3% 2.26% 1.46% -0.80
6171 Baldivis Perth - South West 71.6% 2.24% 1.96% -0.28
6330 Albany Western Australia - Wheat Belt 58.9% 1.00% 1.98% 0.98
6018 Churchlands Perth - North West 59.9% 1.18% 1.98% 0.80
6155 Canning Vale Perth - South East 60.0% 0.83% 1.99% 1.16
6062 Embleton Perth - North East 60.4% 2.16% 2.08% -0.08
6111 Ashendon Perth - South East 63.0% 3.26% 2.18% -1.08
Note: WACLTV - Weighted average current loan to value ratio, weighted by current balanceSource: Moody's Investors Service; periodic investor/servicer reports
16 18 September 2017 RMBS - Australia : Mortgage delinquency map: Home loan arrears rise to five-year high
MOODY'S INVESTORS SERVICE STRUCTURED FINANCE
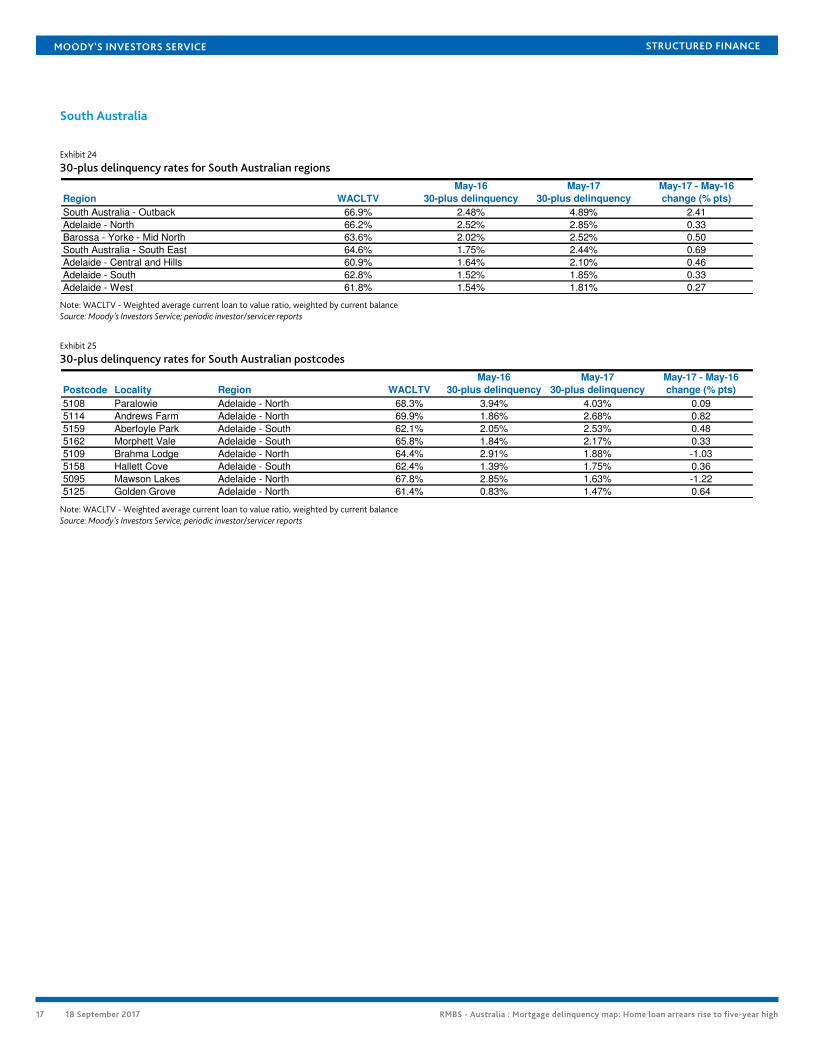
South Australia
Exhibit 24
30-plus delinquency rates for South Australian regions
Region WACLTV
May-16
30-plus delinquency
May-17
30-plus delinquency
May-17 - May-16
change (% pts)
South Australia - Outback 66.9% 2.48% 4.89% 2.41
Adelaide - North 66.2% 2.52% 2.85% 0.33
Barossa - Yorke - Mid North 63.6% 2.02% 2.52% 0.50
South Australia - South East 64.6% 1.75% 2.44% 0.69
Adelaide - Central and Hills 60.9% 1.64% 2.10% 0.46
Adelaide - South 62.8% 1.52% 1.85% 0.33
Adelaide - West 61.8% 1.54% 1.81% 0.27
Note: WACLTV - Weighted average current loan to value ratio, weighted by current balanceSource: Moody's Investors Service; periodic investor/servicer reports
Exhibit 25
30-plus delinquency rates for South Australian postcodes
Postcode Locality Region WACLTV
May-16
30-plus delinquency
May-17
30-plus delinquency
May-17 - May-16
change (% pts)
5108 Paralowie Adelaide - North 68.3% 3.94% 4.03% 0.09
5114 Andrews Farm Adelaide - North 69.9% 1.86% 2.68% 0.82
5159 Aberfoyle Park Adelaide - South 62.1% 2.05% 2.53% 0.48
5162 Morphett Vale Adelaide - South 65.8% 1.84% 2.17% 0.33
5109 Brahma Lodge Adelaide - North 64.4% 2.91% 1.88% -1.03
5158 Hallett Cove Adelaide - South 62.4% 1.39% 1.75% 0.36
5095 Mawson Lakes Adelaide - North 67.8% 2.85% 1.63% -1.22
5125 Golden Grove Adelaide - North 61.4% 0.83% 1.47% 0.64
Note: WACLTV - Weighted average current loan to value ratio, weighted by current balanceSource: Moody's Investors Service; periodic investor/servicer reports
17 18 September 2017 RMBS - Australia : Mortgage delinquency map: Home loan arrears rise to five-year high
MOODY'S INVESTORS SERVICE STRUCTURED FINANCE
Moody's related researchSector comments:
» Rising defaults in Western Australia underscore housing investment loan risks, August 2017
» Structured finance - Australia: Bank downgrades have limited impact on structured finance, June 2017
» Australia's RMBS Will Benefit from Proposal to Expand Regulator's Powers over Mortgage Lending, May 2017
» Housing Affordability Worsening Amid Rising Property Prices, April 2017
» Mortgage Delinquency Map: Home Loan Arrears Rising in All Australian States, April 2017
» New Limits on Interest-Only Mortgages Will Curb Riskier Lending, April 2017
» Alt-Doc Mortgages Subject to Stricter Underwriting than Pre-2008 Low-Doc Mortgages, March 2017
» Housing Market Imbalances Growing in Some States, March 2017
» Heard from the Market: Global Structured Finance Conference 2017, March 2017
» Rising Housing Prices Provide Equity Cushion to Absorb Losses, January 2017
» Buy-to-Let RMBS - Global: Regulations Easing Risks in Mature Markets; Developing Markets Gain Traction, December 2016
» Apartment Construction Boom Poses Moderate Risk to Australian RMBS, September 2016
» Record Low Rental Yields Increase Risks for Residential Property Investors, April 2016
» Negative Euribor Rates Pose Risks to Some Australian RMBS and ABS, February 2016
Outlook:
» Structured Finance - Global: Outlook 2017 - Tepid Growth Props Up Asset Quality, December 2016
» Australia 2017 Outlook - Delinquencies Will Increase Moderately, November 2016
Index:
» Global Structured Finance Collateral Performance Review Australian RMBS Indices – Q2 2017 - Excel Data, August 2017
Rating Methodology:
» Moody’s Approach to Rating RMBS Using the MILAN Framework
» RMBS Rating Methodology Supplement - Australia
To access any of these reports, click on the entry above. Note that these references are current as of the date of publication of thisreport and that more recent reports may be available. All research may not be available to all clients.
18 18 September 2017 RMBS - Australia : Mortgage delinquency map: Home loan arrears rise to five-year high
MOODY'S INVESTORS SERVICE STRUCTURED FINANCE
Endnotes1 This report compares delinquencies between May 2017 and May 2016 rather than November 2016 (the period for our previous mortgage delinquency map
report) to avoid differences caused by seasonal fluctuations.
2 Our records began in 2005. See Australian Residential Mortgage Delinquency Map - May 2017 for all historical 30+ delinquency rates.
3 Source: Australian Bureau of Statistics.
4 The populations in the Northern Territory, South Australia, Tasmania and the ACT are all relatively small. Mortgages from these states and territoriesaccount for just 0.73% (the Northern Territory), 4.69% (South Australia), 0.96% (Tasmania) and 2.17% (ACT) of the loans in our RMBS portfolio. SeeAustralian Residential Mortgage Delinquency Map - May 2017, Appendix 1.
5 See Extent of fiscal resolve to balance budgets will drive variations in credit quality.
6 See Above-potential growth in advanced economies propels economic expansion.
7 The 190% household debt level is based on gross household debt and does not consider deposits in mortgage offset accounts.
8 Postcode analysis has several well-known deficiencies, including the fact that it is difficult to apply meaningful analytical judgment at such a granularlevel. To ensure that results are meaningful, we have excluded postcodes with less than 400 loans.
19 18 September 2017 RMBS - Australia : Mortgage delinquency map: Home loan arrears rise to five-year high
MOODY'S INVESTORS SERVICE STRUCTURED FINANCE
© 2017 Moody’s Corporation, Moody’s Investors Service, Inc., Moody’s Analytics, Inc. and/or their licensors and affiliates (collectively, “MOODY’S”). All rights reserved.
CREDIT RATINGS ISSUED BY MOODY'S INVESTORS SERVICE, INC. AND ITS RATINGS AFFILIATES (“MIS”) ARE MOODY’S CURRENT OPINIONS OF THE RELATIVE FUTURE CREDITRISK OF ENTITIES, CREDIT COMMITMENTS, OR DEBT OR DEBT-LIKE SECURITIES, AND MOODY’S PUBLICATIONS MAY INCLUDE MOODY’S CURRENT OPINIONS OF THERELATIVE FUTURE CREDIT RISK OF ENTITIES, CREDIT COMMITMENTS, OR DEBT OR DEBT-LIKE SECURITIES. MOODY’S DEFINES CREDIT RISK AS THE RISK THAT AN ENTITYMAY NOT MEET ITS CONTRACTUAL, FINANCIAL OBLIGATIONS AS THEY COME DUE AND ANY ESTIMATED FINANCIAL LOSS IN THE EVENT OF DEFAULT. CREDIT RATINGSDO NOT ADDRESS ANY OTHER RISK, INCLUDING BUT NOT LIMITED TO: LIQUIDITY RISK, MARKET VALUE RISK, OR PRICE VOLATILITY. CREDIT RATINGS AND MOODY’SOPINIONS INCLUDED IN MOODY’S PUBLICATIONS ARE NOT STATEMENTS OF CURRENT OR HISTORICAL FACT. MOODY’S PUBLICATIONS MAY ALSO INCLUDE QUANTITATIVEMODEL-BASED ESTIMATES OF CREDIT RISK AND RELATED OPINIONS OR COMMENTARY PUBLISHED BY MOODY’S ANALYTICS, INC. CREDIT RATINGS AND MOODY’SPUBLICATIONS DO NOT CONSTITUTE OR PROVIDE INVESTMENT OR FINANCIAL ADVICE, AND CREDIT RATINGS AND MOODY’S PUBLICATIONS ARE NOT AND DO NOTPROVIDE RECOMMENDATIONS TO PURCHASE, SELL, OR HOLD PARTICULAR SECURITIES. NEITHER CREDIT RATINGS NOR MOODY’S PUBLICATIONS COMMENT ON THESUITABILITY OF AN INVESTMENT FOR ANY PARTICULAR INVESTOR. MOODY’S ISSUES ITS CREDIT RATINGS AND PUBLISHES MOODY’S PUBLICATIONS WITH THE EXPECTATIONAND UNDERSTANDING THAT EACH INVESTOR WILL, WITH DUE CARE, MAKE ITS OWN STUDY AND EVALUATION OF EACH SECURITY THAT IS UNDER CONSIDERATION FORPURCHASE, HOLDING, OR SALE.
MOODY’S CREDIT RATINGS AND MOODY’S PUBLICATIONS ARE NOT INTENDED FOR USE BY RETAIL INVESTORS AND IT WOULD BE RECKLESS AND INAPPROPRIATE FORRETAIL INVESTORS TO USE MOODY’S CREDIT RATINGS OR MOODY’S PUBLICATIONS WHEN MAKING AN INVESTMENT DECISION. IF IN DOUBT YOU SHOULD CONTACTYOUR FINANCIAL OR OTHER PROFESSIONAL ADVISER. ALL INFORMATION CONTAINED HEREIN IS PROTECTED BY LAW, INCLUDING BUT NOT LIMITED TO, COPYRIGHT LAW,AND NONE OF SUCH INFORMATION MAY BE COPIED OR OTHERWISE REPRODUCED, REPACKAGED, FURTHER TRANSMITTED, TRANSFERRED, DISSEMINATED, REDISTRIBUTEDOR RESOLD, OR STORED FOR SUBSEQUENT USE FOR ANY SUCH PURPOSE, IN WHOLE OR IN PART, IN ANY FORM OR MANNER OR BY ANY MEANS WHATSOEVER, BY ANYPERSON WITHOUT MOODY’S PRIOR WRITTEN CONSENT.
All information contained herein is obtained by MOODY’S from sources believed by it to be accurate and reliable. Because of the possibility of human or mechanical error as wellas other factors, however, all information contained herein is provided “AS IS” without warranty of any kind. MOODY'S adopts all necessary measures so that the information ituses in assigning a credit rating is of sufficient quality and from sources MOODY'S considers to be reliable including, when appropriate, independent third-party sources. However,MOODY’S is not an auditor and cannot in every instance independently verify or validate information received in the rating process or in preparing the Moody’s publications.
To the extent permitted by law, MOODY’S and its directors, officers, employees, agents, representatives, licensors and suppliers disclaim liability to any person or entity for anyindirect, special, consequential, or incidental losses or damages whatsoever arising from or in connection with the information contained herein or the use of or inability to use anysuch information, even if MOODY’S or any of its directors, officers, employees, agents, representatives, licensors or suppliers is advised in advance of the possibility of such losses ordamages, including but not limited to: (a) any loss of present or prospective profits or (b) any loss or damage arising where the relevant financial instrument is not the subject of aparticular credit rating assigned by MOODY’S.
To the extent permitted by law, MOODY’S and its directors, officers, employees, agents, representatives, licensors and suppliers disclaim liability for any direct or compensatorylosses or damages caused to any person or entity, including but not limited to by any negligence (but excluding fraud, willful misconduct or any other type of liability that, for theavoidance of doubt, by law cannot be excluded) on the part of, or any contingency within or beyond the control of, MOODY’S or any of its directors, officers, employees, agents,representatives, licensors or suppliers, arising from or in connection with the information contained herein or the use of or inability to use any such information.
NO WARRANTY, EXPRESS OR IMPLIED, AS TO THE ACCURACY, TIMELINESS, COMPLETENESS, MERCHANTABILITY OR FITNESS FOR ANY PARTICULAR PURPOSE OF ANY SUCHRATING OR OTHER OPINION OR INFORMATION IS GIVEN OR MADE BY MOODY’S IN ANY FORM OR MANNER WHATSOEVER.
Moody’s Investors Service, Inc., a wholly-owned credit rating agency subsidiary of Moody’s Corporation (“MCO”), hereby discloses that most issuers of debt securities (includingcorporate and municipal bonds, debentures, notes and commercial paper) and preferred stock rated by Moody’s Investors Service, Inc. have, prior to assignment of any rating,agreed to pay to Moody’s Investors Service, Inc. for appraisal and rating services rendered by it fees ranging from $1,500 to approximately $2,500,000. MCO and MIS also maintainpolicies and procedures to address the independence of MIS’s ratings and rating processes. Information regarding certain affiliations that may exist between directors of MCO andrated entities, and between entities who hold ratings from MIS and have also publicly reported to the SEC an ownership interest in MCO of more than 5%, is posted annually atwww.moodys.com under the heading “Investor Relations — Corporate Governance — Director and Shareholder Affiliation Policy.”
Additional terms for Australia only: Any publication into Australia of this document is pursuant to the Australian Financial Services License of MOODY’S affiliate, Moody’s InvestorsService Pty Limited ABN 61 003 399 657AFSL 336969 and/or Moody’s Analytics Australia Pty Ltd ABN 94 105 136 972 AFSL 383569 (as applicable). This document is intendedto be provided only to “wholesale clients” within the meaning of section 761G of the Corporations Act 2001. By continuing to access this document from within Australia, yourepresent to MOODY’S that you are, or are accessing the document as a representative of, a “wholesale client” and that neither you nor the entity you represent will directly orindirectly disseminate this document or its contents to “retail clients” within the meaning of section 761G of the Corporations Act 2001. MOODY’S credit rating is an opinion asto the creditworthiness of a debt obligation of the issuer, not on the equity securities of the issuer or any form of security that is available to retail investors. It would be recklessand inappropriate for retail investors to use MOODY’S credit ratings or publications when making an investment decision. If in doubt you should contact your financial or otherprofessional adviser.
Additional terms for Japan only: Moody's Japan K.K. (“MJKK”) is a wholly-owned credit rating agency subsidiary of Moody's Group Japan G.K., which is wholly-owned by Moody’sOverseas Holdings Inc., a wholly-owned subsidiary of MCO. Moody’s SF Japan K.K. (“MSFJ”) is a wholly-owned credit rating agency subsidiary of MJKK. MSFJ is not a NationallyRecognized Statistical Rating Organization (“NRSRO”). Therefore, credit ratings assigned by MSFJ are Non-NRSRO Credit Ratings. Non-NRSRO Credit Ratings are assigned by anentity that is not a NRSRO and, consequently, the rated obligation will not qualify for certain types of treatment under U.S. laws. MJKK and MSFJ are credit rating agencies registeredwith the Japan Financial Services Agency and their registration numbers are FSA Commissioner (Ratings) No. 2 and 3 respectively.
MJKK or MSFJ (as applicable) hereby disclose that most issuers of debt securities (including corporate and municipal bonds, debentures, notes and commercial paper) and preferredstock rated by MJKK or MSFJ (as applicable) have, prior to assignment of any rating, agreed to pay to MJKK or MSFJ (as applicable) for appraisal and rating services rendered by it feesranging from JPY200,000 to approximately JPY350,000,000.
MJKK and MSFJ also maintain policies and procedures to address Japanese regulatory requirements.
REPORT NUMBER 1090138
20 18 September 2017 RMBS - Australia : Mortgage delinquency map: Home loan arrears rise to five-year high
MOODY'S INVESTORS SERVICE STRUCTURED FINANCE
CLIENT SERVICES
Americas 1-212-553-1653
Asia Pacific 852-3551-3077
Japan 81-3-5408-4100
EMEA 44-20-7772-5454
21 18 September 2017 RMBS - Australia : Mortgage delinquency map: Home loan arrears rise to five-year high


![Untitled-2 [globalbusinessservices.kfintech.com] · 30Y Mortgage Rate Mortgage Delinquency . Title: Untitled-2 Author: Nitin Chowdhari Created Date: 9/15/2017 3:07:31 PM](https://img.pdfslide.us/doc/110x75/5f0725237e708231d41b87a2/untitled-2-gl-30y-mortgage-rate-mortgage-delinquency-title-untitled-2-author.jpg)