Embed Size (px)
Citation preview
thedesk
Wednesday, January 10, 2018 Volume 19
(Continued on page 2)
(Continued on page 3)(Continued on page 3)
GAS STORAGE FORECAST
LAST FRIDAY/EARLY VIEW
LY REPORT & 5YR AVG
LY & 5YR STORAGE LEVELS
AROUND THE DESK
MARKET MAKERS
weekly gas storage
tealeaves
Early View Avg (1/5) -329.7 Bcf Early View Median: -329.5 BcfRange: -310 to -344 BcfStandard Deviation: 8.4Number of Forecasts: 14
TheDesk Consensus Avg: -335.1 BcfTheDesk Median: -335.1 BcfTheDesk Survey Range: -305 to -365 BcfTop 6 Survey’s Index Avg: -332.9 BcfStandard Deviation: 12.4Number of Forecasts: 33Editor’s Forecast: -340 BcfQ1 Boxscores #1: Reza Haidari, TR -3372017 Champ: Eric Fell, Genscape: -352 Bcf
‘17 Build/Same Week: -151 Bcf 5 Yr Avg Draw/Same Week: -162 Bcf
The industry journal of energy trading, Natural Gas Storage Analysis and market intelligence
Lots of news around the desk this week … Two of the top stories seem to center on this week’s expected, massive inventory draw reports out of EIA – crude today and natty gas tomorrow. API’s forecast, a wildly-high 11-MB draw sent markets screaming, but real-ity soon set in, sort of. As for the gas storage report tomorrow, all bets are off. The range at the moment is -305 Bcf to -365 Bcf, the widest we’ve seen in years. We imagine lots of human traders will simply skip the ceremony Thursday morning and let the algos battle it out. … The other big news, not in the slight-est weather-related, was FERC’s announce-ment Monday that the DOE NOPR is more or less DOA. The five FERC commissioners unanimously rejected Energy Secretary Rick Perry’s proposal to prop up the coal and nu-clear sectors that would have tossed a wrench in decades worth of sound, wholesale mar-ket price dynamics. The whole episode had the lot of us scratching our heads. Was the NOPR simply a political bone tossed to the coal and nuke sector as payback for votes and GOP support in the campaign of 2017? Was there truly no expectation for success on this one? This question is a tough one. Clearly, the NOPR was a bone tossed to the flagging coal and nuclear sectors. Also clear, however, there was in fact a high expectation for success on the administration side. This was not simply political pandering. Sources we spoke to all
Biggest, baddest storage draw ever. But, we reckon, not for long. So long as demand continues to creep up and prices continue to creep up and production and … you get the idea. If severe shots of cold Winter weather occur more often, so too should 300-plus Bcf draws. The previous record of -288 Bcf may be eclipsed by 50 Bcf or more this week. The latest Short-Term Energy Outlook from EIA says that the growth in natural gas use and demand on every level should continue into 2018 and beyond, further edging out coal and nuclear-fired
alternatives. And production is expected to torque up as well. Bottom line: Don’t get so excited the next time the consensus is warning about 300-Bcf draws. The range this week is very wide, even more so than last Friday’s Early View (-310 to -344 Bcf). And, we might add, just about everybody’s forecast this week (among those 14 who submitted Early View forecasts on Friday) is bigger by 5 to 10 Bcf. Bigger by 10 Bcf? Add to this new clarity the fact that EIA de-livered a surprise LowBaller last week and as Bentek so aptly describes it, “Larger-than-average errors would not be unexpected this week.” Sample activity all around the
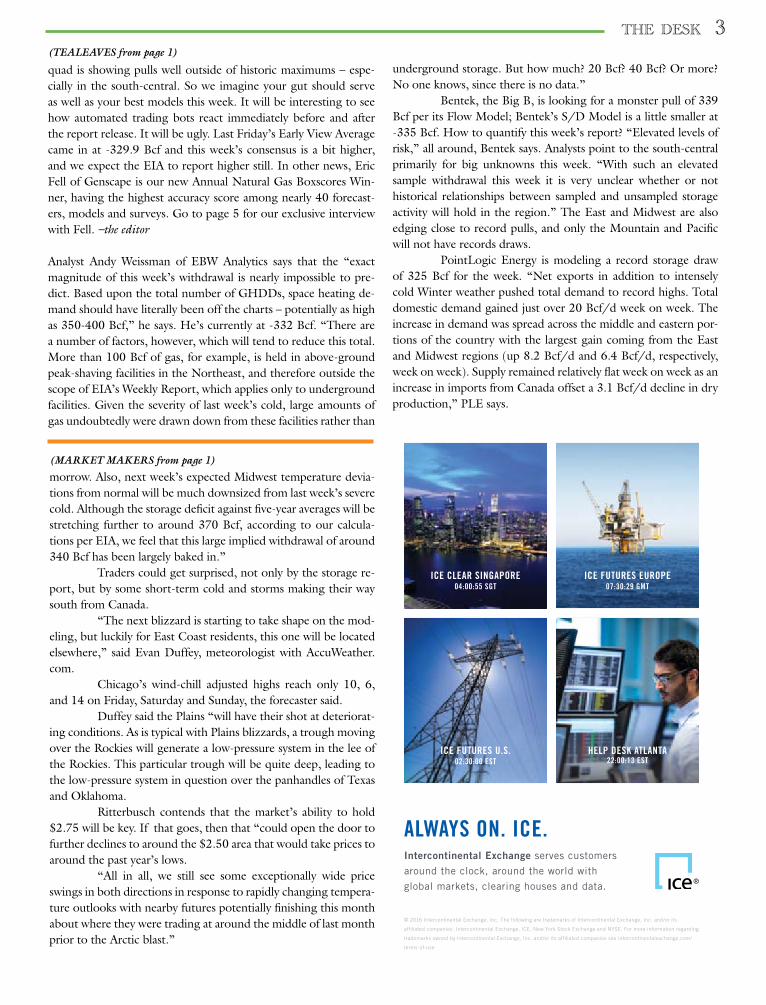
Current Storage Level: 3,126 Bcf Storage 2016/Same Week: 3,318 Bcf/Delta -192 Bcf (-5.8%)
5Yr Avg/Same Week: 3,318 Bcf/Delta -192 Bcf (-5.8%)
Conventional wisdom has it that spot futures aren’t going to make it much past $3 as trad-ers are by and large looking past near-term cold weather as well as what is expected to be the largest ever storage draw ever – well over 300 Bcf by most estimates. “We are still disinclined to shift to a bullish stance in response to this week’s 20-cent price pop that has emanated from colder-than-previously-expected temperatures across most of next week,” said Jim Ritterbusch of Ritterbusch and Associates in a Wednesday note to clients. Ritterbusch sees moderating trends beyond next week “with this shift likely to maintain pricing below the $3 mark, even al-lowing for a supportive EIA storage figure to-
with Bill Burson

2 the desk
(AROUND THE DESK from page 1)
around the quad honestly believed that significant changes would be forcibly engineered to established market pricing functions to prop up coal, and to a lesser extent, nuclear. The reaction from the greater energy sector was somewhat of a surprise. Hmm. We can’t square that last bit, despite what we were told. We also can’t exactly square what the heck acting chairman Neil Chatterjee was all about in the Fall as he attempted to ram through this absurd proposal while FERC lacked a quorum and a permanent chair-man. We’ve been covering this sector since the late ‘80s and we can’t recall a time when a single government policy or proposed policy actually united in opposition the oil, natural gas, wind, so-lar, environmentalist and manufacturing sectors. That was quite a trick indeed, though perhaps not in the fashion the administration intended. Of the hundreds of commentaries and analyses penned on the DOE NOPR in the past several months, we must say that the one written by analyst Andy Weissman for our special End of Year Issue of The Risk Desk, still resonates. Weissman more or less brushed aside the usual charges of ”administration-directed coal bailouts” and, for that matter, deeper questions of grid resilience, and instead focused on what we really should be focused on: countless and critical wholesale market flaws. “Grid resilience is a critical issue which FERC has a statutory obligation to address. In determining whether FERC’s rules need to be revised, however, it is not the only issue FERC needs to address – or even the most important. Instead, I contend there are profound flaws in FERC’s approach to regulating wholesale markets, which have become increasingly ill-suited to meeting the needs of the grid and fail to accommodate important state policies,” Weissman wrote. “There is a need to rigorously assess the effectiveness of FERC’s current mar-ket rules. In the 20-plus years since FERC issued Order No. 888, FERC has never rigorously evaluated the effectiveness of its preferred market structure.” Several thousand words later, Weissman concludes that, “Undertaking the required re-examination in a thorough, objective manner (without preconceptions) will take courage, particularly for a chair-man who has just been sworn in. Kevin McIntyre’s legacy as chairman will depend heavily on his willingness and ability to tackle this responsibility.” True enough. So, in a concession of sorts to the Perry proposal, FERC has now launched an effort to formally ask the question of power grid operators: Just how resilient are these systems? Was this Perry’s plan all along? Was this the administration’s long game? We doubt it, but the results of Chairman McIntyre’s first big decision has managed to nonetheless make everybody happier. And perhaps, as Weissman suggested, creates a critical opportu-nity to explore other potential flaws in the structure of our wholesale markets. If you’d like a free copy of Weissman’s commentary, contact us at [email protected]. Not missing a beat, following FERC’s rejection of the NOPR on Monday, Perry released a statement saying he was glad to be the one who started this important conversation on grid resilience. “As intended, my proposal initiated a na-tional debate on the resiliency of our electric system.” An associated DOE statement suggested that by rejecting the NOPR, US grids may now be at greater risk. A DOE spokes-
man said that, “While the grid’s integrity is being maintained by an abundant and diverse supply of fuel sources today, the real ques-tion is whether or not this diversity will be here tomorrow.” And further, that “marketplace distortions are putting the very resource mix that has enabled our ability to endure severe events at risk. Without action, we cannot guarantee the long-term reliability and resiliency of the electric grid. This is a priority for Secretary Perry, because energy security drives the economy and ensures our na-tion’s security.” Yup. If Weissman is right, and he often is, this may just be the start of a legacy run for FERC’s new chairman. … Speaking of FERC chairmen and big legacies, Utility Drive pinged one notable former chairman for a comment on the unanimously-rejected DOE NOPR and nobody was disappointed. Bush-era FERC chief Pat Wood praised the Monday action at the agency: “It’s a great counter voice to some of the other things going on in (Washington, DC). I wish the country could run the whole damn country like we do FERC.” FERC in 2020? And so, there it is …
Cleared futures contracts on hundreds of hubs, zones and nodes provide participants with superior basis risk management.Nodal Exchange also offers participants enhanced:
• Credit risk management
• Capital efficiency with portfolio margining
• Price discovery with daily marks on approximately 50,000 expiries
• Superior risk management services, including straight-through processing (STP)
Clear the basis
(703) 962.9800 • www.nodalexchange.com
part of eex group
the next generation of energy tradingnodal
the desk 3(TEALEAVES from page 1)
quad is showing pulls well outside of historic maximums – espe-cially in the south-central. So we imagine your gut should serve as well as your best models this week. It will be interesting to see how automated trading bots react immediately before and after the report release. It will be ugly. Last Friday’s Early View Average came in at -329.9 Bcf and this week’s consensus is a bit higher, and we expect the EIA to report higher still. In other news, Eric Fell of Genscape is our new Annual Natural Gas Boxscores Win-ner, having the highest accuracy score among nearly 40 forecast-ers, models and surveys. Go to page 5 for our exclusive interview with Fell. –the editor
Analyst Andy Weissman of EBW Analytics says that the “exact magnitude of this week’s withdrawal is nearly impossible to pre-dict. Based upon the total number of GHDDs, space heating de-mand should have literally been off the charts – potentially as high as 350-400 Bcf,” he says. He’s currently at -332 Bcf. “There are a number of factors, however, which will tend to reduce this total. More than 100 Bcf of gas, for example, is held in above-ground peak-shaving facilities in the Northeast, and therefore outside the scope of EIA’s Weekly Report, which applies only to underground facilities. Given the severity of last week’s cold, large amounts of gas undoubtedly were drawn down from these facilities rather than
(MARKET MAKERS from page 1)
morrow. Also, next week’s expected Midwest temperature devia-tions from normal will be much downsized from last week’s severe cold. Although the storage deficit against five-year averages will be stretching further to around 370 Bcf, according to our calcula-tions per EIA, we feel that this large implied withdrawal of around 340 Bcf has been largely baked in.” Traders could get surprised, not only by the storage re-port, but by some short-term cold and storms making their way south from Canada. “The next blizzard is starting to take shape on the mod-eling, but luckily for East Coast residents, this one will be located elsewhere,” said Evan Duffey, meteorologist with AccuWeather.com. Chicago’s wind-chill adjusted highs reach only 10, 6, and 14 on Friday, Saturday and Sunday, the forecaster said. Duffey said the Plains “will have their shot at deteriorat-ing conditions. As is typical with Plains blizzards, a trough moving over the Rockies will generate a low-pressure system in the lee of the Rockies. This particular trough will be quite deep, leading to the low-pressure system in question over the panhandles of Texas and Oklahoma. Ritterbusch contends that the market’s ability to hold $2.75 will be key. If that goes, then that “could open the door to further declines to around the $2.50 area that would take prices to around the past year’s lows. “All in all, we still see some exceptionally wide price swings in both directions in response to rapidly changing tempera-ture outlooks with nearby futures potentially finishing this month about where they were trading at around the middle of last month prior to the Arctic blast.”
underground storage. But how much? 20 Bcf? 40 Bcf? Or more? No one knows, since there is no data.” Bentek, the Big B, is looking for a monster pull of 339 Bcf per its Flow Model; Bentek’s S/D Model is a little smaller at -335 Bcf. How to quantify this week’s report? “Elevated levels of risk,” all around, Bentek says. Analysts point to the south-central primarily for big unknowns this week. “With such an elevated sample withdrawal this week it is very unclear whether or not historical relationships between sampled and unsampled storage activity will hold in the region.” The East and Midwest are also edging close to record pulls, and only the Mountain and Pacific will not have records draws. PointLogic Energy is modeling a record storage draw of 325 Bcf for the week. “Net exports in addition to intensely cold Winter weather pushed total demand to record highs. Total domestic demand gained just over 20 Bcf/d week on week. The increase in demand was spread across the middle and eastern por-tions of the country with the largest gain coming from the East and Midwest regions (up 8.2 Bcf/d and 6.4 Bcf/d, respectively, week on week). Supply remained relatively flat week on week as an increase in imports from Canada offset a 3.1 Bcf/d decline in dry production,” PLE says.
ALWAYS ON. ICE.Intercontinental Exchange serves customers
around the clock, around the world with
global markets, clearing houses and data.
© 2016 Intercontinental Exchange, Inc. The following are trademarks of Intercontinental Exchange, Inc. and/or its
affiliated companies: Intercontinental Exchange, ICE, New York Stock Exchange and NYSE. For more information regarding
trademarks owned by Intercontinental Exchange, Inc. and/or its affiliated companies see intercontinentalexchange.com/
terms-of-use
ICE FUTURES EUROPE07:30:29 GMT
ICE CLEAR SINGAPORE04:00:55 SGT
ICE FUTURES U.S.02:30:00 EST
HELP DESK ATLANTA22:00:13 EST
4 the desk
Last Four Reports: -525 BcfLast Four Reports/Weekly Avg: -131.25 BcfLast Four Reports/5 Yr Average: -445 Bcf Last Four Reports/Weekly 5 Yr Avg: -111.25 Bcf
THIS WEEK’S SURVEY TALLY2. The Game: Weekly Gas Storage Boxscores
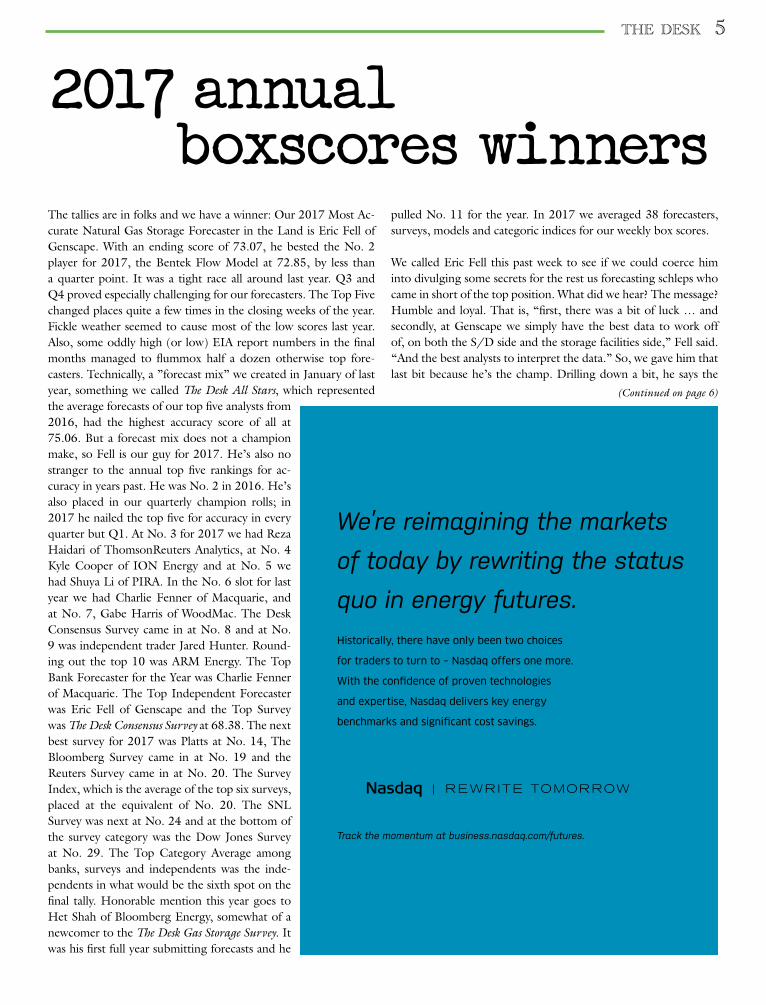
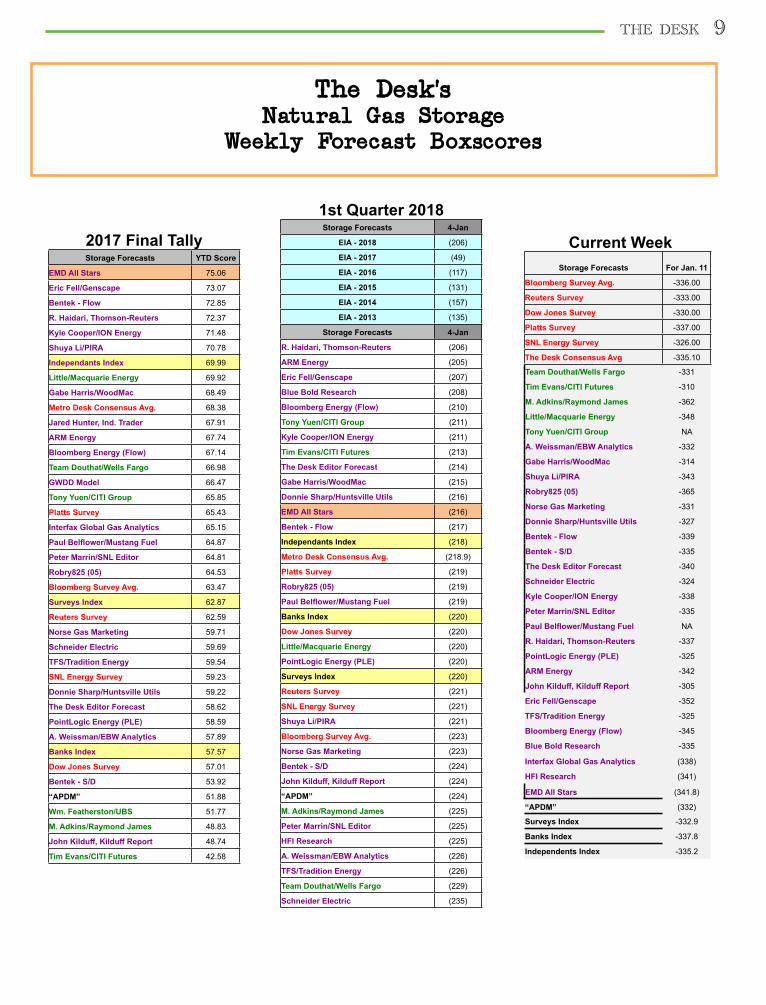
Each week we poll up to 37 professional natural gas forecasters, surveys and models for our weekly Natural Gas Storage Boxscores (see page 9). This is North America’s biggest natural gas storage survey. Forecasts are arranged into 3 categories:1. Major Surveys (up to 6) + avg (Survey Index).2. Bank/Financial Firm Analysts (up to 6) + avg.3. Ind. Analysts/Models/Commercial Firms (up to 25) This week, the preliminary tallies (33 estimates) are: Survey’s Polled This Week: 6Survey’s Forecast Avg: -332.9 Bcf (med. -334.1 Bcf)Bank Analysts Polled: 4Bank Forecast Avg: -337.8 Bcf (med. -339.5 Bcf)Independents Polled: 23Ind Analyst Forecast Avg: -335.2 Bcf (med. -337 Bcf)
This week’s HighBallers:1 Robry825: -365 Bcf2. Raymond James: -362 Bcf3. Genscape: -352 Bcf4. Macquarie Energy: -348 Bcf5. Bloomberg Energy: -345
This week’s LowBallers:1. Kilduff Report: -305 Bcf2. Tim Evans, CITI Futures: -310 Bcf3. Gabe Harris, WoodMac: -314 Bcf4. Schneider Electric: -324 Bcf5. TFS: -325 Bcf6. PointLogic Energy: -325
The Desk All Stars: -341.8 Bcf (avg of our top 5 analysts)
The Desk Average Forecast: -335.1 BcfThe Desk Median: -335.1 BcfSurvey Index: --332.9 Bcf*(*avg. of the top 6 national surveys)The Desk Range: -305 to -365 BcfStandard Deviation: 12.4Editors Forecast This Week: -340 Bcf
Tealeaves’ Preliminary Forecast Range For 1/18: -210 to -300 BcfLast Year, Next Week: -243 Bcf 5 Year Average/Next Week: -219 Bcf (adjusted)
For last week’s (1/5/18) EIA natural gas storage report, we had one winner: Reza Haidari of ThomsonReuters Analytics was spot-on at -206 Bcf and thus is The Best Natural Gas Storage Forecaster in the Land for the EIA report week.
The Desk Commentary from 2017Net withdrawals from storage totaled 151 Bcf, compared with the five-year (2012–16) average net withdrawal of 167 Bcf and last year’s net withdrawal of 152 Bcf during the same week. Increased heating demand for natural gas contributed to the increased rate of withdrawals compared with the week end-ing December 30, 2016, when net withdrawals totaled 49 Bcf. Working gas stocks total 3,160 Bcf, which is 4 Bcf less than the five-year average and 363 Bcf less than last year at this time. According to the Bloomberg survey of natural gas ana-lysts, estimates of net natural gas withdrawals from storage ranged from 132 Bcf to 160 Bcf, with a median of 144 Bcf. At the release of EIA’s storage report, prices varied in subsequent trading, climbing to $3.44/MMBtu within two minutes of the re-lease. Average temperatures in the lower 48 states fell 6°F on the week and averaged 37°F. T
ICE (EIA) Cleared Storage Futures
35000
55000
75000
95000
115000
135000
155000
1/23
/15
3/23
/15
5/23
/15
7/23
/15
9/23
/15
11/2
3/15
1/23
/16
3/23
/16
5/23
/16
7/23
/16
9/23
/16
11/2
3/16
1/23
/17
3/23
/17
5/23
/17
7/23
/17
9/23
/17
11/2
3/17
Supply Demand Balance (MMcf)
Demand Supply
EIA End of Fill Season (11/18) 1 @ 3,650 10 @ 3,750
End of Draw Season 4/184@1,2651@1,3152@1,3205@1,3221@1,3292@1,3335@1,335
14@1,3351@1,3401@1,3416@1,34320@1,3454@1,3491@1,350
the desk 5
Track the momentum at business.nasdaq.com/futures.
We’re reimagining the markets
of today by rewriting the status
quo in energy futures.
Historically, there have only been two choices
for traders to turn to – Nasdaq offers one more.
With the confidence of proven technologies
and expertise, Nasdaq delivers key energy
benchmarks and significant cost savings.
2017 annual boxscores winnersThe tallies are in folks and we have a winner: Our 2017 Most Ac-curate Natural Gas Storage Forecaster in the Land is Eric Fell of Genscape. With an ending score of 73.07, he bested the No. 2 player for 2017, the Bentek Flow Model at 72.85, by less than a quarter point. It was a tight race all around last year. Q3 and Q4 proved especially challenging for our forecasters. The Top Five changed places quite a few times in the closing weeks of the year. Fickle weather seemed to cause most of the low scores last year. Also, some oddly high (or low) EIA report numbers in the final months managed to flummox half a dozen otherwise top fore-casters. Technically, a ”forecast mix” we created in January of last year, something we called The Desk All Stars, which represented the average forecasts of our top five analysts from 2016, had the highest accuracy score of all at 75.06. But a forecast mix does not a champion make, so Fell is our guy for 2017. He’s also no stranger to the annual top five rankings for ac-curacy in years past. He was No. 2 in 2016. He’s also placed in our quarterly champion rolls; in 2017 he nailed the top five for accuracy in every quarter but Q1. At No. 3 for 2017 we had Reza Haidari of ThomsonReuters Analytics, at No. 4 Kyle Cooper of ION Energy and at No. 5 we had Shuya Li of PIRA. In the No. 6 slot for last year we had Charlie Fenner of Macquarie, and at No. 7, Gabe Harris of WoodMac. The Desk Consensus Survey came in at No. 8 and at No. 9 was independent trader Jared Hunter. Round-ing out the top 10 was ARM Energy. The Top Bank Forecaster for the Year was Charlie Fenner of Macquarie. The Top Independent Forecaster was Eric Fell of Genscape and the Top Survey was The Desk Consensus Survey at 68.38. The next best survey for 2017 was Platts at No. 14, The Bloomberg Survey came in at No. 19 and the Reuters Survey came in at No. 20. The Survey Index, which is the average of the top six surveys, placed at the equivalent of No. 20. The SNL Survey was next at No. 24 and at the bottom of the survey category was the Dow Jones Survey at No. 29. The Top Category Average among banks, surveys and independents was the inde-pendents in what would be the sixth spot on the final tally. Honorable mention this year goes to Het Shah of Bloomberg Energy, somewhat of a newcomer to the The Desk Gas Storage Survey. It was his first full year submitting forecasts and he
pulled No. 11 for the year. In 2017 we averaged 38 forecasters, surveys, models and categoric indices for our weekly box scores. We called Eric Fell this past week to see if we could coerce him into divulging some secrets for the rest us forecasting schleps who came in short of the top position. What did we hear? The message? Humble and loyal. That is, “first, there was a bit of luck … and secondly, at Genscape we simply have the best data to work off of, on both the S/D side and the storage facilities side,” Fell said. “And the best analysts to interpret the data.” So, we gave him that last bit because he’s the champ. Drilling down a bit, he says the
(Continued on page 6)
6 the desk
(BOXSCORE WINNER from page 5)team made “material improvements” this year on how it model and calibrates the S/D side of things. “Huge improvement over Q4 2016. We came in second that time, but we sort of blew up at the very end of the year. I believe the changes we made afterward are what pushed us to the top this year.” For the coming year he didn’t note any new products or features that Genscape would be releasing, but rather more of a focus on how to better use the enormous amount of data they currently produce. “We’re focusing on how best to integrate this massive amount of data across regions or facilities, commodities or what have you.” So, for the end of the 2018 heating season, his estimates are growing, not shrinking. His current end-of-draw season is now -1.29 Tcf and his end-of fill season later this year is at 3.65 Tcf. - Massive jolts of cold weather are all fine and nice, he says, but the big increase in prices lately trumps all the additional HDDs. Last year, we had pretty impressive production all Winter, he says, and this year, we may be seeing some significant freeze-offs in Texas, but it’s only temporary. He says we’ll still be expecting some significant production increases. “I tend to agree with Kyle
Cooper of ION Energy, in the context of always assessing many different models, rather than just one, like production or demand or weather or what have you. If you focus on production, you’re a permanent bear. If you focus just on demand or exports, you’re a permanent bull. The reality is, the needle is moving significantly on both sides. And finally, you can’t ignore prices. Prices matter, particularly in the context of weather-driven demand.” On the subject of weather and price-driven demand, Fell noted a very in-teresting signal on the LNG side last week that’s worth exploring. The other week when Henry prices shot up in the $6.50-$7 neigh-borhood, he noted that Sabine shut down for around 12 hours with no announcement. “They do have excess capacity, maybe 10 percent, versus their export commitments. Given that they have excess capacity, and some storage in the tank, they can probably shut down for brief periods each month and still fulfill commit-ments. This recent shutdown, when Henry prices were high, I believe is the first indication of LNG/liquification demand being responsive to prices.” When Henry was up around $7, he says, “it went from being in the money to negative economics.” More on this next week.
the desk 7
Exclusive Weather Forward Views from WSI, Radiant Solutions and the Commodity Weather Group
weather desk Michael Shuman, a senior meteorologist with The Weather Com-pany/WSI, says highly changeable weather is expected across the lower 48 during the next two weeks. “Initially during the next few days a complex two-part storm system will traverse the central and eastern US with areas of rain, ice and snow. A surge of southerly winds ahead of this system will lead to an abrupt warm-up with much-above-average temperatures and widespread rain,” he says. However, the warm-up will be short-lived as an amplified flow and the aforementioned storm system will combine to drive an-other shot of bitterly cold Arctic air southward into the central and eastern US during the upcoming weekend into the middle of next week. “This cold shot won’t match the magnitude of some of the previous cold. Nonetheless, subzero readings will infiltrate the north-central states and subfreezing lows will expand down into Texas and the South,” Shuman says. This cold shot will give way to a more substantial pattern change for the 11- to 15-day period into the back end of the month; above-average warmth will develop and expand across the south-central and eastern US. For more information, go to http://www.wsi.com/industries-energy.htm.
***Matt Rogers of the Commodity Weather Group says that in the prior two US Winters, “whenever a warm-up got revved up on the models, it usually managed to be even stronger than expected (especially true late last Winter), but here in January it seems the opposite is occurring,” he says. The colder addition to the 6- to 10-day is now broken up into two pieces with the second one lasting longer and delaying the 11-to 15-day warm-up yet again. “However, that warm-up itself is also struggling to strengthen. It
still looks impressive on the European composite, but it is definite-ly not as strong as yesterday’s depiction. The models are struggling big-time with the North Pacific, with overnight changes weaken-ing the warm signals and even 56 percent of the European ensem-ble returning a high-pressure ridge (cold signal) to Alaska by day 15. “This is a massive reversal from yesterday and carries very low confidence until better consistency develops, but the momentum continues to favor colder versus warmer risks.” For more informa-tion, go to http://www.commoditywx.com/free-trial.
***Brad Harvey, a meteorologist for Radiant Solutions (formerly MDA Information Systems), says that the MJO is expected to have an influential role on the atmospheric pattern over the next 15 days, with its warmer correlating phases 3-4 (Indian Ocean to Maritime Continent) having the forecast being about 7 percent warmer than the 30-year normal per national GWHDD measures. “This, however, does not tell the entire story, as a round of much- below-normal temperatures accompany Arctic high pressure into the Midwest early in the 6- to 10-day period and press toward the East Coast in the mid-period,” he says. Overall, the 6- to 10-day period features below-normal temperatures in the Midwest, Southeast and East Coast while above-normal temperatures span the western half of North America, he adds. The 11- to 15-day pe-riod flips the pattern, with above- to much-above normal tempera-tures returning to the eastern half as troughing leaves the West to Northern Rockies on the cold side of normal. For more informa-tion, go to http://www.mdaus.com/Weather-Services/Energy.aspx.
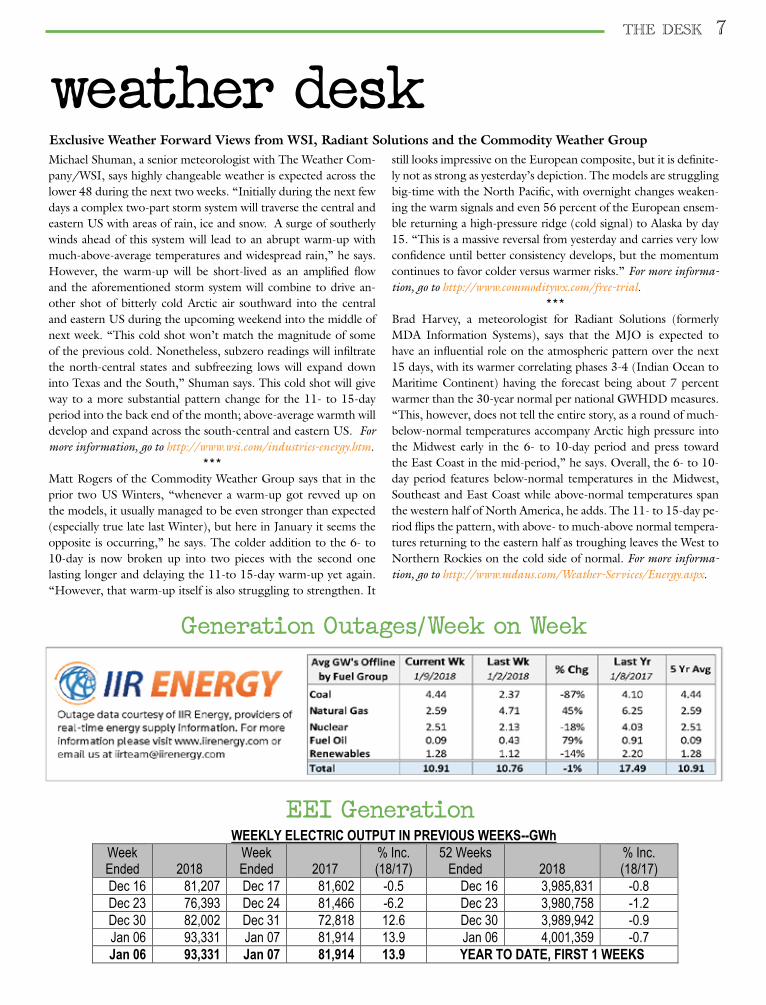
Generation Outages/Week on Week
WEEKLY ELECTRIC OUTPUT IN PREVIOUS WEEKS--GWh
Week Ended 2018
Week Ended 2017
% Inc. (18/17)
52 Weeks Ended 2018
% Inc. (18/17)
Dec 16 81,207 Dec 17 81,602 -0.5 Dec 16 3,985,831 -0.8 Dec 23 76,393 Dec 24 81,466 -6.2 Dec 23 3,980,758 -1.2 Dec 30 82,002 Dec 31 72,818 12.6 Dec 30 3,989,942 -0.9 Jan 06 93,331 Jan 07 81,914 13.9 Jan 06 4,001,359 -0.7 Jan 06 93,331 Jan 07 81,914 13.9 YEAR TO DATE, FIRST 1 WEEKS
EEI Generation
8 the desk
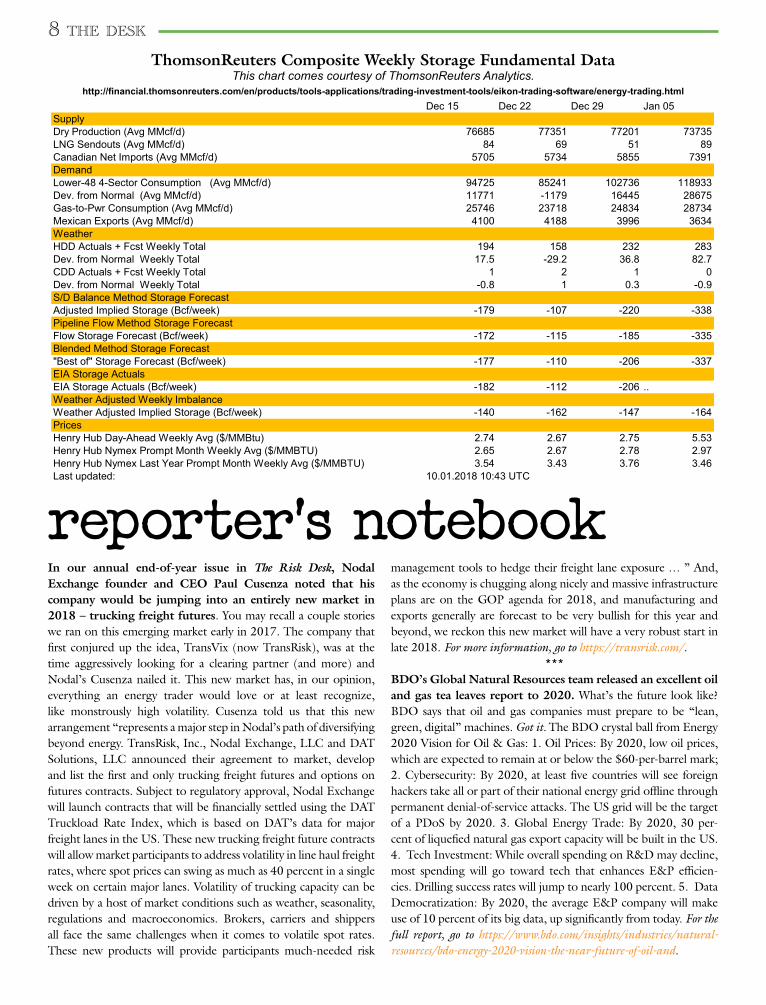
ThomsonReuters Composite Weekly Storage Fundamental DataThis chart comes courtesy of ThomsonReuters Analytics.
http://financial.thomsonreuters.com/en/products/tools-applications/trading-investment-tools/eikon-trading-software/energy-trading.html
reporter’s notebookIn our annual end-of-year issue in The Risk Desk, Nodal Exchange founder and CEO Paul Cusenza noted that his company would be jumping into an entirely new market in 2018 – trucking freight futures. You may recall a couple stories we ran on this emerging market early in 2017. The company that first conjured up the idea, TransVix (now TransRisk), was at the time aggressively looking for a clearing partner (and more) and Nodal’s Cusenza nailed it. This new market has, in our opinion, everything an energy trader would love or at least recognize, like monstrously high volatility. Cusenza told us that this new arrangement “represents a major step in Nodal’s path of diversifying beyond energy. TransRisk, Inc., Nodal Exchange, LLC and DAT Solutions, LLC announced their agreement to market, develop and list the first and only trucking freight futures and options on futures contracts. Subject to regulatory approval, Nodal Exchange will launch contracts that will be financially settled using the DAT Truckload Rate Index, which is based on DAT’s data for major freight lanes in the US. These new trucking freight future contracts will allow market participants to address volatility in line haul freight rates, where spot prices can swing as much as 40 percent in a single week on certain major lanes. Volatility of trucking capacity can be driven by a host of market conditions such as weather, seasonality, regulations and macroeconomics. Brokers, carriers and shippers all face the same challenges when it comes to volatile spot rates. These new products will provide participants much-needed risk
management tools to hedge their freight lane exposure … ” And, as the economy is chugging along nicely and massive infrastructure plans are on the GOP agenda for 2018, and manufacturing and exports generally are forecast to be very bullish for this year and beyond, we reckon this new market will have a very robust start in late 2018. For more information, go to https://transrisk.com/.
***BDO’s Global Natural Resources team released an excellent oil and gas tea leaves report to 2020. What’s the future look like? BDO says that oil and gas companies must prepare to be “lean, green, digital” machines. Got it. The BDO crystal ball from Energy 2020 Vision for Oil & Gas: 1. Oil Prices: By 2020, low oil prices, which are expected to remain at or below the $60-per-barrel mark; 2. Cybersecurity: By 2020, at least five countries will see foreign hackers take all or part of their national energy grid offline through permanent denial-of-service attacks. The US grid will be the target of a PDoS by 2020. 3. Global Energy Trade: By 2020, 30 per-cent of liquefied natural gas export capacity will be built in the US. 4. Tech Investment: While overall spending on R&D may decline, most spending will go toward tech that enhances E&P efficien-cies. Drilling success rates will jump to nearly 100 percent. 5. Data Democratization: By 2020, the average E&P company will make use of 10 percent of its big data, up significantly from today. For the full report, go to https://www.bdo.com/insights/industries/natural-resources/bdo-energy-2020-vision-the-near-future-of-oil-and.
Dec 15 Dec 22 Dec 29 Jan 05SupplyDry Production (Avg MMcf/d) 76685 77351 77201 73735LNG Sendouts (Avg MMcf/d) 84 69 51 89Canadian Net Imports (Avg MMcf/d) 5705 5734 5855 7391DemandLower-48 4-Sector Consumption (Avg MMcf/d) 94725 85241 102736 118933Dev. from Normal (Avg MMcf/d) 11771 -1179 16445 28675Gas-to-Pwr Consumption (Avg MMcf/d) 25746 23718 24834 28734Mexican Exports (Avg MMcf/d) 4100 4188 3996 3634WeatherHDD Actuals + Fcst Weekly Total 194 158 232 283Dev. from Normal Weekly Total 17.5 -29.2 36.8 82.7CDD Actuals + Fcst Weekly Total 1 2 1 0Dev. from Normal Weekly Total -0.8 1 0.3 -0.9S/D Balance Method Storage ForecastAdjusted Implied Storage (Bcf/week) -179 -107 -220 -338Pipeline Flow Method Storage ForecastFlow Storage Forecast (Bcf/week) -172 -115 -185 -335Blended Method Storage Forecast"Best of" Storage Forecast (Bcf/week) -177 -110 -206 -337EIA Storage ActualsEIA Storage Actuals (Bcf/week) -182 -112 -206 ..Weather Adjusted Weekly ImbalanceWeather Adjusted Implied Storage (Bcf/week) -140 -162 -147 -164PricesHenry Hub Day-Ahead Weekly Avg ($/MMBtu) 2.74 2.67 2.75 5.53Henry Hub Nymex Prompt Month Weekly Avg ($/MMBTU) 2.65 2.67 2.78 2.97Henry Hub Nymex Last Year Prompt Month Weekly Avg ($/MMBTU) 3.54 3.43 3.76 3.46Last updated: 10.01.2018 10:43 UTC
the desk 9
The Desk’sNatural Gas Storage
Weekly Forecast Boxscores
1st Quarter 2018Storage Forecasts 4-Jan
EIA - 2018 (206)
EIA - 2017 (49)
EIA - 2016 (117)
EIA - 2015 (131)
EIA - 2014 (157)
EIA - 2013 (135)
Storage Forecasts 4-Jan
R. Haidari, Thomson-Reuters (206)
ARM Energy (205)
Eric Fell/Genscape (207)
Blue Bold Research (208)
Bloomberg Energy (Flow) (210)
Tony Yuen/CITI Group (211)
Kyle Cooper/ION Energy (211)
Tim Evans/CITI Futures (213)
The Desk Editor Forecast (214)
Gabe Harris/WoodMac (215)
Donnie Sharp/Huntsville Utils (216)
EMD All Stars (216)
Bentek - Flow (217)
Independants Index (218)
Metro Desk Consensus Avg. (218.9)
Platts Survey (219)
Robry825 (05) (219)
Paul Belflower/Mustang Fuel (219)
Banks Index (220)
Dow Jones Survey (220)
Little/Macquarie Energy (220)
PointLogic Energy (PLE) (220)
Surveys Index (220)
Reuters Survey (221)
SNL Energy Survey (221)
Shuya Li/PIRA (221)
Bloomberg Survey Avg. (223)
Norse Gas Marketing (223)
Bentek - S/D (224)
John Kilduff, Kilduff Report (224)
“APDM” (224)
M. Adkins/Raymond James (225)
Peter Marrin/SNL Editor (225)
HFI Research (225)
A. Weissman/EBW Analytics (226)
TFS/Tradition Energy (226)
Team Douthat/Wells Fargo (229)
Schneider Electric (235)
2017 Final TallyStorage Forecasts YTD Score
EMD All Stars 75.06
Eric Fell/Genscape 73.07
Bentek - Flow 72.85
R. Haidari, Thomson-Reuters 72.37
Kyle Cooper/ION Energy 71.48
Shuya Li/PIRA 70.78
Independants Index 69.99
Little/Macquarie Energy 69.92
Gabe Harris/WoodMac 68.49
Metro Desk Consensus Avg. 68.38
Jared Hunter, Ind. Trader 67.91
ARM Energy 67.74
Bloomberg Energy (Flow) 67.14
Team Douthat/Wells Fargo 66.98
GWDD Model 66.47
Tony Yuen/CITI Group 65.85
Platts Survey 65.43
Interfax Global Gas Analytics 65.15
Paul Belflower/Mustang Fuel 64.87
Peter Marrin/SNL Editor 64.81
Robry825 (05) 64.53
Bloomberg Survey Avg. 63.47
Surveys Index 62.87
Reuters Survey 62.59
Norse Gas Marketing 59.71
Schneider Electric 59.69
TFS/Tradition Energy 59.54
SNL Energy Survey 59.23
Donnie Sharp/Huntsville Utils 59.22
The Desk Editor Forecast 58.62
PointLogic Energy (PLE) 58.59
A. Weissman/EBW Analytics 57.89
Banks Index 57.57
Dow Jones Survey 57.01
Bentek - S/D 53.92
“APDM” 51.88
Wm. Featherston/UBS 51.77
M. Adkins/Raymond James 48.83
John Kilduff, Kilduff Report 48.74
Tim Evans/CITI Futures 42.58
Storage Forecasts For Jan. 11
Bloomberg Survey Avg. -336.00
Reuters Survey -333.00
Dow Jones Survey -330.00
Platts Survey -337.00
SNL Energy Survey -326.00
The Desk Consensus Avg -335.10
Team Douthat/Wells Fargo -331
Tim Evans/CITI Futures -310
M. Adkins/Raymond James -362
Little/Macquarie Energy -348
Tony Yuen/CITI Group NA
A. Weissman/EBW Analytics -332
Gabe Harris/WoodMac -314
Shuya Li/PIRA -343
Robry825 (05) -365
Norse Gas Marketing -331
Donnie Sharp/Huntsville Utils -327
Bentek - Flow -339
Bentek - S/D -335
The Desk Editor Forecast -340
Schneider Electric -324
Kyle Cooper/ION Energy -338
Peter Marrin/SNL Editor -335
Paul Belflower/Mustang Fuel NA
R. Haidari, Thomson-Reuters -337
PointLogic Energy (PLE) -325
ARM Energy -342
John Kilduff, Kilduff Report -305
Eric Fell/Genscape -352
TFS/Tradition Energy -325
Bloomberg Energy (Flow) -345
Blue Bold Research -335
Interfax Global Gas Analytics (338)
HFI Research (341)
EMD All Stars (341.8)
“APDM” (332)
Surveys Index -332.9
Banks Index -337.8
Independents Index -335.2
Current Week