Embed Size (px)
DESCRIPTION
Navigating Through Volatile Times . Aron Gampel Vice-President & Deputy Chief Economist. Toronto, Ontario February 14, 2012. Global Output Moves To A Slower Growth Trajectory. Real GDP. annual % change. 2004-07. - PowerPoint PPT Presentation
Citation preview
Aron Gampel Vice-President & Deputy Chief Economist
Navigating Through Volatile Times
Toronto, Ontario
February 14, 2012
-2
0
2
4
6
8
10
12
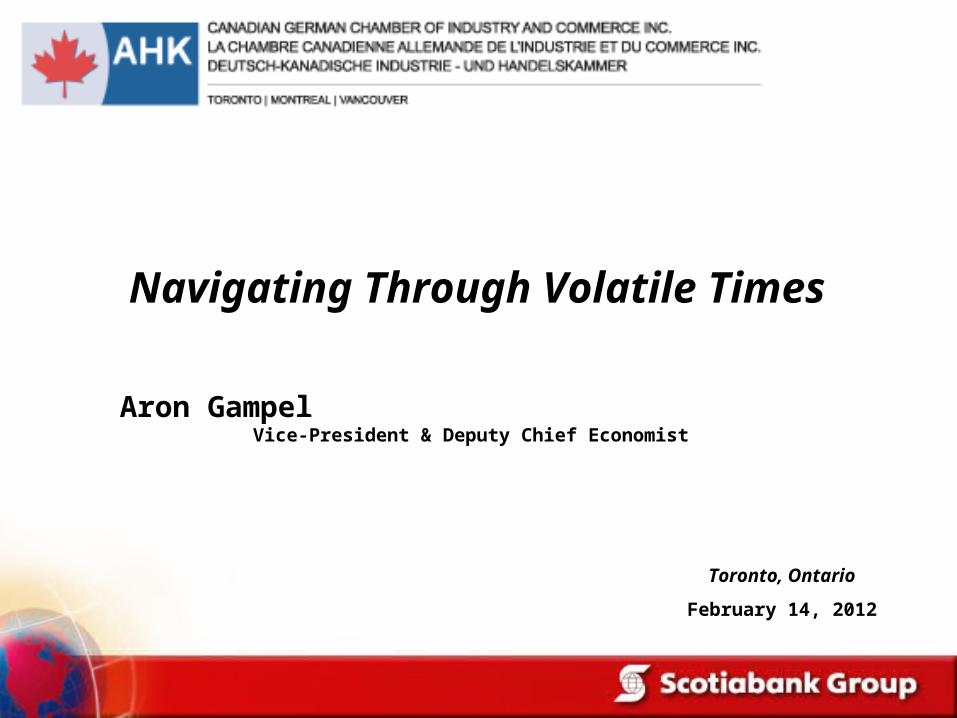
China India Brazil Mexico Japan U.S. Canada Euro zone
2010
2011f
2012f
annual % change
Source: Scotia Economics, Bloomberg, BEA, Statistics Canada, Eurostat.
Real GDP
2004-07
Global Output Moves To A Slower Growth Trajectory
80
90
100
110
120
130
140
150
09 10 11 12
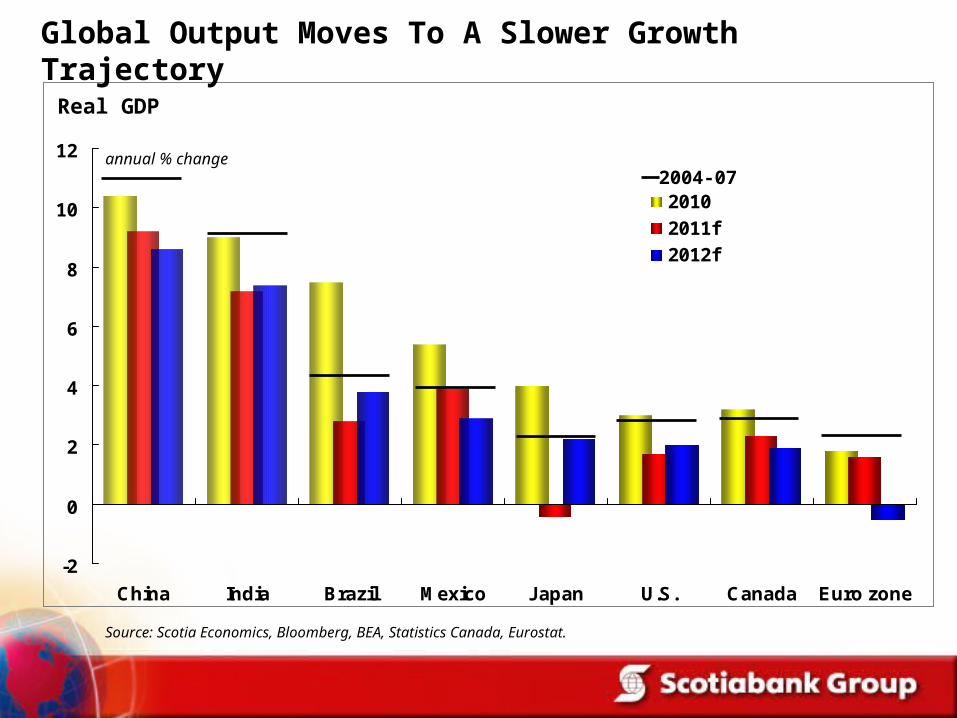
America’s Growth Engine & Competitive Realignment
Exports to High Growth Regions
Source: Bloomberg, NAR.
Uneven Sales Performance
Total Home Sales
90
100
110
120
130
140
150
160
170
180
190
200
09 10 11 12
index: January 2009 = 100
Source: Bloomberg.
Rest of World
South & Central America
Pacific Rim
index: January 2009 = 100
Auto Sales
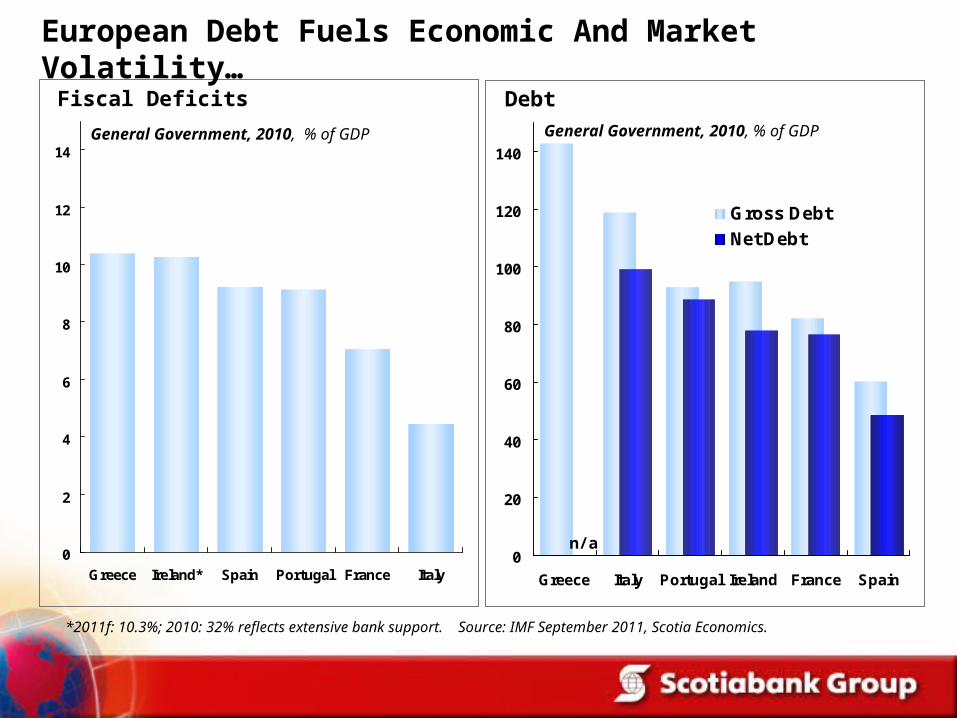
0
2
4
6
8
10
12
14
Greece Ireland* Spain Portugal France Italy
Fiscal Deficits
*2011f: 10.3%; 2010: 32% reflects extensive bank support. Source: IMF September 2011, Scotia Economics.
General Government, 2010, % of GDP
0
20
40
60
80
100
120
140
Greece Italy Portugal Ireland France Spain
Gross Debt
Net Debt
Debt
General Government, 2010, % of GDP
n/a
European Debt Fuels Economic And Market Volatility…
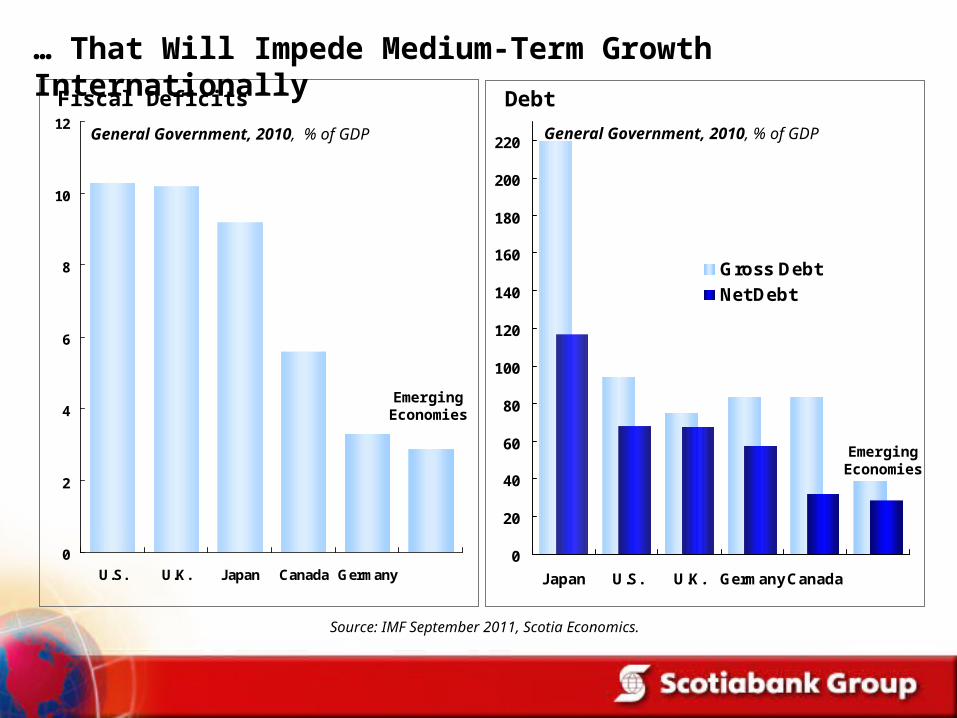
0
2
4
6
8
10
12
U.S. U.K. Japan Canada Germany
Fiscal Deficits
Source: IMF September 2011, Scotia Economics.
General Government, 2010, % of GDP
0
20
40
60
80
100
120
140
160
180
200
220
Japan U.S. U.K. GermanyCanada
Gross Debt
Net Debt
Debt
Emerging Economies
General Government, 2010, % of GDP
Emerging Economies
… That Will Impede Medium-Term Growth Internationally
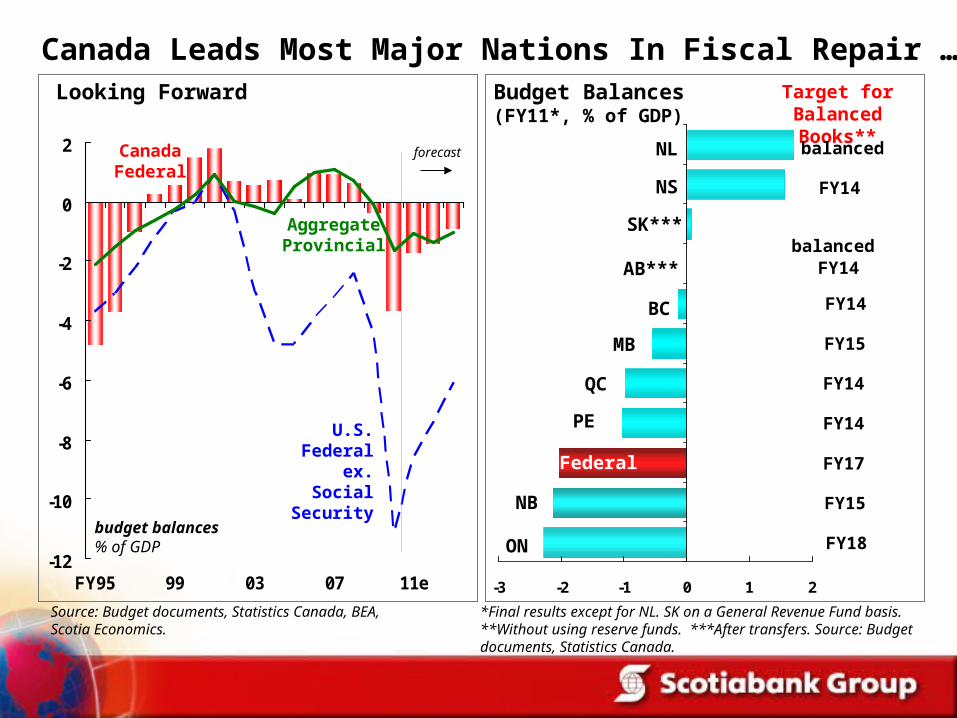
Budget Balances(FY11*, % of GDP)
-3 -2 -1 0 1 2
Federal
SK***
MB
NS
BC
QC
NB
ON
NL
PE
Target for Balanced Books**
FY14
balanced
FY15
balanced
FY14
FY14
FY14
FY15
FY14
FY17
FY18
AB***
-12
-10
-8
-6
-4
-2
0
2
FY95 99 03 07 11e
budget balances % of GDP
U.S. Federal ex. Social
Security
Looking Forward
Source: Budget documents, Statistics Canada, BEA, Scotia Economics.
forecast
Aggregate Provincial
Canada Federal
*Final results except for NL. SK on a General Revenue Fund basis. **Without using reserve funds. ***After transfers. Source: Budget documents, Statistics Canada.
Canada Leads Most Major Nations In Fiscal Repair …
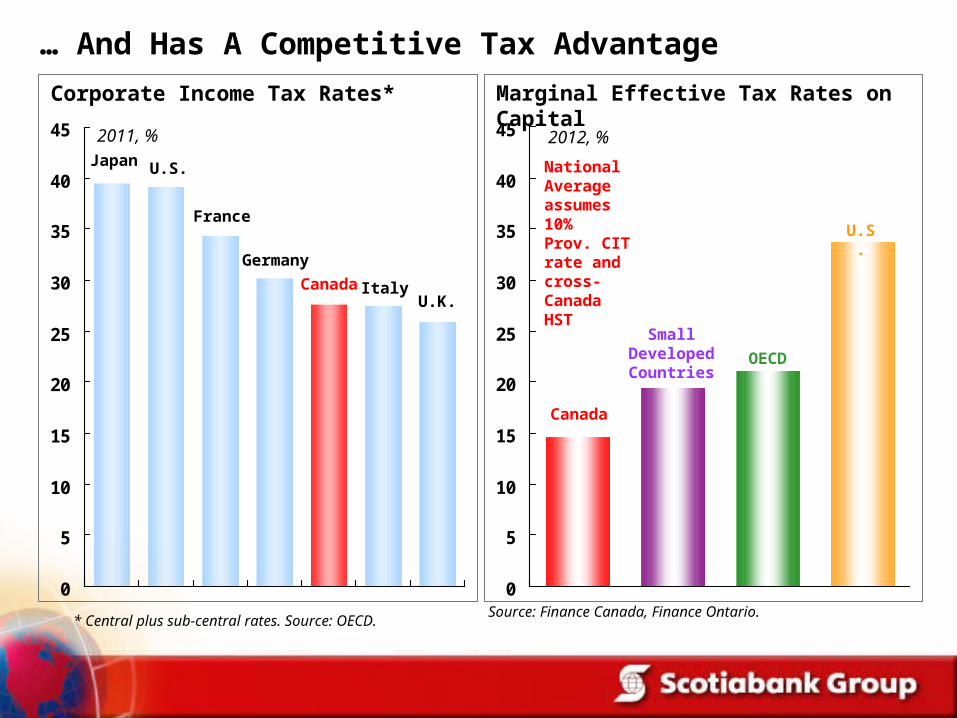
0
5
10
15
20
25
30
35
40
452012, %
National Average assumes 10% Prov. CIT rate and cross-Canada HST
Marginal Effective Tax Rates on Capital
Source: Finance Canada, Finance Ontario.
0
5
10
15
20
25
30
35
40
45
Corporate Income Tax Rates*
Japan
France
U.S.
Germany
Canada ItalyU.K.
* Central plus sub-central rates. Source: OECD.
2011, %
Canada
Small Developed Countries
OECD
U.S.
… And Has A Competitive Tax Advantage
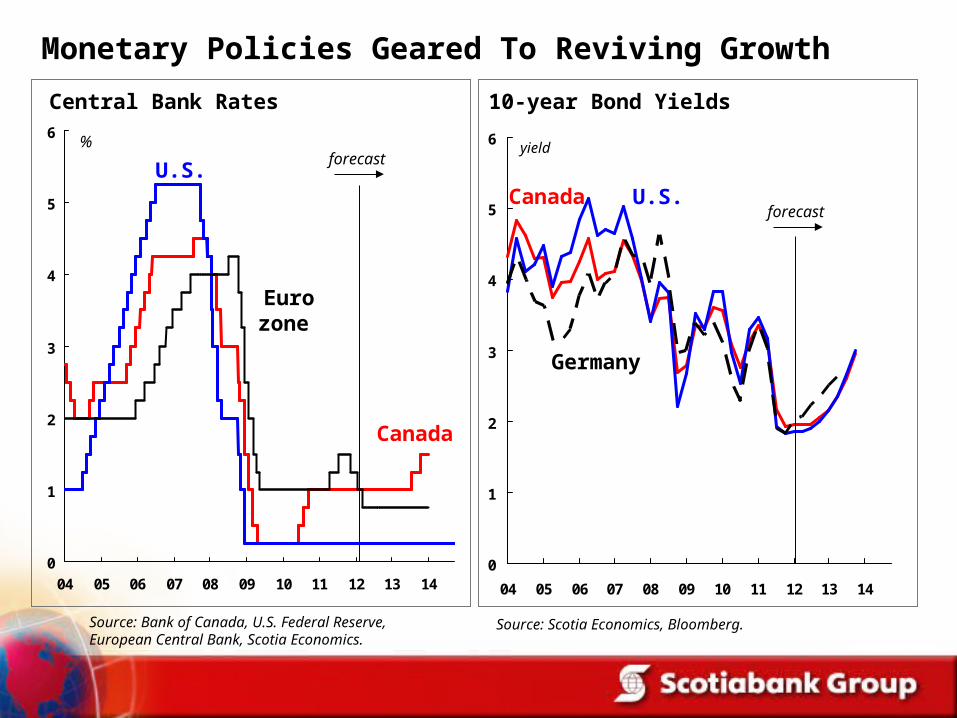
0
1
2
3
4
5
6
04 05 06 07 08 09 10 11 12 13 14
Source: Bank of Canada, U.S. Federal Reserve,European Central Bank, Scotia Economics.
Central Bank Rates
U.S.forecast
%
Canada
Euro zone
0
1
2
3
4
5
6
04 05 06 07 08 09 10 11 12 13 14
10-year Bond Yields
U.S.
yield
Source: Scotia Economics, Bloomberg.
Canadaforecast
Germany
Monetary Policies Geared To Reviving Growth
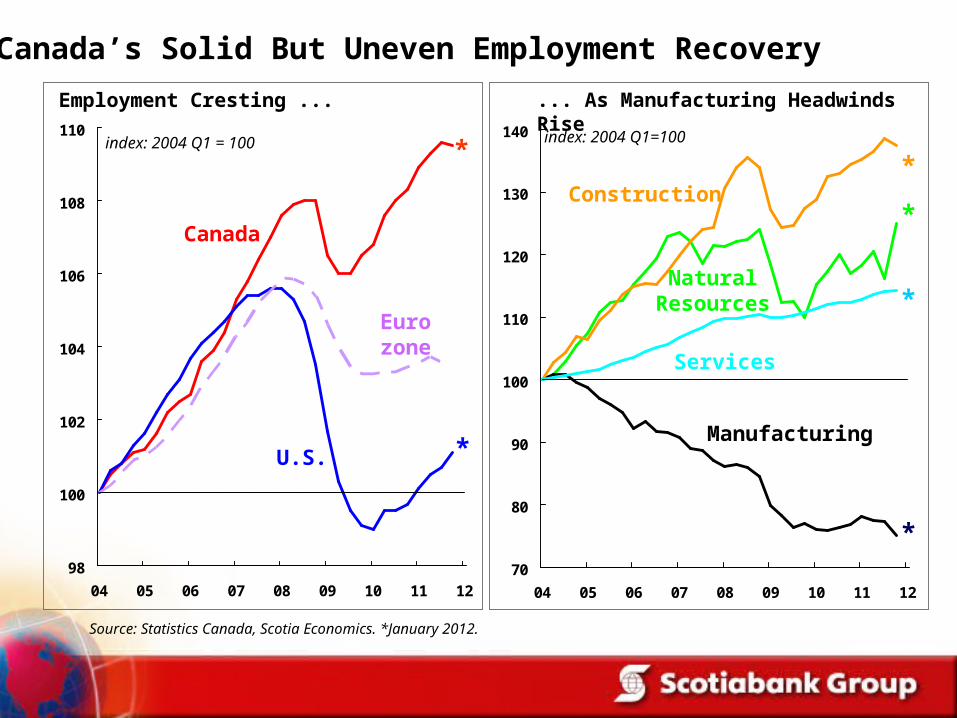
70
80
90
100
110
120
130
140
04 05 06 07 08 09 10 11 12
Source: Statistics Canada, Scotia Economics. *January 2012.
98
100
102
104
106
108
110
04 05 06 07 08 09 10 11 12
Euro zone
U.S.
Employment Cresting ...
index: 2004 Q1 = 100
... As Manufacturing Headwinds Rise
index: 2004 Q1=100
Construction
Manufacturing
Canada
Services
Natural Resources
*
*
*
*
*
*
Canada’s Solid But Uneven Employment Recovery
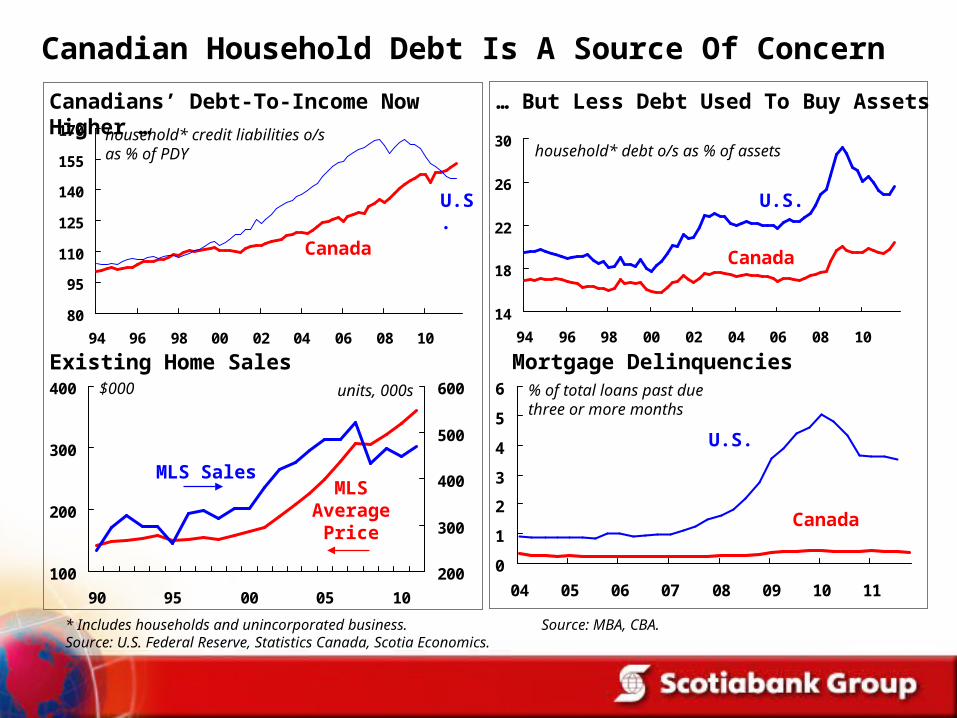
Canadian Household Debt Is A Source Of Concern
* Includes households and unincorporated business.Source: U.S. Federal Reserve, Statistics Canada, Scotia Economics.
80
95
110
125
140
155
170
94 96 98 00 02 04 06 08 10
Canada
U.S.
household* credit liabilities o/s as % of PDY
Canadians’ Debt-To-Income Now Higher …
14
18
22
26
30
94 96 98 00 02 04 06 08 10
Canada
U.S.
household* debt o/s as % of assets
… But Less Debt Used To Buy Assets
Existing Home Sales
100
200
300
400
90 95 00 05 10
200
300
400
500
600units, 000s
MLS Average
Price
MLS Sales
$000
0
1
2
3
4
5
6
04 05 06 07 08 09 10 11
Mortgage Delinquencies
Source: MBA, CBA.
U.S.
Canada
% of total loans past due three or more months
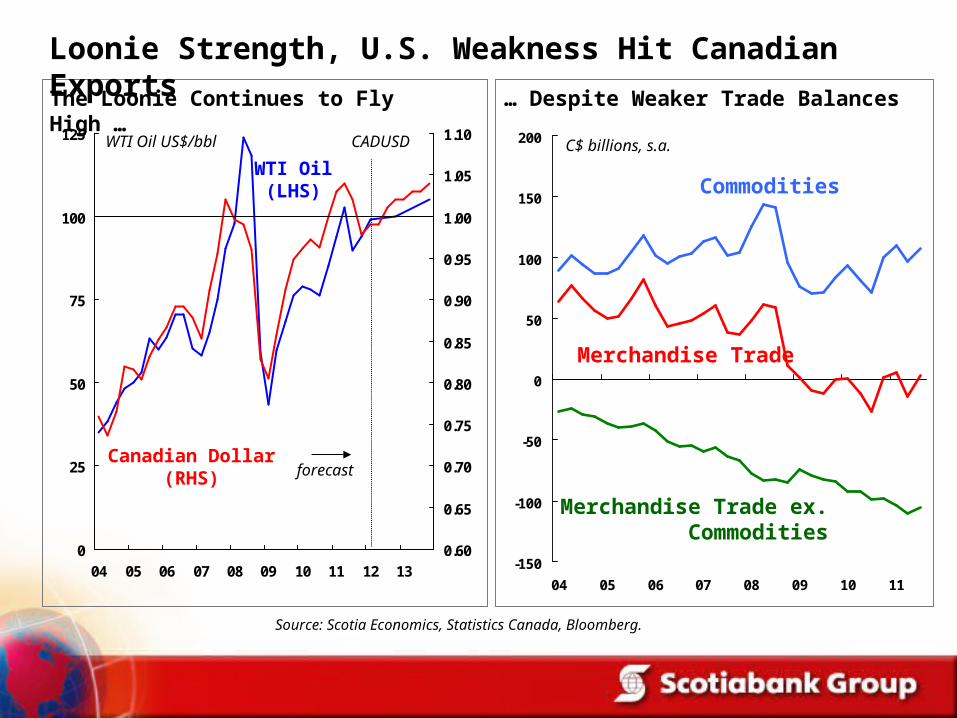
Source: Scotia Economics, Statistics Canada, Bloomberg.
0
25
50
75
100
125
04 05 06 07 08 09 10 11 12 13
0.60
0.65
0.70
0.75
0.80
0.85
0.90
0.95
1.00
1.05
1.10CADUSD
Canadian Dollar(RHS) forecast
The Loonie Continues to Fly High …
WTI Oil(LHS)
WTI Oil US$/bbl
-150
-100
-50
0
50
100
150
200
04 05 06 07 08 09 10 11
Commodities
… Despite Weaker Trade Balances
C$ billions, s.a.
Merchandise Trade ex. Commodities
Merchandise Trade
Loonie Strength, U.S. Weakness Hit Canadian Exports
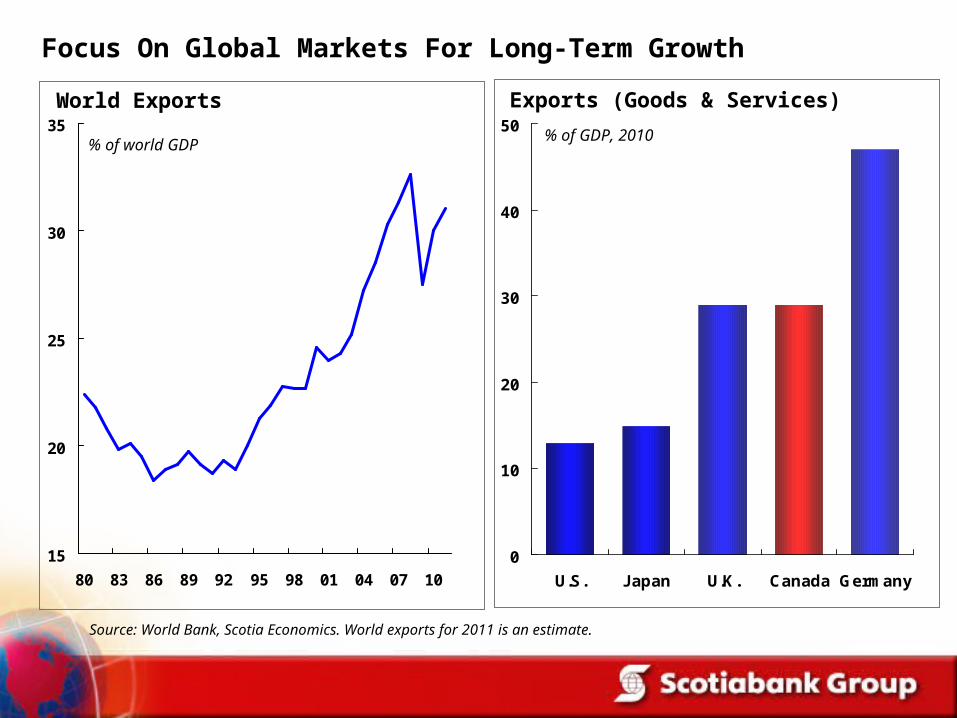
Focus On Global Markets For Long-Term Growth
0
10
20
30
40
50
U.S. Japan U.K. Canada Germany
Exports (Goods & Services)
% of GDP, 2010
Source: World Bank, Scotia Economics. World exports for 2011 is an estimate.
15
20
25
30
35
80 83 86 89 92 95 98 01 04 07 10
% of world GDP
World Exports
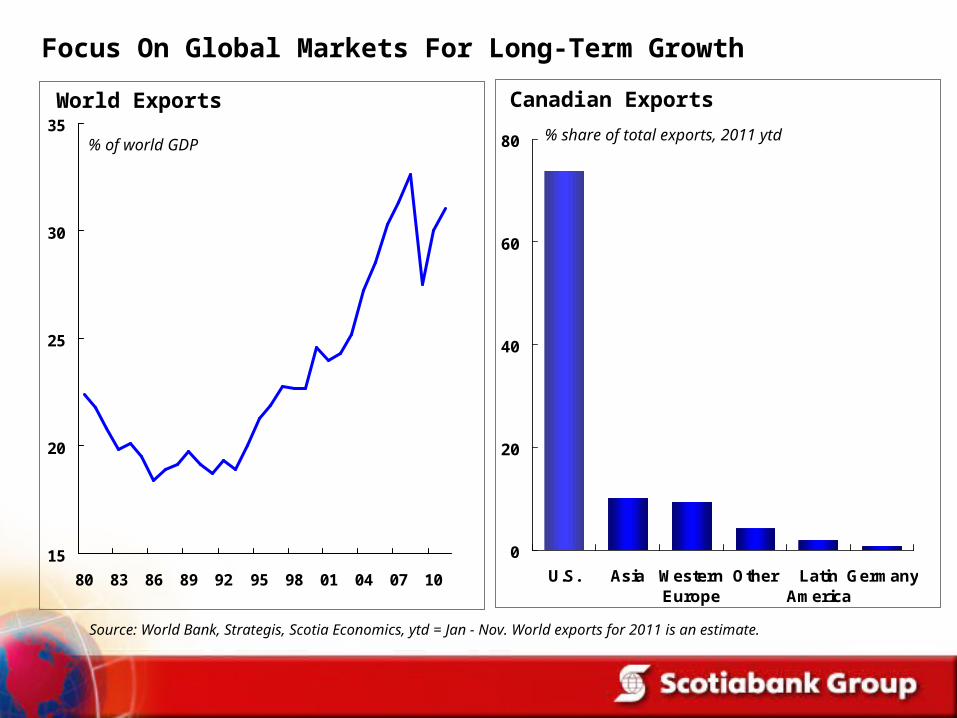
Focus On Global Markets For Long-Term Growth
Source: World Bank, Strategis, Scotia Economics, ytd = Jan - Nov. World exports for 2011 is an estimate.
0
20
40
60
80
U.S. Asia WesternEurope
Other LatinAmerica
Germany
Canadian Exports
% share of total exports, 2011 ytd
15
20
25
30
35
80 83 86 89 92 95 98 01 04 07 10
% of world GDP
World Exports
Africa
Japan
Europe
IndiaChina
Other America
U.S./Canada
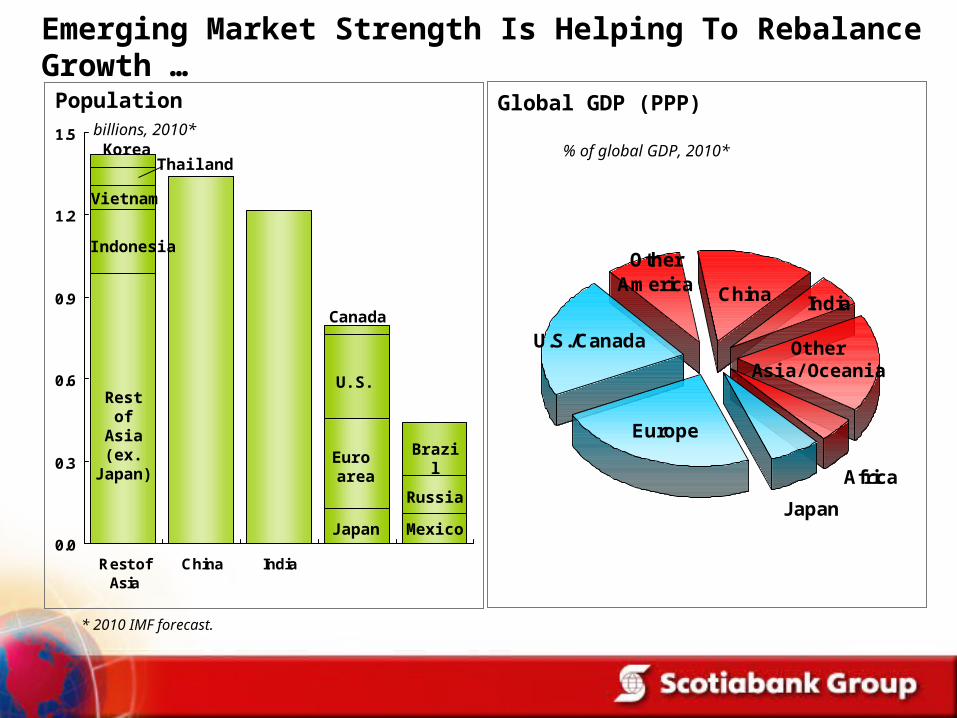
Emerging Market Strength Is Helping To Rebalance Growth …
0.0
0.3
0.6
0.9
1.2
1.5
Rest ofAsia
China India
Populationbillions, 2010*
* 2010 IMF forecast.
Euro area
Japan
Brazil
Mexico
Russia
U.S.Rest
of Asia(ex.
Japan)
Indonesia
Vietnam
KoreaThailand
Canada
% of global GDP, 2010*
Global GDP (PPP)
Other Asia/Oceania
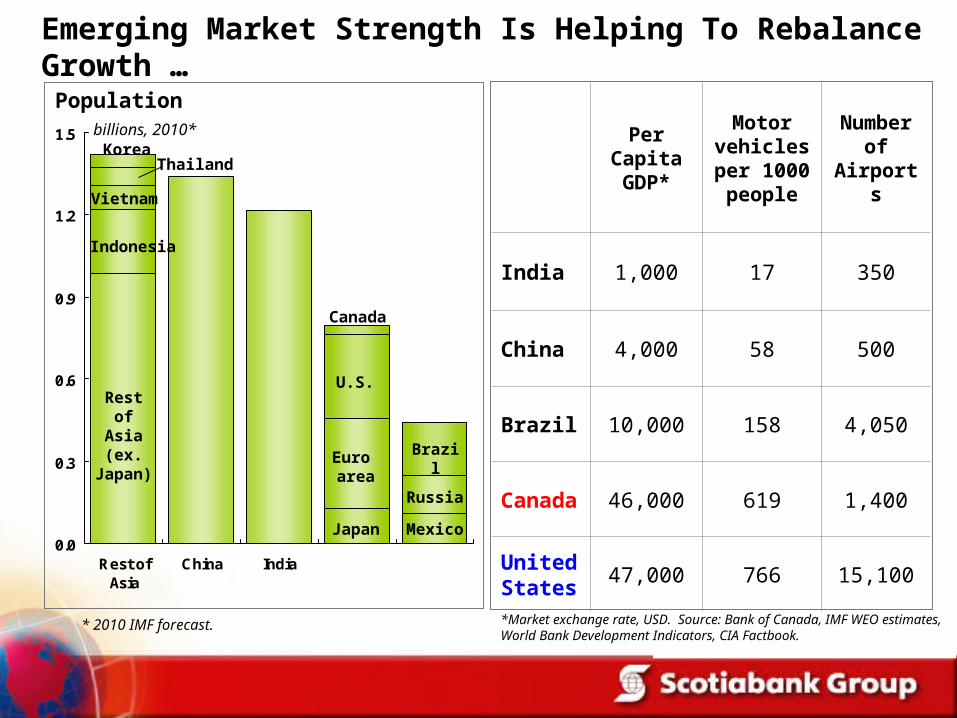
Emerging Market Strength Is Helping To Rebalance Growth …
0.0
0.3
0.6
0.9
1.2
1.5
Rest ofAsia
China India
Populationbillions, 2010*
* 2010 IMF forecast.
Euro area
Japan
Brazil
Mexico
Russia
U.S.Rest
of Asia(ex.
Japan)
Indonesia
Vietnam
KoreaThailand
Canada
*Market exchange rate, USD. Source: Bank of Canada, IMF WEO estimates, World Bank Development Indicators, CIA Factbook.
Per Capita GDP*
Motor vehicles per 1000 people
Number of
Airports
India 1,000 17 350
China 4,000 58 500
Brazil 10,000 158 4,050
Canada 46,000 619 1,400
United States
47,000 766 15,100
0
5
10
15
20
25
04 05 06 07 08 09 10 11 12
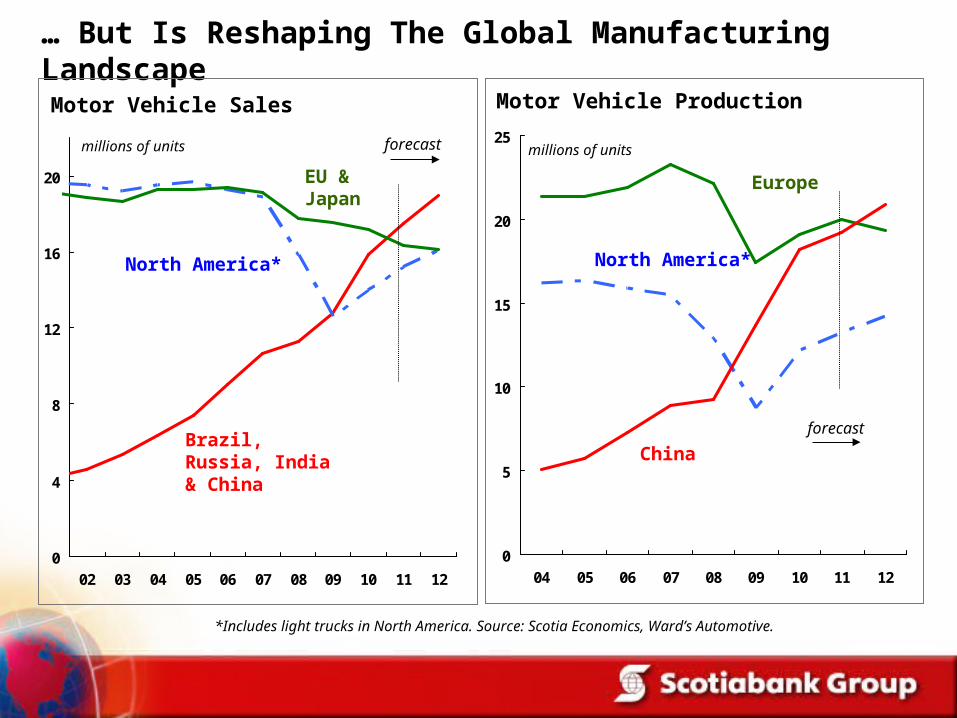
… But Is Reshaping The Global Manufacturing Landscape
Motor Vehicle Sales
0
4
8
12
16
20
02 03 04 05 06 07 08 09 10 11 12
millions of units
North America*
EU & Japan
*Includes light trucks in North America. Source: Scotia Economics, Ward’s Automotive.
Brazil, Russia, India & China
forecast millions of units
Motor Vehicle Production
North America*
Europe
China
forecast
Source: Scotia Economics, IMF, Bloomberg.
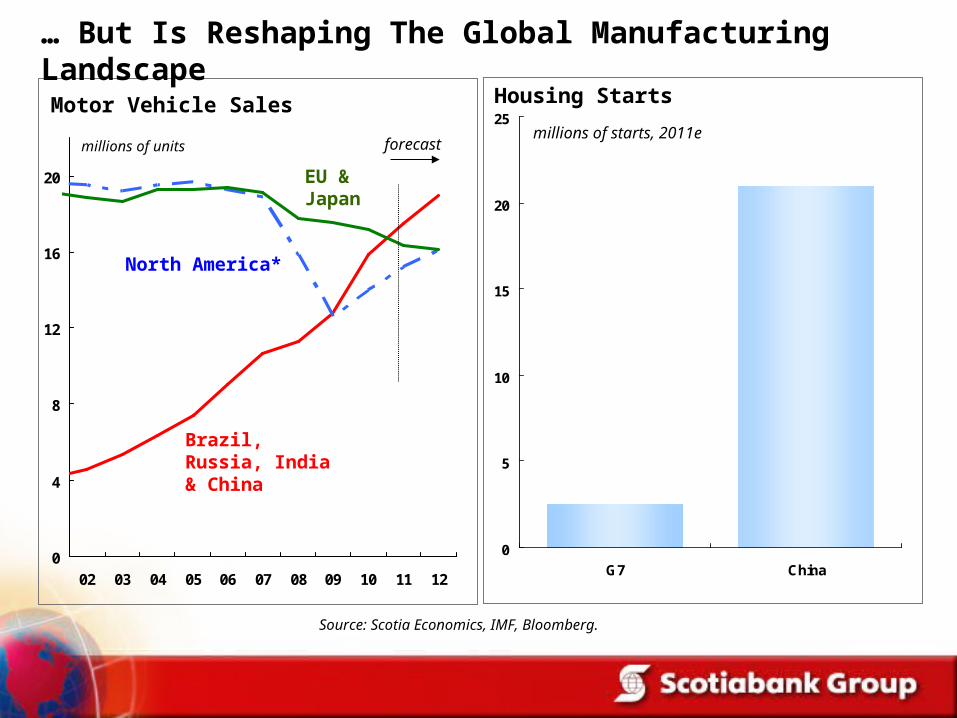
Housing Starts
0
5
10
15
20
25
G7 China
millions of starts, 2011e
Motor Vehicle Sales
0
4
8
12
16
20
02 03 04 05 06 07 08 09 10 11 12
millions of units
North America*
EU & Japan
Brazil, Russia, India & China
forecast
… But Is Reshaping The Global Manufacturing Landscape
*Includes light trucks in North America. Source: Scotia Economics, Ward’s Automotive.
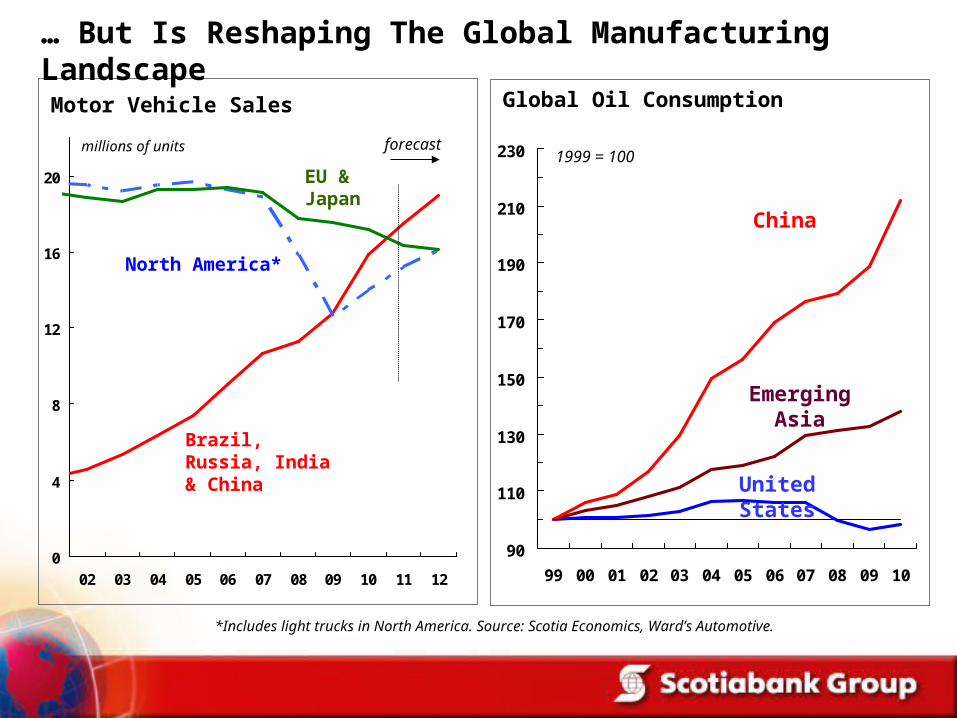
Motor Vehicle Sales
0
4
8
12
16
20
02 03 04 05 06 07 08 09 10 11 12
millions of units
North America*
EU & Japan
Brazil, Russia, India & China
forecast
90
110
130
150
170
190
210
230
99 00 01 02 03 04 05 06 07 08 09 10
1999 = 100
Emerging Asia
China
United States
Global Oil Consumption
… But Is Reshaping The Global Manufacturing Landscape
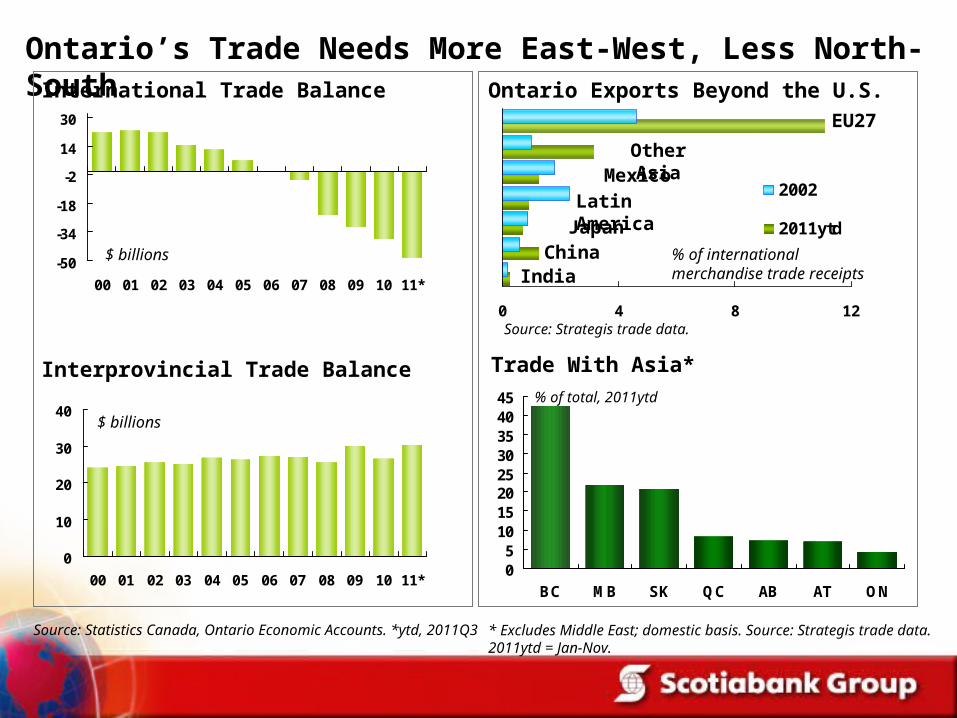
Ontario’s Trade Needs More East-West, Less North-South
-50
-34
-18
-2
14
30
00 01 02 03 04 05 06 07 08 09 10 11*
International Trade Balance
$ billions
Source: Statistics Canada, Ontario Economic Accounts. *ytd, 2011Q3
0
10
20
30
40
00 01 02 03 04 05 06 07 08 09 10 11*
Interprovincial Trade Balance
$ billions
0 4 8 12
2002
2011ytd
Ontario Exports Beyond the U.S.
% of international merchandise trade receipts
EU27
Latin AmericaJapan
ChinaIndia
Other AsiaMexico
Source: Strategis trade data.
05
1015202530354045
BC MB SK QC AB AT ON
Trade With Asia*
% of total, 2011ytd
* Excludes Middle East; domestic basis. Source: Strategis trade data. 2011ytd = Jan-Nov.
-2 0 2 4 6
Germany
Canada
U.S.
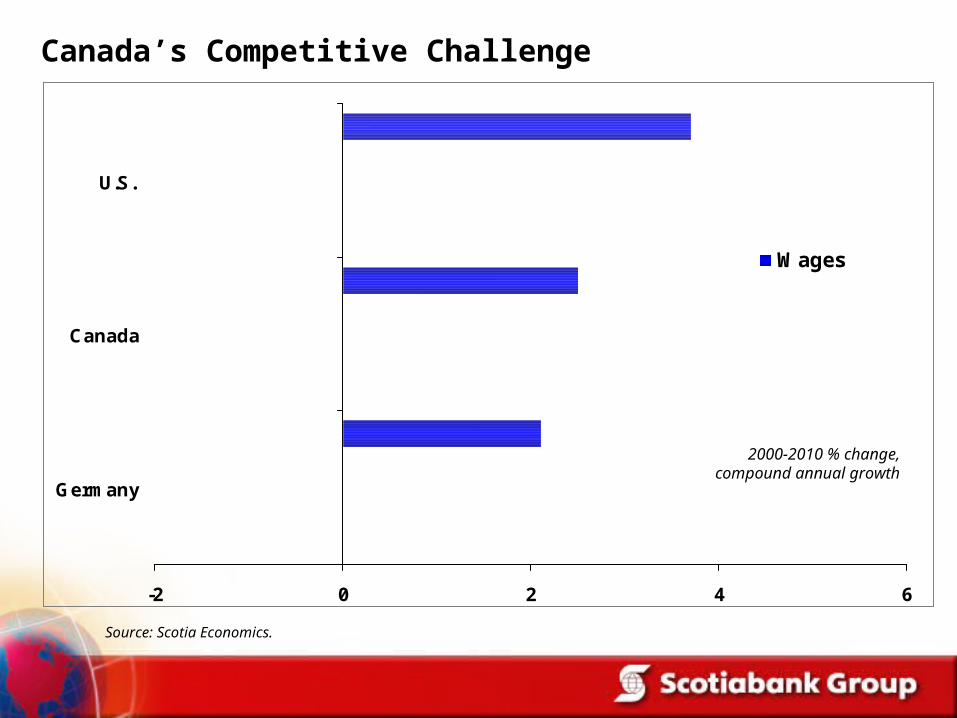
Wages
2000-2010 % change, compound annual growth
Source: Scotia Economics.
Canada’s Competitive Challenge
-2 0 2 4 6
Germany
Canada
U.S.
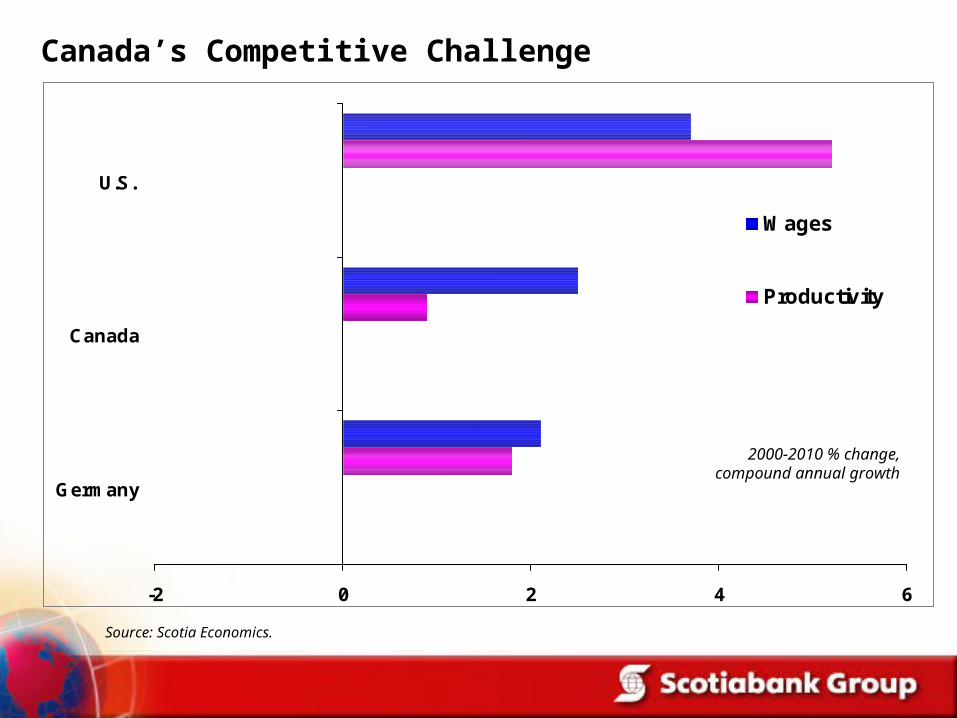
Wages
Productivity
2000-2010 % change, compound annual growth
Source: Scotia Economics.
Canada’s Competitive Challenge
-2 0 2 4 6
Germany
Canada
U.S.
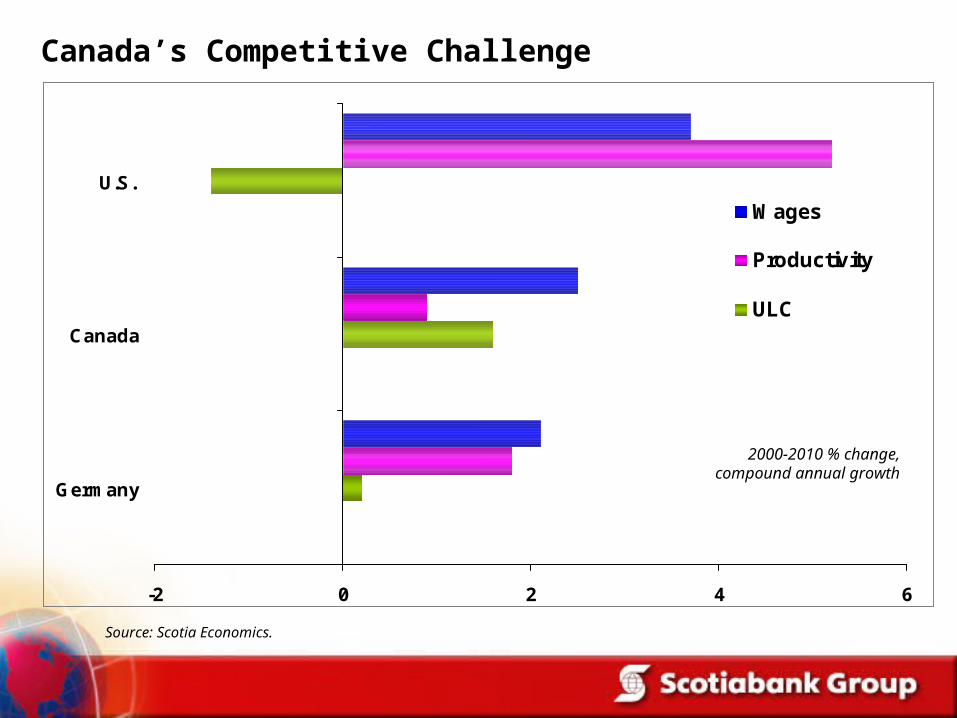
Wages
Productivity
ULC
2000-2010 % change, compound annual growth
Source: Scotia Economics.
Canada’s Competitive Challenge
-2 0 2 4 6
Germany
Canada
U.S.
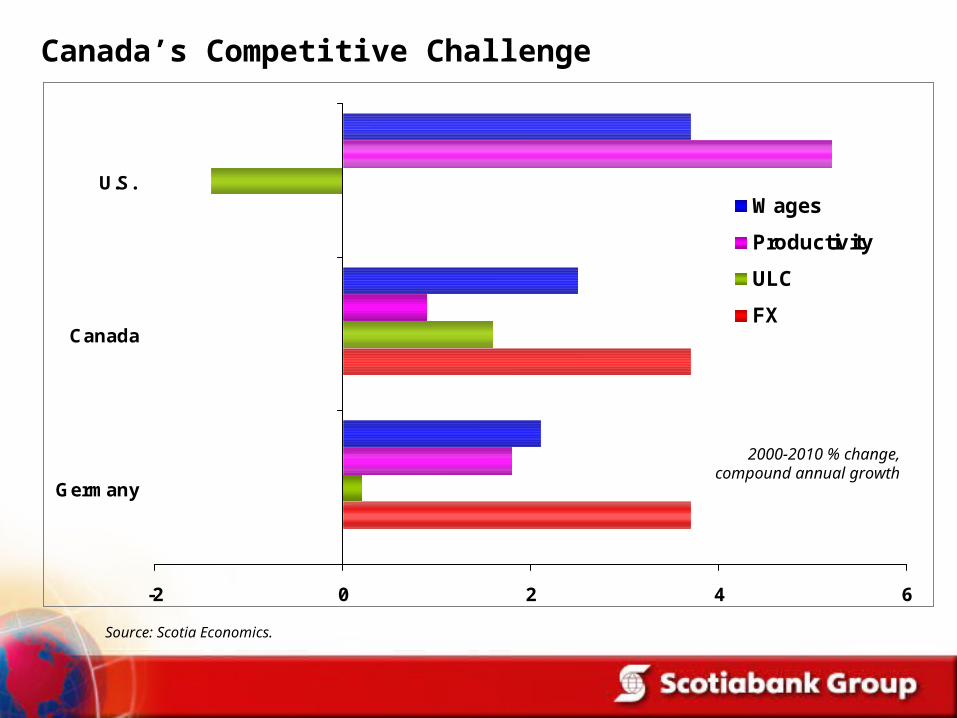
Wages
Productivity
ULC
FX
2000-2010 % change, compound annual growth
Source: Scotia Economics.
Canada’s Competitive Challenge
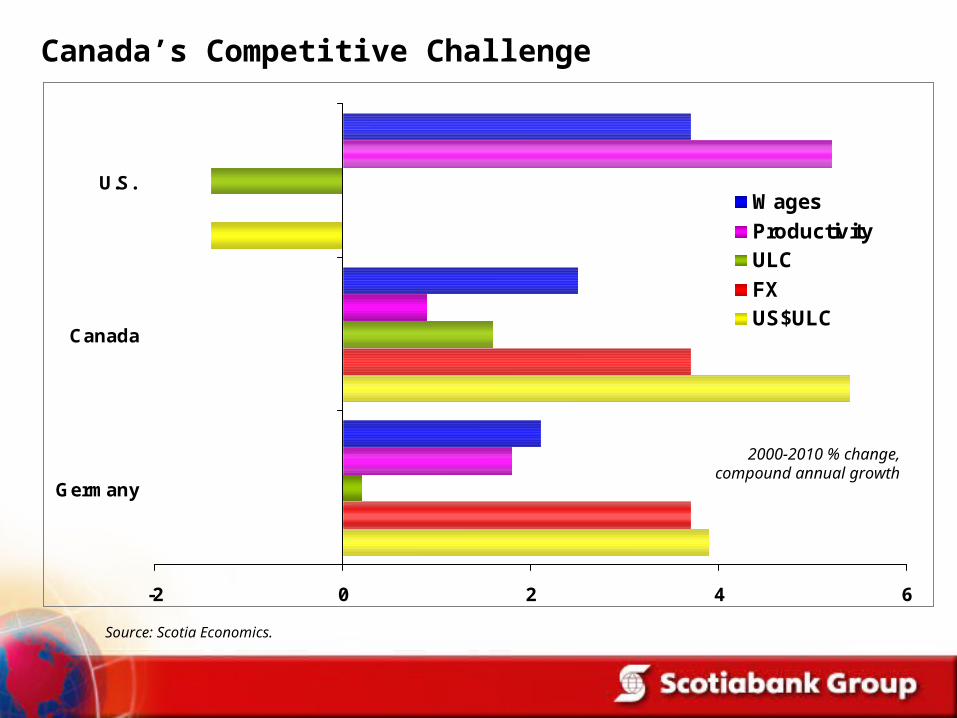
-2 0 2 4 6
Germany
Canada
U.S. Wages
ProductivityULC
FXUS$ULC
2000-2010 % change, compound annual growth
Source: Scotia Economics.
Canada’s Competitive Challenge
8
10
12
14
16
18
20
00 02 04 06 08 10
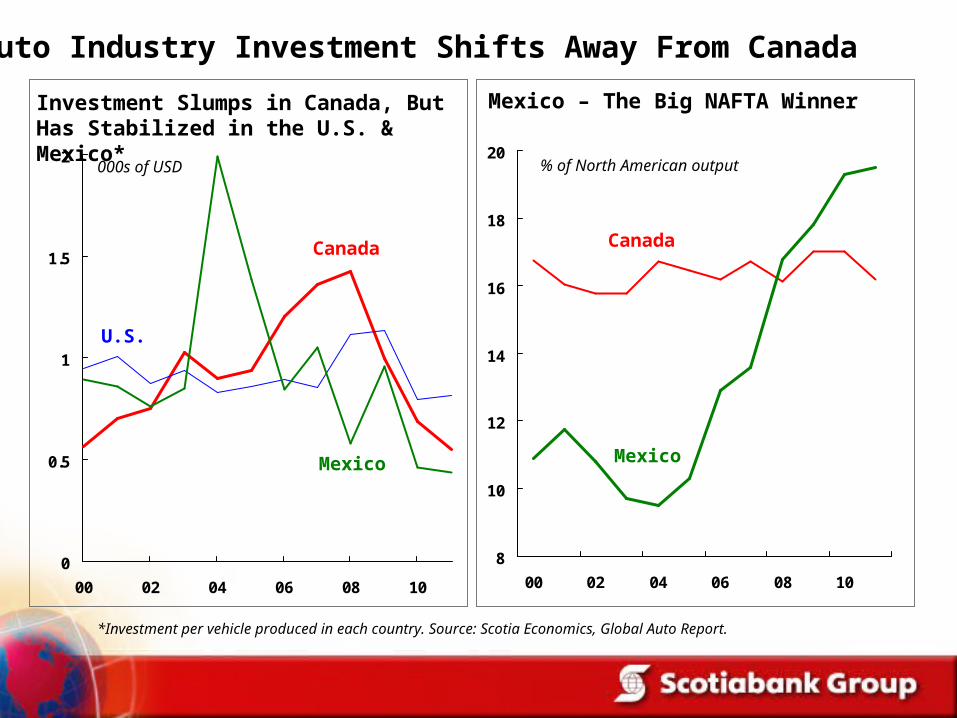
Auto Industry Investment Shifts Away From Canada
Investment Slumps in Canada, But Has Stabilized in the U.S. & Mexico*
Mexico – The Big NAFTA Winner
% of North American output
0
0.5
1
1.5
2
00 02 04 06 08 10
U.S.
Canada
000s of USD
*Investment per vehicle produced in each country. Source: Scotia Economics, Global Auto Report.
Mexico
Canada
Mexico
Source: Statistics Canada, Scotia Economics.
100
110
120
130
140
150
160
170
180
04 05 06 07 08 09 10 11e 12f 13f
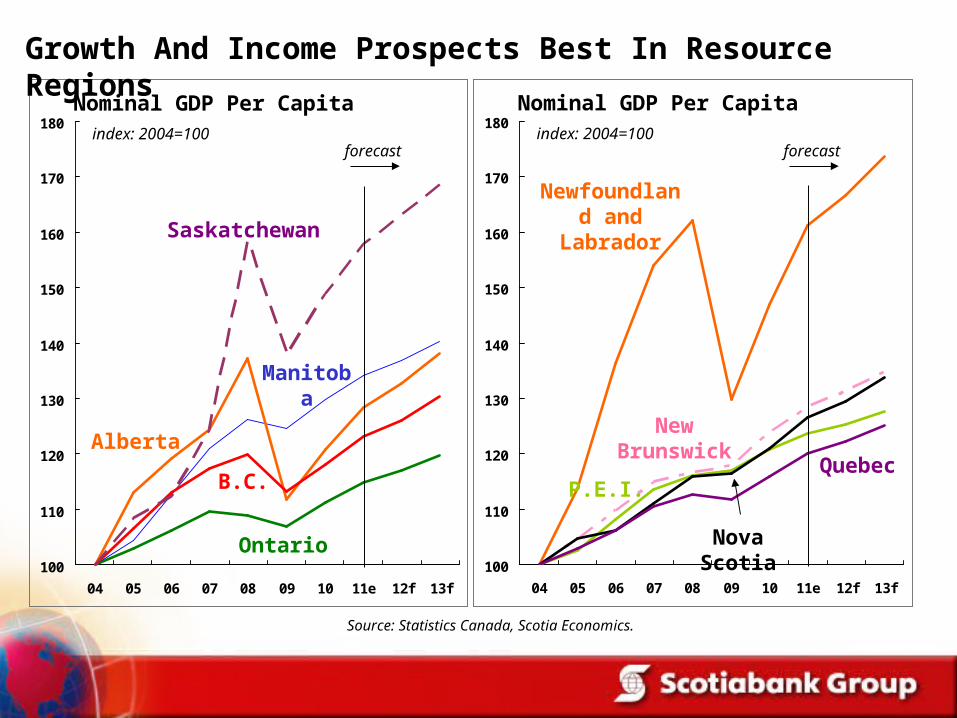
Nominal GDP Per Capitaindex: 2004=100
100
110
120
130
140
150
160
170
180
04 05 06 07 08 09 10 11e 12f 13f
Nominal GDP Per Capitaindex: 2004=100
Ontario
B.C.
AlbertaQuebec
Saskatchewan
P.E.I.
New Brunswick
Nova Scotia
Newfoundland and Labrador
forecast forecast
Manitoba
Growth And Income Prospects Best In Resource Regions
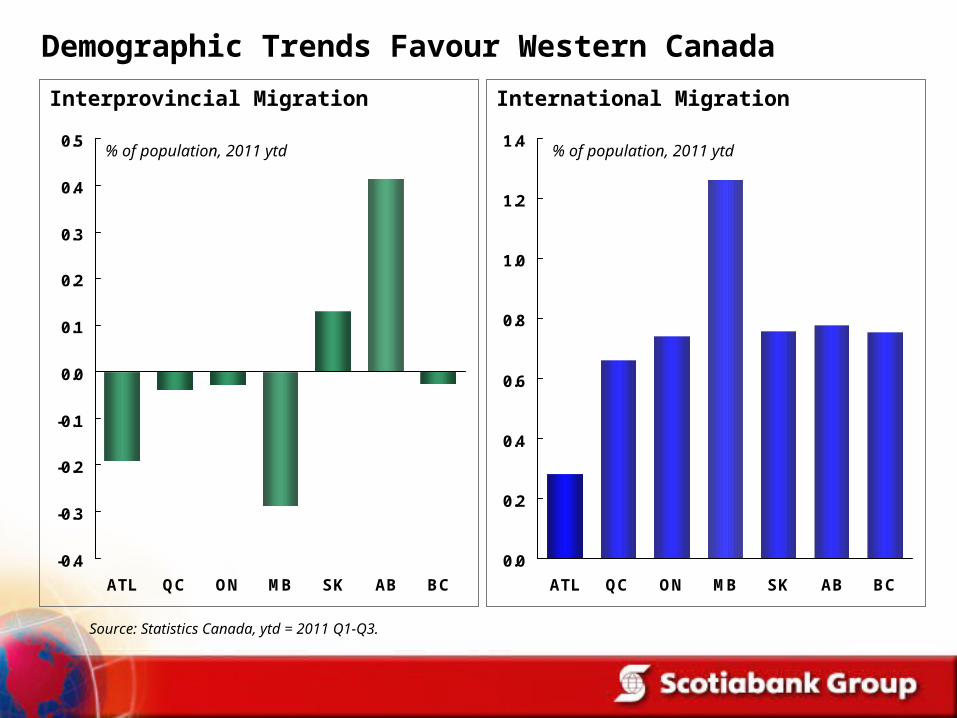
Demographic Trends Favour Western Canada
Interprovincial Migration
-0.4
-0.3
-0.2
-0.1
0.0
0.1
0.2
0.3
0.4
0.5
ATL QC ON MB SK AB BC
% of population, 2011 ytd
International Migration
0.0
0.2
0.4
0.6
0.8
1.0
1.2
1.4
ATL QC ON MB SK AB BC
Source: Statistics Canada, ytd = 2011 Q1-Q3.
% of population, 2011 ytd
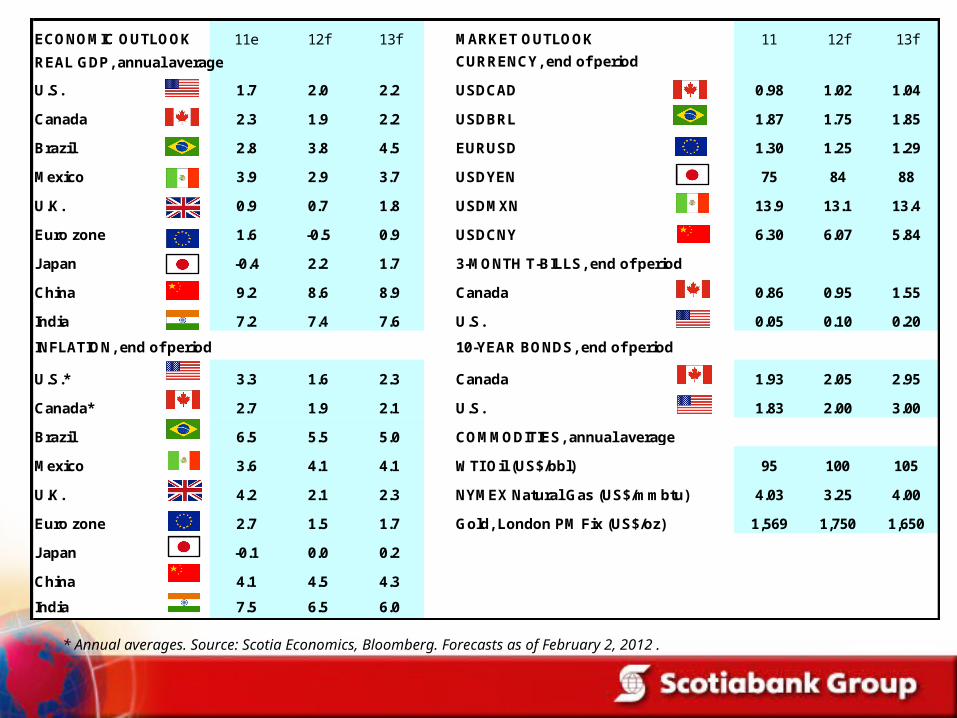
* Annual averages. Source: Scotia Economics, Bloomberg. Forecasts as of February 2, 2012 .
ECONOMIC OUTLOOK 11e 12f 13f MARKET OUTLOOK 11 12f 13f
REAL GDP, annual average CURRENCY, end of period
U.S. 1.7 2.0 2.2 USDCAD 0.98 1.02 1.04
Canada 2.3 1.9 2.2 USDBRL 1.87 1.75 1.85
Brazil 2.8 3.8 4.5 EURUSD 1.30 1.25 1.29
Mexico 3.9 2.9 3.7 USDYEN 75 84 88
U.K. 0.9 0.7 1.8 USDMXN 13.9 13.1 13.4
Euro zone 1.6 -0.5 0.9 USDCNY 6.30 6.07 5.84
Japan -0.4 2.2 1.7 3-MONTH T-BILLS, end of period
China 9.2 8.6 8.9 Canada 0.86 0.95 1.55
India 7.2 7.4 7.6 U.S. 0.05 0.10 0.20
INFLATION, end of period 10-YEAR BONDS, end of period
U.S.* 3.3 1.6 2.3 Canada 1.93 2.05 2.95
Canada* 2.7 1.9 2.1 U.S. 1.83 2.00 3.00
Brazil 6.5 5.5 5.0 COMMODITIES, annual average
Mexico 3.6 4.1 4.1 WTI Oil (US$/bbl) 95 100 105
U.K. 4.2 2.1 2.3 NYMEX Natural Gas (US$/mmbtu) 4.03 3.25 4.00
Euro zone 2.7 1.5 1.7 Gold, London PM Fix (US$/oz) 1,569 1,750 1,650
Japan -0.1 0.0 0.2
China 4.1 4.5 4.3
India 7.5 6.5 6.0

Disclaimer
This report has been prepared by Scotia Economics as a resource for the clients of Scotiabank. Opinions, estimates and projections contained herein are our own as of the date hereof and are subject to change without notice. The information and opinions contained herein have been compiled or arrived at from sources believed reliable but no representation or warranty, express or implied, is made as to their accuracy or completeness. Neither Scotiabank Group nor its affiliates accepts any liability whatsoever for any loss arising from any use of this report or its contents.

Aron Gampel Vice-President & Deputy Chief Economist
Navigating Through Volatile Times
Toronto, Ontario
February 14, 2012