Embed Size (px)
Citation preview

ARMED VIOLENCE AND STABILISATION IN WESTERN EQUATORIA
RECOVERING FROM THE LORD’S RESISTANCE ARMY

ACRONYMS AND DEFINITIONS
AK Kalashnikov assault rifle
Boma Administrative area, one level down from Payam
County Administrative area, one level down from State
DDG Danish Demining Group
DRC Danish Refugee Council
LRA Lord’s Resistance Army
Payam Administrative area, one level down from County
SPLA Sudan People’s Liberation Army (national army of South Sudan)
SPLM Sudan People’s Liberation Movement
SSPS South Sudan Police Service
UNMIS United Nations Mission in Sudan
UNMISS United Nations Mission in South Sudan
UPDF Ugandan People’s Defence Force (national army of Uganda)

CONTENTS
EXECUTIVE SUMMARY ........................................................................................................................... 1
Key Findings ................................................................................................................................... 2
Conclusions .................................................................................................................................... 4
1. BACKGROUND ................................................................................................................................... 5
1.1 Western Equatoria State ................................................................................................................. 5
1.2 Insecurity and the Lord's Resistance Army ..................................................................................... 6
1.2.1 LRA in South Sudan .............................................................................................................. 6
1.2.2 LRA in Western Equatoria ...................................................................................................... 6
1.3 Rationale for the Study ............................................................................................................. 8
1.4 Objectives of the Study ............................................................................................................. 9
2. TARGET GROUPS AND SAMPLING .................................................................................................. 10
2.1 Geographic Area .......................................................................................................................... 10
2.2 Sampling Methodology ................................................................................................................ 11
2.3 Socio-Demographic Breakdown of Respondents ......................................................................... 12
3. RESEARCH METHODOLOGY ........................................................................................................... 14
3.1 Research Team ............................................................................................................................ 14
3.1.1 Staff ..................................................................................................................................... 14
3.1.2 Training ............................................................................................................................... 14
3.1.3 Research Tools .................................................................................................................... 15
3.1.1 Questionnaire ...................................................................................................................... 15
3.1.2 Focus Group Discussions .................................................................................................... 15
3.1.3 Key Informant Interviews ...................................................................................................... 16
3.2 Community Entry and Consent ................................................................................................... 16
4. RESULTS AND CONCLUSIONS ....................................................................................................... 17
4.1 Previous Exposure to LRA Violence ............................................................................................ 17
4.1.1 Conclusions ......................................................................................................................... 18
4.2 Current Perceptions of Safety and Security .................................................................................. 20
4.2.1 Conclusions ......................................................................................................................... 20
4.3 Crime and Disputes ..................................................................................................................... 22
4.3.1 Conclusions ........................................................................................................................ 23
4.4 Security Providers ........................................................................................................................ 26
4.4.1 Conclusions ........................................................................................................................ 26
5. CONCLUSIONS AND RECOMMENDATIONS .................................................................................... 31
5.1 Recovery ...................................................................................................................................... 31
5.2 Community Security and Providers ............................................................................................... 32

1
EXECUTIVE SUMMARY
Between 2007 and 2011, attacks by Lord’s Resistance Army (LRA) displaced between 70,0001 and
100,0002 civilians in Western Equatoria state. In addition to hundreds of violent killings, mutilations and
abductions, roving LRA units closed access to farmland, clean water supplies, schools and health
services, resulting in a significant increase in vulnerability and deprivation across the state. Despite the
presence of thousands of South Sudan Army (SPLA), Ugandan Army (UPDF) and United Nations (UNMIS)
troops during this period, it was not until 2011 that a civilian armed group, the ‘Arrow Boys’ or ‘Home
Guards’, succeeded in pushing the LRA back into D.R. Congo. As of December, 2012, there have been
no confirmed LRA sightings or attacks in Western Equatoria since June, 2011.
While regional LRA violence continues to receive a significant degree of international media and military
attention, a parallel effort to support victims of this violence has not materialised in Western Equatoria.
International assistance, particularly in the remote D.R. Congo border region, is restricted to a handful of
NGOs clustered around major towns, leaving interior forest areas, which account for the majority of
settlements in this region, unassisted. Internally displaced civilians seeking to return to their homes
typically do so without support, protection or livelihood inputs. While the South Sudan government has
established a child protection unit to support the reintegration of returning abductees, it lacks the
capacity to provide more wide-ranging support.
This survey sought to address the similarly sparse research interest around LRA-affected communities in
Western Equatoria and provide a foundation for more targeted future assistance. As a conflict reduction
and peacebuilding organisation, DDG focused primarily on the direct effects of violence and enduring
conflict-risks. The survey was carried out in the four most severely affected counties of Western Equatoria
(Yambio, Nzara, Ezo and Tambura)3, conducting detailed questionnaire interviews with approximately
1,450 households. Data was triangulated through two other research tools: focus group discussions and
key informant interviews. These three tools allowed for a rigorous assessment of findings, with data as
representative as possible of the experiences, attitudes and beliefs of the sample population.
1 World Food Programme, Western Equatoria State Humanitarian Assessment, May, 2011
2 South Sudan Relief and Rehabilitation Commission, 2011 (via UN Office for the Coordination of Humanitarian Affairs, Western
Equatoria State) 3 Based on discussions with representatives from: Ministry of Social Welfare, Ministry of Local Government, UNMISS Department
for Safety and Security, South Sudan Relief and Rehabilitation Commission and local communities.

2
Key Findings
The findings of the survey indicate a continuing and severe legacy of LRA violence and an urgent need for
support in the form of security and mediation services, conflict management education, psycho-social
counselling and humanitarian/developmental aid:
Previous Exposure to LRA Violence
• 71% directly affected by LRA attacks (e.g. direct violence, displacement, theft);
• 39% displaced within the previous five years;
• 17% report killing of household member by LRA, 10% report abduction.
Current Perceptions of Safety and Security
• 62% believe their settlement is unsafe or very unsafe;
• 56% are worried or very worried about the LRA;
• 60% are worried about other forms of violence against their household.
Crime and Disputes
• 29% report either they or a household member have been victim of a crime within the previous 12
months;
• Of those reporting a crime, 25% indicated that a member of their household had been killed
within the previous 12 months;
• Other violent crime was also high – 24% assaults, 13% domestic violence, 12% forced theft.
Security Providers
• 90% report some degree of security provision in their settlement, with most identifying traditional
or religious leaders as security providers;
• 60% would report a crime to a traditional leader but not the police;
• 99% would seek conflict resolution from religious leaders ahead of the police;
• Arrow Boys / Home Guards are perceived as being the only protective security provider outside
major towns.
Civilian Weapons Ownership
• 30% of civilian households report ownership of a firearm;
• 70% firearm-owning households hold a home-made shotgun or ‘fabrication’;
• 92% of firearm-owning households do so for personal protection;
• 10% of violent crimes or disputes involved the use of a firearm.
Humanitarian Assistance
• 60% report receiving no external assistance within the previous 12 months;
• 98% report running out of important items every year, especially food;

3
Data analysis demonstrated that these figures, while already high, rose significantly in smaller and more
remote settlements. Displacement as a result of LRA attacks, for example, was 40% higher among
villages of less than 100 households, while focus groups revealed a common, though almost certainly
inaccurate, belief that LRA fighters were conducting offensive operations nearby. Reports of killings as a
result of LRA attacks were almost 400% higher in remote locations, primarily in Ezo and Tambura
counties, than urban centres. Although questionnaire responses did not indicate a significant variation in
perceptions of safety between different rural and urban locations, levels of fear, paranoia and stress were
clearly higher during visits to remote communities, with several locations experiencing food insecurity due
to the perceived lack of personal safety when working on agricultural land.
Small settlement size and remote location had a similar negative effect on attitudes to security providers,
with smaller villages less likely to report the presence of police or a willingness to engage with them.
Traditional authorities and Arrow Boys / Home Guards were seen as the primary or, in many cases, only
defence against internal and external violence, with many focus group participants indicating strong
feelings of abandonment and betrayal by the state. While the presence of SPLA, UPDF and UN military
units was recognised, these were typically seen as irrelevant to civilian protection, particularly outside
larger towns.
Unlike other conflict areas in South Sudan, civilian ownership of manufactured weapons was relatively
low4, with only 8% of households reporting the presence of an AK-type assault rifle on their property. Far
more common were fabrications, home-made shotguns, with 21.6% reporting ownership. Again, smaller
and more remote communities were more likely to own weapons, with focus group discussions indicating
this was primarily due to greater perceived risk and absence of formal security providers.
A final significant trend related to the time households had been resident within the survey location.
Feelings of insecurity, exposure to previous LRA violence and experience of crime were significantly
higher among IDP populations, many of whom felt threatened, isolated and marginalised by their host
communities. Findings from the survey indicated widespread distrust and hostility towards IDP
populations, who were widely perceived as a drain on land and other shared resources. Destruction of
property and aggressive threats were common, with both host community and IDP participants
expressing frustration with the slow pace of return and lack of security provision in remote areas.
4 O’Brien, A. Shots in the Dark: The 2008 Civilian Disarmament Campaign, Small Arms Survey, Geneva, 2009

4
Conclusions
The findings of this survey indicate that, while the direct threat of LRA attacks has reduced significantly
since 2011, recovery in Western Equatoria has been highly uneven. Urban centres, such as Yambio and
Tambura, are now benefiting from the improved security environment, experiencing rapid economic
growth and an increased commercialisation of both agriculture and forestry. State-wide food production
has increased and inter-communal violence is significantly less common than other states of South
Sudan.
However, such rapid progress has been almost entirely absent from the communities most severely
affected by the LRA crisis. Over 49,000 IDPs and 12,000 refugees remain dispersed across the border
region, unwilling to return to their locations of origin and often unable to establish new livelihoods or
homes in their host communities. Residents of small or remote settlements, which comprise a large
majority of the state population, face similar levels of marginalisation, vulnerability and deprivation.
Without a significant increase in external support, particularly in relation to sustainable development,
community-level safety and security, it is highly likely that this situation will stagnate. Western Equatoria is
now recovering at the state level, but the continued lack of support to LRA-affected communities and
households represents a key destabilising factor in future recovery and development. Given that the
largest and most effective military force in the state, the Arrow Boys, is also heavily affiliated with these
vulnerable communities, there is a risk of future insecurity and conflict unless visible steps are taken to
promote early recovery.
Community-driven development activities must form the central component of any expanded support to
Western Equatoria state. Survey respondents, even in the most deprived areas, frequently indicated their
desire to move towards economic self-sufficiency and were frustrated by the continued prioritisation of
food and health product distributions by aid agencies. Improving food security and community safety
across the state provide a strong foundation on which to move from pure humanitarian assistance to a
sustainable livelihoods model. Support to primary healthcare is a particular priority, with the appalling
health indicators across the state largely due to a lack of adequate medical provision.
Within the context of South Sudan, which has experienced a significant increase in acute crises
throughout 2012, it is understandable that both national government and international organisations have
paid less attention to relatively stable regions, such as Western Equatoria. However, looking beyond the
severity of deprivation in LRA-affected areas, Western Equatoria also represents one of the very few
regions of South Sudan with potential for sustained economic development. The region has the land,
labour and skills-base to produce a significant proportion of South Sudan’s food requirements. Its natural
and mineral resources represent an enormous and, as yet, untapped source of foreign investment, with
easy access to Juba and cross-border markets. Without a renewed and sustained drive to exploit these
potential economic advantages, there is a high risk that this rare opportunity for sustainable, self-sufficient
development will be lost.

5
1. BACKGROUND
1.1 Western Equatoria State
Fig.1: Western Equatoria and the states of South Sudan
Despite extremely fertile land and access to markets in Juba, D.R. Congo and the Central African
Republic, Western Equatoria State (WES) continues to experience some of the worst social and
humanitarian indicators in South Sudan. Infectious disease, maternal mortality and child mortality are
particularly severe, with impact across the state at similar levels to acute refugee emergencies in other
parts of the country5. In 2006, the most recent year for which statistics are available, the infant mortality
rate stood at 151 per 1,000 live births, with the under-5 mortality rate at 192 per 1,000 live births.
Western Equatoria has the highest prevalence of malaria, typhoid and HIV in South Sudan, with its long
and porous border facilitating the rapid transmission of other infectious diseases from neighbouring
countries. During this survey, socio-economic questions also indicated a high degree of vulnerability.
Ninety-eight per cent of respondents reported running out of essential items every year, primarily food
and agricultural inputs, while only 23% reported that there community had ever received external
assistance.
5 Mortality rate comparison between National Bureau of Statistics (South Sudan), Key Indicators for Western Equatoria, Juba,
2011 and Medecins Sans Frontieres, 2012: http://www.trust.org/alertnet/news/children-dying-at-alarming-rate-in-s-sudan-camps-msf

6
School facilities outside of county capitals are limited, with a majority of lessons taking place under trees
or in temporary structures. Approximately 57% of adults are illiterate, with this figure significantly higher
for women and girls6. There are few health facilities and those that do exist are typically restricted to
poorly stocked pharmacies. Traditional healers are a popular alternative but lack capacity to treat the
most common health issues in the state. Preventative medicine is rarely available outside of urban centres
and fewer than 9% of children have been immunised7.
Looking beyond social indicators, infrastructure in Western Equatoria is also very limited. With 84% of the
population living in rural areas8, the majority of which are surrounded by thick forest, the poor road
network has a disproportionately negative effect on both livelihoods and security. Several main roads and
a majority of feeder roads become impassable during the rainy season (April-December), preventing
access to markets, healthcare and security services. Many bomas are inaccessible to vehicles throughout
the year.
1.2 Insecurity and the Lord's Resistance Army
1.2.1 LRA in South Sudan
The Lord’s Resistance Army began operating in Sudan in the early 1990s, establishing a major base of
operations in Eastern Equatoria and conducting attacks on both other armed groups in the region and
civilian settlements. It was not until 1997, partly in response to an LRA alignment with Khartoum9, that the
rebel SPLA displaced the group’s leadership into Central Equatoria, where Joseph Kony, the commander
and spiritual leader, established a residence and headquarters in Juba and camps across other parts of
the state.
Following an agreement between the Ugandan and Sudanese governments in 2002, official support from
Khartoum was rescinded and both the UPDF and SAF began launching direct operations against the LRA
within South Sudan10
. Despite severe casualties on both sides, the LRA remained in Eastern Equatoria
and Central Equatoria until 2005 when, in preparation for the ultimately failed Juba peace talks, both LRA
leadership and the bulk of its military force relocated to the border region of D.R. Congo and South
Sudan, occupying the south-eastern point of Western Equatoria State11
.
6 National Bureau of Statistics (Sudan), National Baseline Households Survey, Khartoum, 2009
7 Ibid.
8 National Bureau of Statistics (South Sudan), Key Indicators for Western Equatoria, Juba, 2011
9 Small Arms Survey (Schomerus, M.), The Lord’s Resistance Army in South Sudan: A History and Overview, Geneva, 2007
10 Small Arms Survey (Schomerus, M.), The Lord’s Resistance Army in South Sudan: A History and Overview, Geneva, 2007
11 Small Arms Survey (Schomerus, M.), The Lord’s Resistance Army in South Sudan: A History and Overview, Geneva, 2007

7
1.2.2 LRA in Western Equatoria
Fig.2: Map of Western Equatoria
After the failure of the Juba peace talks in 2005, renewed military pressure and the Comprehensive
Peace Agreement between the SPLM and the Government of Sudan, the LRA began moving west along
the D.R. Congo – South Sudan border. Denied a regular base in South Sudan, the main force split into
smaller roving units, reducing attacks on military or defended targets and concentrating on theft,
abduction, killing and displacement among relatively remote civilian communities. The intensity and
frequency of these attacks increased as the LRA moved into the more remote western regions of the
state, comprising Yambio, Nzara and, more severely, Ezo and Tambura counties. Between 2007 and
2011, it is estimated that between 70,00012
and 100,00013
people in Western Equatoria were displaced
as a result of these attacks, supplemented by approximately 12,000 refugees fleeing similar violence in
D.R. Congo14
. While refugee camps and services were eventually established in Makpandu (Yambio
County) and Napere (Ezo County), there were no matched arrangements for IDPs, who scattered across
12
World Food Programme, Western Equatoria State Humanitarian Assessment, May, 2011 13
South Sudan Relief and Rehabilitation Commission, 2011 (via UN Office for the Coordination of Humanitarian Affairs, Western Equatoria State) 14
UN High Commissioner for Refugees, Yambio Office, 2012

8
the state. This dispersal has hampered humanitarian support and the longer-term returns process, as
communities are typically scattered across multiple rural and urban locations.
The sparse presence of both government and international agencies in this area of South Sudan mean
that precise casualty figures for this period are not available; however, conservative estimates suggest
that several hundred civilians were killed and hundreds more abducted by the LRA between 2008 and
201115
. More seriously, the mass displacement caused by fear and panic among the wider population is
likely to have resulted in the deaths of many more as a result of poor health, shelter, nutrition and
hygiene. Food security in Western Equatoria, which until the arrival of the LRA had been relatively strong,
collapsed, resulting in widespread hunger among IDP, refugee and resident populations.
Although both UPDF and SPLA units continued to pursue the LRA during this period, lack of resources,
motivation and personnel combined with thousands of square kilometres of dense forest, meant these
forces had little effect on the overall military capacity of the group. The LRA operated with effective
impunity in this region until the formation and rapid expansion of ‘Home Guards’, popularly known as
‘Arrow Boys’, between 2008 and 2010. Despite a nominal centralised command structure, Arrow Boys /
Home Guards were, in effect, a collection of small civilian militias whose fighters came directly from local
communities and, in most cases, were defending their own families and assets. Despite effectively zero
external support, including existing military forces or the wider South Sudanese government, the Home
Guards achieved remarkable success in their operations against the LRA, using rudimentary, home-made
weaponry (typically bows and improvised shotguns) to drive back LRA fighters armed with automatic
rifles and rocket-propelled grenades. From 2009, Home Guard operations increasingly focused on
aggressive patrolling, tracking LRA teams through the forest and displacing fighters back towards D.R.
Congo. Capture of more sophisticated weaponry and improvements in both tactics and command
structure produced further successes, resulting in an almost complete defeat of the LRA in Western
Equatoria by late 2011.
1.3 Rationale for the Study
This survey was designed to rectify the lack of research attention on civilian recovery in Western
Equatoria, particularly among communities affected by LRA attacks. While renewed international media
attention and lobbying has produced dozens of commentaries on LRA military capacity, tactics and
leadership, to date there have been no quantitative or large scale studies on the impact of this group on
civilian populations in the South Sudan-D.R. Congo border region. Both the United States and African
Union have sanctioned large and costly military missions to this region, yet there has been no comparable
effort to understand the needs of affected civilians, or to provide an appropriate humanitarian response.
The dataset produced by the survey has been used to design a DDG conflict-reduction and stabilisation
project in Western Equatoria, focusing on Ezo County. In 2013, this project will be expanded to include
Community-Drive Development services, with a new field location in Ibba County.
15
Amalgam of estimates provided by: SSRRC, UNDSS, UNHCR, UNOCHA, various traditional authorities and community
members

9
1.4 Objectives of the Study
• To assess and quantify the impact of LRA violence on communities in the western region of
Western Equatoria (Yambio, Nzara, Ezo and Tambura Counties) between 2007 and 2012;
• To assess and quantify the legacy of that impact, specifically in relation to psycho-social trauma,
crime, weapons ownership, inter-communal relations and humanitarian indicators;
• To identify interventions that can mitigate these negative effects, promoting stabilisation and
recovery.

10
2. TARGET GROUPS AND SAMPLING
2.1 Geographic Area
Fig.3: Counties covered in the study: Yambio, Nzara, Ezo and Tambura
The research team concentrated on the four counties of Western Equatoria that have experienced the
greatest number of LRA attacks and resulting displacement: Yambio, Nzara, Ezo and Tambura. Within
these counties, a minimum of 50% of payams were selected at random and, within these payams, a
minimum of 50% of bomas were selected at random.

11
Using this approach, the following research locations were selected (population figures from the 2010
Census):
Table 1: How people were affected by LRA
County Payam Population Boma Population
Tambura
Tambura 24923
Tambura West 7905
Gberezagino 2112
Zangia 1648
Matakurungu 2182
Source Yubu 12065
Source Yubu Centre 5836
Ngoko 1125
Mabenge 1115
Ezo
Naandi 31644 Naandi Centre 4504
Marangu 1904
Andari 11472 Bafuka 2246
Bangangai 1868
Bagidi 4901 Baikpa 570
Moso 1615
Nzara
Sangua 10630 Sangua 1 2035
Dingapa 581
Sakure 13946 Bakpara 5121
Sakure Centre 3886
Yambio
Bangasu 14643
Rimenze 3616
Bangasu 3343
Birezigbo 3616
Gangura 16504
Gangura Centre 4579
Birisi 1115
Nabiapai 2425
2.2 Sampling Methodology
Overall sample size (1,500 respondents) was determined through an analysis of operational capacity,
allotted timeframe and geographic area, ensuring that a sufficient number of households were consulted
to achieve statistical significance.
Sample size in specific locations was calculated as a proportion of their total populations, with the
exception of Yambio and Tambura where sample sizes were reduced due to atypical population
densities. Using this approach, the following sample sizes were selected:
12
Table 2: Sample sizes of the study
2.3 Socio-Demographic Breakdown of Respondents
Table 3: Urban/rural distribution of sampling group
Table 4: Size of village where participants come from
Size of village of participants Per cent of sampling group
100 - 200 households 38,22%
200 - 400 households 18,32%
Less than 100 households 12,36%
More than 400 households 31,10%
Grand Total 100,00%
Boma Sample Size
Tambura West 183
Gberezagino 49
Zangia 38
Matakurungu 50
Source Yubu Centre 135
Ngoko 26
Mabenge 26
Naandi Centre 104
Marangu 44
Bafuka 52
Bangangai 43
Baikpa 13
Moso 37
Sangua 1 47
Dingapa 13
Bakpara 118
Sakure Centre 90
Rimenze 84
Bangasu 77
Birezigbo 84
Gangura Centre 106
Birisi 26
Nabiapai 56
Total 1500
Urban or rural residents Per cent of sampling group
Rural 83,52%
Urban 16,48%
Grand Total 100,00%

13
Table 5: Gender distribution
Gender of participants Per cent of sampling group
Female 39,38%
Male 60,62%
Grand Total 100,00%
Table 6: Age distribution
Age structure of respondents Per cent of sampling group
18 - 24 12,32%
25 - 30 22,93%
31 - 40 24,52%
41 - 50 18,64%
51 - 60 5,95%
60 + 3,99%
Do not know 11,65%
Grand Total 100,00%
Table 7: Distribution of participants according to tribe
Tribal affiliation Per cent of sampling group
Balanda 7,45%
Bari 0,68%
Do not know 0,12%
Muro 1,18%
Other 2,48%
Zande 88,08%
Grand Total 100,00%
Table 8: Occupation of participants
Main occupation of respondents Per cent of sampling group
Employee with NGO or UN 0,43%
Farmer 55,50%
Fisherman 0,73%
Government employee 3,77%
Housewife 6,81%
Labourer 3,28%
Livestock (cattle/goats/chickens) 0,79%
Other 9,67%
Police or military 1,40%
Retired/Disabled 2,31%
Student 4,56%
Trader or business 5,84%
Unemployed 4,92%
Grand Total 100,00%

14
3. RESEARCH METHODOLOGY
3.1 Research Team
3.1.1 Staff
The research team comprised the following staff:
• 16 enumerators (8 DDG staff and 8 temporary contractors);
• 1 Field Supervisor
• 1 Project Manager (international)
Supporting this field team were two drivers, plus a range of advisory and Juba-based staff. All
enumerators were from Western Equatoria state, speaking Zande, Juba Arabic and English as a
minimum. All enumerators had previous experience of community-based mobilisation or surveys and had
completed their high school education, with a majority having also completed a higher level qualification.
Although DDG aimed for a 50/50 gender split within the research team, a lack of applicants meant only 5
of the enumerators were female.
3.1.2 Training
DDG conducted two weeks of intensive training for enumerators prior to deployment, covering the
following areas:
• Research ethics and methodology;
• Community entry and negotiation;
• Questionnaire interviews;
• Focus group discussions;
• Key informant interviews;
• Field management – security, logistics, information management.
Practical exercises were used heavily throughout the training process, with enumerators required to reach
a minimum level of competence (as assessed by the DDG Monitoring and Evaluation Officer and Project
Manager) before receiving clearance for field work. The training process also included the supervised
translation of the research tools into both Zande and Juba Arabic, ensuring comprehension. This process
was then completed in reverse, to ensure the accuracy of translations.

15
3.1.3 Research Tools
The survey used three primary research tools to triangulate findings:
• A multiple response questionnaire, complete by an enumerator during interview;
• Focus group discussions;
• Key informant interviews with community leaders and security providers.
3.1.1 Questionnaire
The questionnaire was based on an earlier tool used during a Danish Demining Group-Small Arms Survey
project in Eastern Equatoria during 2009, covering 10 thematic areas:
• Household and Socio-Demographic Information;
• Background Information (gender, age, ethnicity, duration of residence in current location,
occupation, income);
• Humanitarian and Developmental Assistance;
• Safety and Security;
• Crime and Disputes;
• Security Providers;
• Perceptions of Firearms;
• Ownership of Firearms;
• Firearm Accidents;
Each section was revised to ensure context specificity, with additional questions on exposure to LRA
violence, displacement and external support. To ensure consistency, enumerators completed the
questionnaire during household interviews, usually lasting between 30 and 45 minutes. Responses were
anonymous, with unique serial numbers in place of name and location.
3.1.2 Focus Group Discussions
Focus groups were convened with the assistance of community representatives and leaders, usually
taking place in a communal area of the settlement. Respondents were separated into female and male
groups, with a mixture of ages, occupations and socio-economic backgrounds.

16
Discussions were facilitated in Zande, which was the local language for every field location, and typically
lasted approximately one hour. Topics covered included:
• Community security;
• Previous security incidents, including LRA attacks and crimes;
• Performance of security providers;
• Attitudes to weapons and ownership;
Questions were open and designed to provide comparative detail on the areas covered in the
questionnaire.
3.1.3 Key Informant Interviews
Key informant interviews were conducted with a cross-section of traditional authorities (chiefs and
headmen), security providers (Arrow Boys / Home Guards and South Sudan Police Service) and
community leaders. Interviews were typically carried out by a senior member of staff, with an enumerator
translating. Questions covered the same topics as focus group discussions.
3.2 Community Entry and Consent
The research team followed the following community entry model:
• Brief the local state, county and payam authorities, gaining written authorisation for the survey
where possible;
• Advance party (typically the Supervisor) meets local chief or government employee, explaining
survey and negotiating support for the target boma;
• Full team arrives in community, conducts questionnaire;
• Team splits, conducting focus group discussions and key informant interviews simultaneously.
• Team departs.
Enumerators were issued with laminated consent forms explaining the data collection process and nature
of the survey, which was read to potential respondents before commencing. A large majority of
community members were enthusiastic about the process, with very few declining to participate.

17
4. RESULTS AND CONCLUSIONS
4.1 Previous Exposure to LRA Violence
Exposure to violence among the sample population was very high, with 71 % of respondents indicating
that either they or their families had been directly affected by LRA attacks. Displacement was the most
common reported impact, with 39% of those sampled indicating that they had fled LRA armed violence
within the previous five years. Theft was also common, with 33% of respondents indicating that the LRA
had stolen livestock, agricultural produce or building materials. More seriously, approximately 10% of the
sample population indicated that a member of their immediate household had been abducted, while 17%
reported that a member of their immediate household had been killed.
There was no major variation in these reported impacts across socio-economic groups or professions.
With the exception of reports of sexual violence in focus group discussions, disaggregation by gender
also produced little variation, with women and men reporting similar experiences.
Geographic location and size of settlement were the most influential variables when reporting effects of
LRA violence. Almost 50% of respondents from settlements of less than 100 households, for example,
reported that they had experienced displacement as a result of LRA attacks, compared to only 30% for
larger villages. However, this figure rose again to 39% among urban centres and county capitals. This
may indicate that smaller villages typically experienced the highest degree of displacement, with
households relocating to urban centres instead of larger villages nearby.
Geographic location also produced a statistically significant effect, with more remote settlements
reporting higher incidence of abduction and killing. Approximately 12% of respondents from Tambura
and Ezo counties, for example, reported that a member of their household had been abducted,
compared to 7% in Nzara and Yambio. Variation in relation to killings was even more pronounced, with
27% of respondents in Tambura reporting fatalities, compared to only 15% in Ezo and Nzara and 7% in
Yambio. Reported displacement remained constant across all counties.
Focus group discussions supported questionnaire findings, with communities reporting widespread
killings, abductions and loss of property. Many respondents, particularly in smaller villages, indicated that
the primary causes for reduction of population in their area were direct killings and executions by the
LRA, rather than forced displacement. Female focus groups reported widespread sexual violence, both
during LRA attacks and against abducted women and girls.
In addition to the direct effects of violence, community members emphasised the continuing suffering
caused by previous LRA attacks, which resulted in long term damage to food security, livelihoods,
educational attainment and psycho-social wellbeing. Participants from remote areas of Tambura and Ezo
counties often revealed injuries received during LRA attacks, including gunshot wounds, broken bones,
burns and, occasionally, amputation of fingers and limbs. Facial and eye injuries were particularly
common among Arrow Boys / Home Guard members, typically the result of their home-made firearms
exploding accidentally.

18
4.1.1 Conclusions
• Smaller villages and settlements, particularly those in Tambura and Ezo counties, experienced the
greatest impact from LRA attacks in terms of killings, abductions and displacement.
• As a result, affected households relocated from their homes to urban centres, believing them to
represent the most secure locations in case of further attacks.
• Although LRA attacks have subsided since 2011, their impact continues to be felt in the form of
physical disability, increased poverty and psycho-social trauma;
• The fact that reported displacement remained consistent across socio-economic groups and
occupations indicates that displacement typically occurred on a community-wide basis, not
household by household.
Graphics and Tables – Previous Exposure to LRA Violence
Fig.4: % of participants affected by LRA
No, 28,25%
Yes, 71,75%
% affected or not affected by LRA
No
Yes

19
Fig.5: Percentage of population in each county that was displaced
Fig.6: Percentage of population that was displaced according to village size
Table 9: How people were affected by LRA
County
Ezo Nzara Tambura Yambio Grand Total
Abducted 11,24% 7,44% 11,99% 6,80% 9,57%
Displaced 35,21% 41,40% 40,06% 39,46% 39,00%
Injured 2,62% 0,47% 3,51% 0,00% 1,79%
Killed 15,36% 14,42% 26,61% 7,82% 16,64%
Theft 35,58% 36,28% 17,84% 45,92% 33,01% Grand Total
100,00% 100,00% 100,00% 100,00% 100,00%
32,00% 33,00% 34,00% 35,00% 36,00% 37,00% 38,00% 39,00% 40,00% 41,00% 42,00%
Ezo Nzara Tambura Yambio
Displaced people by county
Displaced
0,00%
10,00%
20,00%
30,00%
40,00%
50,00%
60,00%
100 -‐ 200 households
200 -‐ 400 households
Less than 100 households
More than 400 households
Displaced people by village size
Displaced

20
4.2 Current Perceptions of Safety and Security
Perceptions of current safety and security were mixed across all respondent groups. Although 48% of
respondents indicated that the security situation within the last 12 months had improved (compared to
19% who said it had become worse), over 60% reported that they were concerned or very concerned
about experiencing further violence and 62% believed their settlement to be unsafe or very unsafe. Over
56% of those sampled stated that they remained worried or very worried about the LRA.
These figures were consistent across all sample counties, occupations and genders, with minimal
variation in relation to settlement size or location. Given the varying severity of LRA attacks, particularly in
relation to location and settlement size, this finding is surprising; residents of urban centres would be
expected to feel more secure than those from smaller or more remote settlements.
There are several potential explanations for this finding. First, LRA attacks resulted in large-scale
displacement from small, remote communities to county capitals, increasing the number of urban
residents perceiving the LRA to be serious risk. Second, in the absence of confirmed attacks for over 18
months, fear of the LRA is now driven by rumour and myth, catalysed by the presence of other non-state
armed groups, such as the pastoralist Ambororo entering from Central Africa. Rumours of violence
typically spread faster in densely populated areas and, as a result, may have increased concerns in urban
centres, despite their relative security.
Participants in focus group discussions and key-informant interviews emphasised the intense and
continuing fear of LRA attacks. While many focused on the psycho-social burdens of prolonged
insecurity, most respondents focused on the practical impacts, such as reduced access to agricultural
land, schools and health centres. Although very few participants claimed to have encountered the LRA
since the last confirmed attack in June, 2011, a large majority believed that LRA fighters were continuing
to operate in the forests of Western Equatoria. Although inter-communal violence was mentioned, this
was typically restricted to competition over resources and rarely resulted in full-scale armed conflict.
4.2.1 Conclusions
• Despite perceptions of increased security in the absence of recent LRA attacks, fear of insecurity
remains very high;
• Such fears do not vary significantly based on location, possibly due to the highly dispersed IDP
population and prevalence of rumours;
• Even minor security incidents have the potential to cause significant casualties through
displacement and panic/

21
Graphs and tables
Table 10: Improvement or decline in security situation
Table 11: Feeling of safety by county
Table 12: Feeling of safety by village size
Counties that were Surveyed
Ezo Nzara Tambura Yambio Grand Total
Better 44,03% 46,42% 52,54% 51,44% 49,16%
The same 37,67% 29,81% 21,09% 35,17% 30,05%
Worse 17,51% 20,75% 24,67% 12,86% 19,37%
Do not know
0,80% 3,02% 1,69% 0,52% 1,42%
Grand Total
100,00% 100,00% 100,00% 100,00% 100,00%
County
Ezo Nzara Tambura Yambio Grand Total
Very safe 4,72% 1,09% 15,70% 5,40% 7,98%
Quite safe 37,27% 27,01% 20,93% 29,56% 28,06% Quite unsafe 35,96% 37,23% 33,27% 43,44% 37,11% Very unsafe 22,05% 34,67% 30,09% 21,59% 26,85% Grand Total 100,00% 100,00% 100,00% 100,00% 100,00%
Size of villages sampled
100 - 200 household
200 - 400 household
Less than 100 households
More than 400 households Grand Total
Very safe 4,86% 2,03% 5,81% 16,29% 7,96% Quite safe 30,63% 28,72% 29,65% 23,92% 28,09% Quite unsafe 41,49% 39,86% 37,79% 29,90% 37,20% Very unsafe 23,01% 29,39% 26,74% 29,90% 26,75% Grand Total 100,00% 100,00% 100,00% 100,00% 100,00%

22
Fig.7: Level of worry reg. the LRA
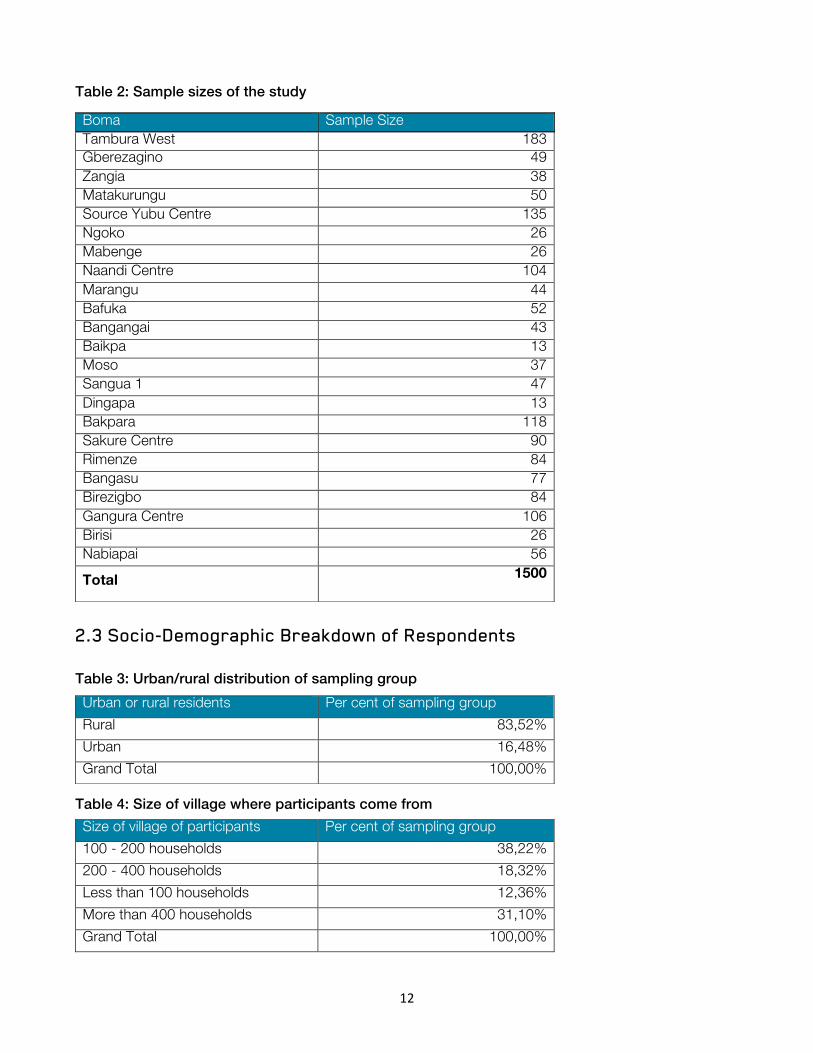
4.3 Crime and Disputes
Experience of violent crime across the respondent population was also high, with 29% indicating that
either they or a member of their household had been the victim of a crime within the previous 12 months.
Of those reporting a crime, murder was the most common with 25% of this group indicating that a
member of their family had been killed within the previous 12 months. Other forms of violent crime were
also high, with 24% of victims reporting assaults, 13% reporting domestic violence and 12% reporting
forced theft.
Although there was no significant pattern in the geographic locations of such crimes, time of day played a
major role in perceptions of risk. Over 90% of respondents felt safe inside their homes or around their
villages during the day but over 60% felt unsafe in their homes at night and over 70% felt unsafe around
their villages at night. The tropical forest which surrounds most settlements was perceived as unsafe
whether day (91%) or night (96%).
The length of time households had been resident in their host community also produced a significant
effect on reports of crime. Although violent assaults and killings were high regardless of the time spent in
a community, reports of threats and harassment were significantly higher for those who had arrived within
the previous two years, who were most likely to be IDPs. Over 40% of households who had arrived within
the previous 1-3 months, for example, reported that they had received direct threats against their safety,
compared to only 15% for arrivals in the past 1-2 years and only 9% of in the past 3-4 years. This gives a
strong indication that IDPs, perceived as a drain on resources and land, continue to experience hostility
from their new host communities and, as such, are more vulnerable to threats, crime and food insecurity.
Do not know 1%
Not worried 5%
Quite worried 57%
Very worried 37%
How people feel about LRA
Do not know
Not worried
Quite worried
Very worried

23
Focus group discussions mentioned land disputes with newly arrived families as a major source of violent
crime and dispute, with theft and destruction of property reported in all locations. Domestic violence,
particularly sexual violence against women and girls, was also described as a major issue, particularly in
larger settlements. Psycho-social trauma and impulsive violent behaviour were reported as having
massively increased since the arrival of the LRA in 2007/2008, with many participants describing relatively
minor disagreements that had resulted in conflict.
4.3.1 Conclusions
• Violent crime and disputes remain prevalent across the region, with murder and assault
particularly common;
• Rural and forested areas are perceived as being particularly high risk;
• IDPs remain vulnerable, with a very high risk of threats and direct violence, particularly in relation
to land disputes.
Graphs and tables
Fig. 8: Experienced crime in past 12 months by county
0%
10%
20%
30%
40%
50%
60%
70%
80%
90%
Ezo Nzara Tambura Yambio
No
Yes (household member was a vicRm)
Yes (respondent was vicRm)
24
Table 13: Experience of crime that involved killing within past 12 months by county
Table 14: Overall kinds of crime experienced within past 12 months
County
Ezo Nzara Tambura Yambio Grand Total
Assault/beating/shooting 31,93% 27,87% 16,57% 22,88% 23,55%
Child abuse 0,00% 0,00% 0,00% 0,85% 0,21%
Domestic violence 18,49% 21,31% 8,88% 9,32% 13,06%
Kidnapping 0,00% 0,00% 1,18% 0,00% 0,43%
Killing 15,13% 11,48% 41,42% 19,49% 25,27%
Other 1,68% 3,28% 8,28% 1,69% 4,28%
Robbery/theft 9,24% 18,03% 8,28% 16,95% 11,99%
Sexual violence 4,20% 3,28% 2,96% 3,39% 3,43%
Threat 15,13% 14,75% 9,47% 23,73% 15,20%
victim of clan fighting 0,84% 0,00% 1,78% 0,00% 0,86%
Victim of gang violence 3,36% 0,00% 1,18% 1,69% 1,71% Grand Total 100,00% 100,00% 100,00% 100,00% 100,00%
County
Ezo Nzara Tambura Yambio Grand Total
Assault/beating/shooting 31,93% 27,87% 16,57% 22,88% 23,55%
Child abuse 0,00% 0,00% 0,00% 0,85% 0,21%
Domestic violence 18,49% 21,31% 8,88% 9,32% 13,06%
Kidnapping 0,00% 0,00% 1,18% 0,00% 0,43%
Killing 15,13% 11,48% 41,42% 19,49% 25,27%
Other 1,68% 3,28% 8,28% 1,69% 4,28%
Robbery/theft 9,24% 18,03% 8,28% 16,95% 11,99%
Sexual violence 4,20% 3,28% 2,96% 3,39% 3,43%
Threat 15,13% 14,75% 9,47% 23,73% 15,20%
victim of clan fighting 0,84% 0,00% 1,78% 0,00% 0,86%
Victim of gang violence 3,36% 0,00% 1,18% 1,69% 1,71%
Grand Total 100,00% 100,00% 100,00% 100,00% 100,00%

25
Table 15: Perceptions of safety according to location and time of day
Time of the day
When walking in the village during day time
When walking in village during night time
When inside house during day time
When inside house during night time
When walking in forest during day time
When walking in forest during night time
Very unsafe
3,56% 31,96% 3,69% 15,69% 50,65% 91,41%
Quite unsafe
5,59% 42,18% 4,98% 46,38% 39,21% 5,59%
No opinion
0,55% 2,62% 0,18% 1,23% 1,54% 1,78%
Quite safe
30,51% 18,13% 32,12% 28,13% 5,90% 0,43%
Very safe
59,79% 5,11% 59,02% 8,58% 2,70% 0,80%
Grand Total
100,00% 100,00% 100,00% 100,00% 100,00% 100,00%
Table 16: Perceptions of safety according to time spent in location
Time spent in the place
Very safe Quite safe
Quite unsafe
Very unsafe
Grand Total
1 - 3 months 7,26% 3,41% 2,43% 3,84% 3,47%
4 -6 months 3,23% 3,41% 4,52% 8,15% 5,08%
7 - 12 months 4,03% 1,82% 5,04% 9,11% 5,14%
1 - 2 years 12,90% 11,14% 16,17% 20,86% 15,75%
3 - 4 years 9,68% 13,18% 11,13% 10,31% 11,38% 4 years or more 9,68% 6,59% 5,91% 6,95% 6,68% Always lived here 52,42% 60,23% 54,61% 40,77% 52,31%
Other 0,00% 0,23% 0,00% 0,00% 0,06%
Do not know 0,81% 0,00% 0,17% 0,00% 0,13%
Grand Total 100,00% 100,00% 100,00% 100,00% 100,00%

26
4.4 Security Providers Attitudes towards formal security providers (e.g. police and military) by the respondent population were
complex, with varying perceptions of trust, competence and availability. Over 90% of respondents
indicated that there was some form of security provision in their settlement, with the South Sudan Police
Service (SSPS) representing the most common provider overall. However, SSPS presence was
significantly lower for smaller and more remote settlements, with less than 35% of respondents in villages
smaller than 200 households identifying this group as a security provider. In these situations, religious and
traditional leaders, despite their lack of policing or defence capacity, were most commonly identified as
the primary security provider, accounting for approximately 40% and 30% respectively. Respondents in
this category emphasised that, while religious and traditional leaders had the greatest capacity for
mediation and conflict management, they lacked any capacity to provide military or police protection.
Respondents were also significantly more likely to report crimes to traditional and religious leaders,
regardless of the presence of SSPS or the size of their settlement. For example, among respondents
willing to report a crime, over 60% would go to traditional leaders ahead of the police.. In cases of intra-
communal dispute, 69% of respondents indicated that they would seek conflict resolution but over 99%
of these preferring to work with religious leaders. Use of formal courts or police services in such instances
was typically a reluctant second choice, ranging from 35% in larger settlements to 5% in smaller villages.
Arrow Boys / Home Guards were significantly more popular in these smaller settlements, with 20% of
respondents indicating that they would approach them for conflict resolution or mediation. Despite
widespread SPLA presence across the sample locations, less than 1% of respondents perceived them as
being either responsible for security or useful in resolving crime and disputes.
Although focus groups also identified traditional authorities as important mediators, Arrow Boys / Home
guards were identified as the primary conventional security provider in these fora. Although there were
occasional complaints of idleness, attitudes to this group were overwhelmingly positive, with a large
majority of respondents crediting them with driving the LRA out of Western Equatoria. Integration with
conventional security and judicial structures was also surprisingly advanced, with most communities
reporting home guards feeding information to police, transferring alleged criminals to urban courts and
acting as mediators in cases of intra or inter-communal dispute. Key informant interviews with home
guard infantry and commanders confirmed such claims, with a high degree of pride and discipline among
both regular infantry and leadership. While such structures will not necessarily last and the continued
presence of such an armed group does represent a potential future security risk, home guards currently
receive a high degree of respect and support from most communities.
4.4.1 Conclusions
• Very few formal security providers are present within the region, with security provision limited to
reactive conflict mediation or traditional dialogue structures;
• Of the formal security services that are present, public trust and engagement is low, with a vast
majority preferring to address conflict or insecurity through traditional leaders;

27
• Arrow Boys/Home Guards are the only security provider perceived as capable of providing
credible protection, with formal security providers seens as largely irrelevant or, at worst, directly
harmful. The role of the Arrow Boys / Home Guards in driving out the LRA has been widely
mythologised by both government and local communities;
• While this traditional mediation is widely used and partially effective in resolving internal crime and
dispute, communities remain extremely vulnerable to external attacks, increasing perceived risk
among communities and disrupting livelihoods.
Graphs and tables
Table 17: Respondents identified the following actors as security providers
County
Ezo Nzara Tambura Yambio Grand Total
Do not know 0,00% 0,00% 0,24% 0,30% 0,16%
Homeguards 2,14% 0,00% 11,72% 0,00% 4,31%
Police 55,36% 44,90% 55,02% 43,54% 50,16%
Religious leaders 21,07% 25,71% 10,05% 29,43% 20,53%
SPLA 0,00% 0,00% 1,67% 0,00% 0,55%
Traditional leaders/boma chiefs
21,43% 29,39% 21,05% 26,73% 24,22%
UPDF 0,00% 0,00% 0,24% 0,00% 0,08%
Grand Total 100,00%
100,00% 100,00%
100,00% 100,00%
Fig. 9: Respondents stated that they report crimes to the following security providers and
members of their social networks
0% 10% 20% 30% 40% 50% 60% 70%

28
Table 18: Respondents stated that they would seek help for mediation in conflicts from the
following security providers and members of their social networks
4.5 Civilian Weapons Ownership
Perceptions of firearms across the sample population were surprisingly negative, with a majority of
respondents indicating that they neither owned nor wished to own one. This finding was at least partly
due to limited availability of firearms within the target area, with approximately 70% of respondents
indicating that it was very difficult to acquire manufactured weapons. Over 75% also indicated that they
perceived firearms ownership as a safety risk for their community, as opposed to 20% who described
them as desirable or normal.
Despite these negative perceptions, a substantial minority of respondents, over 30%, indicated that they
either owned or had access to firearms. Of this group, homemade shotguns or fabrications were most
popular, with 72% reporting ownership. These weapons, although rudimentary, were the primary weapon
used against the LRA by the Home Guards in recent years and have become increasingly sophisticated.
The research team encountered several weapons with adjustable sights, safety switches and breach
loading, with many respondents indicating that they had the skills and materials to produce such firearms
locally.
Among respondents reporting weapons ownership, AK assault rifles were also popular, with 25%
reporting the presence of such weapons in their household. Ownership of other types of weapons was
negligible, with the occasional exception of light machine guns in villages of less than 100 households
(5%). Although hunting remains a major livelihoods input in most respondent communities, over 92% of
weapons-owners indicated they held them primarily for personal or household protection.
The use of firearms in violent crime or confrontations was relatively low. Bladed weapons such as knives
and pangas (machetes) were the most common, accounting for 47% of incidents, followed by unarmed
attacks with 29%. Firearms accounted for only 10% if violent incidents.
Friends 1,58%
Homeguard (“arrow boys”) 5,57%
Military/SPLA 0,25%
Nearest family 0,33%
Neighbours 13,89%
Police 12,31%
Religious leaders 1,66%
Traditional leaders 64,39%
Grand Total 100,00%

29
Focus group discussions provided similar accounts of civilian weapons ownership, with a majority of
groups describing the presence of firearms as relatively widespread and normal, but recognising the
safety risks they posed. All groups described the primary justification for ownership as being self and
communal protection, referring to the widely held belief that the LRA still operated in the area. Most
groups reported occasional use in violent crime but emphasised that this was rare. More common were
firearm accidents, with home-made fabrications either going off unexpectedly or exploding when fired.
4.5.1 Conclusions
• Despite widespread belief that firearms represent a collective safety risk, a large minority hold
personal weapons;
• Of these, manufactured weapons are relatively uncommon, with home-made shotguns or
fabrications significantly more popular;
• The most common explanation for firearms ownership was related to personal protection,
however, use of firearms in violent crime was rare.
Graphs and tables
Table 19: Weapons used in violent incidents
Agricultural tools 3,55%
Bladed weapon 48,60%
Blunt objects 4,57%
Do not know 1,27%
Firearm 10,41%
Fists and legs 29,38%
Refused to answer 0,06%
Rocks or sticks 2,16%
Grand Total 100,00%
Table 20: Household firearms ownership by county
County
Ezo Nzara Tambura Yambio Grand Total
Do not know
0,77% 0,74% 0,37% 3,45% 1,31%
No 63,17% 61,48% 77,90% 64,29% 68,08%
Yes 36,06% 37,78% 21,72% 32,27% 30,61% Grand Total
100,00% 100,00% 100,00% 100,00% 100,00%

30
Table 21: Type of firearms in possession
County
Ezo Nzara Tambura Yambio Grand Total
AK-47/Automatic rifle 19,84% 20,20% 36,45% 23,33% 24,78%
Home made firearm 76,98% 77,78% 59,81% 74,17% 72,35%
Medium/heavy machine gun
1,59% 0,00% 1,87% 2,50% 1,55%
Other 0,79% 1,01% 0,00% 0,00% 0,44%
Pistol 0,79% 1,01% 1,87% 0,00% 0,88%
Grand Total 100,00% 100,00% 100,00% 100,00% 100,00%
Table 22: Reasons for possession of firearms
County
Ezo Nzara Tambura Yambio Grand Total
Fear of future 0,00% 1,01% 0,00% 0,00% 0,21% Personal protection from clans, criminals
92,09% 96,97% 83,04% 98,35% 92,57%
Personal protection from other communities
4,32% 0,00% 16,07% 0,00% 5,10%
Personal protection from wildlife 1,44% 0,00% 0,89% 0,00% 0,64%
Protection of village 1,44% 1,01% 0,00% 1,65% 1,06%
Work 0,72% 1,01% 0,00% 0,00% 0,42%
Grand Total 100,00% 100,00
% 100,00% 100,00% 100,00%

31
5. CONCLUSIONS AND RECOMMENDATIONS
5.1 Recovery
The findings of this survey indicate widespread and enduring social trauma as a result of LRA violence.
This has been aggravated by a continuing IDP crisis across the state, with hundreds of LRA-affected
communities unable or unwilling to return to their home settlements. Although social and economic
indicators are improving across Western Equatoria as a whole, IDPs remain vulnerable and marginalised,
with strong feelings of abandonment by the state and rejection by their host communities.
Communities that have now returned to their original settlements experience a similar level of vulnerability.
Although security has improved, agricultural land, shelters and livelihoods have often been destroyed,
leaving recent returnees highly food insecure. The enduring belief that the LRA is operating in the nearby
forest acts as a major obstacle to long-term community planning and recovery.
However, the effects of LRA violence across Western Equatoria remain highly localised and uneven. The
state as a whole is recovering rapidly, with high potential for economic growth and long term stability.
Given the severe instability and vulnerability of many other states in South Sudan, this is a rare
opportunity. Unfortunately, such improvements are unlikely to be fully or even partially realised while
recovery among LRA-affected communities remains neglected. Remote rural communities still account
for the bulk of agricultural output across the state and, while such acute vulnerability in these settlements
endures, food and livelihood security is likely to remain elusive. Social indicators in many of these areas
are significantly worse than the more widely-publicised refugee emergencies in the northern border region
of South Sudan, but receive virtually zero humanitarian attention.
A key component of any stabilisation and recovery process in Western Equatoria will be a sustained push
towards improved infrastructure, particularly roads. The remote and heavily forested border region
allowed the LRA to operate with almost complete impunity for several years and, following their retreat to
D.R. Congo and Central Africa in 2011/2012, now facilitates the rise and spread of destructive rumours
around their movements. This survey uncovered intense feelings of isolation among the respondent
population, with the inability to easily communicate with the outside world encouraging perceptions of risk
and vulnerability. Improved mobile network coverage has helped in challenging false information but,
without improved transport infrastructure, the perceived risk of armed violence is likely to endure.
Recommendations
• Greater investment from the South Sudan Government and humanitarian agencies in supporting
IDP returns, with a specific focus on livelihoods recovery and agricultural inputs;

32
• Improved information sharing among governmental, humanitarian and military actors and the
community. Concerted efforts to dislodge persistent rumours regarding LRA activity and attacks,
prioritising remote and displaced communities, primarily through improved road and
communication networks. In cases of persistent rumours or panic-induced displacement,
governmental and humanitarian organisations may need to disseminate information via direct
visits;
• Focus on community-led and driven development, granting LRA-affected households greater
agency in the recovery process;
• Improved psycho-social capacity among government health clinics, including basic diagnostic
training and treatment for post-traumatic stress and other psychological disorders.
5.2 Community Security and Providers
While the threat of LRA attacks has receded, their legacy continues to be felt. Fear-induced displacement
now represents a significantly greater threat than direct LRA attacks, with the potential for major
casualties as a result of disease, exposure and loss of livelihoods. Displacement risk is highest in remote
or recently returned communities and, given the already high levels of deprivation and food insecurity in
these areas, sudden relocation exposes households to severe health risks.
The presence of other armed groups in the region, most notably the Ambororo pastoralists, feeds these
rumours, with virtually all respondent communities reporting moderate to strong beliefs that the LRA are
mobilising in the nearby forest. While this cannot be wholly discounted, regular aerial and foot patrols by
various security providers (primarily the UPDF, UN and SPLA) and the lack of attacks or sightings suggest
otherwise. Even without this specific threat, communities feel a significantly greater degree of vulnerability
than before the crisis.
Crime, particularly violent crime, has also increased, with intra-communal murder, assault and theft the
most common. Although the widespread ownership of home-made firearms has not translated into a
significant increase in armed crime, the presence of these weapons presents a threat to security among
both communities and the wider region. In particular, very high levels of deprivation and dissatisfaction
with the South Sudanese state may represent a future source of instability, while tensions between IDPs
and host communities are an enduring security risk.
The most significant weakness within current systems of community security, and therefore the area with
the greatest potential for improvement, relates to formal security provision, primarily by the South Sudan
Police Service. Currently confidence in this institution is very low, with a large majority of respondents
preferring to refer crimes and disputes to community leaders. While the remote and dispersed nature of
settlements in Western Equatoria mean an improvement in overall coverage will be difficult, building of
police capacity and engagement with communities represents an effective, low-cost intervention that can
improve perceptions of community security.

33
While a similar degree of capacity-building and engagement with informal security providers, such as the
Arrow Boys / Home Guards, is significantly more challenging, this group must also be involved in any
attempt to improve security provision in Western Equatoria. This survey found that their role in forcing the
LRA out of the state has been mythologised to such a degree, by both government and communities,
that any attempt to improve state provision without the involvement of Arrow Boys/Home Guards is likely
to be resisted. The continued presence of this armed group certainly represents a potential future risk,
however, this survey found no indication of ambitions beyond community security among Arrow Boys /
Home Guard leadership. This commitment to community service represents a potential asset to any
security sector reform in Western Equatoria and a potential vector for gradual demobilisation,
disarmament and reintegration of this non-state armed group.
Recommendations:
• Improved relations between SSPS and rural communities, ideally facilitated via a grassroots
dialogue methodology;
• Improved operational capacity of SSPS, through direct training and investment;
• Engagement with Arrow Boys / Home Guards at the state, payam and boma levels, examining
the potential for cooperation with the regular SSPS. Focus on support to community security
reform and gradual reintegration to civilian life;
• Improved cooperation and communication between communities and security providers,
including clarification of responsibilities, duties and capabilities, facilitated through joint training
and dialogue;
• Increased representation of communities in state-level security planning, ideally incorporating
representatives from each payam in LRA-affected areas;
• Greater support and education around safe storage and handling of firearms, tailored in relation to
home-made fabrications.


![Commercialisation of R&D Funding Initiative Pilot …...Commercialisation of R&D Funding Initiative Pilot Funding Agreement | [insert Activity title and Contract Number] 1 Commercialisation](https://img.pdfslide.us/doc/110x75/5f537e4e5ed9b3184a1180b6/commercialisation-of-rd-funding-initiative-pilot-commercialisation-of-rd.jpg)