Embed Size (px)
Citation preview

Arlington Community Energy Plan Competitive Community of the Future
Property Development and Management Input Meeting Arlington, Virginia, July 1st, 2010
Community Energy Plan
� Task Force Kick-off Workshop - Jan 2010
� Energy & Greenhouse Gas Baseline complete
� CEP Technical Working Group formed
� Meetings - County Departments, Dominion, Pentagon, Reagan National Airport, Washington Gas, Chamber of Commerce, ….
� Task Force endorses transformative CEP goals
� Community Energy Town Hall meeting Apr 2010
� Initial recommendations to Task Force – Sep 2010
� Completion target – February 2011
Arlington CEP Process to date
Community Energy Plan
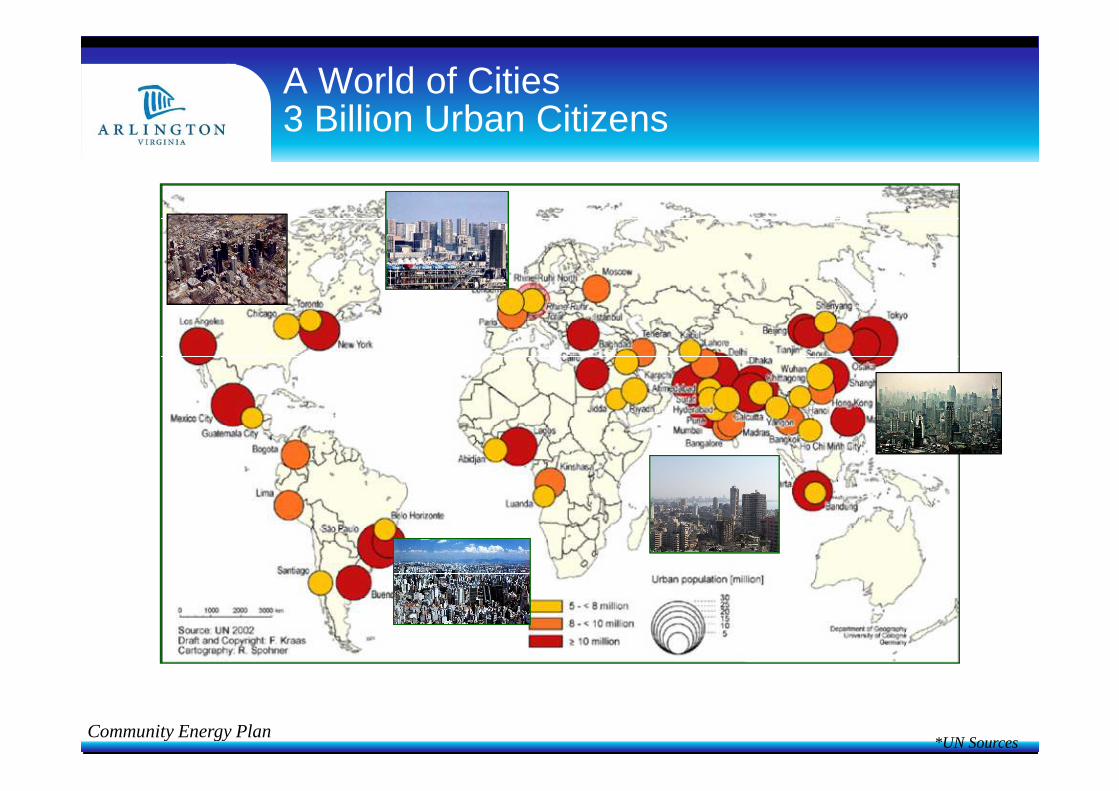
A World of Cities 3 Billion Urban Citizens
*UN Sources

Community Energy Plan
Majority of us live in cities
*UN Sources
Urban Population passed 50% in 2008
Percent

Community Energy Plan
Insatiable Appetite for Energy About 70% of it in Cities
Forecast to double by 2030 Source: IIASA / BP / EIA / Eurostat

Community Energy Plan
Climate Change Range of Potential Impacts
*Stern Review

Community Energy Plan
Global Energy Picture Growing Impacts on USA
� Unpredictable energy prices � Sustained volatility and upward trends likely � Globalizing prices
� Dependence on imports � USA - Oil (70%) and natural gas (16%) � EU – more than 50% of all energy
� Climate change legislation � Aggressive reductions proposed � Uncertainty over regulatory frameworks � Uncertainty over compliance costs and requirements
� Underinvested North American energy infrastructure � Electricity grid � Rail for coal transport � Natural gas terminals
� China and India major new energy customers � Major impacts on primary fuel prices
� Trigger events –hurricanes, tornados, oil spills ….
Fundamentally different from past

Community Energy Plan
Perfect Energy Storm When fears collide…
Growing awareness – Growing Opportunity
Volatile Prices Availability
Climate Change

Community Energy Plan
Energy Productivity Differences How well do we spend our $1.5 Trillion?
*IEA and World Bank – 2007 sources
Key to Competitiveness
Region Population GDP Energy Energy /Capita
Energy /GDP
USA 4.6% 18.9% 19.5% 100 100
EU 7.5% 25.1% 14.8% 47 57
Japan 1.9% 8.8% 4.3% 52 47
China 20.0% 4.5% 16.3% 19 355
India 17.0% 1.5% 4.9% 7 317
World 100% 100% 100% 23 97

Community Energy Plan
Energy Supply Chain From fuel to service
� High greenhouse gas � High-cost low returns � High risk
Uses 70% of all energy
25%
Pay for 100 get less than 10
5%

Community Energy Plan
Energy Use by Sector How does the USA Compare?
� Most energy lost in range of inefficiencies � Only 5% to 15% used productively
Sector Share Index USA/EU
Industry 32% 1.2 : 1 Buildings* 40% 2.5 : 1 Transportation* 29% 1.4 : 1
High potential for productivity gains! *Indicative ratio of US average to EU Average

Community Energy Plan
Arlington Community Energy and Sustainability Plan
Three Groups of Benefits
Competitiveness Security
Environment
� Supply security � Supply quality � Flexibility
� Energy cost � Employment � Investment
� Greenhouse Gas Reduction

Community Energy Plan
Arlington’s Energy Use Roughly $1Bn per year
236 MMBtu e / 69 MWhe for each Resident
2007 Fuel Use 48’252’000 MMBtue / 14’141’000 MWhe
by sector by type

Community Energy Plan
Arlington’s Carbon Footprint
13.4 metric tons for each Resident
2007 Greenhouse Gas Emissions 2,730,000 metric tons / 6,020,000,000 lbs CO2e
by sector by type

Community Energy Plan
Sector Energy Use Greenhouse
Gases
Transportation 21% 28%
Residential 26% 26%
Non-Residential 53% 46%
Arlington - Energy Use and Greenhouse Gas Emissions

Community Energy Plan
Greenhouse Gas Indicators
� GHG good surrogate for overall energy productivity
� National GHG per capita per year (metric tons CO2) � Canada 22.6 � USA 21.7 � Denmark 14.1 � Germany 11.7 � European Union 10.5
� Municipal GHG per capita per year (metric tons CO2) � Washington DC 19.7 (uncertain scope) � Arlington County 13.4 with “breakthrough” goal � Loudoun County 14.2 with 6.0 goal � Canada - Guelph 12.2 with 5.0 goal � Germany – Mannheim 6.0 with 4.5 goal � Denmark - Copenhagen 3.0 with zero goal
*Rough indicators - multiple sources
Arlington Embraces Breakthrough Targets

Community Energy Plan
Copenhagen - Integrated Energy Solution “Environmental Capital of Europe”
� Triggered by 1970’s energy crisis � Neighborhood approach � 2.6 tons / capita greenhouse gas � Efficiency
� World leading building efficiency � Energy Performance Labeling
� District heating / cooling � Systematic expansion
� Fuel flexibility � Multi-fuel cogeneration � Coal, oil, gas, biomass, waste-to-energy � Wind and solar generation
� Transport � Urban design for bike/walking � Efficient trams/trains
� High Value Employment � Energy Products and Services
2009 – Voted “Second Most Livable City”

Community Energy Plan
� Energy efficiency – If you don’t need it don’t use it � Efficient buildings, vehicles � Urban design for transport efficiency � Local employment for commuting efficiency
� Heat Recovery – It it’s already there – use it � Distributed combined heat and power � Use existing “waste” heat � Structure commercial sites to maximize “waste” heat use
� Renewable energy – If it makes sense, go carbon free � Renewable electricity – Photovoltaic, Wind, Run-of-river Hydro � Renewable heat - Solar thermal, Biomass, geothermal � Renewable heat and power – waste-to-energy, biomass
� Energy distribution – Invest where it makes sense � Flexible distribution – electricity, gas, district heating, cooling… � Accepts multiple fuels and energy conversion technologies � Optimize local / regional investment choices
CEP Framework
Integrated Solution – Tailored for County!

Community Energy Plan
Evolution of Benefits Four Distinct Types of Activity
Community Activity •Many initiatives •No changes in policy
Community Activity •Many initiatives •No changes in policy
Scale Projects •Neighborhood size •Local changes in “policy”
Scale Projects •Neighborhood size •Local changes in “policy”
Integrated policy County wide norms •New “business-as-usual”
Integrated policy County wide norms •New “business-as-usual”
Incr
easi
ng C
EP
Ben
efits
Stand alone projects •Fewer larger initiatives •Minor changes in policy
Stand alone projects •Fewer larger initiatives •Minor changes in policy
Transformative
Incremental
Arlington Commits to World Class Performance

Community Energy Plan
Sustainable Energy Multiple Level 1 & 2 initiatives
Langston-Brown Community Center Walter Reed Community Center
Westover Library

Community Energy Plan
Sustainable Transportation Multiple Level 1 & 2 Initiatives

Community Energy Plan
Action Categories Difficulty Competitive
-ness GHG
Reduction Security
1. Voluntary Community Activity
2. Smaller stand-alone projects
3. Large Scale-Projects
4. Integrated Energy Policy
� Competitiveness Goals � Inbound investment, employment, energy costs
� Environmental Goals � Greenhouse gas reduction – good surrogate for overall
energy productivity � Supply Security Goals
� Flexibility, redundancy, upgradeability
CEP Goals
“We don’t do Easy” ?

Community Energy Plan
Energy Planning Neighbourhoods (Work in Progress)
� 2007 to 2050 � Energy needs � Greenhouse gases
� Energy uses � Heating, Cooling, Other
� Buildings Profile � Residential / Non-residential � New, existing, renovated,
demolished � Scenarios
� Business as Usual � Enhanced efficiency � District Energy � Clean and renewable supplies
� Existing buildings dominant factor in future energy use
Renovation and restructuring will be key

Community Energy Plan
� Leadership and community engagement � Transparency and outreach � Necessary planning policy changes in place � World-class energy efficiency � Integrated utility approach � Early implementation of “Scale Projects” � Magnet for business and academic
excellence � Continuous improvement – raising the bar!
Successful CEP Implementation Common Features
Consistent Execution Over Decades

Community Energy Plan
Scale Projects Major Key to Success
� Powerful Goals � 30 to 60% less energy � 40 to 80% less GHG � Affordable energy � Attract investments � Improved reliability � Reduce city costs
� Community awareness � Education � Policy changes � Will they be
implemented?
� Powerful Goals � 30 to 60% less energy � 40 to 80% less GHG � Affordable energy � Attract investments � Improved reliability � Reduce city costs
� Community awareness � Education � Policy changes � Will they be
implemented?
CEP Efficient Buildings Scale Implementation
� Voluntary programmes � Energy Star… � LEED…
� Useful resources � Construction guides � Efficient equipment � Rebate & incentives � Education
� Limited penetration � < 5% new construction
� Voluntary programmes � Energy Star… � LEED…
� Useful resources � Construction guides � Efficient equipment � Rebate & incentives � Education
� Limited penetration � < 5% new construction
� Success needs scale � Multiple benefits
� City, developer, utility… � Potential game-changers
� High density urban villages � Greenfield Smart Growth � Sports Centres � Transportation facilities
� Multiple in county � “Connect the Dots”
� Success needs scale � Multiple benefits
� City, developer, utility… � Potential game-changers
� High density urban villages � Greenfield Smart Growth � Sports Centres � Transportation facilities
� Multiple in county � “Connect the Dots”
Scale A
Scale B
Scale C
Scale D
Scale E
County
Jump Start Implementation

Community Energy Plan
� High probability of being implemented � Manageable number of participants � Large enough to implement integrated energy
solutions within its boundaries � Possibility to apply different energy supply
and efficiency than surrounding norms � Potentially economically, environmentally and
operationally attractive � Future possibility to link to other community
projects
CEP Candidate “Scale Projects” Selection Criteria

Community Energy Plan
� High Density Urban Villages � Core renewal neighborhoods � Commercial or Research Parks � Major retail clusters � Greenfield Smart Growth � Sports and Recreation Centers � Transit hubs/neighbourhoods � Academic Campuses � Military Bases � (Industrial Parks)
Typical Scale Projects

Community Energy Plan
Task Force Recommendations High Priority Candidates
East Falls Church
Rosslyn
Columbia Pike
Crystal City
Decision-Grade IEMPs Necessary* *IEMP=Integrated Energy Master Plan

Community Energy Plan
Scale Project Additional Candidates
Neighborhoods � Arlington Mill � Ballston � Courthouse � Long Bridge Park � North Ten Block � Pentagon City � Potomac Yard � Shirlington � Virginia Hospital Center � Wastewater Plant � Aquatic Center
Hosted � DoD Fort Myer � DoD Pentagon � Reagan National Airport

Arlington Community Energy Plan District Energy in Existing Neighborhoods
Arlington, Virginia July 1st 2010

Community Energy Plan
Combined Heat & Power Wide Range of Share
High Potential for Efficiency Gains
USA USA

Community Energy Plan
What is District Energy?
� Distribution to many homes and buildings
� Closed network of highly insulated pipes
� Optimized energy supply from multiples sources � Combined Heat & Power � Boilers/Furnaces � Absorption Chillers � Electric Chillers � Solar and Biomass � Waste heat recovery
� Typically operated by dedicated DE-Utility Widely deployed proven technology
Centralized supply and delivery � Heating � Cooling � Domestic hot water

Community Energy Plan
� Property Owner/Developer � Reduced building investment � Frees investment for enhanced efficiency � More marketable space � Reduced maintenance costs � Investment opportunity in DE-utility
� Property User � Equal or lower overall energy costs � Less volatile energy costs � Equal or greater supply quality
� Community � Reduced environmental impact � Increased supply security � Fuel flexibility � Peak load reduction may reduce tariff increases � Can migrate DE benefits to lower density areas � Investment opportunity in DE-utility
Benefits of District Energy

Community Energy Plan
� DE-Utility � Profitable retail sales of heating and cooling � Grid sales of clean and renewable electricity � Fuel flexibility - extension to biofuels , fuel oil and waste heat
recovery � Greenhouse gas credits � Saleable expertise for similar projects elsewhere
� Gas Utility Opportunity from DE � Familiar business model � Business diversification � Higher sales volumes – heating, cooling, grid sales � Higher than average margins � Higher customer intimacy
� Electric Utility Opportunity from DE � Business diversification � Low-carbon electricity to meet RPS requirements � Higher than utility margins � Higher customer intimacy
Benefits of District Energy

Community Energy Plan
Phase 0: Current Starting Point
Higher Density Scale Projects Single Building Supply to District Energy
Rooftop H/C-Unit Boiler/Furnace Chiller
Establish Integration “Rules”

Community Energy Plan
Phase 1: Make Buildings DE-ready & start interconnecting
Higher Density Scale Projects Single Building Supply to District Energy
Rooftop H/C-Unit Boiler/Furnace Chiller Heat exchanger Cool exchanger
X X
Efficiency retrofits and early integration

Community Energy Plan
Phase 2: Add Co-generation & Absorption chillers to create Supply Islands
Higher Density Scale Projects Single Building Supply to District Energy
Rooftop H/C-Unit Boiler/Furnace Chiller Heat exchanger Cool exchanger CHP generator Absorption Chiller
X X
Preparing for Wider Integration

Community Energy Plan
Phase 3: Interconnect Islands maybe adding Central Generation
Higher Density Scale Projects Single Building Supply to District Energy
Completing Neighborhood System

Community Energy Plan
Phase 4: Interconnect Scale Projects
Integrating Neighborhoods
Completing Community System
Scale Project 1
Scale Project 2
Scale Project 3

Arlington Community Energy Plan Energy Performance Verification
Arlington, Virginia July 1st 2010

Community Energy Plan
Lifetime Performance Verificiation Energy Performance Labeling
� Certifies performance � Available when sold or rented � Low cost or no-cost � Energy and greenhouse gas � Current state of building � Not historic or similar structures � Displayed in public buildings � Independent certification � Access to discount mortgage � Voluntary or mandatory
approaches possible � Candidate enabling project
Create Market Driven Improvement

Community Energy Plan
Benefits of Winning! Competitive-Sustainable-Flexible
New Relationships – New Rules
Commercial Commercial
•Reduced costs •Rental values •Low vacancy •Productivity
•Reduced costs •Rental values •Low vacancy •Productivity
Banks Banks
•Collateral Value •Credit worthiness •Collateral Value •Credit worthiness
Resident Resident
•Lower utility costs •Resale value •Employment •Quality of life
•Lower utility costs •Resale value •Employment •Quality of life
Developer Developer
•Premium prices •Low carrying time •Reduced investment
•Premium prices •Low carrying time •Reduced investment
•Environmental impact •Attractive development •Competitive energy services •New business opportunities
•Environmental impact •Attractive development •Competitive energy services •New business opportunities
Utility Utility
•Higher returns •Emissions reduction •Customer intimacy •Diversification
•Higher returns •Emissions reduction •Customer intimacy •Diversification
•Tailored energy •Lower costs •Sell waste energy •Reduced CO2 risks
•Tailored energy •Lower costs •Sell waste energy •Reduced CO2 risks
Industry Industry
Academic Academic
•Sustainable curriculum •Lower costs •Student magnet •Global network
•Sustainable curriculum •Lower costs •Student magnet •Global network

Community Energy Plan
� What Impact is energy and climate change having on your current activities related to property development and neighborhood design?
� What aspects of new local energy supply and distribution are in current planning?
� How are energy-related aspects affecting overall competitiveness?
� What would you like to see included in Arlington’s Community Energy Plan including financial and other incentives?
� What are areas of possible concern?
Discussion and input

Community Energy Plan
For more information :
www.arlingtonva.us/energyplan
Contact:
Rich Dooley – CEP Project Manager

Thank You