Embed Size (px)
Citation preview

Arizona Youth Tobacco Survey 2007 Report
Prepared by the Evaluation, Research and Development Unit
The University of Arizona
Funded by the Arizona Department of Health Services
June 2008
Evaluation, Research and Development Unit The University of Arizona
PO Box 210462 Tucson, AZ 85721-0462 Phone: (520) 318-7259 Fax: (520) 318-7252
www.evalrdu.org

Thanks & Appreciation to
The students who participated in the survey
and
The teachers and principals who facilitated their participation
Suggested citation
Malter, F.; Olderbaek, S.; Walsh, M. (2008). Arizona Youth Tobacco Survey – Report 2007. Evaluation, Research and Development Unit, The University of Arizona, Tucson

Table of Contents
1. Executive Summary ................................................................................................................ 1 Prevalence of Any Tobacco Use............................................................................................. 1 Prevalence of Cigarette Smoking............................................................................................ 1 Exposure to Secondhand Smoke............................................................................................. 1 Cessation................................................................................................................................. 2 Access to Cigarettes................................................................................................................ 2 Smoking and the Social Environment (including Media Influence) ...................................... 2
2. Introduction............................................................................................................................. 3 3. Methodology........................................................................................................................... 4
3.1. Instrument ....................................................................................................................... 4 3.2. Sampling Methodology................................................................................................... 4 3.3. Response Rates ............................................................................................................... 4 3.4. Weighting and Analysis.................................................................................................. 5 3.5. Sample Demographics .................................................................................................... 5 3.6. Recalculation of YTS 2000, 2003, and 2005.................................................................. 7 3.7. Missing Data ................................................................................................................... 7 3.8. Survey Limitations.......................................................................................................... 7
4. Results and Trends.................................................................................................................. 9 4.1. Prevalence of Tobacco Use............................................................................................. 9
Ever Tobacco Use ................................................................................................................... 9 Current Tobacco Use ............................................................................................................ 10 Comparing Arizona Rates with National Rates .................................................................... 11 Tobacco Use by Grade.......................................................................................................... 13 Tobacco Use by Gender........................................................................................................ 13 Tobacco Use by Ethnicity..................................................................................................... 15
4.2. Prevalence of Cigarette Smoking.................................................................................. 17 Cigarette Smoking by Middle and High School ................................................................... 17 Cigarette Smoking by Gender............................................................................................... 18 Cigarette Smoking by Ethnicity............................................................................................ 19 Cigarette Smoking by Grade................................................................................................. 21
4.3. Prevalence of Alternative Forms of Tobacco ............................................................... 22 Hookah.................................................................................................................................. 22 Kretek.................................................................................................................................... 22 Pipe ....................................................................................................................................... 23
4.4. Exposure to Secondhand Smoke................................................................................... 23 Secondhand Smoke Exposure in Rooms and Cars ............................................................... 24 Rules about Smoking in the Home ....................................................................................... 27
4.5. Cessation....................................................................................................................... 28 4.6. Access to Cigarettes...................................................................................................... 30 4.7. Media Influence ............................................................................................................ 35 4.8. Smoking and the social environment............................................................................ 36
5. Conclusions........................................................................................................................... 38 Appendix A................................................................................................................................... 40
Availability of Arizona YTS items across survey years....................................................... 40

Appendix B ................................................................................................................................... 41 Arizona 2007 YTS Survey Questionnaire and basic response rates (CDC outcome indicators are included in parenthesis) .................................................................................................. 41

List of Tables
Table 1. YTS 2007 School and Student Response Rates.......................................................... 4
Table 2. Gender Distribution .................................................................................................... 5
Table 3. Age Distribution.......................................................................................................... 5
Table 4. Grade Distribution ...................................................................................................... 6
Table 5. Ethnicity Distribution.................................................................................................. 6
Table 6. Trends in Ever Kretek Use by Middle and High School .......................................... 22
Table 7. Trends in Current Pipe Use by Middle and High School ......................................... 23
Table 8. Percent of Ever Cigarette Smokers Who Have Tried a Nicotine Patch or Gum to Help Them Quit Smoking............................................................................................................. 30
Table 9. Classes discouraging tobacco used and perceived effectiveness.............................. 37
Table 10. Interaction with health care providers....................................................................... 37
List of Figures
Figure 1. Ever Tobacco Use by Middle and High School.......................................................... 9
Figure 2. Trends in Ever Tobacco Use Among Middle School and High School Students .... 10
Figure 3. Current Tobacco Use by Middle and High School................................................... 10
Figure 4. Trends in Current Tobacco Use Among Middle School and High School Students 11
Figure 5. Current Tobacco Use: Comparing Arizona to National Rates Among Middle School Students 12
Figure 6. Current Tobacco Use: Comparing Arizona to National Rates Among High School Students 12
Figure 7. Ever and Current Tobacco Use by Grade ................................................................. 13
Figure 8. Ever Tobacco Use by Gender Among Middle School Students............................... 13
Figure 9. Ever Tobacco Use by Gender Among High School Students .................................. 14
Figure 10. Current Tobacco Use by Gender Among Middle School Students ...................... 14
Figure 11. Current Tobacco Use by Gender Among High School Students.......................... 15
Figure 12. Trends in Ever Tobacco use by Ethnicity and by Middle and High School......... 16
Figure 13. Current Tobacco Use by Ethnicity and by Middle and High School ................... 16
Figure 14. Trends in Ever, Current and Frequent Cigarette Smoking by Middle and High School 17
Figure 15. Trends in Ever Cigarette Smoking by Gender and by Middle and High School.. 18

Figure 16. Trends in Current Cigarette Smoking by Gender and by Middle and High School 18
Figure 17. Trends in Frequent Cigarette Smoking by Gender and by Middle and High School 19
Figure 18. Trends in Ever Cigarette Smoking by Ethnicity and by Middle and High School19
Figure 19. Current Cigarette Smoking by Ethnicity and by Middle and High School .......... 20
Figure 20. Frequent Cigarette Smoking by Ethnicity and by Middle and High School ........ 20
Figure 21. Ever, Current and Frequent Cigarette Smoking by Grade.................................... 21
Figure 22. Ever Hookah Use by Grade .................................................................................. 22
Figure 23. Exposure to Secondhand Smoke in Rooms and Cars by Middle and High School 24
Figure 24. Trends in Exposure to Secondhand Smoke in Rooms and Cars, Comparing Middle School Students Across Years.......................................................................................... 24
Figure 25. Trends in Exposure to Secondhand Smoke in Rooms and Cars, Comparing High School Students Across Years ...................................................................................................... 25
Figure 26. Exposure to Secondhand Smoke in Rooms and Cars, Comparing Those Who Live with a Smoker and Those Who do Not......................................................................................... 25
Figure 27. Trends in Exposure to Secondhand Smoke in Rooms and Cars Among Those Who Live with a Smoker .............................................................................................................. 26
Figure 28. Trends in Exposure to Secondhand Smoke in Rooms and Cars Among Those Not Living with a Smoker.................................................................................................................... 26
Figure 29. Rules About Smoking in the Home ...................................................................... 27
Figure 30. Rules About Smoking in the Home by Presence of a Smoker ............................. 27
Figure 31. Percent of Current Smokers Wanting to Quit Smoking Cigarettes ...................... 28
Figure 32. Percent of Current Smokers Who Think They Could Quit Smoking Cigarettes.. 28
Figure 33. Percent of Smokers Who Reported a Quit Attempt During the Past 12 Months.. 29
Figure 34. Percent of Student Knowing Where to Get Help to Quit Smoking ...................... 29
Figure 35. Percent of Ever Tobacco Users Who Participated in a Program to Help Them Quit Tobacco 30
Figure 36. How Current Smokers Under 18 Reported Getting Cigarettes............................. 31
Figure 37. Store Types Where Current Smokers Under 18 Who Bought Cigarettes from a Store During the Past 30 Days Reported Buying Them ............................................................... 32
Figure 38. Trends in Store Types Where Current Smokers Under 18 Who Bought Cigarettes Reported Buying During the Past 30 Days, Comparing Middle School Students Across Years . 33
Figure 39. Trends in Store Types Where Current Smokers Under 18 Who Bought Cigarettes Reported Buying During the Past 30 Days, Comparing High School Students Across Years.... 33

Figure 40. Trends in Proof of Age Request and Sale Refusal to Current Smokers Under 18 Who Bought Cigarettes From a Store During the Past 30 Days, Comparing Middle School Students Across Years .................................................................................................................. 34
Figure 41. Trends in Proof of Age Request and Sale Refusal to Current Smokers Under 18 Who Bought Cigarettes From a Store During the Past 30 Days, Comparing High School Students Across Years .................................................................................................................. 34
Figure 42. Trends in Media Exposure .................................................................................... 35
Figure 43. Percent of Students Whose Parents Have Discussed the Dangers of Using Tobacco Often or Very Often ....................................................................................................... 36
Figure 44. Percent of Students Who Reported None of Their Closest Friends Smoke ......... 36

Definitions of frequently used terms
Tobacco Use
• Ever Users: Students who reported ever trying a tobacco product (i.e. cigarettes, smokeless tobacco, cigars or cigarillos, or bidis) in their lifetime.
• Current Users: Students who reported use of a tobacco product (i.e. cigarettes, smokeless tobacco, cigars or cigarillos, or bidis) at least once in the 30 days prior to participating in the survey.
Cigarette Smoking
• Ever Smoker: Students who reported ever smoking a cigarette, even one or two puffs, in their lifetime.
• Current Smoker: Students who reported smoking a cigarette at least once in the 30 days prior to participating in the survey.
• Frequent Smoker: Students who reported smoking cigarettes on 20 or more days out of the past 30 days prior to participating in the survey.
• Never Smoker: Students who reported they have never tried smoking, even one or two puffs, during their lifetime.
Tobacco Products
• Bidi: A cigarette made by rolling tobacco by hand in a dried leaf from the tendu tree (a member of the ebony family). Most bidis are made in India and come in different flavors1.
• Cigarette: A narrow, short roll of finely cut, cured tobacco for smoking, usually wrapped in thin white paper2.
• Cigar: A cure cylindrical roll of tobacco leaves for smoking2. • Cigarillo: A small, thin cigar2. • Kretek: A cigarette made of Indonesian tobacco and cloves3. • Pipe: A tube with a small bowl at one end; used for smoking tobacco4. • Hookah (also called ‘Shisha’ or ‘Narghile’): A water pipe originating from eastern
Mediterranean cultures; used for smoking flavored and sweetened, mostly moist tobacco5
1 M.D. Anderson Cancer Center – General Cancer Info: Glossary of Terms A-B. Retrieved May 9, 2008, from http://www.mdanderson.org/patients_public/about_cancer/display.cfm?id=3354011c-72df-11d4-aebd00508bdcce3a&method=displayfull 2 Tobacco-Free QC Glossary of Terms. Retrieved May 9, 2008, from http://www.tobaccofreeqc.org/youth/glossary.php 3 Dictionary.com Unabridged (v 1.1), Based on the Random House Unabridged Dictionary, © Random House, Inc., Retrieved May 9, 2008, from 2006. http://dictionary.reference.com/browse/kretek 4 Wordnet. Retrieved May 9, 2008, from http://wordnet.princeton.edu/perl/webwn?s=tobacco%20pipe
• Smokeless Tobacco: Tobacco that is not smoked but used in another form such as chewing tobacco, snus or snuff6.
5 Smith-Simone, S. et al. 2008. Waterpipe tobacco smoking: Knowledge, attitudes, beliefs and behavior in two U.S. samples. Nicotine and Tobacco Research. Vol. 10 (2), 393-398 6 MedicinNet.com Cancer Causes Glossary of Terms. Retrieved May 9, 2008, from http://www.medicinenet.com/cancer_causes/glossary.htm
Arizona Youth Tobacco Survey Report 2007
Evaluation, Research and Development Unit, The University of Arizona 1
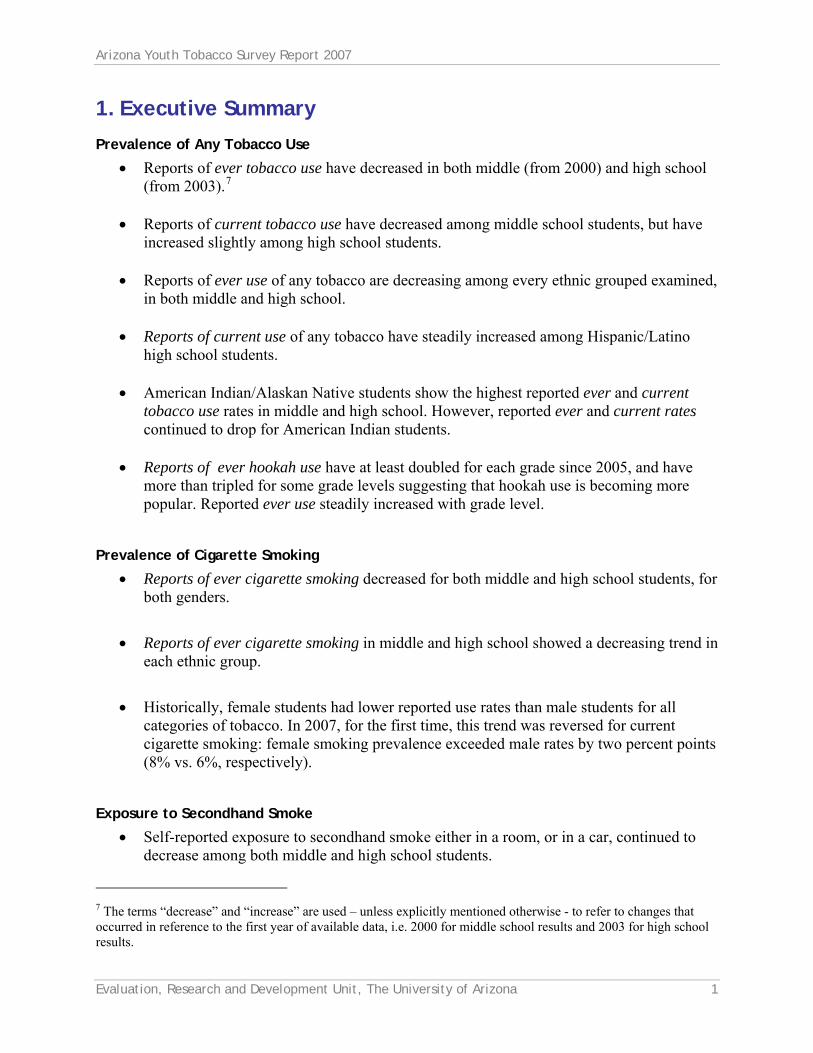
1. Executive Summary
Prevalence of Any Tobacco Use
• Reports of ever tobacco use have decreased in both middle (from 2000) and high school (from 2003).7
• Reports of current tobacco use have decreased among middle school students, but have
increased slightly among high school students. • Reports of ever use of any tobacco are decreasing among every ethnic grouped examined,
in both middle and high school.
• Reports of current use of any tobacco have steadily increased among Hispanic/Latino high school students.
• American Indian/Alaskan Native students show the highest reported ever and current
tobacco use rates in middle and high school. However, reported ever and current rates continued to drop for American Indian students.
• Reports of ever hookah use have at least doubled for each grade since 2005, and have
more than tripled for some grade levels suggesting that hookah use is becoming more popular. Reported ever use steadily increased with grade level.
Prevalence of Cigarette Smoking
• Reports of ever cigarette smoking decreased for both middle and high school students, for both genders.
• Reports of ever cigarette smoking in middle and high school showed a decreasing trend in each ethnic group.
• Historically, female students had lower reported use rates than male students for all categories of tobacco. In 2007, for the first time, this trend was reversed for current cigarette smoking: female smoking prevalence exceeded male rates by two percent points (8% vs. 6%, respectively).
Exposure to Secondhand Smoke
• Self-reported exposure to secondhand smoke either in a room, or in a car, continued to decrease among both middle and high school students.
7 The terms “decrease” and “increase” are used – unless explicitly mentioned otherwise - to refer to changes that occurred in reference to the first year of available data, i.e. 2000 for middle school results and 2003 for high school results.

Arizona Youth Tobacco Survey Report 2007
Evaluation, Research and Development Unit, The University of Arizona 2
• About three quarters of middle and high school students reported living in homes where
smoking was not allowed anywhere in the home.
Cessation
• The percent of current smokers in middle school who expressed a desire to quit has been decreasing since 2000.
• The majority of current smokers in middle and high school (e.g. 84% for middle school
and 85% for high school) reported they could quit smoking if they wanted • The rate of current smokers in middle school who reported having made a quit attempt
has decreased steadily.
• The rate of current smokers who reported knowing where to get help for quitting smoking steadily declined for both middle and high school.
• There was a substantial increase in the rate of current smokers who reported using a
nicotine patch or gum to help them quit smoking among both middle and high school students.
• Only 17 percent of students who are current smokers reported that they were asked if
they smoked by health care professionals.
Access to Cigarettes
• Only one out of four current smokers under the age of 18 reported that they were asked to show proof of age when attempting to buy cigarettes.
Smoking and the Social Environment (including Media Influence)
• Only eight percent of all students reported that their parents or guardians had discussed the dangers of tobacco use with them.
• Sixty percent of all surveyed students reported that none of their closest friends smoke.

Arizona Youth Tobacco Survey Report 2007
Evaluation, Research and Development Unit, The University of Arizona 3
2. Introduction The 2007 Arizona Youth Tobacco Survey (YTS) was completed in the spring of 2007 and is the fourth in a series of biannual school-based tobacco-focused surveys first implemented in the spring of 2000. The survey is designed to help monitor trends in tobacco use among public school students in grades 6 through 12 and to compare changes in rates over time. The survey also collects data on topics including: tobacco use; tobacco-related knowledge, attitudes and beliefs; access to tobacco products; exposure to environmental tobacco smoke; initiation and cessation; influence of family, friends and the media; and social, school and community interventions.

Arizona Youth Tobacco Survey Report 2007
Evaluation, Research and Development Unit, The University of Arizona 4
3. Methodology
3.1. Instrument The Arizona Youth Tobacco Survey uses a core set of questions developed by the Office on Smoking and Health (OSH) at the Centers for Disease Control and Prevention (CDC) to assist states with their tobacco control efforts. For the high school sample, YTS was administered simultaneously with the Youth Risk Behavior Survey in the spring of 2007 as part of a collaborative effort between the Arizona Department of Education (ADE) and the Arizona Department of Health Services (ADHS). The 2007 Arizona YTS contains 98 multiple-choice questions, 61 of which are core questions from the CDC’s Youth Tobacco Survey. The questions cover prevalence, sources of tobacco products, attitudes and beliefs, second-hand smoke, media exposure, social influences. Results from the Arizona YTS can therefore be compared with results from other states and the National Youth Tobacco Survey conducted by the CDC. (See Appendix B for questionnaire and response rates for each item.)
3.2. Sampling Methodology The CDC and a subcontractor, ORC Macro, devised the sampling methods for the 2007 Arizona YTS. Separate middle school and high school samples were selected from all public and charter schools in Arizona. The objective of the samples was to obtain 95% confidence limits of approximately ± 5% around key variables. There were four separate samples: (1) district high school; (2) district middle school; (3) charter high school and (4) charter middle school. All schools with more than three students in grades 6-8 were included in the middle-school sampling frame. All schools with more than three students in grades 9-12 were included in the high-school sampling frame. A two-stage cluster sample design was used to produce a representative sample of middle school students in grades 6-8 and high school students in grades 9-12. All students within the selected class were asked to participate.
3.3. Response Rates
Table 1. YTS 2007 School and Student Response Rates
YTS 2007 Student and School Response Rates
Schools Students
Selected Participated Percent Selected Participated Percent
Overall Response
Rate
District Middle 39 37 95% 2609 2283 88% 83%
Charter Middle 34 27 79% 1411 1197 85% 67%
District High 40 38 95% 2021 1825 90% 86%
Charter High 43 42 98% 1561 1192 76% 75%
Total 156 144 92% 7602 6497 85% 78%
Data Source: ORC Macro, AZ YTS 2007
Arizona Youth Tobacco Survey Report 2007
Evaluation, Research and Development Unit, The University of Arizona 5
3.4. Weighting and Analysis A weighting system was devised based on (a) the probabilities of selecting the school and selecting the classroom, (b) a non-response adjustment factor for school size, (c) a class adjustment factor, calculated by school, (d) a student-level non-response adjustment, calculated by class, and (e) a post-stratification adjustment factor, calculated by gender, grade and race. The weighting system was designed to allow for statewide inferences concerning tobacco use risk behaviors for all public and charter school students in grades 6-8 and grades 9-12.
The analyses presented in this report were calculated using SPSS version 14.0 and the sampling weights. In compliance with the survey methodology, all percent findings reported in this document are based on weighted data, and all frequency counts (e.g. sample sizes) are based on unweighted data.
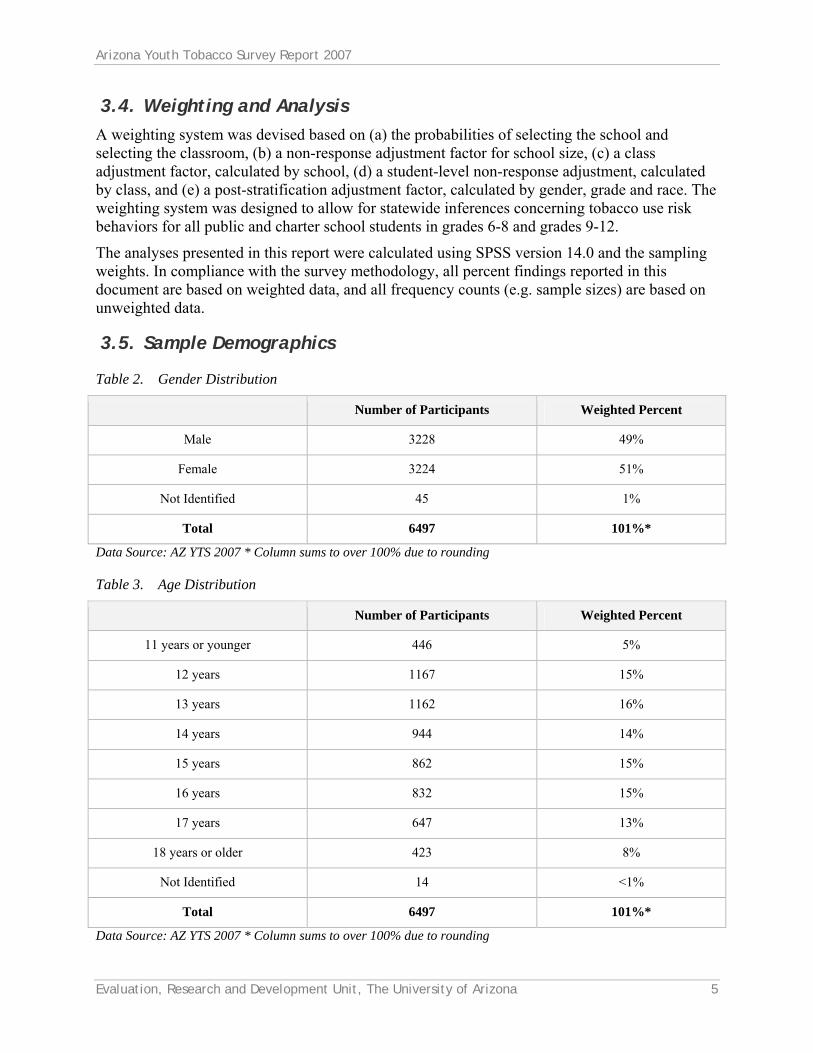
3.5. Sample Demographics
Table 2. Gender Distribution
Number of Participants Weighted Percent
Male 3228 49%
Female 3224 51%
Not Identified 45 1%
Total 6497 101%*
Data Source: AZ YTS 2007 * Column sums to over 100% due to rounding
Table 3. Age Distribution
Number of Participants Weighted Percent
11 years or younger 446 5%
12 years 1167 15%
13 years 1162 16%
14 years 944 14%
15 years 862 15%
16 years 832 15%
17 years 647 13%
18 years or older 423 8%
Not Identified 14 <1%
Total 6497 101%*
Data Source: AZ YTS 2007 * Column sums to over 100% due to rounding
Arizona Youth Tobacco Survey Report 2007
Evaluation, Research and Development Unit, The University of Arizona 6
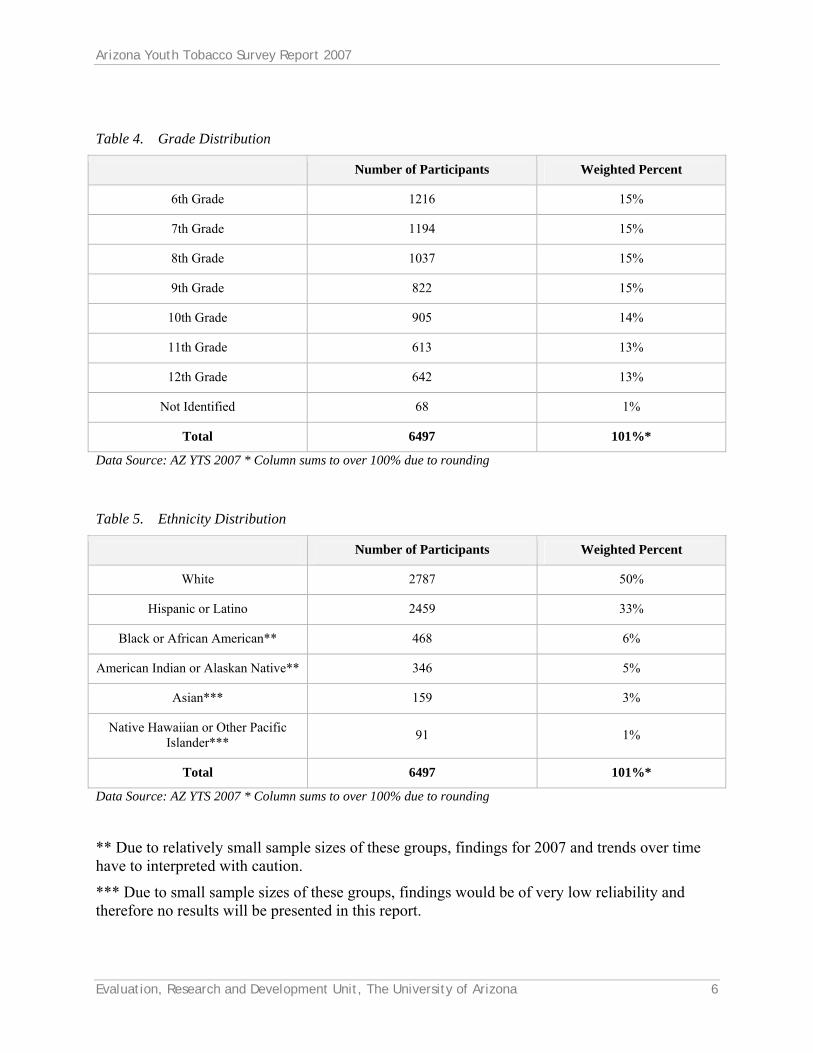
Table 4. Grade Distribution
Number of Participants Weighted Percent
6th Grade 1216 15%
7th Grade 1194 15%
8th Grade 1037 15%
9th Grade 822 15%
10th Grade 905 14%
11th Grade 613 13%
12th Grade 642 13%
Not Identified 68 1%
Total 6497 101%*
Data Source: AZ YTS 2007 * Column sums to over 100% due to rounding
Table 5. Ethnicity Distribution
Number of Participants Weighted Percent
White 2787 50%
Hispanic or Latino 2459 33%
Black or African American** 468 6%
American Indian or Alaskan Native** 346 5%
Asian*** 159 3%
Native Hawaiian or Other Pacific Islander*** 91 1%
Total 6497 101%*
Data Source: AZ YTS 2007 * Column sums to over 100% due to rounding
** Due to relatively small sample sizes of these groups, findings for 2007 and trends over time have to interpreted with caution.
*** Due to small sample sizes of these groups, findings would be of very low reliability and therefore no results will be presented in this report.

Arizona Youth Tobacco Survey Report 2007
Evaluation, Research and Development Unit, The University of Arizona 7
3.6. Recalculation of YTS 2000, 2003, and 2005 Because this report makes comparisons over time, findings on ever and current tobacco use for 2000, 2003 and 2005 were recalculated to include only those tobacco products asked about in 2007.
• Ever tobacco use: cigarettes, cigars, cigarillos, smokeless tobacco, bidis. • Current tobacco use: cigarettes, cigars, cigarillos, smokeless tobacco, bidis.
As a result, the 2000, 2003 and 2005 ever and current tobacco use rates presented in this report are less than or equal to those reported earlier in the 2000, 2003 and 2005 Arizona Youth Tobacco Survey Reports.
The ever and current tobacco use rates presented in this report represent the standard way of measuring tobacco use. In Arizona, however, pipe and hookah use are on the rise. This means that the ever and current tobacco use rates presented here are underestimates. For example, respondents who have used a hookah, but no other form of tobacco, will not be counted as the ever or current users.
3.7. Missing Data For all analyses in this report, including rates for 2000, 2003, and 2005, participants who had missing data were excluded from analyses. Ever and current tobacco use were computed by integrating responses to several items. (For details, see “Definition of frequently used terms.”) If a respondent replied "Yes" to any applicable question, and had missing data on some of the other items, the person was coded an ever or current tobacco user. However, if a respondent replied "No" to some of the applicable questions and did not respond to some others, the case was coded as ‘missing’ and excluded from further analysis. Only participants who responded that they had not used any tobacco product were coded as never user or not current user, respectively. Due to the coding of missing data, some of the rates in this report may be slightly different from those presented in previous YTS reports where missing data was handled in different ways.
3.8. Survey Limitations There are important limitations to school-based surveillance methodology. First, the prevalence rates presented here are based on self-reported behaviors and may be subject to social desirability. Even in a confidential survey, students may be disinclined to describe themselves in completely truthful ways. In addition, not all Arizona youth are represented by the findings from the survey. Rather, YTS data are representative of the district and charter school student population. The following groups are not included in the survey and may be at a high risk for tobacco use, possibly causing the rates in this report to be underestimates of overall Arizona youth smoking rates:
• Young people who drop out of school (approximately 6.4% of Arizona high school students in the 2005- 2006 school year8) have higher rates of tobacco use than adolescents who are in school.
8 Dropout Rate Report: 2006 (http://www.azed.gov/researchpolicy/DropoutInfo/2005-2006/DropoutReport2006v2.pdf on February 18, 2008

Arizona Youth Tobacco Survey Report 2007
Evaluation, Research and Development Unit, The University of Arizona 8
• Young people in juvenile correctional facilities, special schools (vocational education, blind, deaf), or private schools.
• Students who frequently miss school may be under-represented.
In addition, the YTS survey does not provide data on family background characteristics, such as parental income, education levels or smoking status, and other contextual variables that may be linked with tobacco use.
Finally, all findings presented here were derived from self-report only. Self-report does not necessarily correspond with actual behavior.
Arizona Youth Tobacco Survey Report 2007
Evaluation, Research and Development Unit, The University of Arizona 9
4. Results and Trends
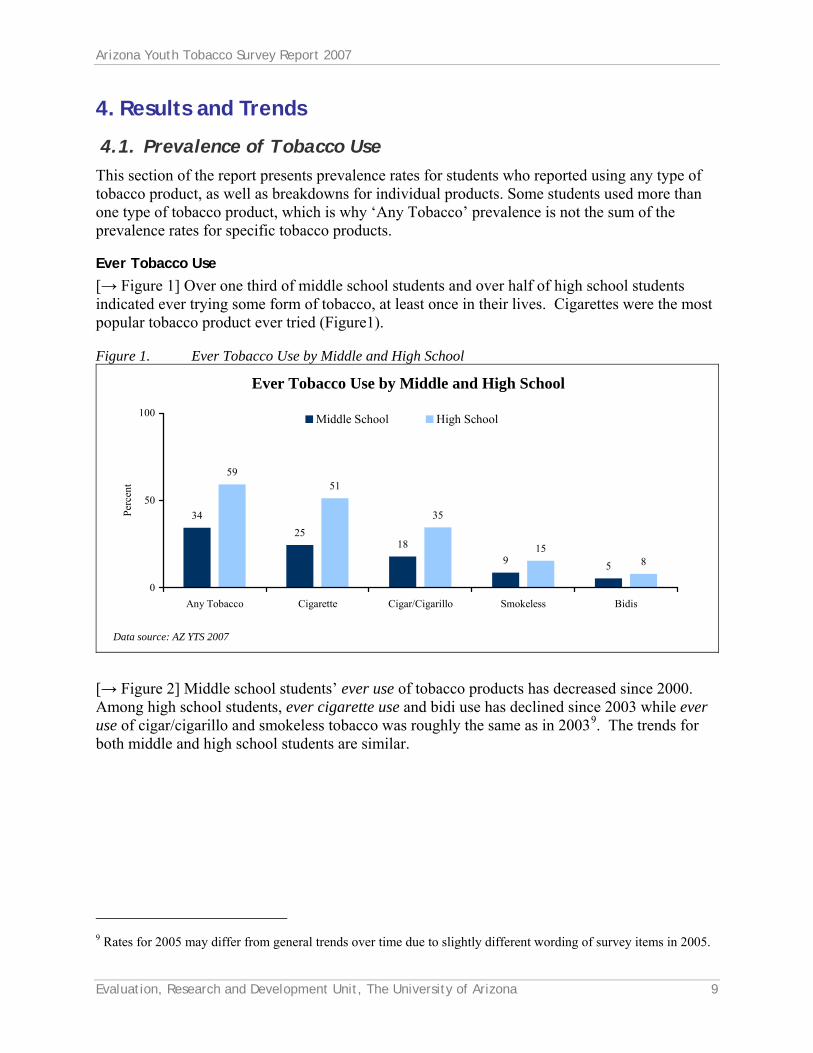
4.1. Prevalence of Tobacco Use This section of the report presents prevalence rates for students who reported using any type of tobacco product, as well as breakdowns for individual products. Some students used more than one type of tobacco product, which is why ‘Any Tobacco’ prevalence is not the sum of the prevalence rates for specific tobacco products.
Ever Tobacco Use [→ Figure 1] Over one third of middle school students and over half of high school students indicated ever trying some form of tobacco, at least once in their lives. Cigarettes were the most popular tobacco product ever tried (Figure1).
Figure 1. Ever Tobacco Use by Middle and High School
Ever Tobacco Use by Middle and High School
3425
189 5
5951
35
158
0
50
100
Any Tobacco Cigarette Cigar/Cigarillo Smokeless Bidis
Data source: AZ YTS 2007
Perc
ent
Middle School High School
[→ Figure 2] Middle school students’ ever use of tobacco products has decreased since 2000. Among high school students, ever cigarette use and bidi use has declined since 2003 while ever use of cigar/cigarillo and smokeless tobacco was roughly the same as in 20039. The trends for both middle and high school students are similar.
9 Rates for 2005 may differ from general trends over time due to slightly different wording of survey items in 2005.

Arizona Youth Tobacco Survey Report 2007
Evaluation, Research and Development Unit, The University of Arizona 10
Figure 2. Trends in Ever Tobacco Use Among Middle School and High School Students
Data Source: AZ YTS 2000, 2003, 2005, 2007
Current Tobacco Use [→ Figure 3] Fewer than 1 in 5 middle school students and 1 in 3 high school students reported current use of any tobacco product. Cigarettes were the most popular tobacco products used, closely followed by cigars/cigarillos.
Figure 3. Current Tobacco Use by Middle and High School
Current Tobacco Use by Middle and High School
137 5 3 5
29
1915
6 7
0
50
100
Any Tobacco Cigarette Cigar/Cigarillo Smokeless Bidis
Data source: AZ YTS 2007
Perc
ent
Middle School High School
SchoolHigh SchoolMiddle School

Arizona Youth Tobacco Survey Report 2007
Evaluation, Research and Development Unit, The University of Arizona 11
[→ Figure 4] Since 2000, current use of any tobacco product has declined among middle school students, presumably because of the decline in cigarette use. Cigars, smokeless tobacco and bidis showed little change for middle school students. Prevalence rates among high school students, however, show a different trend. Overall, current use of any tobacco among high school students has increased since 2003, due to an increase in use of non-cigarette tobacco products such as smokeless tobacco, bidis, and cigar/cigarillos.
Figure 4. Trends in Current Tobacco Use Among Middle School and High School Students
Perc
ent
Data Source: AZ YTS 2000, 2003, 2005, 2007
Comparing Arizona Rates with National Rates The national any tobacco category is composed of the same variables used in the definition of any tobacco for this report (e.g. cigarettes, cigar/cigarillo, smokeless, and bidis) with the addition of one more tobacco product, kreteks. Unfortunately, the YTS did not ask about current kretek use in Arizona, so this tobacco product was left out of the any tobacco category. As such, any tobacco use rates in Arizona may have been slightly higher if current kretek use had been included.
[→ Figure 5] For middle school students overall, the national rates show steeper declines than do Arizona’s rates. Use of smokeless tobacco in Arizona has generally been lower than national rates, but the national rate has declined, while Arizona’s rate has held steady, so that in 2006 the national rate was the same as Arizona’s 2007 rate (3%). Use of cigars/cigarillos appeared to lose popularity on the national level while no change could be observed for Arizona middle school youth.
SchoolHigh SchoolMiddle School

Arizona Youth Tobacco Survey Report 2007
Evaluation, Research and Development Unit, The University of Arizona 12
Figure 5. Current Tobacco Use: Comparing Arizona to National Rates Among Middle School Students
Data Source: AZ YTS 2000, 2003, 2005, 2007; NYTS 2004, 2006
[→ Figure 6] Arizona is showing an increase in prevalence rates among high school students for the categories of any tobacco and cigars/cigarillos, while nationally the prevalence appears to be decreasing. For smokeless tobacco, Arizona’s trends are similar to the national trends. For cigarettes, Arizona’s prevalence rates remain steady, while nationally they appear to be decreasing. In 2007, bidi use was higher in Arizona than it was nationally, with no clear trend in Arizona.
Figure 6. Current Tobacco Use: Comparing Arizona to National Rates Among High School Students
Data Source: AZ YTS 2000, 2003, 2005, 2007; NYTS 2004, 2006
Any Tobacco Cigarettes Cigar/Cigarillos Smokeless Bidis
2003 2004 2005 2006 2007 2003 2004 2005 2006 2007 2003 2004 2005 2006 2007 2003 2004 2005 2006 2007 2003 2004 2005 2006 2007
0
25
Perc
ent
12
10
14
1113 12
6
98
7
8
46 5 5
5
3
2 23 3 2
4
1
5

Arizona Youth Tobacco Survey Report 2007
Evaluation, Research and Development Unit, The University of Arizona 13
Tobacco Use by Grade [→ Figure 7] Ever and current tobacco use show a steady increase with grade level. By 12th grade, about three out of four students have at least tried tobacco once.
Figure 7. Ever and Current Tobacco Use by Grade
Ever and Current Tobacco Use by Grade
18 2128 31 36
7163
564945
3225
119
0
50
100
6th 7th 8th 9th 10th 11th 12th
Data source: AZ YTS 2007
Perc
ent
Ever Tobacco Use Current Tobacco Use
Tobacco Use by Gender [→ Figure 8] Overall, ever tobacco use is consistently higher among males than females. These differences by gender become more pronounced in high school.
Among middle school students, males consistently show a higher prevalence rate than females across all products since 2000. Trends over time are similar for males and females for all categories, and generally show a downward trend.
Figure 8. Ever Tobacco Use by Gender Among Middle School Students
Data Source: AZ YTS 2000, 2003, 2005, 2007
Any Tobacco Ciga rette Ciga r/Ciga rillos Smokeless Bidis
2000 2003 2005 2007 2000 2003 2005 2007 2000 2003 2005 2007 2000 2003 2005 2007 2000 2003 2005 20070
50
100
Perc
ent 51 48
333746
40
2731
3935
312637
3126 23
25 23
1320
19 17
615
1612
610
10 7 2 7
118
16
9 6 1 5

Arizona Youth Tobacco Survey Report 2007
Evaluation, Research and Development Unit, The University of Arizona 14
[→ Figure 9] High school male students consistently report a higher prevalence rate than females across products.
Figure 9. Ever Tobacco Use by Gender Among High School Students
Data Source: AZ YTS 2000, 2003, 2005, 2007
[→ Figure 10] Overall, current tobacco use is higher among middle school males than females across all tobacco products, except for cigarette use. In 2007, for the first time, girls reported a higher prevalence rate than boys, though this appears to be driven by a steep decline in boys’ use rather than an increase in girls’.
Figure 10. Current Tobacco Use by Gender Among Middle School Students Any Tobacco Cigarette Cigar/Cigarillos Smokeless Bidis
2000 2003 2005 2007 2000 2003 2005 2007 2000 2003 2005 2007 2000 2003 2005 2007 2000 2003 2005 2007
0
50
Perc
ent
1815 15
131613 10 12
12
9
11
6
119
98 8
6 7
54 5 3
5 53 3 4
3 1 1 3
5 5
1
55 4 1 4
Data Source: AZ YTS 2000, 2003, 2005, 2007

Arizona Youth Tobacco Survey Report 2007
Evaluation, Research and Development Unit, The University of Arizona 15
[→ Figure 11] Parallel to what has been found for ever use of tobacco, the gender differences in current tobacco use are larger in high school than in middle school. The trends in current tobacco use among high school students from 2003 to 2007, however, are similar for males and females. For males, cigarette and cigar/cigarillo use are about equally high, while for females cigarettes continue to be the most commonly used product.
Figure 11. Current Tobacco Use by Gender Among High School Students
Data Source: AZ YTS 2000, 2003, 2005, 2007
Tobacco Use by Ethnicity [→ Figure 12] American Indian/Alaskan Native students reported the highest rates of ever tobacco use in both middle and high school. In 2007, White students reported the lowest rates in both middle and high school. Ever tobacco use rates show the same decreasing trend for all ethnicities, for both middle and high school.

Arizona Youth Tobacco Survey Report 2007
Evaluation, Research and Development Unit, The University of Arizona 16
Figure 12. Trends in Ever Tobacco Use by Ethnicity and by Middle and High School
Data Source: AZ YTS 2000, 2003, 2005, 2007
[→ Figure 13] American Indian/Alaskan Native students also reported the highest current tobacco use rates in both middle school and high school. In high school, Hispanic/Latino and White students showed an increase in prevalence rates. In middle school, Hispanic/Latino and White students appear to have decreasing prevalence rates. American Indian/Alaskan Native and Black/African American students show a decrease for both middle and high school when compared to 2000.
Figure 13. Current Tobacco Use by Ethnicity and by Middle and High School
Data Source: AZ YTS 2000, 2003, 2005, 2007
America n India n/Ala ska n Na tive Bla ck/Africa n Am erica n Hispa nic/La tino White
2000 2003 2005 2007 2000 2003 2005 2007 2000 2003 2005 2007 2000 2003 2005 20070
50
100
Perc
ent
6859
5550
88
76 80
45 46
35 38
68
47
59
5550
33 37
6961 64
4438
2430
59
5155
SchoolHigh SchoolMiddle School
SchoolHigh SchoolMiddle School

Arizona Youth Tobacco Survey Report 2007
Evaluation, Research and Development Unit, The University of Arizona 17
4.2. Prevalence of Cigarette Smoking This section of the report provides information on cigarette smoking only.
Cigarette Smoking by Middle and High School [→ Figure 14] Ever cigarette smoking rates decreased for both middle and high school students since 2003, as did current smoking rates for middle school students. However, frequent and current smoking rates among high school students remained roughly stable.
Figure 14. Trends in Ever, Current and Frequent Cigarette Smoking by Middle and High School
Ever, Current and Frequent Cigarette Smoking by Middle or High School
33
92
56
196
28
82
52
206
25
7 1
51
197
0
50
100
Ever Current Frequent Ever Current Frequent
Middle School High School
Data Source: AZ YTS 2003, 2005, 2007
Perc
ent
2003 2005 2007

Arizona Youth Tobacco Survey Report 2007
Evaluation, Research and Development Unit, The University of Arizona 18
Cigarette Smoking by Gender [→ Figure 15] Ever cigarette smoking for both males and females has been steadily decreasing in both middle and high school.
Figure 15. Trends in Ever Cigarette Smoking by Gender and by Middle and High School
Trends in Ever Cigarette Smoking by Gender and by Middle and High School
37 3931 35
54 58
26 30
52 53
23 26
50 53
0
50
100
Female Male Female Male
Middle School High School
Data Source: AZ YTS 2003, 2005, 2007
Perc
ent
2000 2003 2005 2007
[→ Figure 16] Current cigarette smoking rates for both male and female high school students have remained fairly stable since 2003. In 2007, for the first time, at least the same rate of female students in middle school reported smoking cigarettes than did male students. Among male middle school students, there has been a decreasing trend in current cigarette smoking since 2000.
Figure 16. Trends in Current Cigarette Smoking by Gender and by Middle and High School
Trends in Current Cigarette Smoking by Gender and by Middle and High School
11 129 9
18 20
7 9
19 21
8 6
18 19
0
50
Female Male Female Male
Middle School High School
Data Source: AZ YTS 2003, 2005, 2007
Perc
ent
2000 2003 2005 2007

Arizona Youth Tobacco Survey Report 2007
Evaluation, Research and Development Unit, The University of Arizona 19
[→ Figure 17] Frequent cigarette use has remained steady among male and female students in middle and high school.
Figure 17. Trends in Frequent Cigarette Smoking by Gender and by Middle and High School
Trends in Frequent Cigarette Smoking by Gender and by Middle and High School
2 31 2
58
1 25
7
1 26
9
0
25
Female Male Female Male
Middle School High School
Data Source: AZ YTS 2003, 2005, 2007
Perc
ent
2000 2003 2005 2007
Cigarette Smoking by Ethnicity [→ Figure 18] Hispanic/Latino and White students showed a decreasing trend in ever cigarette smoking for both middle and high school. The steepest decline appears to be occurring for Hispanic/Latino students in middle school. When compared to the baseline survey year, rates for all ethnicities in both middle and high school have declined.
Figure 18. Trends in Ever Cigarette Smoking by Ethnicity and by Middle and High School
Data Source: AZ YTS 2000, 2003, 2005, 2007
SchoolHigh SchoolMiddle School

Arizona Youth Tobacco Survey Report 2007
Evaluation, Research and Development Unit, The University of Arizona 20
[→ Figure 19] Middle school students showed a decreasing trend for current cigarette smoking across all ethnicities, except for White students among whom the trend remained steady. Current cigarette smoking rates in high school remained roughly stable for most ethnic groups, except for Black/African American students, for whom rates appear to be decreasing somewhat since 2003.
Figure 19. Current Cigarette Smoking by Ethnicity and by Middle and High School
Data Source: AZ YTS 2000, 2003, 2005, 2007
[→ Figure 20] Rates of frequent cigarette smoking are low and roughly stable for middle school students. In high school, there has been a slight increase in frequent smoking among Hispanic/Latino students, and a slight decrease amongst Black/African American students.
Figure 20. Frequent Cigarette Smoking by Ethnicity and by Middle and High School
Data Source: AZ YTS 2000, 2003, 2005, 2007
School
High School
Middle School
School
High School
Middle School

Arizona Youth Tobacco Survey Report 2007
Evaluation, Research and Development Unit, The University of Arizona 21
Cigarette Smoking by Grade [→ Figure 21] Ever, current, and frequent cigarette smoking increase steadily with grade.
Figure 21. Ever, Current and Frequent Cigarette Smoking by Grade
Ever, Current and Frequent Cigarette Smoking by Grade
11 13 1624 23
6357
474136
2314
63
1 2 2 4 6 9 12
0
50
100
6th 7th 8th 9th 10th 11th 12th
Data source: AZ YTS 2007
Perc
ent
Ever Current Frequent

Arizona Youth Tobacco Survey Report 2007
Evaluation, Research and Development Unit, The University of Arizona 22
4.3. Prevalence of Alternative Forms of Tobacco The following section presents results and trends for alternative forms of tobacco not yet discussed in this report: hookah, kreteks, and pipe.
Hookah [→ Figure 22] Ever hookah use in 2007 was 7 percent for middle school students and 22 percent for high school. Ever hookah use steadily increased across grades. Reports of ever hookah use nearly doubled from 2005 when the prevalence rate was 2 percent for middle school students and 13 percent for high school students, though some of this increase may be attributable to a slight change in how the question was asked.
Figure 22. Ever Hookah Use by Grade
Ever Hookah Use by Grade
1 2 48
11
1720
46
11 13
20
3028
0
50
6th 7th 8th 9th 10th 11th 12thData source: AZ YTS 2007, 2005
Perc
ent
2005 2007
Kretek Trends in ever kretek use have remained relatively stable for both middle and high school students.
Table 6. Trends in Ever Kretek Use by Middle and High School
2000 2003 2005 2007
Middle school 5% 4% 1% 4%
High school n.a. 8% 2% 8%
Data Source: AZ YTS 2000, 2003, 2005, 2007

Arizona Youth Tobacco Survey Report 2007
Evaluation, Research and Development Unit, The University of Arizona 23
Pipe Trends in current pipe use have remained relatively stable for middle school students. High school students seemed to be reporting a slightly increased rate of pipe use.
Table 7. Trends in Current Pipe Use by Middle and High School
2000 2003 2005 2007
Middle school 4% 5% 3% 4%
High school n.a. 5% 6% 7%
Data Source: AZ YTS 2000, 2003, 2005, 2007
4.4. Exposure to Secondhand Smoke Secondhand smoke contains cancer-causing chemicals and contributes to numerous diseases in both adults and children10. The impact of secondhand smoke on young people’s health is heightened due to their ongoing physiological development. Young people are particularly vulnerable to exposure to secondhand smoke at home and in cars, where concentrations of toxic chemicals from tobacco smoke can reach excessively high levels.
10 U.S.Department of Health and Human Services (2006). The health consequences of involuntary
exposure to tobacco smoke: a report of the Surgeon General U.S. Department of Health and Human Services, Centers for Disease Control and Prevention, Coordinating Center for Health Promotion, National Center for Chronic Disease Prevention and Health Promotion, Office on Smoking and Health.

Arizona Youth Tobacco Survey Report 2007
Evaluation, Research and Development Unit, The University of Arizona 24
Secondhand Smoke Exposure in Rooms and Cars [→ Figure 23] Overall, more high school students reported being exposed to secondhand smoke than did middle school students.
Figure 23. Exposure to Secondhand Smoke in Rooms and Cars by Middle and High School
Exposure to Secondhand Smoke in Rooms and Cars by Middle or High School
43
2531
17
54
32 36
19
0
50
100
At least one day during thepast 7 days
At least three days duringthe past 7 days
At least one day during thepast 7 days
At least three days duringthe past 7 days
In a Room In a Car
Data Source: AZ YTS 2007
Perc
ent
Middle School High School
[→ Figure 24] Exposure to secondhand smoke reported by middle school students has declined in every category from the baseline year.
Figure 24. Trends in Exposure to Secondhand Smoke in Rooms and Cars, Comparing Middle School Students Across Years
Trends in Exposure to Secondhand Smoke in Rooms and Cars, Comparing Middle School Students Across Years
49
2935
21
45
2432
17
43
2531
17
0
50
100
At least one day duringthe past 7 days
At least three days duringthe past 7 days
At least one day duringthe past 7 days
At least three days duringthe past 7 days
In a Room In a Car
Data Source: AZ YTS 2003, 2005, 2007 (MS Only)
Perc
ent
2003 2005 2007

Arizona Youth Tobacco Survey Report 2007
Evaluation, Research and Development Unit, The University of Arizona 25
[→ Figure 25] Exposure to secondhand smoke reported by high school students has declined across all categories since 2003.
Figure 25. Trends in Exposure to Secondhand Smoke in Rooms and Cars, Comparing High School Students Across Years
Trends in Exposure to Secondhand Smoke in Rooms and Cars, Comparing Middle School Students Across Years
49
29 3521
45
2432
17
4325 31
17
0
50
100
At least one day during thepast 7 days
At least three days duringthe past 7 days
At least one day during thepast 7 days
At least three days duringthe past 7 days
In a Room In a Car
Data Source: AZ YTS 2003, 2005, 2007 (MS Only)
Perc
ent
2003 2005 2007
[→ Figure 26] Students who live with a smoker reported drastically higher exposure to secondhand smoke, two to seven times higher, than those who do not live with a smoker.
Figure 26. Exposure to Secondhand Smoke in Rooms and Cars, Comparing Those Who Live with a Smoker and Those Who do Not
Exposure to Secondhand Smoke in Rooms and Cars, Comparing Those Who Live with a Smoker and Those Who do Not
71
5260
3735
14 175
0
50
100
At least one day during thepast 7 days
At least three days during thepast 7 days
At least one day during thepast 7 days
At least three days during thepast 7 days
In a Room In a Car
Data Source: AZ YTS 2007
Perc
ent
Lives With a Smoker Does Not Live With a Smoker

Arizona Youth Tobacco Survey Report 2007
Evaluation, Research and Development Unit, The University of Arizona 26
[→ Figure 27, 28] Overall, secondhand smoke exposure, both for students living with a smoker and students not living with a smoker, has declined since 2003.
Figure 27. Trends in Exposure to Secondhand Smoke in Rooms and Cars Among Those Who Live with a Smoker
Trends in Exposure to Secondhand Smoke in Rooms and Cars Among Those Who Live with a Smoker
77
58 64
42
74
5464
42
71
5260
37
0
50
100
At least one day during thepast 7 days
At least three days during thepast 7 days
At least one day during thepast 7 days
At least three days during thepast 7 days
In a Room In a Car
Data Source: AZ YTS 2003, 2005, 2007
Perc
ent
2003 2005 2007
Figure 28. Trends in Exposure to Secondhand Smoke in Rooms and Cars Among Those Not Living with a Smoker
Trends in Exposure to Secondhand Smoke in Rooms and Cars Among Those NOT Living with a Smoker
43
17 208
35
12 186
35
14 175
0
50
100
At least one day during thepast 7 days
At least three days duringthe past 7 days
At least one day during thepast 7 days
At least three days duringthe past 7 days
In a Room In a Car
Data Source: AZ YTS 2003, 2005, 2007
Perc
ent
2003 2005 2007

Arizona Youth Tobacco Survey Report 2007
Evaluation, Research and Development Unit, The University of Arizona 27
Rules about Smoking in the Home [→ Figure 29] In 2007, the majority of middle and high school students reported living in homes where smoking was not allowed anywhere in the home.
Figure 29. Rules About Smoking in the Home
Rules About Smoking in the Home
78
157
81
11 9
0
50
100
Smoking is Not AllowedAnywhere
Smoking is Allowed in SomePlaces or at Some Times
Smoking is AllowedAnywhere
Data source: AZ YTS 2007
Perc
ent
Middle School High School
[→ Figure 30] Students who live with a smoker were more likely to report that smoking was allowed in some places, at some times, or anywhere in their homes compared with students who do not live with a smoker.
Figure 30. Rules About Smoking in the Home by Presence of a Smoker
Rules About Smoking in the Home by Presence of Smoker
92
6 2
59
2318
0
50
100
Smoking is Not AllowedAnywhere
Smoking is Allowed in SomePlaces or at Some Times
Smoking is AllowedAnywhere
Data source: AZ YTS 2007
Perc
ent
Does Not Live with a Smoker Does Live with a Smoker

Arizona Youth Tobacco Survey Report 2007
Evaluation, Research and Development Unit, The University of Arizona 28
4.5. Cessation [→ Figure 31] In 2007, roughly half of all current cigarette smokers in high school expressed a desire to quit. In middle school however, there seems to be a declining trend in the reported desire to quit smoking cigarettes among current smokers.
Figure 31. Percent of Current Smokers Wanting to Quit Smoking Cigarettes
Percent of Current Smokers Wanting to Quit Smoking Cigarettes
5850 4852 53
40
53
0
50
100
Middle School High School
Data source: AZ YTS 2007, 2005, 2003, 2000 (MS only)
Perc
ent
2000 2003 2005 2007
[→ Figure 32] The large majority of current smokers reported that they believed they could quit smoking cigarettes if they wanted to.
Figure 32. Percent of Current Smokers Who Think They Could Quit Smoking Cigarettes
Percent of Current Smokers Who Think They Could Quit Smoking Cigarettes
8374
7971
8584 85
0
50
100
Middle School High School
Data source: AZ YTS 2007, 2005, 2003, 2000 (MS only)
Perc
ent
2000 2003 2005 2007

Arizona Youth Tobacco Survey Report 2007
Evaluation, Research and Development Unit, The University of Arizona 29
[→ Figure 33] Students were also asked whether they have made a quit attempt on the past 12 months. Among middle school smokers, the rate of students reporting a quit attempt has declined steadily. In 2007, about half of all high school smokers reported a quit attempt during the past 12 months. This rate has increased since 2003.
Figure 33. Percent of Smokers Who Reported a Quit Attempt During the Past 12 Months
Percent of Current Smokers Who Reported a Quit Attempt During the Past 12 Months
5752
4545 454350
0
50
100
Middle School High School
Data source: AZ YTS 2007, 2005, 2003, 2000 (MS only)
Perc
ent
2000 2003 2005 2007
[→ Figure 34] A declining rate of middle and high school smokers reported knowing where to get help to quit smoking. In 2007 for the first time, less than half of current smokers in high school reported knowing where to get help for quitting smoking.
Figure 34. Percent of Student Knowing Where to Get Help to Quit Smoking
Percent of Current Smokers Who Know Where to Get Help to Quit Smoking
5548
5347 51
43 47
0
50
100
Middle School High School
Data source: AZ YTS 2007, 2005, 2003, 2000 (MS only)
Perc
ent
2000 2003 2005 2007

Arizona Youth Tobacco Survey Report 2007
Evaluation, Research and Development Unit, The University of Arizona 30
[→ Figure 35] Similarly, in 2007 fewer middle school students reported participating in a program to help them quit when compared to 2000 and 2003, but no changes occurred between 2005 and 2007. For high school students, a steady trend was found with roughly one in ten students reporting participation in a quit program.
Figure 35. Percent of Ever Tobacco Users Who Participated in a Program to Help Them Quit Tobacco
Percent of Ever Tobacco Users Who Participated in a Program to Help Them Quit Tobacco
19 19
1114
1115
10
0
50
Middle School High School
Data source: AZ YTS 2007, 2005, 2003, 2000 (MS only)
Perc
ent
2000 2003 2005 2007
The rate of ever smokers who have tried a nicotine patch or gum has increased substantially, for both middle school as well as high school. Both rates more than doubled from 2005.
Table 8. Percent of Ever Cigarette Smokers Who Have Tried a Nicotine Patch or Gum to Help Them Quit Smoking
2005 2007
Middle school 7% 15%
High school 5% 13%
Data Source: AZ YTS 2007
4.6. Access to Cigarettes Students under 18 often acquired tobacco products through social networks such as borrowing or bumming cigarettes from friends. However, middle and high school students show different patterns of sources they reported for acquiring cigarettes.

Arizona Youth Tobacco Survey Report 2007
Evaluation, Research and Development Unit, The University of Arizona 31
[→ Figure 36] Among middle school students, the most commonly reported method of getting cigarettes was “some other way”. Students were not asked to provide further detail on this “other” category. High school students reported that their most common method of getting cigarettes was to give someone else money to buy the cigarettes for them.
Figure 36. How Current Smokers Under 18 Reported Getting Cigarettes
How Current Smokers Under 18 Reported Getting Cigarettes
32
13
2330
17
4
1622
9 94
21
0
50
100
Middle School High School
Data Source: AYS YTS 2007
Perc
ent
I got them some other way.
I gave someone else money to buy them for me.
I took them from a store or family member.
I borrowed or bummed them from someone else.
A person 18 years old or older gave them to me.
I bought them in a store such as a convenience store, supermarket, discount store, or gas station.

Arizona Youth Tobacco Survey Report 2007
Evaluation, Research and Development Unit, The University of Arizona 32
[→ Figure 37] Both high school and middle school students reported gas stations as a typical store location for purchasing cigarettes. Tobacco or smoke shops and convenience stores were also often used.
Figure 37. Store Types Where Current Smokers Under 18 Who Bought Cigarettes from a Store During the Past 30 Days Reported Buying Them
Store Types Where Current Smokers Under 18 Who Bought Cigarettes from a Store During the Past 30 Days Reported Buying Them
53
2220
37
1115
714
4 62 43 2
0
50
100
Middle School High SchoolData Source: AYS YTS 2007
Perc
ent
Other
Gas station
Tobacco or Smoke Shop
Convenience store
Grocery store
Internet
Drugstore

Arizona Youth Tobacco Survey Report 2007
Evaluation, Research and Development Unit, The University of Arizona 33
[→ Figure 38] After an unspecified “other” location, gas stations continue to be the most common type of store where middle school students reported buying cigarettes.
Figure 38. Trends in Store Types Where Current Smokers Under 18 Who Bought Cigarettes Reported Buying During the Past 30 Days, Comparing Middle School Students Across Years
Trends in Store Types Where Current Smokers Under 18 Who Bought Cigarettes Reported Buying During the Past 30 Days, Comparing Middle
School Students Across Years
209 5 5 1
60
2110
3 7 2
58
29
8 4 816
36
20
7 4 311
2
53
0
50
100
Gas Station ConvenienceStore
GroceryStore
Drugstore Tobacco orSmoke Shop
Internet Other
Data source: AZ YTS 2007, 2005, 2003 (MS Only)
Perc
ent
2000 2003 2005 2007
[→ Figure 39] Gas stations are the most often mentioned outlet for buying cigarettes among high school students, with little change over time. Convenience stores continue to be a common location where high school students reported buying cigarettes, but these outlets appeared to lose popularity since 2003. Internet sales remain fairly low, but have increased to the point that a higher proportion of students reported this method than buying from drugstores.
Figure 39. Trends in Store Types Where Current Smokers Under 18 Who Bought Cigarettes Reported Buying During the Past 30 Days, Comparing High School Students Across Years
Trends in Store Types Where Current Smokers Under 18 Who Bought Cigarettes Reported Buying During the Past 30 Days, Comparing High
School Students Across Years
38
23
5 3 1
2940
186 5
13 17
37
146 2
154
22
0
50
100
Gas Station ConvenienceStore
Grocery Store Drugstore Tobacco orSmoke Shop
Internet Other
Data source: AZ YTS 2007, 2005, 2003 (HS Only)
Perc
ent
2003 2005 2007

Arizona Youth Tobacco Survey Report 2007
Evaluation, Research and Development Unit, The University of Arizona 34
[→ Figure 40] The proportion of middle school students who were asked to show proof of age has increased overall but has fallen below the peak in 2005. Reports of sale refusals peaked in 2003, but appear roughly steady in the general trend.
Figure 40. Trends in Proof of Age Request and Sale Refusal to Current Smokers Under 18 Who Bought Cigarettes From a Store During the Past 30 Days, Comparing Middle School Students Across Years
Proof of Age Request and Sale Refusal to Current Smokers Under 18 Who Bought Cigarettes From a Store During the Past 30 Days, Comparing Middle
School Students Across Years
1320
3830
2423 2726
0
50
100
Yes, I was asked to show proof of age Yes, someone refused to sell me cigarettes because ofmy age
Data Source: AZ YTS 2000, 2003, 2005, 2007 (MS Only)
Perc
ent
2000 2003 2005 2007
[→ Figure 41] For high school smokers under the age of 18 years, reports of requests for proof of age dropped from 2003 to 2007, while sale refusals have remained roughly stable.
Figure 41. Trends in Proof of Age Request and Sale Refusal to Current Smokers Under 18 Who Bought Cigarettes From a Store During the Past 30 Days, Comparing High School Students Across Years
Proof of Age Request and Sale Refusal to Current Smokers Under 18 Who Bought Cigarettes from a Store during the Past 30 Days, Comparing High
School Students Across Years
43 38 3532 3335
0
50
100
Yes, I was asked to show proof of age Yes, someone refused to sell me cigarettes because of myage
Data Source: AZ YTS 2003, 2005, 2007 (HS Only)
Perc
ent
2003 2005 2007

Arizona Youth Tobacco Survey Report 2007
Evaluation, Research and Development Unit, The University of Arizona 35
4.7. Media Influence [→ Figure 42] Students consistently reported high rates of seeing an actor on television or in the movies smoke a cigarette. Roughly, four out of five students reported seeing an actor smoking cigarettes. Rates of seeing a tobacco ad on the internet have slightly increased with about one out of three students reporting exposure to tobacco ads on the internet. Seeing athletes smoking cigarettes was reported by a slightly lower rate of students in 2007 than previous years.
Figure 42. Trends in Media Exposure
Trends in Media Exposure
81
3124
77
3124
77
35
21
0
50
100
Saw an Actor Smoke Cigarettes Saw a Tobacco Add on theInternet
Saw an Athlete SmokeCigarettes
Data source: AZ YTS 2007, 2005, 2003
Perc
ent
2003 2005 2007

Arizona Youth Tobacco Survey Report 2007
Evaluation, Research and Development Unit, The University of Arizona 36
4.8. Smoking and the social environment [→ Figure 43] Only eight percent of all students reported that their parents or guardians had discussed the dangers of tobacco use with them. Older students were less likely to report that their parents had discussed the dangers of tobacco use with them.
Figure 43. Percent of Students Whose Parents Have Discussed the Dangers of Using Tobacco Often or Very Often
Percent of Students Whose Parents Have Discussed the Dangers of Using Tobacco Often or Very Often
1512151517
242428
0
25
50
11 yearsold or
younger
12 yearsold
13 yearsold
14 yearsold
15 yearsold
16 yearsold
17 yearsold
18 yearsold orolder
Data source: AZ YTS 2007
Perc
ent
[→ Figure 44] Among all respondents to YTS 2007, 60 percent reported that none of their closest friends smoked. A breakdown by age reveals that students become more likely to have some smoking friends as they progress through the grades.
Figure 44. Percent of Students Who Reported None of Their Closest Friends Smoke
Percent of Students Who Reported None of Their Closest Friends Smoke
46465756
607580
0
50
100
6th 7th 8th 9th 10th 11th 12th
Data source: AZ YTS 2007
Perc
ent

Arizona Youth Tobacco Survey Report 2007
Evaluation, Research and Development Unit, The University of Arizona 37
When asked if a lot of kids smoke at their school, 37 percent of middle school students and 77 percent of high school students reported “definitely yes” or “probably yes”. Among middle school students, 27 percent answered “definitely yes” or “probably yes” when asked if kids ever smoke on school property or at school games (70 percent of high school students).
When asked about anti-tobacco content in any school class, 43 percent of all YTS 2007 respondents confirmed that they were taught about the dangers of tobacco (57% of middle school students and 31% of high school students). Twenty-four percent of students had missing data or were not sure about anti-tobacco content in the classroom. About 16 percent of all students had participated in a school event, club or group that discouraged tobacco use. When asked about participation in a community event that discouraged tobacco use, 9 percent of students reported having participated. However, this rate is slightly lower than in 2005, where 12 percent of all students said that they had participated in a community event that discouraged tobacco use.
Table 9. Classes discouraging tobacco used and perceived effectiveness
Middle school High school
Had taken a class discouraging tobacco use during the last school year 31% 17%
Practiced ways of saying no to tobacco in any of their classes (of those who had taken a class)
64% 37%
Reported that the class had helped them to not use or quit tobacco (of those who had taken a class)
80% 68%
Data Source: AZ YTS 2007
Students who reported that had visited a health professional were also asked if a dentist, doctor, nurse or other health care professional asked them if they smoked and if they were advised by those professionals not to smoke. Overall, 27 percent of students reported that a doctor or other healthcare professional had asked them if they smoke and seven percent said a dentist had asked. Table 10 shows breakdowns by smoking status. While almost one out of two current cigarette smokers reported being asked by a doctor or healthcare professional, only one out of five reported being asked by a dentist if they smoke. About one third of current smokers were advised to not smoke.
Table 10. Interaction with health care providers
Current cigarette smoker
Not currently smoking cigarettes
A doctor, nurse or other health care professional asked if smoked during the past 12 month
43% 24%
A dentist asked if smoked during the past 12 month 19% 5%
A doctor, dentist, nurse or other health care professional advised not to smoke
32% 22%
Data Source: AZ YTS 2007

Arizona Youth Tobacco Survey Report 2007
Evaluation, Research and Development Unit, The University of Arizona 38
5. Conclusions Cigarette smoking is continuing to decrease among Arizona students. Reported rates of cigarette use are at their lowest levels since the Youth Tobacco Survey surveillance began, particularly among middle school youth, where the rate of ever using cigarettes is about half that of the baseline year. For the first time, a higher proportion of middle-school girls report the current use of cigarettes than do boys. The difference is driven not by an increase in female smoking, but by a sharp decline amongst boys.
Rates of cigarette smoking remain high among American Indian/Alaska Native youth, despite decreasing trends. It would be helpful to know the degree to which these high rates are driven by commercial tobacco use versus being influenced by reporting of traditional or ceremonial tobacco use. The current survey does not allow those uses to be differentiated.
Along with a decrease in reported smoking come continuing, though slight, decreases in reported exposure to secondhand smoke. Youth who live with smokers, however, continue to report more than three times the frequent exposure (three or more times a week) in a room, and seven times the frequent exposure in a car.
Though the decrease in cigarette use and exposure to second hand smoke are encouraging, there is indication that the use of alternative tobacco products is rising, particularly among high school students. In fact, there has been an overall increase in current use of tobacco products amongst Hispanic/Latino high school students. This increase is counter to the national trend that shows the use of tobacco products decreasing. Smokeless, bidi and hookah use among high school students have risen to their highest levels since the survey began in 2003, with hookah use showing stark increases from 2005.
Also, as cigarette smoking decreases, we are seeing a decrease in the proportion of middle school smokers who report a desire to quit, and a lower rate of middle school smokers actually making a quit attempt. In addition, fewer than half of current smokers in both middle and high school reported knowing where to get help to quit smoking. This is in contrast with an increasing rate of middle school smokers thinking they could quit if they wanted to. The smoker population in middle school may be changing towards a “hardening target” as was suggest by Chassin et al. (2007)11. “Hardening target” refers to an increase in the difficulty of reaching and treating the target audience (i.e. youth tobacco users), partly because of compounding psychosocial issues among those who use tobacco (such as substance use issues, socioeconomic disadvantage etc.).
Access to tobacco products through retail outlets continues to be relatively easy for students who attempt to purchase them. Only a third of under-age youth who attempted to purchase cigarettes reported that they were refused the sale because of their age; even fewer, one in four, report being asked to show proof of age.
Relatively low rates of current cigarette smokers reported being asked by doctors, other health care professionals or dentists if they smoked. Of those who reported having been asked, only a third said they were advised to quit. Visits to health care professionals represent opportunities to 11 Laurie Chassin, Clark Presson, Antonio Morgan-Lopez, Steven J. Sherman, 'Deviance proneness' and adolescent smoking 1980 versus 2001: Has there been a 'hardening' of adolescent smoking?, Journal of Applied Developmental Psychology, Volume 28, Issue 3, , May-June 2007, Pages 264-276.

Arizona Youth Tobacco Survey Report 2007
Evaluation, Research and Development Unit, The University of Arizona 39
intervene with young tobacco users. Ideally, health care providers would routinely ask young people about their tobacco use and advise and assist users to quit.
It is important to note that the rates reported here do not represent the youth smoking rates of all Arizona youth. Because the YTS is administered in schools, youth not attending school are systematically excluded from the rates. In 2007, 6.4% of Arizona high school students dropped out during the 2005-2006 school year12. According to the academic literature on at-risk youth13, those who drop out of school are much more likely to engage in high-risk behavior such as using tobacco compared with those who remain in school. Therefore, it can be assumed that the tobacco use rates for all Arizona youth are somewhat higher than the in-school rates reported in this document.
12 Dropout Rate Report: 2006 (http://www.azed.gov/researchpolicy/DropoutInfo/2005-2006/DropoutReport2006v2.pdf) on February 18, 2008 13 Pirie, P. L., Murray, D. M., & Luepker, R. V. (1988). Smoking prevalence in a cohort of adolescents, including absentees, dropouts, and transfers. American Journal of Public Health, 78, 176.

Arizona Youth Tobacco Survey Report 2007
Evaluation, Research and Development Unit, The University of Arizona 40
Appendix A
Availability of Arizona YTS items across survey years
Ever Current Frequent Ever Current Frequent Ever Current Frequent
Cigarettes Chewing Tobacco Pipe
2007 X X X X X X O X X
2005 X X X X X Responses
differ X X O
2003 X X X X X X O X X
2000 X X X X X X O X X
Bidis (listed separately) Kreteks (listed separately) Bidis and Kreteks (listed
together)
2007 X X X X O O X O O
2005 X X O X X O X X Responses
differ
2003 X X X X O O X O O
2000 X X X X O O X O O
Cigars (listed separately) Cigarillos (listed separately) Cigars, Cigarillos or little
cigars (listed together)
2007 O O O O O O X X X
2005 X X O X X O X X Responses
differ
2003 O O O O O O X X X
2000 O O O O O O X X X
Hookah
2007 X O O
2005 X X O
2003 O O O
2000 O O O
Key:
X= Question required is available
O= Question required is NOT available
Responses differ = The question required is available, however the response options differ when compared to the other years

Arizona Youth Tobacco Survey Report 2007
Evaluation, Research and Development Unit, The University of Arizona 41
Appendix B
Arizona 2007 YTS Survey Questionnaire and basic response rates (CDC outcome indicators are included in parenthesis)
1. How old are you? Weighted N Weighted % Unweighted N a. 11 years old or younger 28400 5.4 446 b. 12 years old 77737 14.7 1167 c. 13 years old 82693 15.6 1162 d. 14 years old 74816 14.1 944 e. 15 years old 77873 14.7 862 f. 16 years old 79375 15.0 832 g. 17 years old 66336 12.5 647 h. 18 years old or older 40563 7.7 423 Missing 991 0.2 14 2. What is your gender? Weighted N Weighted % Unweighted N a. Female 256922 48.6 3228 b. Male 268772 50.8 3224 Missing 3091 0.6 45 3. What grade are you in? Weighted N Weighted % Unweighted N a. 6th 77309 14.6 1216 b. 7th 77892 14.7 1194 c. 8th 78493 14.8 1037 d. 9th 80241 15.2 822 e. 10th 76370 14.4 905 f. 11th 67645 12.8 613
g. 12th 66109 12.5 642 h. Ungraded or other grade Missing 4726 0.9 68

Arizona Youth Tobacco Survey Report 2007
Evaluation, Research and Development Unit, The University of Arizona 42
4. How do you describe yourself? (You can CHOOSE ONE ANSWER, or MORE THAN ONE)* Weighted N Weighted % Unweighted N a. American Indian or Alaskan Native 51616 9.8 710 b. Asian 26066 4.9 340 c. Black or African American 40079 7.6 617 d. Hispanic or Latino 195376 36.9 2712 e. Native Hawaiian or Other Pacific Islander 13016 2.5 170 f. White 285856 54.1 3060 *Note: Due to the multiple-choice character of this item, percentages may add up to more than 100 percent. 5. Which one of these groups BEST describes you? (CHOOSE ONLY ONE ANSWER) Weighted N Weighted % Unweighted N a. American Indian or Alaska Native 27005 5.1 346 b. Asian 13378 2.5 159 c. Black or African American 28824 5.5 468 d. Hispanic or Latino 175433 33.2 2459 e. Native Hawaiian or Other Pacific Islander 6830 1.3 91 f. White 262126 49.6 2787 Missing 15189 2.9 187 6. During the last 4 weeks, about how much money did you have each week to spend any way you want to? Weighted N Weighted % Unweighted N a. None 49872 9.4 665 b. Less than $1 5903 1.1 87 c. $1 to $5 37453 7.1 512 d. $6 to $10 46274 8.8 614 e. $11 to $20 99649 18.8 1209 f. $21 to $50 104604 19.8 1266 g. More than $50 174410 33.0 2006 Missing 10620 2.0 138 7. At home, what language do you speak most often? Weighted N Weighted % Unweighted N a. English 373498 70.6 4366 b. Spanish 57374 10.9 799 c. Both English and Spanish, about the same amount 67862 12.8 995 d. Other 21759 4.1 233 Missing 8292 1.6 104

Arizona Youth Tobacco Survey Report 2007
Evaluation, Research and Development Unit, The University of Arizona 43
THE NEXT GROUP OF QUESTIONS ASKS ABOUT TOBACCO USE. Cigarette Smoking 8. Have you ever tried cigarette smoking, even one or two puffs? (1.13.2, 1.10.5) Weighted N Weighted % Unweighted N a. Yes 196725 37.2 2452 b. No 303325 57.4 3666 Missing 28735 5.4 379 9. How old were you when you smoked a whole cigarette for the first time? (1.13.1) Weighted N Weighted % Unweighted N a. I have never smoked a whole cigarette 364221 68.9 4407 b. 8 years old or younger 15750 3.0 236 c. 9 or 10 years old 16952 3.2 224 d. 11 or 12 years old 27675 5.2 390 e. 13 or 14 years old 41612 7.9 517 f. 15 or 16 years old 31886 6.0 318 g. 17 years old or older 7434 1.4 74 Missing 23255 4.4 331 10. About how many cigarettes have you smoked in your entire life? (1.14.1, 1.14.2) Weighted N Weighted % Unweighted N a. None 341110 64.5 4120 b. 1 or more puffs but never a whole cigarette 49098 9.3 642 c. 1 cigarette 12648 2.4 157 d. 2 to 5 cigarettes 33208 6.3 395 e. 6 to 15 cigarettes (about 1/2 a pack total) 19998 3.8 241 f. 16 to 25 cigarettes (about 1 pack total) 12961 2.5 161 g. 26 to 99 cigarettes (more than 1 pack, but less than 5 packs) 16371 3.1 200 h. 100 or more cigarettes (5 or more packs) 34510 6.5 453 Missing 8881 1.7 128 11. Have you ever smoked cigarettes daily, that is, at least one cigarette every day for 30 days? Weighted N Weighted % Unweighted N a. Yes 45948 8.7 610 b. No 473239 89.5 5745 Missing 9599 1.8 142

Arizona Youth Tobacco Survey Report 2007
Evaluation, Research and Development Unit, The University of Arizona 44
12. During the past 30 days, on how many days did you smoke cigarettes? (1.14.1) Weighted N Weighted % Unweighted N a. 0 days 435072 82.3 5253 b. 1 or 2 days 18661 3.5 228 c. 3 to 5 days 10232 1.9 125 d. 6 to 9 days 6874 1.3 90 e. 10 to 19 days 7518 1.4 98 f. 20 to 29 days 7563 1.4 99 g. All 30 days 16292 3.1 226 Missing 26572 5.0 378 13. During the past 30 days, on the days you smoked, how many cigarettes did you smoke per day? (1.14, 2.8.2) Weighted N Weighted % Unweighted N a. I did not smoke cigarettes during the past 30 days 432280 81.7 5230 b. Less than 1 cigarette per day 17185 3.2 225 c. 1 cigarette per day 11274 2.1 143 d. 2 to 5 cigarettes per day 23128 4.4 285 e. 6 to 10 cigarettes per day 8958 1.7 112 f. 11 to 20 cigarettes per day 3388 0.6 58 g. More than 20 cigarettes per day 3579 0.7 48 Missing 28992 5.5 396 14. During the past 30 days, what brand of cigarettes did you usually smoke? (CHOOSE ONLY ONE ANSWER) (1.14.2) Weighted N Weighted % Unweighted N a. I did not smoke cigarettes during the past 30 days 435964 82.4 5277 b. I do not have a usual brand 10589 2.0 127 c. Camel 11016 2.1 146 d. Marlboro 38712 7.3 500 e. Newport 6067 1.1 95 f. Virginia Slims 1341 0.3 17 g. GPC, Basic, or Doral 1382 0.3 22 h. Some other brand 11015 2.1 144 Missing 12698 2.4 169

Arizona Youth Tobacco Survey Report 2007
Evaluation, Research and Development Unit, The University of Arizona 45
15. During the past 30 days, how did you usually get your own cigarettes? (CHOOSE ONLY ONE ANSWER) (1.11.4, 1.11.5) Weighted N Weighted % Unweighted N a. I did not smoke cigarettes during the past 30 days 437679 82.8 5303 b. I bought them in a store such as a convenience store, supermarket, discount store, or gas station 19518 3.7 237 c. I gave someone else money to buy them for me 18067 3.4 229 d. I borrowed (or bummed) them from someone else 15292 2.9 193 e. A person 18 years old or older gave them to me 6776 1.3 101 f. I took them from a store or family member 5911 1.1 80 g. I got them some other way 13617 2.6 190 Missing 11925 2.3 164 16. During the past 30 days, where did you buy the last pack of cigarettes you bought? (CHOOSE ONLY ONE ANSWER) (1.11.2, 1.11.5) Weighted N Weighted % Unweighted N a. I did not buy a pack of cigarettes during the past 30 days 463005 87.6 5620 b. A gas station 22553 4.3 278 c. A convenience store 6703 1.3 99 d. A grocery store 3525 0.7 49 e. A drugstore 2182 0.4 38 f. I bought them over the Internet 1985 0.4 23 g. A tobacco or smoke shop 7338 1.4 87 h. Other 13915 2.6 204 Missing 7578 1.4 99 17. When you bought or tried to buy cigarettes in a store during the past 30 days, were you ever asked to show proof of age? Weighted N Weighted % Unweighted N a. I did not try to buy cigarettes in a store during the past 30 days 476189 90.1 5787 b. Yes, I was asked to show proof of age 18309 3.5 249 c. No, I was not asked to show proof of age 23428 4.4 307 Missing 10859 2.1 154

Arizona Youth Tobacco Survey Report 2007
Evaluation, Research and Development Unit, The University of Arizona 46
18. During the past 30 days, did anyone ever refuse to sell you cigarettes because of your age? (1.11.3) Weighted N Weighted % Unweighted N a. I did not try to buy cigarettes in a store during the past 30 days 468813 88.7 5694 b. Yes, someone refused to sell me cigarettes because of my age 11989 2.3 182 c. No, no one refused to sell me cigarettes because of my age 32046 6.1 418 Missing 15936 3.0 203 19. During the past 30 days, on how many days did you smoke cigarettes on school property? (1.7.10, 2.6.5) Weighted N Weighted % Unweighted N a. 0 days 496545 93.9 6033 b. 1 or 2 days 7666 1.4 111 c. 3 to 5 days 4026 0.8 63 d. 6 to 9 days 3008 0.6 47 e. 10 to 19 days 2260 0.4 35 f. 20 to 29 days 1494 0.3 24 g. All 30 days 4708 0.9 66 Missing 9078 1.7 118 20. When was the last time you smoked a cigarette, even one or two puffs? (3.13.1, 3.13.2) Weighted N Weighted % Unweighted N a. I have never smoked even one or two puffs 336851 63.7 4089 b. Earlier today 22802 4.3 322 c. Not today but sometime during the past 7 days 25979 4.9 312 d. Not during the past 7 days but sometime during the past 30 days 11844 2.2 154 e. Not during the past 30 days but sometime during the past 6 months 37097 7.0 444 f. Not during the past 6 months but sometime during the past year 19584 3.7 236 g. 1 to 4 years ago 34836 6.6 430 h. 5 or more years ago 17770 3.4 221 Missing 22021 4.2 289

Arizona Youth Tobacco Survey Report 2007
Evaluation, Research and Development Unit, The University of Arizona 47
21. How long can you go without smoking before you feel like you need a cigarette? Weighted N Weighted % Unweighted N a. I have never smoked cigarettes 356487 67.4 4317 b. I have not smoked cigarettes during the past 30 days 73824 14.0 894 c. Less than an hour 6519 1.2 91 d. 1 to 3 hours 8237 1.6 109 e. More than 3 hours but less than a day 6171 1.2 101 f. A whole day 5126 1.0 68 g. Several days 10847 2.1 139 h. A week or more 49165 9.3 616 Missing 12408 2.3 162 22. When do you usually smoke cigarettes? (YOU CAN CHOOSE ONE ANSWER OR MORE THAN ONE)* Weighted N Weighted % Unweighted N a. I have never smoked cigarettes 362787 68.6 4384 b. I have not smoked cigarettes during the past 30 days 69272 13.1 852 c. When I am with friends who smoke 56231 10.6 706 d. When I am with friends who don’t smoke 11126 2.1 161 e. When I am by myself 24194 4.6 325 f. When I am feeling stressed out 36692 6.9 509 g. When there are no grownups around 15632 3.0 211 h. When I am bored 20377 3.9 295 *Note: Due to the multiple-choice character of this item, percentages may add up to more than 100 percent. 23. Have you ever smoked in front of your parents? Weighted N Weighted % Unweighted N a. I have never smoked cigarettes 340239 64.3 4102 b. Yes 33767 6.4 469 c. No 141756 26.8 1747 Missing 13023 2.5 179 24. Do you consider yourself a smoker? Weighted N Weighted % Unweighted N a. Definitely yes 34820 6.6 457 b. Probably yes 25333 4.8 332 c. Probably not 50872 9.6 673 d. Definitely not 403853 76.4 4839 Missing 13908 2.6 196

Arizona Youth Tobacco Survey Report 2007
Evaluation, Research and Development Unit, The University of Arizona 48
25. Do you want to stop smoking cigarettes? (3.8.3) Weighted N Weighted % Unweighted N a. I do not smoke now 430272 81.4 5179 b. Yes 35425 6.7 477 c. No 33813 6.4 434 Missing 29276 5.5 407 26. During the past 12 months, did any doctor, nurse, or other health professional ask you if you smoke? (3.9.2) Weighted N Weighted % Unweighted N a. I haven’t visited a doctor’s office in the past 12 months 104017 19.7 1392 b. Yes 92597 17.5 1067 c. No 256491 48.5 3053 d. Don’t know / not sure 63047 11.9 803 Missing 12632 2.4 182 27. During the past 12 months, did any dentist ask you if you smoke? (3.9.2) Weighted N Weighted % Unweighted N a. I haven’t visited a dentist’s office in the past 12 month 107320 20.3 1417 b. Yes 26025 4.9 337 c. No 344792 65.2 4079 d. Don’t know/ not sure 35874 6.8 458 Missing 14774 2.8 206 28. During the past 12 months, did any doctor, dentist, nurse, or other health professional advise you not to smoke? (3.9.3) Weighted N Weighted % Unweighted N a. I haven’t visited a doctor’s or dentist’s office in the past 12 months 81419 15.4 1101 b. Yes 88774 16.8 1120 c. No 289907 54.8 3396 d. Don’t know / not sure 54858 10.4 682 Missing 13827 2.6 198 29. During the past 12 months, have you had an episode of asthma or an asthma attack? Weighted N Weighted % Unweighted N a. Yes 68648 13.0 818 b. No 423926 80.2 5218 Missing 36212 6.8 461

Arizona Youth Tobacco Survey Report 2007
Evaluation, Research and Development Unit, The University of Arizona 49
30. During the past 12 months, did you ever try to quit smoking cigarettes? Weighted N Weighted % Unweighted N a. I did not smoke during the past 12 months 394634 74.6 4777 b. Yes 52952 10.0 672 c. No 60046 11.4 748 Missing 21153 4.0 300 31. How many times during the past 12 months have you stopped smoking for one day or longer because you were trying to quit smoking? (3.11.2, 3.13.2) Weighted N Weighted % Unweighted N a. I have not smoked in the past 12 months 409666 77.5 4982 b. I have not tried to quit 42737 8.1 528 c. 1 time 18838 3.6 220 d. 2 times 9218 1.7 121 e. 3 to 5 times 9222 1.7 121 f. 6 to 9 times 4149 0.8 66 g. 10 or more times 13649 2.6 166 Missing 21305 4.0 293 32. When you last tried to quit, how long did you stay off cigarettes? (3.13.1) Weighted N Weighted % Unweighted N a. I have never smoked cigarettes 371793 70.3 4493 b. I have never tried to quit 48615 9.2 573 c. Less than a day 8212 1.6 109 d. 1 to 7 days 11523 2.2 157 e. More than 7 days but less than 30 days 10336 2.0 136 f. 30 days or more but less than 6 months 15418 2.9 198 g. 6 months or more but less than a year 13829 2.6 180 h. 1 year or more 26625 5.0 355 Missing 22434 4.2 296 33. Do you know of any place where you can get help to quit smoking? Weighted N Weighted % Unweighted N a. I have not smoked cigarettes during the past 30 days 385525 72.9 4660 b. Yes 47959 9.1 615 c. No 69985 13.2 891 Missing 25315 4.8 331

Arizona Youth Tobacco Survey Report 2007
Evaluation, Research and Development Unit, The University of Arizona 50
34. Have you ever tried the patch or nicotine gum to help you quit smoking? Weighted N Weighted % Unweighted N a. I have never smoked cigarettes 360254 68.1 4348 b. Yes 26426 5.0 341 c. No 125004 23.6 1570 Missing 17101 3.2 238 Smokeless Tobacco: Chewing Tobacco, Snuff, or Dip 35. Have you ever used chewing tobacco, snuff, or dip, such as Redman, Levi Garrett, Beechnut, Skoal, Skoal Bandits, or Copenhagen? Weighted N Weighted % Unweighted N a. Yes 62167 11.8 724 b. No 440343 83.3 5407 Missing 26275 5.0 366 36. How old were you when you used chewing tobacco, snuff, or dip for the first time? Weighted N Weighted % Unweighted N a. I have never used chewing tobacco, snuff, or dip 459866 87.0 5669 b. 8 years old or younger 12320 2.3 138 c. 9 or 10 years old 7579 1.4 100 d. 11 or 12 years old 7119 1.3 96 e. 13 or 14 years old 11397 2.2 132 f. 15 or 16 years old 12687 2.4 124 g. 17 years old or older 4234 0.8 44 Missing 13585 2.6 194 37. During the past 30 days, on how many days did you use chewing tobacco, snuff, or dip? Weighted N Weighted % Unweighted N a. 0 days 486261 92.0 5975 b. 1 or 2 days 10458 2.0 119 c. 3 to 5 days 3404 0.6 43 d. 6 to 9 days 2743 0.5 35 e. 10 to 19 days 3232 0.6 34 f. 20 to 29 days 1301 0.2 14 g. All 30 days 4046 0.8 45 Missing 17340 3.3 232

Arizona Youth Tobacco Survey Report 2007
Evaluation, Research and Development Unit, The University of Arizona 51
38. During the past 30 days, on how many days did you use chewing tobacco, snuff, or dip on school property? (1.7.10) Weighted N Weighted % Unweighted N a. 0 days 494592 93.5 6048 b. 1 or 2 days 6269 1.2 86 c. 3 to 5 days 3589 0.7 49 d. 6 to 9 days 3359 0.6 48 e. 10 to 19 days 1796 0.3 24 f. 20 to 29 days 1927 0.4 20 g. All 30 days 4110 0.8 42 Missing 13144 2.5 180 39. During the past 30 days, how did you usually get your own chewing tobacco, snuff, or dip? (CHOOSE ONLY ONE ANSWER) Weighted N Weighted % Unweighted N a. I did not use chewing tobacco, snuff, or dip during the past 30 days 474694 89.8 5803 b. I bought them in a store such as a convenience store, supermarket, discount store, or gas station 9845 1.9 113 c. I gave someone else money to buy them for me 7065 1.3 76 d. I borrowed (or bummed) them from someone else 6053 1.1 73 e. A person 18 years old or older gave them to me 3382 0.6 46 f. I took them from a store or family member 1824 0.3 23 g. I got them some other way 3556 0.7 49 Missing 22366 4.2 314 Cigars 40. Have you ever tried smoking cigars, cigarillos, or little cigars, even one or two puffs? Weighted N Weighted % Unweighted N a. Yes 135956 25.7 1665 b. No 367576 69.5 4474 Missing 25253 4.8 358

Arizona Youth Tobacco Survey Report 2007
Evaluation, Research and Development Unit, The University of Arizona 52
41. How old were you when you smoked a cigar, cigarillo, or little cigar for the first time? Weighted N Weighted % Unweighted N a. I have never smoked a cigar, cigarillo or little cigar 384695 72.8 4692 b. 8 years old or younger 16808 3.2 240 c. 9 or 10 years old 13523 2.6 187 d. 11 or 12 years old 22739 4.3 298 e. 13 or 14 years old 36169 6.8 452 f. 15 or 16 years old 31996 6.1 335 g. 17 years old or older 9336 1.8 105 Missing 13518 2.6 188 42. During the past 30 days, on how many days did you smoke cigars, cigarillos, or little cigars? Weighted N Weighted % Unweighted N a. 0 days 450787 85.2 5465 b. 1 or 2 days 25915 4.9 332 c. 3 to 5 days 10100 1.9 136 d. 6 to 9 days 6312 1.2 85 e. 10 to 19 days 3879 0.7 49 f. 20 to 29 days 2262 0.4 34 g. All 30 days 3719 0.7 50 Missing 25811 4.9 346 43. During the past 30 days, how did you usually get your own cigars, cigarillos, or little cigars? (CHOOSE ONLY ONE ANSWER) Weighted N Weighted % Unweighted N a. I did not smoke cigars, cigarillos, or little cigars during the past 30 days 446252 84.4 5412 b. I bought them in a store such as a convenience store, supermarket, discount store, or gas station 15135 2.9 207 c. I gave someone else money to buy them for me 13520 2.6 173 d. I borrowed (or bummed) them from someone else 12819 2.4 149 e. A person 18 years old or older gave them to me 7210 1.4 91 f. I took them from a store or family member 4569 0.9 52 g. I got them some other way 11608 2.2 161 Missing 17674 3.3 252

Arizona Youth Tobacco Survey Report 2007
Evaluation, Research and Development Unit, The University of Arizona 53
Pipe 44. During the past 30 days, on how many days did you smoke tobacco in a pipe? Weighted N Weighted % Unweighted N a. 0 days 482286 91.2 5875 b. 1 or 2 days 10553 2.0 136 c. 3 to 5 days 6957 1.3 90 d. 6 to 9 days 5145 1.0 61 e. 10 to 19 days 2958 0.6 42 f. 20 to 29 days 764 0.1 17 g. All 30 days 3978 0.8 50 Missing 16144 3.1 226 Bidis and Kreteks THE NEXT QUESTIONS ARE ABOUT BIDIS (OR “BEEDIES”) AND KRETEKS (ALSO CALLED “CLOVE CIGARETTES”). BIDIS ARE SMALL BROWN CIGARETTES FROM INDIA CONSISTING OF TOBACCO WRAPPED IN A LEAF TIED WITH A THREAD. KRETEKS ARE CIGARETTES CONTAINING TOBACCO AND CLOVE EXTRACT. 45. Have you ever tried smoking any of the following: Weighted N Weighted % Unweighted N a. Bidis 18049 3.4 247 b. Kreteks 15792 3.0 164 c. I have tried both bidis and kreteks 15934 3.0 211 d. I have never smoked bidis or kreteks 451686 85.4 5498 Missing 27324 5.2 377 46. During the past 30 days, on how many days did you smoke bidis? Weighted N Weighted % Unweighted N a. 0 days 481704 91.1 5856 b. 1 or 2 days 10650 2.0 134 c. 3 to 5 days 5371 1.0 75 d. 6 to 9 days 8103 1.5 120 e. 10 to 19 days 1713 0.3 21 f. 20 to 29 days 801 0.2 14 g. All 30 days 3246 0.6 35 Missing 17197 3.3 242

Arizona Youth Tobacco Survey Report 2007
Evaluation, Research and Development Unit, The University of Arizona 54
47. Have you ever tried smoking hookah, even one or two puffs? Weighted N Weighted % Unweighted N a. Yes 76917 14.5 855 b. No 423949 80.2 5255 Missing 27919 5.3 387 THE NEXT QUESTIONS ASK ABOUT YOUR THOUGHTS ABOUT TOBACCO. 48. Do you think that you will try a cigarette soon? (1.10.5) Weighted N Weighted % Unweighted N a. I have already tried smoking cigarettes 113799 21.5 1377 b. Yes 39560 7.5 518 c. No 350052 66.2 4252 Missing 25374 4.8 350 49. Do you think you will smoke a cigarette at anytime during the next year? (1.10.5) Weighted N Weighted % Unweighted N a. Definitely yes 47719 9.0 624 b. Probably yes 52288 9.9 637 c. Probably not 78372 14.8 940 d. Definitely not 331249 62.6 4029 Missing 19156 3.6 267 50. Do you think you will be smoking cigarettes 5 years from now? Weighted N Weighted % Unweighted N a. I definitely will 17773 3.4 245 b. I probably will 50134 9.5 660 c. I probably will not 102819 19.4 1280 d. I definitely will not 337445 63.8 4022 Missing 20613 3.9 290 51. If one of your best friends offered you a cigarette, would you smoke it? (1.10.5) Weighted N Weighted % Unweighted N a. Definitely yes 41604 7.9 546 b. Probably yes 54678 10.3 679 c. Probably not 81346 15.4 982 d. Definitely not 326561 61.8 3954 Missing 24595 4.7 336

Arizona Youth Tobacco Survey Report 2007
Evaluation, Research and Development Unit, The University of Arizona 55
52. In the past 12 months, how often have your parents or guardians discussed the dangers of tobacco use with you? (1.10.3) Weighted N Weighted % Unweighted N a. Never 185060 35.0 2244 b. Rarely 108009 20.4 1252 c. Sometimes 123132 23.3 1518 d. Often 56691 10.7 725 e. Very often 36088 6.8 484 Missing 19806 3.7 274 53. Can people get addicted to using tobacco? Weighted N Weighted % Unweighted N a. Definitely yes 361409 68.3 4265 b. Probably yes 103293 19.5 1354 c. Probably not 17407 3.3 245 d. Definitely not 25035 4.7 339 Missing 21641 4.1 294 54. Do you think young people who smoke cigarettes have more friends? (1.10.2) Weighted N Weighted % Unweighted N a. Definitely yes 27729 5.2 380 b. Probably yes 75950 14.4 1048 c. Probably not 233307 44.1 2788 d. Definitely not 160592 30.4 1877 Missing 31207 5.9 404 55. Do you think smoking cigarettes makes young people look cool or fit in? (1.10.1) Weighted N Weighted % Unweighted N a. Definitely yes 25478 4.8 339 b. Probably yes 44476 8.4 551 c. Probably not 83205 15.7 1026 d. Definitely not 349846 66.2 4225 Missing 25780 4.9 356 56. Do you think smoking cigarettes makes kids your age look more grown up? Weighted N Weighted % Unweighted N a. Definitely yes 34738 6.6 442 b. Probably yes 64558 12.2 795 c. Probably not 73355 13.9 925 d. Definitely not 328995 62.2 3967 Missing 27139 5.1 368

Arizona Youth Tobacco Survey Report 2007
Evaluation, Research and Development Unit, The University of Arizona 56
57. Do you think smoking cigarettes helps people reduce stress? Weighted N Weighted % Unweighted N a. Definitely yes 67490 12.8 823 b. Probably yes 157455 29.8 1836 c. Probably not 101313 19.2 1285 d. Definitely not 173056 32.7 2139 Missing 29471 5.6 414 58. Do you think smoking cigarettes helps people keep their weight down? Weighted N Weighted % Unweighted N a. Definitely yes 43181 8.2 547 b. Probably yes 98736 18.7 1141 c. Probably not 157766 29.8 1962 d. Definitely not 199539 37.7 2442 Missing 29564 5.6 405 59. Do you think young people risk harming themselves if they smoke from 1 - 5 cigarettes per day? Weighted N Weighted % Unweighted N a. Definitely yes 343990 65.1 4023 b. Probably yes 89763 17.0 1160 c. Probably not 21920 4.1 316 d. Definitely not 44152 8.3 593 Missing 28960 5.5 405 60. Do you think it is safe to smoke for only a year or two, as long as you quit after that? Weighted N Weighted % Unweighted N a. Definitely yes 26102 4.9 330 b. Probably yes 46241 8.7 588 c. Probably not 118350 22.4 1444 d. Definitely not 307766 58.2 3711 Missing 30325 5.7 424 61. Do you think smoking low tar and low-nicotine cigarettes is less harmful to your health than smoking regular cigarettes? Weighted N Weighted % Unweighted N a. Definitely yes 53738 10.2 666 b. Probably yes 100376 19.0 1215 c. Probably not 144337 27.3 1746 d. Definitely not 195641 37.0 2378 Missing 34693 6.6 492

Arizona Youth Tobacco Survey Report 2007
Evaluation, Research and Development Unit, The University of Arizona 57
62. Do you think you would be able to quit smoking cigarettes now if you wanted to? Weighted N Weighted % Unweighted N a. I have never smoked cigarettes 331545 62.7 3973 b. I have not smoked cigarettes during the past 30 days 72858 13.8 888 c. Yes 72374 13.7 906 d. No 21400 4.0 301 Missing 30609 5.8 429 63. Have you ever participated in a program to help you quit using tobacco? Weighted N Weighted % Unweighted N a. I have never used tobacco 323566 61.2 3905 b. Yes 20346 3.8 271 c. No 147642 27.9 1804 Missing 37232 7.0 517 64. During this school year, were you taught in any of your classes about the dangers of tobacco use? (1.7.9) Weighted N Weighted % Unweighted N a. Yes 211314 40.0 2598 b. No 191992 36.3 2249 c. Not sure 91801 17.4 1172 Missing 33678 6.4 478 65. During this school year, did you practice ways to say NO to tobacco in any of your classes (for example by role-playing)? (1.7.9) Weighted N Weighted % Unweighted N a. Yes 121479 23.0 1558 b. No 303190 57.3 3513 c. Not sure 69978 13.2 922 Missing 34137 6.5 504 66. During this school year, have you asked someone, such as a friend or family member, to give up smoking? Weighted N Weighted % Unweighted N a. Yes 247046 46.7 2967 b. No 240474 45.5 2942 Missing 41265 7.8 588 67. During this school year, have you taken a class that discouraged tobacco use? Weighted N Weighted % Unweighted N a. Yes 112025 21.2 1374 b. No 377081 71.3 4548 Missing 39679 7.5 575

Arizona Youth Tobacco Survey Report 2007
Evaluation, Research and Development Unit, The University of Arizona 58
68. During this school year, have you participated in a school event, club or group that discouraged tobacco use? Weighted N Weighted % Unweighted N a. Yes 80065 15.1 936 b. No 407307 77.0 4961 Missing 41413 7.8 600 69. Did the classes or courses you took about tobacco help you to not use tobacco or to quit using tobacco? Weighted N Weighted % Unweighted N a. Yes 176835 33.4 2135 b. No 282808 53.5 3382 Missing 69143 13.1 980 THE NEXT QUESTIONS ASK ABOUT EVENTS YOU MAY HAVE ATTENDED OR WHAT YOU HAVE SEEN ON TV, AT THE MOVIES, OR ON THE INTERNET. 70. During the past 12 months, have you participated in any community activities to discourage people your age from using cigarettes, chewing tobacco, snuff, dip, or cigars? (1.7.8) Weighted N Weighted % Unweighted N a. Yes 48859 9.2 618 b. No 256898 48.6 3110 c. I did not know about any activities 182952 34.6 2178 Missing 40076 7.6 591 71. During the past 30 days, have you seen or heard commercials on TV, the Internet, or on the radio about the dangers of cigarette smoking? (1.6.1) Weighted N Weighted % Unweighted N a. Not in the past 30 days 136196 25.8 1773 b. 1-3 times in the past 30 days 104072 19.7 1171 c. 1-3 times per week 84812 16.0 968 d. Daily or almost daily 99478 18.8 1167 e. More than once a day 67914 12.8 877 Missing 36313 6.9 541

Arizona Youth Tobacco Survey Report 2007
Evaluation, Research and Development Unit, The University of Arizona 59
72. When you watch TV or go to movies, how often do you see actors using tobacco? Weighted N Weighted % Unweighted N a. I don’t watch TV or go to movies 25300 4.8 301 b. Most of the time 151417 28.6 1882 c. Some of the time 224215 42.4 2597 d. Hardly ever 69824 13.2 880 e. Never 18497 3.5 253 Missing 39532 7.5 584 73. When you watch TV, how often do you see athletes using tobacco? Weighted N Weighted % Unweighted N a. I don’t watch TV 32533 6.2 374 b. Most of the time 31847 6.0 425 c. Some of the time 72161 13.6 905 d. Hardly ever 184333 34.9 2122 e. Never 172787 32.7 2152 Missing 35123 6.6 519 74. When you are using the Internet, how often do you see ads for tobacco products? Weighted N Weighted % Unweighted N a. I don’t use the Internet 40730 7.7 553 b. Most of the time 56588 10.7 713 c. Some of the time 114586 21.7 1361 d. Hardly ever 155513 29.4 1768 e. Never 124135 23.5 1560 Missing 37231 7.0 542 75. Have the commercials changed the way you feel about using tobacco? Weighted N Weighted % Unweighted N a. I did not see or hear any commercials 82577 15.6 1079 b. Definitely yes 101565 19.2 1278 c. Probably yes 91830 17.4 1053 d. Probably not 88943 16.8 984 e. Definitely not 116629 22.1 1407 Missing 47240 8.9 696

Arizona Youth Tobacco Survey Report 2007
Evaluation, Research and Development Unit, The University of Arizona 60
SOME TOBACCO COMPANIES MAKE ITEMS LIKE SPORTS GEAR, T-SHIRTS, LIGHTERS, HATS, JACKETS, AND SUNGLASSES THAT PEOPLE CAN BUY OR RECEIVE FREE. 76. During the past 12 months, did you buy or receive anything that has a tobacco company name or picture on it? Weighted N Weighted % Unweighted N a. Yes 72634 13.7 878 b. No 400629 75.8 4842 Missing 55522 10.5 777 77. Would you ever use or wear something that has a tobacco company name or picture on it such as a lighter, t-shirt, hat, or sunglasses? (1.6.3) Weighted N Weighted % Unweighted N a. Definitely yes 33524 6.3 439 b. Probably yes 88078 16.7 1039 c. Probably not 135145 25.6 1601 d. Definitely not 228861 43.3 2786 Missing 43177 8.2 632 THE NEXT QUESTIONS ASK ABOUT YOUR EXPOSURE TO TOBACCO USE. 78. During the past 7 days, on how many days were you in the same room with someone who was smoking cigarettes? (2.7.5) Weighted N Weighted % Unweighted N a. 0 days 245253 46.4 2980 b. 1 day 60910 11.5 721 c. 2 days 38638 7.3 446 d. 3 days 29069 5.5 358 e. 4 days 14503 2.7 175 f. 5 days 14886 2.8 170 g. 6 days 6804 1.3 79 h. All 7 days 72686 13.7 914 Missing 46037 8.7 654 79. Which of these best describes the rules about smoking inside the house where you live? Smoking is… (2.4.4) Weighted N Weighted % Unweighted N a. Never allowed inside my home 379769 71.8 4485 b. Allowed only at some times or in some places 60650 11.5 777 c. Always allowed inside my home 38264 7.2 514 Missing 50101 9.5 721

Arizona Youth Tobacco Survey Report 2007
Evaluation, Research and Development Unit, The University of Arizona 61
80. What do you think people should do about smoking in their vehicles? People should … Weighted N Weighted % Unweighted N a. Never allow smoking in their vehicles 361416 68.3 4296 b. Allow smoking at some times in their vehicles 84501 16.0 1049 c. Always allow smoking in their vehicles 32446 6.1 425 Missing 50422 9.5 727 81. During the past 7 days, on how many days did you ride in a car with someone who was smoking cigarettes? (2.7.3, 2.7.5) Weighted N Weighted % Unweighted N a. 0 days 320733 60.7 3758 b. 1 day 44540 8.4 545 c. 2 days 32270 6.1 402 d. 3 days 18529 3.5 249 e. 4 days 10786 2.0 140 f. 5 days 9499 1.8 110 g. 6 days 5617 1.1 65 h. All 7 days 42445 8.0 568 Missing 44368 8.4 660 82. What do you think employers should do about smoking in indoor areas in places where people work? Employers should... (2.3.7) Weighted N Weighted % Unweighted N a. Never allow smoking in places where people work 388545 73.5 4632 b. Allow smoking only at some times or in some places 75305 14.2 905 c. Always allow smoking in places where people work 14769 2.8 218 Missing 50166 9.5 742 83. Which of these best describes smoking where you work? Smoking is… (2.4.3) Weighted N Weighted % Unweighted N a. I do not have a job 346475 65.5 4327 b. Never allowed where I work 69596 13.2 753 c. Allowed but only at some times or in some places 46392 8.8 516 d. Always allowed where I work 19514 3.7 215 Missing 46808 8.9 686

Arizona Youth Tobacco Survey Report 2007
Evaluation, Research and Development Unit, The University of Arizona 62
84. On how many of the past 7 days did you breathe the smoke from someone who was smoking in the place where you work? (2.7.1) Weighted N Weighted % Unweighted N a. I do not have a job 335904 63.5 4196 b. I have a job but did not work in the past 7 days. 26671 5.0 316 c. 0 days 65199 12.3 681 d. 1 to 3 days 28452 5.4 316 e. 4 to 6 days 8860 1.7 97 f. All 7 days 14644 2.8 178 Missing 49056 9.3 713 85. Now think about indoor public places such as malls, movie theaters, clubs or restaurants. Which of these best describes what you think about smoking in indoor public places? Smoking should… (2.3.7) Weighted N Weighted % Unweighted N a. Never be allowed in indoor public places 377127 71.3 4497 b. Be allowed in indoor public places but only at some times or in some areas 86150 16.3 1036 c. Always be allowed in indoor public places 12648 2.4 194 Missing 52860 10.0 770 86. Do you think the smoke from other people’s cigarettes is harmful to you? (2.3.5) Weighted N Weighted % Unweighted N a. Definitely yes 344137 65.1 4021 b. Probably yes 85718 16.2 1073 c. Probably not 23875 4.5 331 d. Definitely not 25627 4.8 346 Missing 49428 9.3 726 87. Does anyone who lives with you now smoke cigarettes? (YOU CAN CHOOSE ONE ANSWER OR MORE THAN ONE) Weighted N Weighted % Unweighted N a. No one who lives with me now smokes cigarettes 297870 56.3 3438 b. A parent (or guardian) 132328 25.0 1634 c. A brother or sister 43309 8.2 554 d. Another adult who lives with us 27728 5.2 385 e. Another young person who leaves with us 7460 1.4 112 *Note: Due to the multiple-choice character of this item, percentages may add up to more than 100 percent.

Arizona Youth Tobacco Survey Report 2007
Evaluation, Research and Development Unit, The University of Arizona 63
88. How many of your four closest friends smoke cigarettes? Weighted N Weighted % Unweighted N a. None 289267 54.7 3483 b. One 69029 13.1 796 c. Two 43687 8.3 507 d. Three 20400 3.9 243 e. Four 22985 4.3 307 f. Not sure 34885 6.6 447 Missing 48532 9.2 714 89. How many of the adults you know well smoke cigarettes? Weighted N Weighted % Unweighted N a. A lot 103685 19.6 1302 b. Some 146861 27.8 1757 c. Not many 110942 21.0 1348 d. None or almost none 115804 21.9 1327 Missing 51492 9.7 763 90. Do lots of kids who go to your school smoke cigarettes? Weighted N Weighted % Unweighted N a. Definitely yes 112901 21.4 1247 b. Probably yes 169963 32.1 1864 c. Probably not 132429 25.0 1673 d. Definitely not 57046 10.8 896 Missing 56446 10.7 817 91. Do kids at your school ever smoke on school property or at school games? Weighted N Weighted % Unweighted N a. Definitely yes 108867 20.6 1156 b. Probably yes 134664 25.5 1415 c. Probably not 124532 23.6 1514 d. Definitely not 107707 20.4 1626 Missing 53014 10.0 786 92. Does other people’s cigarette smoke bother you? Weighted N Weighted % Unweighted N a. Definitely yes 293058 55.4 3469 b. Probably yes 67023 12.7 801 c. Probably not 61237 11.6 730 d. Definitely not 55775 10.5 721 Missing 51692 9.8 776

Arizona Youth Tobacco Survey Report 2007
Evaluation, Research and Development Unit, The University of Arizona 64
THE NEXT QUESTIONS ASK ABOUT YOUR SCHOOL PLANS 93. Do you plan to finish high school? Weighted N Weighted % Unweighted N a. Definitely yes 427920 80.9 5024 b. Probably yes 24475 4.6 357 c. Probably not 10036 1.9 143 d. Definitely not 11720 2.2 171 Missing 54634 10.3 802 94. Do you plan to go to college? Weighted N Weighted % Unweighted N a. Definitely yes 366944 69.4 4217 b. Probably yes 74270 14.0 1009 c. Probably not 22564 4.3 313 d. Definitely not 14936 2.8 206 Missing 50071 9.5 752 THE LAST QUESTIONS ASK ABOUT YOUR DENTAL HEALTH 95. How long has it been since you last visited a dentist or a dental clinic (including an orthodontist)? Weighted N Weighted % Unweighted N a. Within the last year (12 months ago or less) 325851 61.6 3717 b. Within the past 2 years (more than 1 year but less than 2 years ago) 51558 9.8 649 c. Within the past 5 years (more than 2 years ago but less than 5 years ago) 21989 4.2 283 d. 5 or more years ago 9869 1.9 139 e. Never 11312 2.1 146 f. Don’t know/ not sure 57665 10.9 808 Missing 50541 9.6 755 96. Do you believe that you have dental cavities or “holes” in any of your teeth now? Weighted N Weighted % Unweighted N a. Yes 89087 16.8 1108 b. No 290498 54.9 3345 c. Don’t know/not sure 91874 17.4 1189 Missing 57326 10.8 855

Arizona Youth Tobacco Survey Report 2007
Evaluation, Research and Development Unit, The University of Arizona 65
97. Do you have any sealants (plastic coatings to prevent cavities) on your back teeth (molars)? Weighted N Weighted % Unweighted N a. Yes 162666 30.8 1823 b. No 231456 43.8 2823 c. Don’t know/not sure 78467 14.8 1008 Missing 56196 10.6 843 98. Did you have a toothache during the past 6 months that was bad enough to do any of the following things? Weighted N Weighted % Unweighted N (YOU CAN CHOOSE ONE ANSWER or MORE THAN ONE) a. I did not have a bad toothache during the past 6 months 392376 74.2 4645 b. Bad enough to change what you ate or drank 54647 10.3 671 c. Bad enough to keep you from sleeping 18227 3.4 258 d. Bad enough to make you go to the dentist 16566 3.1 201 e. Bad enough to make you miss school 8851 1.7 100 *Note: Due to the multiple-choice character of this item, percentages may add up to more than 100 percent.